1. Introduction
Recent years have witnessed the increased application of biometric identification systems across various fields, thus necessitating their improvements in terms of accuracy and usability. To develop identification systems, various biometric traits, including fingerprint- [
1,
2,
3], finger-vein- [
2,
4,
5,
6], face- [
7,
8,
9,
10,
11,
12,
13,
14,
15,
16], palm-vein- [
17], palm-print- [
18,
19,
20], retina- [
21,
22], sclera- [
23], voice- [
24,
25], and ear-based [
26,
27,
28,
29] recognitions have been deployed. These modalities constitute fundamental components in the evolution of biometric systems [
30], with six key criteria that must be satisfied [
26]:
Universality: each individual should have the trait;
Distinctiveness: able to distinguish between different individuals;
Permanence: has sufficient invariance over age;
Performance: achieves the required recognition accuracy and speed, as well as being robust against operational and environmental factors affecting them;
Collectability: can be acquired and measured easily and quantitatively;
Acceptability: the extent individuals accept these biometric characteristic technologies.
However, no single biometric trait has been able to perfectly satisfy all six criteria. Therefore, multimodal biometrics, which integrates multiple modalities to compensate for the limitations of individual modalities, have been explored.
The ear is a non-contact, long-range biometric modality that is generally less affected by aging compared with other modalities, such as fingerprints. It is among the few biometric traits that satisfy the permanence criterion owing to its aging-tolerant morphology [
26]. Furthermore, the extant studies revealed that even various individuals, including genetically identical twins, exhibit distinct ear morphologies [
31]. These characteristics render the ear a promising candidate for contactless, long-range identification systems.
Therefore, a variety of ear-based biometric identification methods has been explored. For example, Hassaballah et al. employed local binary patterns (LBPs) for ear-image-based recognition, achieving a maximum identification accuracy of 0.986 [
26]. However, their experiment was exclusively based on the frontal images of the auricle, thereby disregarding image-orientation variations. Consequently, their identification accuracy decreased dramatically to 0.387 when rotated ear images were introduced. To address this limitation, Mahajan et al. applied a convolutional neural network (CNN) and bidirectional long short-term memory (LSTM) on the same dataset. Their results indicated improved accuracy (0.928–0.943) [
29]. Similarly, Antonio et al. performed CNN-based identification using a dataset containing rotated ear images, achieving identification accuracies of 0.910–0.920 [
28]. The reviewed studies indicated that CNN-based models exhibit significant robustness to orientation variations in ear images. However, their effectiveness in real-world applications is still limited by the limited orientation diversity in the training datasets. Moreover, the practical deployment of ear-based biometric identification requires the ability to recognize individuals from multiple directions. This is particularly relevant in applications, such as multimodal biometrics and surveillance-based identification systems. Multimodal biometrics typically comprises the acquisition of ear images from the same direction as the face. However, surveillance-based applications comprise the capturing of images from behind or at other oblique angles. Despite these application potentials, the extant studies have barely considered the systematic evaluation of the feasibility of ear-based identification using datasets incorporating multiple viewpoints. This research gap necessitates further studies on the effectiveness of ear-based identification using images captured from diverse angles.
To address the aforementioned research gap, we tested the following two hypotheses:
To test the hypotheses, a machine learning method capable of image identification and interpretation is required. In this study, we conducted identification experiments based on multidirectional ear images using CNN and Gradient-weighted Class Activation Mapping (Grad-CAM). Mahajan et al. [
29] and Antonio et al. [
28] have demonstrated the potential robustness of CNN to slight orientational changes in ear images [
32]. Therefore, we conducted a CNN-based personal-identification experiment on ear images captured from multiple directions and used Grad-CAM to visualize the feature regions that were independent of the shooting direction.
This study contributes the following to the extant literature:
To demonstrate the feasibility of performing ear-image-based personal identification under realistic conditions, thereby facilitating system development regarding the capability to handle diverse image-capture directions, which has not been addressed.
To visualize the ear regions that are crucial for identification regardless of the shooting direction, thus providing a foundation for further studies on ear-image-based biometric identification.
The remainder of this paper is structured as follows:
Section 2 describes the methodology for collecting ear images and constructing the identification model,
Section 3 presents the experimental setting and evaluation framework,
Section 4 reports the results of the individual identification performances and visualizations of discriminative ear features,
Section 5 discusses the implications of the findings and directions for future research, and
Section 6 concludes the study, stating the limitations and outlining the directions for further investigation.
2. Materials and Methods
2.1. Methodology
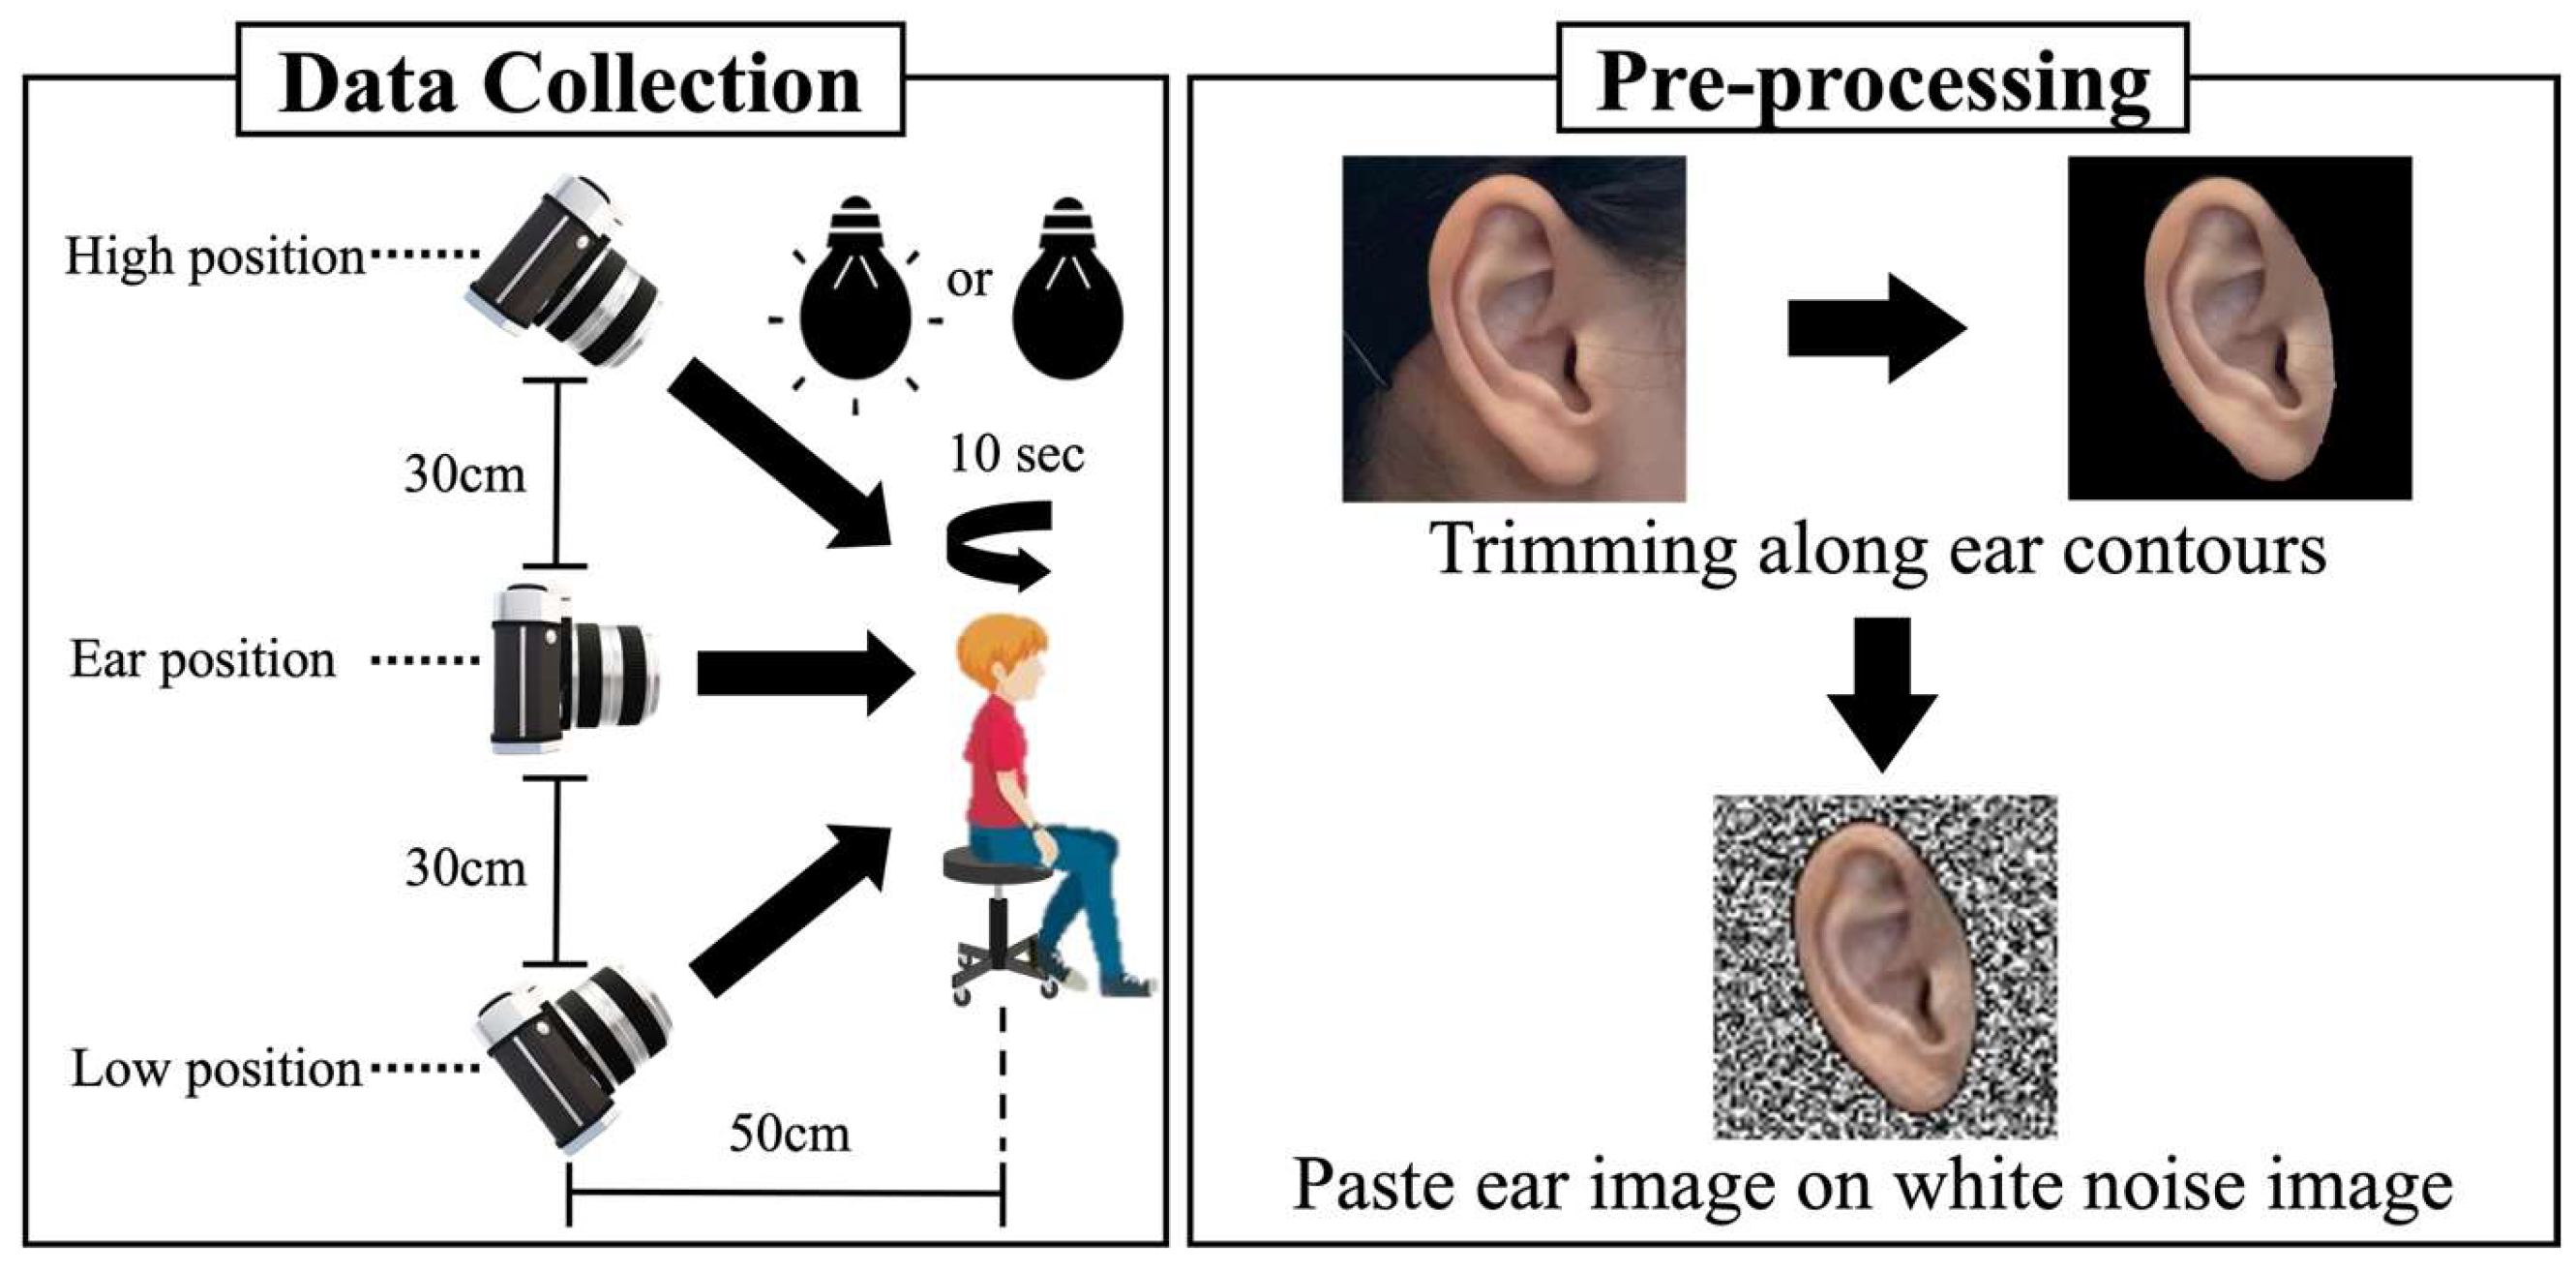
Figure 1 shows an overview of the ear-image-capturing and ear-image-preprocessing procedures. The ear images of ten subjects (six males and four females, age: 21–24 years, and nationality: Japanese) were captured using the telephoto lens camera of an Apple iPhone 12 Pro (Apple Inc., Cupertino, CA, USA) with a 2× zoom. The telephoto lens was selected for its distortion-minimizing ability compared with a wide-angle lens. Thus, it can preserve the structural integrity of the ear features [
33,
34]. The ear images were captured during daylight hours to ensure optimal illumination and clarity. To obtain the features of ear images under both illuminated and non-illuminated conditions, we captured the images in these two settings.
During image capturing, each subject was made to sit on an adjustable-height chair with a swiveling seat. The height of the chair was adjusted such that the subject’s ear aligned with the camera lens at a standardized ear position, maintaining a fixed distance of 50 cm between the ear and lens. Under these conditions, the subjects performed continuous 180° counterclockwise rotations for 10 s, allowing for the ear images to be captured from multiple perspectives. Additionally, the images were captured from two other vertical positions: the high and low positions, where the camera lens was elevated and lowered by 30 cm above and below the ear position, respectively (
Figure 1; data collection). Overall, three sets of ear images were captured from three different vertical positions, i.e., the High, Ear, and Low positions.
The raw images contained extraneous elements, such as hair, facial features, and other background components. To ensure that the dataset exclusively contained ear-related features, we manually cropped all the images along the auricle contour using ImageJ (version 1.53t) [
35]. Thereafter, the cropped ear images were overlaid onto a square white noise background to standardize the dataset. Finally, all the images were resized to 96 × 96 pixels to ensure image size uniformity.
2.2. Construction and Identification of the Convolutional Neural Network Model
In this study, CNN [
32], which is a widely deployed architecture of the artificial neural network for image-identification tasks, was deployed as the primary identification model. Additionally, Grad-CAM [
36] was used to visualize the discriminating evidence of the CNN during the identification. This study was also aimed at investigating personal identifications based on multidirectional ear images and the key feature regions that contribute to the discrimination of the model. The combination of CNN and Grad-CAM was considered an appropriate methodological approach to achieve the objectives.
Figure 2 shows an overview of the architecture of the CNN model constructed in this study, and
Table 1 details its structure. The input of the model comprised the preprocessed ear images obtained as described in
Section 2.1. Next, we performed feature extraction through a sequence of seven convolutional layers that were interspersed with three max-pooling layers, a smoothing layer, and three fully connected layers. The final fully connected layer produced a 10-dimensional feature vector, which was subsequently transformed into class probabilities by the Softmax function [
37]. Thereafter, the network parameters were optimized using the backpropagation algorithm [
38], with the optimization function named Adam [
39]. Additionally, the rectified linear unit (ReLU) function was deployed as the activation function for all the layers except the last fully connected layer, which utilized the SoftMax function. The convolutional layers exhibited a 3 × 3 filter size, with a stride of 1. The number of filters increased progressively across the layers: 64 filters for the first two layers, 128 filters for the third and fourth, and 256 filters for the fifth and sixth. The three fully connected layers contained 256, 128, and 10 neurons, respectively.
The categorical cross entropy (CCE) loss was deployed as the loss function in our model training; CCE is expressed, as follows:
Here, denotes the number of subject classes, denotes the ground-truth label for class , and denotes the predicted probability for class . During the identification, the ear images were fed into the trained model, which generated probability distributions over the subject classes. Thereafter, the input ear image was assigned to the class with the highest probability score.
2.3. Model Building Based on Three Different Camera Angles
This study is primarily aimed at examining the feasibility of personal identification using multidirectional ear images. To perform the examination, we trained four different CNN models using distinct training datasets comprising ear images that were captured from specific angles:
Model H: Trained using ear images captured from the High position;
Model E: Trained using ear images captured from the Ear position;
Model L: Trained using ear images captured from the Low position;
Model A: Trained using a combination of ear images from all three positions (High, Ear, and Low positions).
Table 2 summarizes the number of training images employed for each model. Models H, E, and L utilized 1160 images each, whereas Model A was trained using an expanded dataset comprising 3480 images. Notably, these models were subsequently evaluated for their generalization across the test images captured from the same or different directions.
3. Experiment
In this study, the ear-image dataset (collected as described in
Section 2.1) was divided into training and test data, and we experimentally evaluated the identification performances of the models as well as visualized the discriminating evidence. The experiments are described in the following subsections.
3.1. Distributions of the Training and Testing Data
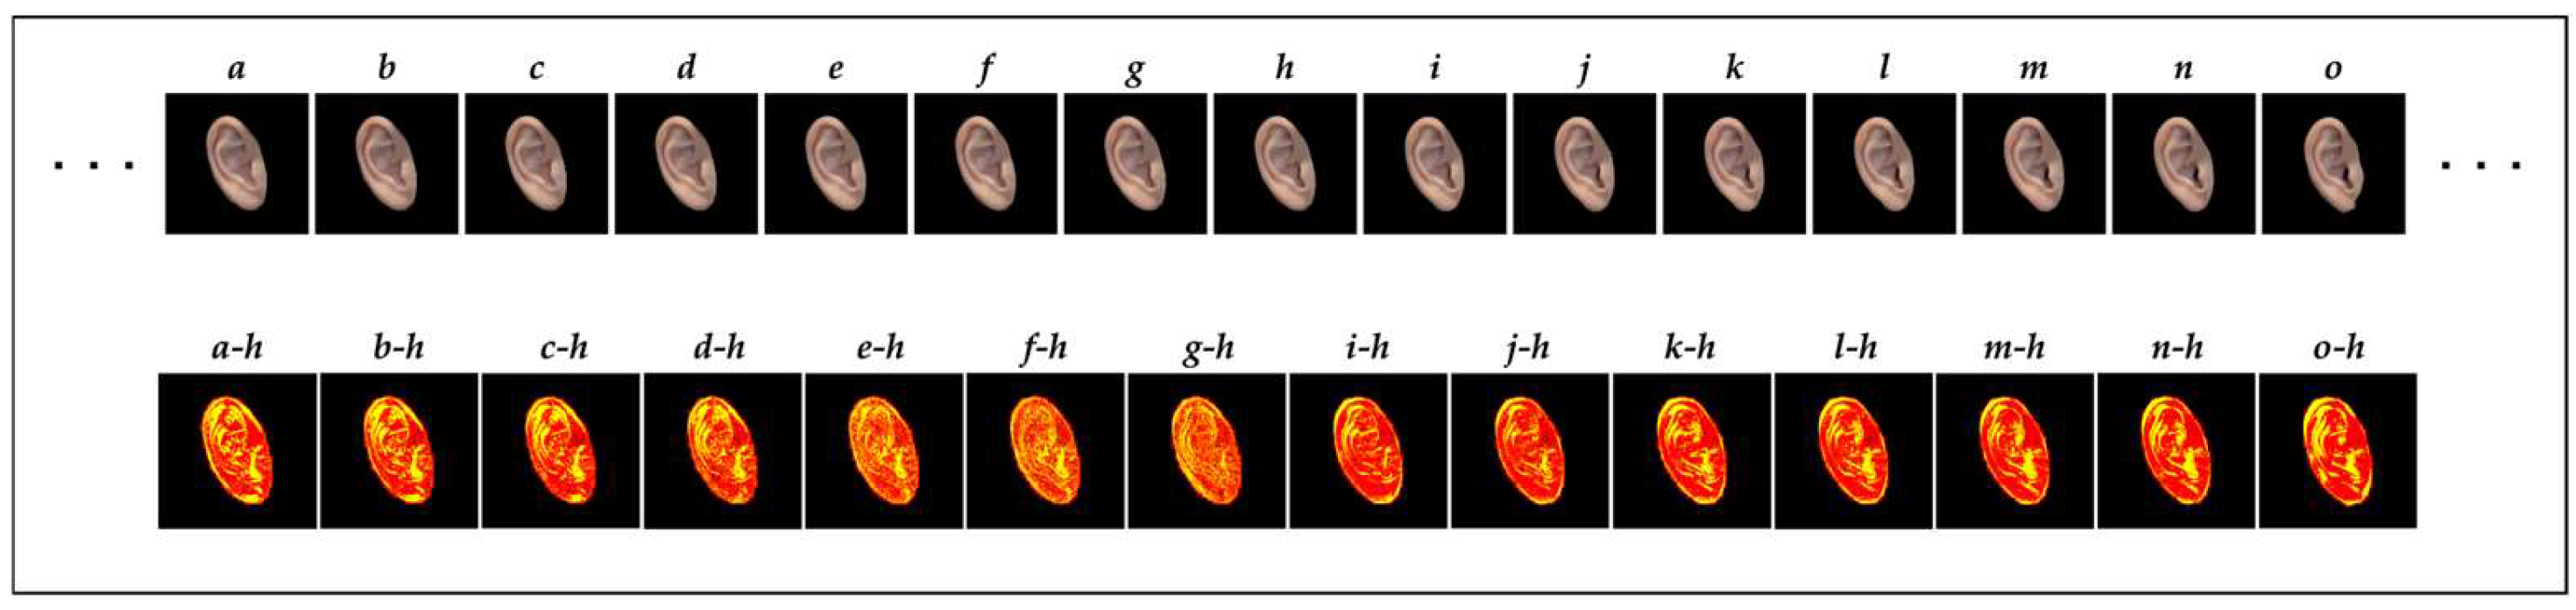
As already mentioned, the ear-image data were collected using the continuous-shooting function of the camera. Thus, the differences between the features of consecutive ear images could be extremely small.
Figure 3 shows a heatmap depicting the strength of the differences between the central ear image (
h) and the other images (
a–
g,
i–
o) of the 15 consecutive ear-image frames of one subject. The differences between the two images were detected using DiffIMG [
40]. For example, in this figure, image
a–h represents the difference between images
a and
h, with the differences overlaid on image
h. In the heatmap image, the yellow and red colors indicate strong and weak differences, respectively. As shown in
Figure 3, the heatmap images closer to image
h exhibited a scattered distribution of the yellow and red colors. Contrarily, the heatmap images farther from image
h displayed a more distinct contrast between the yellow and red colors, indicating the evident differences of these images from
h. Notably, this trend was consistently observed in the other ear images collected. Further, introducing variations in the training data was crucial to enhancing the model performance. Based on these findings, we employed the following data-selection procedures to ensure that highly similar ear images were not included in the training and test datasets:
We selected the ear images that were captured from each subject in chronological order by skipping every 14 images (e.g., the 15th, 30th, and 45th images) and designated them as the test data.
We removed the ear images that were selected in Step 1 and their four adjacent ear images, two preceding and two following the images in chronological order.
We used the images that were neither selected nor removed in Steps 1 and 2 as the training data.
We randomly selected 10% of the ear images from the training data and designated them as the validation data.
Notably, the ratio of the numbers of images in the training, testing, and validation data was 8:1:1, as obtained using the above procedure.
Figure 3.
Visualization of the differences between adjacent images.
Figure 3.
Visualization of the differences between adjacent images.
Algorithm 1 presents the pseudocode for generating training, test, and validation data from ear images arranged in chronological order.
| Algorithm 1. Pseudocode for generating training, testing, and validation data |
| Input : PicsList : List storing ear images in chronological order | |
| Output : TrainPicsList : List for storing training images | |
| TestPicsList : List for storing testing images | |
| ValPicsList : List for storing validation images | |
| 1: main | |
| 2: j ← LEN(PicsList) | |
| | #Obtain the length of PicsList, i.e., the number of ear images stored in PicsList |
| 3: for i ←1 to j do | |
| 4: if (i % 15 = 0) then | |
| 5: ADD(PicsList[i], TestPicsList) | |
| | #Add PicsList[i] to TestPicsList |
| 6: else if (i % 15 = 1) or (i % 15 = 2) or (i % 15 = 13) or (i % 15 = 14) then | |
| 7: DEL(PicsList[i]) | |
| | #Delete PicsList[i] |
| 8: else | |
| 9: ADD(PicsList[i], TrainPicsList) | |
| | #Add PicsList[i] to TrainPicsList |
| 10: end if | |
| 11: end for | |
| 12: MOVE(TrainPicsList, ValPicsList, 0.1) | |
| | #Randomly select 10% of images form TrainPicsList and store them in ValPicsList |
| 13: return TrainPicsList, TestPicsList, ValPicsList | |
3.2. Experimental Settings
High identification accuracies were maintained even for ear images captured from angles different from those employed during training for a practical perspective. This study was conducted to investigate the feasibility of personal identification using multidirectionally captured ear images. Therefore, in this experiment, we evaluated the identification accuracies when the ear images employed for training and testing were captured from the same and different directions.
Table 3 summarizes the experimental settings. As shown in this table, the experiment proceeded under the three following configurations:
An experiment in which the ear images captured from the same direction as that of the training data were used as the test data.
An experiment in which the ear images captured from a different direction from that of the training data were used as the test data.
An experiment in which the ear images captured from all directions were used as the training data, and those captured from each direction were used as the test data.
Table 3.
Train and test data employed for the experiment.
Table 3.
Train and test data employed for the experiment.
| Experimental Setup | Training | Test | Experiment Name |
|---|
| i | H | H | H_H |
| E | E | E_E |
| L | L | L_L |
| ii | E | H | E_H |
| E | L | E_L |
| H | E | H_E |
| H | L | H_L |
| L | H | L_H |
| L | E | L_E |
| iii | A | H | A_H |
| A | E | A_E |
| A | L | A_L |
| A | A | A_A |
As presented in
Table 3, the ear images captured from above, the same height as, and below the ear were denoted as H, E, and L, respectively. Additionally, each identification experiment was denoted as training_testing. For instance, Experiment E_H refers to that in which the training and test data were E and H, respectively. Overall, 13 experiments were conducted under three experimental conditions. By conducting identification experiments with different combinations of training and test data, the generalization ability of the model can be evaluated, and identification performance, independent of angles, can be confirmed. This reveals a model that can adapt to a broader range of data without relying on ear images taken from a specific angle. Furthermore, by clarifying the feature points that contribute to identification at each angle, it becomes possible to identify which features most significantly affect identification accuracy. This provides insights for future model improvements. As a result, it allows for a focused and experimental evaluation of the key features that should be emphasized to further enhance identification accuracy.
3.3. Identification Experiments
We performed the model construction, validation, and identification tests on a workstation equipped with an Intel Core i7-10700F (2.90 GHz) processor (Intel Corporation, Santa Clara, CA, USA) and an NVIDIA GeForce RTX 3060 (8 GB) graphics card (Santa Clara, CA, USA). In each experiment, corresponding to
Table 3, we evaluated the identification performance using ear images captured from multiple directions by performing five-fold cross-validation. In this study, we used four metrics for the evaluation, i.e., accuracy, recall, precision, and the F1-score:
Here, TP denotes the number of target images classified into the correct class, TN denotes the number of non-target images classified into the correct class, FP denotes the number of target images classified into the wrong class, and FN denotes the number of non-target images classified into the wrong class.
3.4. Visualization for the Identification Basis
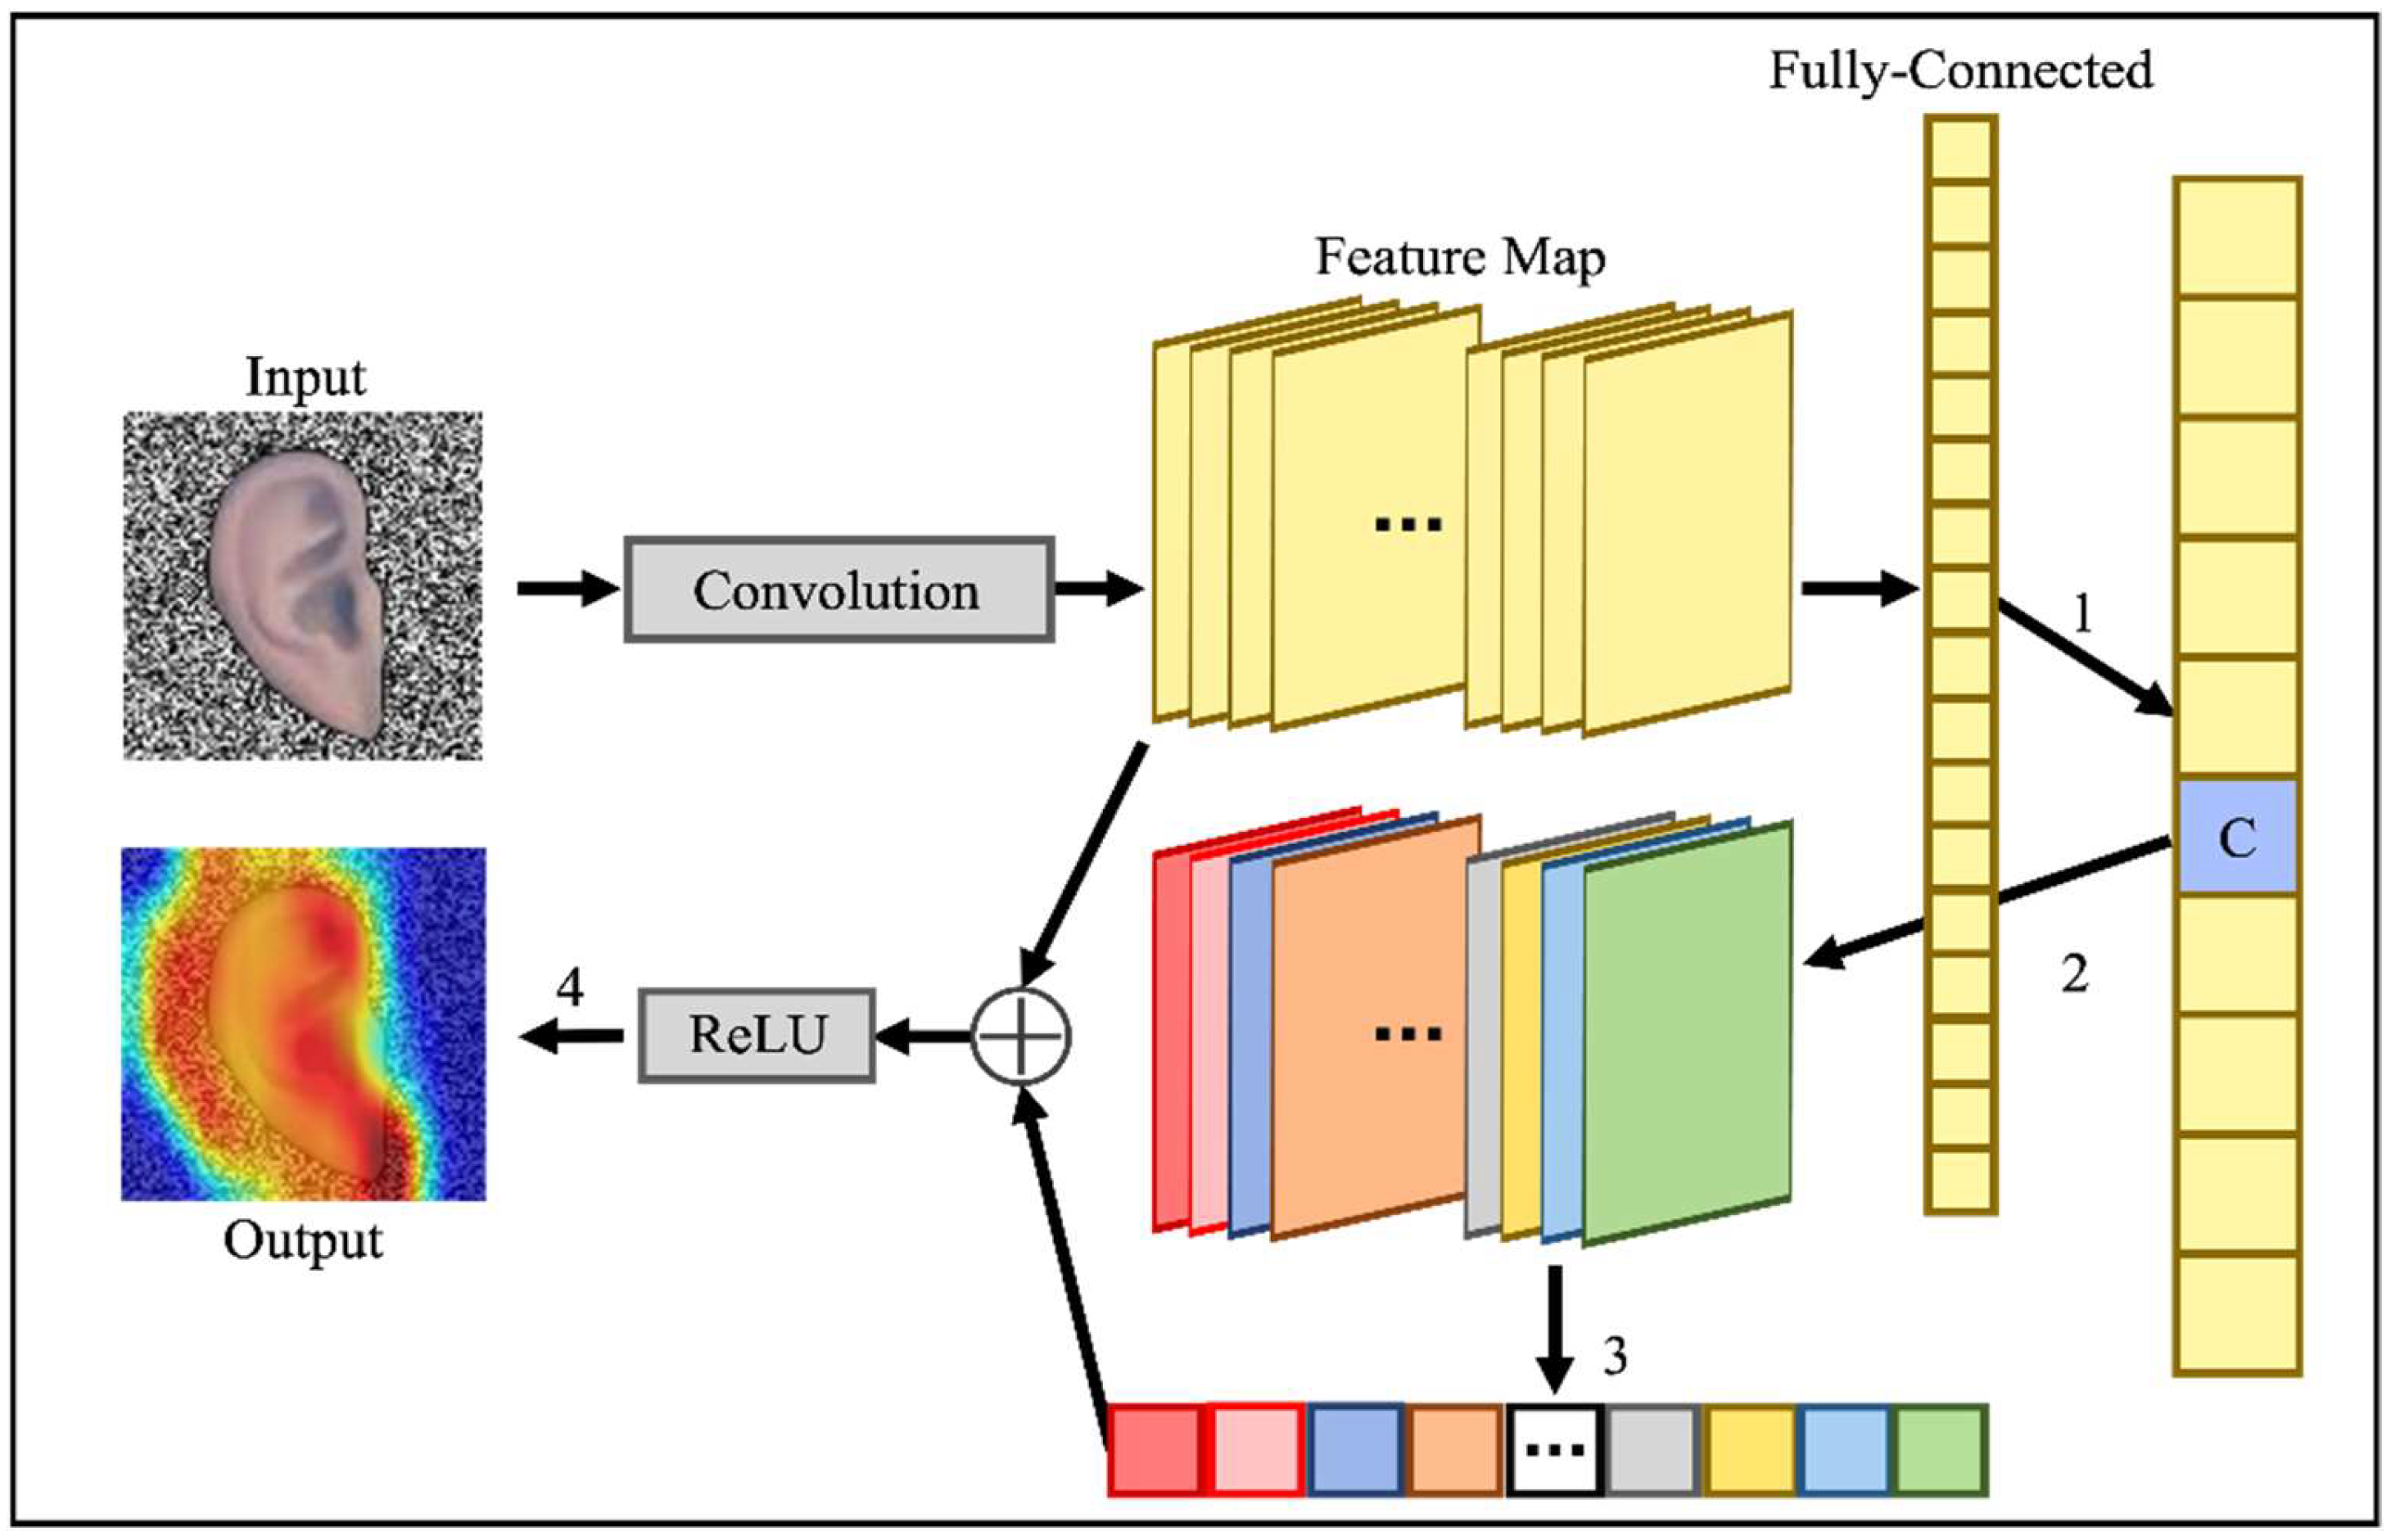
In this experiment, we investigated the rationale for the identification of ear images. To do this, we adopted Grad-CAM (a method for visualizing the rationale behind CNN-based image identification).
Figure 4 shows the outline of Grad-CAM. Grad-CAM presents the contribution to image identification as a heatmap based on the following four steps (corresponding to 1–4 in
Figure 4):
It obtains the class C prediction of the input image.
It performs backpropagation based on the output probability of the class C prediction and calculates the gradient with respect to the feature map of the final convolutional layer.
It averages the calculated gradients for each feature map and uses them as weights for each feature map.
It linearly combines the feature maps of the final convolutional layer using the weights obtained in Step 3, followed by applying the ReLU function to generate the heatmap.
Figure 4.
Grad-CAM outline.
Figure 4.
Grad-CAM outline.
Algorithm 2 shows the pseudocode for generating heatmaps that visualize the identification rationale of the input ear images based on Grad-CAM.
| Algorithm 2. Pseudocode for generating ear heatmap images using Grad-CAM |
| Input : Ear Image | |
|
Model | |
| s : The number of layers from the input layer to the final convolutional layer |
| p : The size of one side (in pixels) of the ear image(square) |
| Output : HeatMapEarImage |
| 1 : main | |
| 2 : Model_Output ← FIT(Model, EarImage) | |
| | #Input ear images into the Model and obtain a 10-class pribabilith distribution |
| 3 : C ← ARGMAX(Model_Output) | |
| | #Obtain the prediction class C (the class with the maximum probability) from the Model_Output (10-class probabilith distribution) |
| 4 : C_Score ← Model_Output[C] | |
| | #Obtain the prediction score for the prediction class C |
| 5 : LastFeatureMaps ← GETFEATMAP(Model, s) | |
| | #Obtain the feature maps of the final convolutional layer |
| 6 : Gradients ← COMPUTE_GRAD(C_Score, LastFeatureMaps) | |
| | #Compute the gradients of the LastFeatureMaps with respect to the score of the prediction class C |
| 7 : Weights ← AVERAGE(Gradients) | |
| | #Compute the Weights for each feature map by averaging the Gradients of the feature maps |
| 8 : Cam ← LINEAR_COMBI(Weights, LastFeatureMaps) | |
| | #By weighting each feature map (in LastFeatureMaps) with Weights and Performing a linear combination, a matrix(Cam) that retains the importance of each pixel is obtain |
| 9 : Cam ← RELU(Cam) | |
| | #Apply ReLU function to remove negative values |
| 10 : CamResized ← RESIZED(Cam, p) | |
| | #Resize the Cam to match the size of EarImage p × p |
| 11 : Heatmap ← COLORMAP(CamResized) | |
| | #Generate the Heatmap |
| 12 : HeatmapEarImage ← BLEND(EarImage, Heatmap) | |
| | #Overlay the Heatmap on the EarImage |
| 13 : return HeatmapEarImage | |
4. Results
4.1. Results of the Identification Experiments
In this study, we implemented three different experimental settings to evaluate the identification performances for multidirectionally captured ear images.
Table 4 presents the number of training and test images employed in each identification experiment as well as the identification results.
Experiment setting (i) comprised an experiment in which the ear images captured from the same direction as that of the training data were employed as the test data. In this setting, scores exceeding 0.975 were achieved for all the evaluation metrics across all the experiments, indicating that the models performed the ear-based identification with high accuracy when the training and testing data were obtained from the same direction.
Experiment setting (ii) comprised an experiment in which the ear images captured from a different direction from that of the training data were deployed as the test data. In this setting, all the evaluation metrics scored significantly lower scores than in the other experiments under the remaining settings. This indicated that personal identification using ear images captured from a different direction from that of the training data was more challenging compared with the other experimental settings. Conversely, in all cases under experiment setting ii, we obtained higher scores that were statistically significant compared with the random-identifica tion cases (p < 0.00005 using the Mann–Whitney U test). Therefore, despite the reduced identification accuracy, the results indicated the feasibility of achieving personal identification under this setting.
Experiment setting (iii) comprised an experiment in which the ear images captured from all directions were deployed as the training data, and those captured from each direction and all directions were deployed as the test data. Under this setting, scores exceeding 0.964 were achieved for all evaluation metrics across all experiments, indicating that, by training the model using ear images captured from all directions, individuals can be identified regardless of the direction from which the images were captured.
The results above indicate that high identification accuracy was achieved in experimental settings (i) and (iii), whereas experimental setting (ii) showed considerably lower identification accuracy.
Figure 5 presents the learning curves for experiments H_H (experimental setting (i)), H_L (experimental setting (ii)), and A_A (experimental setting (iii)). As shown in this figure, when the training and validation data were captured from different shooting directions, as in the case of H_L, the model’s learning did not proceed effectively. This is likely the reason for the low accuracy observed in the identification test. Conversely, when the training and validation data were captured from the same shooting direction, as in the cases of H_H and A_A, the model learned effectively and achieved high identification accuracy. Therefore, it can be inferred that the high accuracy observed in the identification test is a result of proper model training under these conditions.
4.2. Results of the Visualization for the Identification Basis
Figure 6 shows the heatmap of the identification evidence obtained using Grad-CAM. As per the Grad-CAM results, the regions that contributed strongly to the identification process are shown in red, whereas those with weak contributions are shown in blue. Except for a few experiments (H_H, H_E, and H_L), most of the experiments focused on the contour of the ear for personal identification. Furthermore, when E (the ear position) and L (low position) were deployed as the training data, the features inside the auricle, such as ridges and depressions, contributed to the identification process.
5. Discussion
Experimental settings (i) and (iii) were conducted under conditions where the training and testing data included ear images captured from the same shooting direction. As presented in
Table 4, these experiments obtained high identification accuracies across all evaluation metrics, indicating that the model could accurately distinguish ear images captured from the directions on which it had been trained, thereby confirming the hypothesis regarding the feasibility of personal identification based on ear images captured from multiple directions. Conversely, experimental setting (ii), which proceeded under conditions where the training and test data included image data obtained from different directions, obtained significantly reduced identification accuracy compared with the remaining experimental settings. Nevertheless, the results were significantly higher than those obtained through random identification across all the evaluation metrics, indicating that the ear contains features that are crucial to personal identification even when the shooting direction differs from that of the training data.
Figure 7 shows the anatomical parts of the ear. Based on the visualization results of Experiment A_A, which achieved high identification accuracies with ear images captured from all shooting directions, we analyzed the valuable feature points for identification.
Table 5 and
Table 6 present the percentages of the red-highlighted regions on the Grad-CAM heatmaps of the frontal and occipital views of the ear images. These results indicated that the helix region yielded the highest percentage of discriminating evidence for the frontal and occipital views, indicating that the helix might be a valuable biometric feature regardless of the shooting direction. However, the helix only contributed to 56.0% of the identification process for occipital views. These results could not fully support the hypothesis regarding the existence of ear feature points that are universally key to identification regardless of the shooting direction.
Table 7 presents a comparison of the identification accuracies obtained in this study and those obtained in the extant studies on ear-based personal identification. Notably, the datasets deployed for these studies differed in terms of the shooting direction constraints. For instance, the IITD-Ⅱ dataset comprised frontal ear images, whereas the WPUT, AMI, and EarVN1.0 datasets included ear images captured from slightly off-frontal positions. Conversely, our dataset comprised ear images captured from 180° horizontal rotations and three different vertical heights (H, E, and L positions), making the identification task more challenging. The row labeled “This study” in
Table 7 presents the results of the A_A experiment, which utilized this dataset. As presented in
Table 7, our CNN model achieved comparable or superior identification accuracy despite the increased complexity of the deployed dataset. Therefore, we expanded the range of feasible shooting directions by demonstrating the feasibility of achieving accurate identification under a variety of ear-image-capturing conditions.
Our findings highlight the potential of multidirectionally captured ear images for personal identification, offering new insights by visualizing the identification accuracies and underlying proof. The high-accuracy identification model based on multidirectionally captured ear images could be deployed as a complementary technology to conventional facial recognition systems. In scenarios in which the face is partially obscured by masks or affected by environmental lighting, the stable features of the ear could suffice to ensure identification accuracy. Additionally, this technology could be applied to surveillance cameras and access control systems that capture images from lateral or posterior angles. Additionally, leveraging the identified criticality of the helix region in this study, the development of identification algorithms that prioritize specific regions of the ear would also be a promising basis for future studies. This approach could contribute to the design of innovative identification methods that can function with partial or low-quality images. Furthermore, further studies on improving the identification accuracies of images captured from posterior angles could facilitate the development of more versatile and robust personal identification technologies.
Notably, the following four limitations are acknowledged about this study:
First, equal and sufficient ear images captured from multiple directions are required for each data class. However, we utilized the ear images of only 10 subjects under identical conditions, even though maintaining completely uniform imaging conditions in real-world scenarios is challenging. Thus, measures must be put in place to address data imbalance. This issue could be mitigated by employing data-augmentation techniques to improve the balance among classes and generate a more uniform and sufficient dataset. Additionally, the utilization of the focal loss function [
41,
42], which strengthens penalties for misclassification in minority classes, might help alleviate the effects of data imbalance. Furthermore, by training on larger and more diverse datasets, it is expected that a high-performance model that captures the general characteristics of the ear can be constructed. By leveraging such a model through transfer learning, it could, for instance, enable personal identification across different ethnic groups. However, it is a known fact that differences in CNN architecture can significantly affect model performance. In particular, selecting the right CNN architecture is crucial for accurately capturing the important features of the ear from multiple angles. Moving forward, experimenting with various architectures will be necessary to further explore the optimal design for this task of personal identification using ear images captured from multiple angles.
Second, we did not consider the roles of external factors. Although the helix region was identified as a critical feature point, it could be affected by external factors such as hair or earrings. Furthermore, it is challenging to completely eliminate such external factors in practical applications. This issue could be resolved by integrating CNN with an attention mechanism [
43] to reduce the influence of external factors and focus solely on learning the features of the auricle. Nevertheless, if the helix or other critical feature points are largely obscured by hair or similar elements, our approach may not be applicable. In such cases, it would be necessary to switch to identification methods designed for other modalities, such as facial recognition. Additionally, ear-based personal identification is sensitive to lighting conditions, and accurate identification can be challenging, particularly in backlit or low-light environments. However, this challenge could be addressed by utilizing low-light image enhancement techniques [
44], offering a solution to improve identification accuracy under such conditions.
Third, our method is based on deep learning, and the model size is extremely large. Therefore, addressing the computational load in real-time processing becomes a potential challenge. In large-scale surveillance systems, achieving practical identification performance requires not only solving the external factor constraints mentioned above but also addressing the computational load issue. To tackle this challenge, model compression techniques [
45] that reduce the model size while maintaining identification performance could be effective.
Fourth, the ear-image preprocessing performed in this study only comprised manual cropping, which is time-consuming and may cause reproducibility issues. To address this, methods such as Deng et al.’s RetinaFace [
46] could be employed for the automatic detection of ear landmarks and accurate identification of ear positions based on the training data, thereby automating the cropping process.
6. Conclusions
This study was conducted to test the following hypotheses:
Personal identification can be achieved with ear images captured from multiple directions.
Valuable feature points exist on the ear and facilitate personal identification regardless of the shooting direction.
To achieve our objectives, we constructed a CNN model for ear images captured from multiple directions, conducted identification experiments, and employed Grad-CAM for the visualization of the features that contributed to personal identification. The results of the identification experiments demonstrated that the model could achieve high identification accuracies of ≥0.980 across all evaluation metrics, confirming the feasibility of personal identification based on ear images captured from multiple directions. Our visualization experiments revealed that the helix accounted for key feature points in 97.5% and 56.0% of the frontal- and occipital-view images, respectively. These results indicated that the helix could be a valuable feature point that is independent of the shooting direction. However, the lower percentage obtained for the occipital view indicated that further studies are required to identify the other feature points that are consistently significant across all angles.
Our findings demonstrate the feasibility of personal identification using multidirectional-captured ear images as well as contribute to the development of future identification methods that leverage partial or low-quality ear images and specific biometric features. Future studies should address the issues of data imbalance and the roles of external factors, such as hair, lighting conditions, and accessories, which may affect identification accuracy. Additionally, the development of automated preprocessing techniques, including ear-contour detection and feature extraction, would enhance the practicality and scalability of ear-based biometric systems.
Author Contributions
Conceptualization, R.F. and Y.O.; methodology, R.F. and Y.O.; validation, R.F. and Y.O.; formal analysis, R.F.; investigation, R.F.; resources, R.F.; data curation, R.F.; writing—original draft preparation, R.F. and Y.O.; writing—review and editing, R.F, Y.O, C.P. and Y.Y.; visualization, R.F., C.P. and Y.Y.; supervision, Y.O.; funding acquisition, Y.O. All authors have read and agreed to the published version of the manuscript.
Funding
This research received no external funding.
Institutional Review Board Statement
The study was conducted according to the guidelines of the Declaration of Helsinki, and approved by the Ethics Committee of Muroran Institute of Technology Ethical Review Board (protocol code R6-07-S07 and date of approval: 1 August 2024).
Informed Consent Statement
Informed consent was obtained from all the subjects involved in the study. The participants were provided with detailed information about the purpose and procedures of the study, after which they provided written informed consent before data collection.
Data Availability Statement
The data presented in this study are not publicly available due to privacy, and the ear images collected for this study cannot be made public. However, the CNN model, program files, and a README file detailing their usage are available on GitHub (software version: ver1.0) at
https://github.com/RyuhiFukuda/Ear_Classification (accessed on 13 February 2025).
Conflicts of Interest
The authors declare no conflicts of interest.
Abbreviations
The following abbreviations are used in this manuscript:
| LBP | Local binary patterns |
| CNN | Convolutional neural network |
| LSTM | Long short-term memory |
| Grad-CAM | Gradient-weighted Class Activation Mapping |
| ReLU | Rectified linear unit |
| CCE | Categorical cross entropy |
| E | Ear position |
| H | High position |
| L | Low position |
References
- Lin, C.-H.; Chen, J.-L.; Tseng, C.Y. Optical sensor measurement and biometric-based fractal pattern classifier for fingerprint recognition. Expert Syst. Appl. 2011, 38, 5081–5089. [Google Scholar] [CrossRef]
- Yang, W.; Wang, S.; Hu, J.; Zheng, G.; Valli, C. A fingerprint and finger-vein based cancelable multi-biometric system. Pattern Recognit. 2018, 78, 242–251. [Google Scholar] [CrossRef]
- Murillo-Escobar, M.A.; Cruz-Hernández, C.; Abundiz-Pérez, F.; López-Gutiérrez, R.M. A robust embedded biometric authentication system based on fingerprint and chaotic encryption. Expert Syst. Appl. 2015, 42, 8198–8211. [Google Scholar] [CrossRef]
- Qiu, S.; Liu, Y.; Zhou, Y.; Huang, J.; Nie, Y. Finger-vein recognition based on dual-sliding window localization and pseudo-elliptical transformer. Expert Syst. Appl. 2016, 64, 618–632. [Google Scholar] [CrossRef]
- Xi, X.; Yang, L.; Yin, Y. Learning discriminative binary codes for finger vein recognition. Pattern Recognit. 2017, 66, 26–33. [Google Scholar] [CrossRef]
- Mohd Asaari, M.S.M.; Suandi, S.A.; Rosdi, B.A. Fusion of band limited phase only correlation and width centroid contour distance for finger based biometrics. Expert Syst. Appl. 2014, 41, 3367–3382. [Google Scholar] [CrossRef]
- Yoo, S.-H.; Oh, S.-K.; Pedrycz, W. Optimized face recognition algorithm using radial basis function neural networks and its practical applications. Neural Netw. 2015, 69, 111–125. [Google Scholar] [CrossRef]
- Yadav, S.; Vishwakarma, V.P. Extended interval Type-II and kernel based sparse representation method for face recognition. Expert Syst. Appl. 2019, 116, 265–274. [Google Scholar] [CrossRef]
- Mamta, H.; Hanmandlu, M. Robust authentication using the unconstrained infrared face images. Expert Syst. Appl. 2014, 41, 6494–6511. [Google Scholar] [CrossRef]
- Jalali, A.; Mallipeddi, R.; Lee, M. Sensitive deep convolutional neural network for face recognition at large standoffs with small dataset. Expert Syst. Appl. 2017, 87, 304–315. [Google Scholar] [CrossRef]
- Becerra-Riera, F.; Morales-González, A.; Méndez-Vázquez, H. Facial marks for improving face recognition. Pattern Recognit. Lett. 2018, 113, 3–9. [Google Scholar] [CrossRef]
- Kas, M.; El Merabet, Y.E.; Ruichek, Y.; Messoussi, R. Mixed neighborhood topology cross decoded patterns for image-based face recognition. Expert Syst. Appl. 2018, 114, 119–142. [Google Scholar] [CrossRef]
- Yaddaden, Y.; Adda, M.; Bouzouane, A.; Gaboury, S.; Bouchard, B. User action and facial expression recognition for error detection system in an ambient assisted environment. Expert Syst. Appl. 2018, 112, 173–189. [Google Scholar] [CrossRef]
- Jun, B.; Kim, D. Robust face detection using local gradient patterns and evidence accumulation. Pattern Recognit. 2012, 45, 3304–3316. [Google Scholar] [CrossRef]
- Yu, Y.-F.; Dai, D.-Q.; Ren, C.-X.; Huang, K.-K. Discriminative multi-scale sparse coding for single-sample face recognition with occlusion. Pattern Recognit. 2017, 66, 302–312. [Google Scholar] [CrossRef]
- Ramaiah, N.P.; Ijjina, E.P.; Mohan, C.K. Illumination invariant face recognition using convolutional neural networks. In Proceedings of the 2015 IEEE International Conference on Signal Processing Informatics, Communication and Energy Systems (SPICES), Kozhikode, India, 23 April 2015; IEEE: New York, NY, USA; pp. 1–4. [Google Scholar] [CrossRef]
- Han, W.-Y.; Lee, J.-C. Palm vein recognition using adaptive Gabor Filter. Expert Syst. Appl. 2012, 39, 13225–13234. [Google Scholar] [CrossRef]
- Su, C.-L. Palm-print recognition by matrix discriminator. Expert Syst. Appl. 2009, 36, 10259–10265. [Google Scholar] [CrossRef]
- Bingöl, Ö.; Ekinci, M. Stereo-based palmprint recognition in various 3D postures. Expert Syst. Appl. 2017, 78, 74–88. [Google Scholar] [CrossRef]
- Guo, J.-M.; Hsia, C.-H.; Liu, Y.-F.; Yu, J.-C.; Chu, M.-H.; Le, T.-N. Contact-free hand geometry-based identification system. Expert Syst. Appl. 2012, 39, 11728–11736. [Google Scholar] [CrossRef]
- Frucci, M.; Riccio, D.; Sanniti di Baja di, G.S.; Serino, L. Using direction and score information for retina based person verification. Expert Syst. Appl. 2018, 94, 1–10. [Google Scholar] [CrossRef]
- Köse, C.; İki, C. A personal identification system using retinal vasculature in retinal fundus images. Expert Syst. Appl. 2011, 38, 13670–13681. [Google Scholar] [CrossRef]
- Crihalmeanu, S.; Ross, A. Multispectral scleral patterns for ocular biometric recognition. Pattern Recognit. Lett. 2012, 33, 1860–1869. [Google Scholar] [CrossRef]
- Heracleous, P.; Even, J.; Sugaya, F.; Hashimoto, M.; Yoneyama, A. Exploiting alternative acoustic sensors for improved noise robustness in speech communication. Pattern Recognit. Lett. 2018, 112, 191–197. [Google Scholar] [CrossRef]
- Dehzangi, O.; Ma, B.; Chng, E.S.; Li, H. Discriminative feature extraction for speech recognition using continuous output codes. Pattern Recognit. Lett. 2012, 33, 1703–1709. [Google Scholar] [CrossRef]
- Hassaballah, M.; Alshazly, H.A.; Ali, A.A. Ear recognition using local binary patterns: A comparative experimental study. Expert Syst. Appl. 2019, 118, 182–200. [Google Scholar] [CrossRef]
- Chowdhury, D.P.; Bakshi, S.; Sa, P.K.; Majhi, B. Wavelet energy feature based source camera identification for ear biometric images. Pattern Recognit. Lett. 2020, 130, 139–147. [Google Scholar] [CrossRef]
- Antonio, R.; Tyandra, N.; Indryani, T.A.; Edbert, I.S.; Aulia, A. Human identification system based on ear shape using convolutional neural network. Procedia Comput. Sci. 2024, 245, 657–666. [Google Scholar] [CrossRef]
- Mahajan, A.; Singla, S.K. DeepBio: A deep CNN and bi-LSTM learning for person identification using ear biometrics. CMES Comput. Model. Eng. Sci. 2024, 141, 1623–1649. [Google Scholar] [CrossRef]
- Dargan, S.; Kumar, M. A comprehensive survey on the biometric recognition systems based on physiological and behavioral modalities. Expert Syst. Appl. 2020, 143, 113114. [Google Scholar] [CrossRef]
- Nejati, H.; Zhang, L.; Sim, T.; Martinez-Marroquin, E.; Dong, G. Wonder ears: Identification of identical twins from ear images. In Proceedings of the 21st International Conference on Pattern Recognition (ICPR2012), Tsukuba, Japan, 11–15 November 2012; pp. 1201–1204. [Google Scholar]
- Lecun, Y.; Bottou, L.; Bengio, Y.; Haffner, P. Gradient-based learning applied to document recognition. Proc. IEEE 1998, 86, 2278–2324. [Google Scholar] [CrossRef]
- Fang, W.; Zheng, L. Distortion correction modeling method for zoom lens cameras with bundle adjustment. J. Opt. Soc. Korea 2016, 20, 140–149. [Google Scholar] [CrossRef]
- Zhang, J.; Qian, W.; Gu, G.; Mao, C.; Ren, K.; Cai, G.; Liu, Z.; Yang, J.; Chen, Q. The effect of lens distortion in angle measurement based on four-quadrant detector. Infrared Phys. Technol. 2020, 104, 103060. [Google Scholar] [CrossRef]
- Schneider, C.A.; Rasband, W.S.; Eliceiri, K.W. NIH image to ImageJ: 25 years of image analysis. Nat. Methods 2012, 9, 671–675. [Google Scholar] [CrossRef]
- Selvaraju, R.R.; Cogswell, M.; Das, A.; Vedantam, R.; Parikh, D.; Batra, D.; Grad, C.A.M. Visual explanations from deep networks via gradient-based localization. In Proceedings of the 2017 IEEE International Conference on Computer Vision (ICCV), Venice, Italy, 22–29 October 2017; pp. 618–626. [Google Scholar]
- Bridle, J. Training stochastic model recognition algorithms as networks can lead to maximum mutual information estimation of parameters. In Advances in Neural Information Processing Systems; Touretzky, D., Ed.; Morgan Kaufmann: Burlington, MA, USA, 1989; Volume 2. [Google Scholar]
- Glorot, X.; Bengio, Y. Understanding the difficulty of training deep feedforward neural networks. In Proceedings of the Thirteenth International Conference on Artificial Intelligence and Statistics, Sardinia, Italy, 13 May 2010; Teh, Y.W., Titterington, M., Eds.; PMLR: Chia Laguna Resort, Sardinia, Italy; Volume 9, pp. 249–256. [Google Scholar]
- Kingma, D.P.; Ba, J.A. A method for stochastic optimization 2017. In Proceedings of the International Conference on Learning Representations (ICLR), San Diego, CA, USA, 7–9 May 2015; Volume 5. [Google Scholar]
- DiffImg. Available online: https://sourceforge.net/projects/diffimg/ (accessed on 1 February 2025).
- Lin, T.-Y.; Goyal, P.; Girshick, R.; He, K.; Dollár, P. Focal loss for dense object detection. IEEE Trans. Pattern Anal. Mach. Intell. 2020, 42, 318–327. [Google Scholar] [CrossRef]
- Dina, A.S.; Siddique, A.B.; Manivannan, D. A deep learning approach for intrusion detection in Internet of Things using focal loss function. Internet Things 2023, 22, 100699. [Google Scholar] [CrossRef]
- Wang, S.; Zhang, Y. An attention-based CNN model integrating observational and simulation data for high-resolution spatial estimation of urban air quality. Atmos. Environ. 2025, 340, 120921. [Google Scholar] [CrossRef]
- Li, C.; Guo, C.; Han, L.; Jiang, J.; Cheng, M.-M.; Gu, J.; Loy, C.C. Low-Light Image and Video Enhancement Using Deep Learning: A Survey. IEEE Trans. Pattern Anal. Mach. Intell. 2021, 44, 9396–9416. [Google Scholar] [CrossRef]
- Li, Z.; Li, H.; Meng, L. Model Compression for Deep Neural Networks: A Survey. Computers 2023, 12, 60. [Google Scholar] [CrossRef]
- Deng, J.; Guo, J.; Ververas, E.; Kotsia, I.; Zafeiriou, S. RetinaFace: Single-shot multi-level face localisation in the wild. In Proceedings of the 2020 IEEE/CVF Conference on Computer Vision and Pattern Recognition (CVPR), Seattle, WA, USA, 13–19 June 2020; IEEE: New York, NY, USA; pp. 5202–5211. [Google Scholar] [CrossRef]
| Disclaimer/Publisher’s Note: The statements, opinions and data contained in all publications are solely those of the individual author(s) and contributor(s) and not of MDPI and/or the editor(s). MDPI and/or the editor(s) disclaim responsibility for any injury to people or property resulting from any ideas, methods, instructions or products referred to in the content. |
© 2025 by the authors. Licensee MDPI, Basel, Switzerland. This article is an open access article distributed under the terms and conditions of the Creative Commons Attribution (CC BY) license (https://creativecommons.org/licenses/by/4.0/).


