1. Introduction
Solar photovoltaic (PV) systems have become a crucial technology in the worldwide shift to sustainable and renewable energy sources. The increasing apprehensions regarding climate change, the exhaustion of fossil resources, and the ecological consequences of traditional energy production have driven the global implementation of photovoltaic systems. Wind and solar photovoltaic energy will exceed nuclear power generation in 2025 and 2026, respectively. By 2028, renewable energy sources will represent over 42% of worldwide electricity generation, with the proportion of wind and solar photovoltaic energy doubling to 25% [
1]. The efficiency of these systems is a crucial determinant that directly affects their overall performance, energy output, and economic feasibility. Efficient photovoltaic systems enhance energy production while reducing expenses, which is crucial for the competitiveness of solar energy in the global energy market. Precise assessment of photovoltaic efficiency facilitates enhanced system design, optimization, and maintenance planning. It enables accurate energy yield forecasts, aiding in grid integration and energy strategizing. Furthermore, comprehending efficiency dynamics assists producers and engineers in enhancing PV module designs and materials, resulting in technological progress in the sector. Historically, the evaluation of photovoltaic performance has mostly concentrated on external environmental variables, including solar irradiation, ambient temperature, shade, and meteorological conditions. These parameters clearly influence the performance of photovoltaic systems; nonetheless, they do not present a comprehensive overview. The internal features of photovoltaic modules, including electrical parameters, material properties, and thermal behavior, provide vital insights that can be utilized for more accurate efficiency calculation. Parameters such as Open Circuit Voltage (Voc), Short Circuit Current (Isc), Maximum Power (Pmpp), Fill Factor (FF), and resistances (parallel, Rp and series, Rs) are inherent to photovoltaic modules and substantially influence their operating efficiency. Recent breakthroughs in machine learning (ML) have yielded sophisticated tools adept at predicting the intricate non-linear interactions characteristic of photovoltaic (PV) systems [
2]. Machine learning algorithms can manage extensive datasets with numerous variables, identifying complex patterns and relationships that conventional statistical methods would miss. The incorporation of machine learning in photovoltaic efficiency assessment offers a chance to improve forecast accuracy by concurrently accounting for both internal and external elements. Nonetheless, a considerable obstacle in utilizing ML models is their “black-box” characteristic. Although they provide excellent predicted accuracy, comprehension of how input features affect the output is frequently constrained. The absence of openness might impede confidence and acceptability among stakeholders that necessitate justifications for model projections, especially in vital applications such as energy systems. Interpretability is crucial for both validating model behavior and understanding the system’s physical processes. To tackle this difficulty, Explainable Artificial Intelligence (XAI) methodologies have been created to elucidate and clarify machine learning model predictions [
3]. XAI methodologies seek to elucidate the decision-making processes of machine learning models, offering insights into the contributions of input features to the resultant output. In the realm of photovoltaic systems, the application of explainable artificial intelligence approaches can clarify the impact of internal factors on efficiency calculation, thereby improving comprehension and enabling informed decision-making.
This study investigates the estimation of photovoltaic system efficiency utilizing eleven internal parameters: Open Circuit Voltage (Voc), Short Circuit Current (Isc), Maximum Power (Pmpp), Solar Irradiation Spread (SIS), Maximum Voltage (Vmpp), Maximum Current (Impp), Fill Factor (FF), Parallel Resistance (Rp), Series Resistance (Rs), and Module Temperature (Tm). We utilize advanced machine learning regression models, including XGBoost, CatBoost, LightGBM, AdaBoost, and Histogram-Based Gradient Boosting, to forecast efficiency based on these attributes. These models are selected for their capacity to manage non-linear relationships and interactions among variables, together with their shown efficacy in regression tasks.
To improve the interpretability of our machine learning models, we utilize explainable artificial intelligence techniques, notably SHAP (SHapley Additive exPlanations) and LIME (Local Interpretable Model-agnostic Explanations). SHAP offers a cohesive framework for elucidating forecasts by calculating the contribution of each feature to the final result, grounded in game theory principles [
4]. LIME elucidates individual predictions by locally approximating the intricate model with a comprehensible one [
5]. The utilization of these XAI approaches in photovoltaic efficiency assessment is innovative and bridges the gap in comprehending the influence of internal variables on model predictions.
This research is significant due to its potential to enhance the efficiency of photovoltaic systems. By comprehending the internal aspects that affect efficiency, engineers and practitioners can concentrate on essential parameters for system enhancements. Furthermore, the interpretability afforded by XAI approaches can augment the reliability and adoption of ML models within the renewable energy sector.
The principal objective of this study is to enhance the assessment of photovoltaic system efficiency by employing internal module characteristics alongside sophisticated machine learning models and explainable artificial intelligence approaches. We want to develop precise regression models for estimating photovoltaic efficiency utilizing internal features.
This study’s originality resides in the use of XAI techniques, SHAP and LIME, to elucidate the efficiency forecasts of machine learning models in the realm of photovoltaic systems. Although machine learning has been utilized in renewable energy forecasting and optimization, the application of explainable artificial intelligence techniques to elucidate the impact of internal photovoltaic properties on efficiency estimation is unprecedented. This study is, to our knowledge, the inaugural application of XAI approaches to clarify the internal dynamics of PV systems within efficiency prediction models, thus addressing a significant gap in existing research. We seek to integrate powerful machine learning techniques with explainable artificial intelligence to develop models that are both precise and interpretable. This method corresponds with the increasing desire for transparency in AI applications, particularly in areas where decision-making affects economic and environmental results.
Table 1 presents an overview of the research organized by technique and application domains derived from this literature review.
2. Background
The incorporation of machine learning in the renewable energy sector has garnered considerable attention in recent years. Numerous research studies have investigated the utilization of machine learning algorithms [
13] for the prediction and optimization of energy systems, including photovoltaic systems [
14].
Voyant et al. [
2] conducted an extensive assessment of machine learning methodologies for estimating solar power generation. They underscored the efficacy of machine learning algorithms in identifying non-linear patterns in solar irradiance and photovoltaic output, accentuating the potential for enhanced forecasting precision. Nonetheless, their emphasis was largely on exterior environmental conditions, with minimal attention to internal PV module attributes. Keddouda et al. [
15] created artificial neural network (ANN) and regression models to forecast photovoltaic (PV) module power production based on meteorological variables and operating temperature as inputs. Their ANN model, specifically utilizing the Levenberg–Marquardt training procedure, attained exceptional precision (R
2 reaching 0.998) and asserted superiority over previous models. Rätz et al. [
16] created an automated, data-driven machine learning instrument for modeling building energy systems utilizing sensor data, thereby diminishing dependence on the comprehensive system knowledge necessitated by gray and white box models. Their approach effectively simulated diverse energy systems in numerous scenarios, facilitating forecasting, control techniques, and compensating for absent data. The application of sophisticated gradient boosting algorithms in photovoltaic systems has been investigated. Kumari and Toshniwal [
17] created an ensemble model called XGBF-DNN, which integrates extreme gradient boosting forests and deep neural networks through ridge regression to predict hourly global horizontal irradiance. Their model, utilizing specific input features such as temperature, clear-sky index, relative humidity, and hour of the day, exhibited enhanced prediction accuracy and stability across various Indian climates in comparison to conventional machine learning techniques, rendering it suitable for energy forecasting applications, including solar and wind power. Explainable AI methodologies have garnered attention across multiple fields but remain largely unexamined in photovoltaic system modeling. Lundberg and Lee [
4] presented SHAP as a technique for elucidating intricate machine learning models. Their methodology has been utilized in sectors such as healthcare and finance, although it has not gained widespread acceptance in renewable energy research. Ribeiro et al. [
5] created LIME to furnish localized explanations for specific forecasts. LIME has been utilized in picture and text classification; nonetheless, its employment in regression assignments concerning photovoltaic systems is unprecedented. Chen et al. [
18] examined the use of interpretable machine learning techniques to improve building energy management, tackling the opaque character of conventional ML models. They recognized obstacles such as inconsistent terminology about interpretability, difficulties in evaluating model performance across tasks, and the limits of existing approaches like SHAP and LIME. The authors advocated for more study to enhance model interpretability to expedite the integration of machine learning in building energy management. Notwithstanding the progress made, a significant deficiency exists in the literature concerning the utilization of XAI approaches for elucidating ML models in photovoltaic efficiency estimate. Current research has either prioritized enhancing prediction accuracy at the expense of interpretability or has inadequately examined the intrinsic properties of PV modules. This study bridges the gap by combining advanced machine learning models with explainable artificial intelligence methodologies to assess photovoltaic efficiency utilizing internal features. In doing so, we enhance both the methodological development of machine learning applications in renewable energy and the practical comprehension of photovoltaic system performance.
3. Methodology
3.1. Data Collection and Preprocessing
This study’s dataset includes measurements from many modules of diverse photovoltaic technologies, concentrating on 11 internal module features, as detailed in
Section 4. The input features comprise Open Circuit Voltage (Uoc), Short Circuit Current (Isc), Maximum Power (Pmpp), Solar Irradiation Spread (SIS), Maximum Voltage (Umpp), Maximum Current (Impp), Fill Factor (FF), Parallel Resistance (Rp), Series Resistance (Rs), and Module Temperature (Tm). The output feature is the Efficiency of the photovoltaic system, determined as the ratio of electrical power output to solar power input. Data were originally collected every 5 min in the 6th month of 2022 from the Utrecht University Photovoltaic Outdoor Test Facility (UPOT). These data were then aggregated to hourly averages for analysis, resulting in a final dataset of 468 data points after cleaning and preprocessing. The eleven input parameters were selected based on their established influence on PV module efficiency, as reported in the literature [
19]. These parameters represent key electrical characteristics, material properties, and operating conditions that directly affect the conversion of solar energy into electricity. Prior to model training, a correlation analysis was performed to confirm the influence of these parameters on the output variable (Efficiency). The correlation matrix indicated strong relationships between most of the selected features and Efficiency, supporting their inclusion in the model. However, the Record Time (RecTime) parameter was found to have a very low correlation with Efficiency and was excluded from the final feature set to prevent unnecessary complexity.
Data pretreatment encompassed common protocols to guarantee data quality and appropriateness for modeling. Missing values were adequately addressed, and outliers were recognized and managed. Normalization techniques were employed for feature scaling to enhance model convergence. The dataset was partitioned into training (80%) and testing (20%) sets to assess model performance. While a separate validation set is common in machine learning workflows, we opted for a simpler train/test split due to the relatively small size of our dataset (n = 468). With such a limited number of data points, creating a separate validation set would further reduce the size of the training set, potentially hindering the models’ ability to learn effectively. To mitigate the risk of overfitting, we employed regularization techniques within each model and carefully monitored performance on the test set.
3.2. Machine Learning Models
The five machine learning regression models (XGBoost (2.1.1), CatBoost (1.2.5), LightGBM (4.5.0), AdaBoost (1.4.2), and Histogram-Based Gradient Boosting (1.4.2)) were selected for this study due to their proven performance in regression tasks, their ability to handle complex non-linear relationships, and their diverse approaches to gradient boosting. XGBoost was chosen for its regularization techniques and efficiency in handling large datasets. CatBoost was included due to its ability to effectively handle categorical features without extensive preprocessing. LightGBM was selected for its speed and efficiency, particularly with high-dimensional data. AdaBoost was chosen as a representative boosting algorithm with a different approach to weighting and combining weak learners. Finally, Histogram-Based Gradient Boosting was included for its computational efficiency and ability to handle large datasets with reduced memory consumption. This combination of models allows for a comprehensive comparison of different gradient boosting techniques and their suitability for predicting PV system efficiency. While Deep Neural Networks (DNNs) have shown promise in regression tasks, particularly those involving non-categorical parameters, we opted to focus on gradient boosting methods in this study for several reasons. First, gradient boosting methods are known for their ability to achieve high performance with relatively small datasets, which is relevant given the size of our dataset (n = 468). Second, gradient boosting methods often require less hyperparameter tuning than DNNs, making them more efficient to implement and optimize. Third, the interpretability of gradient boosting models, particularly when combined with XAI techniques like SHAP and LIME, aligns with our goal of understanding the factors influencing PV system efficiency. While future work could explore the application of DNNs to this problem, we believe that the gradient boosting methods provide a strong balance of performance, efficiency, and interpretability for the scope of this study.
- (A)
Extreme Gradient Boosting (XGBoost)
XGBoost is a sophisticated version of gradient-boosting techniques, enhanced for computational efficiency and model efficacy [
20]. It employs a gradient boosting framework that constructs additive models in a sequential manner, facilitating the optimization of any differentiable loss functions. XGBoost employs regularization methods (L1 and L2) to mitigate overfitting, hence improving the model’s generalization capabilities. XGBoost utilizes second-order Taylor series expansions of the loss function for enhanced accuracy and computational efficiency. It facilitates parallel processing, manages missing values internally, and incorporates sparsity-aware algorithms, rendering it exceptionally efficient for large-scale and high-dimensional data. XGBoost’s characteristics render it especially adept at modeling the intricate non-linear interactions inherent in photovoltaic system efficiency prediction [
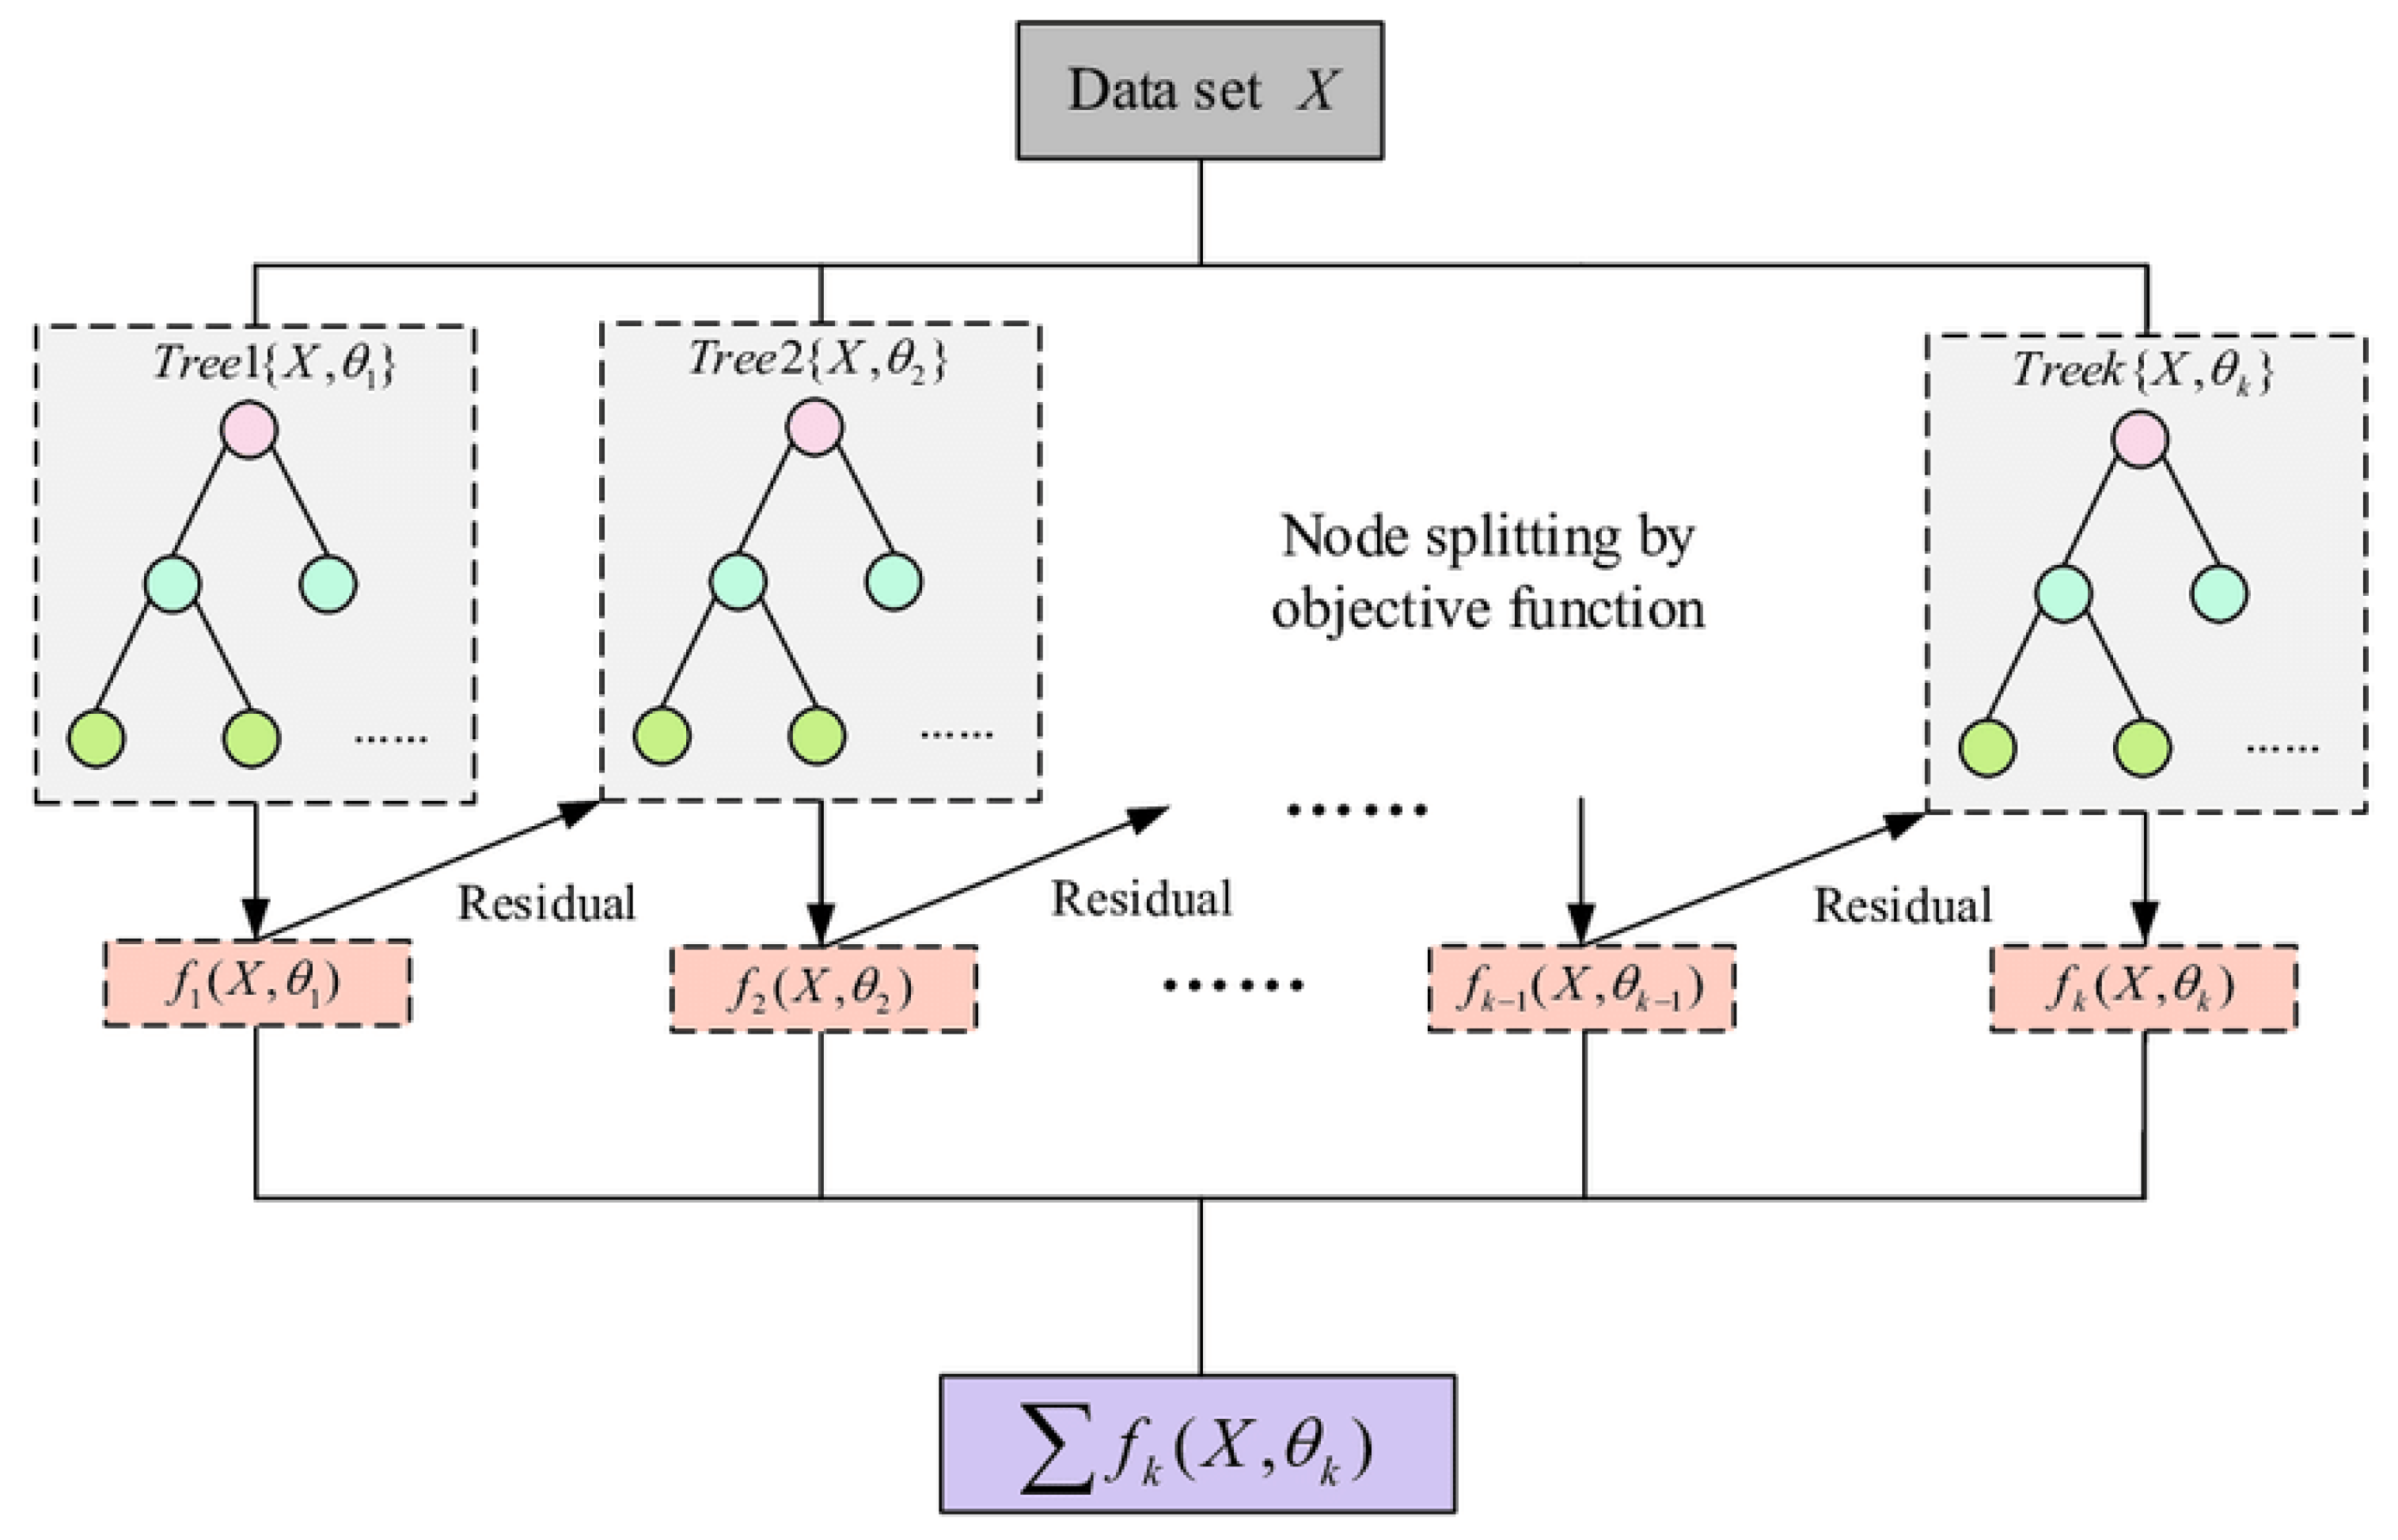
20].
Figure 1 depicts XGBoost, which exemplifies the gradient boosting framework, wherein each successive tree models the residuals of preceding trees to optimize the objective function. Likewise, CatBoost, LightGBM, AdaBoost, and Histogram-Based Gradient Boosting adhere to boosting concepts, although they enhance training using distinct methodologies. CatBoost adeptly manages categorical data, LightGBM employs leaf-wise tree development, AdaBoost allocates increased weights to misclassified instances, and Histogram-Based Gradient Boosting enhances training speed by utilizing binned feature values. In the figure, functions
,
,…,
represent each subsequent tree that models the residuals from previous iterations, aiming to reduce errors in the dataset. Each tree splits the data based on the residuals calculated by the objective function to minimize overall error. The final model is represented by the sum of these functions,
, which serves as the prediction function that optimizes the target objective.
- (B)
CatBoost
CatBoost is a gradient boosting technique that proficiently manages categorical features without requiring considerable preparation [
21]. It presents novel methodologies, including ordered boosting and target statistics, to address prediction shift and overfitting. Ordered boosting employs a permutation-based methodology to guarantee that each model is trained on novel data, hence mitigating the bias associated with conventional gradient boosting techniques.
The technique employs symmetric decision trees, which facilitate the reduction in prediction time and the preservation of balanced tree topologies. CatBoost’s proficiency in handling categorical variables and its resilience to overfitting render it a useful instrument for datasets characterized by intricate patterns and interactions, exemplified by the internal features of PV systems [
22].
- (C)
LightGBM
LightGBM is a gradien- boosting framework optimized for efficiency and scalability, especially applicable to extensive datasets with high dimensionality [
23]. It presents two innovative methodologies: Gradient-based One-Side Sampling (GOSS) and Exclusive Feature Bundling (EFB). GOSS preserves instances with substantial gradients while eliminating those with minimal gradients, so substantially decreasing the quantity of data instances without markedly impacting accuracy. EFB minimizes the feature set by consolidating mutually exclusive features, therefore reducing computational expenses. LightGBM constructs trees in a leaf-wise manner (best-first) instead of a level-wise approach, resulting in accelerated convergence and enhanced accuracy. This method may lead to overfitting if not adequately regularized. In our research, LightGBM’s rapid training performance and minimal memory consumption enabled us to effectively manage high-dimensional data and conduct swift iterations during model optimization.
- (D)
Adaptive Boosting (AdaBoost)
AdaBoost is an ensemble learning technique that integrates several weak learners to create a robust predictive model [
24]. It operates by incrementally modifying the weights of training cases, placing greater emphasis on those that prior models inaccurately predicted. Each successive weak learner is trained to rectify the faults of its predecessor, and the final model consolidates the predictions of all learners, weighted according to their performance. AdaBoost, in technical terms, minimizes an exponential loss function, rendering it susceptible to noisy data and outliers. Notwithstanding this sensitivity, it possesses the benefit of diminishing both bias and variance, hence enhancing its efficacy in regression tasks. AdaBoost’s iterative emphasis on challenging cases in PV efficiency prediction improves its capacity to model intricate linkages within the data.
- (E)
Histogram-Based Gradient Boosting
Histogram-Based Gradient Boosting is an efficient variant of gradient boosting that enhances the training speed by converting continuous features into discrete bins or histograms [
25]. This discretization diminishes the quantity of split points to evaluate during tree construction, resulting in expedited computation and decreased memory consumption. The technique identifies appropriate split points using histogram bins, effectively mimicking continuous features with minimal information loss. This strategy is especially beneficial for extensive datasets where computational efficiency is paramount. Simplifying continuous variables preserves competitive performance while decreasing training duration. In our work, the Histogram-Based Gradient Boosting technique enabled us to effectively simulate the PV efficiency data, achieving a compromise between precision and computational resource consumption.
3.3. Techniques for Explainable AI
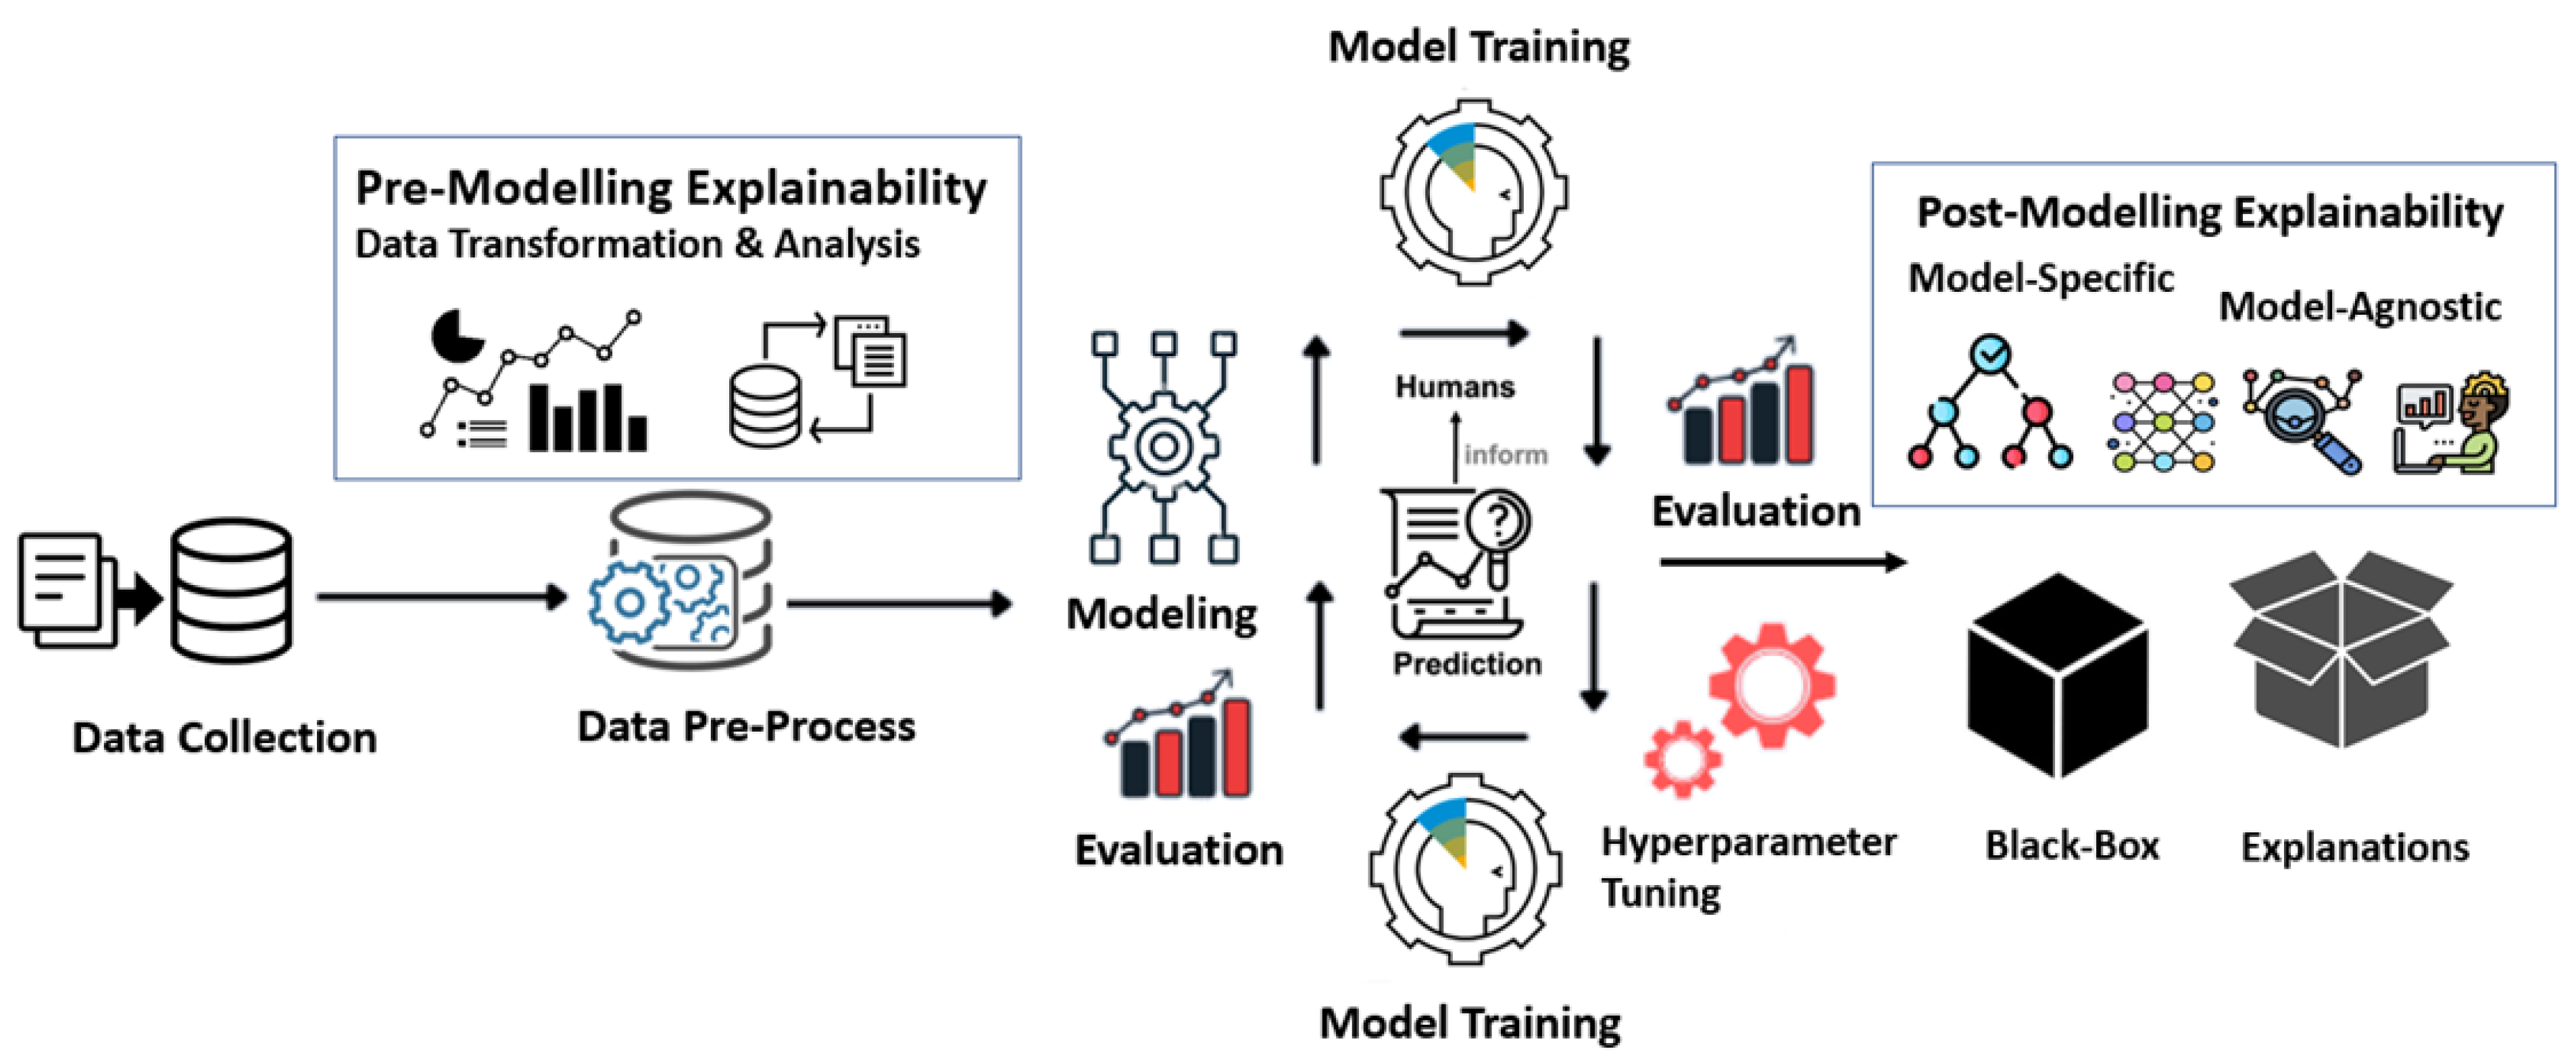
We utilized two Explainable Artificial Intelligence (XAI) techniques, SHAP (SHapley Additive exPlanations) version[0.46.0] and LIME (Local Interpretable Model-agnostic Explanations) version[0.2.0.1], to elucidate the predictions of our machine learning models (
Figure 2).
SHAP (SHapley Additive exPlanations) is grounded in cooperative game theory and offers a cohesive methodology for elucidating the outputs of any machine learning model [
27]. It calculates Shapley values, which denote the contribution of each characteristic to the forecast, so ensuring consistency and local correctness in the explanations. SHAP provides global interpretability by consolidating local explanations, facilitating the evaluation of feature significance throughout the entire dataset [
28]. This work calculated SHAP values for the trained models to measure the influence of each internal feature on efficiency forecasts. The SHAP library’s visualization tools, including summary plots and dependence plots, enabled a thorough comprehension of the impact of features on model outputs. This facilitated the identification of critical elements influencing photovoltaic efficiency and offered insights into the model’s decision-making process. LIME (Local Interpretable Model-agnostic Explanations) aims to deliver localized explanations by approximating a complex machine learning model with an interpretable model centered on a particular prediction [
29]. It disturbs the input data surrounding the instance of interest and monitors alterations in the predictions, so creating a local surrogate model that is readily interpretable, such as linear regression or a decision tree. Utilizing LIME, we elucidated individual predictions of the efficiency model, emphasizing the characteristics that most significantly influenced a particular prediction and the nature of their impact. This localized interpretability is essential for comprehending anomalies or particular instances where the model’s forecast is crucial for decision-making.
4. Data and Assessment Criteria
Data were gathered at five-minute intervals from the Utrecht University Photovoltaic Outdoor Test Facility (UPOT), located in Utrecht, The Netherlands (Latitude: 52.0907374, Longitude: 5.1214201), which evaluates the performance of several photovoltaic (PV) modules under real-world situations (
Figure 3) [
30]. Solar radiation measurements were obtained using a Kipp & Zonen CMP11 pyranometer (Delft, The Netherlands). The dataset contains 11 features; 10 serve as input variables, while one feature (Efficiency) functions as the output variable in the models. The characteristics and their associated values are displayed in
Table 2.
Each model was trained on the training dataset, with hyperparameters optimized via grid search and cross-validation methods. To ensure reproducibility, the random_state was set to 42 for all models. The number of estimators (n_estimators) was also consistently set to 500 across all models after optimization. Other hyperparameters were specific to each model and were determined through the grid search process. The evaluation of model performance was conducted utilizing metrics such as Mean Absolute Error (MAE), Mean Squared Error (MSE), Root Mean Squared Error (RMSE), and the coefficient of determination (R
2). The metrics are computed utilizing the below formulae. The MAE (Equation (1)) measures the mean magnitude of the absolute discrepancies between expected and observed values. The MSE (Equation (2)) evaluates the mean squared differences between expected and actual values. The RMSE (Equation (3)), the square root of the MSE, quantifies the model’s predictive performance by assessing the square root of the mean squared discrepancies between anticipated and actual values. The R
2 (Equation (4)) value indicates the extent to which the variance in the dependent variable is elucidated by the independent factors.
5. Results
We evaluated the effectiveness of the five regression models (XGBoost, CatBoost, LightGBM, AdaBoost, and Histogram-Based Gradient Boosting) was assessed utilizing four principal metrics: Mean Absolute Error (MAE), Mean Squared Error (MSE), Root Mean Squared Error (RMSE), and the Coefficient of Determination (R
2). The findings are encapsulated in
Table 3.
Among the models we analyzed, CatBoost attained the minimal MAE of 0.023, signifying exceptional accuracy in forecasting PV system efficiency. XGBoost and LightGBM demonstrated marginally elevated MAE values of 0.025 and 0.026, respectively, indicating similar performance. Histogram-Based Gradient Boosting had a Mean Absolute Error (MAE) of 0.027, whereas AdaBoost registered the greatest MAE of 0.040, signifying inferior predictive accuracy compared to the other models. MSE and RMSE are metrics that impose greater penalties on larger errors, with RMSE yielding values in the same units as the target variable. CatBoost once more surpassed the other models, with the lowest MSE of 0.002 and RMSE of 0.054. XGBoost and LightGBM had MSE values of 0.003 and RMSE values of 0.061, indicating robust predictive performance. Histogram-Based Gradient Boosting exhibited a mean squared error (MSE) of 0.003 and a root mean squared error (RMSE) of 0.062. AdaBoost demonstrated the highest MSE and RMSE values of 0.004 and 0.068, respectively, highlighting its comparative underperformance in this scenario. The coefficient of determination (R
2) measures the proportion of variance in the dependent variable that can be predicted by the independent variables. CatBoost attained the greatest R
2 value of 0.90, signifying that it accounts for 90% of the variance in photovoltaic system efficiency based on the internal properties. XGBoost and LightGBM both achieved R
2 values of 0.88, indicating robust explanatory capability. Histogram-Based Gradient Boosting achieved a R
2 of 0.87, but AdaBoost recorded the lowest R
2 score of 0.85. We utilize SHAP and LIME methodologies to elucidate the constructed machine learning models. We offer both global and local explainability findings for CatBoost, identified as the most successful regression model among those evaluated. Initially, global explanations were derived via the SHAP approach to identify the features affecting the regression predictions generated by the CatBoost model for efficiency estimation throughout the entire dataset. The objective was to evaluate the model’s behavior comprehensively. The results of the global analysis are illustrated in
Figure 4 and
Figure 5.
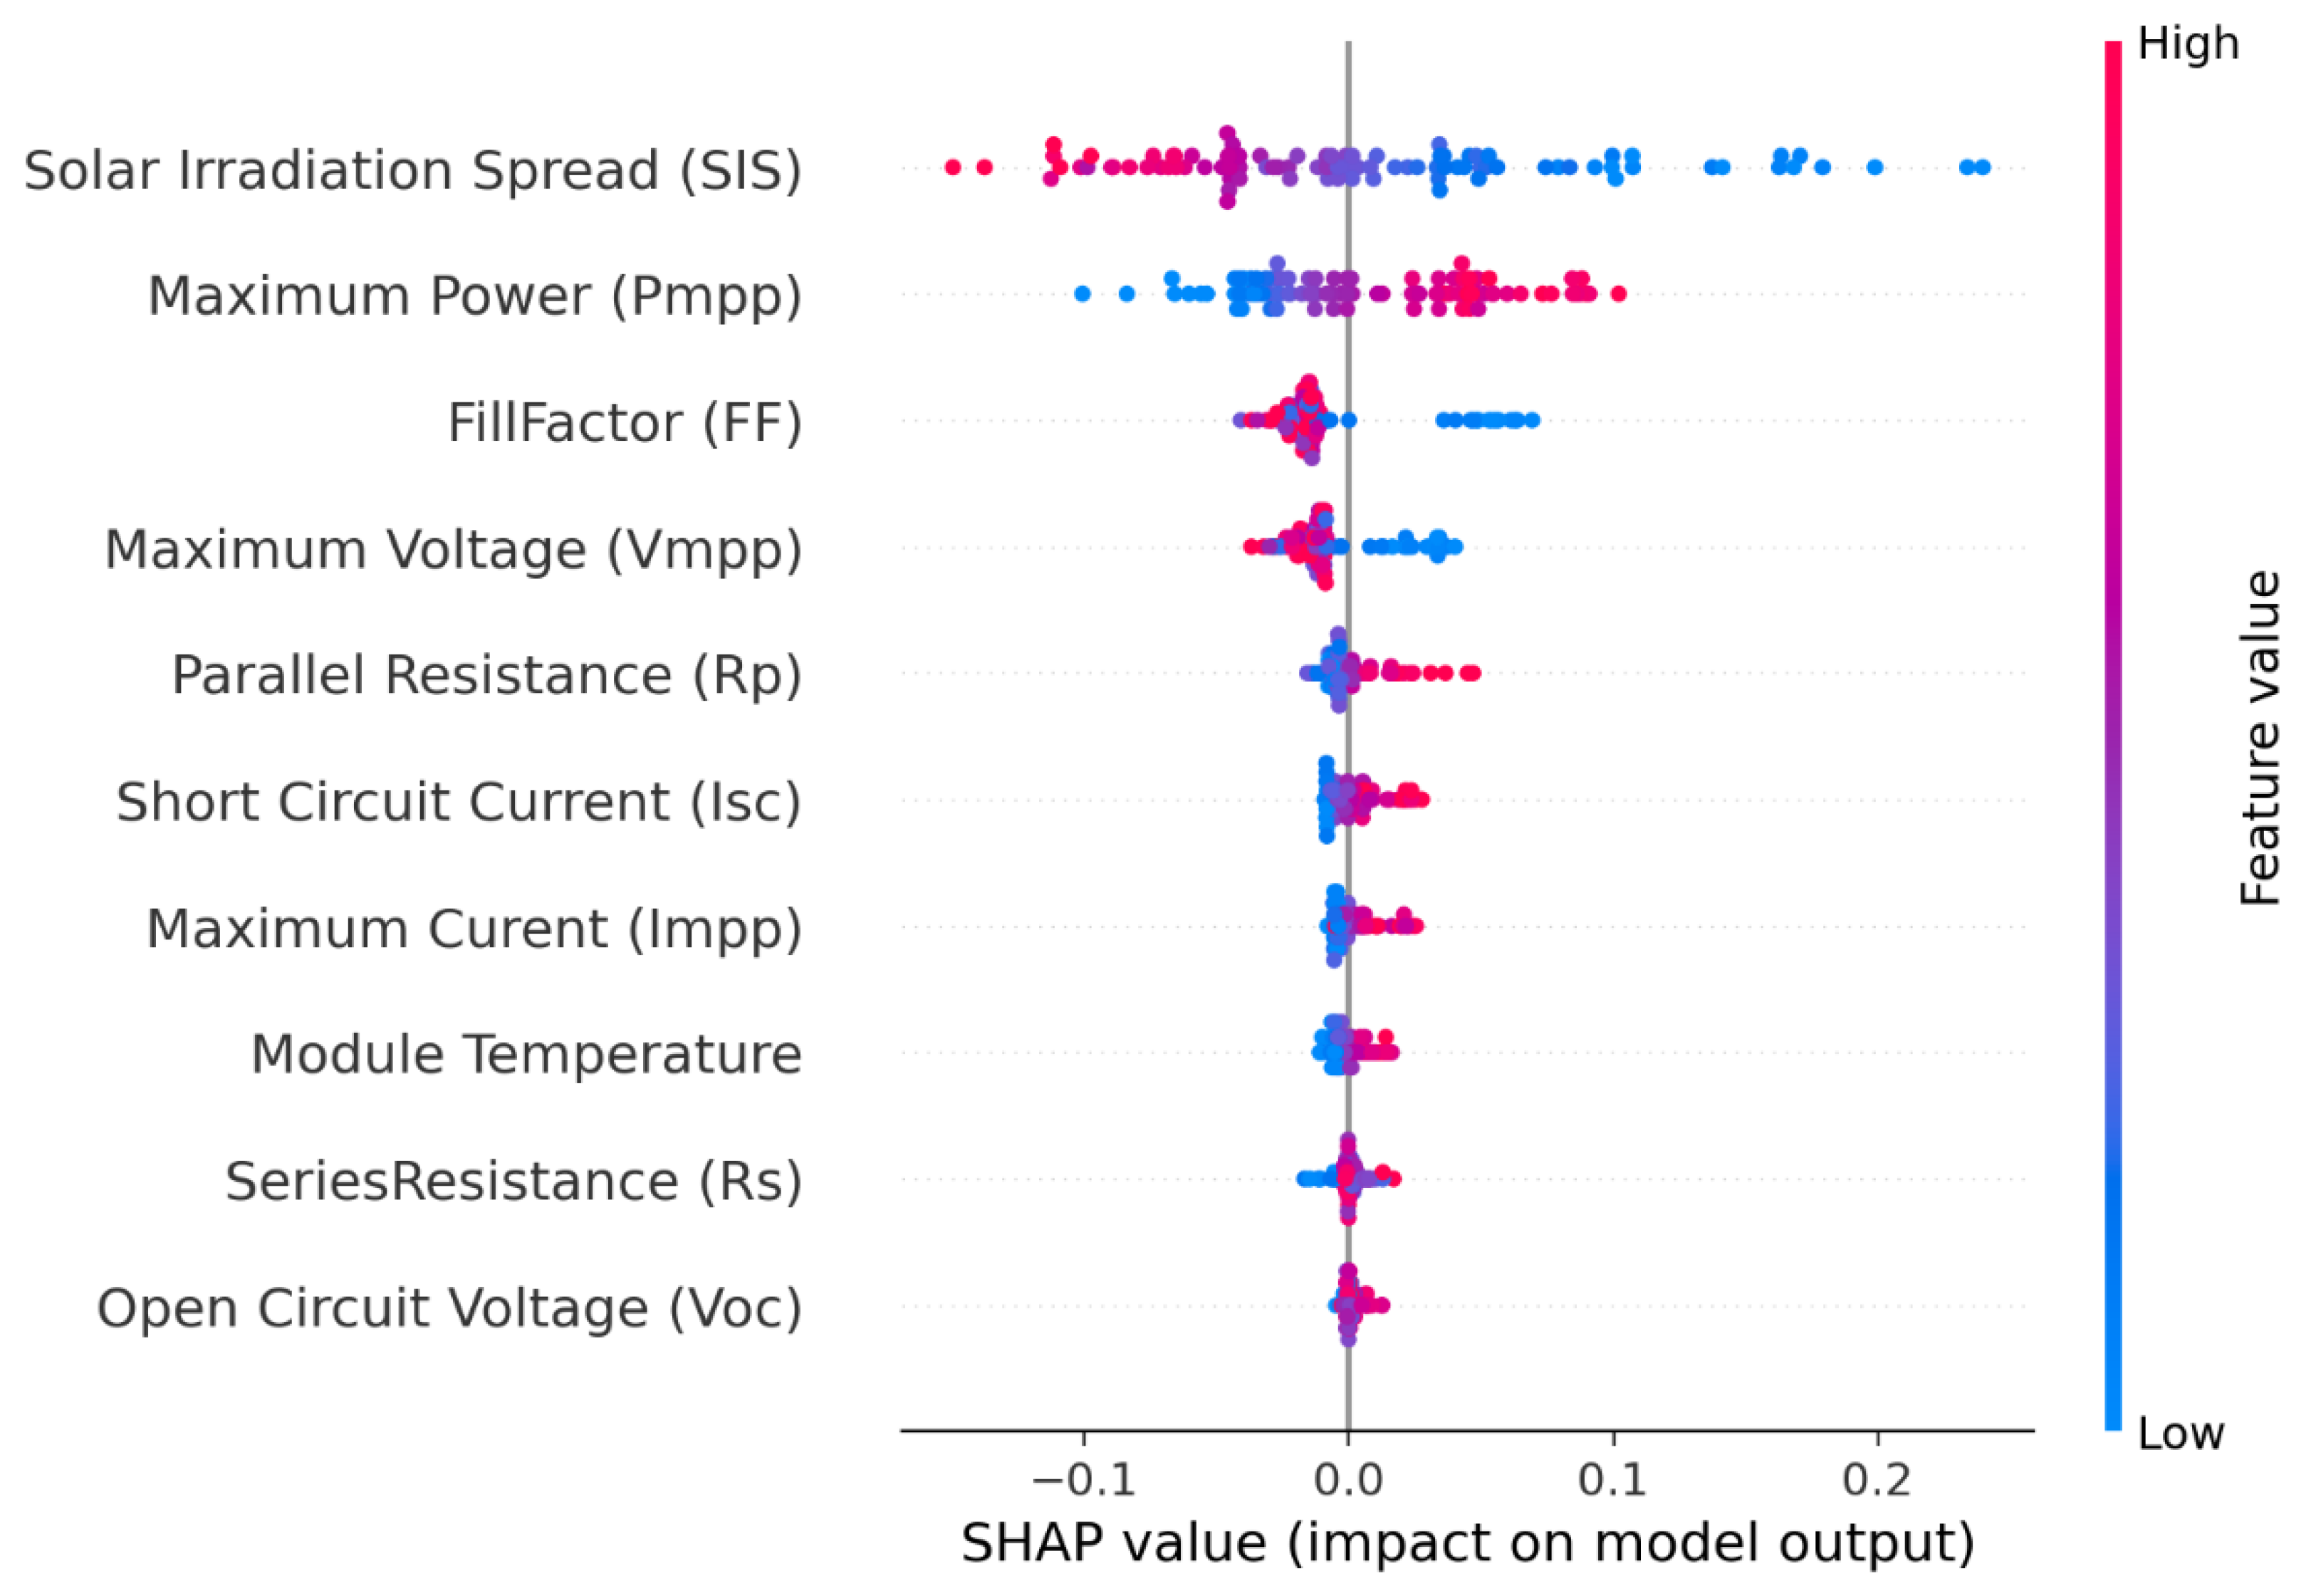
Figure 4 illustrates the factors that most significantly influence efficiency predictions throughout the dataset, sorted by relevance. The results indicate that the five primary features influencing efficiency estimation are Solar Irradiation Spread (SIS), Maximum Power (Pmpp), Fill Factor (FF), Maximum Voltage (Vmpp), and Parallel Resistance (Rp).
Examining
Figure 4 elucidates the significance of the solar irradiation distribution. This sun irradiation distribution aids in assessing the extent of usable territory and its optimal utilization. As to [
32], while the exact rooftop size is known, the useable area cannot be readily ascertained without accounting for shadowing, irregularities, or locations where panels cannot be put. The projected solar irradiation distribution considers these aspects, facilitating a pragmatic installation strategy.
Figure 5 illustrates the impacts and distributions of the principal features that substantially affect efficiency prediction throughout the dataset. The features are enumerated on the
y-axis, arranged by their overall significance from top to bottom. The
x-axis denotes the SHAP value, reflecting its influence on the model’s output.
Y-axis indicates the feature names in order of importance from top to bottom.
X-axis represents the SHAP value, which indicates the degree of change in log odds.
The color of each point on the graph represents the value of the corresponding feature, with red indicating high values and blue indicating low values.
Each point represents a row of data from the original dataset [
33].
High (pink) means the feature has a high value for that sample.
Low (blue) means the feature has a low value for that sample.
As shown in
Figure 5, some features, such as Fill Factor (FF) and Maximum Voltage (Vmpp), exhibit a mix of both high (pink) and low (blue) values at similar SHAP values. This indicates that both high and low values of these features can have similar impacts on the model’s prediction, depending on the specific data instance and its interaction with other features. This behavior suggests a complex or non-linear relationship between these features and the PV system efficiency. The investigation indicates that elevated levels of solar irradiation dispersion often exacerbate the adverse effects on the model, while they may mitigate negative impacts in certain instances. Increased Maximum Power (Pmpp) levels enhance the model’s beneficial influence and mitigate adverse impacts. Fill Factor (FF) demonstrates a comparable trend of escalating negative impacts while diminishing their intensity. Conversely, Maximum Voltage (Vmpp) values exhibit an augmentation in the adverse impact on the model while diminishing beneficial contributions. Ultimately, Parallel Resistance (Rp) appears to augment the beneficial impact on the model while mitigating adverse contributions.
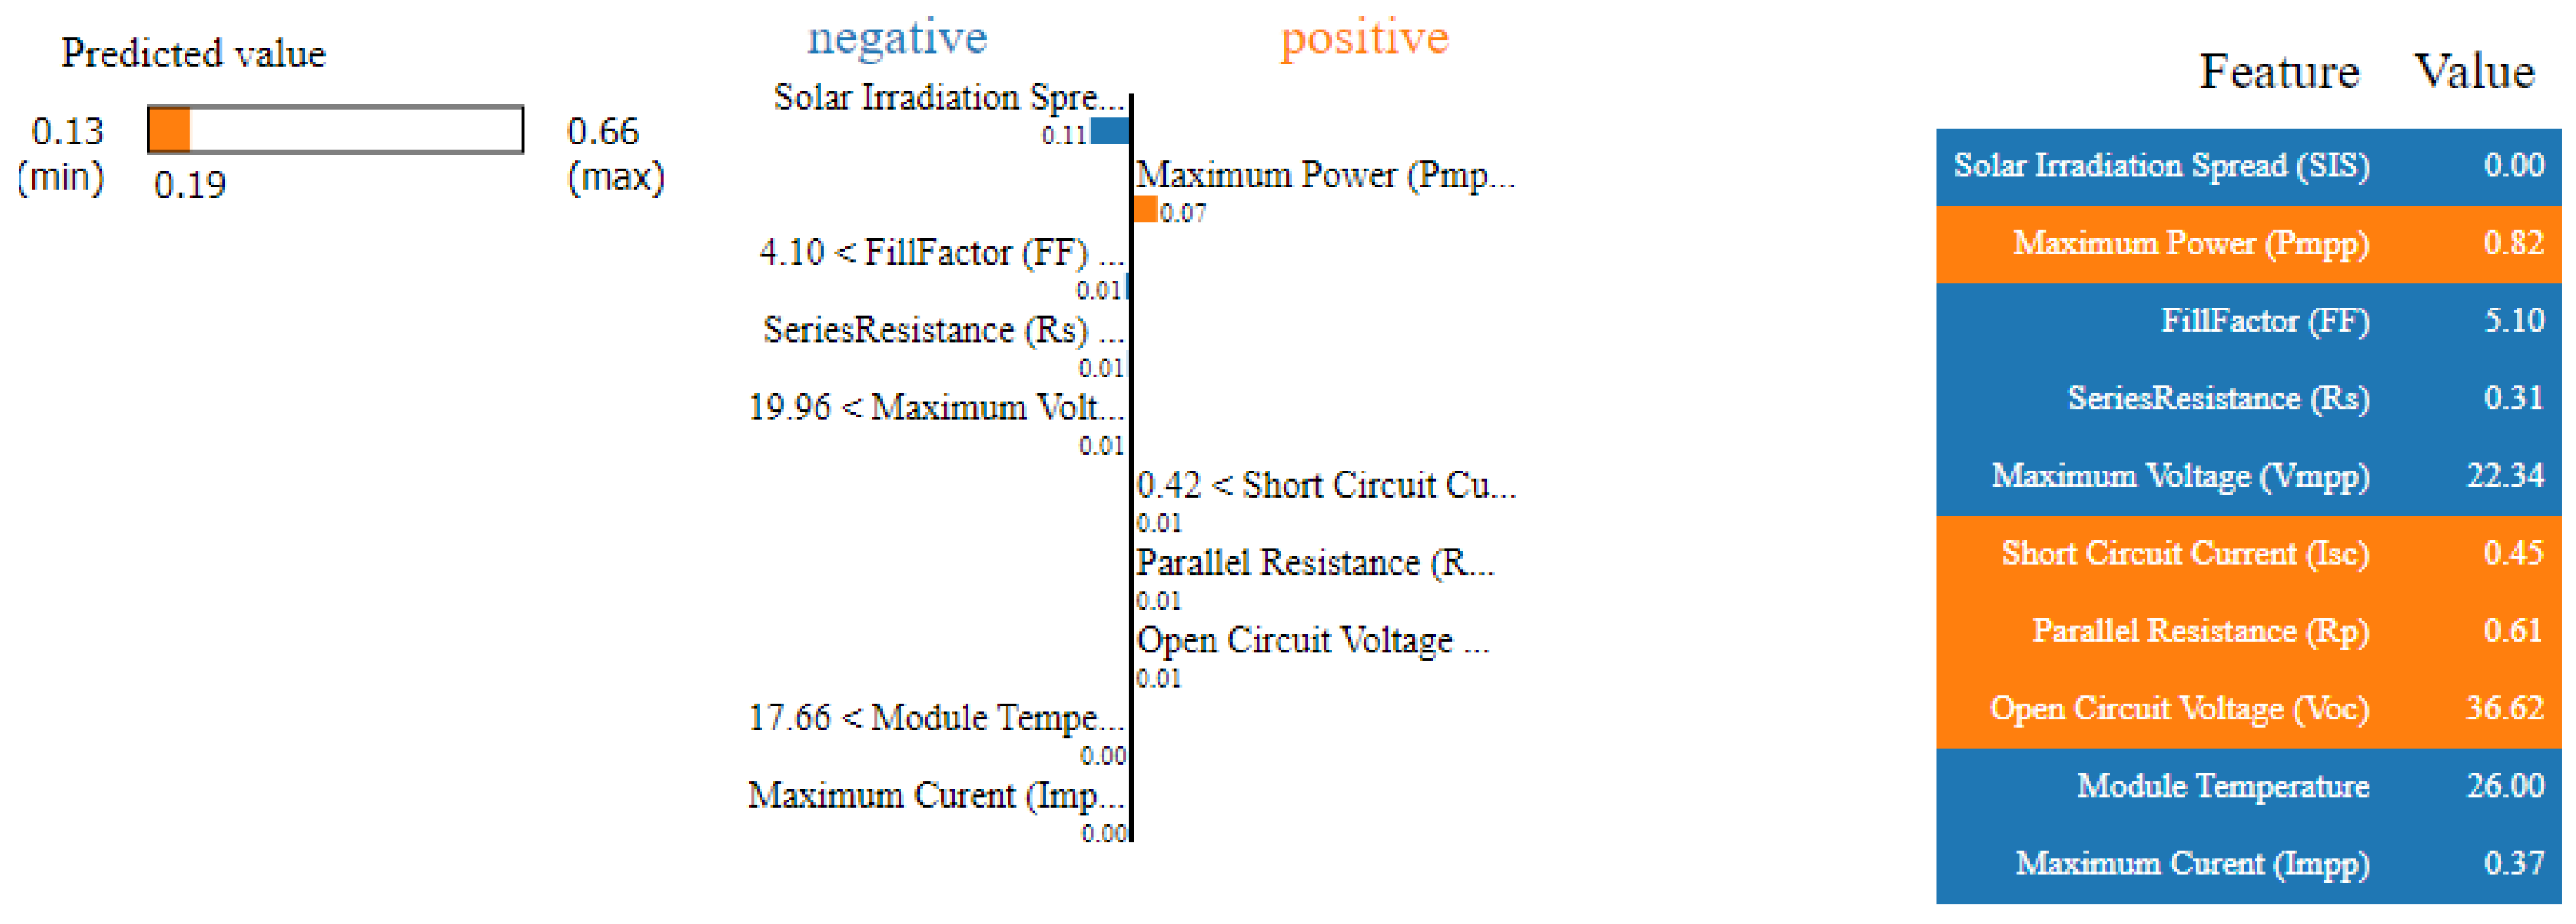
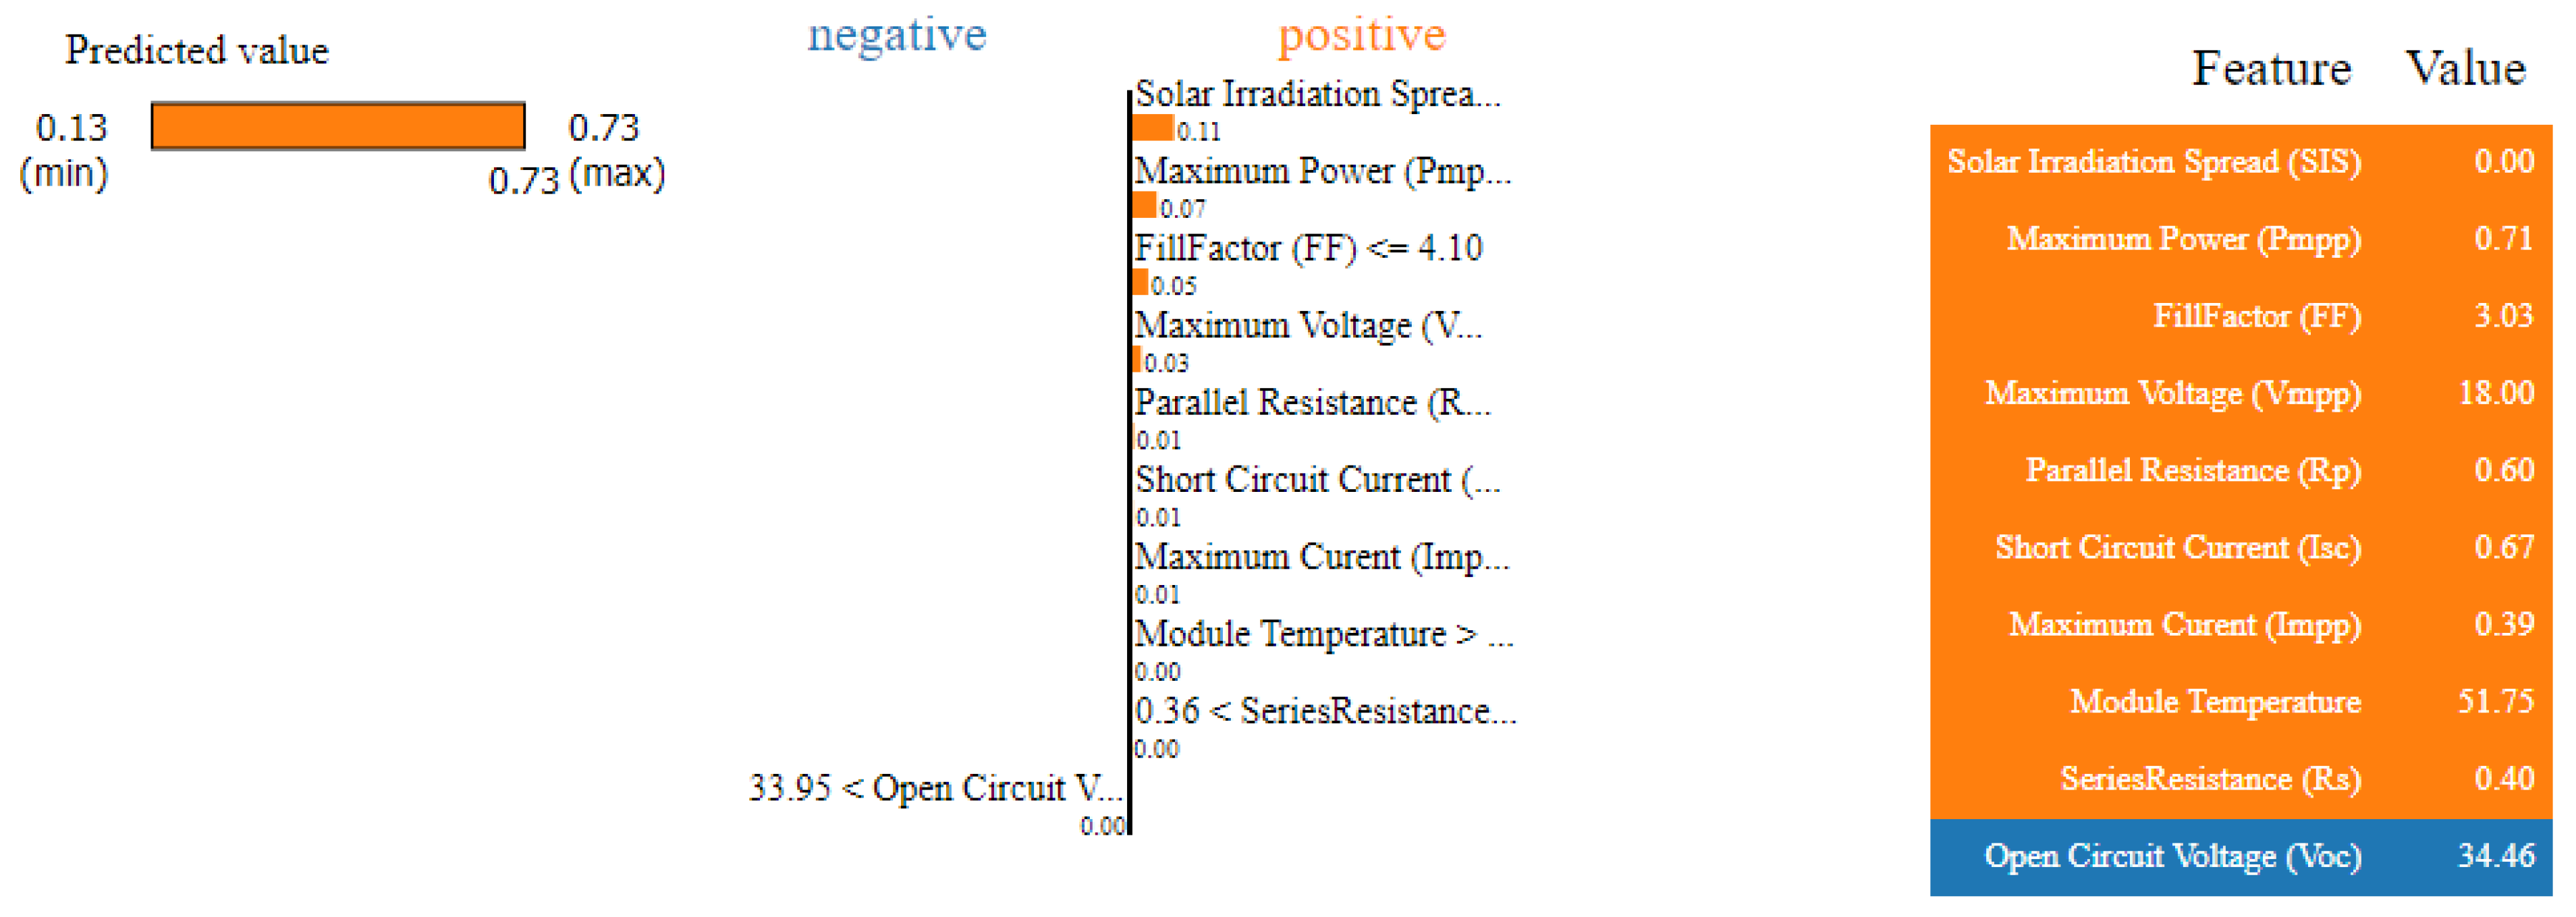
Global explanations furnish a comprehensive comprehension of feature influences on model behavior, whereas local explanations elucidate the rationale behind a single prediction in particular circumstances. To do this, we utilized the LIME approach to elucidate individual predictions, concentrating on two separate samples from the dataset—one exhibiting low efficiency and the other high efficiency.
Figure 6 and
Figure 7 depict the local interpretability outcomes for these two scenarios.
Our analysis in
Figure 6 shows that the model forecasts an efficiency value of 0.19 for the specified sample. The three most significant features for this prediction are: Solar irradiation spread exceeding 0.00, which adversely impacts efficiency; Maximum Power (Pmpp) surpassing 0.63, which has a positive contribution; and Fill Factor (FF) ranging from 4.10 to 6.32, which also negatively influences the outcome. In contrast,
Figure 7 illustrates the local explanation for the high-efficiency sample, which has a predicted efficiency value of 0.73. The primary contributing parameters include: solar irradiation equal to or less than 0.00, maximum power (Pmpp) values either below or above 0.63, and fill factor (FF) equal to or less than 4.10. The interpretability approaches, SHAP for global explanations and LIME for local explanations, offer complementary insights into the performance and behavior of the CatBoost regression model, thereby augmenting our comprehension of the principal factors influencing the model’s predictions.
6. Discussion
The comparative study results indicate that CatBoost surpassed other regression models in forecasting the efficiency of photovoltaic (PV) systems, underscoring its proficiency in managing intricate non-linear connections and categorical variables. The enhanced accuracy across all evaluation criteria is due to CatBoost’s distinctive features, including ordered boosting and effective management of categorical input, which alleviate overfitting concerns and enhance generalization. This skill is essential in photovoltaic efficiency estimates, where understanding the interplay between internal factors like maximum power (Pmpp) and fill factor (FF) is crucial for enhancing prediction accuracy. XGBoost and LightGBM demonstrated commendable outcomes, with performance measures closely aligning with those of CatBoost. XGBoost’s integration of regularization approaches and LightGBM’s application of Gradient-based One-Side Sampling (GOSS) and Exclusive Feature Bundling (EFB) improve their efficacy in managing intricate datasets. Nonetheless, CatBoost’s proficiency in modeling intricate non-linear interactions rendered it the most effective model in this investigation. The marginally inferior performance of Histogram-Based Gradient Boosting, despite its computational ease, underscores the trade-off between computational efficiency and model efficacy. The discretization of continuous features may result in information loss, hence accounting for the observed rise in prediction error. AdaBoost’s comparatively elevated error metrics highlight its constraints in this situation. The focus on misclassified instances during training renders it vulnerable to noise and outliers, which likely impaired its capacity to accurately simulate the intricacies of PV system efficiency. This discovery underscores the significance of model selection contingent upon the dataset’s complexity and the prediction objective. The incorporation of Explainable Artificial Intelligence (XAI) methodologies, particularly SHAP and LIME, enhances understanding of the model’s predictions by pinpointing the significant elements for efficiency assessment. Global explanations utilizing SHAP elucidate the most significant elements within the dataset, including solar irradiation distribution, maximum power, and fill factor, thereby offering a comprehensive comprehension of their contributions. MPP and fill factor are influenced by extrinsic factors such as sun irradiation. El-Khozondar, El-Khozondar, and Matter [
19] similarly proved that when irradiance increases, the output current and maximum power point (MPP) increase, however the fill factor falls. This underscores the substantial impact of solar irradiance, an external variable, on these parameters. Simultaneously, local explanations via LIME clarify specific forecasts, offering a more detailed picture. This dual methodology for model interpretation boosts both the transparency and reliability of the model while offering actionable insights to inform enhancements in photovoltaic module design and operating efficiency. The present study is limited by its evaluation of model performance on a single dataset from the Utrecht University Photovoltaic Outdoor Test Facility (UPOT). While this dataset provides valuable insights into the performance of PV systems under real-world conditions, it is important to acknowledge that the results may not generalize perfectly to other datasets with different characteristics (e.g., different PV technologies, climatic conditions, or data collection methodologies). Future research should explore the performance of these machine learning models on multiple, diverse datasets to assess their robustness and generalizability. This would provide a more comprehensive understanding of the strengths and weaknesses of each method and inform the selection of the most appropriate model for different PV system applications. An important aspect not explicitly addressed in this study is the uncertainty associated with the machine learning model predictions. While metrics such as MAE, MSE, and RMSE provide an indication of the average prediction error, they do not quantify the uncertainty in individual predictions. This uncertainty can arise from various sources, including the inherent randomness of the data, the limited size of the training dataset, and the approximations made by the machine learning models. Future research should explore methods for quantifying model uncertainty, such as using bootstrapping techniques to estimate confidence intervals for the predictions or employing Bayesian machine learning approaches that explicitly model uncertainty. Furthermore, hypothesis testing could be incorporated to formally assess the statistical significance of the observed differences in performance between the different machine learning models. For example, a paired
t-test could be used to compare the predictions of two models on the same test dataset to determine if the difference in their performance is statistically significant. Addressing model uncertainty and incorporating hypothesis testing would provide a more rigorous and comprehensive evaluation of the machine learning models and enhance the reliability of the findings.
7. Conclusions
The comparative analysis of machine learning models for predicting photovoltaic system efficiency indicated that CatBoost is the most effective model, providing enhanced accuracy and strong generalizability. Its sophisticated abilities in managing categorical data, mitigating overfitting, and capturing non-linear interactions render it an essential instrument for modeling photovoltaic efficiency based on internal properties. The ramifications of this study extend beyond model selection; precise efficiency calculation directly influences the optimization of photovoltaic system design, enhancing energy output and diminishing operational expenses. Moreover, the integration of XAI approaches like SHAP and LIME enhances comprehension of the determinants affecting efficiency forecasts, thus augmenting the interpretability and practical applicability of the models. These insights can enable precise interventions to enhance PV module performance, hence fostering more efficient and sustainable energy generation. The findings underscore the essential importance of sophisticated machine learning models and explainable artificial intelligence techniques in the renewable energy sector. Utilizing these tools allows stakeholders to acquire profound insights into PV systems, facilitating more informed decision-making that promotes the advancement and optimization of PV technology. Future research should investigate the incorporation of time-series analysis techniques like Recurrent Neural Networks (RNNs) or Long Short-Term Memory (LSTM) networks to capture temporal dependencies in PV system performance. Furthermore, exploring advanced XAI methods beyond SHAP and LIME, such as counterfactual explanations or causal inference techniques, could provide deeper insights into the underlying factors driving PV efficiency. Finally, the impact of different data aggregation intervals (e.g., 15 min, 30 min) on model performance and interpretability warrants further investigation.


