Abstract
The separation of mixed signals typically requires appropriate prior assumptions, while traditional signal separation methods struggle to describe the differences in separation targets with significant features. This paper proposes a signal separation framework based on knowledge representation, where separation targets are represented with knowledge, guiding the branches of autoencoders for signal separation. Firstly, under the proposed knowledge representation framework, corresponding knowledge representations are obtained based on observed mixed signals. Secondly, the number of branches of the autoencoder is determined based on the number of separation target signals. Then, utilizing the results of knowledge representation, a branch autoencoder network is constructed, with branches guided by knowledge to achieve the separation of target sub-signals. Finally, a self-encoding network architecture is constructed with a combination of observation signal reconstruction error and knowledge-guided error constraints. Through numerical simulations on a layered velocity model, the Marmousi-II geological model, and the MNIST dataset, the proposed method is validated by comparing the numerical energy differences between predictions and ground truths, demonstrating its effectiveness under both limited and ample data conditions.
1. Introduction
Signal separation, as a key signal processing task, aims to untangle complex mixtures. Such problems typically fall into the category of ill-posed problems, thus requiring the extraction of accurate components from mixed signals based on specific assumptions as constraints [1,2]. It is important in various domains such as speech processing, geophysics, remote sensing, and image processing. The main approach to solving signal separation problems is to utilize the differences in characteristics between target signals, effectively separating them. In this process, the main methods include signal separation methods based on mathematical feature differences, those based on transformation domain feature differences, and artificial intelligence signal separation methods.
Signal separation methods based on mathematical prior assumptions are one of the current research focuses. Among them, non-negative matrix factorization (NMF) is a commonly used method based on mathematical features of the target [3,4]. Leplat et al. [5] proposed a new NMF model, which is based on the Kullback–Leible and Itakura–Saito -divergences and introduces a penalty term to promote small-volume dictionary matrix columns. Under corresponding assumptions and noiseless conditions, it is proven that this model can reliably achieve audio signal separation. Sedighin et al. [6] found that signals recorded by different sensors exhibit certain similarities, especially in their temporal changes. Based on this similarity, assuming that the activation coefficient matrices of their NMF have a similar form and utilizing this similarity for co-factorization, effective signal separation is achieved. NMF assumes that source signals are non-negative, while independent component analysis (ICA) [7] achieves signal separation by finding independent signal components and utilizing the non-Gaussian features in statistical principles. Boergens et al. [8] investigated the potential of ICA methods in separating geophysical signals in GRACE data. Boppidi et al. [9] introduced an implementation using fast independent component analysis (FastICA) for blind image source separation using memristor crossbar arrays.
Signal separation methods based on transformation domain features have also received attention [10]. In the field of wavefield separation, Duan et al. [11] introduced the discrete cosine transform (DCT) into seismic wavefield separation, combined with discrete Fourier transform (DFT) and DCT operations, and designed a high-efficiency and precision frequency–space (f-x) domain vertical seismic profiling (VSP) [12] wavefield separation method. This includes methods such as F-K transform [13,14] and Radon transform [15,16], among others. Transformation domain-based methods utilize differences in physical features in the transformation domain to achieve separation. While such methods are effective for separating simple signals, energy overlaps in the transformation domain in complex geological models, resulting in an impure separation of wavefield signals.
Traditional signal separation methods rely on mathematical prior assumptions, often requiring strict conditions that limit their applicability. Moreover, these methods heavily depend on accurate mathematical models and parameter estimation, leading to poor separation performance when the assumptions are not met. In contrast, transform domain-based signal separation methods require the target signals to exhibit distinct characteristics in the transform domain. However, in complex environments and challenging signal conditions, energy aliasing between the separated signals in the transform domain can result in impure separation outputs. This introduces challenges in feature selection and affects the overall effectiveness of signal separation. Moreover, when there is overlap among the feature domains of target signals, traditional methods often yield poor results. To address this issue, machine learning approaches have been proposed. For instance, Wei et al. [17] introduced a strategy for constructing seismic datasets and trained fully convolutional networks (FCNs) to separate P-waves and S-waves, investigating the generalization performance of deep learning methods. Huang et al. [18] used deep learning methods to train neural networks using data samples to separate P/S wavefields from ground seismic multi-component data. While intelligent P-wave and S-wave separation methods eliminate the need for precise parameter dependency, simplifying the wavefield separation process, they typically rely on data-driven approaches, leading to poor interpretability and dependence on a large amount of high-quality data labels. Wisdom et al. [19] introduced the MixIT method, a fully unsupervised audio separation technique. MixIT constructs training samples by blending existing audio mixtures and utilizes deep neural networks to separate them into latent sources, approximating the original mixture. MixIT demonstrates competitive performance in speech separation tasks and enables unsupervised adaptation and learning from large real-world datasets, providing an economically efficient solution for the audio separation domain. Neri et al.’s utilization of unsupervised variational autoencoders yielded remarkable performance in separation experiments involving mixed MNIST handwritten digits and audio spectrograms [20].
Although machine learning has achieved significant success, data-driven supervised methods lack interpretability and overly rely on data samples, while unsupervised approaches require accurate and appropriate prior information tailored to specific problems. A potential solution is to combine neural networks with domain expertise, leading to the concept of knowledge-guided neural networks [21,22,23,24]. Muralidhar et al. [25] integrated domain expertise into the loss function of neural networks, demonstrating its effectiveness in scenarios with scarce training data. Maziar Raissi et al. [26] proposed a physics-informed neural network framework for solving forward and inverse problems of various partial differential equations, offering a more general method for knowledge-guided neural networks. Von Rueden et al. [27] summarized strategies for integrating prior knowledge into machine learning, providing various ideas for knowledge-guided neural networks. Wu et al. [28] introduced domain knowledge into deep neural networks and successfully applied it to geophysics, offering feasible solutions to various problems in seismology. Knowledge-guided neural networks enhance network interpretability and reduce the need for large data samples. Lu et al. [29] constructed a knowledge-guided autoencoder network to improve P-wave and S-wave separation in seismic exploration, achieving enhanced separation performance. In previous studies [30,31,32], the velocity model inversion of geological structures could be achieved through a knowledge-guided recurrent neural network (RNN), resulting in a relatively accurate velocity model.
Although knowledge-guided neural networks can alleviate data dependency, effective training still requires a sufficient amount of knowledge-filtered data to ensure reliable model performance. However, their typical application scenarios often involve partial differential equations related to the target signal. Real-world applications, however, cover a broad range of scenarios, and knowledge representation is not limited to the form of partial differential equations. Therefore, selecting an appropriate knowledge representation method based on the specific application scenario is crucial for effectively implementing signal separation using knowledge-guided networks. However, this selection process is inherently challenging, as different scenarios may require distinct forms of knowledge representation, ranging from analytical models such as partial differential equations to data-driven statistical representations. The complexity arises from the need to balance accuracy, interpretability, and computational efficiency, making it essential to carefully evaluate the suitability of a given representation for the task at hand.
Based on the ideas of previous work, this paper proposes a more general signal separation method based on knowledge representation. The knowledge representation framework proposed in this paper can represent knowledge according to the application scenario, including observed knowledge representation, physical knowledge representation, and data-driven knowledge representation, making the knowledge-guided neural network signal separation method more general. Within the framework of knowledge representation, signal separation is achieved by representing the separation targets with knowledge and implementing signal separation guided by knowledge-based branch autoencoder networks. First, corresponding knowledge representation is obtained under the proposed knowledge representation framework based on the observed mixed signals. Second, the number of branches of the autoencoder is determined based on the number of separation target signals. Then, a branch autoencoder network is constructed using the results of knowledge representation, with branches achieving the separation of target sub-signals under the guidance of knowledge. Finally, a self-encoding network architecture is constructed with comprehensive constraints of observation signal reconstruction error and knowledge-guided error. This method can effectively address different application scenarios, providing new solutions for signal separation. The innovations of this paper are mainly as follows:
(1) A more comprehensive knowledge representation framework, which includes observed knowledge representation, physical knowledge representation, and data-driven knowledge representation, provides new insights for knowledge-guided neural networks.
(2) A more general signal separation method that can be applied to different types of signals, including seismic signals, image signals, etc.
(3) The proposed method achieves signal separation via a knowledge-guided branch autoencoder.
2. Theory
2.1. Problem Setup
The signal separation problem can be described as a mixed signal matrix consisting of N target source signals and noise .
When provided with the observed mixed signal matrix , the objective of signal separation is to estimate its source signals , aiming to closely resemble the true underlying signals. In blind source separation (BSS) problems [33,34], the number of target source signals is usually unknown. Therefore, the key to solving the signal separation problem lies in accurately extracting prior knowledge from the mixed signal and utilizing these knowledge representations to effectively recover the target source signals, as well as reconstructing the mixed signal . Assuming the knowledge of the number of source signals N, this problem can be formulated as a mathematical optimization problem:
This optimization problem seeks to minimize the discrepancy between the observed mixed signal matrix and its reconstructed signal , where represents the function operation used for the reconstruction error of the observed mixed signal, and in the context of signal separation, the most critical requirement is that the separated signals must accurately reconstruct the observed signal, ensuring that the reconstructed signal is exactly equal to the observed signal. The norm is adopted in our formulation because it inherently enforces equality constraints, making it well suited for this purpose. By minimizing the norm, the formulation guarantees that the sum of the separated signals strictly equals the observed signal, thereby preserving its fidelity and preventing information loss. represents a nonlinear function for knowledge extraction and representation of the observed mixed signal; represents the knowledge corresponding to the i-th separated target; represents a neural network function capable of predicting the separated i-th source signal; denotes the i-th separated source signal predicted by the neural network function; and represents the trainable parameters of the i-th branch of the neural network. Finally, represents the function that combines the results of applying knowledge from different target signals. It can be either a linear or a nonlinear function.
2.2. Knowledge Representation
Three scenarios for knowledge representation are as follows:
(1) Observed knowledge representation: People can utilize experiential knowledge to represent the target signal based on the observed mixed signals.
(2) Physical knowledge representation: The target signal has specific underlying physical mechanisms, satisfying certain physical partial differential equations and enabling corresponding knowledge representation.
(3) Data-driven knowledge representation: Abundant data samples related to the target signals are available, allowing for knowledge representation through a data-driven approach.
In these three scenarios, the framework of knowledge representation effectively captures the distinctive features of the target signal. The illustration in Figure 1 showcases how knowledge representation varies across different scenarios using the framework.
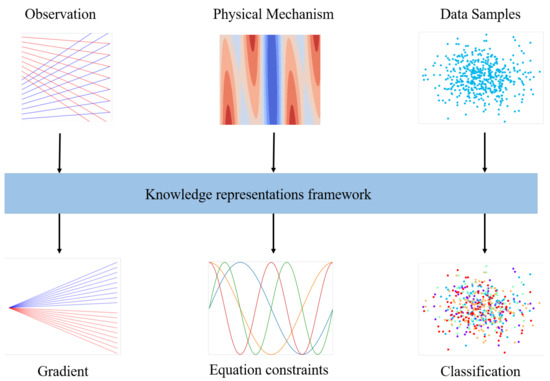
Figure 1.
The three scenarios via knowledge representation framework. Utilizing human cognition to represent knowledge inherent in the data, such as distinguishing between intertwined upward and downward lines based on gradient disparities, offers a method for knowledge representation. For complex data beyond direct human characterization, but adhering to certain physical principles, knowledge representation takes the form of specific mathematical constraints, such as partial differential equations. Lastly, in scenarios with numerous associated data samples relevant to the target, knowledge representation involves classifying and partitioning data samples based on their distinct features.
2.2.1. Observed Knowledge Representation
Vertical seismic profiling (VSP) is a technique used in seismic exploration to record seismic signals at different depths within a borehole. VSP signals comprise the transmission wavefield, which can be utilized for calculating velocity models, and the reflection wavefield, which is often migrated to obtain subsurface images for geological interpretation [35,36]. Effectively separating upgoing and downgoing waves is fundamental and critical, as it directly impacts the quality of the final images. VSP signals comprise both the upgoing and downgoing wavefields. The objective of wavefield separation is to accurately extract these wavefields from complete seismic signals.
Taking the separation of upgoing and downgoing waves as an example, the distinct gradient disparities observed in the image enable human observers to identify the differences between upgoing and downgoing waves. The result of knowledge representation is thus the gradient information of different target source signals. Lu et al. [37] provided a method and approach for effectively extracting gradient features in the problem of separating upgoing and downgoing waves, along with a detailed explanation of the upgoing and downgoing wave separation problem. Seismic record signals can be divided into upgoing and downgoing waves based on the number of wave reflections, which can be represented as
Here, represents the upgoing wave signal, and represents the downgoing wave signal.
As shown in Figure 2, experts can observe the characteristic differences in the mixed signal image of upgoing and downgoing waves to extract and record the angles and between the upgoing and downgoing waves and the image axis, achieving knowledge representation of the target signal based on human experiential knowledge. Therefore, we can easily obtain the knowledge representation results of upgoing and downgoing waves as follows:
Here, q is an empirical parameter representing the number of angles formed by the selected upgoing wave segments with the axis, while p is an empirical parameter representing the number of angles formed by the selected downgoing wave segments with the axis.
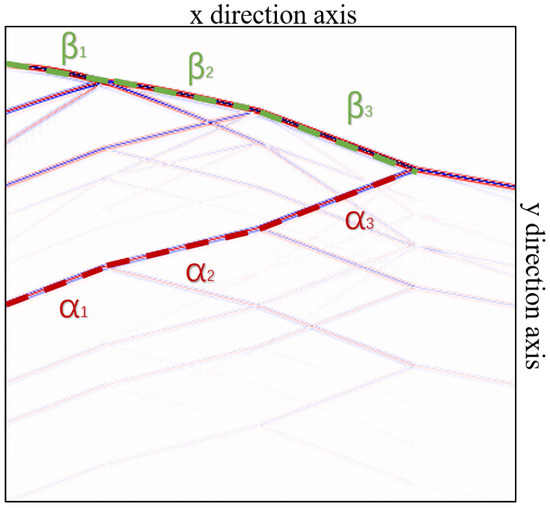
Figure 2.
Knowledge representation based on human cognition is employed to characterize observed signals. The figure illustrates the mixed wavefield recordings observed in VSP, which consist of both upgoing and downgoing wavefield signals. Through human observation, the angles of the upgoing and downgoing waves are extracted as knowledge derived from the observed signals.
2.2.2. Physical Knowledge Representation
Taking the separation of P-waves and S-waves in the field of geoscience as an example, according to the direction of wave propagation, seismic waves can be classified into P-waves and S-waves. The observed signal can thus be represented as the sum of P-waves and S-waves, expressed as follows:
In the task of separating P-waves and S-waves, it is not feasible to directly represent the separation targets based on human cognition from images. In isotropic media, the P-wave manifests as a curl-free wavefield and the S-wave manifests as a divergence-free wavefield. According to the Helmholtz theory [38], Zhang et al. [39] formulated first-order velocity–stress equations for the equivalent separation of P- and S-waves in elastic waves:
Here, and are the particle velocities in the x direction and z direction, respectively. and are the P-wave velocity component and S-wave velocity component in the x direction, respectively. and are the P-wave velocity component and S-wave velocity component in the z direction, respectively. and are the normal stresses in the x direction and z direction, respectively. is the shear stress; and are Lamé coefficients; is the density; and are the P- and S-wave velocity models, respectively. and represent the nondivergent pure P-wave and noncurl pure S-wave, respectively. At a given time t, let us assume the current state of each variable in the elastic wave equation is denoted by , including particle velocity, velocity model, density model, as well as normal and shear stresses.
Once the partial differential equations governing the behaviors of P-waves and S-waves are derived, certain coefficients or terms in these equations are typically unknown. Existing inversion techniques can be applied to estimate these coefficients and terms. For instance, full waveform inversion (FWI) enables the accurate estimation of P-wave velocity, S-wave velocity, and density models within the elastic wave equation.
When accurate P- and S-wave velocity models, along with a density model, are available within the time range , which one can operate on the current seismic source and the previous state to produce the current time step’s knowledge representation of P- and S-waves, denoted as and , respectively. This process also updates the state to . The entire process of updating the wave equation can be described as follows:
The symbols and represent the linear operations that sample a specific row or column of the variable. represents the operator matrix of the partial differential equations. denotes the knowledge representation of P-waves and denotes the knowledge representation of S-waves.
2.2.3. Data-Driven Knowledge Representation
In the realm of handwritten digit recognition, abundant resources are available, notably exemplified by the MNIST dataset http://yann.lecun.com/exdb/mnist/ (accessed on 11 March 2024), which comprises a vast array of handwritten numeral instances. Mixed digit handwriting can be the result of overlaying multiple different digit handwritings. It can be represented as
where represents the observed mixed digit handwriting, and denotes the i-th source signal, which corresponds to a single handwritten digit component. The number of source signals is denoted by N.
When confronted with a scenario involving the amalgamation of disparate digits, such as the fusion of ‘3’ and ‘8’ in a single image, a pragmatic strategy involves sourcing extensive sets of handwritten samples that bear semblance to the respective shapes of ‘3’ and ‘8’. It is pivotal to note that similarity in shape features suffices, obviating the necessity for exact matches. For instance, when delineating the numeral ‘1’, a judicious selection encompasses samples from both the ‘1’ class and data samples with shapes similar to a dash, owing to their perceptible similarities in shape. Here, a cosine similarity function is defined to measure the structural similarity between two signals.
where is the Frobenius norm. Let represent the entire dataset, which consists of samples divided into L classes. Thus, can be expressed as , where each represents a subset of samples for the t-th class () and . The knowledge representation of the separated source signals, denoted as , exhibits similarity with the separated target features and possesses distinguishable characteristics from each other. Thus, the representation of knowledge can be aptly formulated as follows:
where can be considered as an empirical parameter given based on the observed signals. It represents a threshold, and if is smaller, it indicates a stronger correlation between the target source signal and the knowledge representation result. Similarly, is also an empirical parameter. The larger it is, the greater the characteristic difference between the knowledge representation results of different target signals.
2.3. Application of Knowledge Representations
In three scenarios, knowledge representation results can be obtained through the framework of knowledge representation. Now, we will discuss how to apply knowledge representation to signal separation.
2.3.1. Application of Observed Knowledge Representation
The result of knowledge representations ,
include angle information between the separated targets in the signal and the axial direction. When combined with the Sobel operator, it can be used to calculate directional difference operators for gradient computation along the axis. For example, the difference operator along is denoted as and defined as follows:
With the mathematical definitions provided above, it becomes feasible to apply the results of knowledge representation to the task of signal separation:
where ∗ denotes the convolution operation. The final result of applying knowledge is combined as follows:
where ⊙ denotes the Hadamard product. is a function that combines the predicted results of the upgoing wavefield with the observed knowledge of the upgoing wavefield. Similarly, is a function that integrates the predicted results of the downgoing wavefield with the observed knowledge of the downgoing wavefield.
2.3.2. Application of Physical Knowledge Representation
In Equation (6), based on the inversion and forward modeling of partial differential equations, a relatively accurate knowledge representation result can be obtained. This representation adheres to the physical mechanisms governing the propagation of the target signal, allowing its application using an L1 norm. The expression for the final application of knowledge is as follows:
Here, and represent the predicted P-wave and S-wave signals by the neural network, respectively.
2.3.3. Application of Data-Driven Knowledge Representation
In the case of a large number of samples, we aim for the predicted target signals by the neural network to be similar to the features and shapes represented in the knowledge representation. This implies that the cosine similarity can be applied to the output of the network predictions while still ensuring differences exist between the predicted signals. Therefore, the mathematical expression for applying knowledge representation is as follows:
Here, represents the weight of similarity between the knowledge representation and the predicted separated signals, represents the weight of feature differences among the predicted different target source signals, and represents the weight of shape constraints between the knowledge representation and the predicted separated signals.
3. Methodology
3.1. Signal Separation Based on Knowledge Representation Framework
The signal separation method based on knowledge representation consists of the following three steps. First, knowledge extraction is performed based on the received observation signal, including the scenario of which type of knowledge representation the signal belongs to, and the number of target source signals is determined based on the signal itself, thereby determining the number of network branches. Then, the signals are represented using the knowledge representation framework. Finally, knowledge is applied by forming a knowledge-guided loss function between the results predicted by the neural network and the knowledge representation, guiding the neural network to achieve signal separation. The entire process is illustrated in Figure 3.
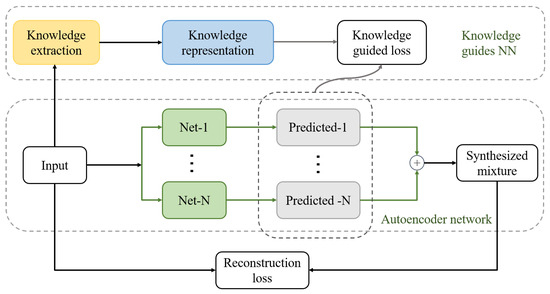
Figure 3.
The workflow of signal separation based on knowledge representation framework. Integrating the main steps of knowledge extraction, knowledge representation, and knowledge application with the autoencoder network.
3.2. Network Architecture
The architecture of the knowledge-guided autoencoder is illustrated in Figure 3. The observed data size is represented as , where C denotes the number of samples, H represents the height of the observed signals, and W represents the width. The input data undergo the knowledge representation framework, generating knowledge representations of the target source signals, . The number of network branches and knowledge representations is determined by the number of separation targets. The knowledge representations guide the branch autoencoder networks, influencing each network branch. This forms the knowledge-guided loss function and the reconstruction loss function. Both loss functions are combined for backpropagation, adjusting neural network parameters to achieve signal separation.
Since the observed signal consists of multiple source signals, the autoencoder is designed as a multi-branch U-Net network. The encoding and decoding processes in the U-Net network reconstruct the output signal based on input features while effectively leveraging knowledge representations. The U-Net network comprises several key components, summarized in Table 1, each serving a specific purpose.

Table 1.
Key components of the U-Net network.
The specific parameters of the network architecture can be adjusted based on task requirements. For upgoing and downgoing wave separation and handwritten digit separation, the U-Net network has a depth of 2, with convolutional output channels set to {1, 32, 64}. For P-wave and S-wave separation, the network depth increases to 4, with output channels configured as {1, 32, 64, 128, 256}. The overall structure of the U-Net network is shown in Figure 4.
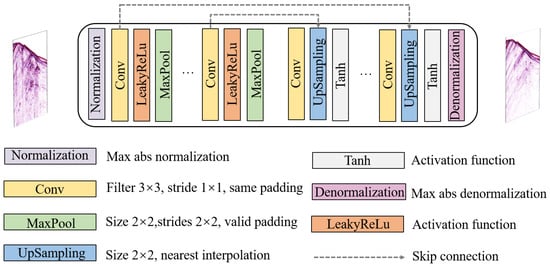
Figure 4.
Architecture of the U-Net. Multiple U-Net network modules constitute a branch autoencoder. The structure of the network comprises an encoder–decoder architecture. The encoding phase involves normalizing the input data and extracting features through convolutional pooling operations. Subsequently, the decoder phase generates the target data by utilizing convolutions, upsampling, and denormalization operations based on the encoded features.
Given the diverse value ranges of different data types, such as seismic wavefield recordings and image signals, which include both positive and negative values, a more generalized basic network unit is provided. The intermediate activation function is LeakReLu, while the hyperbolic tangent function tanh is used as the activation function in the final output. The normalization layer ensures that input observation data are distributed within the range of , thereby mitigating adverse effects caused by outlier data and aiding network convergence. The size of the network’s input and output remains same as .
3.3. Loss Function
Followed by Equation (2), the overall loss function consists of two components. One part is the reconstruction loss of the observed signal, and the other part is the knowledge-guided loss. The specific expressions are as follows:
where is the empirical parameter, is the reconstruction loss of the observed data, and is the knowledge-guided loss. The goal is to minimize the residual difference between the reconstructed signal and observation record; therefore, loss is used as the reconstruction loss function and can be concisely written as
As introduced in Section 2.3, the application of knowledge representation involves scenarios where knowledge representation can be directly observed. In such cases, the expression for the knowledge-guided loss function is as follows:
Based on physical processes, the guided loss function formed by the knowledge representation derived from partial differential equations is as follows:
Finally, the guided loss function formed by the knowledge representation derived from data-driven approaches, based on similarities in features within the data and differences in features between different target sources, is expressed as follows:
where , , and are weight factors that balance the contribution of each term in the loss function, and represents the cosine similarity loss function in Equation (10).
4. Numerical Simulation
4.1. Up- and Downgoing Wavefield Separation via Observed Knowledge Representation
A simple model was built for synthetic zero-offset VSP wavefields, as shown in Figure 5. The model consists of four layers. The Ricker wavelet with a frequency of 50 Hz was used as the source signal (marked in red triangle). The grid dimensions of Model-A were 400 × 400, with a spatial sampling interval of 5 m. The geophone array was positioned at a horizontal distance of 0.85 km (marked in dotted line). The simulation included 4000 time sampling points, with a time sampling interval of 0.5 ms. Thus, it covered the time period from 0 to 2 s.
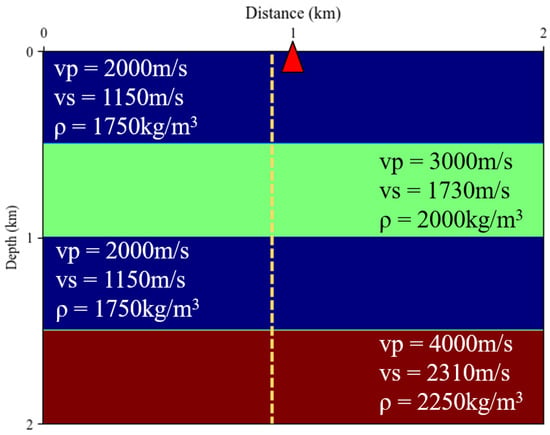
Figure 5.
Schematic diagram of the synthetic model.
Figure 6 shows the synthetic VSP signal obtained by this model and the separation results of the autoencoder without knowledge guidance. The original VSP signal contains a mixture of upgoing and downgoing waves. The autoencoder network can effectively reconstruct the observed signal, while the U-Net network branches predict the upgoing and downgoing wave signals separately. It can be found that without knowledge guidance, the upgoing and downgoing waves cannot be effectively separated and contain each other’s energy.
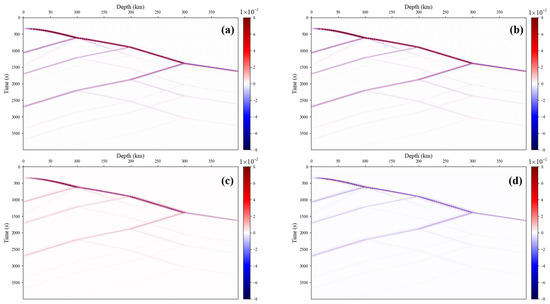
Figure 6.
Up− and downgoing wavefield separation without observed knowledge representation. (a) Mixed signal of observed up- and downgoing wavefield. (b) Mixed wavefield signal reconstructed by the autoencoder network. (c) Upgoing wavefield signal predicted by the U-Net network branch. (d) Downgoing wavefield signal predicted by the U-Net network branch.
Figure 7 shows the results of separation of upgoing and downgoing waves guided by knowledge. Experimental results demonstrate significant gradient-based feature differences between the predicted signals, achieving good separation effects. Although the separated upgoing wave signal, which is near the onset of the signal wavefield where the energy is strong, contains some energy from the downgoing wave, our focus is more on the reflected signal. With guidance from prior knowledge, this network can effectively separate the upgoing and downgoing waves.
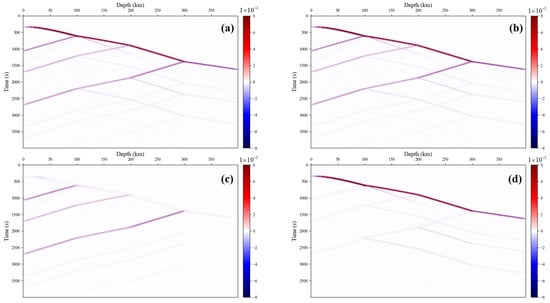
Figure 7.
Up− and downgoing wavefield separation via observed knowledge representation. (a) Mixed signal of observed up- and downgoing wavefield. (b) Mixed wavefield signal reconstructed by the autoencoder network. (c) Upgoing wavefield signal predicted by the U-Net network branch. (d) Downgoing wavefield signal predicted by the U-Net network branch.
4.2. P- and S-Wave Separation via Physical Knowledge Representation
Marmousi-II is an updated and extended geophysical model based on the original Marmousi, designed with a fully elastic structure and high-quality synthetic seismic data [40]. It is widely used for studying complex geological structures and supporting various geophysical research applications.
In this study, a subset of the Marmousi-II complex model, labeled Model-A, was used for simulation purposes. The acquisition system, P-wave velocity, S-wave velocity, and density models are shown in Figure 8. Model-A’s grid dimensions are 100 × 100, with a spatial sampling interval of 10 m. The RNN effectively implements FWI and enables efficient knowledge representation of P-waves and S-waves by incorporating elastic wave propagation and utilizing tensors to capture wavefield gradients across time steps, with this information leveraged within the backpropagation computational graph to facilitate the training of a nonlinear velocity model for nonlinear inversion. During the FWI process, the forward modeling of the elastic wave equation using an RNN network involved a 20 Hz Ricker wavelet excitation as the shot point, spaced at horizontal intervals of 10 m (totaling 10 shots, marked as the top red explosion icons in Figure 8). To obtain the knowledge representation results of P-waves and S-waves from the RNN, a single shot was placed at a horizontal distance of 0.25 km (marked as the top white explosion icon in Figure 8). The geophone array was positioned at a horizontal distance of 0.5 km (marked as vertical golden dotted lines in Figure 8). The simulation included 1280 time sampling points, with a time sampling interval of 0.5 ms, covering the time period from 0 to 0.64 s.

Figure 8.
Model-A complex model with size 100 × 100. (a) P-wave velocity model. (b) S-wave velocity model. (c) Density model.
The effective realization of P- and S-wave velocity inversion is facilitated by the design of a suitable RNN architecture, as documented in previous studies [32,41,42,43].
In the context of Model-A, the initial P- and S-wave velocity models and inversion velocity model (Inversion-A) obtained via RNN are presented in Figure 9. The initial velocity model in Figure 9a,b results from Gaussian blur applied to Model-A, resulting in the loss of fine details. Employing RNN for the velocity model estimation enables a more accurate representation of knowledge. It is apparent from the inversion velocity model (Figure 9c,d) using the RNN that numerous geological structural details were recovered, and the results closely resemble that of the actual velocity model, Model-A.
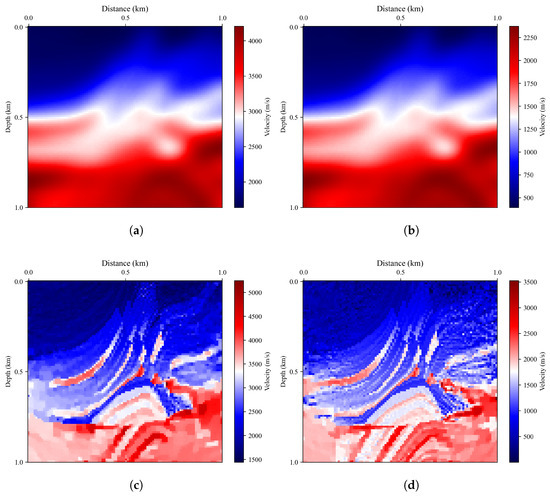
Figure 9.
RNN implements velocity inversion and obtains estimates of P- and S-wave velocity models. (a) P-wave initial velocity model. (b) S-wave initial velocity model. (c) Inversion-A: P-wave inversion velocity model. (d) Inversion-A: S-wave inversion velocity model.
The velocity model obtained through FWI exhibited diminished quality on both sides, primarily because of the absence of recorded reflected wavefield signals near the boundaries in the observation data. The central segment of the estimated model parameters closely resembles the structure of Model-A, with the primary distinctions arising from variations in numerical values and the blurring of detailed information at the model interface.
This paper evaluates the difference between the applied model and the true model (Model-A) using mean squared error (MSE) and signal-to-noise ratio (SNR). Table 2 presents the MSE and SNR metrics for the initial and inversion models in terms of the P-wave velocity model and the S-wave velocity model.

Table 2.
MSE and SNR for initial and inversion models.
As shown in the table above, the inversion model exhibits a significant reduction in MSE compared to the initial model, indicating that the inversion process effectively optimizes the velocity model, making it closer to the true geological conditions. Meanwhile, the increase in SNR suggests that the inversion model has better signal quality and improved overall reliability. Specifically, the SNR of the P-wave velocity model increases from 7.632 dB to 10.066 dB, while the S-wave velocity model improves from 7.727 dB to 9.612 dB, further demonstrating the effectiveness of the inversion process. These results confirm the validity of the physical knowledge representation.
The implementation of FWI through the RNN enables the acquisition of knowledge representations for P- and S-waves. The results of this process are shown in Figure 10.

Figure 10.
FWI realizes knowledge representation via RNN. (a) P-wave knowledge representation result and residual. (b) S-wave knowledge representation result and residual. (c) FWI data result and residual.
The inversion knowledge guidance results presented in Figure 11 highlight the effectiveness of the proposed method in reconstructing observation data. Notably, the separation of P- and S-waves improved the data reconstruction when compared to cases without knowledge guidance. In the absence of knowledge guidance, the network branches lack any constraints. As a result, the separated signals exhibit significant discrepancies from the true signals, rendering effective signal separation unachievable. Furthermore, noticeable low-frequency biases are observed among the separated target signals, indicating the network’s inability to effectively capture essential features within the target signals. This is a common challenge encountered in ill-posed problems, where a mixed signal comprises multiple combinations of two signals. This improvement was evident in the reduced effective energy residuals between the predicted P- and S-wave results and actual results. When there is no knowledge guidance, that is, when the loss function only contains the reconstruction loss in Equation (18), the separation of P- and S-waves cannot be achieved, as shown in Figure 12. In the absence of knowledge guidance, spurious strong energy axes were observed in the separated results, which were attenuated with the inclusion of knowledge guidance. Moreover, the initially discontinuous trends achieved continuity under knowledge guidance. Importantly, the separation results closely approximated the observed signal, thereby ensuring the reliability of the separation target.

Figure 11.
Knowledge-guided P- and S-wave separation results. (a) P-wave prediction result and residual. (b) S-wave prediction result and residual. (c) Reconstruction result and residual.

Figure 12.
P- and S-wave separation results without knowledge guidance. (a) P-wave prediction result without knowledge guidance and residual. (b) S-wave prediction result without knowledge guidance and residual. (c) Reconstruction result without knowledge guidance and residual.
4.3. Separation of Mixed Handwritten Digits via Data-Driven Knowledge Representation
By mixing different handwritten digit signals together, experiments were conducted to separately mix and superimpose the digits 1 and 9, digits 3 and 8, as well as digits 4 and 7. Taking the separation of the mixed handwritten digits 1 and 9 as an example, this study selected a large number of handwritten digit samples related to digit 1 and a large number related to digit 9 (excluding real examples of mixed data). During training, the two branches of the U-Net network were constrained by knowledge representation results driven by the samples. This constraint allowed one branch of the network to learn features related to digit 1, another branch to learn features related to digit 9, and simultaneously learn the feature differences between digits 1 and 9. Ultimately, this led to the separation of the mixed handwritten digit signals. The separation results are shown in Figure 13.
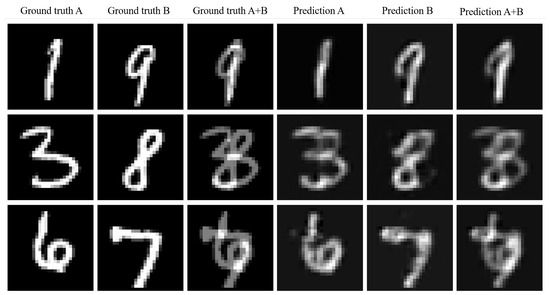
Figure 13.
MNIST handwritten digit dataset mixed handwriting separation results.
The experimental results demonstrate that the data-driven knowledge representation effectively guides neural networks in separating mixed handwritten digits. The network branches can efficiently learn the shape features of digits and the feature differences between different digits. Despite the presence of certain differences in amplitude compared to real data and some degree of blurriness, the separated results closely resemble the shapes of the real data, effectively achieving signal separation.
5. Conclusions
This study introduces a novel framework for knowledge representation specifically designed to tackle the diverse scenarios encountered in signal separation. The framework is flexible enough to handle variations in the quantity of data samples and the complexity of knowledge representations. Its versatility allows it to be applied across a wide range of domains, from seismic signal separation to the segregation of mixed handwritten digits. Through rigorous numerical simulations, this approach has been shown to be effective, demonstrating adaptability and robustness across different signal types and scenarios.
The proposed framework addresses three main types of knowledge representation: observed knowledge representation, physical knowledge representation, and data-driven knowledge representation. Each type is tailored to the specific nature of the signal and the available information, allowing for a nuanced and precise separation process. Observed knowledge representation leverages experiential knowledge derived from observed mixed signals. Physical knowledge representation utilizes the underlying physical mechanisms and satisfies certain physical partial differential equations. Data-driven knowledge representation takes advantage of abundant data samples related to the target signal, enabling a data-driven approach to knowledge representation.
To validate the effectiveness of these knowledge representations, we selected datasets that align closely with the characteristics of each scenario. For observed knowledge representation, we employed a geological model with a flat-layer structure, which generates significant up- and downgoing wavefield signals. In the physical knowledge representation scenario, the Marmousi-II complex model was utilized, as it includes diverse geological structures and produces extensive P-wave and S-wavefield signal data, making it a widely used benchmark in seismic exploration. For data-driven knowledge representation, we adopted the MNIST dataset, which is commonly used in handwritten digit recognition tasks. These datasets were chosen for their strong relevance to our research focus and our familiarity with them, which enables effective validation of the proposed framework. While other datasets could be explored, their selection requires deeper analysis of their characteristics. This aspect will be further addressed in future research work.
Moreover, the framework provides valuable insights into the underlying principles governing signal separation, highlighting the intricate interplay between data and knowledge representations. By integrating knowledge representation with neural networks, the framework improves the interpretability of the separation process and reduces the dependency on extensive data samples. This integration results in more accurate and reliable signal separation outcomes.
This framework has the ability to represent knowledge according to specific application scenarios, offering not only a more generalizable approach but also paving the way for further exploration and development in this field. Researchers can now apply this framework to various types of signals and scenarios, expanding the scope and possibilities of signal separation.
Author Contributions
Conceptualization, C.L., J.Z. and X.Z.; methodology, C.L.; software, X.Z.; validation, X.Z., J.Z. and C.L.; formal analysis, C.L.; investigation, C.L.; resources, X.Z.; data curation, X.Z.; writing—original draft preparation, X.Z.; writing—review and editing, C.L.; visualization, C.L. and X.Z.; supervision, C.L and J.Z.; project administration, C.L.; funding acquisition, C.L. All authors have read and agreed to the published version of the manuscript.
Funding
This research was supported by the National Natural Science Foundation of China under Grant 42474171, 41974147 and 42104130.
Institutional Review Board Statement
Not applicable.
Informed Consent Statement
Not applicable.
Data Availability Statement
Data are contained within the article.
Acknowledgments
We are grateful to the reviewers for their valuable comments.
Conflicts of Interest
The authors declare no conflicts of interest.
References
- Guo, X.; Cao, X.; Ma, Y. Robust separation of reflection from multiple images. In Proceedings of the IEEE Conference on Computer Vision and Pattern Recognition, Columbus, OH, USA, 23–28 June 2014; pp. 2187–2194. [Google Scholar]
- Narayanaswamy, V.; Thiagarajan, J.J.; Anirudh, R.; Spanias, A. Unsupervised audio source separation using generative priors. arXiv 2020, arXiv:2005.13769. [Google Scholar]
- Sawada, H.; Ono, N.; Kameoka, H.; Kitamura, D.; Saruwatari, H. A review of blind source separation methods: Two converging routes to ILRMA originating from ICA and NMF. APSIPA Trans. Signal Inf. Process. 2019, 8, e12. [Google Scholar] [CrossRef]
- Lee, D.D.; Seung, H.S. Learning the parts of objects by non-negative matrix factorization. Nature 1999, 401, 788–791. [Google Scholar] [CrossRef]
- Leplat, V.; Gillis, N.; Ang, A.M. Blind audio source separation with minimum-volume beta-divergence NMF. IEEE Trans. Signal Process. 2020, 68, 3400–3410. [Google Scholar] [CrossRef]
- Sedighin, F.; Babaie-Zadeh, M.; Rivet, B.; Jutten, C. Multimodal soft nonnegative matrix co-factorization for convolutive source separation. IEEE Trans. Signal Process. 2017, 65, 3179–3190. [Google Scholar] [CrossRef]
- Hyvärinen, A.; Oja, E. Independent component analysis: Algorithms and applications. Neural Netw. 2000, 13, 411–430. [Google Scholar] [CrossRef]
- Boergens, E.; Rangelova, E.; Sideris, M.G.; Kusche, J. Assessment of the capabilities of the temporal and spatiotemporal ICA method for geophysical signal separation in GRACE data. J. Geophys. Res. Solid Earth 2014, 119, 4429–4447. [Google Scholar] [CrossRef]
- Boppidi, P.K.R.; Louis, V.J.; Subramaniam, A.; Tripathy, R.K.; Banerjee, S.; Kundu, S. Implementation of fast ICA using memristor crossbar arrays for blind image source separations. IET Circuits Devices Syst. 2020, 14, 484–489. [Google Scholar] [CrossRef]
- Belouchrani, A.; Amin, M.G.; Thirion-Moreau, N.; Zhang, Y.D. Source separation and localization using time-frequency distributions: An overview. IEEE Signal Process. Mag. 2013, 30, 97–107. [Google Scholar] [CrossRef]
- Duan, J.; Zhang, G.; Liang, C.; Zhan, Y.; Li, Y. High-efficiency and precision VSP wavefield separation method via DCT. J. Geophys. Eng. 2022, 19, 192–210. [Google Scholar] [CrossRef]
- Hardage, B.A. Vertical seismic profiling. Lead. Edge 1985, 4, 59. [Google Scholar] [CrossRef]
- Devaney, A.; Oristaglio, M. A plane-wave decomposition for elastic wave fields applied to the separation of P-waves and S-waves in vector seismic data. Geophysics 1986, 51, 419–423. [Google Scholar] [CrossRef]
- Li, Z.; Ma, X.; Fu, C.; Gu, B.; Liang, G. Frequency-wavenumber implementation for P-and S-wave separation from multi-component seismic data. Explor. Geophys. 2016, 47, 32–43. [Google Scholar] [CrossRef]
- Jiang, X.; Lin, J.; Ye, F.; Zheng, F. Separation of P–P and P–SV wavefields by high resolution parabolic Radon transform. J. Appl. Geophys. 2015, 119, 192–201. [Google Scholar] [CrossRef]
- Moon, W.; Carswell, A.; Tang, R.; Dilliston, C. Radon transform wave field separation for vertical seismic profiling data. Geophysics 1986, 51, 940–947. [Google Scholar] [CrossRef]
- Wei, Y.; Li, Y.E.; Zong, J.; Yang, J.; Fu, H.; Sun, M. Deep learning-based P-and S-wave separation for multicomponent vertical seismic profiling. IEEE Trans. Geosci. Remote Sens. 2021, 60, 1–16. [Google Scholar] [CrossRef]
- Huang, H.; Wang, T.; Cheng, J. P/S-wave separation of multicomponent seismic data at the land surface based on deep learning. Geophysics 2023, 88, V233–V247. [Google Scholar] [CrossRef]
- Wisdom, S.; Tzinis, E.; Erdogan, H.; Weiss, R.; Wilson, K.; Hershey, J. Unsupervised sound separation using mixture invariant training. Adv. Neural Inf. Process. Syst. 2020, 33, 3846–3857. [Google Scholar]
- Neri, J.; Badeau, R.; Depalle, P. Unsupervised blind source separation with variational auto-encoders. In Proceedings of the 2021 29th European Signal Processing Conference (EUSIPCO), Dublin, Ireland, 23–27 August 2021; IEEE: Piscataway, NJ, USA, 2021; pp. 311–315. [Google Scholar]
- Lu, L.; Dao, M.; Kumar, P.; Ramamurty, U.; Karniadakis, G.E.; Suresh, S. Extraction of mechanical properties of materials through deep learning from instrumented indentation. Proc. Natl. Acad. Sci. USA 2020, 117, 7052–7062. [Google Scholar] [CrossRef]
- Wang, J.; Wang, Z.; Zhang, D.; Yan, J. Combining Knowledge with Deep Convolutional Neural Networks for Short Text Classification. In Proceedings of the Twenty-Sixth International Joint Conference on Artificial Intelligence (IJCAI-17), Melbourne, Australia, 19–25 August 2017; pp. 2915–2921. [Google Scholar]
- Wang, X.; He, X.; Cao, Y.; Liu, M.; Chua, T.S. Kgat: Knowledge graph attention network for recommendation. In Proceedings of the 25th ACM SIGKDD International Conference on Knowledge Discovery & Data Mining, Anchorage, AK, USA, 4–8 August 2019; pp. 950–958. [Google Scholar]
- Karniadakis, G.E.; Kevrekidis, I.G.; Lu, L.; Perdikaris, P.; Wang, S.; Yang, L. Physics-informed machine learning. Nat. Rev. Phys. 2021, 3, 422–440. [Google Scholar] [CrossRef]
- Muralidhar, N.; Islam, M.R.; Marwah, M.; Karpatne, A.; Ramakrishnan, N. Incorporating prior domain knowledge into deep neural networks. In Proceedings of the 2018 IEEE International Conference on Big Data (Big Data), Seattle, WA, USA, 10–13 December 2018; IEEE: Piscataway, NJ, USA, 2018; pp. 36–45. [Google Scholar]
- Raissi, M.; Perdikaris, P.; Karniadakis, G.E. Physics-informed neural networks: A deep learning framework for solving forward and inverse problems involving nonlinear partial differential equations. J. Comput. Phys. 2019, 378, 686–707. [Google Scholar] [CrossRef]
- Von Rueden, L.; Mayer, S.; Beckh, K.; Georgiev, B.; Giesselbach, S.; Heese, R.; Kirsch, B.; Pfrommer, J.; Pick, A.; Ramamurthy, R. Informed machine learning–a taxonomy and survey of integrating prior knowledge into learning systems. IEEE Trans. Knowl. Data Eng. 2021, 35, 614–633. [Google Scholar] [CrossRef]
- Wu, X.; Ma, J.; Si, X.; Bi, Z.; Yang, J.; Gao, H.; Xie, D.; Guo, Z.; Zhang, J. Sensing prior constraints in deep neural networks for solving exploration geophysical problems. Proc. Natl. Acad. Sci. USA 2023, 120, e2219573120. [Google Scholar] [CrossRef]
- Lu, C.; Zou, X.; Wang, Y.; Zong, J.; Su, Q. P-and S-Wave Separation in Complex Geological Structures via Knowledge-Guided Autoencoder. IEEE Trans. Geosci. Remote Sens. 2024, 62, 1–20. [Google Scholar] [CrossRef]
- Sun, H.; Zhang, J.; Xue, Y.; Zhao, X. Seismic inversion based on fusion neural network for the joint estimation of acoustic impedance and porosity. IEEE Trans. Geosci. Remote Sens. 2024, 62. [Google Scholar] [CrossRef]
- Lu, C.; Zhang, C. Seismic velocity inversion via physical embedding recurrent neural networks (RNN). Appl. Sci. 2023, 13, 13312. [Google Scholar] [CrossRef]
- Wang, W.; McMechan, G.A.; Ma, J. Elastic isotropic and anisotropic full-waveform inversions using automatic differentiation for gradient calculations in a framework of recurrent neural networks. Geophysics 2021, 86, R795–R810. [Google Scholar] [CrossRef]
- Cardoso, J.F. Blind signal separation: Statistical principles. Proc. IEEE 1998, 86, 2009–2025. [Google Scholar] [CrossRef]
- Jutten, C.; Herault, J. Blind separation of sources, part I: An adaptive algorithm based on neuromimetic architecture. Signal Process. 1991, 24, 1–10. [Google Scholar] [CrossRef]
- Fan, N.; Xie, X.B.; Zhao, L.F.; Zhou, X.; Yao, Z.X. The P-and S-Wave Decomposition in a Multicomponent Elastic Wavefield Based on the Divergence and Curl Operators and Their Applications in Elastic Reverse Time Migration. IEEE Trans. Geosci. Remote Sens. 2022, 60, 1–13. [Google Scholar] [CrossRef]
- Xiao, X.; Leaney, W.S. Local vertical seismic profiling (VSP) elastic reverse-time migration and migration resolution: Salt-flank imaging with transmitted P-to-S waves. Geophysics 2010, 75, S35–S49. [Google Scholar] [CrossRef]
- Lu, C.; Mu, Z.; Zong, J.; Wang, T. Unsupervised VSP Up-and Downgoing Wavefield Separation via Dual Convolutional Autoencoders. IEEE Trans. Geosci. Remote Sens. 2023, 62, 1–15. [Google Scholar] [CrossRef]
- Aki, K.; Richards, P.G. Quantitative Seismology; University Science Books: Herndon, VA, USA, 2002. [Google Scholar]
- Jianlei, Z.; Zhenping, T.; Chengxiang, W. P-and S-wave separated elastic wave equation numerical modeling using 2D staggered-grid. In Proceedings of the SEG International Exposition and Annual Meeting, SEG, San Antonio, TX, USA, 23–26 September 2007. SEG–2007–2104. [Google Scholar]
- Martin, G.S.; Wiley, R.; Marfurt, K.J. Marmousi2: An elastic upgrade for Marmousi. Lead. Edge 2006, 25, 156–166. [Google Scholar] [CrossRef]
- Zhang, T.; Innanen, K.A.; Sun, J.; Trad, D.O. Numerical analysis of a deep learning formulation of multi-parameter elastic full waveform inversion. In Proceedings of the SEG International Exposition and Annual Meeting, SEG, Virtual, 11–16 October 2020. D031S057R004. [Google Scholar] [CrossRef]
- Richardson, A. Seismic full-waveform inversion using deep learning tools and techniques. arXiv 2018, arXiv:1801.07232. [Google Scholar]
- Sun, J.; Niu, Z.; Innanen, K.A.; Li, J.; Trad, D.O. A theory-guided deep-learning formulation and optimization of seismic waveform inversion. Geophysics 2020, 85, R87–R99. [Google Scholar] [CrossRef]
Disclaimer/Publisher’s Note: The statements, opinions and data contained in all publications are solely those of the individual author(s) and contributor(s) and not of MDPI and/or the editor(s). MDPI and/or the editor(s) disclaim responsibility for any injury to people or property resulting from any ideas, methods, instructions or products referred to in the content. |
© 2025 by the authors. Licensee MDPI, Basel, Switzerland. This article is an open access article distributed under the terms and conditions of the Creative Commons Attribution (CC BY) license (https://creativecommons.org/licenses/by/4.0/).