Article

Size Effect on the Strength Behavior of Cohesionless Soil Under Triaxial Stress State

1
Institute of Geotechnical Engineering, Xi’an University of Technology, Xi’an 710054, China
2
Anhui Construction Engineering SanJian Group Co., Ltd., Hefei 230041, China
3
School of Civil Engineering, Xi’an University of Architecture and Technology, Xi’an 710055, China
4
Northwest Electric Power Design Institute Co., Ltd. of China Power Engineering Consulting Group, Xi’an 710075, China
*
Authors to whom correspondence should be addressed.
Appl. Sci. 2025, 15(6), 3310; https://doi.org/10.3390/app15063310
Submission received: 19 February 2025 / Revised: 14 March 2025 / Accepted: 15 March 2025 / Published: 18 March 2025
(This article belongs to the Special Issue Tunnel and Underground Engineering: Recent Advances and Challenges)

Abstract

:
Many underground projects are built in cohesionless soil regions, where soil strength is crucial for stability. Particle size greatly influences the mechanical behavior of cohesionless soil. To investigate the relationship between particle size (as a single internal variable) and the strength behavior of cohesionless soil, this study employed idealized spherical glass beads of varying sizes as an experimental material. A series of consolidated-drained triaxial compression tests, including both conventional and large-scale tests, were conducted on specimens with different particle sizes. The correlation between particle size and stress-strain behavior, as well as strength characteristics, was analyzed. Additionally, the influence of particle size variations on the macroscopic strength characteristics was investigated. Results indicated that for both small-sized (2 mm–6 mm) or large-sized (10 mm–30 mm) granular materials, the peak shear stress and internal friction angle increased with increased particle size. The strength of large-sized granular materials was significantly higher than that of small-sized ones. During the shear process of large-sized particles, the particle breakage rate initially increased and then decreased with increasing particle size. The internal friction angle rose monotonically with particle size, but showed insensitivity in the 4 mm–5 mm and 20 mm–25 mm particle size ranges. This insensitivity reflects a macroscopic effect resulting from the interplay between the number of inter-particle contacts and the micro-area of their surface, which reaches an extremum. These findings provide valuable insights into the micromechanical interactions governing the strength of behavior of cohesionless soils and highlight the importance considering particle size effects in geotechnical analysis. The derived particle-interaction framework provides theoretical underpinnings for optimizing design methodologies in underground infrastructure projects involving granular media.

1. Introduction

The rapid urbanization process has driven a substantial increase in the development of underground infrastructure within cohesionless soil deposits, including sand, gravel, and other coarse-grained formations. The mechanical response of these granular materials is governed by complex dependencies on multiple intrinsic and extrinsic factors, such as stress path, void ratio, particle size, and particle shape. This inherent complexity poses significant challenges in predicting deformation patterns and stability thresholds, often resulting in the pronounced settlement issues in overlying structures. Therefore, a comprehensive understanding of the mechanical behavior of cohesionless soils is a critical prerequisite for ensuring the safety of underground engineering in such geotechnical environments.
Significant progress has been made in the study of the strength behavior of cohesionless soil [1,2,3,4,5]. Shen et al. [6] conducted an experimental investigation into the stability of tunnel excavation faces in sandy soil strata using a self-developed simulation test device. They obtained the specific failure modes of tunnel excavation faces in sandy soil strata. Based on the Kirsch indoor model test, Miao et al. [7] elucidated the instability mechanism of shield tunnel excavation faces in sandy soil from a microscopic perspective and proposed an improved wedge analysis model for calculating the ultimate support force of the excavation face. Despite these advancements, the quantitative relationship between the variables influencing the strength factors of cohesionless soil and the strength behavior has not been fully established in these studies.
Investigating the influence of each mesoscopic parameter (internal variable) on the mechanical properties of cohesionless soil is essential for developing a quantitative strength index that comprehensively reflects the contributions of these internal variables. Wang et al. [8] demonstrated that the fine particle content of sand significantly affects the stability of the surrounding rock in sandy tunnel, and the internal friction coefficient does not increase with the increase of sand density. Zhu et al. [9] employed PFC software to conduct numerical experiments on triaxial specimens with different gradations, revealing significant differences in the internal friction angles among specimens with different particle gradations. Sun [10] and Hu [11] showed that particle shape has a substantial impact on both crushing strength and shear strength. Specifically, particles with greater irregularity are more prone to fracture. Sun et al. [12,13,14,15] further established that the gradation of granular materials affects their density, strength, and stability in various ways. Optimizing particle gradation can enhance the performance of engineering materials. Through investigation into the strength characteristics of materials under diverse arrangements, Liu et al. [16,17] concluded that exploring particle arrangement is instrumental in elucidating the interaction mechanisms among particles. This understanding can facilitate better control over material behavior and properties.
Particle size is a critical internal variable that significantly influences the mechanical behavior of cohesionless soil. Recent research has extensively explored this relationship [18,19,20,21], revealing both consistent and contrasting findings. For instance, Varadarajan [22], Wang [23], and Li [24] demonstrated, through laboratory and simulation tests, that shear strength is positively correlated with average particle size in circular gravel fillers and sand. Similarly, studies by Venkatachalam [25], Wu [26], Ma [27], and Xue [28] showed that the internal friction angle increases with the maximum particle size. However, Marachi [29], Gupta [30], Charles [31], and Marsal [32] reported contrasting results, finding that the internal friction angle decreased with increasing maximum particle size in large-scale triaxial tests of rockfill materials.
These findings highlight the complexity of the relationship between particle size and the mechanical properties of cohesionless soil. The inherent coupling between granulometric characteristics and other particulate attributes, such as particle morphology and surface texture, poses challenges in isolating the independent influence of particle size on shear strength development. To address this, recent experimental advances have demonstrated the efficacy of using spherical glass beads for numerical and laboratory triaxial testing [33,34,35,36,37]. These beads provide a uniform shape and well-defined size, allowing researchers to focus specifically on the effects of particle size without the confounding influences of other variables. In this study, the ideal spherical glass beads of different sizes were used to prepare single-particle material specimen at the same relative density. Conventional and large-scale triaxial tests were conducted to systematically investigate the influence of particle size on the macroscopic strength behavior of cohesionless soil and to elucidate the underlying mechanisms affecting shear strength. This approach aims to provide a clearer understanding of how particle size influences the mechanical behavior of cohesionless soils, which is essential for optimizing design methodology in geotechnical engineering applications involving granular media.

2. Experimental Schemes

2.1. Experimental Materials

To isolate the independent influence of particle size on the strength of cohesionless soil, this investigation employs a controlled-variable experimental methodology. Smooth spherical glass beads of different diameter (Figure 1) were selected as the idealized particles material for comprehensive triaxial testing. This systematic approach effectively eliminates confounding factors such as surface roughness, particle shape, and interparticle cementation effects, thereby enabling a focused investigation of particle size as an independent variable influencing the macroscopic strength behavior of cohesionless soil.
The diameter (D) of the specimen used in the conventional triaxial test is 61.8 mm. According to relevant standards [38], the maximum allowable particle size dmax within the specimen is D/10. This means that the maximum particle size in conventional triaxial test should not exceed 6.18 mm. Therefore, in this study, glass beads with diameters (d) of 2 mm, 3 mm, 4 mm, 5 mm, and 6 mm were selected for the conventional test. To extend the range of particle sizes investigated, large-scale triaxial tests were also conducted using larger-sized glass beads. The diameter (D) of the large-scale specimen was 300 mm. The diameters of the large glass beads were scaled and rounded according to the specimen diameter ratio (300 mm/61.8 mm). The diameter of the large glass beads were set to 10 mm, 15 mm, 20 mm, 25 mm, and 30 mm.
The actual density values of the customed glass beads, as well as the maximum dry density (ρdmax) and minimum dry density (ρdmin), were measured for each bead size. The basic physical properties and specimen preparation parameters of glass beads of various sizes are summarized in Table 1. Specimens for conventional triaxial tests and large-scale triaxial tests were prepared using small and large glass beads, respectively, to create a single-particle-size particle specimen.

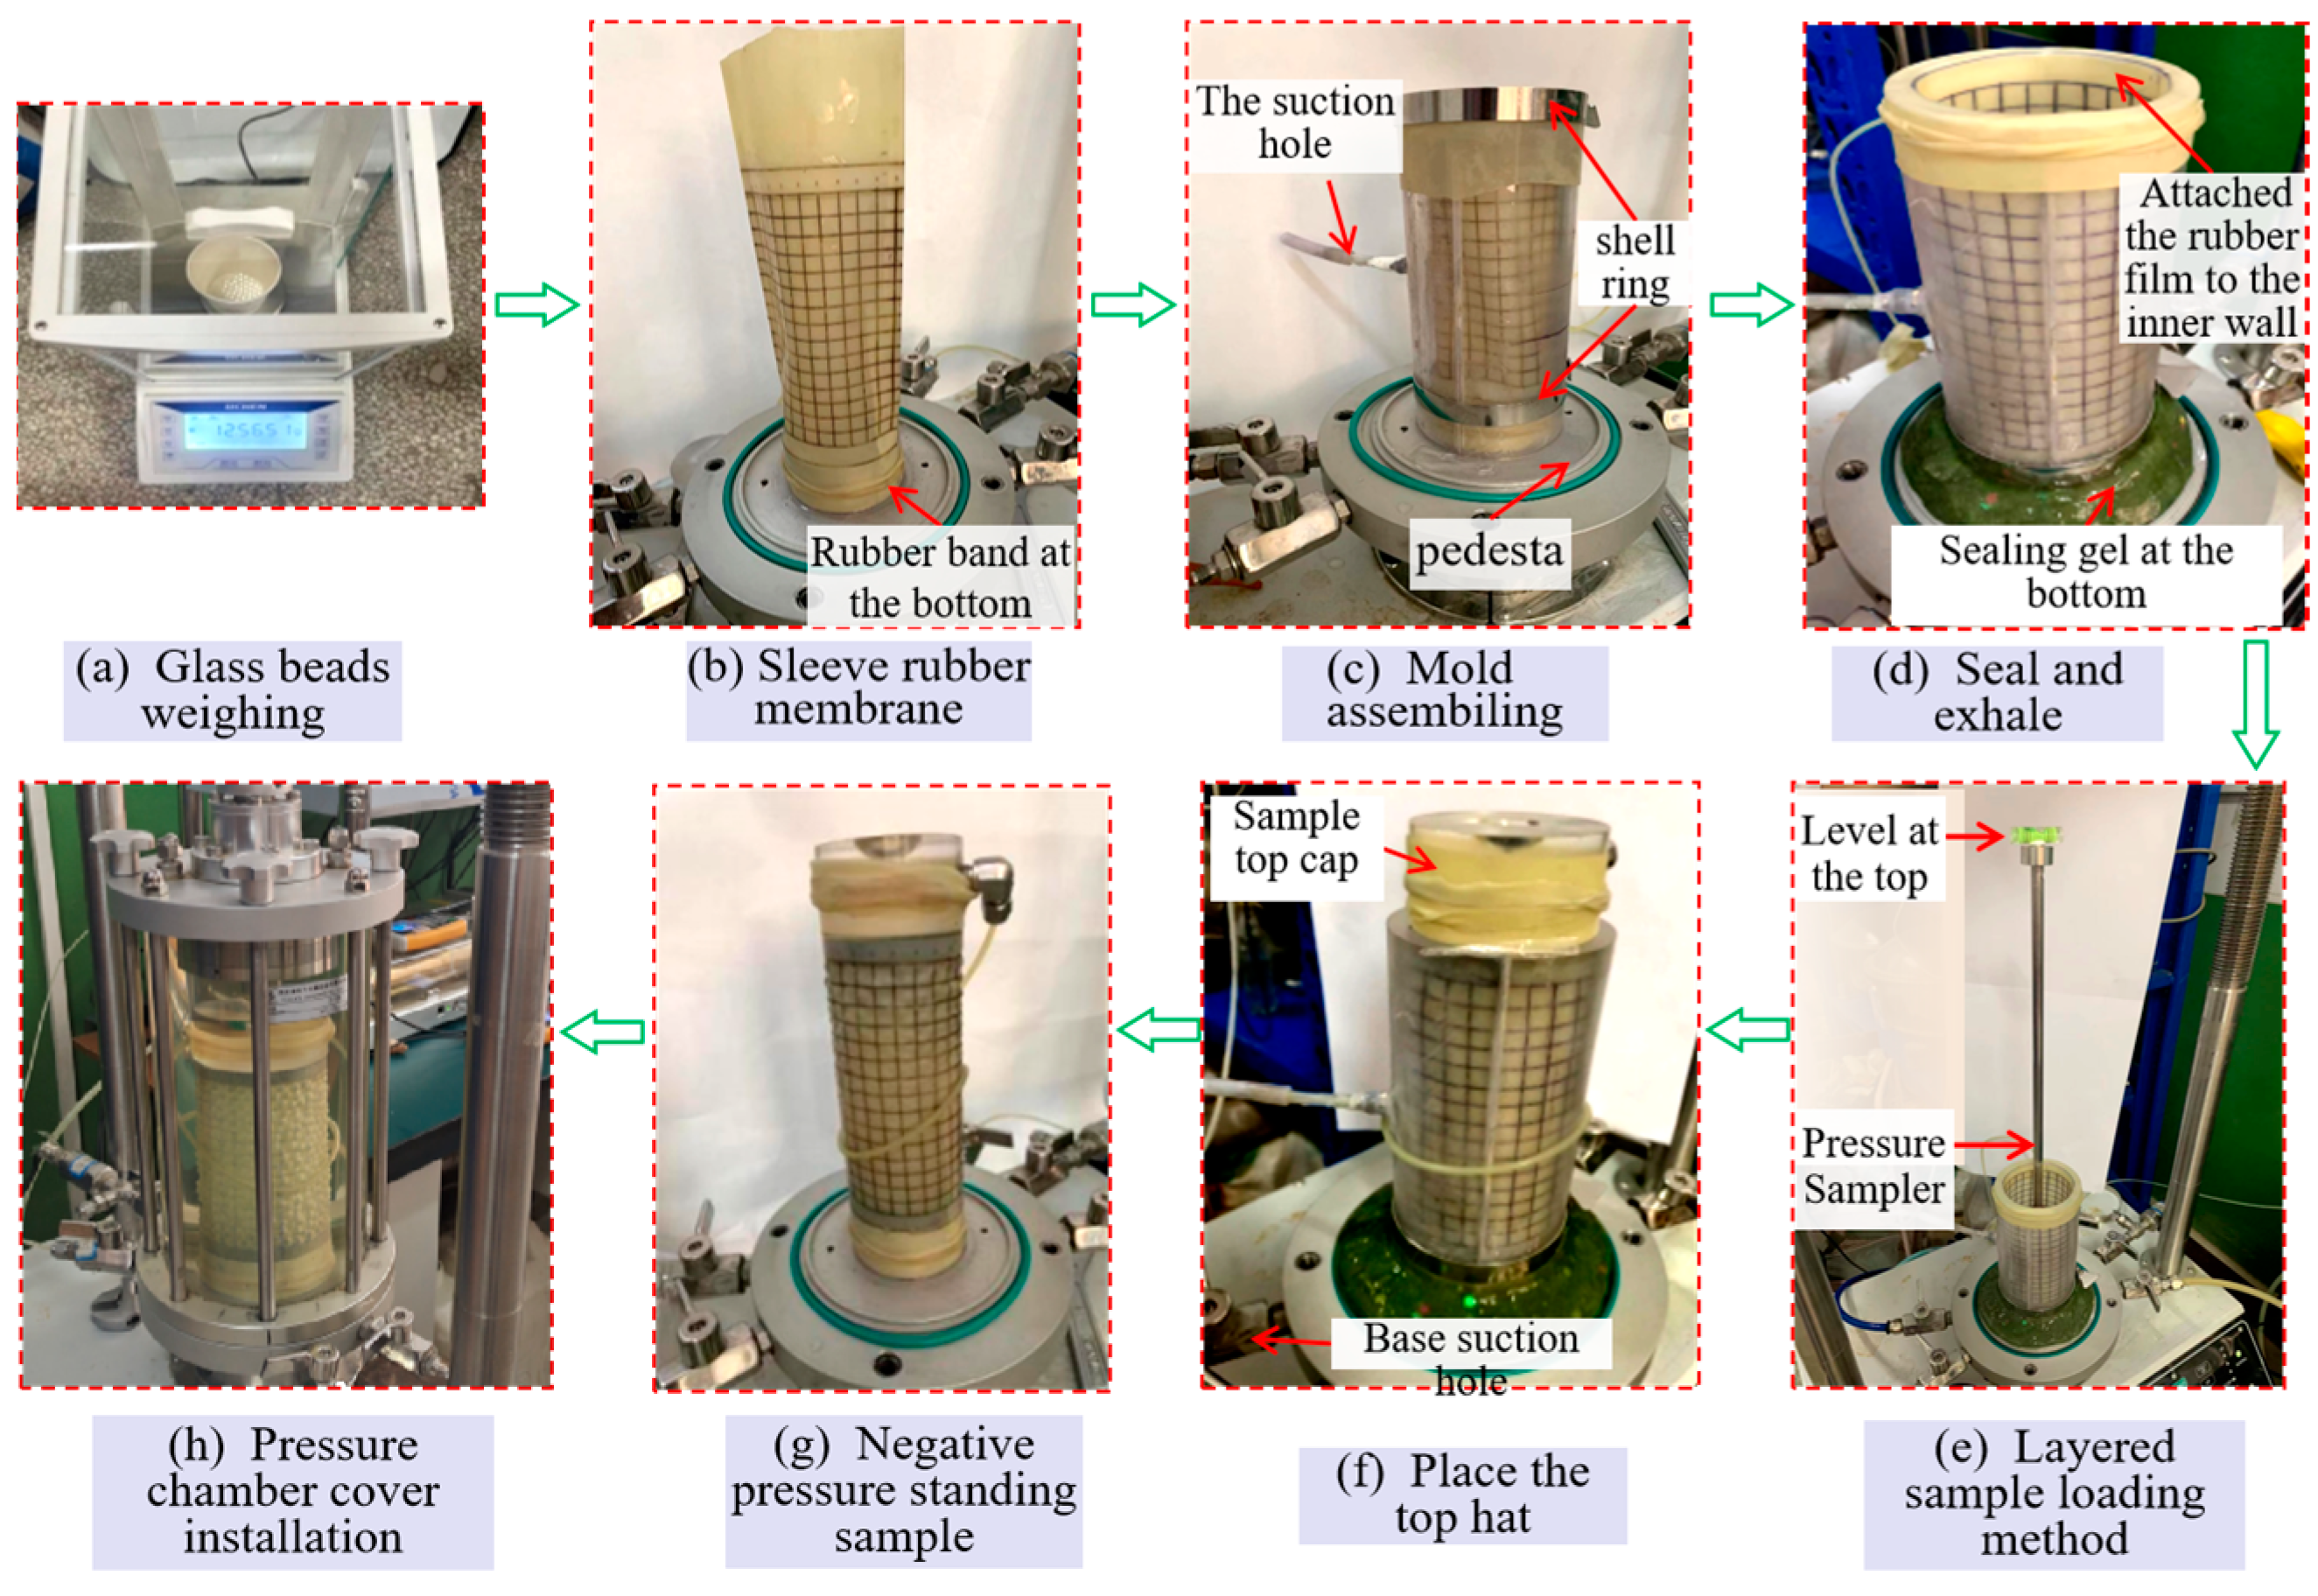
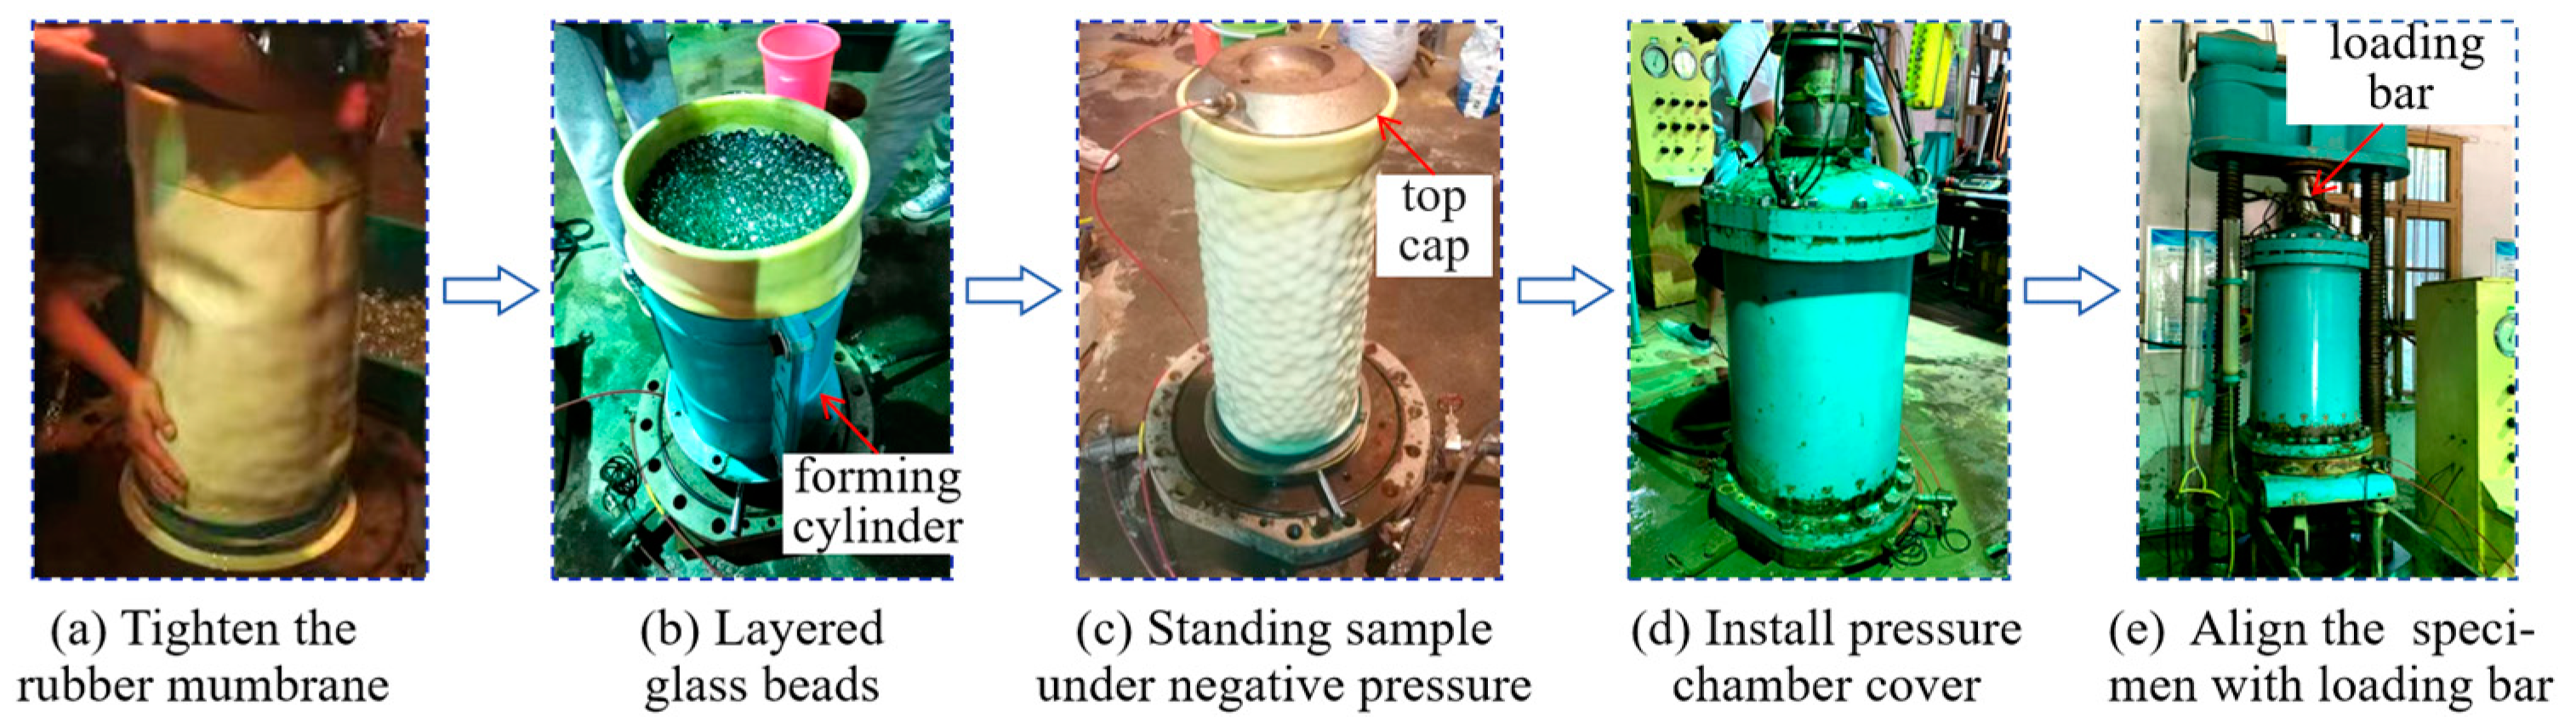
2.2. Specimen Preparation

In this study, the conventional triaxial test employed a visual in situ specimen preparation device [39] to directly prepare the glass bead specimens on the base.
The primary steps of the in situ specimen preparation method are illustrated in Figure 2. After completing the specimen assembly on the base (Figure 2g), the procedure involves installing the pressure chamber, filling the confining pressure chamber with water, and degassing remove air bubbles from the pressure chamber (Figure 2h). The test can then commence.
The specimen preparation process for the large-scale triaxial test was conducted in accordance with relevant specifications, and the main steps are illustrated in Figure 3. After the large triaxial specimen was prepared (Figure 3d), it was hoisted to the bottom plate of the triaxial apparatus (equipped with a pulley) using a gantry crane. Subsequently, the specimen was positioned beneath the top loading rod (Figure 3e), ensuring precise axial alignment with the top loading rod.
Relevant studies have demonstrated that Dr is a crucial factor influencing the mechanical behavior of granular materials [9]. The maximum and minimum dry density values of glass beads with different particle sizes, as shown in Table 1, further indicate that it is challenging to control specimen preparation based on a specific density value. Dr is also a commonly used control index in the engineering of cohesionless soil. Therefore, this study maintains consistent Dr for glass beads of different sizes.
As shown in Table 1, the maximum and minimum dry density difference for large glass beads is just 0.06 g/cm3. This is because the spherical shape of glass beads means larger ones have a higher center of gravity, making them prone to rolling and instability. Consequently, large glass beads struggle to stay in a relatively loose state and tend to pack closely. Therefore, the relative density Dr of the specimens for both large and small sized glass beads was set at 0.8.
The dry density of the specimens can be calculated according to Equation (1), and subsequently, the mass of the required test materials can be determined according to Equation (2). The mass of glass beads required for each layer can be obtained based on the number of layers during specimen preparation.
ρ d = ρ d max ρ d min ρ d max D r ( ρ d max ρ d min )
M = ρ d V = ρ d π R 2 H 4
where, ρd is the dry density of the glass beads; M is the total mass of the specimen; V is the volume of the specimen; R is the diameter of the specimen (61.8 mm/300 mm); and H is the height of the specimen.
Both conventional and large-scale triaxial tests were conducted under consistent consolidated-drained (CD) conditions.

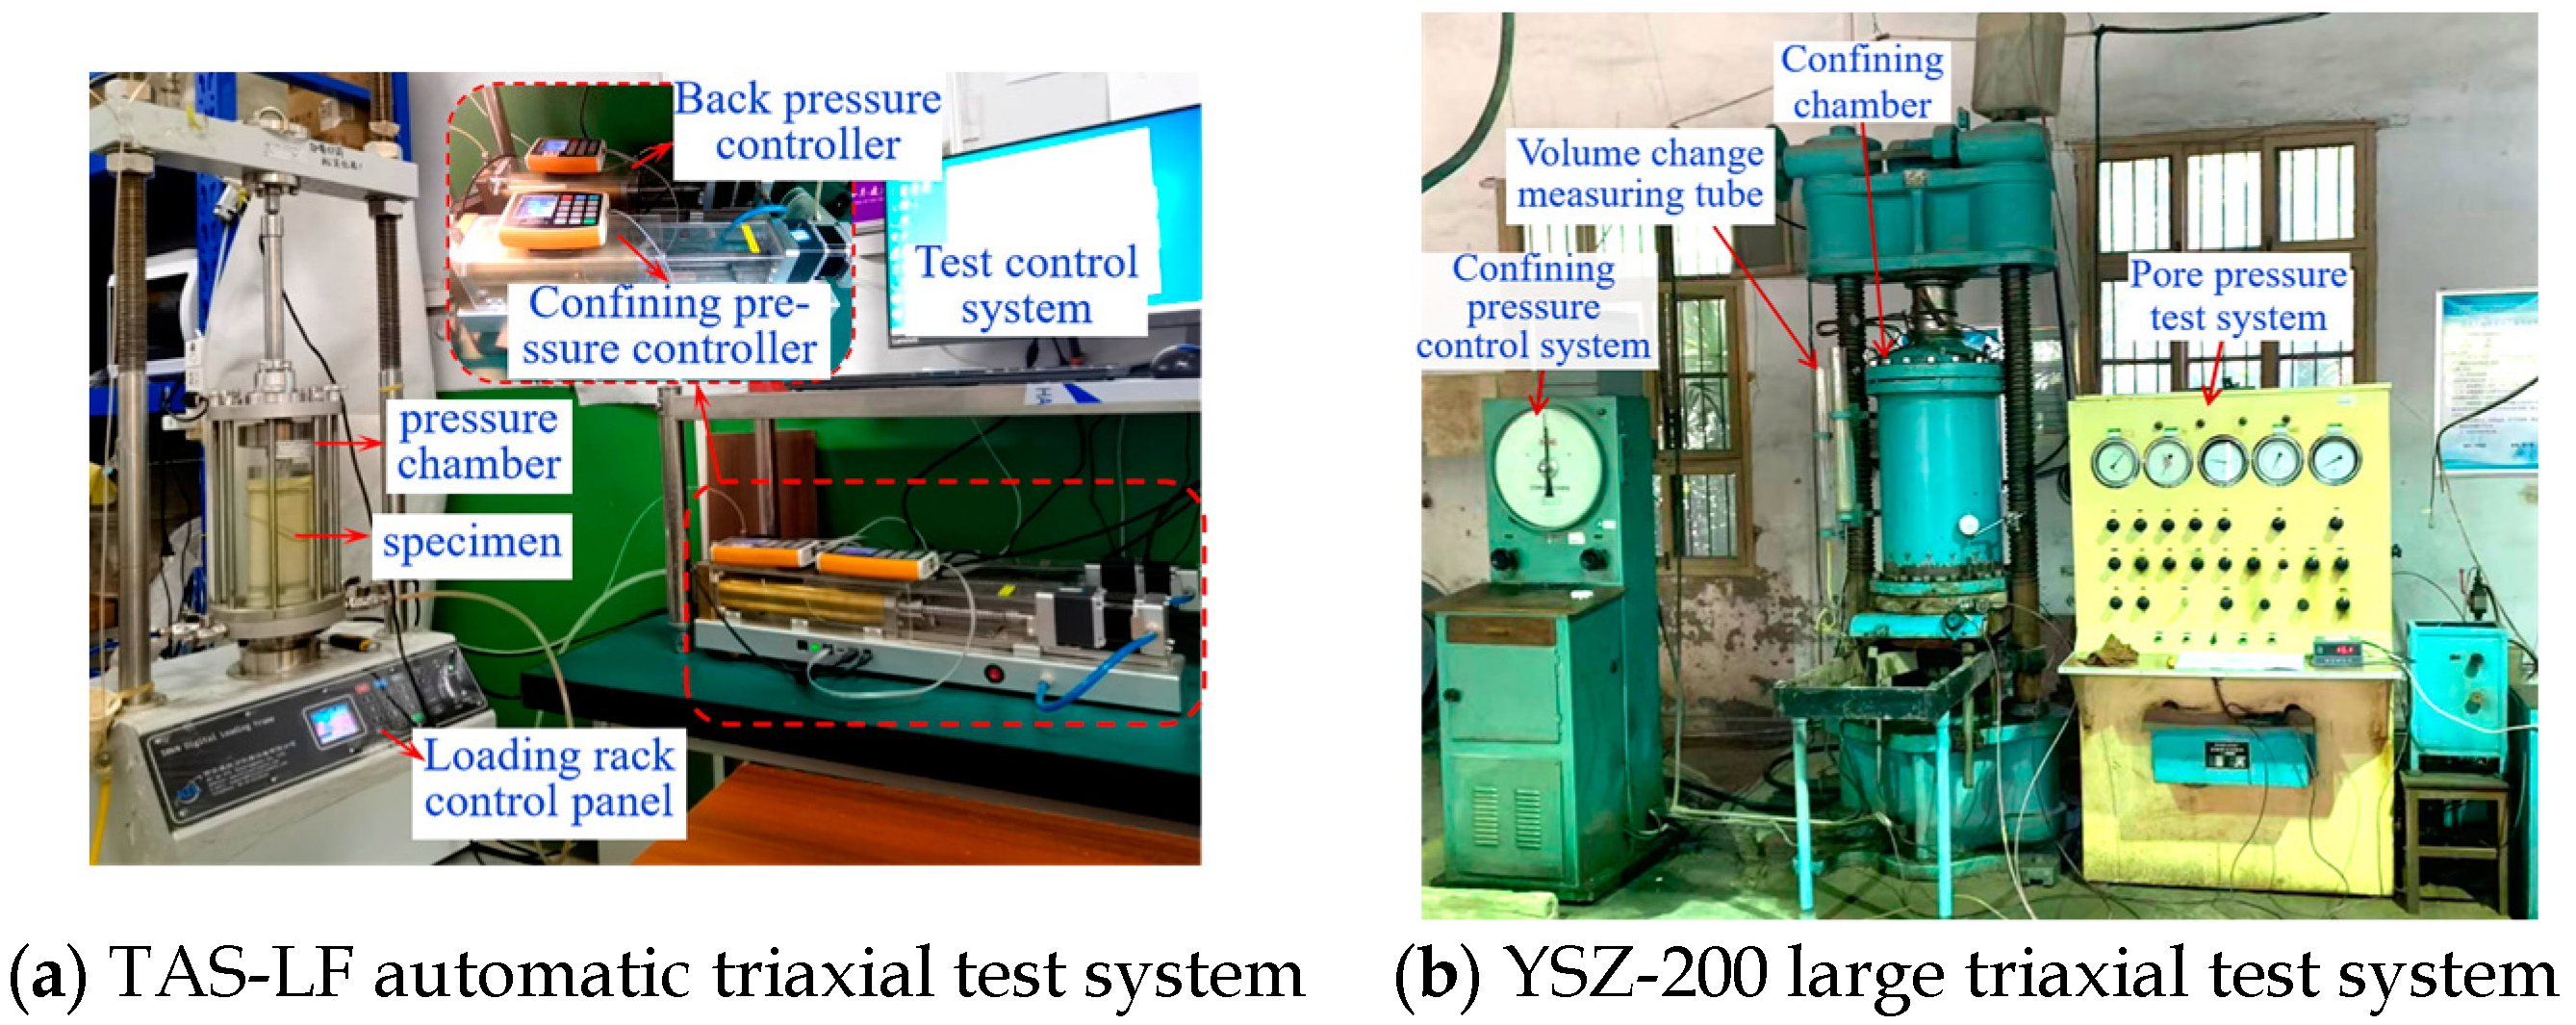
2.3. Experimental Equipment and Procedure, Experimental Process

Conventional triaxial tests on small-particle specimens were conducted using a fully automated, high-precision triaxial testing system (TAS-LF, Triaxial Automated System-Load Frame). Large-scale triaxial tests on larger-particle specimens were performed using a custom-developed YSZ-200 large-scale triaxial apparatus. The equipment used is shown in Figure 4.
In the study of coarse-grained soil, relative density (Dr) is widely used as a control index for specimen preparation [40,41,42,43].
According to the test standard [38], the shear rate of the test is set to 0.2%/min, and the test confining pressure is 100 kPa, 200 kPa, 300 kPa, and 400 kPa. Specimens were labeled using the convention “d-σ3”, where d (mm) represents the glass bead diameter and σ3 (kPa) represents the confining pressure.
After the specimen preparation was completed according to the aforementioned method, consolidated-drained (CD) triaxial shear tests were conducted following standard procedures. The confining pressure was applied to the specimen via the water in the confining chamber. Once the set confining pressure was reached, it was stabilized for 30 min before loading was initiated to induce shear deformation until specimen failure occurred. The failure criterion was defined as the maximum shear stress or the shear stress value corresponding to an axial strain of 15%.

3. Results

3.1. Test Results and Analyses of Small-Sized Granular Materials

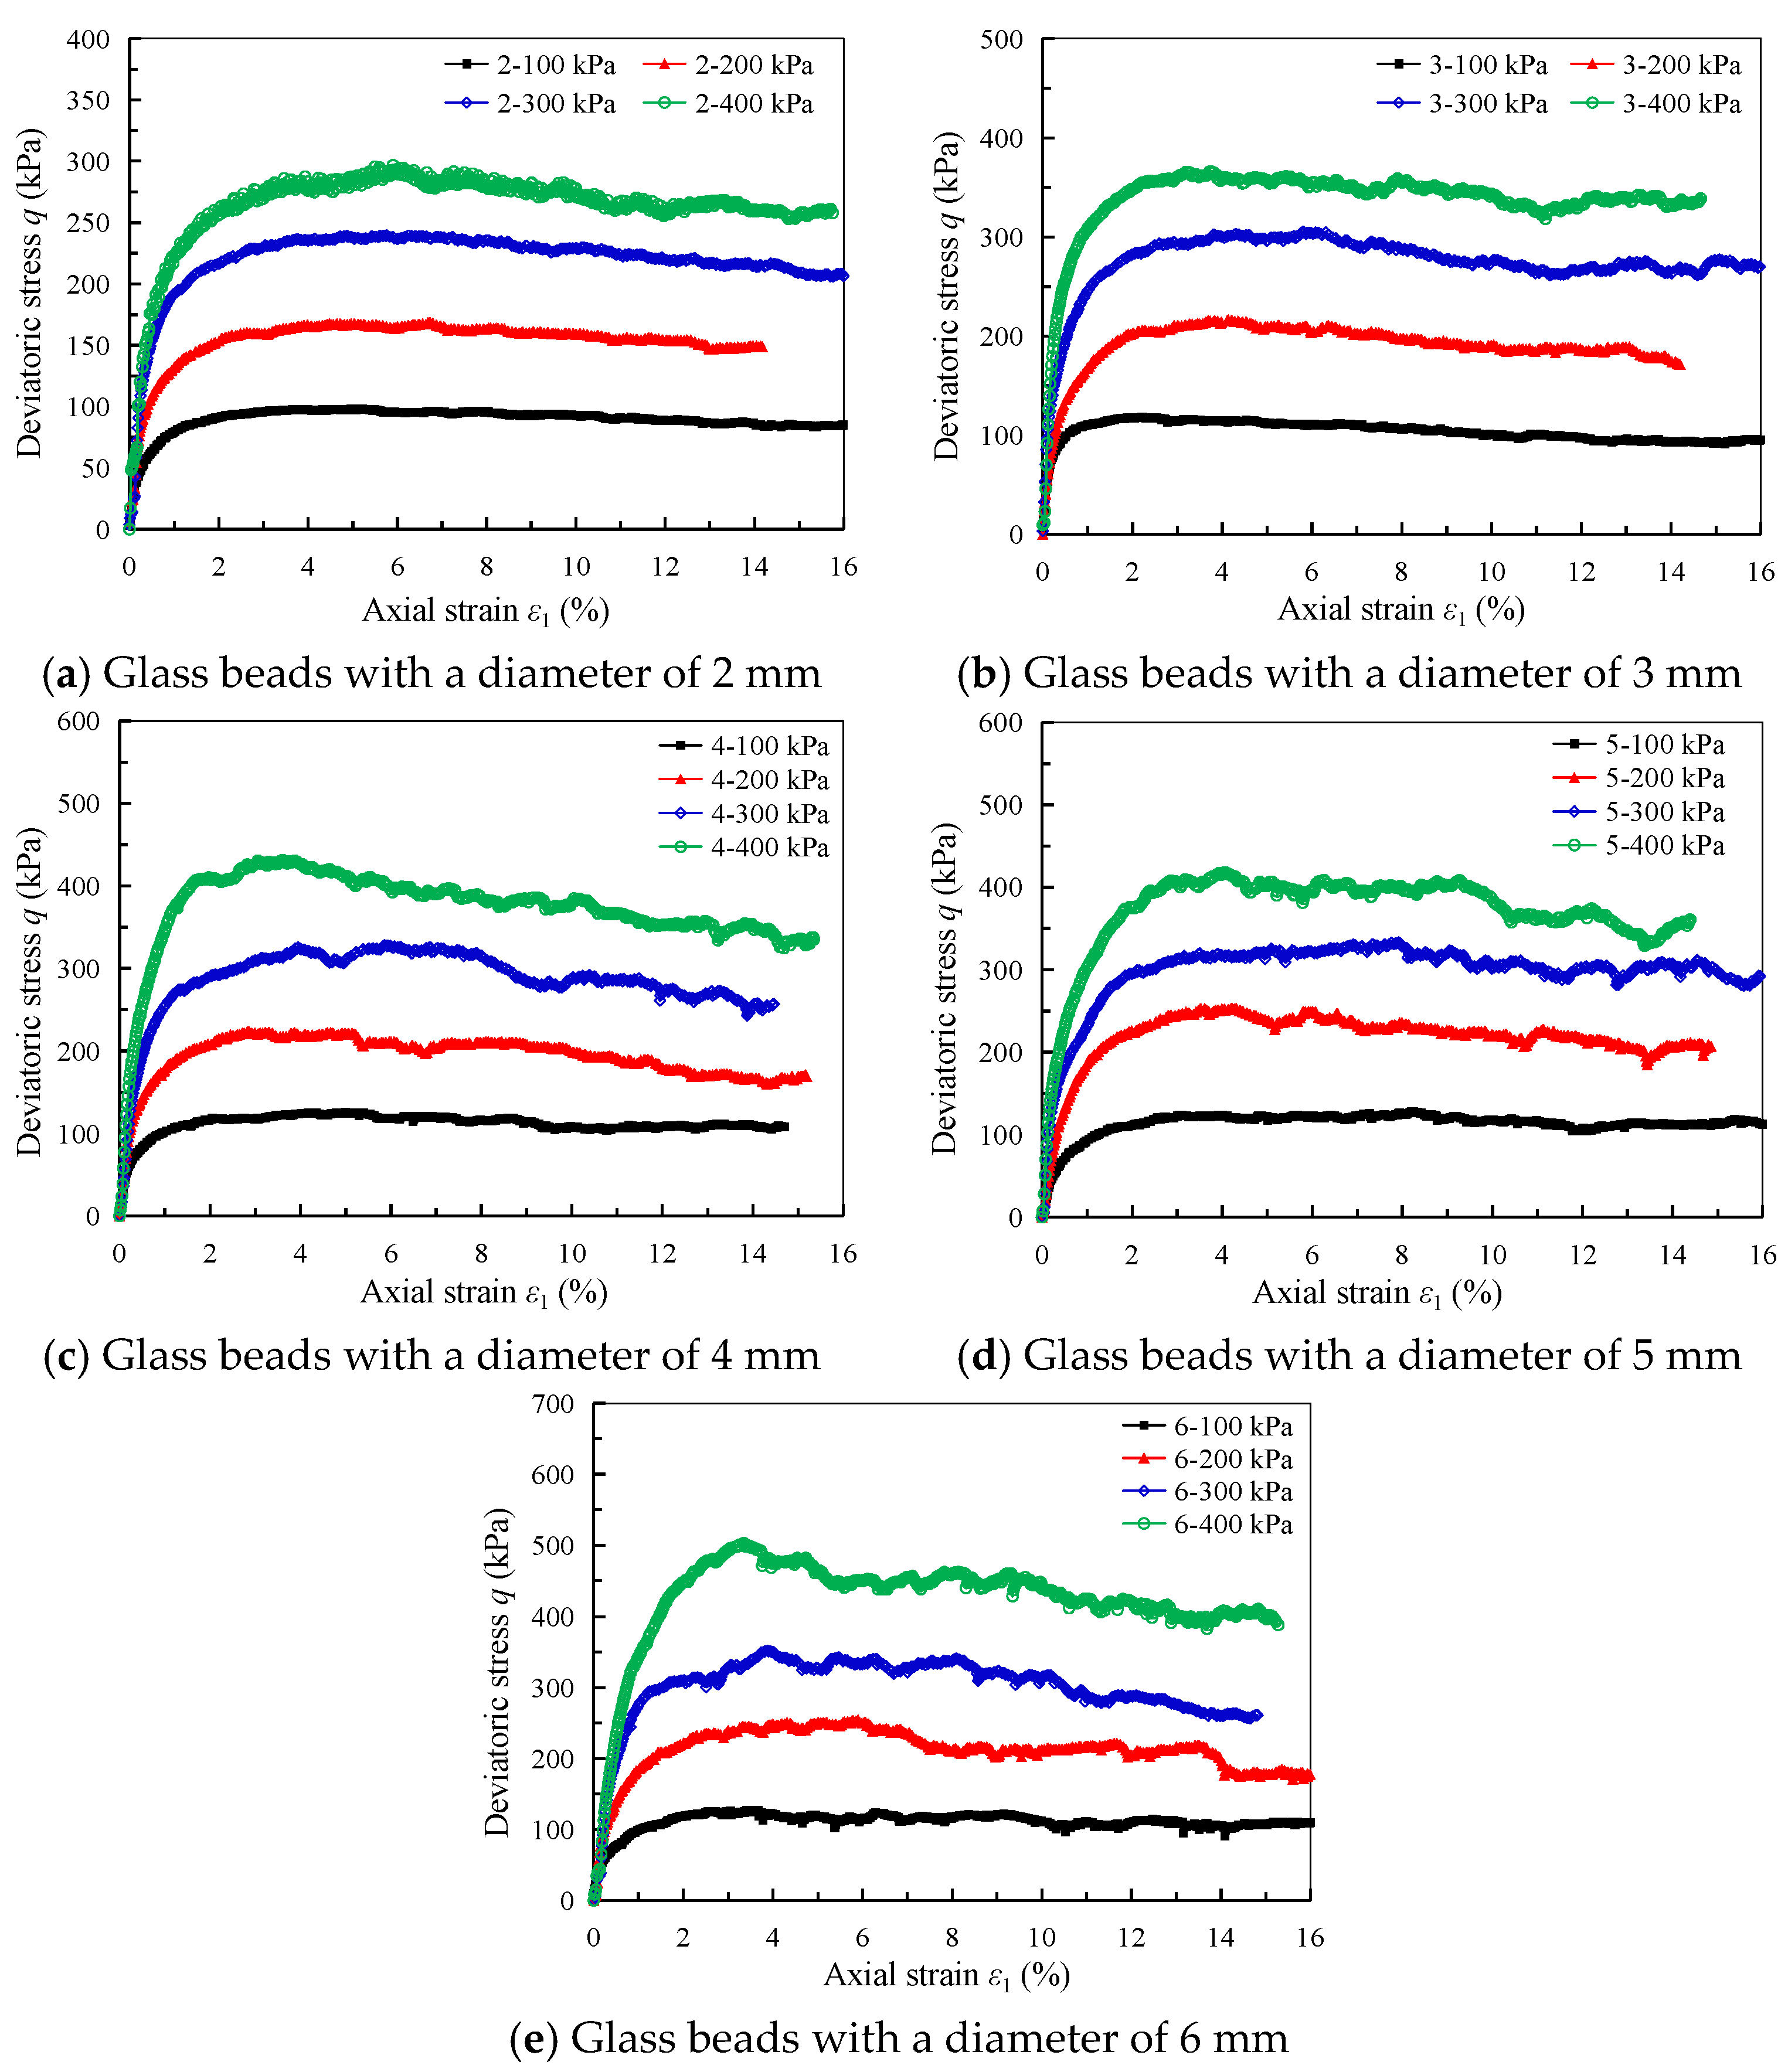
3.1.1. Stress-Strain Characterization

Figure 5 presents the stress-strain curves of small-sized glass bead (2–6 mm) specimens under four different levels of confining pressures.
As shown in Figure 5, for granular materials with particle diameters ranging from 2 to 6 mm, the deviatoric stress (q) increases obviously with the increase of confining pressure (σ3). Under low confining pressure (100 kPa), all specimens exhibit strain-hardening behavior without a pronounced peak shear stress (qf). The axial strain (ε1) corresponding to qf ranges from 1% to 3%, and the deviatoric stress tends to stabilize after the strain exceeds 3%. At higher confining pressures (200, 300, and 400 kPa), the stress-strain behavior varies with particle size, generally exhibiting an increasing trend of strain-softening as confinement increases. This trend is more pronounced for larger particle sizes. The axial strain at the qf under higher confining pressures consistently remains within the range of 2% to 4%.
Figure 5 illustrates that the shear stress values of glass bead specimen of varying sizes exhibit oscillations characterized by differing amplitudes. All curves begin to show shear stress oscillations prior to reaching the peak shear stress and persist until the end of the experiment. For specimens with the same particle size, the amplitude of these oscillations increases with rising confining pressure. Correspondingly, under the same confining pressure conditions, larger particle sizes are correlated with more pronounced oscillations in the strain curves.
The observed stress-strain oscillation phenomenon can be attributed to the evolving inter-particle kinematics during shearing. As shearing progresses, the specimen’s porosity decreases until a minimum is reached. Subsequently, changes in the relative positions of particles include sliding dislocation, particle rolling, and particle rearrangement. In this process, the particles are influenced not only by inter-particle frictional and interlocking forces, but also by the energy required for reorientation. These particle rearrangements lead to the oscillation in the macroscopic shear stress q value, a phenomenon often referred to as stick-slip behavior [33,36,37,44]. Consequently, the frictional resistance experienced by particles increases, and the potential energy required for particles to slide or roll also increases. Macroscopically, this is manifested as more pronounced stick-slip phenomenon in the stress-strain curves.
Figure 6 presents the peak shear stress (qf) as a function of confining pressure (σ3) for each particle size (d), derived from the stress-strain curves shown in Figure 5a–e. A positive correlation is observed between qf and d. The slope of the qf vs. σ3 relationship varies slightly with d, with the increase in qf under high confining pressure being significantly greater than that observed under low confining pressure. This highlights the significant influence of particle size on the mechanical behavior of granular materials.

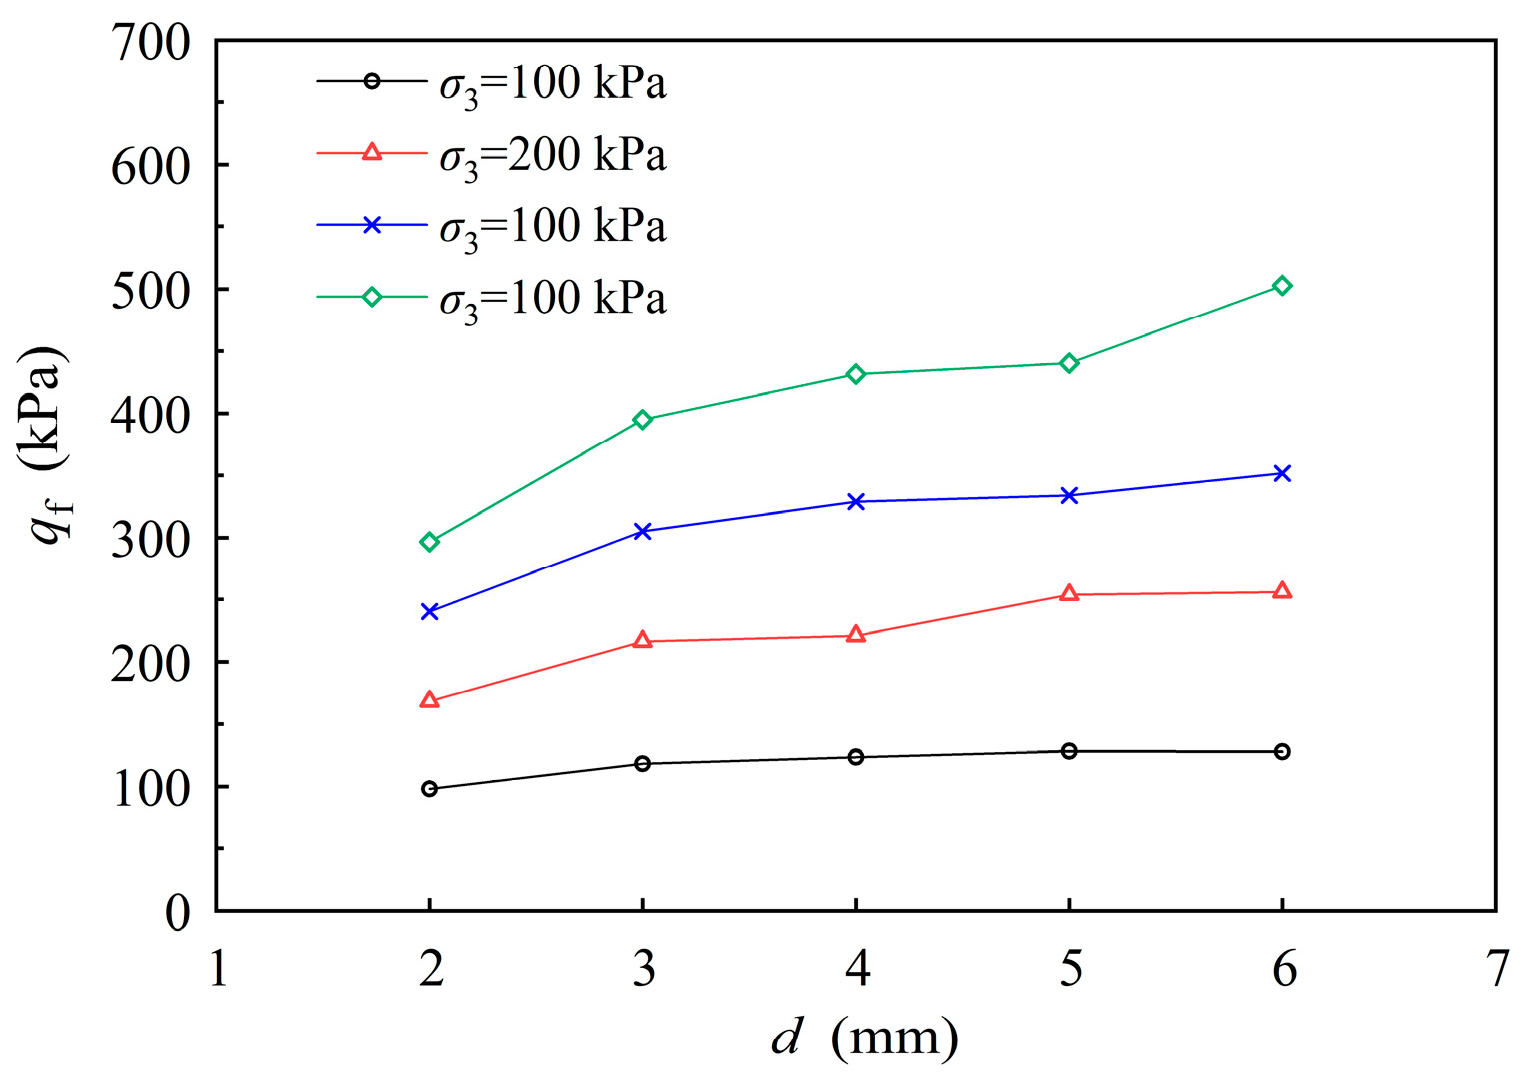
3.1.2. Effect of Particle Diameter on the Shear Strength of Small-Sized Granular Materials

According to the qf obtained under different confining pressures, as shown in Figure 6, the cohesion(c) and internal friction angle (φ) of the glass bead specimen of each size was calculated (Table 2). The relationship between the internal friction angle (φ) and particle diameter was then plotted, as shown in Figure 7.
Figure 7 reveals that the internal friction angle (φ) exhibits a non-monotonic variation with particle diameter (d) within the range of 2 mm to 6 mm. Specifically, when the particle diameter increases from 2 mm to 3 mm, the φ increases by 4.06° (approximately 25%). From 3 mm to 4 mm, φ increases by 1.42° (approximately 8%). Between 4 mm to 5 mm, the increase in φ is minimal at 0.02° (approximately 0.1%), indicating a plateau in the relationship. Finally, as d increases from 5 mm to 6 mm, φ rises by 2.59° (approximately 12%). These results suggest that while the internal friction angle generally increases with particle diameter, the relationship is not strictly monotonic. Instead, there is a notable interval of minimal change between 4 mm and 5 mm, indicating a complex interplay between particle size and shear strength parameters. This observation highlights the importance of considering the specific particle size range when evaluating the shear strength characteristics of granular materials.

3.2. Test Results and Analyses of Large-Sized Granular Materials

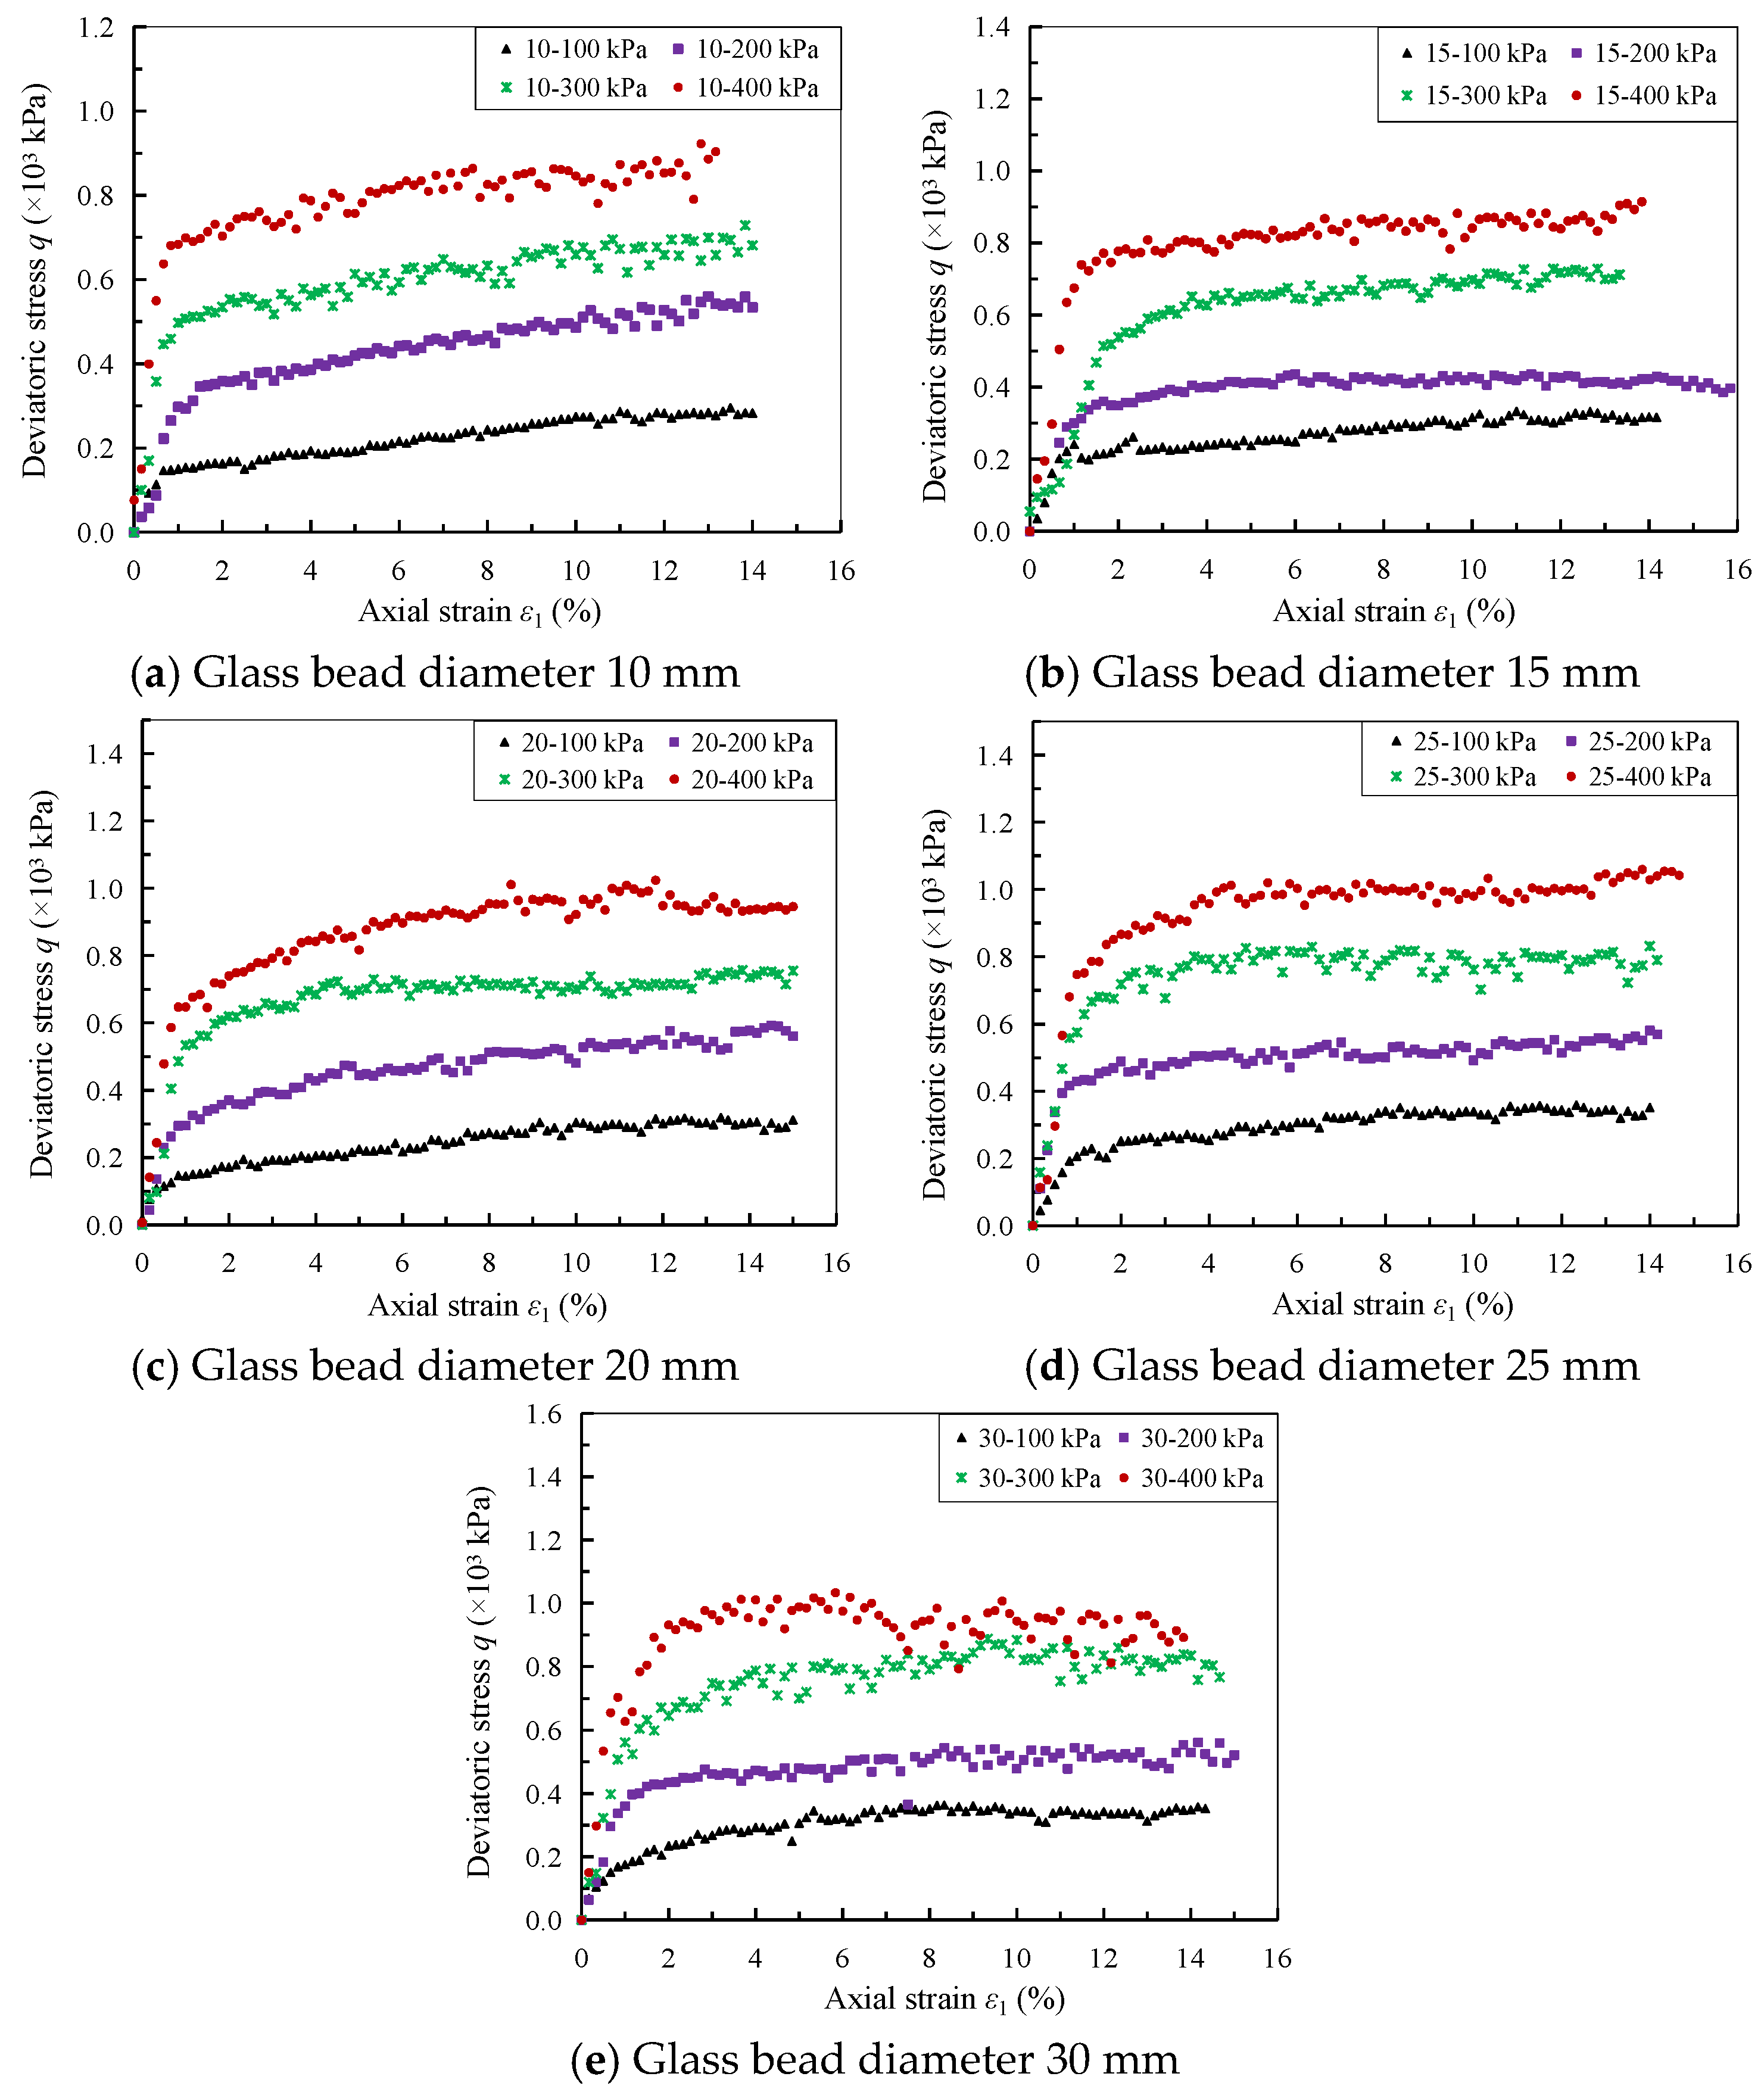
3.2.1. Stress-Strain Characterization

Figure 8 presents the stress-strain curves for specimens of large-sized granular materials (15 mm to 30 mm) obtained from large-scale triaxial tests. These tests extend the range of particle sizes studied to better understand the influence of particle diameter on the shear strength characteristics of granular materials.
From Figure 8a–e, it is evident that, with the exception of the 30 mm particle specimen under the confining pressure of 400 kPa, the strain curves for the single-particle-size specimens of other large particles exhibit hardening behavior. For large-diameter glass bead specimens with the same particle size, the shear stress (q) increases significantly with the increase in confining pressure σ3. Additionally, the oscillation phenomenon in the ε1~q curves becomes more pronounced, and the stick-slip behavior is more evident. Furthermore, under the same confining pressure, larger particle sizes correspond to a higher peak shear stress qf.
Figure 9 illustrates the variation of qf with d under four levels of confining pressure. The figure clearly demonstrates that, for large-sized granular materials, qf increases significantly with increasing confining pressure (σ3). At all levels of confining pressure, qf also increases with d, although the rate of increase (slope) exhibits slight variations across different particle size ranges. Under low confining pressure, the slope of the curve changes minimally as d increases, whereas under high confining pressure, the variation becomes more pronounced. This suggests that the influence of particle size on shear strength is more significant under higher confining pressures.

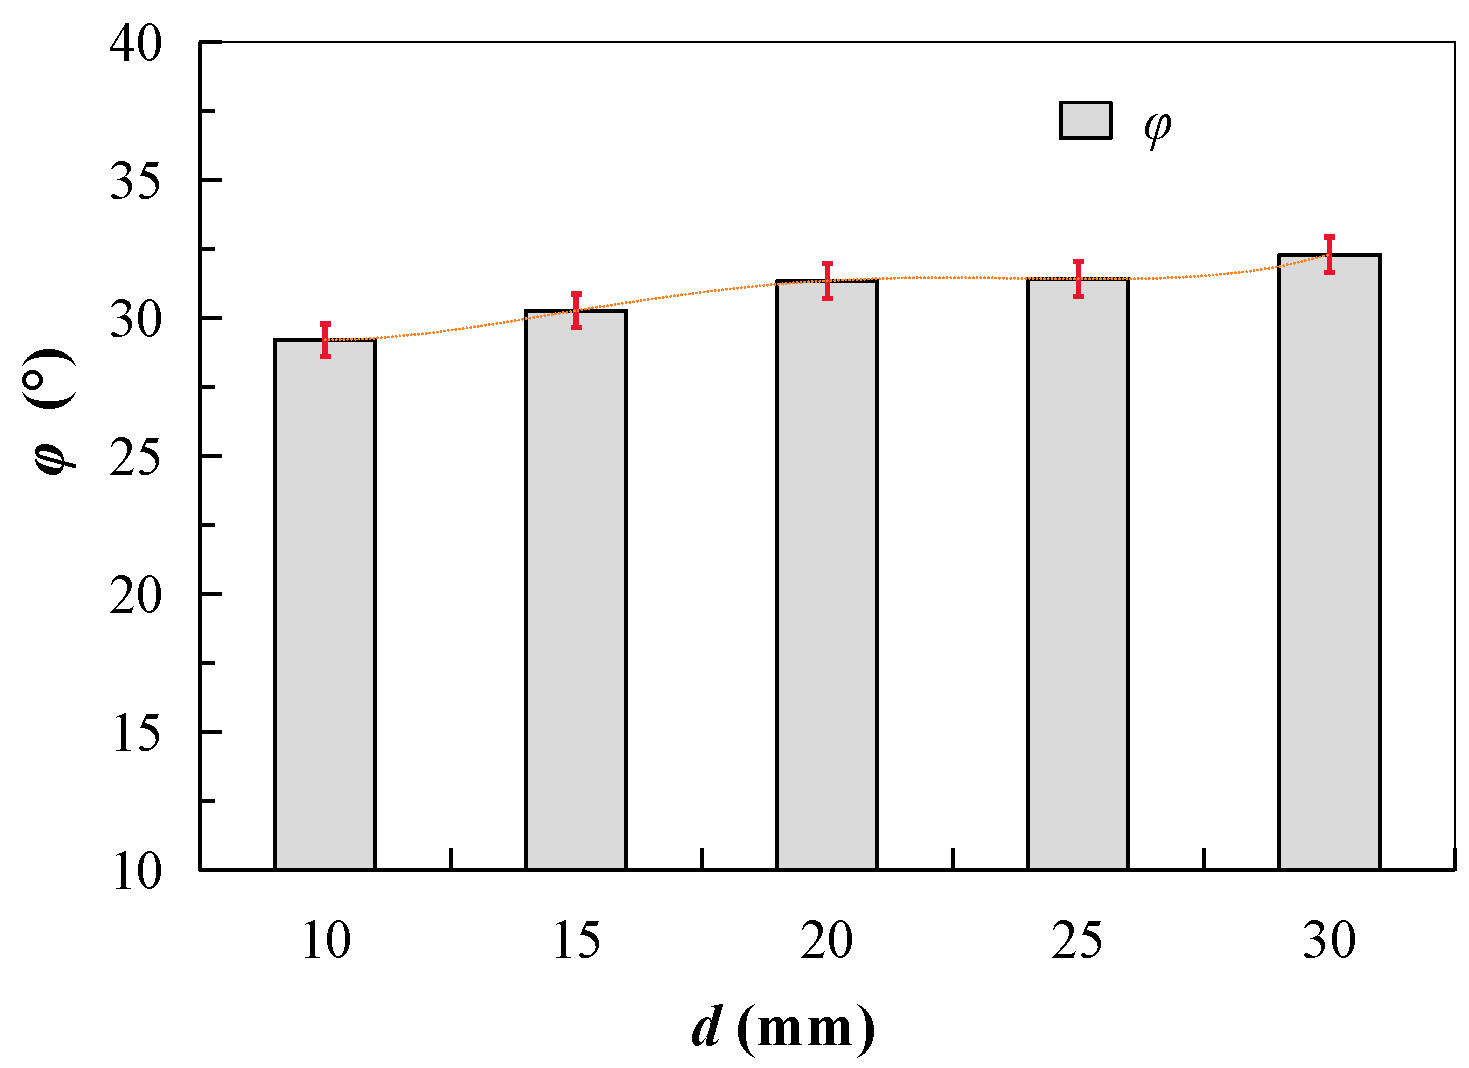
3.2.2. Effect of Particle Diameter on the Shear Strength of Large-Size Granular Materials

Table 3 shows the shear strength values of large-sized granular material specimens obtained from the large-scale triaxial tests. Figure 10 illustrates the relationship between the internal friction angle (φ) and particle diameter (d).
In Figure 10, the internal friction angle (φ) of large-sized granular materials with particle diameters (d) ranging from 10 mm to 30 mm exhibits a generally monotonic increase with particle size, albeit with some variations. Specifically: when d increases from 10 mm to 15 mm, φ increases by 1.06° (about 3.6%); from 15 mm to 20 mm, φ increases by 1.18° (about 3.7%); from 20 mm to 25 mm, φ increases by 0.1° (about 0.3%), indicating almost no change; from 25 mm to 30 mm, φ increases by 0.75º (2.4%).
These results indicate that, overall, the internal friction angle (φ) increases with particle diameter (d) for large-sized granular materials. However, within the range of 20 mm to 25 mm, φ remains nearly unchanged, suggesting a plateau in the relationship between particle size and internal friction angle. This observation highlights the non-linear nature of the relationship between particle diameter and shear strength parameters, even in larger-sized granular materials.

3.2.3. Test Results and Analyses of Large-Sized Granular Materials

Figure 11 presents the images of fractured particles collected following the large-scale triaxial tests on glass beads. Glass beads with a diameter exceeding 10 mm exhibited varying degrees of fragmentation. A summary of fragmentation amounts for different bead diameters is provided in Table 4. By comparing the breakage of particles with different diameters, the relationship between particle interactions and material strength can be more effectively elucidated.
From Table 4, it is evident that the glass beads of all sizes remained intact under a confining pressure of 100 kPa. However, under higher confining pressures, the extent of particle breakage varied significantly depending on the particle size. Particle breakage can influence the strain and strength characteristics of the materials. To quantify the particle breakage observed in shear tests of large-sized glass bead materials, the particle breakage rate (Br) was employed for analysis and research, based on the concept of limit gradation proposed by Einav [45]. The expression for Br is given by Equation (3).
B r = B t B p
In the equation, Bt represents the area enclosed by the initial particle gradation curve before the experiment and the particle gradation curve after the experiment; Bp represents the area enclosed by the initial gradation curve and the limiting gradation curve. As shown in Figure 12, Bt = S1S0; Bp = S2S0. The value of Br varies between 0 and 1, where Br = 0 indicates that no particle breakage occurs, and Br = 1 indicates complete breakage of the material.
The area under each grading curve can be calculated using the area integration method proposed by Einav [45]. The calculation formulas are given in Equations (4) and (5).
B t = S 1 S 0 = d m d M F i ( d ) F 0 ( d ) d 1 d d B p = S 2 S 0 = d m d M F u ( d ) F 0 ( d ) d 1 d d
F ( d ) = F ( Δ < d ) = d m d p ( Δ ) d Δ
In the equation, F(d) with subscripts i, 0, and u correspond to the gradation curves of the current state, the initial state before experiment, and the limit state, respectively. Δ is particles with diameters smaller than d; P(Δ) is the particle size distribution; P(Δ)dΔ represents the probability that particles within the fraction dΔ; dm and dM are the minimum and maximum particle diameters, respectively.
The variation of Br with d in large-sized granular materials during the triaxial experiment at different confining pressures is shown in Figure 13.
Figure 13 clearly demonstrates that for large-sized granular materials with particle diameters ranging from 15 mm to 30 mm, the particle breakage rate (Br) increases significantly with increasing confining pressure (σ3) for specimens of the same particle size. Furthermore, the test results across four levels of confining pressure indicate that Br initially increases and then decreases with increasing particle diameter (d).
No particle breakage was observed at a confining pressure of 100 kPa. Under higher confining pressure, the trend of Br with particle diameter is as follows: at high confining pressures (ranging from 300 kPa to 400 kPa), Br begins to decrease when d reaches 25 mm; at low confining pressure (200 kPa), Br also starts to decrease when d reaches 30 mm.
The intrinsic deformation mechanisms of particle breakage are governed by a combination of particle sliding, rotation, abrasion, and breakage, all of which are energy-dissipating behaviors. In triaxial tests, as the axial strain of the specimen continuously increases, this is accompanied by particle breakage. Br is influenced by factors such as particle size and confining pressure. The breakage of particles inevitably leads to a rearrangement of the material structure, changes in inter-particle contact modes, and alterations in the morphology of contact surfaces. These changes result in a transformation of the material’s strain characteristics. This helps to elucidate the intrinsic reasons for the transition of the strain curves for the 25 mm and 30 mm glass beads towards a softening characteristic under high confining pressures (300 kPa and 400 kPa), as shown in Figure 8.
As particle size d increases from 15 to 20 mm, the breakage rate (Br) and internal friction angle (φ) both show the largest increase. When d grows from 20 to 25 mm, Br increase slows down compared to the 15–20 mm range, and φ barely changes with d. However, as d rises from 25 to 30 mm, Br decreases while φ increases. This indicates that structural changes from particle breakage have a minimal impact on the strength of mono-sized glass-bead specimens. Instead, the variation in φ with size in large-particle specimens is mainly attributed to particle size itself.

4. Analysis of the Influence and Mechanisms of Particle Size on the Strength Behavior of Cohesionless Soil

4.1. Regularity of Particle Size Effect on Strength Behavior

The definitions of friction angle (φ) and cohesion (c) in coarse-grained soils are primarily introduced for analytical convenience. However, it is challenging to strictly distinguish between these two parameters. Theoretically, cohesion (c) should be zero in non-cohesive soils, yet practical experiments often yield a non-zero value for c. In this study, the observed non-zero c value (Table 2) for smooth glass beads does not represent true cohesion but rather results from inter-particle interactions such as sliding friction and interlocking. When the specimen is subjected to shear stress, the particles transition from a static state and must overcome their maximum static frictional force to initiate movement. This maximum static frictional force is macroscopically incorporated into the c value, which is defined as “characterizing cohesion”.
As previously discussed, the variation of shear strength behavior with particle size (d) for both small and large-sized granular materials indicates a consistent effect of particle size on the internal friction angle (φ) of cohesionless soils. The influence of particle size on strength is primarily reflected in the variation of φ. Generally, φ exhibits a monotonically increasing trend with increasing d, although there are intervals where this increase is minimal.
To further investigate the influence of particle size on the internal friction angle, the relationship between φ and particle diameter (d) for both small and large-sized particles was plotted, as shown in Figure 14. This visualization allows for an intuitive comparison of how particle size affects φ, thereby enhancing our understanding of the impact of particle size on the strength behavior of cohesionless soil.
In the Figure 14, the internal friction angle (φ) of large-sized particle materials is generally significantly greater than that of small-sized particle materials. Moreover, both large and small-sized granular materials exhibit a gentle interval in φ values as particle size increases. The large-scale triaxial tests on large-sized particles were conducted to expand the particle size range of the study and to further compare the φ of small and large-sized particles, particularly focusing on the gentle zone discontinuity in the particle size increase process. The diameters of small and large-sized specimens are compared with the particle sizes in Table 5. It is evident that the diameter-to-diameter ratio of the insensitive particle size interval (4 mm–5 mm for small particles and 20 mm–25 mm for large particles) is nearly equal. Based on this observation, the gentle interval is defined as the “insensitive particle size range” for φ with respect to particle diameter d, where the φ value remains almost unchanged as the particle diameter increases. Therefore, it can be concluded that the strength of particle materials generally increases monotonically with particle size. However, within certain particle size ranges (i.e., the insensitive particle size range), this increase is not significant, and φ shows insensitivity to changes in particle size. This finding is important for understanding the mechanical performance differences of materials with different particle sizes and has significant implications for material selection and design in practical engineering applications.

4.2. Mechanistic Analysis of the Effect of Dimensions on Strength Behavior

To elucidate the existence of the insensitive particle size range in the monotonic increase of φ with particle size, Figure 15 illustrates the micro-contact mechanism of spherical glass bead particles during the shearing process. Initially, during the shearing of spherical granular materials, the process enters the first stage, characterized by the gradual particle densification (Figure 15a). Once the particle density reaches its maximum, the particles transition into the second shear stage, where shear force is transmitted through the particles (Figure 15b). Under the action of shear stress, particle displacement occurs, primarily through particle sliding (Figure 15c) and particle rolling (Figure 15d).
When the particle size is small, the potential energy required for rolling displacement between particles is relatively low, hence the particles primarily displace through rolling. As the particle size increases, the potential energy required for rolling displacement increases, causing the mode of displacement to gradually shift towards predominantly particle sliding. This process reflects the influence of particle size on the mode of displacement and the changes in inter-particle interactions at different sizes.
Figure 16 illustrates the microscopic force diagram of glass beads during the shearing process. In the figure, F represents the frictional force per unit area at the contact points between particles, which resists the shear stress during the shearing, f denotes the frictional force acting on the particles, while N represents the normal force exerted by the upper contacting particles on the beads. The shear stress transmitted between particles disrupts the equilibrium among them, leading to sliding and rolling of the stressed particles. This resistance to particle displacement is macroscopically reflected as the material’s overall strength.
The macroscopic strength characteristics of granular materials are primarily influenced by the total frictional force between particles in the shear band. Further analysis of the frictional force per unit area between particles is illustrated in Figure 17, which presents a schematic of the contact between two adjacent particles during the shear process at the mesoscopic scale. At this scale, there exists a small surface contact at the contact vertex between the two adjacent particles. Particle size directly determines two key microscopic parameters: the micro-contact area between particles (Si) and the number of contact points between adjacent particles. Both of these parameters are positively correlated with the frictional force between particles. As the particle diameter (d) decreases, the number of particles per unit area increases, leading to more contact points between particles; however, the micro-contact area (Si) correspondingly decreases. Conversely, as shown in Figure 18, when d increases, the number of contact points decreases, but Si increases. Therefore, as particle size increases, the combined effect of the number of contact points and the micro-contact area reaches an extremum, resulting in the frictional force between particles reaching a local extremum. This manifests macroscopically as a plateau in the overall strength as the particle size increases.
It is evident that the macroscopic strength of granular materials is primarily determined by both the number of particles per unit area at the mesoscopic level and the size of the micro-interlocking area at the contact points between particles. This influence is reflected in triaxial tests of granular materials at different scales, where the internal friction angle (φ) increases with the particle diameter (d), exhibiting insensitivity within a certain range of particle sizes. Within this range, the number of contact points between particles and the size of the micro-contact areas work together to achieve an extremum in strength. When the particle size is smaller than the insensitive particle size range, the number of contact points predominately influences the macroscopic strength, which mainly arises from sliding and rolling friction between particles. Conversely, when the particle size exceeds this range, the total micro-contact area becomes the dominant factor affecting macroscopic strength, with the shear strength mainly arising from the sliding friction of the particles and even their intrinsic shear strength. The particle diameters (d) of 4 mm–5 mm and 20 mm–25 mm represent the extremum values for small-scaled and large-scaled granular materials, respectively, where the product of the particle contact points and the micro-contact areas is maximized. When d < 4 mm or d < 20 mm, the number of contact points dominates the macroscopic strength, whereas when d > 5 mm or d > 25 mm, the size of the micro-contact area becomes the primary factor influencing macroscopic strength.
In Figure 12, when the particle diameter increases from 25 mm to 30 mm under different confining pressures, the relative particle breakage rate (Br) decreases. This is because the material strength of particles of different sizes is the same. As the particle size increases, the micro-contact area and shear resistance between particles increase, leading to a decrease in the particle breakage rate.
Consequently, the effect of d on φ follows a clear pattern: φ increases monotonically with the increase in d but shows insensitivity to intermediate particle sizes. The insensitive particle size range is as follows: for a specimen diameter of 61.8 mm, the insensitive range is d = 4 mm–5 mm; for a specimen diameter of 300 mm, the insensitive range is d = 20 mm–25 mm.

5. Conclusions

Based on the concept of the control variable method, ideal spherical glass beads were employed as the experimental material to systematically investigate the effect of particle size–a single internal variable–on the strength characteristics of cohesionless soil. Additionally, the intrinsic mechanisms underlying the influence of particle size variations on strength behavior were thoroughly analyzed. The findings provide a theoretical basis for optimizing the selection of particle sizes in fill materials for engineering applications such as tunnels and deep foundations in cohesionless soil regions. Furthermore, this study offers new insights and methods for the optimization of soil materials in underground engineering. The specific conclusions are as follows:
(1)
Particle size significantly influences the mechanical properties of cohesionless soil. For a given confining pressure, the peak shear stress (qf) of the specimen increases with particle size. This trend is observed for both small-sized (2 mm–6 mm) and large-sized (10 mm–30 mm) granular particles, with the growth rate of qf being higher under high confining pressures (300 kPa and 400 kPa) compared to low confining pressures (100 kPa and 200 kPa).
(2)
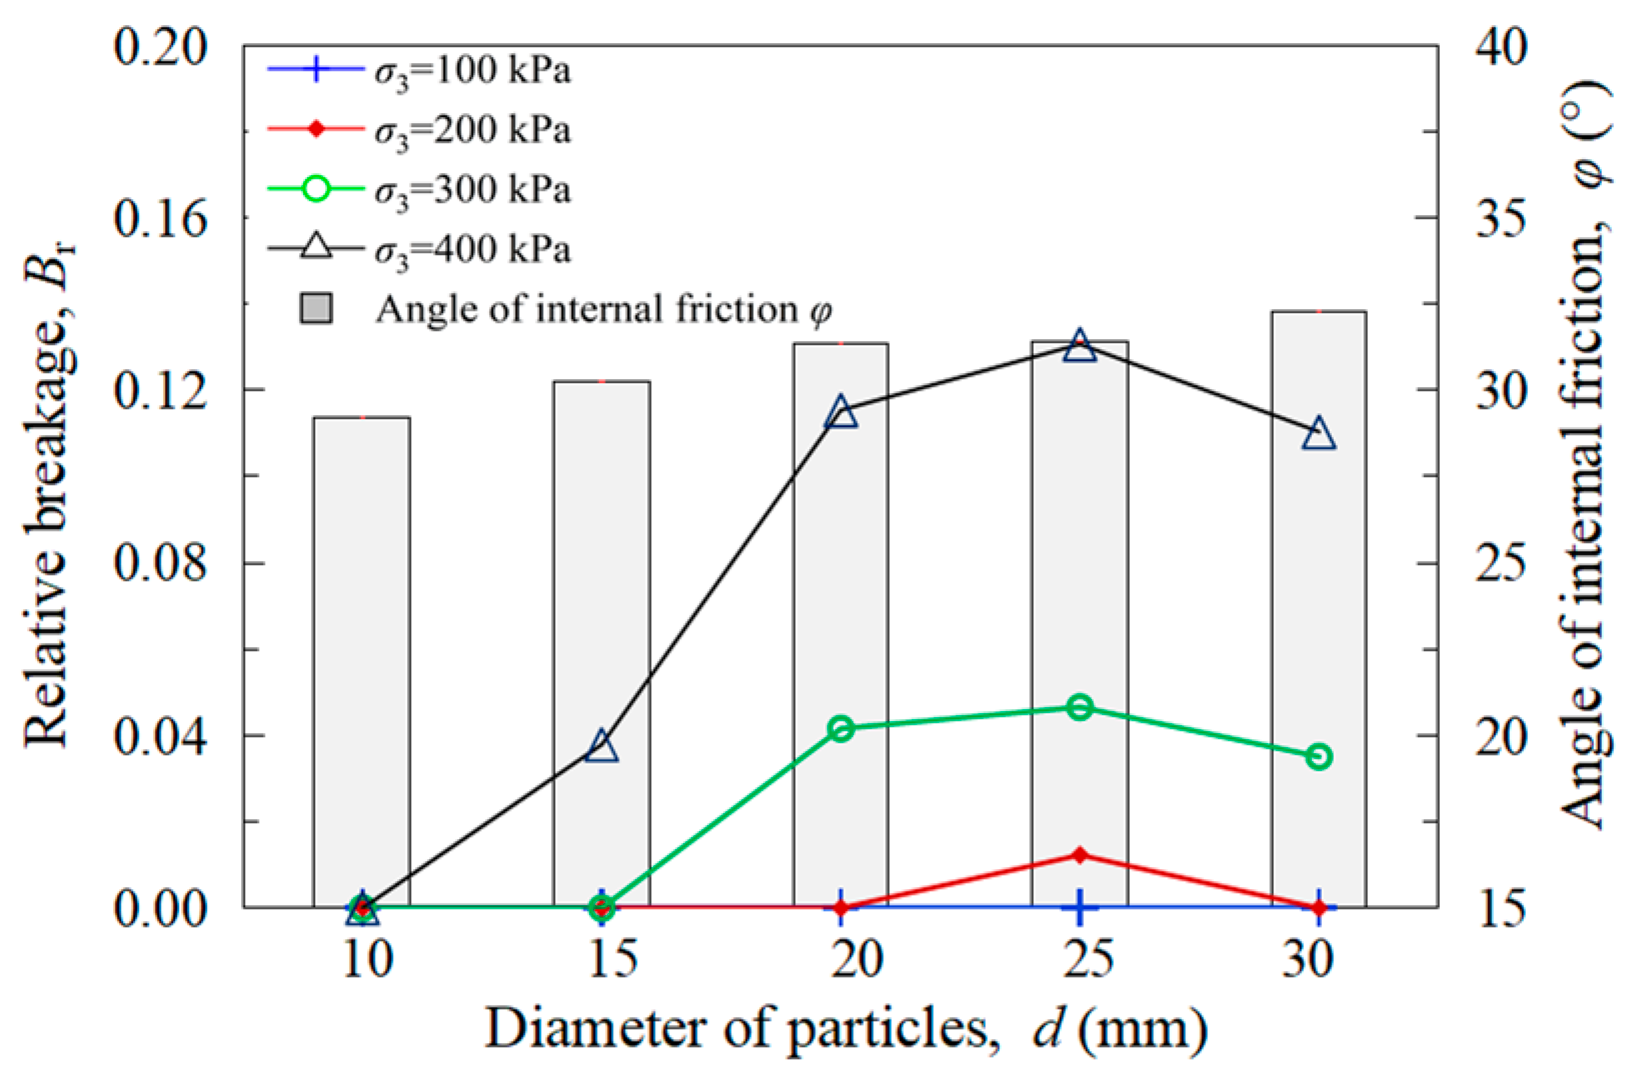
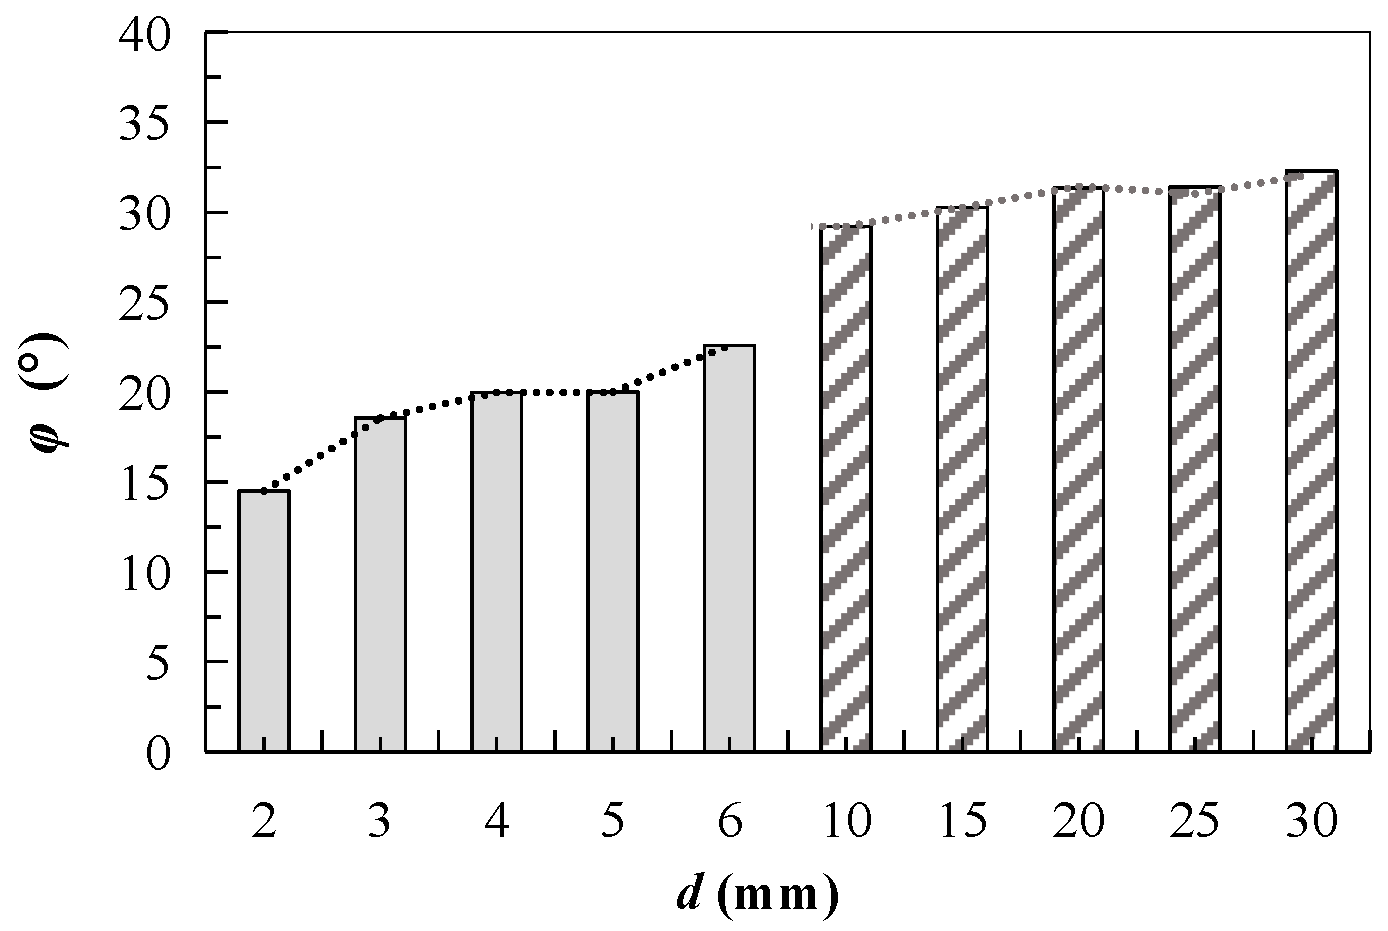
The internal friction angle (φ) increases monotonically with particle diameter (d) for both small-sized and large-sized granular materials. However, there exists an insensitive particle size range where the increase in φ is minimal: 4 mm–5 mm for small particles and 20 mm–25 mm for large particles. Additionally, large-sized granular materials exhibit significantly higher strength than small-sized granular materials.
(3)
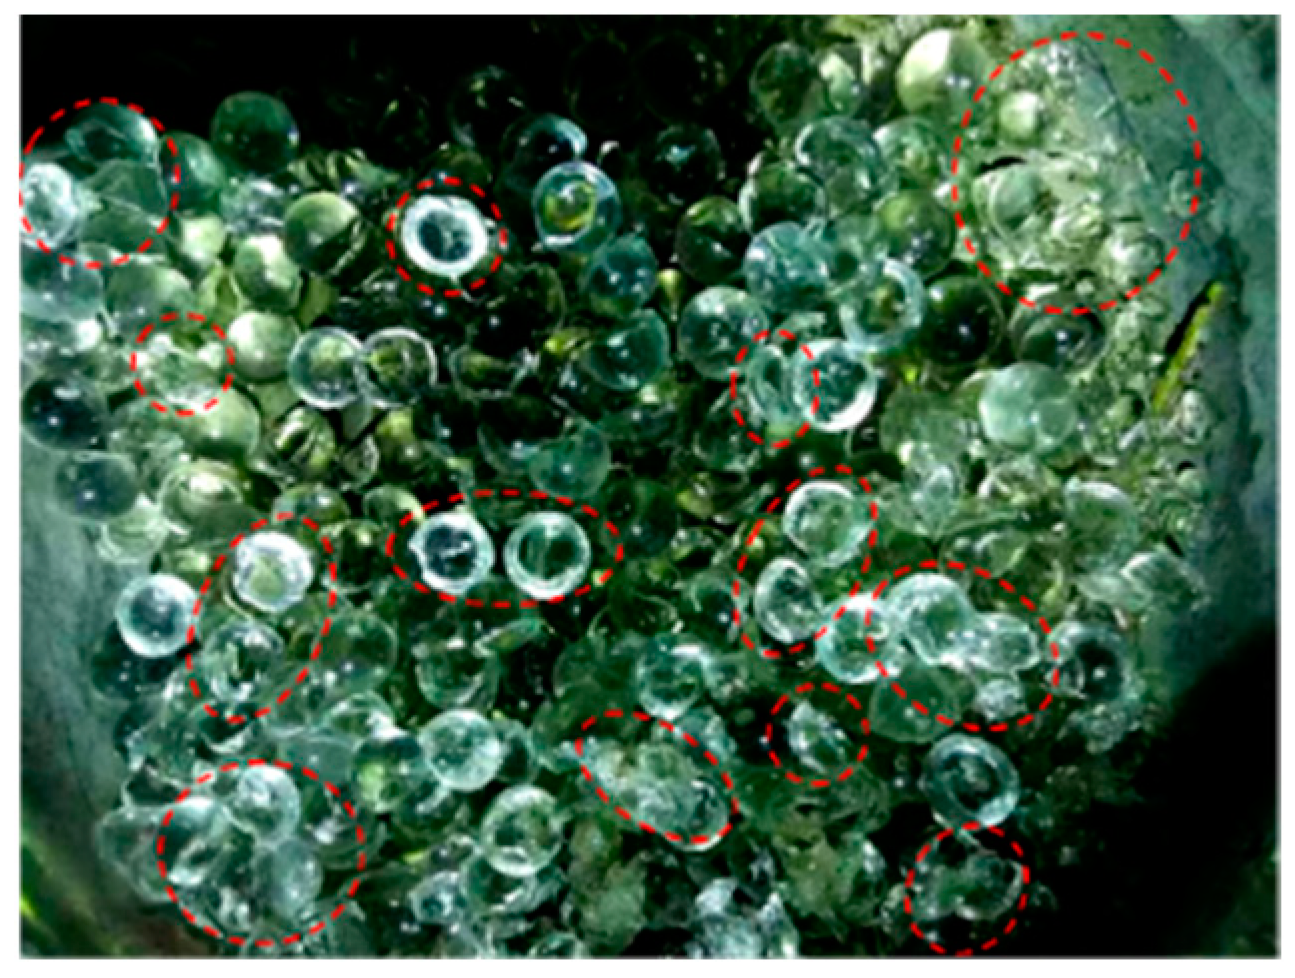
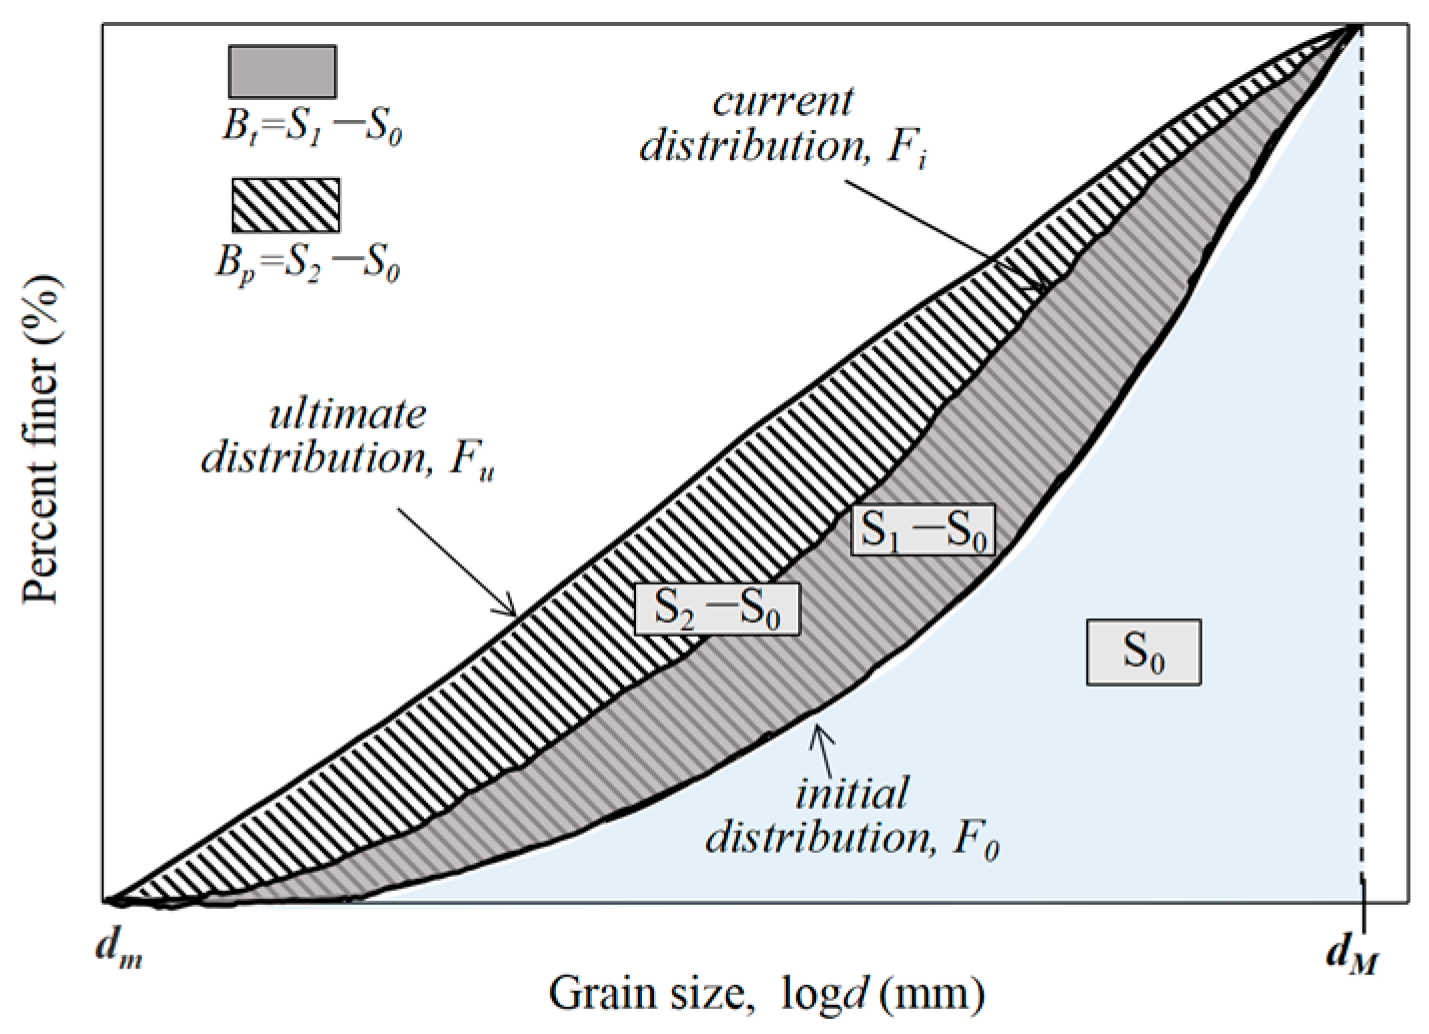
For large-sized granular particles, the particle breakage rate (Br) increases with confining pressure. Moreover, Br initially increases and then decreases with increasing particle diameter (d).
(4)
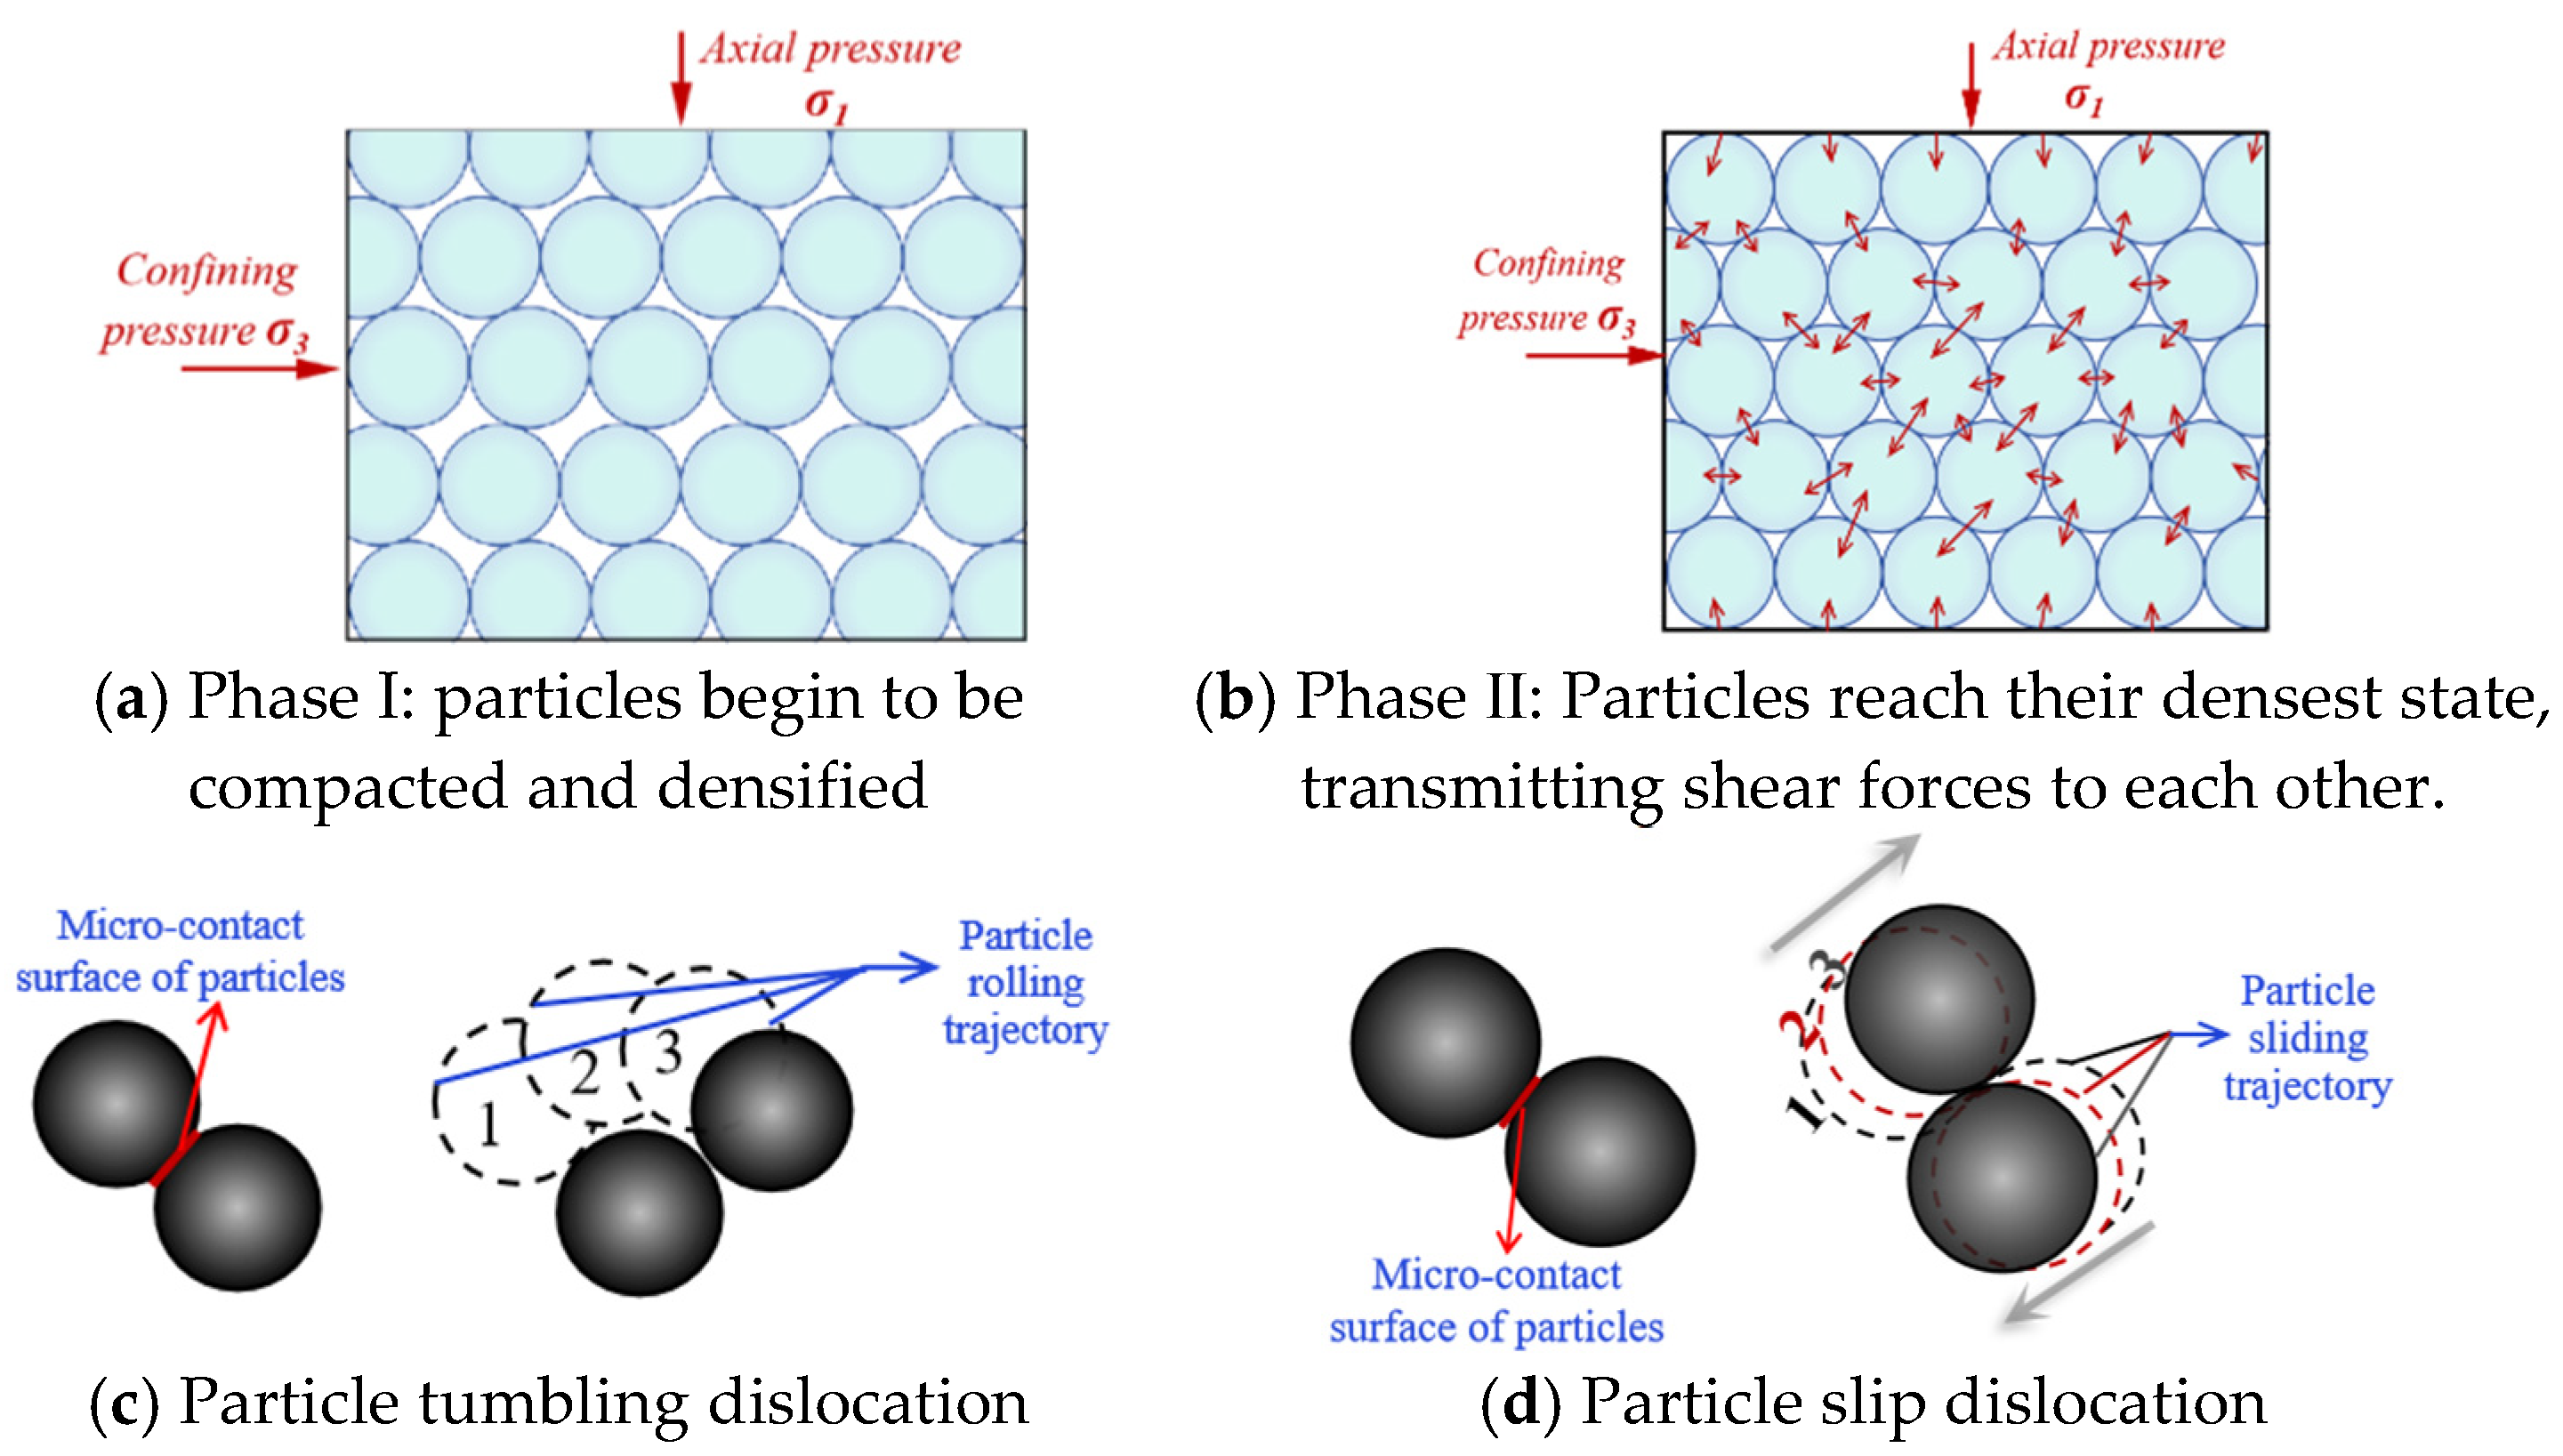
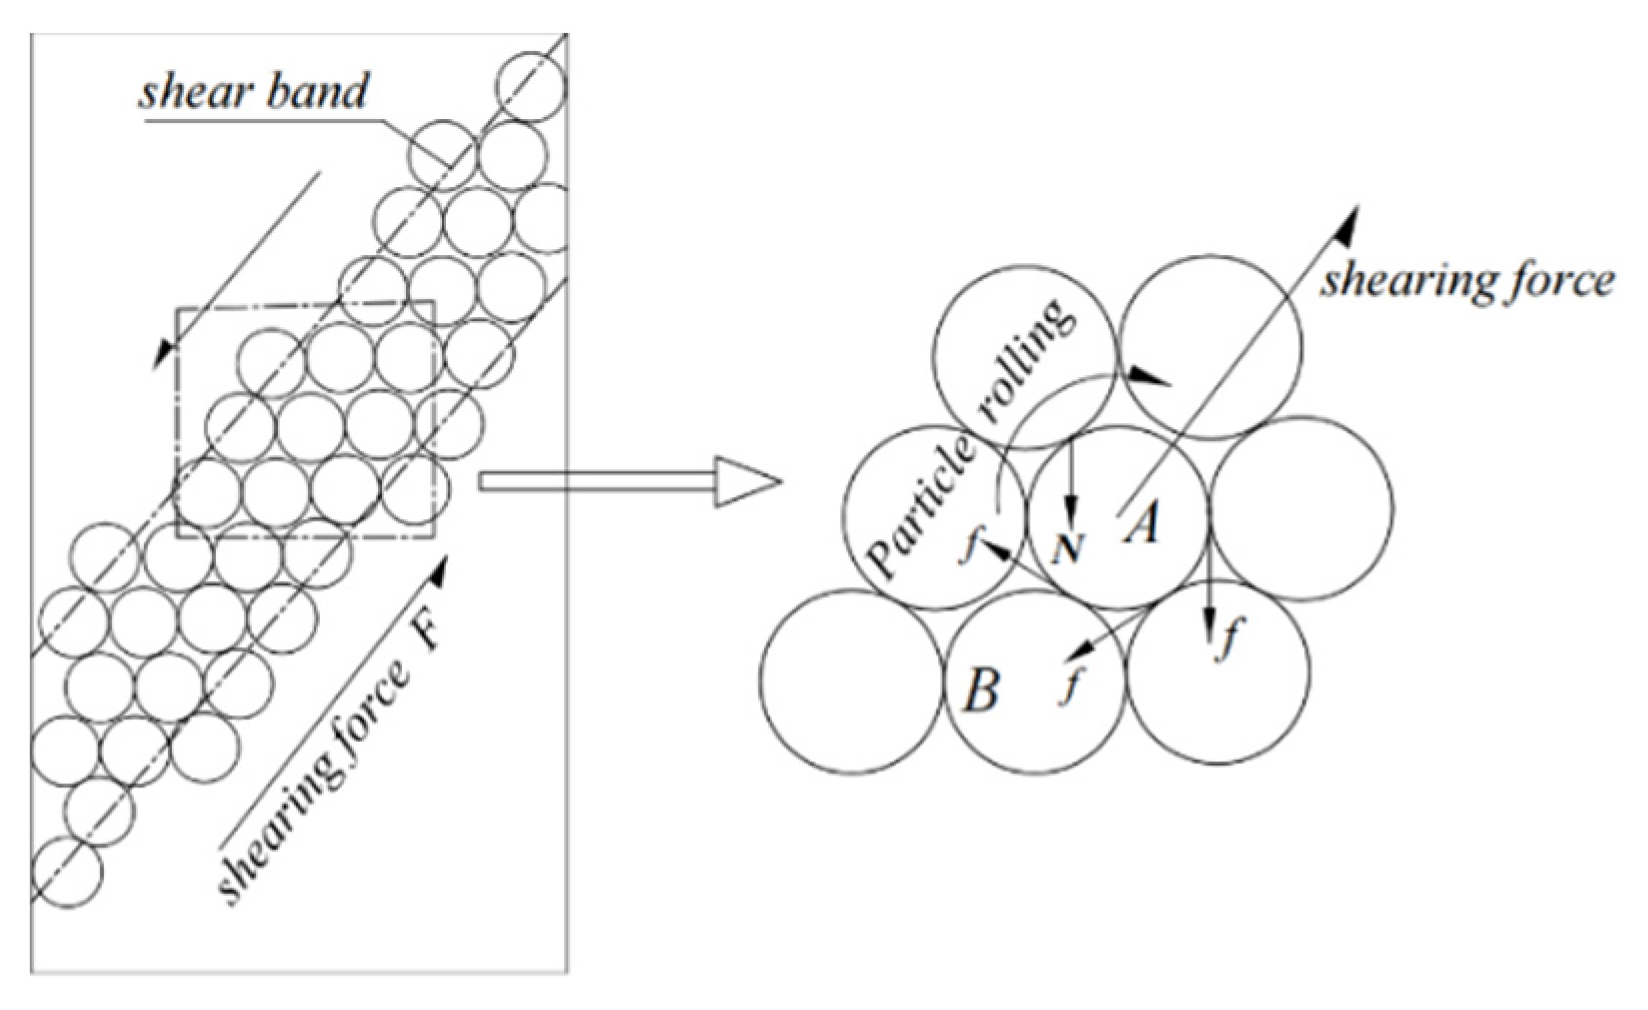
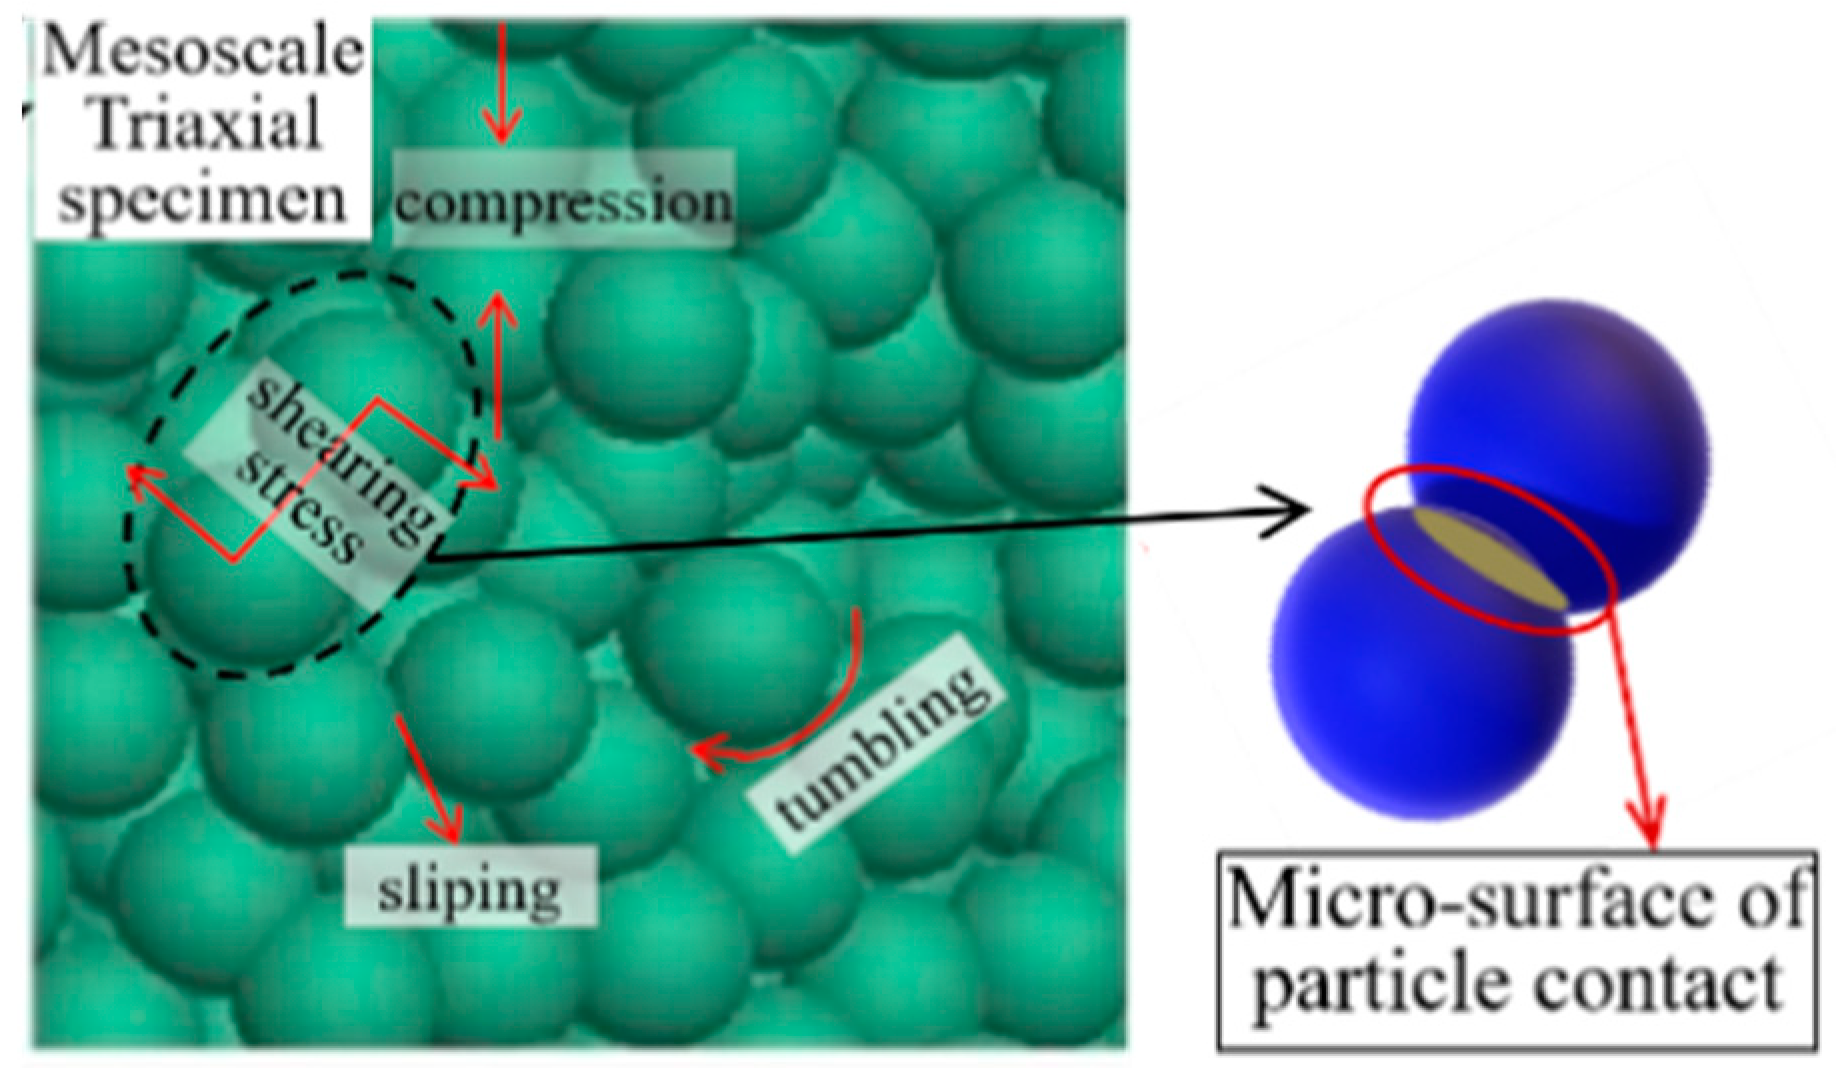
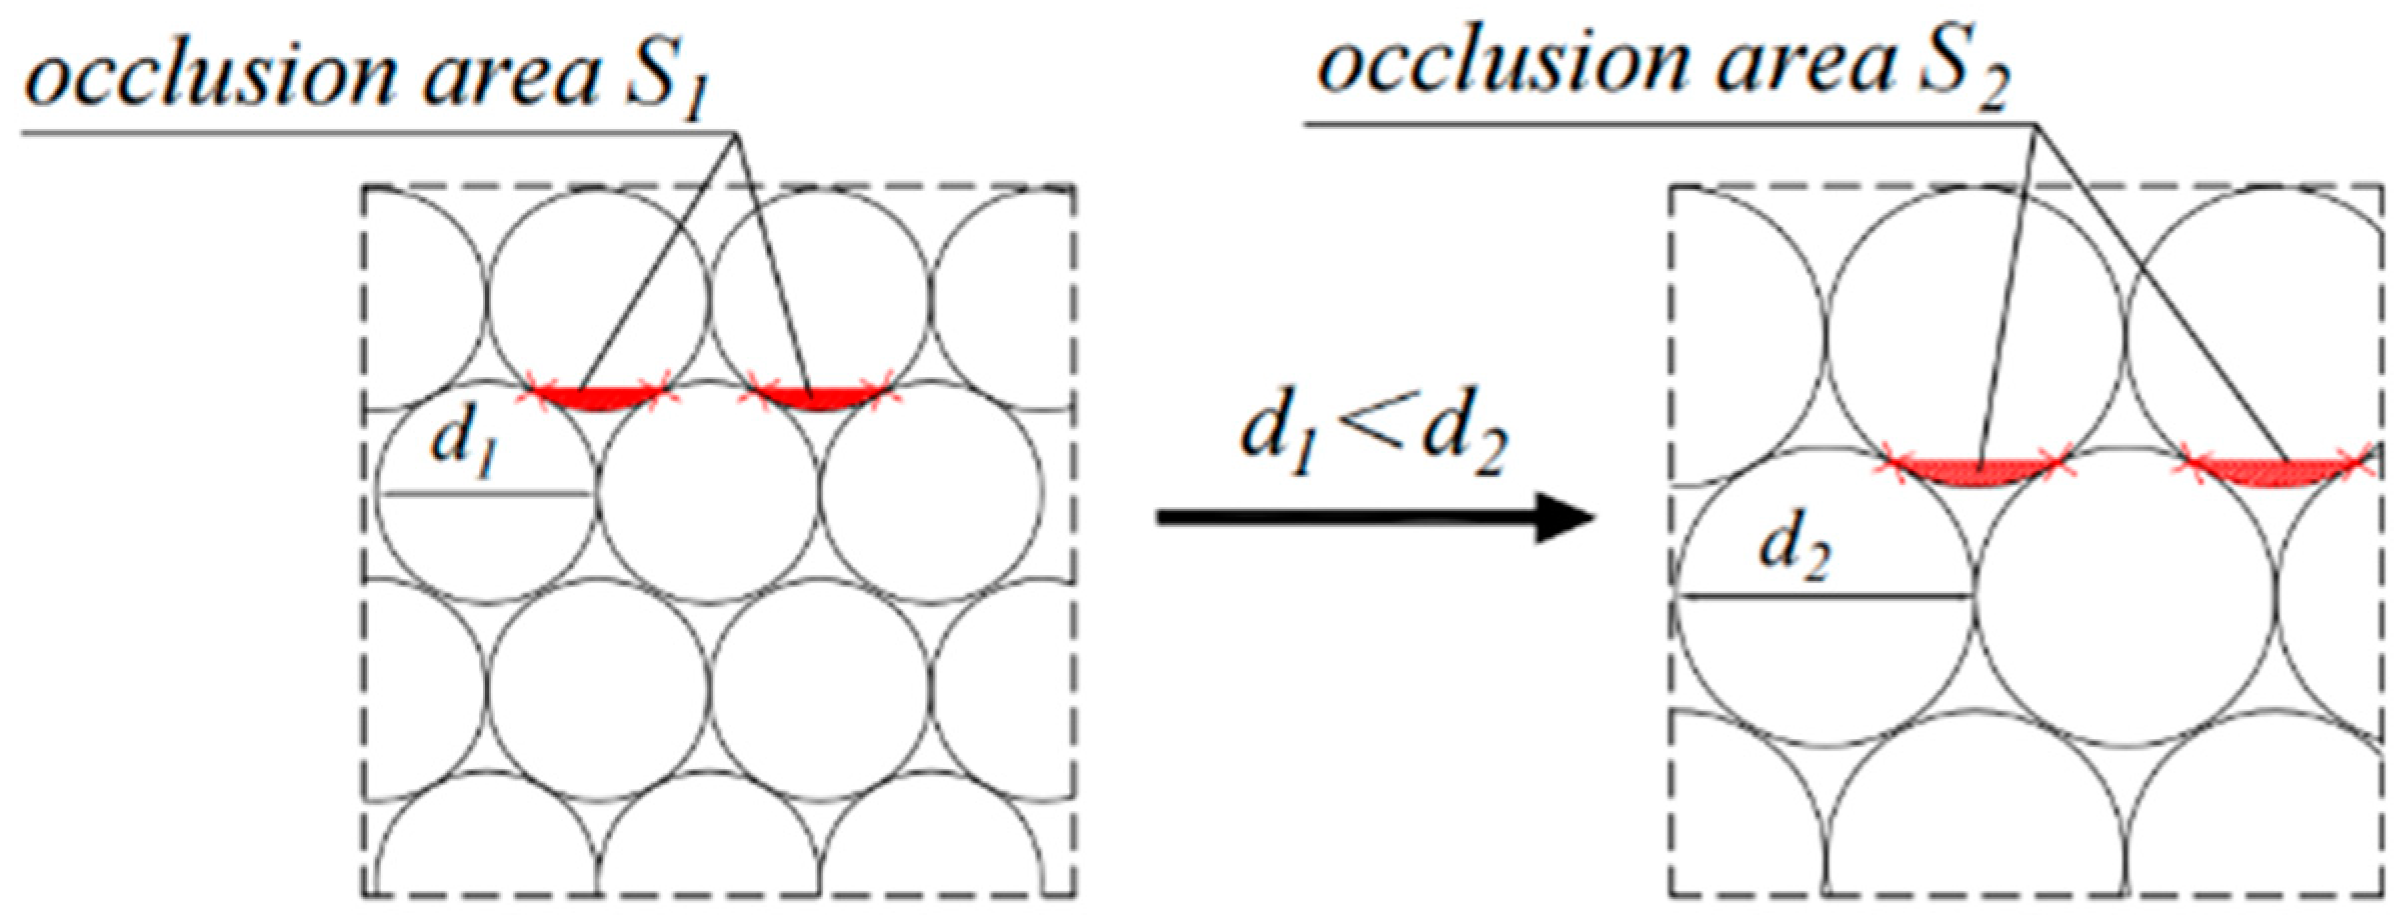
The insensitive particle size ranges in the increase of internal friction angle (φ) with particle size reflect the macroscopic manifestation of the combined effects of two mesoscopic structural parameters: the number of particle contact points and the micro-contact area between particles. These parameters reach an extremum, resulting in a plateau in the overall strength as particle size increases.
This study has limitations due to the lack of micro-scale testing methods and equipment during triaxial tests, preventing observation of particle information during shearing. We hope to conduct more systematic research in the future when conditions permit.

Author Contributions

L.Z.: Conceptualization, Writing and Editing; F.L.: Conceptualization, Review and Supervision, Resources, Funding acquisition; Z.W.: Review and Editing, Visualization Figures, Funding acquisition; N.L.: Methodology, Investigation Supervision and Data Curation; H.L.: Writing—Review and Funding acquisition; B.W.: Writing—Review and Editing. All authors have read and agreed to the published version of the manuscript.

Funding

This research was supported by the National Natural Science Foundation of China (No. 12072260) and the National Natural Science Foundation of China (No. 52278370) and the Project for Enhancing Composite Foundation Treatment Construction Technology by Anhui Construction Engineering San Jian Group Co., Ltd. (RD2024-XB-03).

Institutional Review Board Statement

Not applicable.

Informed Consent Statement

Not applicable.

Data Availability Statement

The data presented in this study are available from the corresponding author upon reasonable request.

Conflicts of Interest

The authors declare no conflicts of interest.

References

  1. Fang, Q.; Du, J.M.; Wang, G.; Wang, Z.J.; Wang, G.Q. Stratum deformation laws and influence factors analysis of tunnel excavation in sand. Hazard Control Tunneling Undergr. Eng. 2020, 2, 67–76. [Google Scholar]
  2. Chen, R.P.; Tang, L.J.; Ling, D.S.; Chen, Y.M. Face stability analysis of shallow shield tunnels in dry sandy ground using the discrete element method. Comput. Geotech. 2011, 38, 87–95. [Google Scholar] [CrossRef]
  3. Alagha, A.S.N.; Chapman, D.N. Numerical modelling of tunnel face stability in homogeneous and layered soft ground. Tunneling Undergr. Space Technol. 2019, 94, 103096. [Google Scholar] [CrossRef]
  4. Liu, N.F.; Liang, S.H.; Wang, S.J.; Song, Z.P. THM model of rock tunnels in cold regions and numerical simulation. Sci. Rep. 2024, 14, 3465. [Google Scholar] [CrossRef]
  5. Marshall, A.M.; Farrell, R.; Klar, A.; Mair, R. Tunnels in sands: The effect of size, depth and volume loss on greenfield displacements. Geotechnique 2012, 62, 385–399. [Google Scholar] [CrossRef]
  6. Shen, X.; Yuan, D.J. Model test of shield tunnel excavation face stability in sand. China Civ. Eng. J. 2015, 48, 261–265. [Google Scholar]
  7. Miao, L.C.; Wang, Z.X.; Shi, W.B. Theoretical and numerical simulations of face stability around shield tunnels in sand. Chin. J. Geotech. Eng. 2015, 37, 98–104. [Google Scholar]
  8. Wang, Y.S.; Wang, M.N.; Chen, W.T.; Wei, L.H. Test research on internal friction coefficient of sandy soil tunnel surrounding rock. Rock Soil Mech. 2008, 29, 741–746. [Google Scholar]
  9. Zhu, J.G.; Guo, W.L.; Xu, J.C.; Chu, F.Y. DEM analysis on impact of gradation and compactness on coarse-grained soil in tri-axial test. J. Chongqing Jiaotong Univ. (Nat. Sci.) 2017, 36, 70–74. [Google Scholar]
  10. Sun, Z.Z.; Ma, G.; Zhou, W.; Wang, Y.H.; Xiao, H.B. Influence of particle shape on size effect of crushing strength of rockfill particles. Rock Soil Mech. 2021, 42, 430–438. [Google Scholar]
  11. Hu, S.J.; Guo, N.; Yang, Z.X.; Zhao, J.D. Implicit DEM analyses of size and shape effects on crushing strength of rockfill particles. Chin. J. Geotech. Eng. 2023, 45, 433–440. [Google Scholar]
  12. Sun, Y.; Shen, Y.; Chen, C. A grading parameter for evaluating the grading-dependence of the shear stiffness of granular aggregates. Particuology 2018, 36, 193–200. [Google Scholar] [CrossRef]
  13. Li, G.; Liu, Y.J.; Dano, C.; Hicher, P.Y. Grading-dependent behavior of granular materials: From discrete to continuous modeling. J. Eng. Mech. 2014, 141, 04014172. [Google Scholar] [CrossRef]
  14. Chen, M.L.; Wu, G.J.; Gan, B.R.; Jiang, W.H.; Zhou, J.W. Physical and compaction properties of granular materials with artificial grading behind the particle size distributions. Adv. Mater. Sci. Eng. 2018, 2018, 8093571. [Google Scholar] [CrossRef]
  15. Li, G.; Liu, Y.J.; Yin, Z.Y.; Dano, C.; Hicher, P.Y. Grading effect on critical state behavior of granular materials. Chin. J. Geotech. Eng. 2014, 36, 452–457. [Google Scholar]
  16. Liang, C.Y.; Wu, Y.D.; Liu, J.; Wu, H.G. Influences of arrangement and cementation of soil particles on structure of artificial structural soil. Chin. J. Geotech. Eng. 2022, 44, 2135–2142. [Google Scholar]
  17. Liu, F.Y.; Zhong, L.J.; Zhong, Y. Effects of different particle arrangements on mechanical properties of sand. Chin. J. Geotech. Eng. 2021, 43, 155–160. [Google Scholar]
  18. Louati, H.; Oulahna, D.; Ryck, A. Effect of the particle size and the liquid content on the shear behavior of wet granular material. Powder Technol. 2017, 315, 398–409. [Google Scholar] [CrossRef]
  19. Wang, Z.Y.; Wang, P.; Yin, Z.Y.; Wang, R. Micromechanical investigation of the particle size effect on the shear strength of uncrushable granular materials. Acta Geotech. 2022, 17, 4277–4296. [Google Scholar] [CrossRef]
  20. Dai, B.B.; Yang, J.; Zhou, C.Y. A preliminary investigation on effect of particle size on mechanical behavior of granular materials. Rock Soil Mech. 2014, 35, 1878–1884. [Google Scholar]
  21. Shao, X.Q.; Chi, S.C. Particle size correlation of deformation parameters for rockfill materials. Chin. J. Geotech. Eng. 2020, 42, 1715–1722. [Google Scholar]
  22. Varadarajan, A.; Sharma, K.G.; Venkatachalam, K.; Gupta, A.K. Testing and modeling two rockfill materials. J. Geotech. Geoenviron. Eng. 2003, 129, 206–218. [Google Scholar] [CrossRef]
  23. Wang, B.; Lv, G.; Li, J. Experimental study on micro-macro shear properties of sand considering particle size. Geotech. Eng. Tech. 2023, 37, 618–622. [Google Scholar]
  24. Li, Z.R. Effect of Particle Size Difference on Shear Properties of Sand and Its Mesomechanical Analysis; Qingdao University of Technology: Qingdao, China, 2019. [Google Scholar]
  25. Venkatachalam, K. Prediction of Mechanical Behavior of Rockfill Materials; IIT Delhi: New Delhi, India, 1993. [Google Scholar]
  26. Wu, L.Q.; Ye, F.; Lin, W.Q. Experimental study on scale effect of mechanical properties of rockfill materials. Chin. J. Geotech. Eng. 2020, 42, 141–145. [Google Scholar]
  27. Ma, G.; Zhou, W.; Chang, X.L.; Zhou, C.B. Mesoscopic mechanism study of scale effects of rockfill. Chin. J. Rock Mech. Eng. 2012, 31, 2473–2482. [Google Scholar]
  28. Xue, Q.H. Study on Direct Shear Characteristics and Particle Crushing Characteristics of Soil-Rock Mixture; China University of Mining and Technology: Xuzhou, China, 2020. [Google Scholar]
  29. Marschi, N.D.; Chan, C.K.; Seed, H.B. Evaluation of properties of rockfill materials. ASCE Soil Mech. Found. Div. J. 1972, 98, 95–114. [Google Scholar] [CrossRef]
  30. Gupta, A.K. Effects of particle size and confining pressure on breakage factor of rockfill materials using medium triaxial test. J. Rock Mech. Geotech. Eng. 2016, 8, 378–388. [Google Scholar] [CrossRef]
  31. Charles, J.A.; Watts, K.S. The influence of confining pressure on the shear strength of compacted rockfill. Geotechnique 1980, 30, 353–367. [Google Scholar] [CrossRef]
  32. Marsal, R.J. Large scale testing of rockfill materials. J. Soil Mech. Found. Div. 1900, 94, 1042–1047. [Google Scholar] [CrossRef]
  33. Kai, W.; Patrick, P.; Frederic, B.; Sébastien, R.; Noredine, A.; Xu, W.Y.; Liu, S.Y. Experimental and numerical study of cylindrical triaxial test on mono-sized glass beads under quasi-static loading condition. Adv. Powder Technol. 2017, 28, 155–166. [Google Scholar]
  34. Brenda, N.M. Strength Properties of Granular Materials; Louisiana State University and Agricultural and Mechanical College: Baton Rouge, LA, USA, 2003. [Google Scholar]
  35. Wu, K.; Sébastien, R.; NorEdine, A.; Patrick, P.; Frédéric, B.; Liu, S.Y. Study of the shear behavior of binary granular materials by DEM simulations and experimental triaxial tests. Adv. Powder Technol. 2017, 28, 2198–2210. [Google Scholar] [CrossRef]
  36. Xu, W.D.; Li, X.F.; Yang, W.W.; Jia, H.J. Triaxial test on glass beads simulating coarse-grained soil. Res. Cold Arid. Reg. 2022, 14, 274–280. [Google Scholar] [CrossRef]
  37. Ou, F.Y.; Fei, J.B.; Ma, W.B.; Chen, X.S. Influence of Loading Conditions and Particle Size on Stick-Slip Characteristics of Granular Materials. Geotech. Eng. Tech. 2024, 38, 592–597. [Google Scholar]
  38. GB/T 50123-2019; Standard for Geotechnical Testing Method. China Planning Press: Beijing, China, 2019.
  39. Liu, F.Y.; Zhong, L.J.; Wang, B.; Yang, Z.; Dong, C. Visual Sealing Specimen Preparation Device, Assembly Method, and Specimen Preparation Method for Bulk Materials. CN Patent 1234567, 22 March 2024. [Google Scholar]
  40. Qin, H.Y.; Liu, H.L.; Gao, Y.F.; Dai, P.F. Research on strength and deformation behavior of coarse aggregates based on large-scale triaxial tests. Rock Soil Mech. 2004, 25, 1575–1580. [Google Scholar]
  41. Chu, F.Y.; Zhu, J.G.; Wang, G.Q.; Liu, H.L. Large-scale triaxial test study on deformation and strength characteristic of coarse grained material. J. Shandong Agric. Univ. (Nat. Sci.) 2011, 42, 572–578. [Google Scholar]
  42. Chu, F.Y.; Zhu, J.G.; Yin, J.H. Study of shear dilatancy behaviors of coarse-grained soil in large-scale triaxial tests under K0-consolidation condition. Rock Soil Mech. 2013, 34, 3431–3436. [Google Scholar]
  43. Liu, M.C.; Meng, F.; Wang, Y.Y. Evolution of particle crushing of coarse-grained materials in large-scale triaxial tests. Chin. J. Geotech. Eng. 2020, 42, 561–567. [Google Scholar]
  44. Chen, B.; Li, Y.Q.; Liu, X.F.; Zhou, Y.X.; Xu, Y. Study on Stick-slip Behavior of Granular Materials in Triaxial Test. J. Disaster Prev. Mitig. Eng. 2023, 43, 568–575. [Google Scholar]
  45. Chen, X.; Shen, J.H.; Wang, X.; Yao, T.; Xu, D.S. Effect of Saturation on Shear Behavior and Particle Breakage of Coral Sand. J. Mar. Sci. Eng. 2022, 10, 1280–1309. [Google Scholar] [CrossRef]
Figure 1. Smooth spherical glass beads.
Applsci 15 03310 g001
Figure 2. In situ specimen preparation method.
Applsci 15 03310 g002
Figure 3. Large triaxial specimen preparation process.
Applsci 15 03310 g003
Figure 4. Experimental equipment.
Applsci 15 03310 g004
Figure 5. Stress-strain curves of single-particle size specimens with different particle sizes under various confining pressures.
Applsci 15 03310 g005
Figure 6. Variation curves of peak shear stress qf with particle diameter (d) for glass beads of different size under four levels of confining pressure.
Applsci 15 03310 g006
Figure 7. The variation curve of internal friction angle (φ) of small size granular materials with particle diameter (d).
Applsci 15 03310 g007
Figure 8. The stress-strain curves of large particle glass beads with different sizes in large-scale triaxial tests.
Applsci 15 03310 g008
Figure 9. Variation curve of shear strength parameters with particle diameter(d) of single-particle-size specimens of large-sized glass beads.
Applsci 15 03310 g009
Figure 10. Relationship between shear strength parameters and d of each group of large-sized granular particles.
Applsci 15 03310 g010
Figure 11. Particle breakage observed in the large triaxial test (broken particles are highlighted with red circles).
Applsci 15 03310 g011
Figure 12. Schematic diagram illustrating the particle breakage rate Br.
Applsci 15 03310 g012
Figure 13. Variation of Br with d in triaxial test of large-size granular materials under different σ3.
Applsci 15 03310 g013
Figure 14. Relationship between φ and particle diameter (d) for both small-sized and large-sized particles.
Applsci 15 03310 g014
Figure 15. Schematic diagram of different stages of particle material shear and particle displacement.
Applsci 15 03310 g015
Figure 16. Schematic diagram of forces acting on particles at macroscopic and microscopic scales.
Applsci 15 03310 g016
Figure 17. Mesoscopic contact state of particles.
Applsci 15 03310 g017
Figure 18. Schematic diagram of occlusion areas for particles of different sizes.
Applsci 15 03310 g018
Table 1. The maximum and minimum dry density of glass beads used in the test.
Glass Bead Diameter (mm)234561015202530
ρ (g/cm3)2.50 (±0.003)
ρdmax (g/cm3)1.631.621.601.591.581.551.501.491.481.47
ρdmin (g/cm3)1.431.431.411.401.401.531.471.451.431.41
Specimen size (D × h)61.8 mm × 120 mm300 mm × 600 mm
Table 2. The shear strength parameters of granular materials with different sizes.
Particle Diameter (mm)Shear Strength Parameters
c (kPa)φ (°)
213.0614.51
39.8918.57
45.6719.99
510.8120.01
61.3222.60
Table 3. The shear strength parameters of large-sized granular materials with different sizes.
Particle Diameter (mm)Shear Strength Parameters
c (kPa)φ (°)
1035.3329.21
1522.5430.27
2029.7331.45
2539.6331.35
3029.9532.10
Table 4. Particle breakage of large-sized glass bead specimens.
d (mm)σ3 (kPa)Total Mass of Design Specimen Md (kg)Total Mass of Actual Specimen Mf (kg)Mass of Unbroken Particles Mu (kg)Mass Percent of Crushed Particles Pt (%)
1510063.27863.26663.2660
20063.26863.268
30063.27163.271
40063.27261.7222.45%
2010062.81162.80062.8000
20062.79162.791
30062.80161.0992.71%
40062.79554.02913.96%
2510062.38762.41262.4120
20062.42562.0250.64%
30062.42259.4194.81%
40062.42053.31314.59%
3010061.92061.92261.9220
20061.92961.929
30061.91560.3672.50%
40061.92456.6738.48%
Table 5. Diameter-to-diameter ratio (D/d) of insensitive particle size range for large and small specimens.
Specimen DiameterConventional Triaxial Tests D = 61.8 mmLarge-Scale Triaxial Tests
D = 300
Glass bead diameter (mm)452025
D/d15.4512.361512
Disclaimer/Publisher’s Note: The statements, opinions and data contained in all publications are solely those of the individual author(s) and contributor(s) and not of MDPI and/or the editor(s). MDPI and/or the editor(s) disclaim responsibility for any injury to people or property resulting from any ideas, methods, instructions or products referred to in the content.

