Article

A Vehicle Conflict Risk Identification Method Based on an Improved Intelligent Driver Model

1
School of Transportation and Civil Engineering, Fujian Agriculture and Forestry University, Fuzhou 350002, China
2
Department of Civil and Environmental Engineering, Hong Kong Polytechnic University, Hong Kong 999077, China
*
Author to whom correspondence should be addressed.
Appl. Sci. 2025, 15(6), 3240; https://doi.org/10.3390/app15063240
Submission received: 13 February 2025 / Revised: 9 March 2025 / Accepted: 14 March 2025 / Published: 16 March 2025
(This article belongs to the Section Transportation and Future Mobility)

Abstract

:
With accelerating urbanization, vehicle conflict risk identification has become a critical research focus for improving road traffic safety. To address the discrepancies between microscopic traffic simulation outputs and real-world traffic flow characteristics caused by stochastic factors, this study proposes a vehicle conflict risk identification framework based on an enhanced intelligent driver model (IDM). Through VISSIM secondary development and scenario calibration, a simulation environment was constructed to replicate real-world road test conditions. Multi-vehicle trajectory data were employed to calibrate the IDM parameters. The conventional IDM was further improved by integrating driver-state variables and braking dynamics, while the inverse time to collision (ITTC) was adopted as the primary metric for collision risk assessment. Three risk levels were defined: potential collision (PC), general collision (GC), and serious collision (SC). The experimental results demonstrated strong alignment between the enhanced model and VISSIM simulations in vehicle speed and headway calibration, achieving classification accuracy rates exceeding 92.71%. The ITTC thresholds (0.25/s and 0.48/s) effectively differentiated between risk levels. This research provides theoretical and technical foundations for dynamic vehicle conflict risk identification and offers actionable insights for safety-critical decision making in intelligent driving systems.

1. Introduction

With the rapid advancement of global urbanization, the proportion of urban population worldwide exceeded 57% in 2023 [1]. This growth has led to an explosive increase in transportation demand and the overloading of road networks. Consequently, traffic flow complexity has risen exponentially, characterized by frequent acceleration and deceleration behaviors due to higher vehicle density [2], the spatiotemporal interweaving of multi-modal transportation [3] (including motor vehicles, non-motorized vehicles, and pedestrians), and the cascading effects of sudden traffic events such as congestion and accidents [4]. This complex dynamic system has exacerbated road safety challenges. According to the World Health Organization (WHO), road traffic accidents caused 1.19 million deaths globally in 2021, with an average of 15 fatalities per 100,000 people. Additionally, these accidents resulted in economic losses equivalent to 1–3% of the gross national product [5]. In 2023, motor vehicle traffic accidents in the United States resulted in a total of 40,990 fatalities, with a fatality rate of 1.26 deaths per 100 million vehicle miles traveled (VMT) [6]. Concurrently, in China, there were 254,738 road traffic accidents reported in the same year, leading to 60,028 deaths and direct economic losses amounting to 1.18 billion yuan [7]. These statistics underscore the urgency of research on vehicle conflict risk identification and prevention.
The essence of vehicle conflict risk lies in the overlap of spatiotemporal trajectories and the loss of control in interactions among traffic participants. Traditional traffic safety research primarily relies on post hoc analysis of historical accident data, which suffers from significant time lags and limited coverage of potential risk scenarios [8,9]. In highly dynamic urban road networks, conflict risks often arise from the coupling effects of multiple factors, including traffic flow dynamics, road conditions, weather, and driver behavior [10,11,12,13]. This complexity necessitates the integration of real-world experiments and microscopic simulations for accurate traffic conflict risk assessment and prediction. Recent studies have combined real-world experiments with microscopic simulations to predict vehicle conflict probabilities. Md Saddam Hussain et al. [14] utilized the VISSIM simulation platform to identify vehicle–pedestrian conflicts at urban intersections based on time to collision (TTC) and post-encroachment time (PET), achieving an accuracy rate exceeding 90% in conflict frequency identification. Somyoung Shin et al. [15] analyzed the influence mechanism of autonomous vehicles on traffic conflicts by optimizing VISSIM parameters using genetic algorithms. Changhe Liu et al. [16] conducted a collaborative simulation of Prescan and VISSIM to identify traffic risks at highway entrances and exits. Xinhao Zhang [17] employed VISSIM to study entrance roads with varying linear and traffic flow parameters, establishing a Poisson-based conflict prediction model. However, the inherent randomness of simulation tools often leads to deviations from real-world traffic characteristics. While microscopic traffic simulations can provide intuitive traffic flow representations, they struggle with dynamic adaptability in complex scenarios, failing to accurately model instantaneous changes and sudden events [18,19]. For example, car-following models in microscopic simulations, typically based on theoretical driver behavior [20,21], face limitations in parameter adjustments, hindering accurate conflict risk predictions under varying traffic conditions. In parallel, advancements in artificial intelligence (AI) have introduced innovative approaches for traffic conflict detection and risk prediction, leveraging techniques such as computer vision, deep learning, and predictive analytics to address the growing complexity of modern transportation systems [22]. For instance, Hussain et al. [23] proposed a bi-level framework for real-time crash risk forecasting at signalized intersections. This framework leverages extreme value modeling and deep learning to predict crash risks within the next 20–25 min, enabling proactive safety management. Iranmanesh, M. et al. [24] proposed a spatial-temporal framework using XGBoost and random forest to predict rural road crash risks, identifying traffic flow, road type, and weather as key factors, with 70% accuracy in high-risk segment-day forecasting. Similarly, Hussain et al. [25] proposed a hybrid framework that combines machine learning and extreme value theory to estimate crash risk from traffic conflicts. This framework employs isolation forest algorithms to identify extremes more efficiently than traditional sampling methods, significantly improving estimation accuracy and enabling practical applications in traffic safety. While these AI-driven methods demonstrate significant promise in enhancing conflict detection precision, their reliance on large-scale data and computational resources, combined with limited physical interpretability, may restrict their applicability in scenarios prioritizing real-time adaptability and model transparency.
In contrast, the intelligent driver model (IDM) [26] provides a computationally efficient and physically interpretable framework for simulating vehicle behavior in traffic flows, particularly in mixed traffic environments. Research has investigated its asymptotic stability and damping characteristics. By incorporating factors such as driving environment adaptability, vehicle performance coupling, and driver behavior integration, numerous scholars have enhanced the traditional IDM model, enabling it to more accurately replicate real-world vehicle-following behavior during simulations, as summarized in Table 1. Research on IDM models integrated with driving environment fitness optimization seeks to enhance dynamic responsiveness to complex traffic scenarios, particularly addressing environmental interaction challenges such as mixed traffic flow and lane-changing behavior. For instance, Yi, Z.-w. et al. [27] introduced a back-looking distance driver model to improve perception of the overall driving environment. This model incorporates the expected following distance in homogeneous connected and autonomous vehicle (CAV) environments and employs linear stability theory to analyze stability conditions against small perturbations in homogeneous traffic flow, demonstrating advantages in maintaining string stability. Similarly, Abdulrahman Alhariqi et al. [28] developed an adaptive IDM that dynamically adjusts its parameters based on real-time traffic conditions, enhancing the simulated driving behavior of autonomous vehicles, especially in modeling main-lane vehicle responses to lane-changing maneuvers on highways. Additionally, Dustin Holley et al. [29] implemented the IDM constant acceleration heuristic as the acceleration output, targeting both the lead actor and related merge actors to determine the maximum induced deceleration, thereby improving the realism of simulated vehicle responses to lane-changing scenarios. In the study of IDM modeling incorporating vehicle performance, researchers have enhanced the model’s capability to represent the mechanical responses of heterogeneous vehicles by integrating vehicle dynamics. For example, based on a comprehensive analysis of the IDM’s asymptotic stability and damping properties, Zhi Zhou et al. [30] introduced adaptive coefficients to dynamically adjust the acceleration control function of following vehicles in real time, using the speed and travel time of the preceding vehicle, thereby improving platoon safety. Similarly, Xiao, Xinping et al. [31] combined driving force concepts, the IDM, and the generalized autoregressive conditional heteroskedasticity model to develop a novel car-following model. This model’s forward predictions closely match actual acceleration changes and can effectively predict dangerous driving behaviors. Additionally, F. Wu. et al. [32] proposed an improved composite network based on the residual dense module to output the following speed through driving-state analysis. By integrating the IDM through optimal weight theory, a hybrid-drive car-following model was established, demonstrating higher traffic efficiency and the ability to capture asymmetric driving characteristics. In studies incorporating driver characteristics, the influence of human factors on following behavior has been analyzed by quantifying psychological states and driving behavior traits. For instance, Tanveer, H. et al. [33] incorporated a quantified driver panic factor into the IDM to simulate acceleration behavior under panic conditions, revealing a gradual decrease in driver speed as the panic factor increases. Furthermore, Sharma, A. et al. [34] developed an IDM tailored to simulate bus-driver behavior, accounting for multi-vehicle precognition and stimulus perception. Parameter calibration results confirmed that the modified IDM provides realistic interpretations of bus-driving behavior.
Key factors such as reaction delays in hazardous situations, psychological pressure, and external environmental interference remain inadequately addressed. Particularly in mixed traffic flows with significant speed variations, the IDM model often exhibits unrealistic sharp speed fluctuations, leading to distorted simulation results and compromised risk assessment accuracy. To address these limitations, this study proposes an enhanced vehicle conflict risk identification method based on an improved intelligent driver model (IDM). First, leveraging VISSIM secondary development and scenario calibration techniques, a simulation platform aligned with the actual road test environment (Zhongyuan Avenue in Harbin, China) was constructed, with optimized speed distribution and driving behavior parameters. Second, the driver-state factor and the rear vehicle braking variable were incorporated into the traditional IDM to refine the calculation of the following vehicle’s acceleration, thereby correcting the safety distance calculation logic. The driver-state variable quantifies the driver’s cognitive and physiological states during driving, simulating acceleration and deceleration behaviors under different conditions. The braking dynamics variable models the vehicle’s response to deceleration or stopping of the leading vehicle. These enhancements improve the dynamic adaptability of the model in complex traffic flows and better capture the uncertainty inherent in real-world driving scenarios. Finally, a conflict risk classification index was developed based on the inverse time to collision (ITTC), and statistical verification combined with threshold analysis was employed to achieve quantitative risk level identification.
The remainder of this paper is organized as follows: Section 2 introduces the test section and the methodology for constructing the VISSIM simulation environment, along with the theoretical framework of the improved IDM model. Section 3 presents the experimental results and discusses the effectiveness of the proposed risk identification method. Section 4 concludes the study and outlines both the limitations and future research directions.

2. Methodology

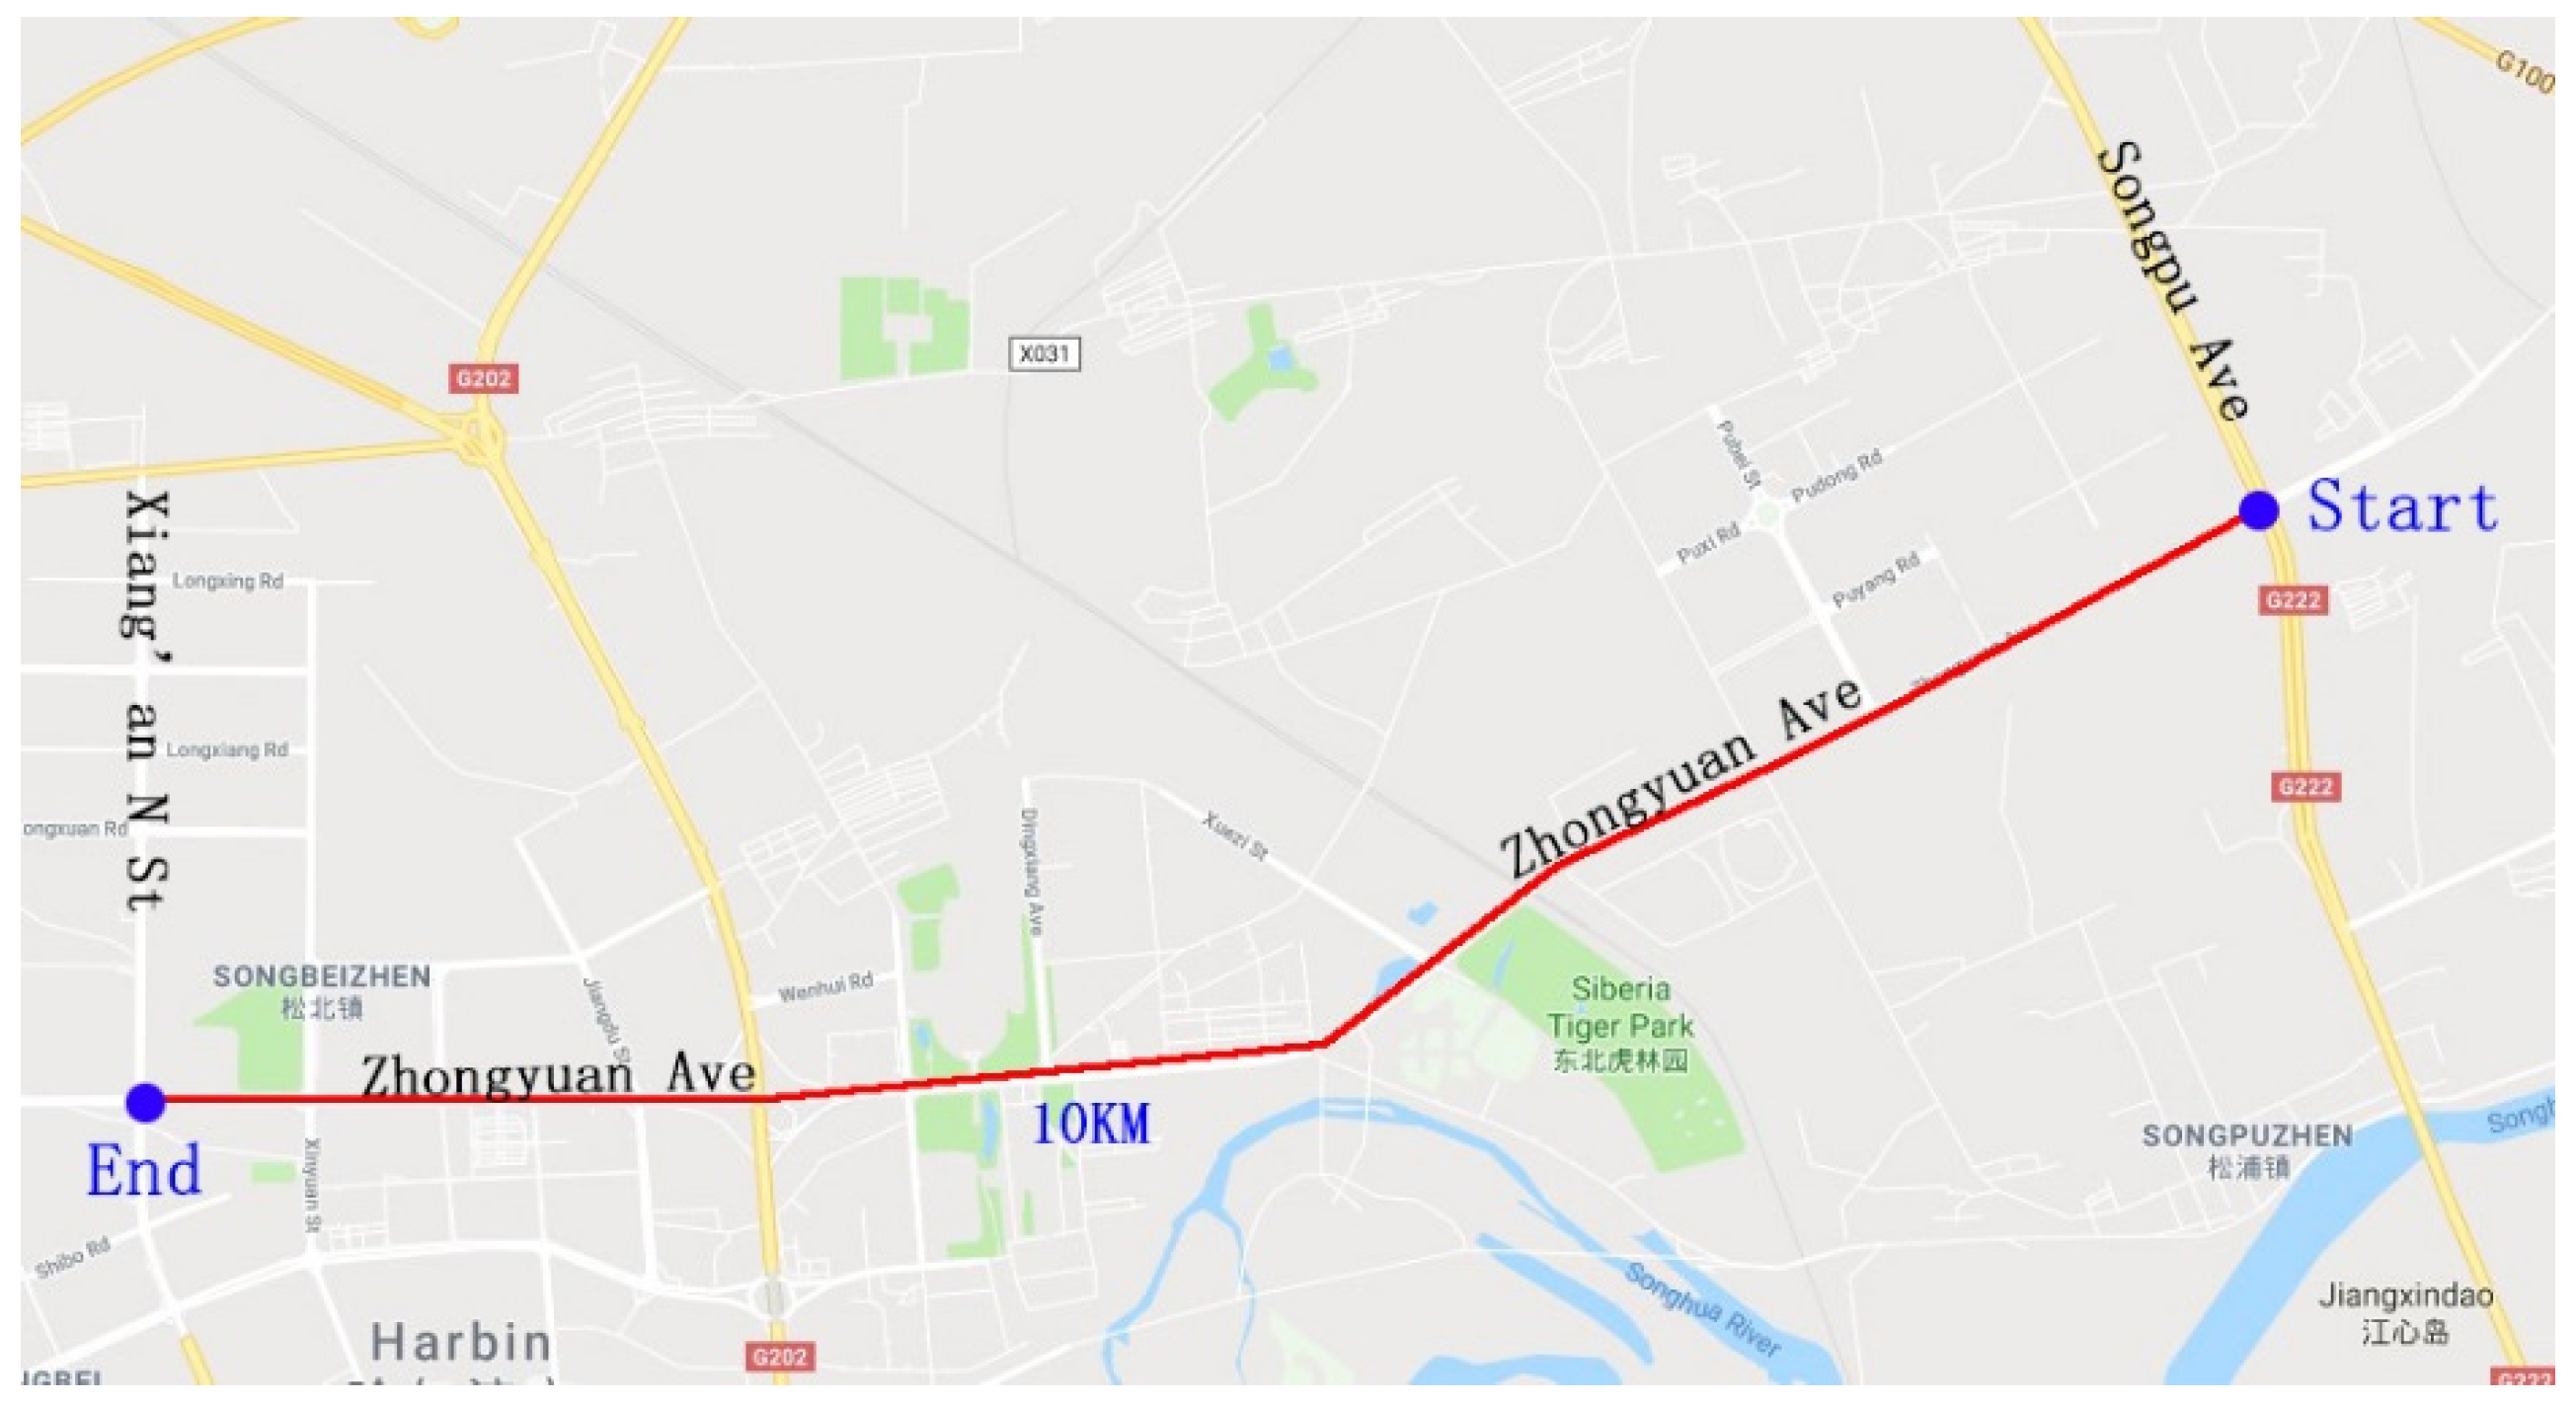
2.1. Experimental Road Sections

The field experiment for this study was conducted along a 10 km segment of Zhongyuan Avenue, a major urban arterial road in Harbin, China (Figure 1). The tested route spanned from the intersection of Songpu Bridge and Zhongyuan Avenue to the junction of Zhongyuan Avenue and Xiang’an North Street. Zhongyuan Avenue was selected as the test site due to its representative traffic conditions, including high traffic volume, frequent acceleration and deceleration maneuvers, and significant congestion during peak hours, which are typical characteristics of urban arterial roads in China. Additionally, this section has been identified by local traffic authorities as a high-risk zone for traffic accidents, making it an ideal location for analyzing car-following behavior and collision risks. The roadway features a two-way, six-lane configuration divided by a central median, providing diverse driving scenarios for data collection. The experiment was conducted under clear weather conditions, with moderate temperatures and optimal visibility, ensuring minimal environmental interference.

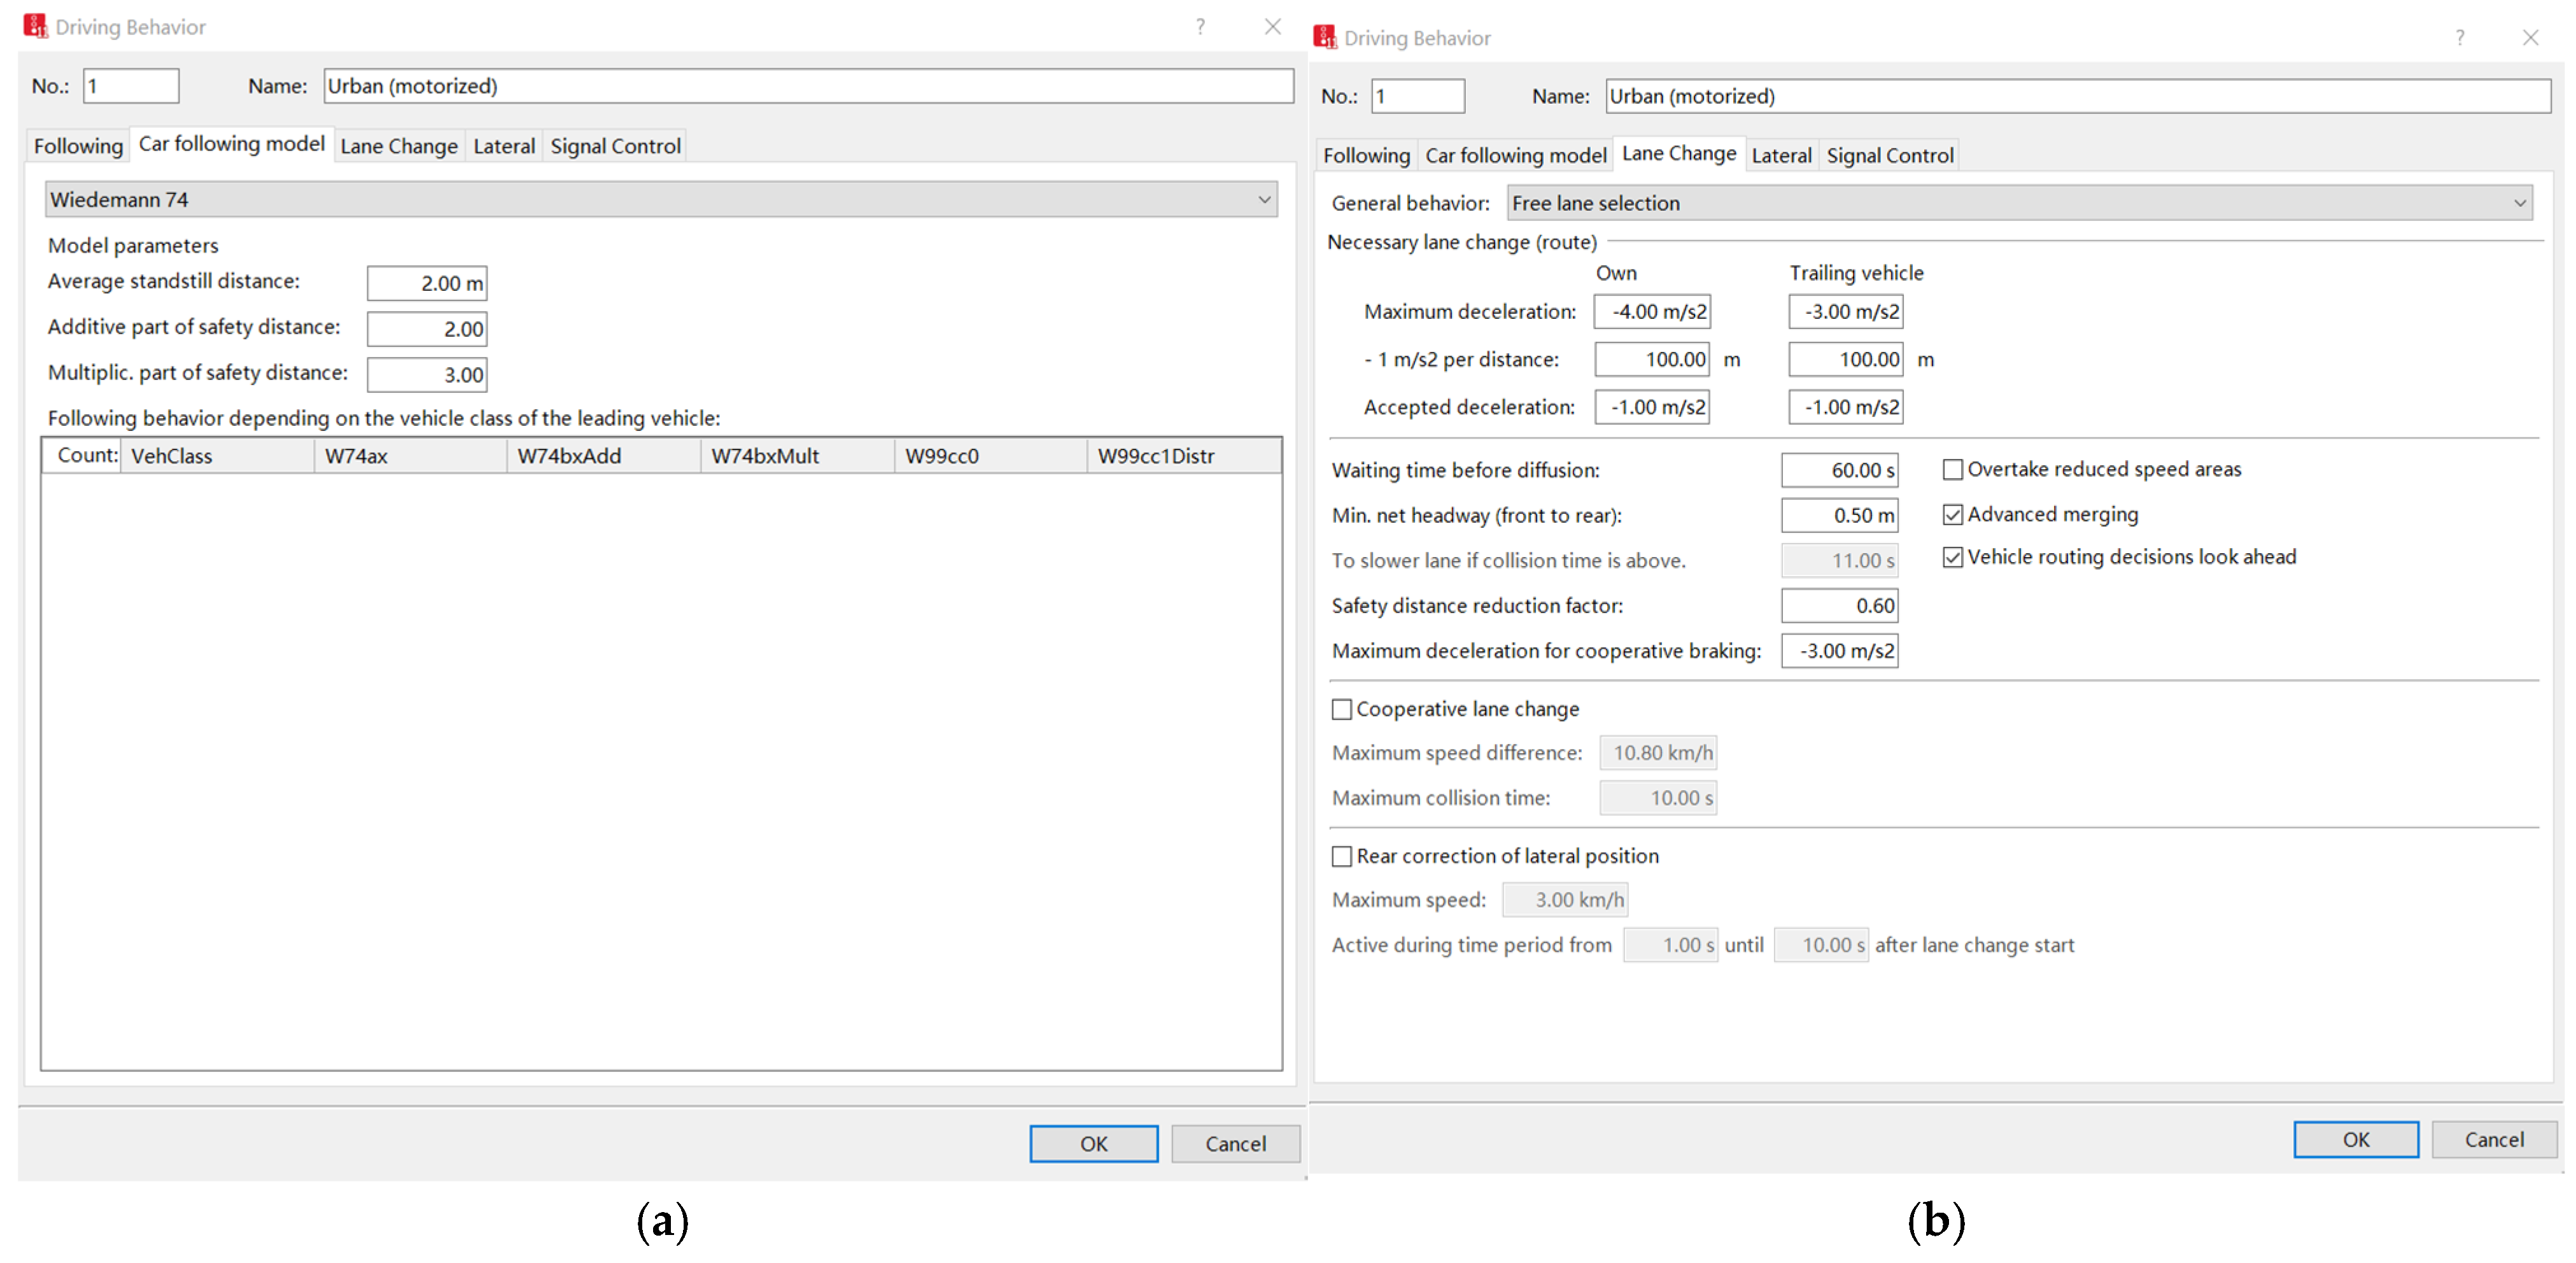
2.2. VISSIM Scenario Development

VISSIM is a micro-traffic simulation system simulation tool developed by PTV, and it enables the modeling and analysis of traffic flow dynamics on urban roads and highways under diverse traffic conditions [35]. While the native VISSIM platform extracts basic vehicle travel speeds, its secondary development interfaces allow calculation of time headways and relative speeds between vehicles within the simulated network. These parameters were integrated into the intelligent driver model to derive conflict risk indicators. The methodological workflow of VISSIM secondary development is illustrated in Figure 2.
From the research objectives of this paper, the VISSIM simulation framework incorporates the Wiedemann car-following model, a physiological–psychological driver behavior model originally proposed in 1974. Among them, Wiedemann74 is generally applicable to road traffic within cities, and Wiedemann99 is applicable to intercity highways and expressways. Within this model, speed distribution parameters critically influence road network capacity and operational efficiency. Vehicles initiate overtaking maneuvers when their desired speed exceeds their current speed, provided safe conditions are maintained. Figure 3 illustrates the calibration of desired speed distributions based on empirical driving data, ensuring alignment with real-world traffic dynamics.
The horizontal axis denotes the desired vehicle speed, while the vertical axis corresponds to the normalized cumulative frequency (ranging from 0 to 1). To better approximate the stochasticity of real-world traffic, speeds during acceleration and deceleration phases were excluded from the cumulative distribution function (CDF) analysis. A speed threshold of 35 km/h was established, with a sigmoidal distribution centered on the median speed.
The study area—Harbin’s urban road network—was modeled by sequentially calibrating road geometry, vehicle characteristics, and signal timing parameters to replicate real-world conditions. Driver distraction probability was parameterized at 15%. The Wiedemann 74 car-following model, implemented in the simulation’s behavioral module, calculates inter-vehicle distances (d), as defined in Equations (1) and (2).
d = a x + b x
b x = ( b x _ a d d + b x _ m u l t × z ) × v
where a x is the average parking spacing, with a range of ± 1 m. In this paper, the value is 2.0 m; v is the vehicle speed in m / s ; z is a value between [0, 1], with 0.5 as the average value of a standard normal distribution and a standard deviation of 0.15; b x _ a d d is the additional part of the safety distance, and the value in this paper is 2; and b x _ m u l t is the multiple part of the safety distance, and the value in this paper is 3.
The key parameters governing urban traffic behavior encompass time headway, following-state entry thresholds, and following sensitivity variables, with their typological classifications and operational ranges detailed in Table 2. Calibration settings for the car-following model parameters are illustrated in Figure 4a. Among them, average parking distance refers to the minimum separation distance between stationary lead and following vehicles. The time headway, measured in seconds (s), quantifies the temporal interval between consecutive vehicles passing a fixed point. This metric serves as a critical indicator of traffic flow density and driver aggressiveness, where smaller values typically correspond to denser traffic or riskier driving behaviors. Follow-up variables represent a microscopic traffic simulation parameter quantifying a driver’s responsiveness to changes in the preceding vehicle’s speed, acceleration, and spacing. This variable directly influences inter-vehicle safety margins and traffic flow stability. The aggressive following threshold defines the critical headway or relative speed at which drivers transition to high-risk maneuvers, such as increased acceleration rates or reduced safety margins, to minimize gaps with preceding vehicles. The passive following threshold represents the headway or speed differential triggering conservative driving strategies, including deceleration or extended safety buffers, to mitigate collision risks. These parameters collectively determine vehicular interaction dynamics and conflict probabilities in simulated traffic environments.
Lane-changing rules permit unrestricted lane selection using the parameter calibration methodologies detailed in Figure 4b. The key parameters and their definitions are as follows: Acceptable deceleration is the maximum deceleration tolerated by drivers during path-dependent lane changes, accounting for vehicle mechanical limits and trailing vehicle interactions. Minimum headway is the critical inter-vehicle spacing required to safely complete overtaking maneuvers, irrespective of initial kinematic conditions. Safety distance reduction factor is a scaling coefficient influencing lane-change initiation decisions and real-time safety margin adjustments during lateral transitions. Maximum deceleration of coordinated braking is the peak deceleration drivers accept when yielding to lane-changing vehicles to maintain traffic harmony. These parameters collectively govern lane-change feasibility and risk mitigation in dynamic traffic scenarios.
The schematic diagram of the simulated road section is shown in Figure 5. During the simulation, the vehicle’s speed, acceleration, and headway are monitored, and the above traffic flow parameters are averaged over 5 s.

2.3. Improved Intelligent Driver Model
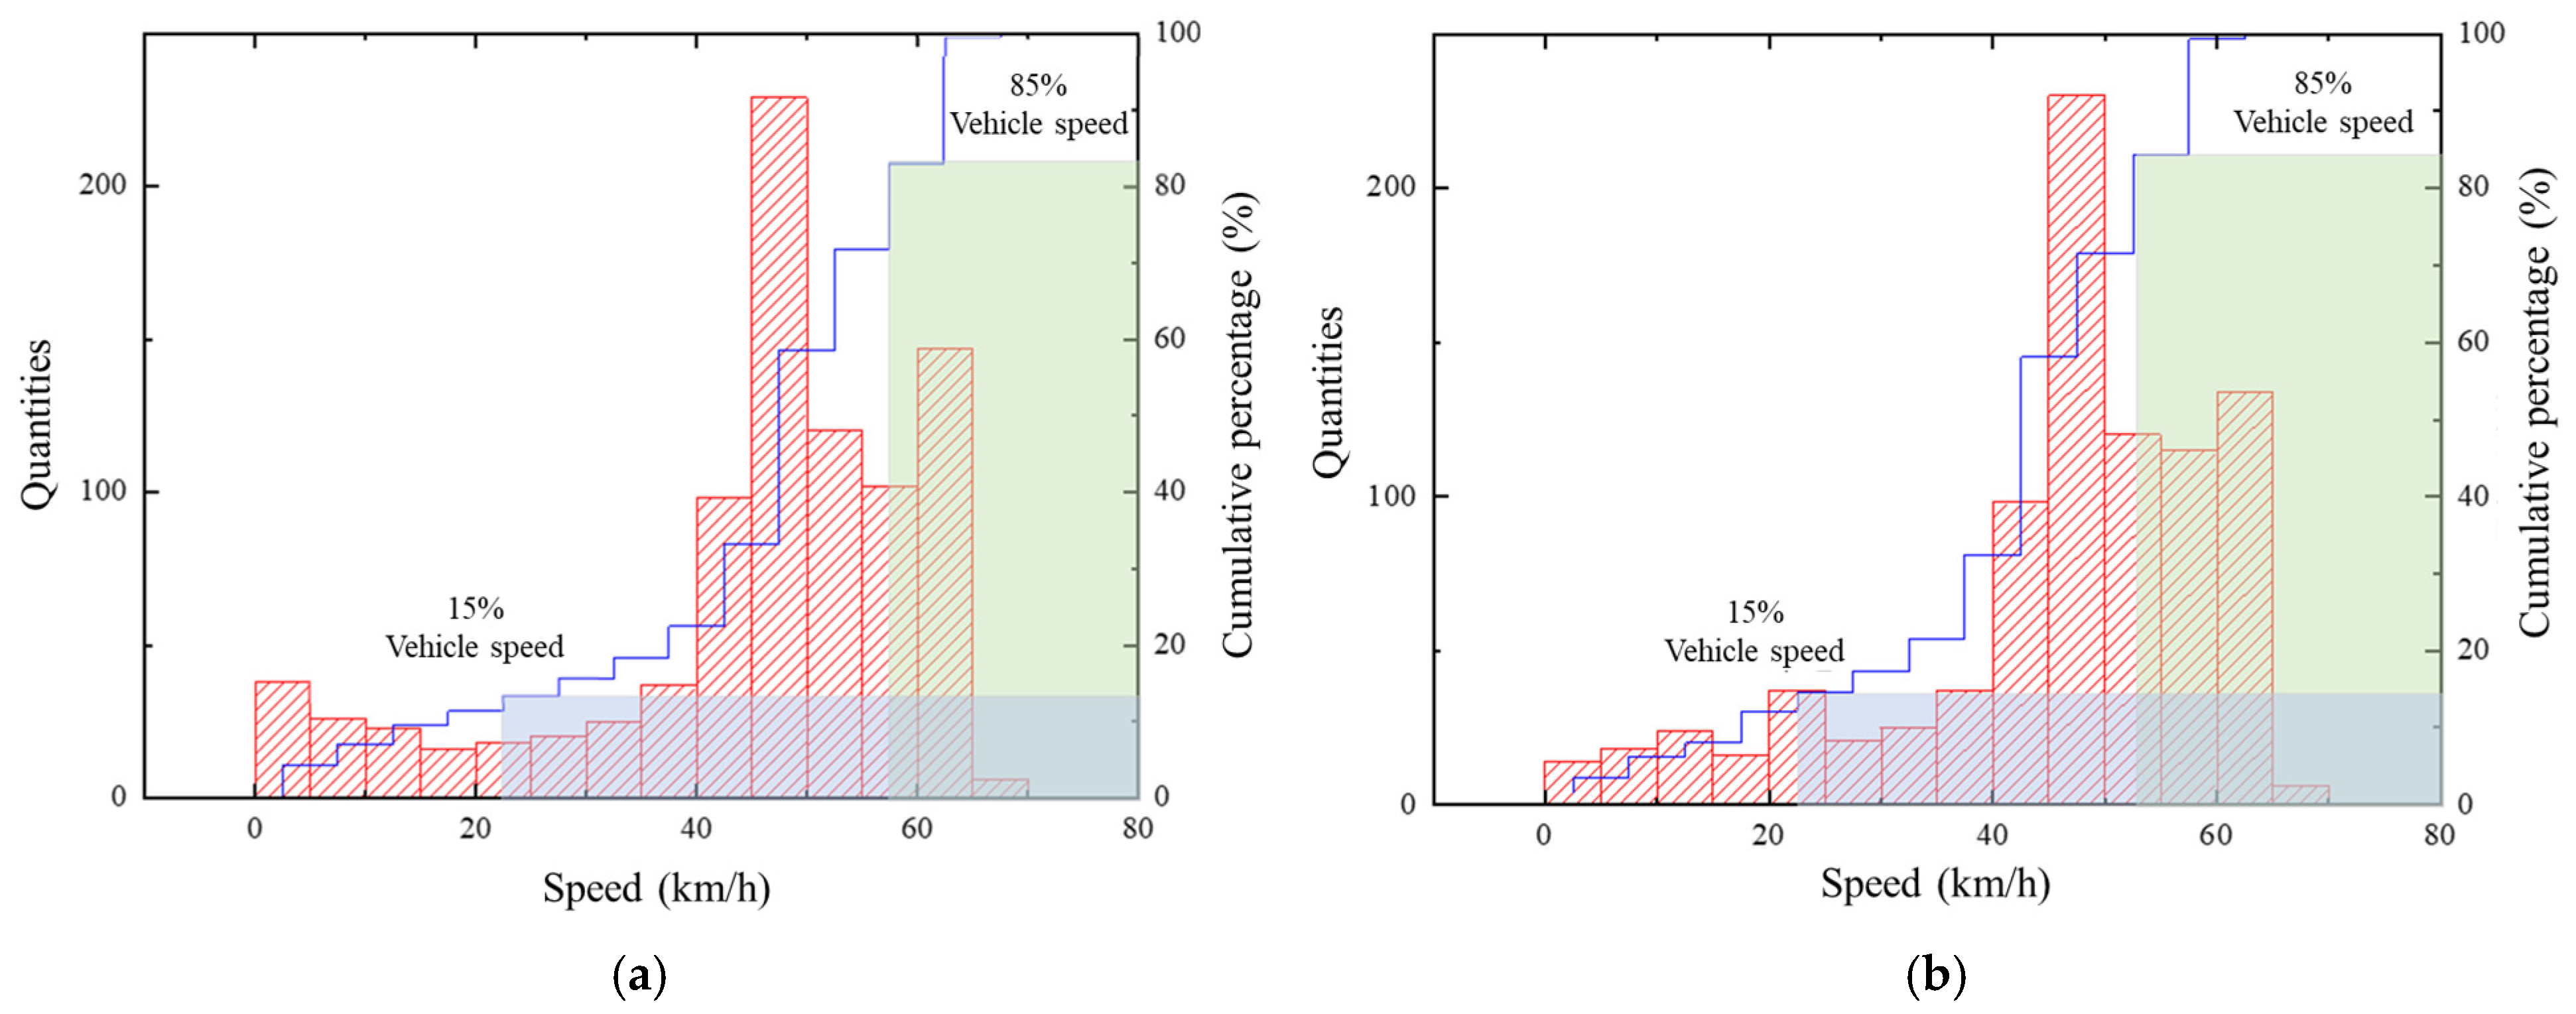
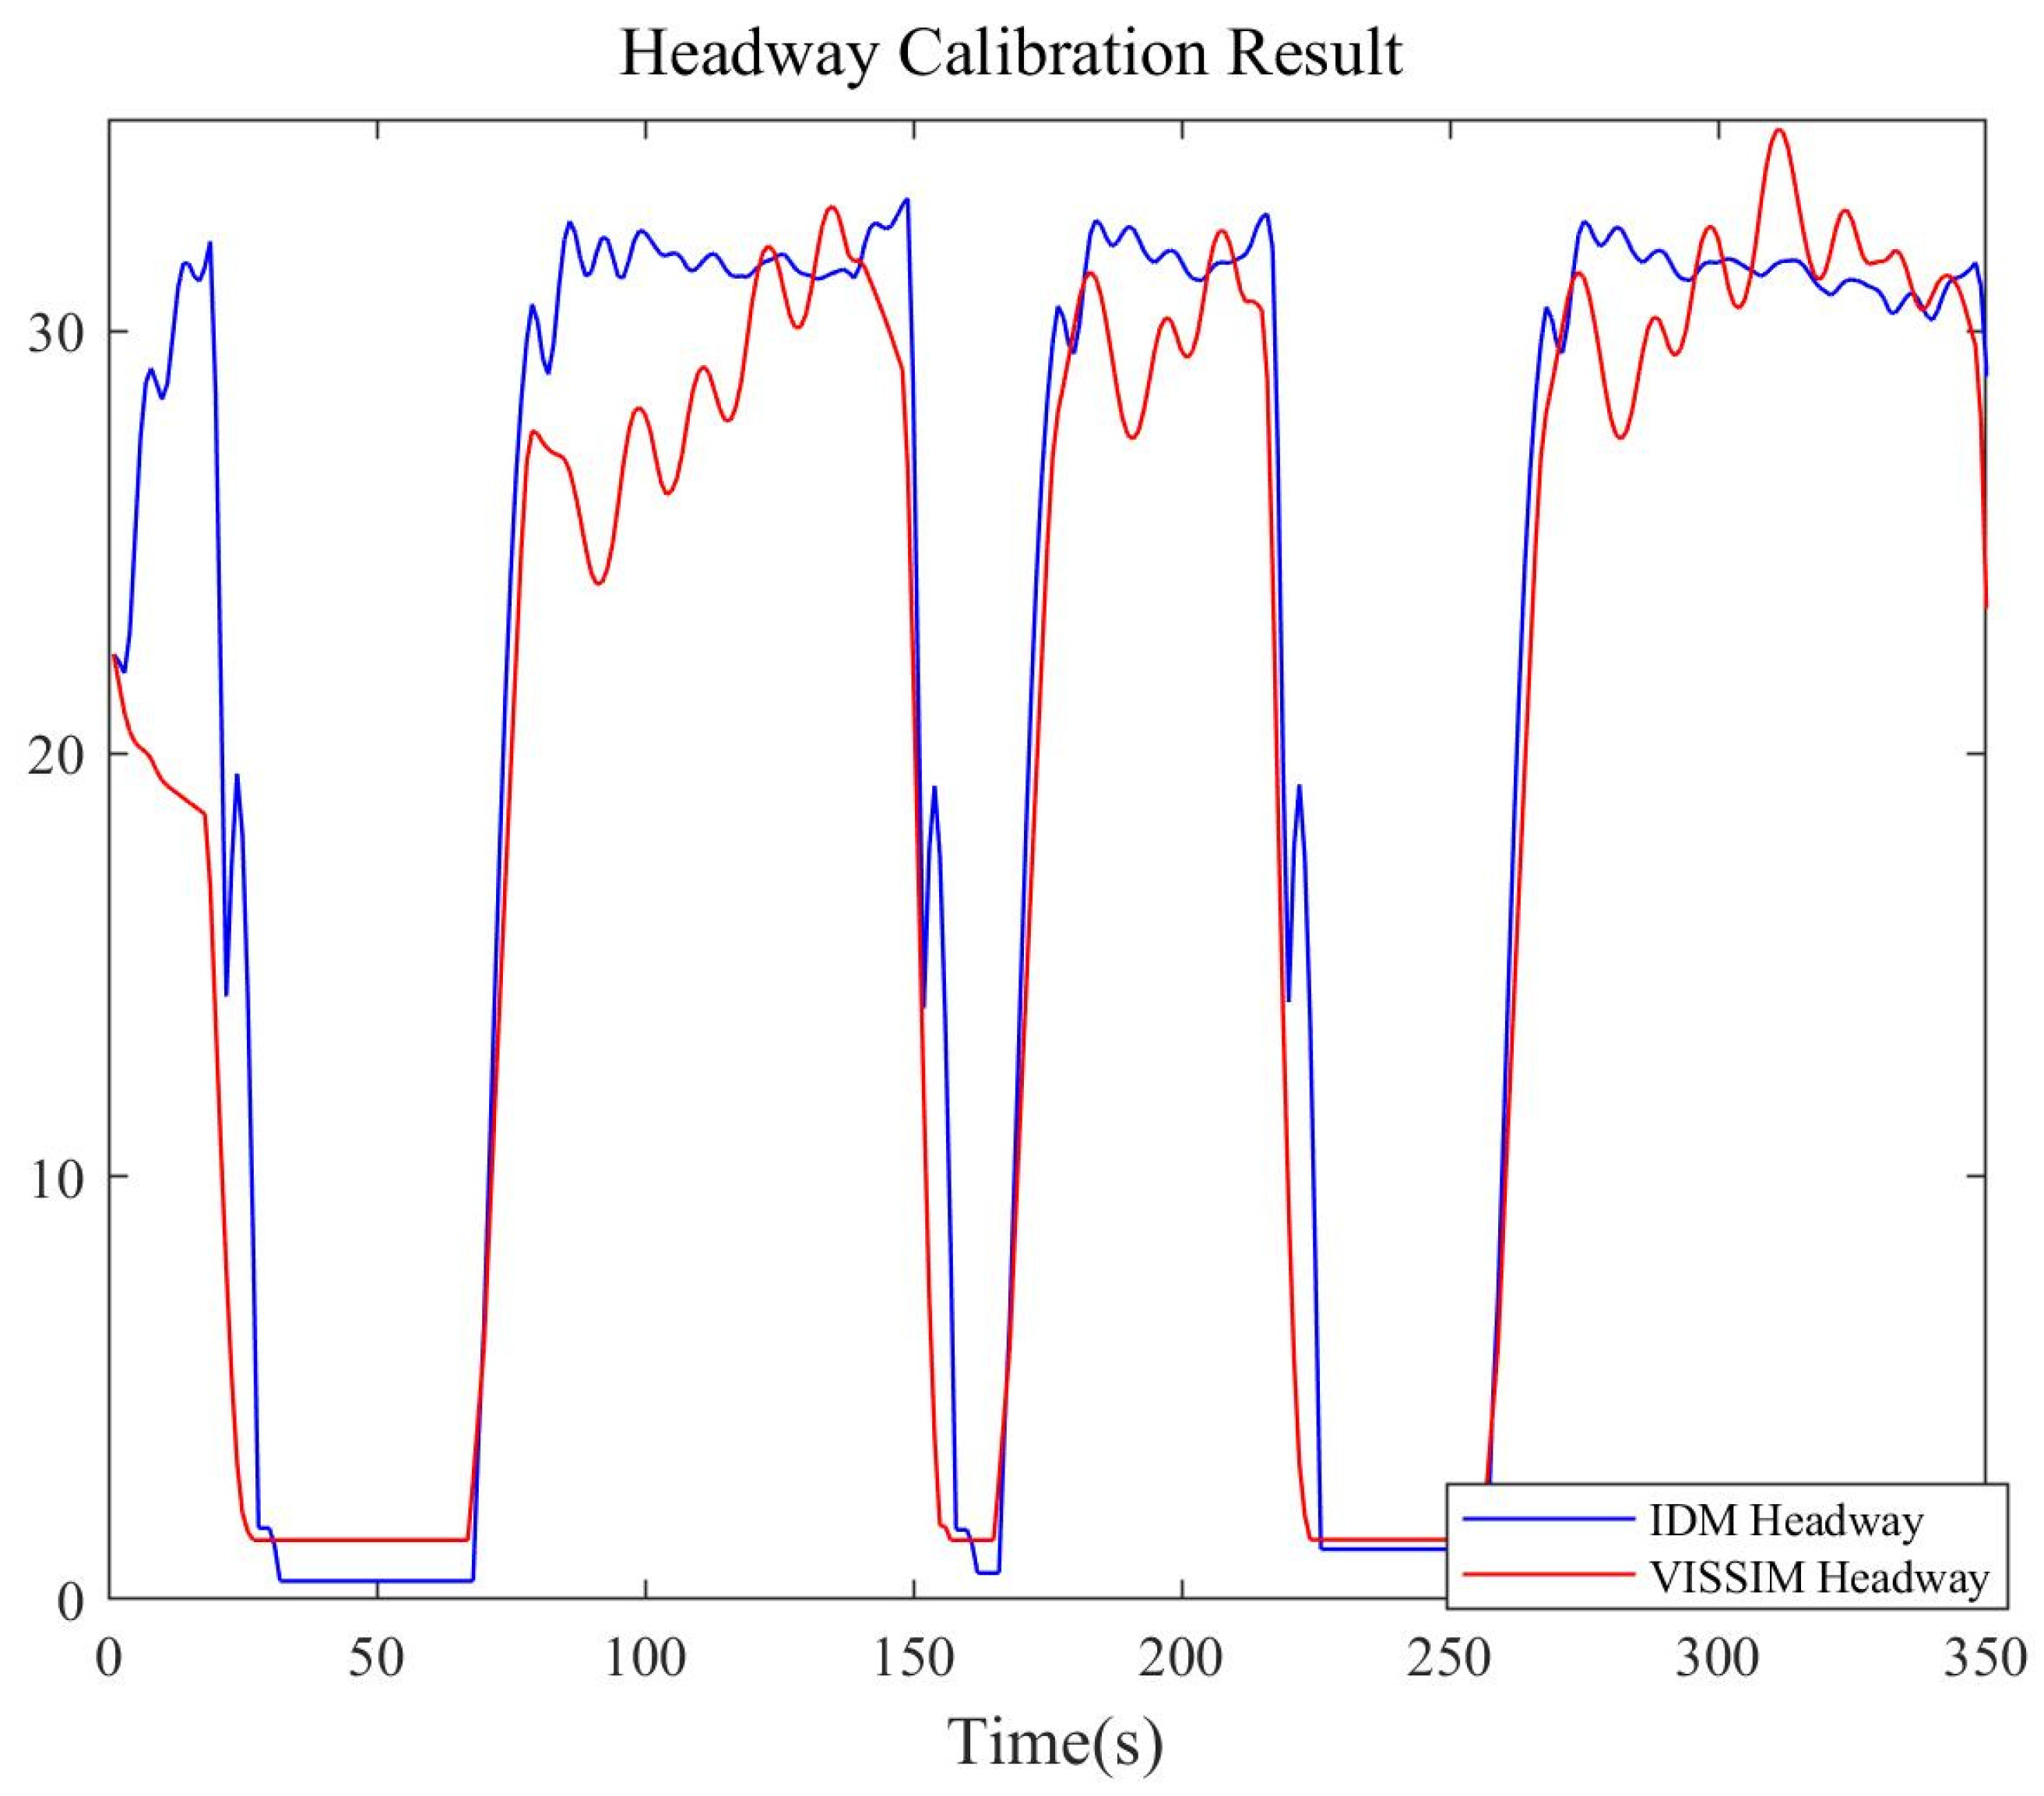
The vehicle-following model is a valuable tool for studying traffic flow characteristics in depth and has been extensively applied in traffic risk research. In 2002, Helbing et al. [26] introduced the intelligent driver model (IDM), which utilizes a minimal set of meaningful parameters to ensure consistency with empirical observations. The model’s parameters are easily calibrated and capable of capturing real-time dynamic changes in vehicle position and speed. Subsequently, Xiong et al. [36] enhanced the traditional IDM by incorporating additional factors, such as non-negative expected distance and driver reaction time. The specific formula is as follows:
v α · ( s α , v α , Δ v a ) = a 1 v α v 0 α δ s α s α 2
s α = s 0 α + s 1 α v α v 0 α + T α v α + v a Δ v a 2 a α b α
Here, α represents the vehicle index, v denotes the vehicle speed, Δ v is the speed difference between the current vehicle and the preceding vehicle, v 0 is the desired speed, s is the distance between the current vehicle and the preceding vehicle, s is the desired distance under the current driving state, T is the reaction time, a is the maximum acceleration, b is the comfortable deceleration, δ is the acceleration exponent, s 0 is the static safety distance parameter, and s 1 is the speed-dependent safety distance parameter.
When in free traffic flow, the distance between the vehicle and the preceding vehicle is large, i.e., s α v α , Δ v a s α 2 0 , and the acceleration is determined by the free-flow state, causing the vehicle speed to gradually converge toward the desired speed v 0 . However, when the IDM model is applied to mixed traffic flow conditions, it tends to generate a safe distance to prevent conflicts or collisions. This often results in an unrealistically large deceleration, which undermines the model’s overall effectiveness. To address this limitation, this study proposes an improved model, as illustrated in Equation (5).
2 t 2 x α = a α 1 t x α v α 0 δ s α 2 ε 2 + s α 2 + ( h f ) i a α 1 1 t x α 1 v α 1 0 δ s α 1 2 ε 2 + s α 1 2
The formula incorporates direct safety factors related to both the vehicle itself and the rear vehicle. Here, h f represents the driver factor, which is determined based on the driver’s state and is set to 1 in this study [37]; then, the influence of the front and rear vehicles can be considered to avoid vibration in speed and acceleration. Meanwhile, ε denotes the braking variable. When the vehicle begins to decelerate or stop, the speed of the rear vehicle also gradually decreases. When it comes to a sufficiently low speed, a critical condition arises, as demonstrated in Equations (6) and (7). It is evident that ε is directly influenced by the static safety distance and the state of the vehicle itself.
b max v α ·   = a α 1 s 0 α ε 2
ε s 0 α 1 b max a α
In a multi-vehicle traffic system, assuming that there are N vehicles in the system, Equation (5) can be rewritten as follows:
A ¯ ¯ 1   x ¨ ( t ) + V ¯ ¯ 1 f _ 1 [ x ˙ ( t ) ] + S ¯ ¯ f _ 2 [ x ( t ) ] = 1 _ ( t ) + h _ ( t )
This can be incorporated into the following formula:
A 1 =   1 a 1 ,   1 a 2 ,   ,   1 a n   ;
V ¯ ¯ 1 =   1 ( v 1 0 ) 4 + h 1 ( t ) ( v 2 0 ) 4 1 ( v i 0 ) 4 + h i ( t ) ( v i + 1 0 ) 4 1 ( v n 0 ) 4 ;
S ¯ ¯ = ( s 1 ) 2 h 1 ( t ) ( s 2 ) 2 ( s i ) 2 h i ( t ) ( s i + 1 ) 2 ( s n ) 2 ;
  f _ 1 [ x ˙ ( t ) ] =   x ˙ 1 4 x ˙ 2 4 x ˙ n 4 ;   f _ 2 [ x ( t ) ] =   1 ε 1 2 + s 1 2 1 ε 2 2 + s 2 2 1 ε n 2 + s n 2 ;   1 _ ( t ) =   1 ( t ) 1 ( t ) 1 ( t ) ;   h _ ( t ) =   h 1 ( t ) h 2 ( t ) h n ( t ) ;  

3. Result

In order to make the established VISSIM simulation environment closer to the real scene of the road test experiment, it is necessary to check the speed distribution obtained by the simulation environment and the actual speed distribution. When the two distributions are close, it can be considered that the established VISSIM can simulate the real environment.
To ensure the established VISSIM simulation environment aligns closely with real-world road test conditions, the simulated speed distribution was rigorously validated against empirical speed distribution data. As illustrated in Figure 6, a close match between the two distributions confirms that the VISSIM model accurately replicates real-world traffic dynamics.
As illustrated in Figure 7, parameter optimization involved comparing key statistical metrics—the 15th percentile, median, and 85th percentile of vehicle speeds—as well as the morphological alignment of the distribution histograms. Upon achieving convergence between simulated and empirical distributions, the calibration process was deemed complete. This validation confirms that the VISSIM simulation realistically captures traffic network behavior, including vehicle acceleration and deceleration patterns.
The calibrated VISSIM data were subsequently integrated into the enhanced intelligent driver model (IDM). To ensure the IDM accurately replicates real-world car-following behavior, critical parameters—including front-vehice speed and headway—were iteratively calibrated against VISSIM outputs. Given the dynamic variability of preceding vehicle speeds, model validity was confirmed only after achieving close alignment between simulated and empirical results. The calibration outcomes are presented in Figure 8 and Figure 9.
The inclusion of traffic signal control in the simulation introduced distinct behavioral patterns, such as periodic speed deceleration to 0 with corresponding waiting intervals and minimized inter-vehicle spacing. These phenomena, evident in the calibrated model, demonstrate its capacity to reflect real-world traffic scenarios under signalized conditions. The finalized simulation parameters are summarized in Table 3.
The spatial-temporal diagram of the traffic flow at different times is shown in Figure 10.
When two vehicles in the same lane are in close proximity, a collision will occur if the following vehicle exceeds the speed of the preceding vehicle and no active avoidance measures are taken. The TTC is defined as the time required for a collision to occur if both vehicles maintain their current states (e.g., speed and distance). It is calculated as the ratio of the relative distance to the relative speed between the two vehicles and is widely used as a metric for assessing traffic conflicts. However, when the speed difference between the two vehicles is minimal during car-following scenarios, the TTC model becomes ineffective. To address this limitation, the ITTC is introduced as a more robust indicator. ITTC values typically range between 0 and 1, with units of 1/s. The frequency distribution of ITTC was fitted to a negative exponential distribution, as illustrated in Figure 11.
The median and 85th percentile of the ITTC distribution were selected as thresholds for potential conflict risk (indicating safe following conditions) and general conflict risk, respectively. The corresponding ITTC thresholds are 0.25 (1/s) and 0.48 (1/s), with equivalent TTC values of 4 s and 2.1 s, respectively. The classification of vehicle conflict risk levels and their corresponding thresholds are summarized in Table 4.
To validate the selected conflict thresholds, a random seed was generated within the calibrated VISSIM network, and 51,936 valid samples were extracted for comparative analysis based on ITTC results, as shown in Table 5. The accuracy of identifying potential conflict risks and general conflict risks was 96.63% and 97.72%, respectively. The accuracy of identifying serious conflict risks reached 92.71%. The error time was TTC 0.03 s, so it can be considered that the risk levels and thresholds set in this paper are valid.

4. Discussion

The proposed enhanced IDM offers a robust framework for traffic conflict risk identification; however, several limitations and opportunities for refinement warrant discussion. In this section, we discuss these across the following three areas: enhancement of model realism and robustness, integration with intelligent systems, and adaptation to diverse traffic environments:

4.1. Enhancement of Model Realism and Robustness

In our research, while the proposed model incorporates a driver-state factor to account for cognitive delays and stress responses, it does not fully capture the inherent variability in human driving behavior. Individual differences in reaction times and unexpected road conditions remain oversimplified, such as delayed responses due to distractions or fatigue and sudden obstacles. Future iterations would integrate stochastic modeling and machine learning techniques to dynamically adjust reaction time parameters based on real-time behavioral data, thereby enhancing adaptability to diverse driver profiles. In addition to driver variability, our current work only considered driving environments under clear weather conditions. Environmental factors can significantly alter braking dynamics and vehicle interactions. These factors include adverse weather (rain, snow, and icy roads) and varying road surface conditions. These changes would compromise the model’s accuracy. To address this issue, our future work plans to incorporate real-time environmental data by using V2X communication. For instance, V2X-enabled systems could share critical information about sudden braking, lane changes, and intersection movements, which is particularly crucial in scenarios like heavy rain, snow, or icy roads, where friction coefficients and visibility are drastically reduced. This integration would allow dynamic updates to IDM parameters, such as adjusting safety distances based on real-time friction coefficients from road sensors or incorporating weather forecasts (e.g., snowfall intensity or ice formation alerts) transmitted via V2X communication. By refining braking variables and safety distance calculations under these adverse conditions, the model’s adaptability and predictive capabilities in extreme weather scenarios would be improved. Furthermore, while ITTC effectively quantifies collision risk, its reliance on time-to-collision thresholds may overlook contextual factors like road geometry or driver intent. Complementing ITTC with multi-dimensional metrics could improve reliability, such as the deceleration rate to avoid a crash and surrogate safety measures derived from vehicle kinematics. Future work will focus on developing hybrid approaches that combine ITTC with data-driven classifiers, such as random forests. The improved method would enable a more comprehensive analysis of collision risks.

4.2. Integration with Intelligent Systems

Our work demonstrates strong potential for implementation in intelligent transportation networks and adaptive traffic signal systems. By integrating ITTC-based risk levels into real-time traffic management platforms, traffic authorities could prioritize signal phases at high-risk intersections or dynamically reroute traffic to mitigate risks. For instance, real-time risk thresholds could trigger warnings in connected vehicle networks, enabling proactive speed adjustments and effectively reducing collision risks. Additionally, the improved IDM and ITTC-based risk assessment framework could be incorporated into adaptive traffic signal control systems, allowing for dynamic adjustments to signal timing based on real-time conflict risk levels. This would enhance traffic flow efficiency. Building on this, the enhanced IDM could also be integrated into autonomous vehicle decision-making processes. By incorporating real-time conflict risk assessments, autonomous vehicles could adjust their driving strategies—such as speed and following distance—to minimize collision risks. This application would require further refinement to account for the unique decision-making logic of autonomous systems, ensuring seamless interaction with other vehicles and infrastructure. Furthermore, the model could serve as a core component of intelligent transportation networks. For example, integrating ITTC predictions with signal optimization algorithms could minimize conflict points during peak hours. Additionally, coupling the model with edge computing infrastructure would enable localized risk assessments, reducing latency and enhancing real-time responsiveness. This integration would not only improve traffic flow but also support the development of adaptive traffic signal systems that dynamically adjust to changing traffic conditions.

4.3. Adaptation to Diverse Traffic Environments

The model’s validation focused on Zhongyuan Avenue, a high-traffic arterial road, demonstrating its effectiveness in this specific context. However, its performance in other urban settings requires further testing, including intersections with complex pedestrian flows, roundabouts, and low-speed residential zones. In future work, we will focus on scenario-specific calibrations to enhance the model’s generalizability across diverse urban traffic scenarios. This includes adjusting h f for intersection priority rules, pedestrian density, and other dynamic factors. Additionally, the current simulations primarily focus on vehicle-to-vehicle interactions but exclude pedestrians and cyclists, limiting their applicability to mixed traffic environments. To address this gap, we plan to extend the model with modules for vulnerable road-user trajectory prediction. For example, pedestrian crossing intent inferred from smartphone data or cyclist speed profiles could be incorporated into the IDM’s safety distance logic. This extension will enable comprehensive risk assessments, ensuring the model accurately captures interactions between vehicles, pedestrians, and cyclists in complex urban environments.

5. Conclusions

Accurate assessment and prediction of traffic conflict risks are critical priorities in traffic safety research. To address the deviations between simulation results and real-world traffic flow characteristics caused by the inherent randomness of microscopic traffic simulation tools, this study proposes a vehicle conflict risk identification method based on an improved intelligent driver model (IDM). A realistic traffic scenario was constructed using VISSIM 4.3 simulation software, with speed distribution calibrated to ensure high consistency between the simulated and real-world traffic environments. To account for the complexity of real-world driver decision making, the IDM was enhanced by integrating driver-state parameters and braking variables. Vehicle speed and headway data generated by VISSIM were input into the model, enabling parameter calibration through iterative optimization. Using the improved IDM, the inverse time to collision (ITTC) was calculated as the primary indicator for collision risk assessment. Three collision risk thresholds were established: potential conflict risk (ITTC < 0.25 1/s, TTC > 4 s), general conflict risk (0.25 1/s ≤ ITTC ≤ 0.48 1/s, 2.1 s ≤ TTC ≤ 4 s), and serious conflict risk (ITTC > 0.48 1/s, TTC < 2.1 s). The proposed conflict risk identification method was validated using a large sample dataset. The results demonstrate high accuracy: identification rates exceeded 95% for potential and general conflicts and reached 92.71% for serious conflicts. These findings confirm the method’s effectiveness and practicality. The study provides a theoretical foundation for real-time risk prediction and proactive collision avoidance strategy design in intelligent driving systems.
While the improved IDM framework proposed in this study advances traffic conflict risk identification, limitations persist in addressing driver behavior variability and the impacts of complex road environments and adverse weather conditions. As discussed above, our future work will focus on enhanced behavioral and environmental realism as well as integration with intelligent systems.

Author Contributions

Conceptualization, S.Q. and A.Z.; methodology, S.Q.; software, A.Z.; validation, A.Z.; formal analysis, S.Q.; investigation, A.Z.; resources, S.Q.; data curation, S.Q. and A.Z.; writing—original draft preparation, S.Q. and A.Z.; writing—review and editing, S.Q. and A.Z.; visualization, A.Z.; supervision, S.Q. All authors have read and agreed to the published version of the manuscript.

Funding

This research was supported by the Fujian Province Education System Philosophy and Social Science Research Project (JAS24028), Postdoctoral Fellowship Program of CPSF (GZC20240179).

Institutional Review Board Statement

Not applicable.

Informed Consent Statement

Not applicable.

Data Availability Statement

The data presented in this study are available on request from the corresponding author due to privacy reasons.

Conflicts of Interest

The authors declare no conflicts of interest.

References

  1. Urban Population (% of Total Population). Available online: https://data.worldbank.org.cn/indicator/SP.URB.TOTL.IN.ZS (accessed on 5 February 2025).
  2. Matin, A.; Dia, H. Impacts of connected and automated vehicles on road safety and efficiency: A systematic literature review. IEEE Trans. Intell. Transp. Syst. 2022, 24, 2705–2736. [Google Scholar] [CrossRef]
  3. Treiber, M.; Kesting, A. Traffic flow dynamics. In Traffic Flow Dynamics: Data, Models and Simulation; Springer: Berlin/Heidelberg, Germany, 2013; Volume 227, p. 228. [Google Scholar]
  4. Chen, Y.; Zhao, Y.; Wu, Y. Recent progress in air traffic flow management: A review. J. Air Transp. Manag. 2024, 116, 102573. [Google Scholar] [CrossRef]
  5. Global Status Report on Road Safety 2023. Available online: https://www.who.int/teams/social-determinants-of-health/safety-and-mobility/global-status-report-on-road-safety-2023 (accessed on 5 February 2025).
  6. Early Estimate of Motor Vehicle Traffic Fatalities in 2023. Available online: https://crashstats.nhtsa.dot.gov/Api/Public/ViewPublication/813561 (accessed on 25 February 2025).
  7. China Statistical Yearbook 2024. Available online: https://www.stats.gov.cn/sj/ndsj/2024/indexch.htm (accessed on 5 February 2025).
  8. Zou, X.; Vu, H.L.; Huang, H. Fifty years of accident analysis & prevention: A bibliometric and scientometric overview. Accid. Anal. Prev. 2020, 144, 105568. [Google Scholar] [PubMed]
  9. Koo, J.; Kim, S.; Kim, H.; Kim, Y.-H.; Yoon, E.S. A systematic approach towards accident analysis and prevention. Korean J. Chem. Eng. 2009, 26, 1476–1483. [Google Scholar] [CrossRef]
  10. Rahman, R.; Hasan, S.; Zaki, M.H. Towards reducing the number of crashes during hurricane evacuation: Assessing the potential safety impact of adaptive cruise control systems. Transp. Res. Part C Emerg. Technol. 2021, 128, 103188. [Google Scholar] [CrossRef]
  11. Gettman, D.; Pu, L.; Sayed, T.; Shelby, S.G.; Energy, S. Surrogate Safety Assessment Model and Validation; Turner-Fairbank Highway Research Center: McLean, VA, USA, 2008.
  12. Zheng, L.; Ismail, K.; Meng, X. Traffic conflict techniques for road safety analysis: Open questions and some insights. Can. J. Civ. Eng. 2014, 41, 633–641. [Google Scholar] [CrossRef]
  13. Treiber, M.; Kesting, A. Evidence of convective instability in congested traffic flow: A systematic empirical and theoretical investigation. Procedia-Soc. Behav. Sci. 2011, 17, 683–701. [Google Scholar] [CrossRef]
  14. Hussain, M.S.; Bahrha, G.; Goswami, A.K. An integrated VISSIM-SSAM approach to predicting and mitigating pedestrian crashes and severity along urban crossings. Case Stud. Transp. Policy 2024, 15, 101153. [Google Scholar] [CrossRef]
  15. Shin, S.; Cho, Y.; Lee, S.; Park, J. Assessing Traffic-Flow Safety at Various Levels of Autonomous-Vehicle Market Penetration. Appl. Sci. 2024, 14, 5453. [Google Scholar] [CrossRef]
  16. Liu, C.; Zhang, C.; Wang, B.; Tang, Z.; Xie, Z. Digital twin of highway entrances and exits: A traffic risk identification method. IEEE J. Radio Freq. Identif. 2022, 6, 934–937. [Google Scholar] [CrossRef]
  17. Zhang, X. Research on Traffic Conflict Prediction and Safety Assessment Method in Merging Area of Expressway Interchange. Master’s Thesis, Chang’an University, Xi’an, China, 2021. [Google Scholar]
  18. Hu, Y.; Li, Y.; Huang, H.; Lee, J.; Yuan, C.; Zou, G. A high-resolution trajectory data driven method for real-time evaluation of traffic safety. Accid. Anal. Prev. 2022, 165, 106503. [Google Scholar] [CrossRef]
  19. Yuan, C.; Li, Y.; Huang, H.; Wang, S.; Sun, Z.; Li, Y. Using traffic flow characteristics to predict real-time conflict risk: A novel method for trajectory data analysis. Anal. Methods Accid. Res. 2022, 35, 100217. [Google Scholar] [CrossRef]
  20. Raju, N.; Kumar, P.; Chepuri, A.; Arkatkar, S.S.; Joshi, G. Calibration of vehicle following models using trajectory data under heterogeneous traffic conditions. In Proceedings of the 96th Annual Transportation Research Board, Washington, DC, USA, 8–12 January 2017. [Google Scholar]
  21. Nishinari, K. Traffic flow dynamics: Data, models and simulation. Phys. Today 2014, 67, 54. [Google Scholar] [CrossRef]
  22. Sadeq, A. Machine Learning Mastery for Engineers; Kindle Direct Publishing: Qatar, Doha, 2024. [Google Scholar]
  23. Hussain, F.; Ali, Y.; Li, Y.; Haque, M.M. A bi-level framework for real-time crash risk forecasting using artificial intelligence-based video analytics. Sci. Rep. 2024, 14, 4121. [Google Scholar] [CrossRef] [PubMed]
  24. Iranmanesh, M.; Seyedabrishami, S.; Moridpour, S. Identifying high crash risk segments in rural roads using ensemble decision tree-based models. Sci. Rep. 2022, 12, 20024. [Google Scholar] [CrossRef]
  25. Hussain, F.; Li, Y.F.; Arun, A.; Haque, M.M. A hybrid modelling framework of machine learning and extreme value theory for crash risk estimation using traffic conflicts. Anal. Methods Accid. Res. 2022, 36, 100248. [Google Scholar] [CrossRef]
  26. Helbing, D.; Hennecke, A.; Shvetsov, V.; Treiber, M. Micro-and macro-simulation of freeway traffic. Math. Comput. Model. 2002, 35, 517–547. [Google Scholar] [CrossRef]
  27. Yi, Z.-W.; Lu, W.-Q.; Xu, L.-H.; Qu, X.; Ran, B. Intelligent back-looking distance driver model and stability analysis for connected and automated vehicles. J. Cent. South Univ. 2020, 27, 3499–3512. [Google Scholar] [CrossRef]
  28. Alhariqi, A.; Gu, Z.; Saberi, M. Calibration of the intelligent driver model (IDM) with adaptive parameters for mixed autonomy traffic using experimental trajectory data. Transp. B Transp. Dyn. 2022, 10, 421–440. [Google Scholar] [CrossRef]
  29. Holley, D.; D’sa, J.; Mahjoub, H.N.; Ali, G.; Chalaki, B.; Moradi-Pari, E. MR-IDM-Merge Reactive Intelligent Driver Model: Towards Enhancing Laterally Aware Car-following Models. In Proceedings of the 2023 IEEE 26th International Conference on Intelligent Transportation Systems (ITSC), Bizkaia, Spain, 24–28 September 2023; pp. 1460–1467. [Google Scholar]
  30. Zhou, Z.; Li, L.; Qu, X.; Ran, B. A self-adaptive IDM car-following strategy considering asymptotic stability and damping characteristics. Phys. A Stat. Mech. Its Appl. 2024, 637, 129539. [Google Scholar] [CrossRef]
  31. Xiao, X.P.; Jiang, M.; Wen, J.H.; Wu, C.Z. A novel car-following model considering conditional heteroskedasticity of acceleration fluctuation and driving force. J. Intell. Fuzzy Syst. 2018, 34, 2301–2311. [Google Scholar] [CrossRef]
  32. Wu, F.; Zhou, Z.; Guo, Y. Hybrid-Driven Car-Following Model Based on Improved Composite Network and IDM. Arab. J. Sci. Eng. 2024, 50, 741–757. [Google Scholar] [CrossRef]
  33. Tanveer, H.; Mubasher, M.M.; Jaffry, S.W. Integrating human panic factor in intelligent driver model. In Proceedings of the 2020 3rd International Conference on Advancements in Computational Sciences (ICACS), Lahore, Pakistan, 17–19 February 2020; pp. 1–6. [Google Scholar]
  34. Sharma, A.; Pinjari, A.R.; Nirmale, S.; Sundaresan, R. A human factors-based modeling framework to mimic bus driver behavior. Transp. Res. Part C Emerg. Technol. 2025, 170, 104929. [Google Scholar] [CrossRef]
  35. Abou-Senna, H.; Radwan, E.; Westerlund, K.; Cooper, C.D. Using a traffic simulation model (VISSIM) with an emissions model (MOVES) to predict emissions from vehicles on a limited-access highway. J. Air Waste Manag. Assoc. 2013, 63, 819–831. [Google Scholar] [CrossRef]
  36. Xiong, B.-K.; Jiang, R.; Tian, J.-F. Improving two-dimensional intelligent driver models to overcome overly high deceleration in car-following. Phys. A Stat. Mech. its Appl. 2019, 534, 122313. [Google Scholar] [CrossRef]
  37. Derbel, O.; Peter, T.; Zebiri, H.; Mourllion, B.; Basset, M. Modified Intelligent Driver Model for driver safety and traffic stability improvement. In Proceedings of the 7th IFAC Symposium on Advances in Automotive Control, National Olympics Memorial Youth Center, Tokyo, Japan, 4–7 September 2013. [Google Scholar]
Figure 1. Experiment route.
Applsci 15 03240 g001
Figure 2. Simulation flow chart.
Applsci 15 03240 g002
Figure 3. Expected vehicle speed distribution in VISSIM simulation.
Applsci 15 03240 g003
Figure 4. Driving behavior parameter setting. (a) Car-following model parameter definition. (b) Lane-change parameter definition.
Applsci 15 03240 g004
Figure 5. Schematic diagram of simulation interface. (a) Schematic diagram of simulated road network. (b) Traffic flow simulation map.
Applsci 15 03240 g005
Figure 6. VISSIM calibration results.
Applsci 15 03240 g006
Figure 7. Speed comparison of on-road experiment and VISSIM simulation. (a) Speed distribution of on-road experiment. (b) Speed distribution of VISSIM simulation.
Applsci 15 03240 g007
Figure 8. Speed calibration results between IDM and VISSIM simulation.
Applsci 15 03240 g008
Figure 9. Headway calibration results between IDM and VISSIM simulation.
Applsci 15 03240 g009
Figure 10. Temporal and spatial characteristics of traffic flow.
Applsci 15 03240 g010
Figure 11. ITTC frequency distribution histogram.
Applsci 15 03240 g011
Table 1. Classification and Comparison of IDM Improvement Models.
Improvement DimensionReferenceYearCore Methods
Environmental Adaptability OptimizationYi et al. [27]2020Proposed the back-looking distance driver model, which integrates a backward-looking distance optimization module with linear stability theory to enhance the stability of homogeneous CAV queues.
Alhariqi et al. [28]2022Developed adaptive IDMs that dynamically adjust parameters based on real-time traffic conditions.
Holley et al. [29]2023Introduced the concept of maximum deceleration competition between main lane and converging vehicles into IDM.
Vehicle Performance Coupling ModelingZhou et al. [30]2024Optimized queue cooperative control by dynamically correcting IDM acceleration function based on front vehicle speed and time.
Xiao et al. [31]2018Coupled the IDM with a generalized autoregressive conditional heteroskedasticity model to predict sudden changes in acceleration associated with risky driving behavior.
Wu et al. [32]2024Utilized residual dense networks to extract driving state features and made collaborative decisions with IDM through optimal weight assignment.
Driver Behavior IntegrationTanveer et al. [33]2020Quantified the nonlinear inhibitory effect of psychological stress on acceleration by embedding panic level coefficients into IDM safety distance calculations.
Sharma et al. [34]2025 Introduced a multi-target prognostic logic and a stimulus perception parameter calibration mechanism into IDM to account for bus driver driving characteristics.
Table 2. Driving behavior parameters and reference threshold.
Driving BehaviorParameters to Be Calibrated Parameter NameParameter Threshold
Follow-up modelAverage parking distance/m0.5–3
Time headway/s0.3–2
Follow-up variables2–7
Aggressive following threshold2.5–5
Passive following threshold −5–5
Acceleration/(m/s2)1–5
Vehicle lane-change behaviorAcceptable deceleration/(m/s2)−4–−0.5
Minimum headway/m0.1–1
Safety distance reduction factor0.1–1
Maximum deceleration of coordinated braking/(m/s2)−5–−2
Table 3. IDM parameter value.
ParameterValueUnit
a2m/s2
b1.4m/s2
s01.5m
T1.2s
V070km/h
ε 3
Table 4. Conflict index level and threshold.
Risk LevelIndicator
TTC (s)ITTC (1/s)
Potential conflict risk (PC)>4<0.25
General conflict risk (GC)[2.1, 4][0.25, 0.48]
Serious conflict risk (SC)<2.1>0.48
Table 5. Analysis of conflict identification results.
Conflict LevelConflict Situation
Actual SampleIndicator SampleAccuracy Rate
Potential conflict risk (PC)26,16127,13896.63%
General conflict risk (GC)17,99717,58797.72%
Serious conflict risk (SC)7778721192.71%
Disclaimer/Publisher’s Note: The statements, opinions and data contained in all publications are solely those of the individual author(s) and contributor(s) and not of MDPI and/or the editor(s). MDPI and/or the editor(s) disclaim responsibility for any injury to people or property resulting from any ideas, methods, instructions or products referred to in the content.

