Article

Gagam-Palmultang Restores Immune Homeostasis and T Lymphocyte Activation in a Cyclophosphamide-Induced Immunosuppression Mouse Model

Jaseng Spine and Joint Research Institute, Jaseng Medical Foundation, 538, Gangnam-daero, Gangnam-gu, Seoul 135-896, Republic of Korea
*
Author to whom correspondence should be addressed.
Appl. Sci. 2025, 15(6), 3235; https://doi.org/10.3390/app15063235
Submission received: 19 February 2025 / Revised: 13 March 2025 / Accepted: 13 March 2025 / Published: 16 March 2025

Abstract

:
Gagam-palmultang (PMT), a traditional Korean herbal formula, has been used to treat various conditions; however, its immunomodulatory potential remains unclear. Our objective was to assess the immunomodulatory effects of PMT in an immunosuppression mouse model. In vitro, we assessed interleukin (IL)-10 production in concanavalin A (Con A)-stimulated mouse splenocytes using real-time polymerase chain reaction and enzyme-linked immunosorbent assays. In vivo, C57BL/6 mice were intraperitoneally administered cyclophosphamide (CPA) to induce immunosuppression, followed by the oral administration of PMT (100 or 200 mg/kg) once daily for 14 days to evaluate its effects on T lymphocyte activation and immune function restoration. Immune function was evaluated via flow cytometric analysis of CD4+ and CD8+ T cells, thymus index measurements, thymic histopathology, and hematological analysis of white blood cell, monocyte, lymphocyte, neutrophil, and eosinophil counts. PMT significantly increased IL-10 production in Con A-stimulated splenocytes. In immunosuppressed mice, PMT restored the thymus index, improved thymic histopathology, and enhanced hematological parameters. Flow cytometry showed a significant increase in CD3e+CD4+ and CD3e+CD8+ T lymphocytes, and histological evaluation revealed increased CD3+ lymphocytes in the thymus. These findings suggest that PMT enhances T lymphocyte activation and restores immune homeostasis under immunosuppressive conditions, demonstrating its potential as a herbal immunomodulatory agent.

1. Introduction

The immune system is essential for defending the body against pathogens and preserving homeostasis [1]. Dysregulation of immune function increases susceptibility to infections, autoimmune disorders, and inflammatory diseases. With the increasing prevalence of immune-related disorders, there is a growing demand for safe and effective immunomodulatory agents, making this an essential area of research [2,3].
Traditional herbal medicines are commonly utilized to enhance immune function, and polyherbal formulations have demonstrated promising immunomodulatory effects [4,5]. Gagam-palmultang (PMT), a well-known traditional Korean herbal formula, and Nokyonggunbi-tang, another widely used herbal medicine, are commonly used to alleviate symptoms such as blurred vision, dizziness, anemia, fatigue, allergic reactions, and general physical weakness [6]. Numerous studies have validated its pharmacological properties, demonstrating significant anti-inflammatory effects by inhibiting inflammatory mediator production via the NF-κB pathway in RAW 264.7 cells [7]. Additionally, PMT has been shown to enhance female reproductive function by promoting oocyte proliferation [8], protect the gastric mucosa from acute gastric damage induced by ethanol in rats [9], and ameliorate scopolamine-induced memory deficits through the PI3K and ERK/CREB/BDNF signaling pathways in mice [10]. Furthermore, studies have shown that PMT reduces apoptosis in cardiomyocytes under hypoxic conditions [11] and regulates osteoblast activity to restore bone homeostasis [12]. Despite these promising findings, its immunomodulatory effects have not been fully elucidated. Exploring the immunoregulatory mechanisms of PMT may offer valuable insights into its potential as a functional health supplement or an immunomodulatory therapeutic agent.
Cyclophosphamide (CPA), a widely used immunosuppressive agent, induces immune suppression by damaging the lymphoid organs and reducing immune cell proliferation, leading to dysregulated T lymphocyte activation and cytokine production [13,14]. In this study, we explored the immunomodulatory potential of PMT in a mouse model of CPA-induced immunosuppression. Specifically, we evaluated its ability to enhance T lymphocyte activation and restore immune function. In vitro, we assessed IL-10 production in concanavalin A (Con A)-stimulated splenocytes using real-time PCR and enzyme-linked immunosorbent assays (ELISA). In vivo, CPA-induced immunosuppressed mice were treated with PMT, followed by immunological assessments, including analysis of CD4+ and CD8+ T cells, thymus index measurements, thymic histopathology, and hematological analysis.
This study aimed to evaluate whether PMT promotes T lymphocyte activation and restores immune homeostasis in immunosuppressed conditions. Our findings provide scientific evidence supporting the potential application of PMT as an immunomodulatory herbal formulation for immune support.

2. Materials and Methods

2.1. Preparation and Authentication of PMT

All the plant materials utilized in this study were obtained from Green M.P. Pharm. Co., Ltd. (Seongnam-si, Republic of Korea). The specific composition of the PMT formulation, including the origin, region, and percentage of each herbal ingredient, is shown in Table 1. The PMT extract, comprising 14 medicinal herbs, was prepared using a standardized decoction method to ensure consistency in its composition and biological activity. The 14 medicinal herbs were weighed according to their respective proportions and immersed in distilled water. The mixture was heated to 88 °C in a reflux extraction apparatus and boiled continuously for 8 h. After boiling, the extract was microfiltered using a 1 μm filter to remove plant residues. The filtrate was concentrated to 30 Brix under reduced pressure at 65 ± 5 °C using a rotary vacuum evaporator (Sunil Eyela Co., Seongnam-si, Republic of Korea). The final yield was 57.24% when the extraction, filtration, and concentration processes were carried out using PMT raw material (2.27 kg) with 8 times the amount of water. The concentrated extract was freeze-dried into a fine powder and stored at −20 °C for stability and preservation.

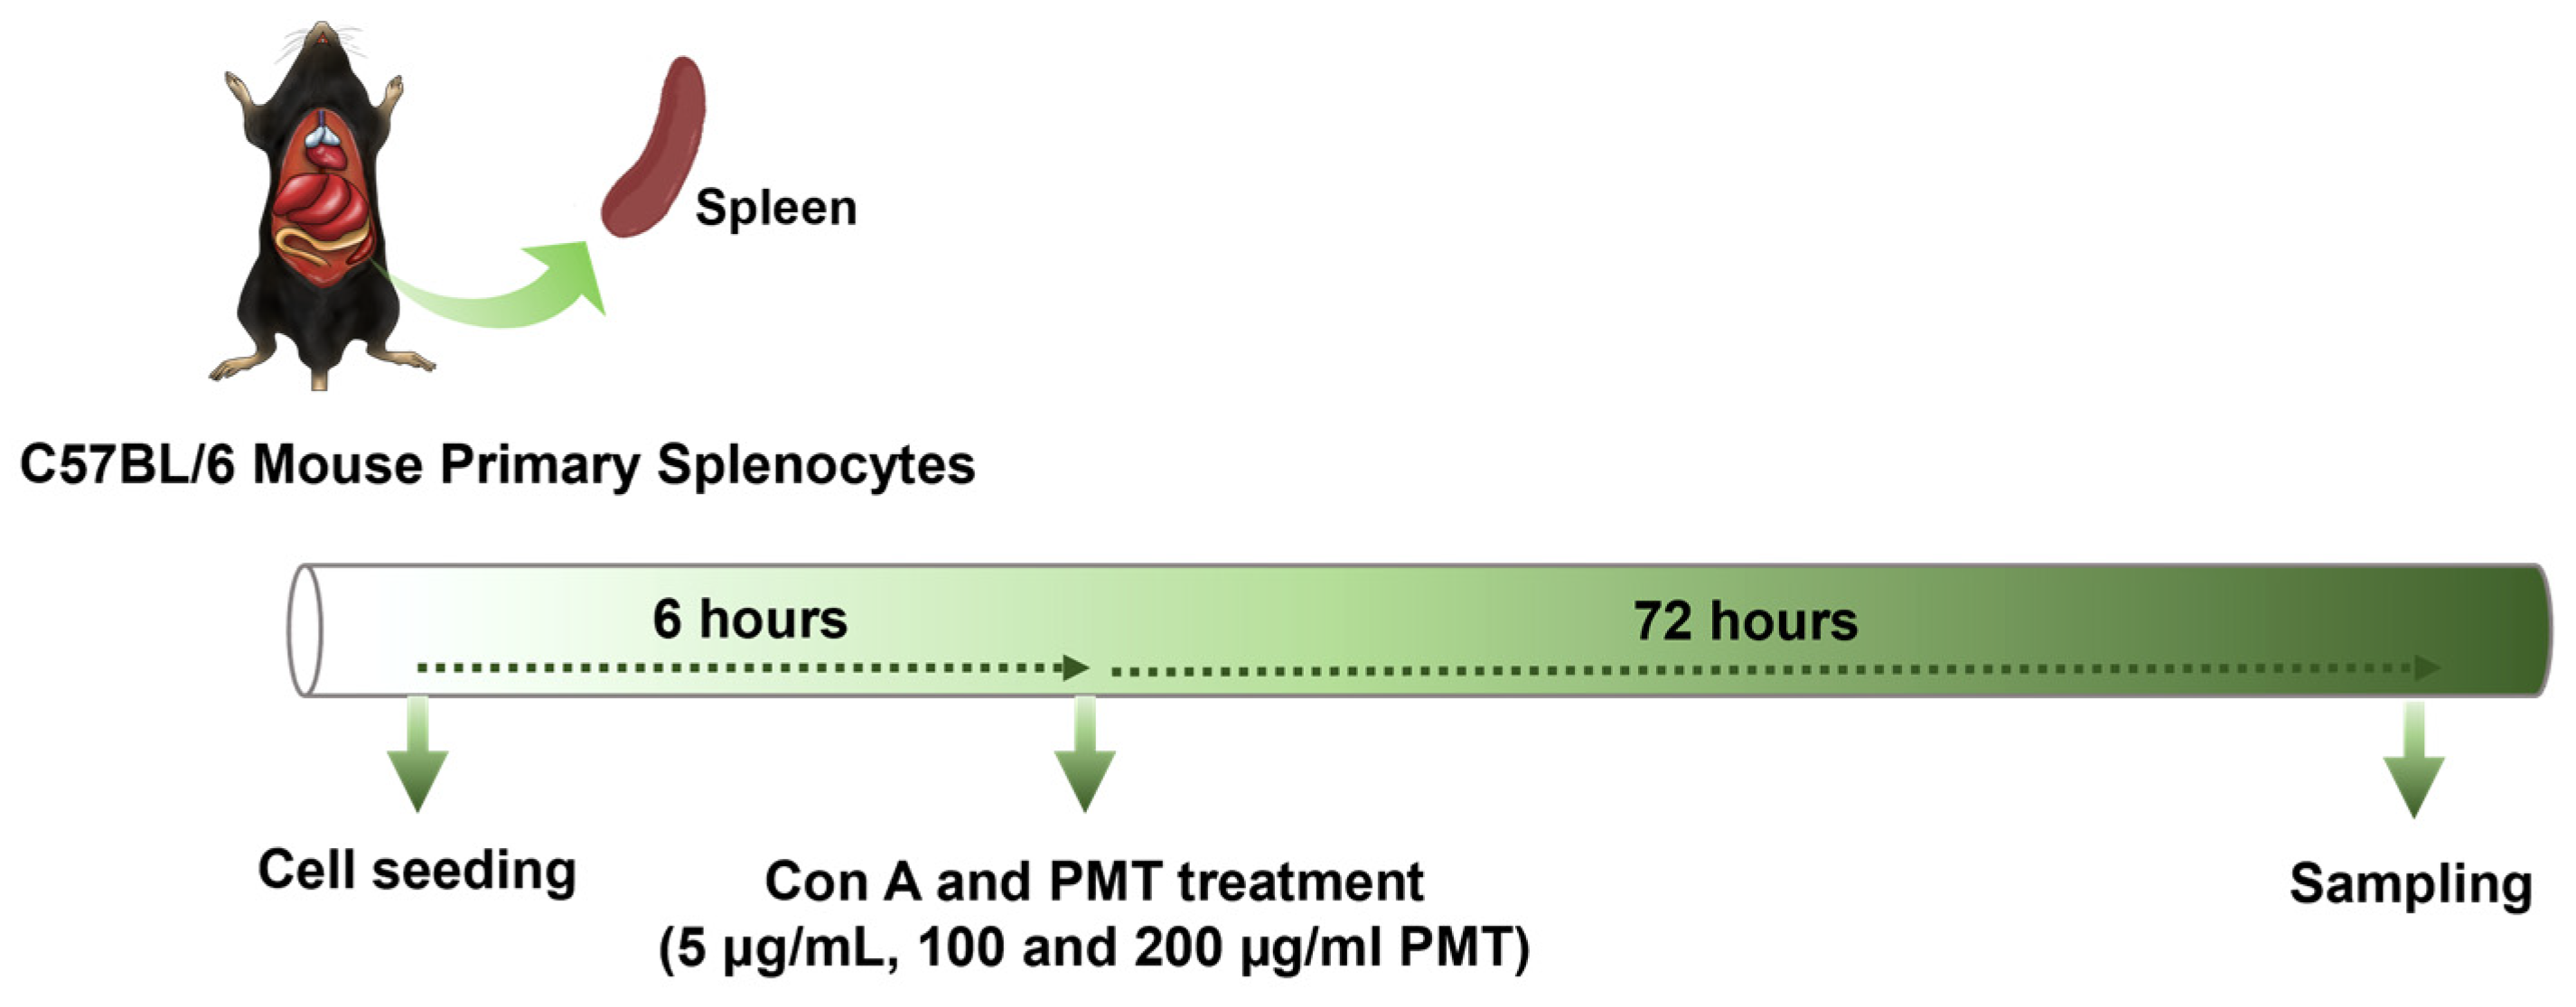
2.2. Mouse Primary Splenocyte Culture and Drug Treatment

Male C57BL/6 mice (3 weeks old) were procured from Orient Bio Inc. (Seongnam-si, Republic of Korea). All experiments were performed in compliance with the National Research Council Guidelines and received approval from the Institutional Animal Care and Use Committee (IACUC) of the Jaseng Spine and Joint Research Institute (protocol No. JSR-2020-12-002A). Spleens were aseptically collected, mechanically dissociated, and filtered to obtain a single-cell suspension. After centrifugation, red blood cells were lysed using ACK buffer (Lonza, Walkersville, MD, USA), followed by washing with RPMI-1640 (Hyclone, South Logan, UT, USA). The final splenocyte pellet was resuspended in RPMI-1640 with 10% FBS and 1% penicillin–streptomycin and cultured at 1 × 10⁷ cells/2 mL for 6 h. For stimulation, splenocytes were treated with Con A (5 μg/mL, Sigma-Aldrich, St. Louis, MO, USA) to induce T cell activation. Subsequently, 100 and 200 μg/mL PMT (designated as PMT100 and PMT200 groups) were introduced into the cultures, followed by incubation under standard culture conditions at 37 °C for 72 h. A detailed timeline outlining the steps of the in vitro study is provided in Scheme 1.

2.3. ELISA

Splenocytes were plated at 5 × 10⁶ cells per well in six-well plates and exposed to Con A and PMT (100 or 200 μg/mL). Following a 72 h incubation, culture supernatants were collected and analyzed for IL-10 secretion using a quantitative ELISA kit (R&D Systems, Minneapolis, MN, USA) according to the manufacturer’s instructions.

2.4. Real-Time qPCR

IL-10 mRNA expression was quantified using real-time qPCR. Total RNA was extracted, reverse-transcribed into cDNA, and amplified using SYBR Green Supermix (Bio-Rad, Hercules, CA, USA). GAPDH served as the reference gene, and relative expression levels were calculated using the ΔΔCt method, with results expressed as fold changes relative to the control or Con A group. The primer sequences used for IL-10 amplification were 5′-TAACTGCACCCACTTCCCAG-3′ for the forward primer and 5′-AGGCTTGGCAACCCAAGTAA-3′ for the reverse primer (NCBI accession number: NM_010548.2).

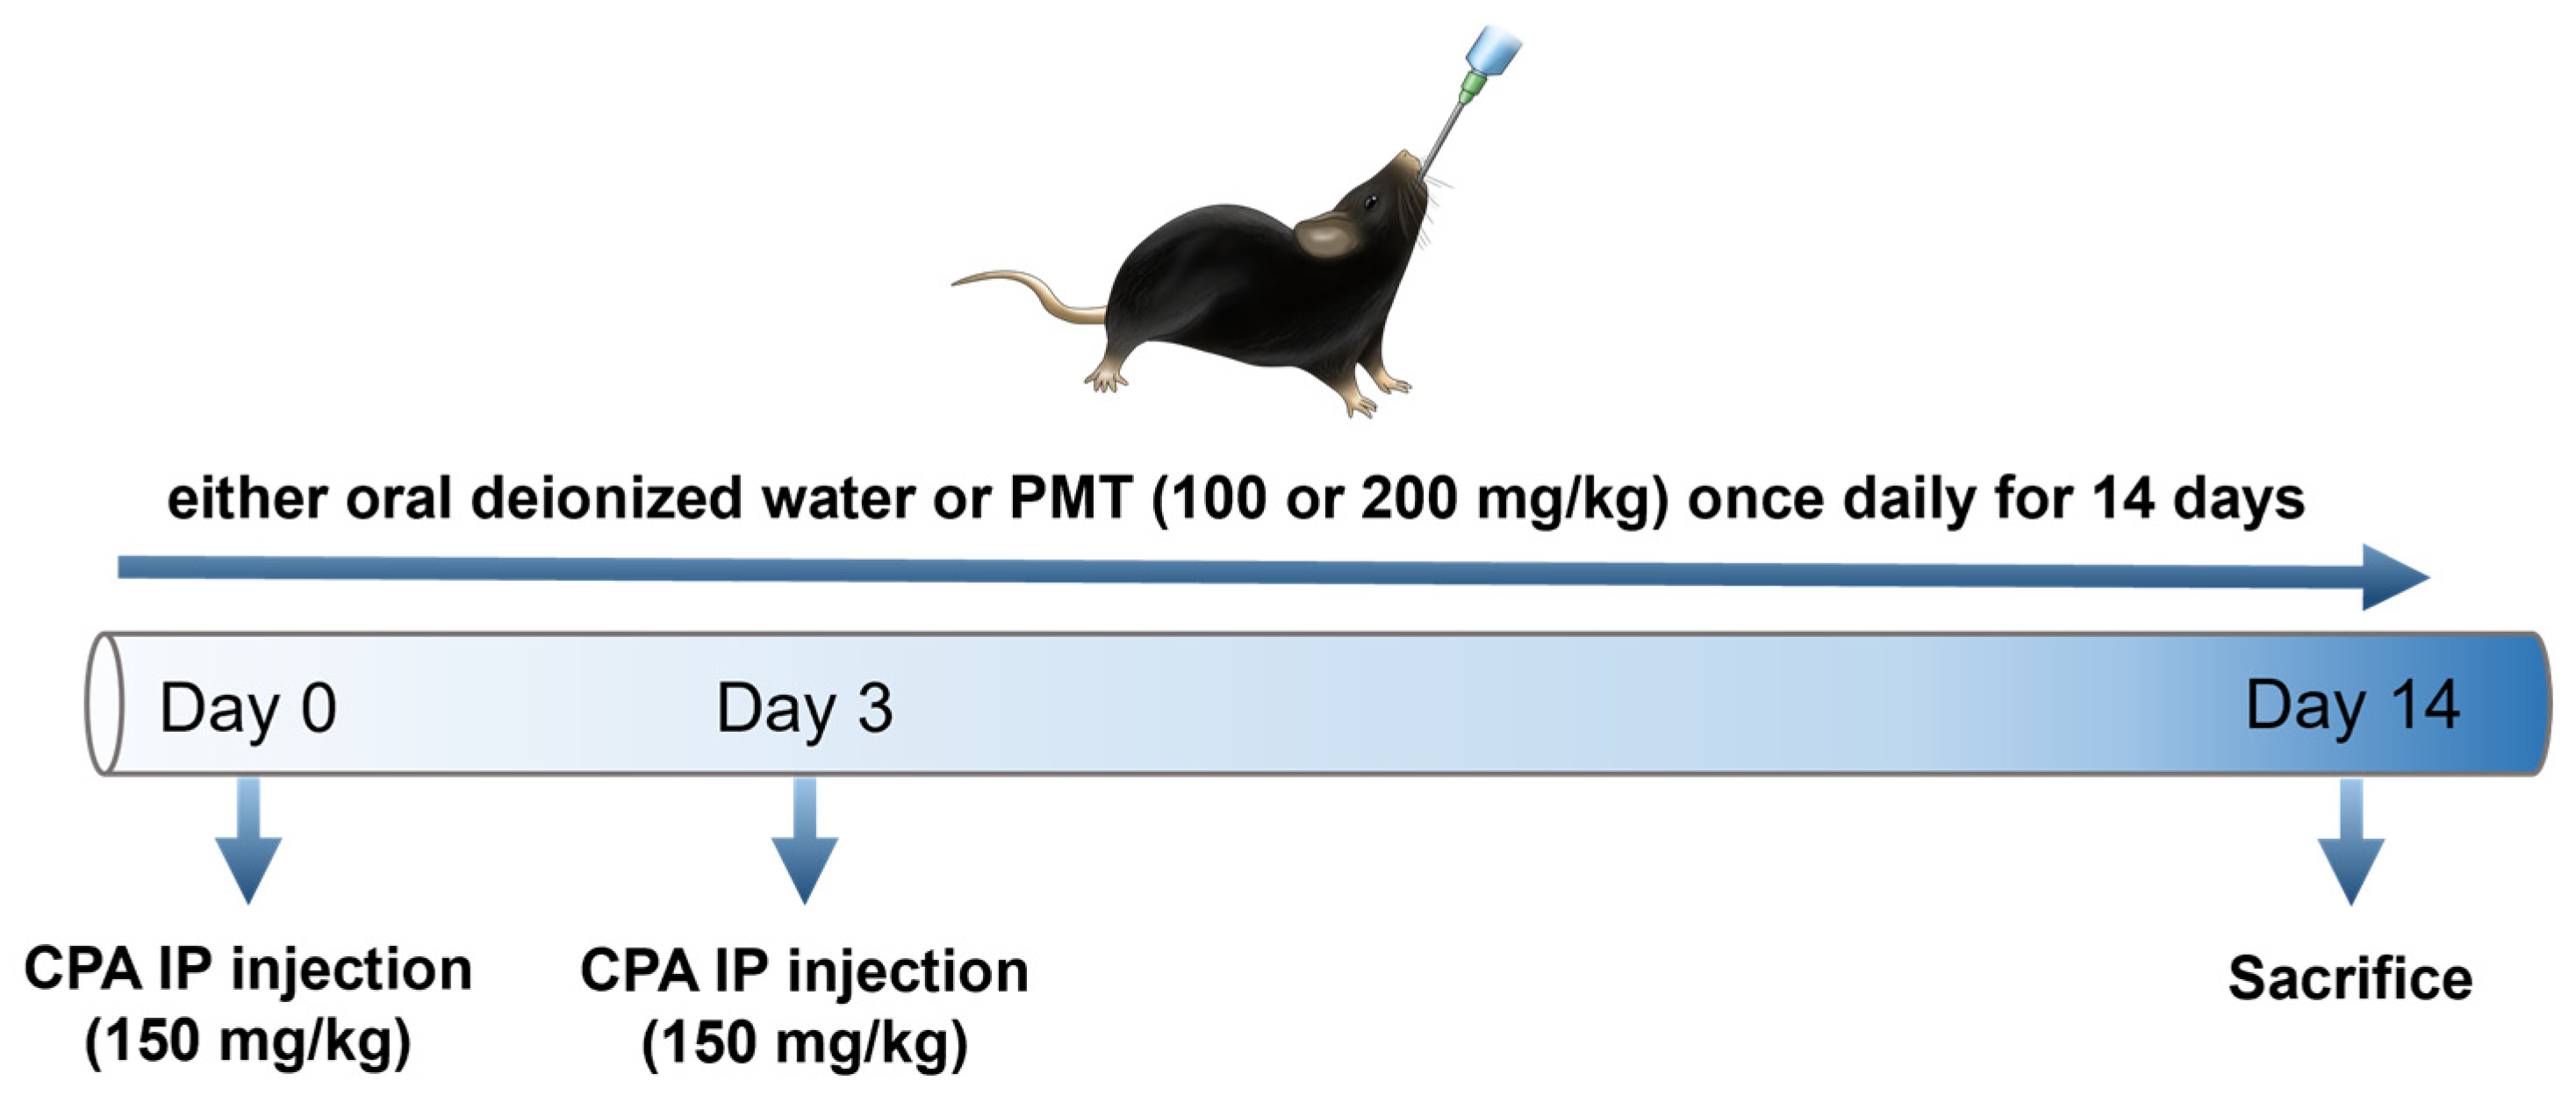
2.5. Animal Model and Treatment Protocol

Male C57BL/6 mice (7 weeks old) were obtained from Orient Bio Inc. and housed under standard conditions with controlled temperature (25 ± 1 °C), humidity (50 ± 5%), and a 12 h light/dark cycle. They had ad libitum access to food and water. All the animal experiments were approved by the IACUC of the Jaseng Spine and Joint Research Institute (protocol No. JSR-2020-12-001A). To induce immunosuppression, the mice were intraperitoneally administered CPA (150 mg/kg) twice, on days 0 and 3. The normal group received oral deionized water daily for 14 days, while the CPA-treated groups received two CPA injections along with daily oral administration of deionized water for the same period. For the experimental treatment, the mice in the PMT groups received two CPA injections and were given oral PMT at doses of 100 or 200 mg/kg once daily for 14 days. A detailed timeline outlining the steps of the in vivo study is provided in Scheme 2.

2.6. Hematological Analysis

Blood samples were drawn from the ophthalmic venous plexus and placed into ethylenediaminetetraacetic acid-coated tubes for hematological analysis. The total white blood cell (WBC), neutrophil (NEU), lymphocyte (LYM), monocyte (MONO), eosinophil (EOS), and basophil (BASO) counts were measured using a CELL-DYN 3700 hematological analyzer (Abbott Diagnostics, Wiesbaden, Germany).

2.7. Weight Gain and Immune Organ Index Analysis

The body weight of each mouse was measured on days 0 and 14. The percentage of weight gain was calculated using the following formula:
Weight gain (%) = ([final weight − initial weight] × 100/initial weight)
On day 14, the thymus and the spleen were collected and weighed. The immune organ index was determined using the following formulas:
Thymus index = thymus weight (mg)/body weight (g)
Spleen index = spleen weight (mg)/body weight (g)

2.8. Hematoxylin and Eosin (H&E) Staining

The thymus was weighed, sectioned, and fixed in 4% paraformaldehyde before being embedded in paraffin and sliced into 5 μm thin sections. The tissue sections were then deparaffinized and stained with H&E following standard histological procedures. The stained samples were analyzed under a Nikon Eclipse Ti2 microscope (Nikon Instruments Inc., Seoul, Republic of Korea), and images were acquired using NIS-Elements BR 5.01 software (Nikon Instruments Inc.).

2.9. Flow Cytometric Analysis

Flow cytometric analysis was performed to evaluate T cell subsets in thymic cells isolated from the mice. Briefly, thymic cells were cultured in 100 mm dishes at a density of 3.5 × 10⁸ cells per well and subsequently incubated with specific antibodies: fluorescein isothiocyanate (FITC)-conjugated rat anti-mouse CD3 molecular complex (clone 17A2, catalog #555274), peridinin–chlorophyll–protein (PerCP)-conjugated rat anti-mouse CD4 (clone RM4-5, catalog #553052), PerCP-conjugated rat anti-mouse CD8a (clone 53-6.7, catalog #553036), and PerCP–Cy™5.5-conjugated rat anti-mouse CD25 (clone PC61, catalog #551071) (all from BD Biosciences, San Jose, CA, USA). Fluorescence-activated cell sorting (FACS) was performed using an Accuri C6 Plus flow cytometer (BD Biosciences) to quantify T cell populations.

2.10. Immunohistochemistry

Immunohistochemistry was performed using paraffin-embedded thymic tissue sections following a standard protocol. Briefly, the tissue samples were initially warmed at 60 °C for 60 min to facilitate paraffin removal. The sections then underwent deparaffinization and rehydration through sequential immersion in xylene (10 min, twice), followed by a graded ethanol series (100%, 90%, 80%, and 70% for 5 min each), distilled water (twice for 5 min), and 1× PBS (twice for 5 min). For antigen retrieval, the sections were incubated in boiling citrate buffer for 20 min, followed by cooling at room temperature for 20 min. The slides were then transferred to a humid chamber, and the hydrophobic barrier was reinforced using rubber cement. Tissue sections were permeabilized with 0.5% Triton X-100, blocked with 2% normal goat serum, and incubated overnight at 4 °C with an anti-CD3 antibody (Dako, Carpinteria, CA, USA). CD3 immunoreactivity was visualized using a DAB detection kit (Vector Laboratories, Inc., Burlingame, CA, USA), and the stained sections were analyzed with a Nikon Eclipse Ti2 microscope using NIS-Elements BR 5.01 software.

2.11. Statistical Analyses

All the data are presented as the means ± standard error of the mean (SEM), derived from at least three independent experiments. Statistical analyses were conducted using one-way analysis of variance (ANOVA) to assess differences between the groups with GraphPad Prism 9.0 (GraphPad Software, La Jolla, CA, USA). To determine significant differences between the groups, Dunnett’s multiple comparisons test was applied. Statistical significance was defined as follows: for comparisons with the blank or normal group, the significance levels were indicated as # p < 0.05, ## p < 0.01, ### p < 0.001, and #### p < 0.0001; for comparisons with the Con A group or the CPA group, the significance levels were denoted as * p < 0.05, ** p < 0.01, *** p < 0.001, and **** p < 0.0001.

3. Results

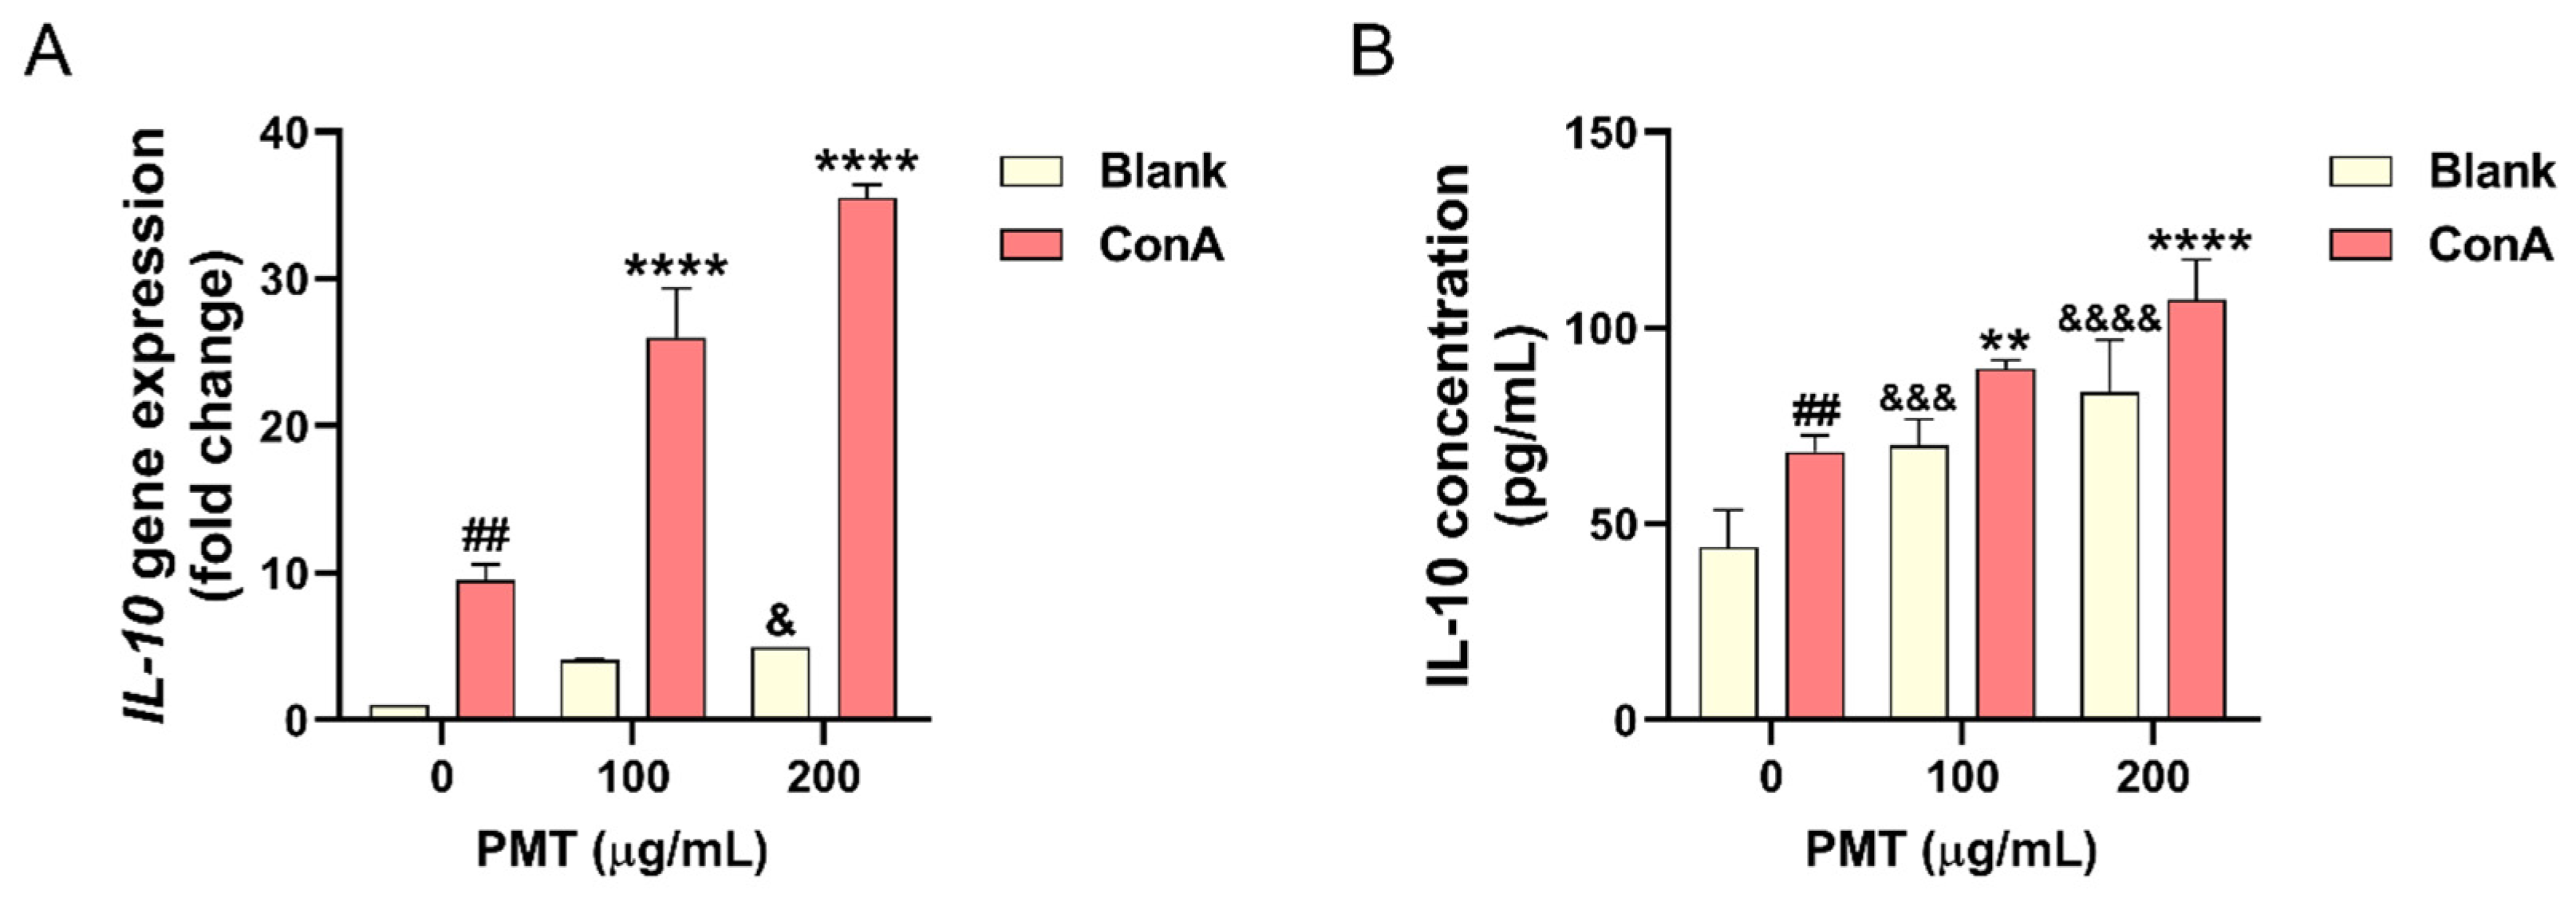
3.1. Effect of PMT on IL-10 Expression in the Con A-Treated Mouse Primary Splenocytes

IL-10, a crucial regulator of immune function, was evaluated at the mRNA and protein levels in splenocytes treated with PMT (100 or 200 μg/mL) and Con A. IL-10 mRNA expression was significantly higher in the Con A group than in the blank group (Figure 1A). Additionally, treatment with 200 μg/mL of PMT alone significantly enhanced IL-10 mRNA expression compared to the blank group. Notably, under Con A-treated conditions, PMT at both 100 and 200 μg/mL further increased IL-10 mRNA levels compared to the Con A treatment alone. A similar trend was observed at the protein level, as measured by ELISA (Figure 1B). Both 100 and 200 μg/mL PMT treatments alone significantly increased IL-10 protein expression compared to the blank group. Furthermore, in the presence of Con A, PMT at both 100 and 200 μg/mL significantly elevated IL-10 protein levels compared to the Con A group. Con A alone led to a significant increase in IL-10 protein expression compared with the blank group, whereas PMT treatment resulted in a further significant enhancement. These results indicate that PMT enhances IL-10 expression, suggesting its potential as an immunomodulatory agent capable of boosting immune responses.

3.2. Effect of PMT on Weight Gain and Hematological Parameters in the Immunosuppressed Mice

Treatment with CPA significantly reduced weight gain (%) compared to that in the normal group, indicating the immunosuppressive effects of CPA (Figure 2A). PMT administration (100 and 200 mg/kg) did not result in a significant improvement in weight gain. In the hematological analysis, CPA treatment significantly decreased the WBC, NEU, LYM, MONO, and EOS counts (Figure 2B–F). PMT treatment increased these parameters in a dose-dependent manner, with WBC counts significantly elevated in both the PMT100 and PMT200 groups compared to those in the CPA group (Figure 2B). Additionally, EOS counts were significantly higher in the PMT200 group than in the CPA group (Figure 2F). Although other hematological parameters, such as NEU, LYM, and MONO counts, demonstrated a recovery trend with PMT treatment, these changes were not statistically significant. These findings suggest that PMT may partially mitigate CPA-induced hematological suppression, particularly through its effects on WBC and EOS counts.

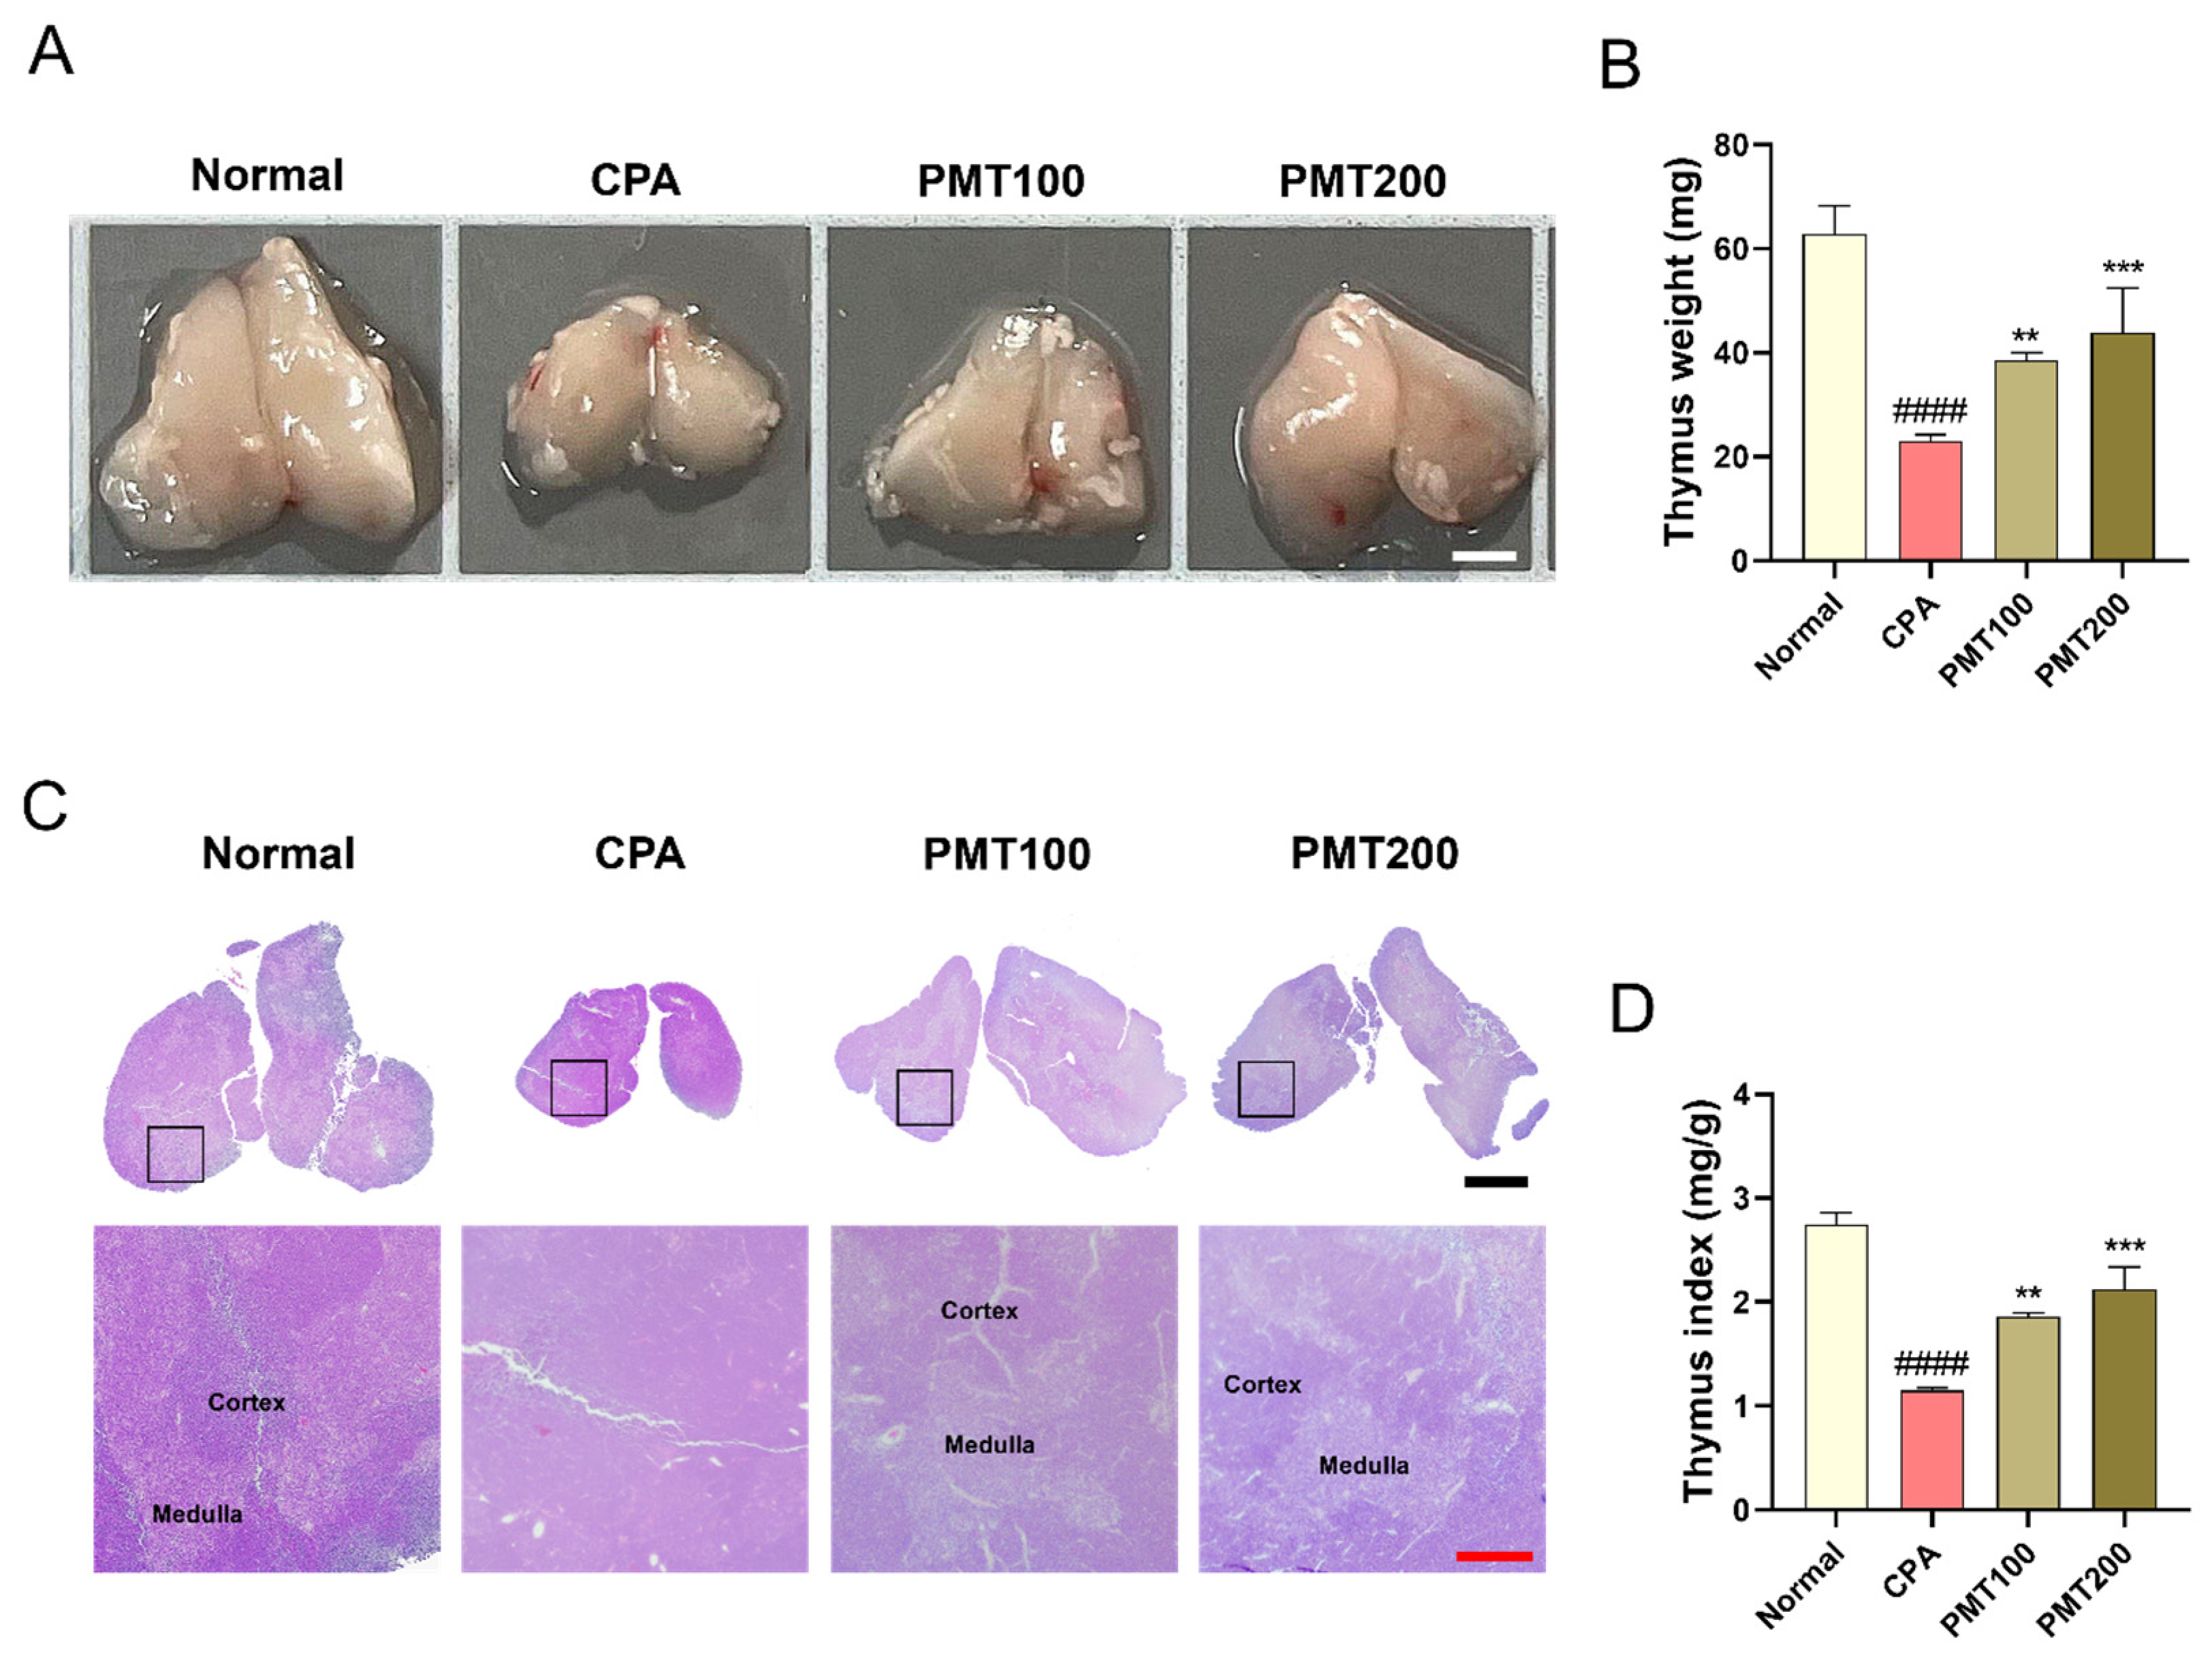
3.3. Effect of PMT on Thymus Morphology and Function in the Immunosuppressed Mice

Thymus tissues in the CPA-treated group exhibited a noticeable decrease in size compared to those in the normal group, highlighting the severe immunosuppressive effects of CPA (Figure 3A). In contrast, treatment with 100 and 200 mg/kg PMT led to a significant increase in thymus weight, indicating a partial restoration of thymus size and suggesting PMT’s potential to mitigate CPA-induced thymic atrophy. Quantitative analysis revealed a significant reduction in thymus weight following CPA administration (Figure 3B). However, treatment with 100 and 200 mg/kg PMT effectively reversed these reductions in a dose-dependent manner, suggesting the restorative potential of PMT in alleviating CPA-induced thymic atrophy.
Histological analysis using H&E staining further supported these findings (Figure 3C). The CPA group exhibited an unclear boundary between the cortex and the medulla, indicating structural damage, compared to the normal group, which displayed a well-defined thymic architecture. In contrast, treatment with 100 and 200 mg/kg PMT resulted in clearer demarcation of the cortex and the medulla compared to that in the CPA group, suggesting that PMT alleviates thymic structural damage caused by CPA. The thymus index showed a trend consistent with that of the thymus weight analysis (Figure 3D). CPA administration significantly reduced the thymus index compared with that in the normal group. Additionally, treatment with 100 or 200 mg/kg PMT significantly improved the thymus index in a manner proportional to the dose.

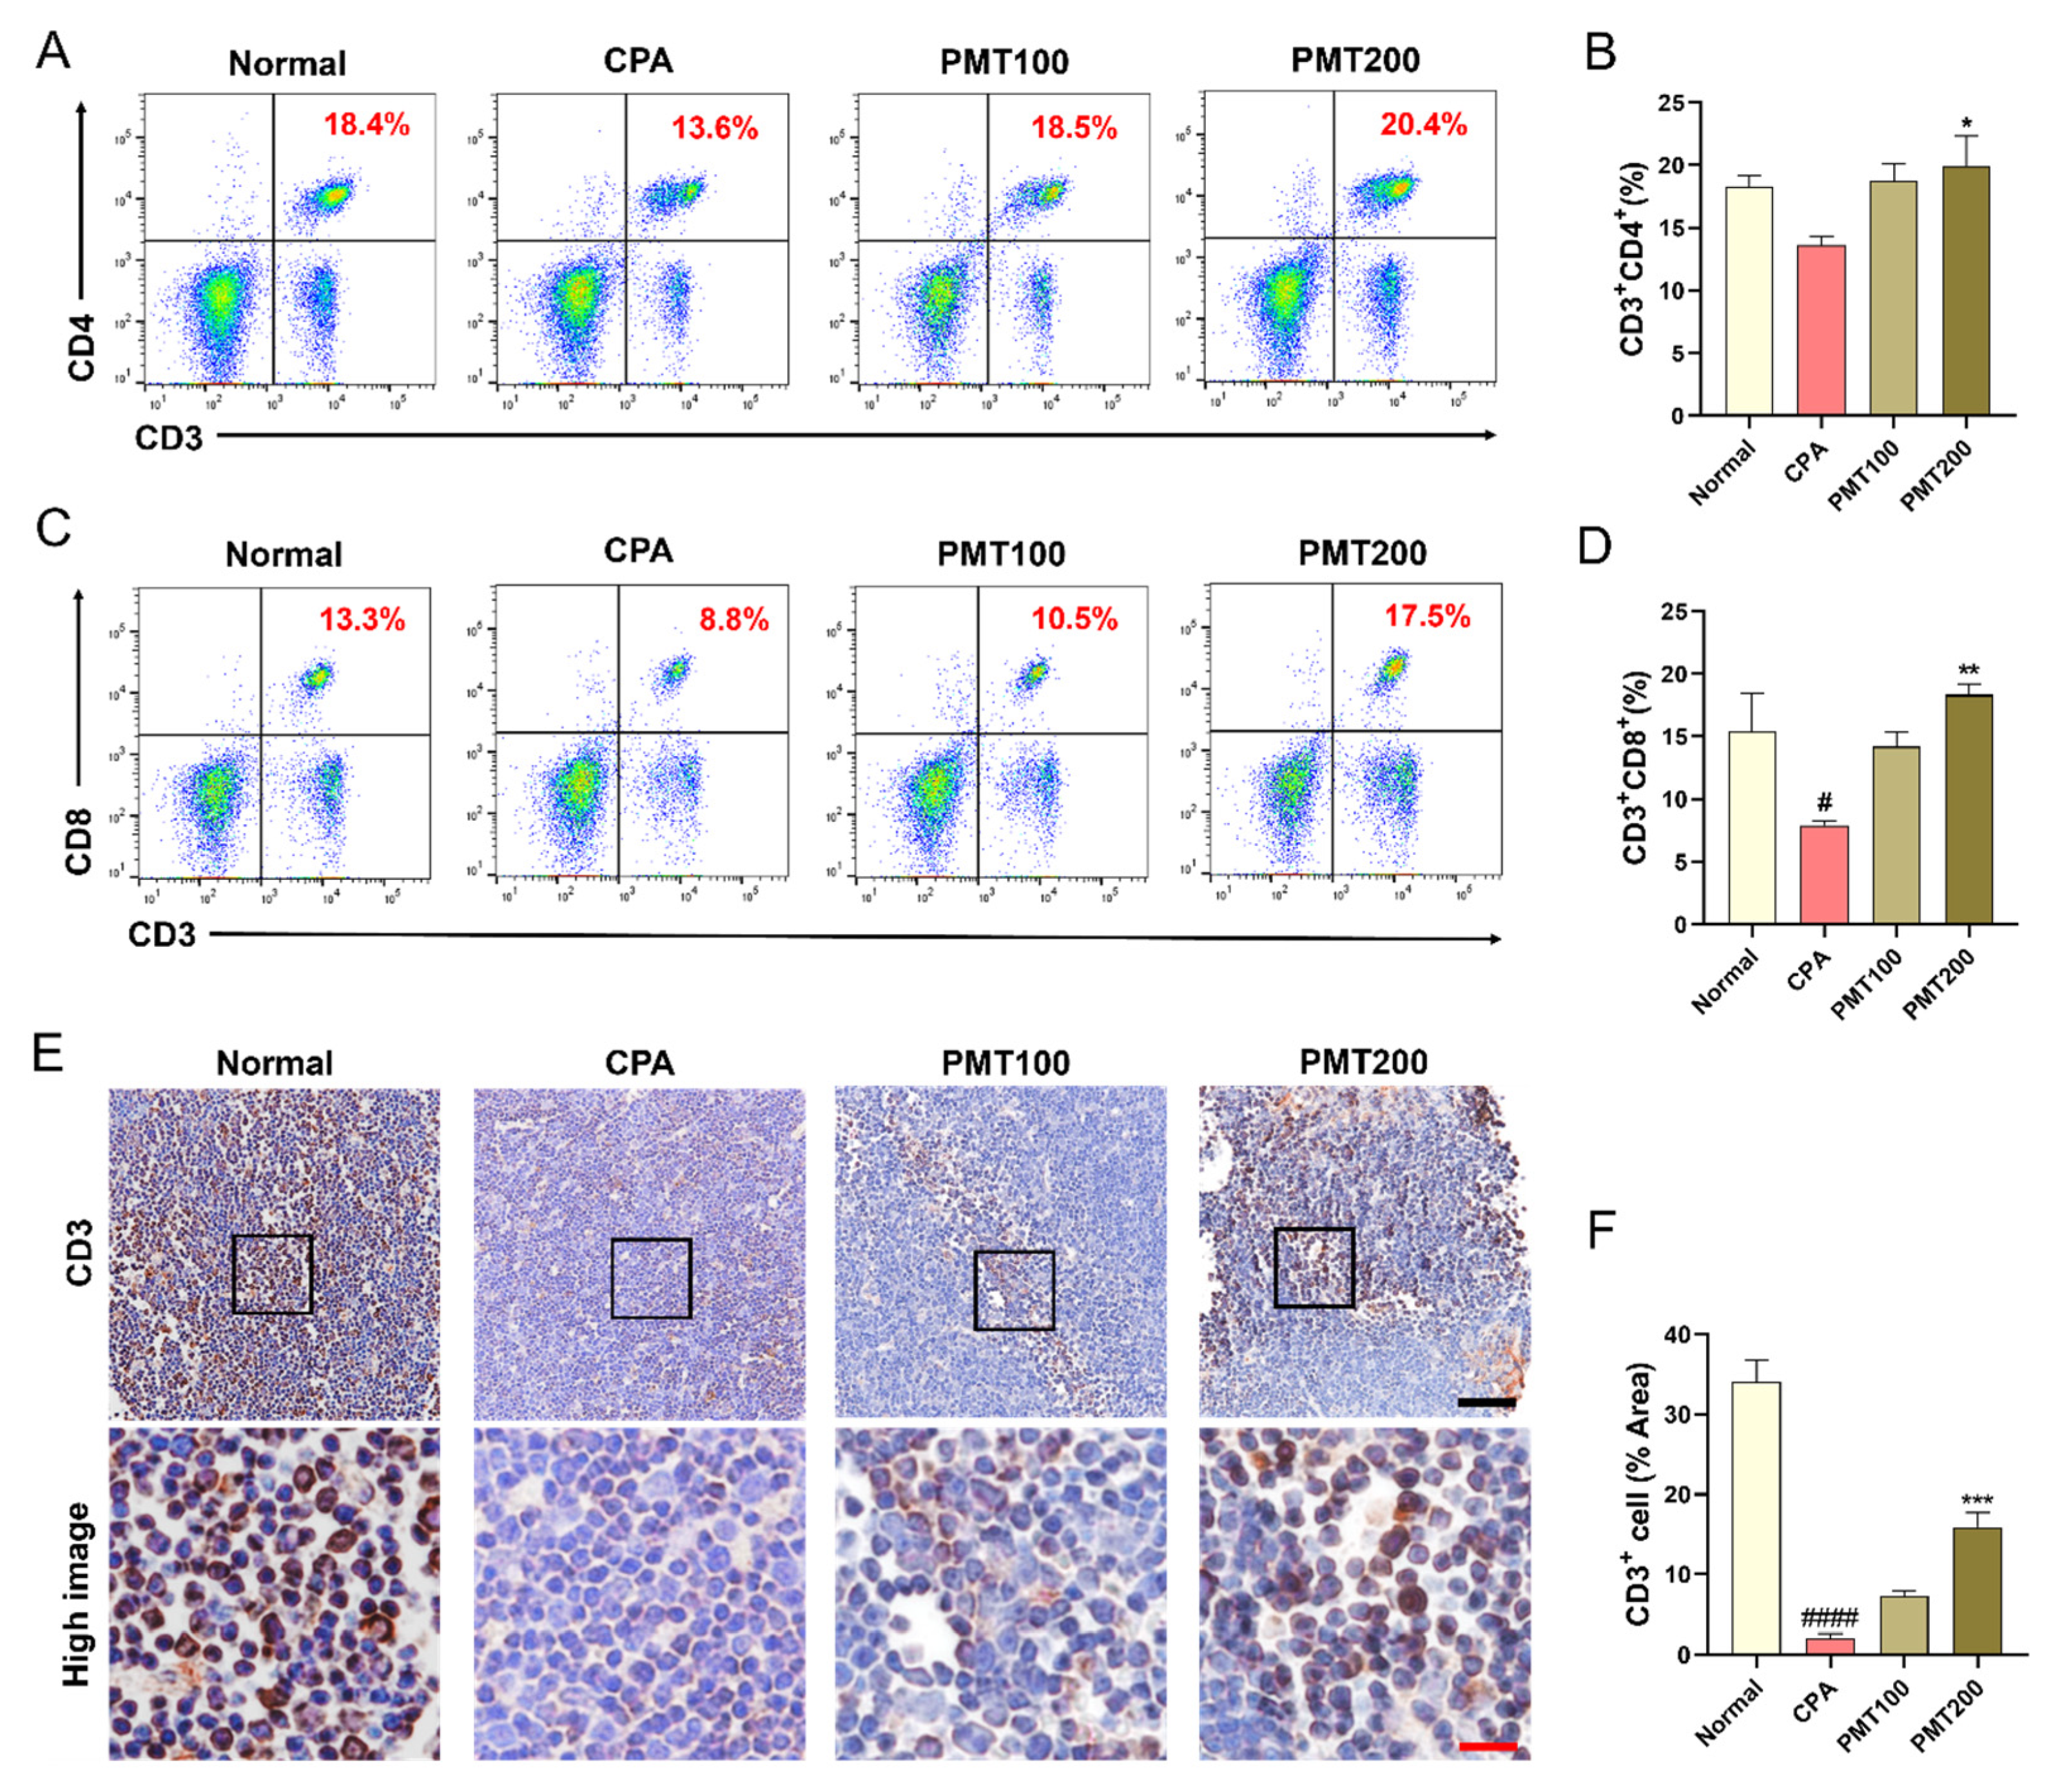
3.4. Effect of PMT on T Lymphocyte Populations in the Immunosuppressed Mice

T lymphocytes, critical regulators of immune responses, were analyzed to evaluate the immunomodulatory effects of PMT in the CPA-induced immunosuppression mouse model. Flow cytometric analysis revealed significant alterations in the percentages of CD3e+CD4+ T helper cells and CD3e+CD8+ T cytotoxic cells among the groups (Figure 4A–D). In the CPA group, percentages of the CD3e+CD4+ and CD3e+CD8+ cells were markedly reduced compared to the normal group. Treatment with 100 and 200 mg/kg PMT significantly reversed these effects. In the PMT200 group, proportions of the CD3e+CD4+ and CD3e+CD8+ T cells were significantly elevated, increasing approximately 1.5-fold and 2-fold, respectively, compared to the CPA group. Additionally, to further assess the impact of PMT on lymphocyte activation, CD25 expression was analyzed via flow cytometry (Supplementary Figure S1). CD25 was significantly reduced in the CPA group compared to the normal group, indicating impaired lymphocyte activation. However, PMT treatment restored CD25 expression in a manner proportional to the dose, with both 100 mg/kg and 200 mg/kg PMT groups showing a significant increase in the percentage of CD25+ lymphocytes. The PMT200 group, in particular, exhibited the most pronounced recovery, suggesting that PMT enhances lymphocyte proliferation under immunosuppressive conditions.
Immunohistochemical analysis of CD3+ T lymphocytes in the thymus corroborated these findings (Figure 4E). The proportion of CD3+ lymphocytes in the CPA group was significantly lower than that in the normal group, indicating reduced T cell activity due to immunosuppression (Figure 4F). Treatment with 100 and 200 mg/kg PMT effectively increased the proportion of CD3+ lymphocytes in the thymus, reflecting enhanced T cell activity. Notably, the PMT200 group showed the highest levels of CD3+ lymphocytes, demonstrating significant improvement and suggesting a response that correlates with the administered dose. Overall, these results highlight the immunomodulatory effects of PMT, which effectively regulated T lymphocyte subsets, enhanced T cell activity, and improved immune function in CPA-induced immunosuppressed mice.

4. Discussion

This study examined the immunomodulatory effects of PMT in a CPA-induced immunosuppressed mouse model, focusing on its influence on IL-10 expression, hematological parameters, thymus morphology and function, and T lymphocyte populations. Collectively, these findings suggest that PMT can mitigate the immunosuppressive effects of CPA and restore immune balance. To assess the potential immunoenhancing properties of PMT, we evaluated IL-10 expression in vitro at the mRNA and protein levels. IL-10, a key regulator involved in immune function, was selected as the target due to its pivotal role in preserving immune balance. Previous research has established that IL-10 exhibits strong anti-inflammatory effects and serves as a key regulator of immune responses against infections caused by various pathogens, including viruses, bacteria, fungi, and protozoa [15]. It plays an essential role in limiting or resolving inflammation, while ensuring host protection. IL-10 not only modulates inflammation, but also exerts immunosuppressive effects on various immune cells, including regulatory T cells (Tregs), M2 macrophages, and naïve T cells [16]. Through these mechanisms, IL-10 helps to suppress excessive immune activation, thereby maintaining immune tolerance and preventing autoimmunity. Dissimilar to proinflammatory cytokines, which are released early during inflammation, IL-10 is typically secreted by innate immune cells at later stages, helping to fine-tune immune responses, limit prolonged inflammation, and prevent immune-mediated tissue damage. This dual function of IL-10—both as an immune regulator and an immunosuppressive cytokine—ensures effective pathogen elimination while maintaining tissue homeostasis and protecting against immunopathology [17].
Con A is a plant-derived lectin that is widely utilized in immunological research due to its potent ability to activate T lymphocytes [18]. It specifically binds to α-D-mannose and α-D-glucose residues present in various glycoproteins, leading to T cell receptor-mediated activation of T cells [19]. Owing to this strong mitogenic effect, Con A is commonly used to stimulate mouse T cell subsets in in vitro studies and model T cell-mediated immune responses in various preclinical models [20,21,22]. In this study, PMT treatment significantly increased IL-10 expression at both mRNA and protein levels in splenocytes. Furthermore, when PMT was combined with Con A, a lymphocyte mitogen for T cell activation, IL-10 expression was further amplified, demonstrating the synergistic effect of PMT on IL-10 regulation. Although Con A is not inherently immunosuppressive, it induces a robust inflammatory response by activating T cells. This frequently leads to the compensatory release of anti-inflammatory cytokines such as IL-10 to regulate and prevent excessive inflammation. The observed increase in IL-10 expression following Con A treatment reflects a natural attempt by the immune system to counterbalance inflammation and maintain immune equilibrium. This physiological process highlights IL-10’s crucial role in reducing inflammatory damage and maintaining homeostasis during immune responses.
In this study, a 150 mg/kg CPA dosage (administered on days 0 and 3) was chosen based on established immunosuppressive models that demonstrate efficacy without excessive toxicity [23,24]. This two-dose regimen aligns with widely used protocols designed to induce stable immunosuppression while minimizing adverse effects [25,26,27]. Furthermore, the post-CPA treatment duration varies across studies, with short-term protocols (≤7 days) assessing early-phase immune responses [23,28], while longer durations (>14 days) focus on extended immunomodulatory effects [29,30]. Experimental evidence supports the use of 10–14 days of continuous treatment following CPA administration, a strategy that aligns with our study design [14,31,32,33]. To further validate this approach, preliminary experiments were conducted using three different CPA doses (12.5 mg/kg, 70 mg/kg, and 150 mg/kg) (Supplementary Table S1). The results confirmed that administering CPA at 150 mg/kg on days 0 and 3, followed by a 14-day treatment period, provided the most effective and biologically relevant conditions for evaluating immunomodulatory effects.
CPA-induced immunosuppression significantly impacts key hematological parameters, including WBC, NEU, LYM, MONO, and EOS, which play essential roles in immune function. WBCs are crucial for immune defense, and their reduction weakens the body’s ability to combat infections [34]. NEUs, the primary defense against bacterial infections, are suppressed by CPA, increasing susceptibility to infections [35]. LYMs, including T and B cells, are vital for adaptive immunity, and their decline compromises both humoral and cell-mediated immune responses [36]. MONOs, which differentiate into macrophages and dendritic cells, contribute to pathogen clearance, and their reduction weakens immune surveillance [37]. Lastly, EOS, which are involved in allergic reactions and parasite defense, are also suppressed, potentially disrupting immune homeostasis [38]. Overall, the CPA-induced decline in these parameters indicates significant immunosuppression, underscoring the importance of evaluating the effects of PMT in mitigating these changes. PMT treatment partially restored these parameters, with WBC and EOS levels showing significant recovery in a dose-dependent manner. These findings suggest that PMT can aid in restoring hematological homeostasis, particularly through its effects on WBC and EOS counts, under immunosuppressive conditions.
The thymus, a critical immune organ for T cell maturation, was significantly affected by CPA-induced immunosuppression, as evidenced by reduced thymus weight, thymus index, and structural disorganization. PMT treatment (100 and 200 mg/kg) dose-dependently reversed these effects, restoring the thymus weight and thymus index. Histological analysis demonstrated that PMT improved the thymic architecture by reestablishing the boundary between the cortex and the medulla, suggesting a protective effect on the thymus structure. Conversely, the spleen, a key organ responsible for filtering blood and orchestrating immune responses, exhibited reactive hypertrophy in response to systemic stress, inflammation, and cellular damage [39,40]. CPA-induced cell death and tissue injury result in the release of cellular debris and inflammatory signals, which are processed by the spleen. This leads to the accumulation of immune cells, particularly macrophages and neutrophils, as well as an increase in splenic extramedullary hematopoiesis. These processes contributed to the observed splenic enlargement. Splenic hypertrophy following CPA treatment may also be linked to compensatory immune mechanisms [41,42]. CPA-induced cytotoxicity releases damage-associated molecular patterns that activate splenic immune cells, leading to proliferation and increased splenic size [43]. Additionally, the spleen may act as a compensatory site for hematopoiesis in response to CPA-induced damage to the bone marrow, further contributing to its enlargement [44]. The absence of a significant decrease in spleen size in the PMT-treated groups suggests that PMT does not directly mitigate CPA-induced reactive splenic hypertrophy (Supplementary Figure S2). Instead, the effects of PMT appeared to be more pronounced in protecting the thymus, as evidenced by the restoration of thymus size, weight, and structure. This indicates that the immunomodulatory effects of PMT may be more effective in modulating adaptive immunity (T cell recovery) than in preventing splenic hypertrophy, which is driven by innate immune responses and hematopoietic compensation.
Furthermore, T lymphocytes were significantly depleted in CPA-treated mice, reflecting profound immunosuppression. PMT treatment significantly increased the percentages of CD3e+CD4+ T helper cells and CD3e+CD8+ T cytotoxic cells, with the PMT200 group showing the most pronounced recovery. Moreover, immunohistochemical analysis revealed a significant increase in CD3+ lymphocyte levels, indicating enhanced T cell activity. The ability of PMT to enhance IL-10 expression and support thymic recovery is particularly noteworthy, as these effects are critical for maintaining immune homeostasis, particularly in the context of T cell-mediated immunity.
PMT is a traditional herbal formula composed of 14 medicinal herbs, each containing bioactive compounds with distinct immunomodulatory properties. These compounds regulate cytokine production, macrophage activation, T cell differentiation, and inflammatory signaling pathways, contributing to PMT’s immunoregulating potential. Key components include decursin (Angelica gigas) and ligustilide (Ligusticum officinale), which suppress proinflammatory cytokines and enhance T cell function [45,46,47,48]. Paeoniflorin (Paeonia japonica) and catalpol (Rehmannia glutinosa) regulate immune homeostasis by modulating inflammatory pathways such as MAPK/NF-κB and TLR-4 [49,50,51,52]. Ginsenosides (Panax ginseng) maintain the Th1/Th2 balance [53,54], while astragaloside IV (Astragalus mongholicus) enhances immune responses with anticancer potential [55,56]. Pachymic acid (Poria cocos) and glycyrrhizin (Glycyrrhiza uralensis) play protective roles in inflammation and sepsis by inhibiting NF-κB and caspase-11 activation [57,58,59]. Other notable immunomodulators include bornyl acetate (Amomum villosum) and atractylenolide (Atractylodes macrocephala), which suppress the NF-κB/MAPK pathways, controlling inflammatory cytokine production [60,61,62]. Gallic acid (Dimocarpus longan) regulates the Th17/Treg balance, contributing to autoimmune disease management [63]. Lycium barbarum polysaccharides from Lycium chinense stimulate macrophage activity and cytokine production [64], while flavonoids (Crataegus pinnatifida) exhibit antiviral and immune-enhancing properties [65]. 6-Gingerol (Zingiber officinale) has been shown to activate p38 MAPK and NF-κB, promoting Th1/Th17 responses while suppressing LPS-induced inflammation [66]. Collectively, these bioactive compounds contribute to PMT’s synergistic immunomodulatory effects, making it a promising candidate for treating immune-related disorders. Further studies are needed to explore their precise mechanisms and combined therapeutic potential.
While PMT treatment enhanced T cell populations, this study did not assess functional aspects such as antigen-specific responses, cytokine secretion, or T cell proliferation. Future studies should incorporate functional immune assays to better understand how PMT restores adaptive immunity. Although PMT significantly improved thymic recovery, it did not directly mitigate CPA-induced splenic hypertrophy. Further investigations into PMT’s impact on splenic immune function, particularly its role in extramedullary hematopoiesis and innate immune regulation, are needed to determine its broader immunological effects. Additionally, while CPA administration significantly reduced weight gain compared to the normal group, PMT treatment (100 and 200 mg/kg) did not lead to notable improvements in body weight. As a result, further metabolic assessments were not conducted in this study. However, given the critical role of metabolic parameters in immune regulation, future research should explore glucose levels, lipid metabolism, and energy expenditure to better understand the systemic effects of PMT. The observed increase in IL-10 expression following PMT and Con A treatment suggests a compensatory immune response rather than a direct effect of PMT. Further studies in animal models are needed to determine whether PMT actively modulates IL-10 production or whether the observed increase is due to T cell activation and restoration of immune homeostasis. Lastly, this study did not fully evaluate the dose-dependent effects and long-term safety profile of PMT. Although PMT has been traditionally used for a long time, its potential adverse effects associated with prolonged administration, particularly in the context of immune modulation, require careful investigation. Therefore, additional pharmacokinetic and toxicological studies are essential not only to systematically assess the safety of PMT, but also to optimize its therapeutic potential in promoting immune recovery.

5. Conclusions

This study demonstrates the immunomodulatory potential of PMT in a CPA-induced immunosuppression model, highlighting its beneficial effects on cytokine expression, hematological parameters, thymus function, and T lymphocyte populations. PMT treatment significantly enhanced IL-10 expression at both the mRNA and protein levels, suggesting its role in promoting anti-inflammatory and immunoregulatory responses. Additionally, PMT partially restored hematological parameters, particularly WBC and EOS counts, mitigating the immunosuppressive effects of CPA. Moreover, PMT effectively alleviated CPA-induced thymic atrophy, as evidenced by increased thymus size, improved histological structure, and restoration of the thymus index. Flow cytometric and immunohistochemical analyses further revealed that PMT treatment significantly reversed CPA-induced reductions in the CD3e+CD4+ and CD3e+CD8+ T lymphocyte populations, thereby enhancing overall immune function. While these findings provide strong evidence for the protective and restorative effects of PMT against CPA-induced immunosuppression, further studies are required to fully elucidate its mechanistic pathways and long-term safety. Investigating PMT’s effects on other key immune markers, its influence on different immunosuppressive models, and potential clinical applications will be crucial in establishing its therapeutic potential. Additionally, future research should focus on identifying active compounds within PMT responsible for its immunomodulatory properties, as well as assessing its pharmacokinetics and bioavailability to optimize its efficacy in clinical settings. Collectively, this study highlights PMT as a promising immunomodulatory agent, with potential applications in managing immune dysfunctions associated with immunosuppressive conditions.

Supplementary Materials

The following supporting information can be downloaded at: https://www.mdpi.com/article/10.3390/app15063235/s1, Figure S1: Effect of PMT on CD25 expression in lymphocytes of the CPA-treated mice. Figure S2: Effect of PMT on thymus size, weight, histology, and thymus index in the CPA-treated mice. Table S1: Comparison of immunosuppressive effects of the different CPA doses in mice.

Author Contributions

Conceptualization, J.Y.H. and B.R.C.; methodology, B.R.C., D.R.P. and J.E.Y.; validation, J.Y.H. and B.R.C.; formal analysis, B.R.C., D.R.P. and J.E.Y.; investigation, B.R.C. and D.R.P.; resources, I.-H.H.; data curation, J.Y.H. and B.R.C.; writing—original draft preparation, J.Y.H.; writing—review and editing, J.Y.S., Y.J.L. and I.-H.H.; visualization, J.Y.H.; supervision, Y.J.L. and I.-H.H.; project administration, I.-H.H.; funding acquisition, I.-H.H. All authors have read and agreed to the published version of the manuscript.

Funding

This research was funded by the Jaseng Medical Foundation, Korea.

Institutional Review Board Statement

Not applicable.

Informed Consent Statement

Not applicable.

Data Availability Statement

Data is contained within the article and Supplementary Material.

Conflicts of Interest

The authors declare no conflict of interest.

Abbreviations

The following abbreviations are used in this manuscript:
BASOBasophil
Con Aconcanavalin A
CPAcyclophosphamide
ELISAenzyme-linked immunosorbent assay
EOSeosinophil
H&Ehematoxylin and eosin
IACUCInstitutional Animal Care and Use Committee
ILinterleukin
LYMlymphocyte
MONOmonocyte
NEUneutrophil
PEphycoerythrin
PMTgagam-palmultang
qPCRquantitative PCR
SEMstandard error of the mean
WBCwhite blood cell

References

  1. Marshall, J.S.; Warrington, R.; Watson, W.; Kim, H.L. An introduction to immunology and immunopathology. Allergy Asthma Clin. Immunol. 2018, 14, 49. [Google Scholar] [CrossRef] [PubMed]
  2. Moudgil, K.D.; Venkatesha, S.H. The Anti-Inflammatory and Immunomodulatory Activities of Natural Products to Control Autoimmune Inflammation. Int. J. Mol. Sci. 2022, 24, 95. [Google Scholar] [CrossRef] [PubMed]
  3. Reale, M.; Conti, L.; Velluto, D. Immune and Inflammatory-Mediated Disorders: From Bench to Bedside. J. Immunol. Res. 2018, 2018, 7197931. [Google Scholar] [CrossRef]
  4. Alhazmi, H.A.; Najmi, A.; Javed, S.A.; Sultana, S.; Al Bratty, M.; Makeen, H.A.; Meraya, A.M.; Ahsan, W.; Mohan, S.; Taha, M.M.E.; et al. Medicinal Plants and Isolated Molecules Demonstrating Immunomodulation Activity as Potential Alternative Therapies for Viral Diseases Including COVID-19. Front. Immunol. 2021, 12, 637553. [Google Scholar] [CrossRef]
  5. Shi, J.; Weng, J.-H.; Mitchison, T.J. Immunomodulatory drug discovery from herbal medicines: Insights from organ-specific activity and xenobiotic defenses. eLife 2021, 10, e73673. [Google Scholar] [CrossRef]
  6. Gao, G.-Z.; Nan, Z. Korean-Chinese-English oriental medicine dictionary; Publication Department. Maeil Health Newspaper, 2001. [Google Scholar]
  7. Oh, Y.-C.; Jeong, Y.H.; Cho, W.-K.; Gu, M.-J.; Ma, J.Y. Inhibitory effects of palmultang on inflammatory mediator production related to suppression of NF-kappaB and MAPK pathways and induction of HO-1 expression in macrophages. Int. J. Mol. Sci. 2014, 15, 8443–8457. [Google Scholar] [CrossRef]
  8. Joo, J.-M.; Baek, S.-H.; Kim, E.-H.; Kim, D.-C. The effect of Palmultang (八物湯) on the ovarian functions and differential gene expression of caspase-3, MAPK and MPG in female mice. J. Korean Obstet. Gynecol. 2007, 20, 91–110. [Google Scholar]
  9. Shin, I.-S.; Lee, M.-Y.; Seo, C.-S.; Lim, H.-S.; Kim, J.-H.; Jeon, W.-Y.; Shin, H.-K.J. Palmul-tang, a traditional herbal formula, protects against ethanol-induced acute gastric injury in rats. J. Korean Med. 2011, 32, 74–84. [Google Scholar]
  10. Kim, Y.R.; Kwon, M.Y.; Pak, M.E.; Park, S.H.; Baek, J.U.; Choi, B.T. Beneficial Effects of Gagam-Palmultang on Scopolamine-Induced Memory Deficits in Mice. Evid.-Based Complement. Altern. Med. 2018, 2018, 3479083. [Google Scholar] [CrossRef]
  11. Rhim, E.-K.; Shin, S.-H.J. Protective effects of Palmul-tang on hypoxia-induced apoptosis in H9c2 cardiomyoblast cells. Soc. Korean Med. 2004, 25, 67–76. [Google Scholar]
  12. Choi, L.Y.; Kim, M.H.; Nam, Y.K.; Kim, J.H.; Cho, H.-Y.; Yang, W.M. Palmul-tang, a Korean medicine, promotes bone formation Via bmp-2 pathway in osteoporosis. Front. Pharmacol. 2021, 12, 643482. [Google Scholar] [CrossRef] [PubMed]
  13. Peng, K.-W.; Myers, R.; Greenslade, A.; Mader, E.; Greiner, S.; Federspiel, M.J.; Dispenzieri, A.; Russell, S.J. Using clinically approved cyclophosphamide regimens to control the humoral immune response to oncolytic viruses. Gene Ther. 2013, 20, 255–261. [Google Scholar] [CrossRef]
  14. Kim, H.; Hong, J.Y.; Lee, J.; Yeo, C.; Jeon, W.-J.; Lee, Y.J.; Ha, I.-H. Immune-boosting effect of Yookgong-dan against cyclophosphamide-induced immunosuppression in mice. Heliyon 2024, 10, e24033. [Google Scholar] [CrossRef]
  15. Iyer, S.S.; Cheng, G. Role of Interleukin 10 transcriptional regulation in inflammation and autoimmune disease. Crit. Rev. Immunol. 2012, 32, 23–63. [Google Scholar] [CrossRef]
  16. Hsu, P.; Santner-Nanan, B.; Hu, M.; Skarratt, K.; Lee, C.H.; Stormon, M.; Wong, M.; Fuller, S.J.; Nanan, R. IL-10 Potentiates Differentiation of Human Induced Regulatory T Cells via STAT3 and Foxo1. J. Immunol. 2015, 195, 3665–3674. [Google Scholar] [CrossRef]
  17. Carlini, V.; Noonan, D.M.; Abdalalem, E.; Goletti, D.; Sansone, C.; Calabrone, L.; Albini, A. The multifaceted nature of IL-10: Regulation, role in immunological homeostasis and its relevance to cancer, COVID-19 and post-COVID conditions. Front. Immunol. 2023, 14, 1161067. [Google Scholar] [CrossRef] [PubMed]
  18. Feng, Q.; Yao, J.; Zhou, G.; Xia, W.; Lyu, J.; Li, X.; Zhao, T.; Zhang, G.; Zhao, N.; Yang, J. Quantitative Proteomic Analysis Reveals That Arctigenin Alleviates Concanavalin A-Induced Hepatitis Through Suppressing Immune System and Regulating Autophagy. Front. Immunol. 2018, 9, 1881. [Google Scholar] [CrossRef] [PubMed]
  19. Tanno, D.; Yokoyama, R.; Kawamura, K.; Kitai, Y.; Yuan, X.; Ishii, K.; De Jesus, M.; Yamamoto, H.; Sato, K.; Miyasaka, T.; et al. Dectin-2-mediated signaling triggered by the cell wall polysaccharides of Cryptococcus neoformans. Microbiol. Immunol. 2019, 63, 500–512. [Google Scholar] [CrossRef]
  20. Gao, R.; Li, X.; Gao, H.; Zhao, K.; Liu, X.; Liu, J.; Wang, Q.; Zhu, Y.; Chen, H.; Xiang, S.; et al. Protein phosphatase 2A catalytic subunit β suppresses PMA/ionomycin-induced T-cell activation by negatively regulating PI3K/Akt signaling. FEBS J. 2022, 289, 4518–4535. [Google Scholar] [CrossRef]
  21. Ren, F.; Chen, X.; Hesketh, J.; Gan, F.; Huang, K. Selenium promotes T-cell response to TCR-stimulation and ConA, but not PHA in primary porcine splenocytes. PLoS ONE 2012, 7, e35375. [Google Scholar] [CrossRef]
  22. Shinohara, Y.; Tsukimoto, M. Adenine Nucleotides Attenuate Murine T Cell Activation Induced by Concanavalin A or T Cell Receptor Stimulation. Front. Pharmacol. 2017, 8, 986. [Google Scholar] [CrossRef] [PubMed]
  23. Kim, H.; Kim, J.W.; Kim, Y.-K.; Ku, S.K.; Lee, H.-J. Immunoenhancement Effects of the Herbal Formula Hemomine on Cyclophosphamide-Induced Immunosuppression in Mice. Appl. Sci. 2022, 12, 4935. [Google Scholar] [CrossRef]
  24. Park, H.-R.; Kim, J.W.; Lee, J.-O.; Ahn, J.-D.; Yang, M.-C.; Bashir, K.M.I.; Choi, J.-S.; Ku, S.-K. Anti-Mutagenic and Immunomodulatory Effects of Astragali Radix Extract on a Cyclophosphamide-Induced Immunosuppressed Mouse Model. Appl. Sci. 2023, 13, 2959. [Google Scholar] [CrossRef]
  25. Huyan, X.-H.; Lin, Y.-P.; Gao, T.; Chen, R.-Y.; Fan, Y.-M. Immunosuppressive effect of cyclophosphamide on white blood cells and lymphocyte subpopulations from peripheral blood of Balb/c mice. Int. Immunopharmacol. 2011, 11, 1293–1297. [Google Scholar] [CrossRef]
  26. Kim, J.W.; Choi, J.-S.; Seol, D.J.; Choung, J.J.; Ku, S.K. Immunomodulatory Effects of Kuseonwangdogo-Based Mixed Herbal Formula Extracts on a Cyclophosphamide-Induced Immunosuppression Mouse Model. Evid.-Based Complement. Altern. Med. 2018, 2018, 6017412. [Google Scholar] [CrossRef] [PubMed]
  27. Refaie, M.M.; El-Hussieny, M.; Bayoumi, A.M.; Shehata, S.; Welson, N.N.; Abdelzaher, W.Y. Simvastatin cardioprotection in cyclophosphamide-induced toxicity via the modulation of inflammasome/caspase1/interleukin1β pathway. Hum. Exp. Toxicol. 2022, 41, 9603271221111440. [Google Scholar] [CrossRef] [PubMed]
  28. Kim, J.-K.; Kim, J.-Y.; Jang, S.-E.; Choi, M.-S.; Jang, H.-M.; Yoo, H.-H.; Kim, D.-H. Fermented Red Ginseng Alleviates Cyclophosphamide-Induced Immunosuppression and 2,4,6-Trinitrobenzenesulfonic Acid-Induced Colitis in Mice by Regulating Macrophage Activation and T Cell Differentiation. Am. J. Chin. Med. 2018, 46, 1879–1897. [Google Scholar] [CrossRef]
  29. Chen, L.-X.; Qi, Y.-L.; Qi, Z.; Gao, K.; Gong, R.-Z.; Shao, Z.-J.; Liu, S.-X.; Li, S.-S.; Sun, Y.-S. A Comparative Study on the Effects of Different Parts of Panax ginseng on the Immune Activity of Cyclophosphamide-Induced Immunosuppressed Mice. Molecules 2019, 24, 1096. [Google Scholar] [CrossRef]
  30. Liu, X.; Zhang, Z.; Liu, J.; Wang, Y.; Zhou, Q.; Wang, S.; Wang, X. Ginsenoside Rg3 improves cyclophosphamide-induced immunocompetence in Balb/c mice. Int. Immunopharmacol. 2019, 72, 98–111. [Google Scholar] [CrossRef]
  31. Jia, D.; Lu, W.; Wang, C.; Sun, S.; Cai, G.; Li, Y.; Wang, G.; Liu, Y.; Zhang, M.; Wang, D. Investigation on Immunomodulatory Activity of Calf Spleen Extractive Injection in Cyclophosphamide-induced Immunosuppressed Mice and Underlying Mechanisms. Scand. J. Immunol. 2016, 84, 20–27. [Google Scholar] [CrossRef]
  32. Monmai, C.; You, S.; Park, W.J. Immune-enhancing effects of anionic macromolecules extracted from Codium fragile on cyclophosphamide-treated mice. PLoS ONE 2019, 14, e0211570. [Google Scholar] [CrossRef] [PubMed]
  33. Qi, Q.; Dong, Z.; Sun, Y.; Li, S.; Zhao, Z. Protective Effect of Bergenin against Cyclophosphamide-Induced Immunosuppression by Immunomodulatory Effect and Antioxidation in Balb/c Mice. Molecules 2018, 23, 2668. [Google Scholar] [CrossRef] [PubMed]
  34. Shirani, K.; Hassani, F.V.; Razavi-Azarkhiavi, K.; Heidari, S.; Zanjani, B.R.; Karimi, G. Phytotrapy of cyclophosphamide-induced immunosuppression. Environ. Toxicol. Pharmacol. 2015, 39, 1262–1275. [Google Scholar] [CrossRef] [PubMed]
  35. Zuluaga, A.F.; Salazar, B.E.; Rodriguez, C.A.; Zapata, A.X.; Agudelo, M.; Vesga, O. Neutropenia induced in outbred mice by a simplified low-dose cyclophosphamide regimen: Characterization and applicability to diverse experimental models of infectious diseases. BMC Infect. Dis. 2006, 6, 55. [Google Scholar] [CrossRef]
  36. den Haan, J.M.; Arens, R.; van Zelm, M.C. The activation of the adaptive immune system: Cross-talk between antigen-presenting cells, T cells and B cells. Immunol. Lett. 2014, 162, 103–112. [Google Scholar] [CrossRef]
  37. Serbina, N.V.; Jia, T.; Hohl, T.M.; Pamer, E.G. Monocyte-mediated defense against microbial pathogens. Annu. Rev. Immunol. 2008, 26, 421–452. [Google Scholar] [CrossRef]
  38. Strandmark, J.; Rausch, S.; Hartmann, S. Eosinophils in Homeostasis and Their Contrasting Roles during Inflammation and Helminth Infections. Crit. Rev. Immunol. 2016, 36, 193–238. [Google Scholar] [CrossRef]
  39. Bronte, V.; Pittet, M.J. The spleen in local and systemic regulation of immunity. Immunity 2013, 39, 806–818. [Google Scholar] [CrossRef]
  40. Wei, Y.; Wang, T.; Liao, L.; Fan, X.; Chang, L.; Hashimoto, K. Brain-spleen axis in health and diseases: A review and future perspective. Brain Res. Bull. 2022, 182, 130–140. [Google Scholar] [CrossRef]
  41. Kolb, J.-P.B.; Poupon, M.-F.M.; Lespinats, G.M.; Sabolovic, D.; Loisillier, F. Splenic modifications induced by cyclophosphamide in C3H/He, nude, and “B” mice. J. Immunol. 1977, 118, 1595–1599. [Google Scholar] [CrossRef]
  42. Krank, M.D.; MacQueen, G.M. Conditioned compensatory responses elicited by environmental signals for cyclophosphamide-induced suppression of antibody production in mice. Psychobiology 1988, 16, 229–235. [Google Scholar] [CrossRef]
  43. Feng, L.; Huang, Q.; Huang, Z.; Li, H.; Qi, X.; Wang, Y.; Liu, Z.; Liu, X.; Lu, L. Optimized Animal Model of Cyclophosphamide-induced Bone Marrow Suppression. Basic Clin. Pharmacol. Toxicol. 2016, 119, 428–435. [Google Scholar] [CrossRef] [PubMed]
  44. Wang, Y.; Meng, Q.; Qiao, H.; Jiang, H.; Sun, X. Role of the spleen in cyclophosphamide-induced hematosuppression and extramedullary hematopoiesis in mice. Arch. Med. Res. 2009, 40, 249–255. [Google Scholar] [CrossRef]
  45. Ge, Y.; Yoon, S.-H.; Jang, H.; Jeong, J.-H.; Lee, Y.-M. Decursin promotes HIF-1α proteasomal degradation and immune responses in hypoxic tumour microenvironment. Phytomedicine 2020, 78, 153318. [Google Scholar] [CrossRef]
  46. Sestito, S.; Ibba, R.; Riu, F.; Carpi, S.; Carta, A.; Manera, C.; Habtemariam, S.; Yeskaliyeva, B.; Almarhoon, Z.M.; Sharifi-Rad, J.; et al. Anticancer potential of decursin, decursinol angelate, and decursinol from Angelica gigas Nakai: A comprehensive review and future therapeutic prospects. Food Sci. Nutr. 2024, 12, 6970–6989. [Google Scholar] [CrossRef]
  47. Xu, X.; Tao, N.; Sun, C.; Hoffman, R.D.; Shi, D.; Ying, Y.; Dong, S.; Gao, J. Ligustilide prevents thymic immune senescence by regulating Thymosin β15-dependent spatial distribution of thymic epithelial cells. Phytomedicine 2024, 123, 155216. [Google Scholar] [CrossRef]
  48. Yuan, C.; Sha, X.; Xiong, M.; Zhong, W.; Wei, Y.; Li, M.; Tao, S.; Mou, F.; Peng, F.; Zhang, C. Uncovering dynamic evolution in the plastid genome of seven Ligusticum species provides insights into species discrimination and phylogenetic implications. Sci. Rep. 2021, 11, 988. [Google Scholar] [CrossRef]
  49. Bhattamisra, S.K.; Koh, H.M.; Lim, S.Y.; Choudhury, H.; Pandey, M. Molecular and Biochemical Pathways of Catalpol in Alleviating Diabetes Mellitus and Its Complications. Biomolecules 2021, 11, 323. [Google Scholar] [CrossRef] [PubMed]
  50. Guo, L.; Cho, S.Y.; Kang, S.S.; Lee, S.-H.; Baek, H.-Y.; Kim, Y.S. Orthogonal array design for optimizing extraction efficiency of active constituents from Jakyak-Gamcho Decoction, the complex formula of herbal medicines, Paeoniae Radix and Glycyrrhizae Radix. J. Ethnopharmacol. 2007, 113, 306–311. [Google Scholar] [CrossRef]
  51. Zhang, L.; Wei, W. Anti-inflammatory and immunoregulatory effects of paeoniflorin and total glucosides of paeony. Pharmacol. Ther. 2020, 207, 107452. [Google Scholar] [CrossRef]
  52. Zhang, R.-X.; Li, M.-X.; Jia, Z.-P. Rehmannia glutinosa: Review of botany, chemistry and pharmacology. J. Ethnopharmacol. 2008, 117, 199–214. [Google Scholar] [CrossRef] [PubMed]
  53. Kang, S.-W.; Min, H.-Y. Ginseng, the ’Immunity Boost’: The Effects of Panax ginseng on Immune System. J. Ginseng Res. 2012, 36, 354–368. [Google Scholar] [CrossRef]
  54. You, L.; Cha, S.; Kim, M.-Y.; Cho, J.Y. Ginsenosides are active ingredients in Panax ginseng with immunomodulatory properties from cellular to organismal levels. J. Ginseng Res. 2022, 46, 711–721. [Google Scholar] [CrossRef] [PubMed]
  55. Li, Y.; Ye, Y.; Chen, H. Astragaloside IV inhibits cell migration and viability of hepatocellular carcinoma cells via suppressing long noncoding RNA ATB. Biomed. Pharmacother. 2018, 99, 134–141. [Google Scholar] [CrossRef]
  56. Zhang, J.; Wu, C.; Gao, L.; Du, G.; Qin, X. Astragaloside IV derived from Astragalus membranaceus: A research review on the pharmacological effects. Adv. Pharmacol. 2020, 87, 89–112. [Google Scholar] [CrossRef] [PubMed]
  57. Li, X.-L.; Zhou, A.-G.; Zhang, L.; Chen, W.-J. Antioxidant status and immune activity of glycyrrhizin in allergic rhinitis mice. Int. J. Mol. Sci. 2011, 12, 905–916. [Google Scholar] [CrossRef]
  58. Wang, Z.; Yang, X.; Wang, X.; Liang, F.; Tang, Y. Glycyrrhizin attenuates caspase-11-dependent immune responses and coagulopathy by targeting high mobility group box 1. Int. Immunopharmacol. 2022, 107, 108713. [Google Scholar] [CrossRef]
  59. Wei, C.; Wang, H.; Sun, X.; Bai, Z.; Wang, J.; Bai, G.; Yao, Q.; Xu, Y.; Zhang, L. Pharmacological profiles and therapeutic applications of pachymic acid (Review). Exp. Ther. Med. 2022, 24, 547. [Google Scholar] [CrossRef]
  60. Xu, H.; Van der Jeught, K.; Zhou, Z.; Zhang, L.; Yu, T.; Sun, Y.; Li, Y.; Wan, C.; So, K.M.; Liu, D.; et al. Atractylenolide I enhances responsiveness to immune checkpoint blockade therapy by activating tumor antigen presentation. J. Clin. Investig. 2021, 131, e146832. [Google Scholar] [CrossRef]
  61. Zhao, Z.-J.; Sun, Y.-L.; Ruan, X.-F. Bornyl acetate: A promising agent in phytomedicine for inflammation and immune modulation. Phytomedicine 2023, 114, 154781. [Google Scholar] [CrossRef]
  62. Zhu, B.; Zhang, Q.-L.; Hua, J.-W.; Cheng, W.-L.; Qin, L.-P. The traditional uses, phytochemistry, and pharmacology of Atractylodes macrocephala Koidz.: A review. J. Ethnopharmacol. 2018, 226, 143–167. [Google Scholar] [CrossRef]
  63. Liu, S.; Li, J.; Feng, L. Gallic acid regulates immune response in a mouse model of rheumatoid arthritis. Immun. Inflamm. Dis. 2023, 11, e782. [Google Scholar] [CrossRef] [PubMed]
  64. Wang, B.; Han, L.; Liu, J.-M.; Zhang, J.; Wang, W.; Li, B.-G.; Dong, C.-X.; Bai, C.-C. Lycium Genus Polysaccharide: An Overview of its Extraction, Structures, Pharmacological Activities and Biological Applications. Separations 2022, 9, 197. [Google Scholar] [CrossRef]
  65. Zhang, X.; Chen, S.; Li, X.; Zhang, L.; Ren, L. Flavonoids as Potential Antiviral Agents for Porcine Viruses. Pharmaceutics 2022, 14, 1793. [Google Scholar] [CrossRef] [PubMed]
  66. Pázmándi, K.; Szöllősi, A.G.; Fekete, T. The “root” causes behind the anti-inflammatory actions of ginger compounds in immune cells. Front. Immunol. 2024, 15, 1400956. [Google Scholar] [CrossRef]
Scheme 1. Experimental timeline of the in vitro study.
Applsci 15 03235 sch001
Scheme 2. Experimental timeline of the in vivo study.
Applsci 15 03235 sch002
Figure 1. Effect of PMT on IL-10 expression in the Con A-treated mouse primary splenocytes. (A) IL-10 mRNA expression levels were analyzed using qRT-PCR in the mouse primary splenocytes treated with PMT (100 and 200 μg/mL) in the presence or absence of Con A. (B) IL-10 protein levels were measured by ELISA in the culture supernatants of splenocytes treated with PMT (100 and 200 μg/mL) in the presence or absence of Con A. All the data are expressed as the means ± SEM (n = 4). Statistical significance was determined using one-way ANOVA followed by Tukey’s post hoc test. Note: ## p < 0.01 blank vs. Con A; & p < 0.05, &&& p < 0.001, and &&&& p < 0.0001 vs. the blank group; ** p < 0.01 and **** p < 0.0001 vs. the Con A group.
Applsci 15 03235 g001
Figure 2. Effect of PMT on body weight changes and hematological parameters in the CPA-treated mice. (A) Percentage of body weight gain in the normal, CPA-, and PMT-administered groups. (BF) Hematological analysis of (B) the white blood cell (WBC) count, (C) the neutrophil (NEU) count, (D) the lymphocyte (LYM) count, (E) the monocyte (MONO) count, and (F) the eosinophil (EOS) count in whole blood following CPA-induced immunosuppression and PMT administration (100 and 200 mg/kg). Data are presented as the means ± SEM (n = 6). Statistical significance was determined using one-way ANOVA followed by Tukey’s post hoc test. Note: ## p < 0.01, ### p < 0.001, and #### p < 0.0001 vs. the normal group; * p < 0.05 and ** p < 0.01 vs. the CPA group.
Applsci 15 03235 g002
Figure 3. Effect of PMT on thymus size, weight, histology, and thymus index in the CPA-treated mice. (A) Representative thymus tissue images from each group at 14 days. White scale bar = 200 μm. (B) Quantitative analysis of thymus weight across the different treatment groups. (C) Histological evaluation of thymic architecture using H&E staining. Black scale bar = 200 μm, red scale bar = 40 μm. (D) Thymus index (thymus weight/body weight ratio) across different treatment groups. Data are presented as the means ± SEM (n = 6). Statistical significance was determined using one-way ANOVA followed by Tukey’s post hoc test. Note: #### p < 0.0001 vs. the normal group; ** p < 0.01 and *** p < 0.001 vs. the CPA group.
Applsci 15 03235 g003
Figure 4. Effect of PMT on T-lymphocyte subsets and CD3+ T-cell activity in the CPA-treated mice. (A) Illustrative flow cytometry scatter plots displaying the CD3e+CD4+ T cell populations in the thymus of each group. (B) Quantification of the CD3e+CD4+ T cell percentages across the different groups. (C) Representative flow cytometry dot plots showing the CD3e+CD8+ T cell populations in the thymus of each group. (D) Quantification of the CD3e+CD8+ T cell percentages across the different groups. (E) Immunohistochemical staining of CD3+ T lymphocytes in thymic tissues. Black scale bars = 200 μm, red scale bar = 40 μm. (F) Quantification of the CD3+ T cell proportions based on immunohistochemical analysis of thymic tissue. Data are presented as the means ± SEM (n = 6). Statistical significance was determined using one-way ANOVA followed by Tukey’s post hoc test. Note: # p < 0.05 and #### p < 0.0001 vs. the normal group; * p < 0.05, ** p < 0.01, and *** p < 0.001 vs. the CPA group.
Applsci 15 03235 g004
Table 1. Composition of gagam-palmultang.
Scientific Name of the HerbSourcePartAmount (%)
Angelica gigas NakaiRepublic of KoreaRoot8.98
Ligusticum officinale (Makino) KitagRepublic of KoreaRhizome5.99
Paeonia japonica (Makino) Miyabe & H.TakedaRepublic of KoreaRoot5.99
Rehmannia glutinosa (Gaertn.) DC.Republic of KoreaRoot11.98
Panax ginseng C.A.Mey.Republic of KoreaRoot5.99
Poria cocosRepublic of KoreaDried sclerotia5.99
Astragalus mongholicus Bunge.Republic of KoreaRoot11.98
Glycyrrhiza uralensis Fisch.Republic of KoreaRadices5.99
Amomum villosum Lour.VietnamDry ripe fruit4.19
Atractylodes macrocephala Koidz.Republic of KoreaRhizome5.99
Dimocarpus longan Lour.ThailandAril11.98
Lycium chinense Mill.Republic of KoreaFruit5.99
Crataegus pinnatifida BungeRepublic of KoreaFruit5.99
Zingiber officinale RoscoeRepublic of KoreaDry rhizome2.99
Total amount 100
Disclaimer/Publisher’s Note: The statements, opinions and data contained in all publications are solely those of the individual author(s) and contributor(s) and not of MDPI and/or the editor(s). MDPI and/or the editor(s) disclaim responsibility for any injury to people or property resulting from any ideas, methods, instructions or products referred to in the content.

