1. Introduction
Climate change and rising energy costs have driven global initiatives to improve energy efficiency and sustainability [
1]. The industrial sector plays a significant role in these efforts, as it is one of the largest consumers of energy worldwide. In 2015, the United Nations adopted the Paris Agreement, aiming to limit global temperature rise to well below 2 °C above pre-industrial levels, with efforts to cap warming at 1.5 °C [
2,
3]. The Glasgow Climate Pact (COP26) further reinforced these commitments, emphasizing the urgency of reducing greenhouse gas emissions to mitigate climate change [
4].
In this context, industrial energy consumption is a key area for targeted efficiency improvements, as manufacturing and production processes account for a major share of electricity use across different regions. For example, in the UK, the industry sector accounted for 16% of total electricity consumption in 2023, while the remaining electricity was used by domestic, transport, and service sectors, including agriculture and commercial and public administration activities [
5]. Similar trends are observed in other industrialized nations, where manufacturing and industrial processes represent a major share of energy consumption. Understanding these sectoral energy demands is essential for developing targeted strategies to enhance efficiency and reduce overall consumption.
Within the industry sector, electric machines and drives account for the largest share of electricity consumption. However, a significant portion of their energy-saving potential remains unrealized, primarily due to insufficient transparency and limited visibility into energy consumption patterns within production processes [
6].
Industry 4.0’s digitalization and interconnectedness offer a solution by enhancing process transparency. Real-time monitoring and data-driven decisions help identify inefficiencies, optimize energy use, and support a climate-friendly circular economy. However, one of the main challenges in implementing different aspects of Industry 4.0 is the growing engineering skills gap. As noted by Petit et al. [
7], a shortage of employees with the necessary qualifications is a major obstacle to implementing I4.0 technologies. This rising demand for skilled, cross-disciplinary engineers capable of adopting emerging technologies highlights the need for stronger cooperation between universities and businesses. Such collaboration can help bridge the skills gap and accelerate the adoption of new technologies.
Mitsubishi Electric Air Conditioning Systems Europe Ltd. (M-ACE), a manufacturing facility in Scotland, is in the process of adopting Industry 4.0 (I4.0) technologies to improve machine performance and production efficiency. A key focus has been on energy monitoring and cost reduction, aligning with broader sustainability goals. However, M-ACE also faces challenges related to the engineering skills gap, which has hindered the implementation of Smart Factory solutions. This shortage of skilled professionals has necessitated additional collaboration to develop and integrate these systems effectively.
To address this challenge, M-ACE established Knowledge Transfer Partnerships (KTP) with Glasgow Caledonian University (GCU) to develop Smart Factory solutions tailored to its needs and rapidly implement innovative projects. These collaborations were particularly relevant as M-ACE provided a real-world manufacturing environment, allowing solutions to be tested and deployed directly on live production lines [
8]. Through this partnership, it was possible to access real data, assets, and infrastructure, ensuring the practical application of Smart Factory techniques to drive tangible business improvements.
As part of these collaborations, a structured, step-by-step approach has been developed to establish an effective and efficient energy monitoring system. The process begins with identifying relevant energy consumers and determining their nominal power using technical data sheets. These energy consumers are then classified into two categories: static and dynamic. Static energy consumers are systems with energy consumption that remains relatively constant over time. For these systems, direct energy monitoring is not necessary, as their consumption can be estimated with reasonable accuracy based on their operating and idle times. On the other hand, dynamic energy consumers, whose energy usage varies depending on the load, require direct energy monitoring to accurately measure and analyze their consumption patterns. This distinction ensures that monitoring resources are allocated effectively, enabling M-ACE to optimize energy usage and improve overall efficiency.
Deploying Industry 4.0 technologies to monitor energy consumption in the dynamic energy consumers at M-ACE is highly dependent on the condition of the equipment. For older machinery, retrofitting is essential—not only to modernize the equipment for seamless communication, but also to enable control software upgrades without disrupting production [
9].
To assess the impact of such retrofitting, this study focuses on a critical machine suspected to be inefficient due to its age. By equipping it with sensors, valuable insights into its performance were obtained, supporting maintenance planning, quality control, and real-time production monitoring while minimizing operational disruptions.
Building on these findings, this paper details the installation of sensors to quantify the machine’s energy and air consumption, enhancing its efficiency through data-driven analysis. The proposed data acquisition system serves as a scalable model for similar machines in M-ACE and other industrial settings. In addition, this study aims to address key challenges in industrial energy monitoring. Specifically, we seek to answer the following research questions:
How can an IIoT-based monitoring system be effectively implemented in a 24/7 manufacturing environment with minimal disruption?
What are the scalability challenges in deploying real-time energy and air consumption monitoring across multiple machines?
How can collected data be leveraged to optimize energy use, detect inefficiencies, and support cost-saving strategies in manufacturing?
By addressing these questions, this research contributes to the development of scalable, data-driven industrial energy monitoring solutions that enhance efficiency and sustainability.
This article is structured as follows:
Section 2 presents a literature review of relevant research on IoT-based energy monitoring solutions, an overview of the machine, the challenges faced at M-ACE, and the implementation of the IoT-based energy and air consumption monitoring system.
Section 3 outlines the proposed solution, covering sensor selection, installation, network integration, and the monitoring dashboard. Finally,
Section 4 discusses the outcomes of the implementation, highlighting its impact and effectiveness.
2. Problem Description—Energy Monitoring in Industries
Efficient monitoring of electricity and air consumption in factories is essential for cost reduction and financial sustainability. By identifying inefficiencies and optimizing resource usage, manufacturers can lower utility costs while advancing toward net-zero emissions goals. Responsible resource management is increasingly critical as energy costs rise and environmental regulations tighten. Energy and consumption monitoring has been extensively studied in various research works.
For example, J. Lenz et al. [
10] developed an online energy monitoring and analysis tool to measure the energy consumption of individual components in a milling machine. Given the machine’s stock configuration, they retrofitted it with a power monitoring PLC module and integrated it with the main PLC, enabling external data requests via the OPC-UA interface. By analyzing the captured energy data, they identified inefficiencies and optimized the machine’s auxiliary components, achieving a 28% reduction in power consumption without altering the machining process, including the feed rate and spindle operation.
In another study, F. Lima et al. [
11] retrofitted a 20-year-old CNC machine with an energy meter, enabling wireless data transmission via the Energy Window ZigBee protocol (IEEE 802.15 [
12]) to a Power Link concentrator (Schneider Electric). The data were then sent via Modbus over TCP/IP to a Siemens IoT 2040 gateway, which aggregated and transmitted it to Siemens MindSphere (Version 3.0) and GRV Software Cloud (Version 0.3.2), integrating the machine into an IoT-enabled smart manufacturing system.
In another study, A.A. Mirani et al. [
13] developed an IoT-driven energy monitoring system that utilized edge computing to optimize industrial energy management. Their system was structured into three main layers: an energy metering system, an edge gateway, and a cloud layer. At the device level, wired and wireless energy meters were used to monitor both movable and stationary assets, collecting key consumption parameters and transmitting data in JSON format to an edge server. The edge gateway processed these data, stored them in a PostgreSQL database, computed additional parameters, and provided a local interface for real-time monitoring. Additionally, filtered data were sent to the cloud for remote access. The system was designed for efficient data handling, minimizing CPU usage (5.58%) while mitigating network-related disruptions, thereby enhancing reliability in industrial energy monitoring.
M. Anusha et al. [
14] developed an IoT-enabled smart energy meter that utilized a ESP32 microcontroller, a Hall effect sensor, a voltage sensor, and ThingSpeak software (Version 2.0.1) to monitor energy consumption in real time. Their system incorporated key components, including an SCT103 Hall effect sensor for current measurement and a ZMPT101B sensor for voltage detection, to ensure precise data collection. The ESP32 microcontroller functioned as the central processing unit, facilitating data transmission via Wi-Fi to the ThingSpeak platform, where users could track energy consumption trends and patterns. A 16 × 2 LCD display, connected through the I2C communication protocol, presented real-time power usage information. Additionally, the system supported advanced features such as graphical data visualization, continuous monitoring, and potential future improvements, including automated alerts for excessive power consumption. Their findings demonstrated the potential of IoT in energy management, enabling users to make informed decisions for optimizing energy use and promoting sustainability.
S. Tsyrulnyk et al. [
15] developed a cost-effective electricity monitoring system using the WeMos IoT module and ACS712-30 sensor, designed for seamless home automation integration. Utilizing wireless technology, the system ensured easy installation, scalability, and mobile compatibility. It employed an ESP8266 microcontroller within the WeMos D1 mini platform to transmit data via Wi-Fi to an MQTT broker, enabling remote power consumption tracking. Their study highlighted the potential of IoT-based monitoring for real-time energy insights, remote access, and improved energy efficiency.
In another study, R.V. Siva Balan et al. [
16] developed an IoT-based smart energy meter designed to automate electricity monitoring while improving accuracy and efficiency. Their system incorporated an Arduino Uno with an optical sensor to detect electric meter pulses and employed a wireless sensor network for automated meter readings via a smartphone application. Key components included a controller, an NB-IoT communication module, and cloud integration, enabling real-time data transmission and remote access. The system allowed utility providers to track energy consumption, automate billing, and remotely disconnect power in cases of non-payment, reducing human intervention and minimizing billing errors. The findings showed high accuracy in voltage and current measurements, demonstrating the system’s potential as a viable alternative to conventional meters.
L. Zhao et al. [
17] developed an IIoT-based monitoring system for power substations using an FPGA-embedded controller to track critical parameters such as voltage, frequency, power, circuit breaker status, and transformer temperatures in real time. The system incorporated event-triggering mechanisms that recorded and transferred data to a network-attached storage (NAS) device for further analysis. A high-precision GPS module ensured accurate timestamps and synchronization, while the FPGA controller enabled high-speed data acquisition, capturing both steady-state and transient power conditions. With secure data transmission over a local network, operators could remotely monitor and analyze system performance. Successfully deployed in a petrochemical facility, the system demonstrated its effectiveness by capturing fault events and providing valuable insights for improving substation reliability.
While these studies provide valuable insights into IIoT-based energy monitoring, they primarily focus on electricity consumption or isolated aspects of industrial resource usage. However, they do not comprehensively address the simultaneous measurement of both air and electricity consumption in manufacturing environments. Additionally, previous research has largely emphasized energy efficiency improvements without focusing on detecting system malfunctions such as air leaks or implementing automated shut-off mechanisms to reduce waste and enhance cost savings.
In this study, we bridge these gaps by developing and deploying a real-time IIoT-based energy and air consumption monitoring system, specifically tailored to a legacy industrial machine in a high-demand 24/7 production environment.
The key novelties and contributions of our work compared to previous studies are as follows:
Simultaneous Monitoring of Air and Electricity Consumption: Unlike prior works that focus solely on power consumption, our approach integrates both air and electricity monitoring, enabling a more comprehensive assessment of resource efficiency.
Automated Leak Detection and Shut-off Control: Our system not only detects air leaks, but also automatically shuts off airflow when the machine is idle, minimizing waste—an aspect not explored in previous studies.
Scalability and Real-time Data Acquisition via Modbus TCP/IP: We integrate an Ethernet-based Modbus TCP/IP communication protocol for real-time energy tracking, enhancing data accessibility and operational oversight compared to standalone monitoring systems.
Custom Sensor Integration for Legacy Machines: Retrofitting older machines often presents hardware and communication challenges. Our work successfully demonstrates an adaptable IIoT-based model that allows legacy machines to integrate into modern smart manufacturing ecosystems.
At M-ACE, implementing this IIoT-based energy and air consumption monitoring system presented several challenges, particularly due to the factory’s continuous 24/7 production cycle. Unlike conventional industrial environments where scheduled downtimes allow for maintenance and retrofits, the high operational demand at M-ACE left minimal opportunities for sensor installation and system integration. To mitigate disruptions, installation and configuration efforts had to be strategically planned and executed during short maintenance windows, ensuring that production efficiency remained unaffected. Additionally, retrofitting legacy machines required overcoming technical limitations, including limited built-in monitoring capabilities and lack of modern communication protocols.
2.1. Turret Punch Press
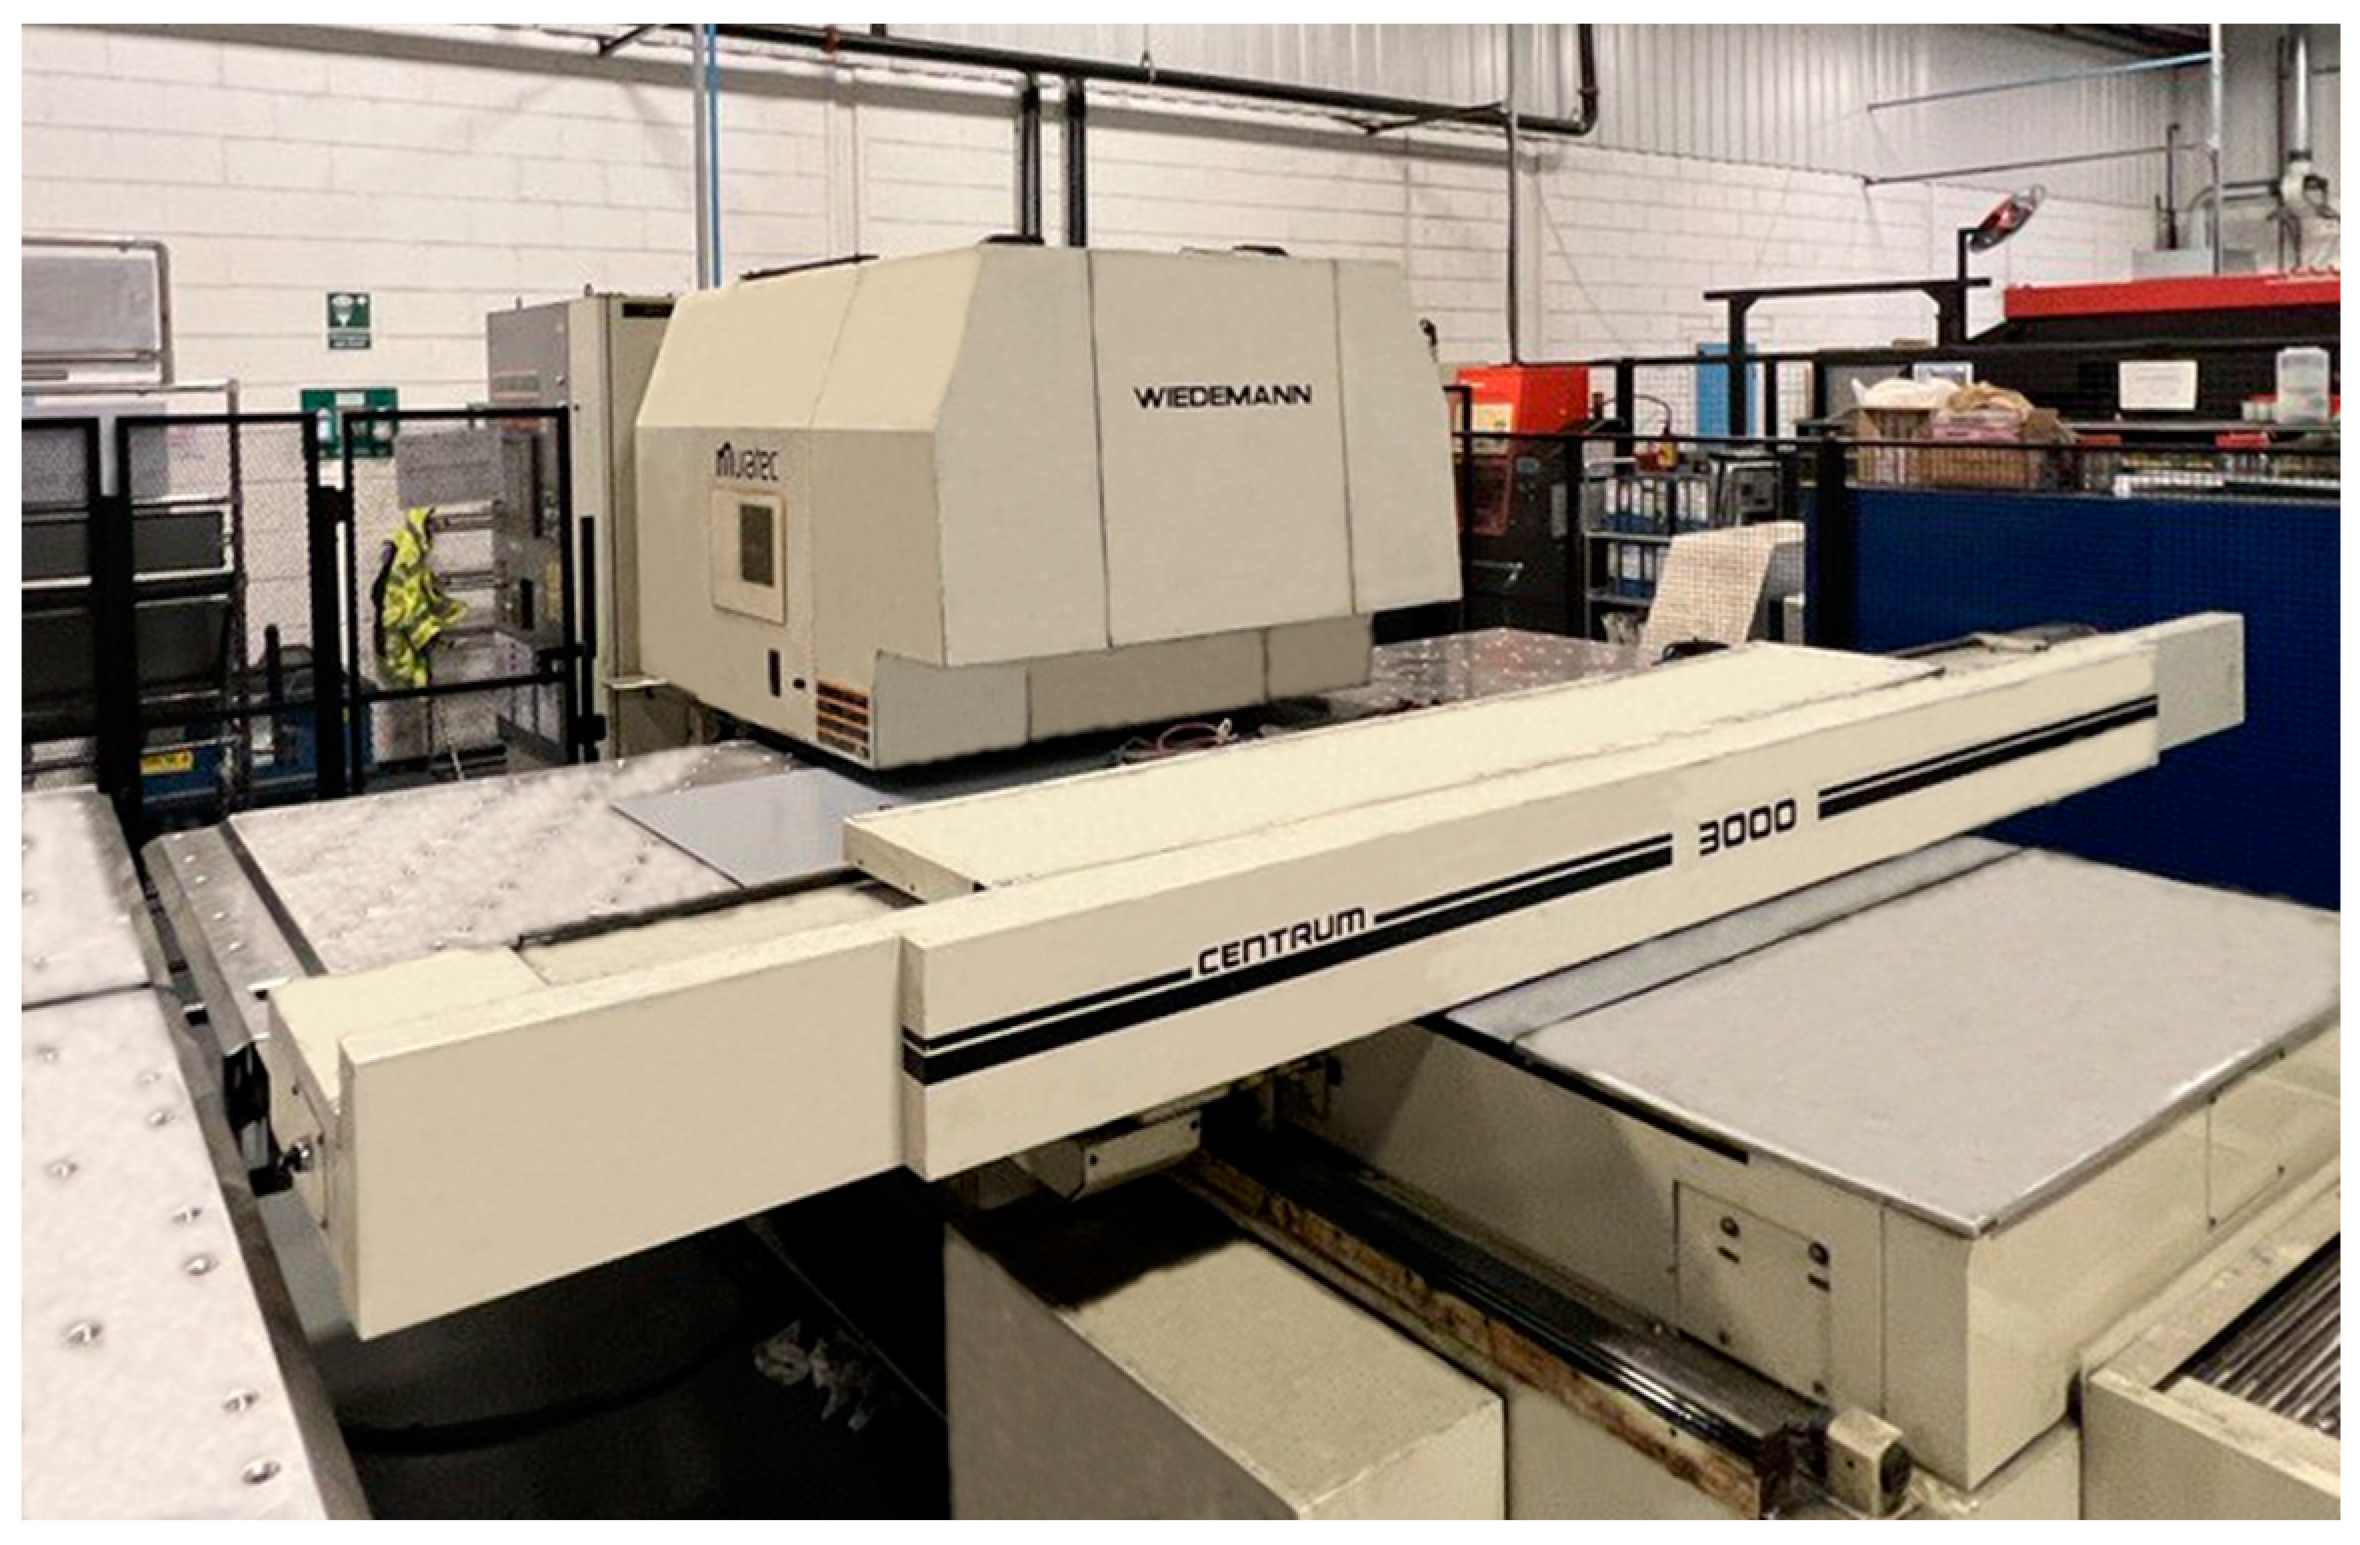
The machine analyzed in this research is an aging legacy Wiedemann Turret Punch Press (TPP), a crucial machine used for fabricating sheet metal components in air conditioning units. While reliable and versatile, this older model lacks modern features such as PLC-based control, factory network connectivity, and integrated data collection. Instead, it relies on outdated programmed diskettes, preventing automatic monitoring of runtime, energy usage, and efficiency.
Like many legacy machines, the Wiedemann TPP (
Figure 1) suffers from poor documentation and limited configuration control, making maintenance and optimization difficult. Investigations revealed that the machine frequently remains in standby mode due to uncertainties in production scheduling. While this ensures readiness, it also leads to significant resource waste, unnecessarily consuming electricity and compressed air.
With rising energy costs and a commitment to green initiatives, M-ACE recognizes the need to modernize its production process. Enhancing communication about machine downtime and optimizing product flow could reduce waste and improve efficiency. To address these challenges, a sensor-based monitoring system was introduced to track energy and air consumption, analyze usage patterns, and support data-driven decision-making.
2.2. IoT-Based Energy Monitoring System
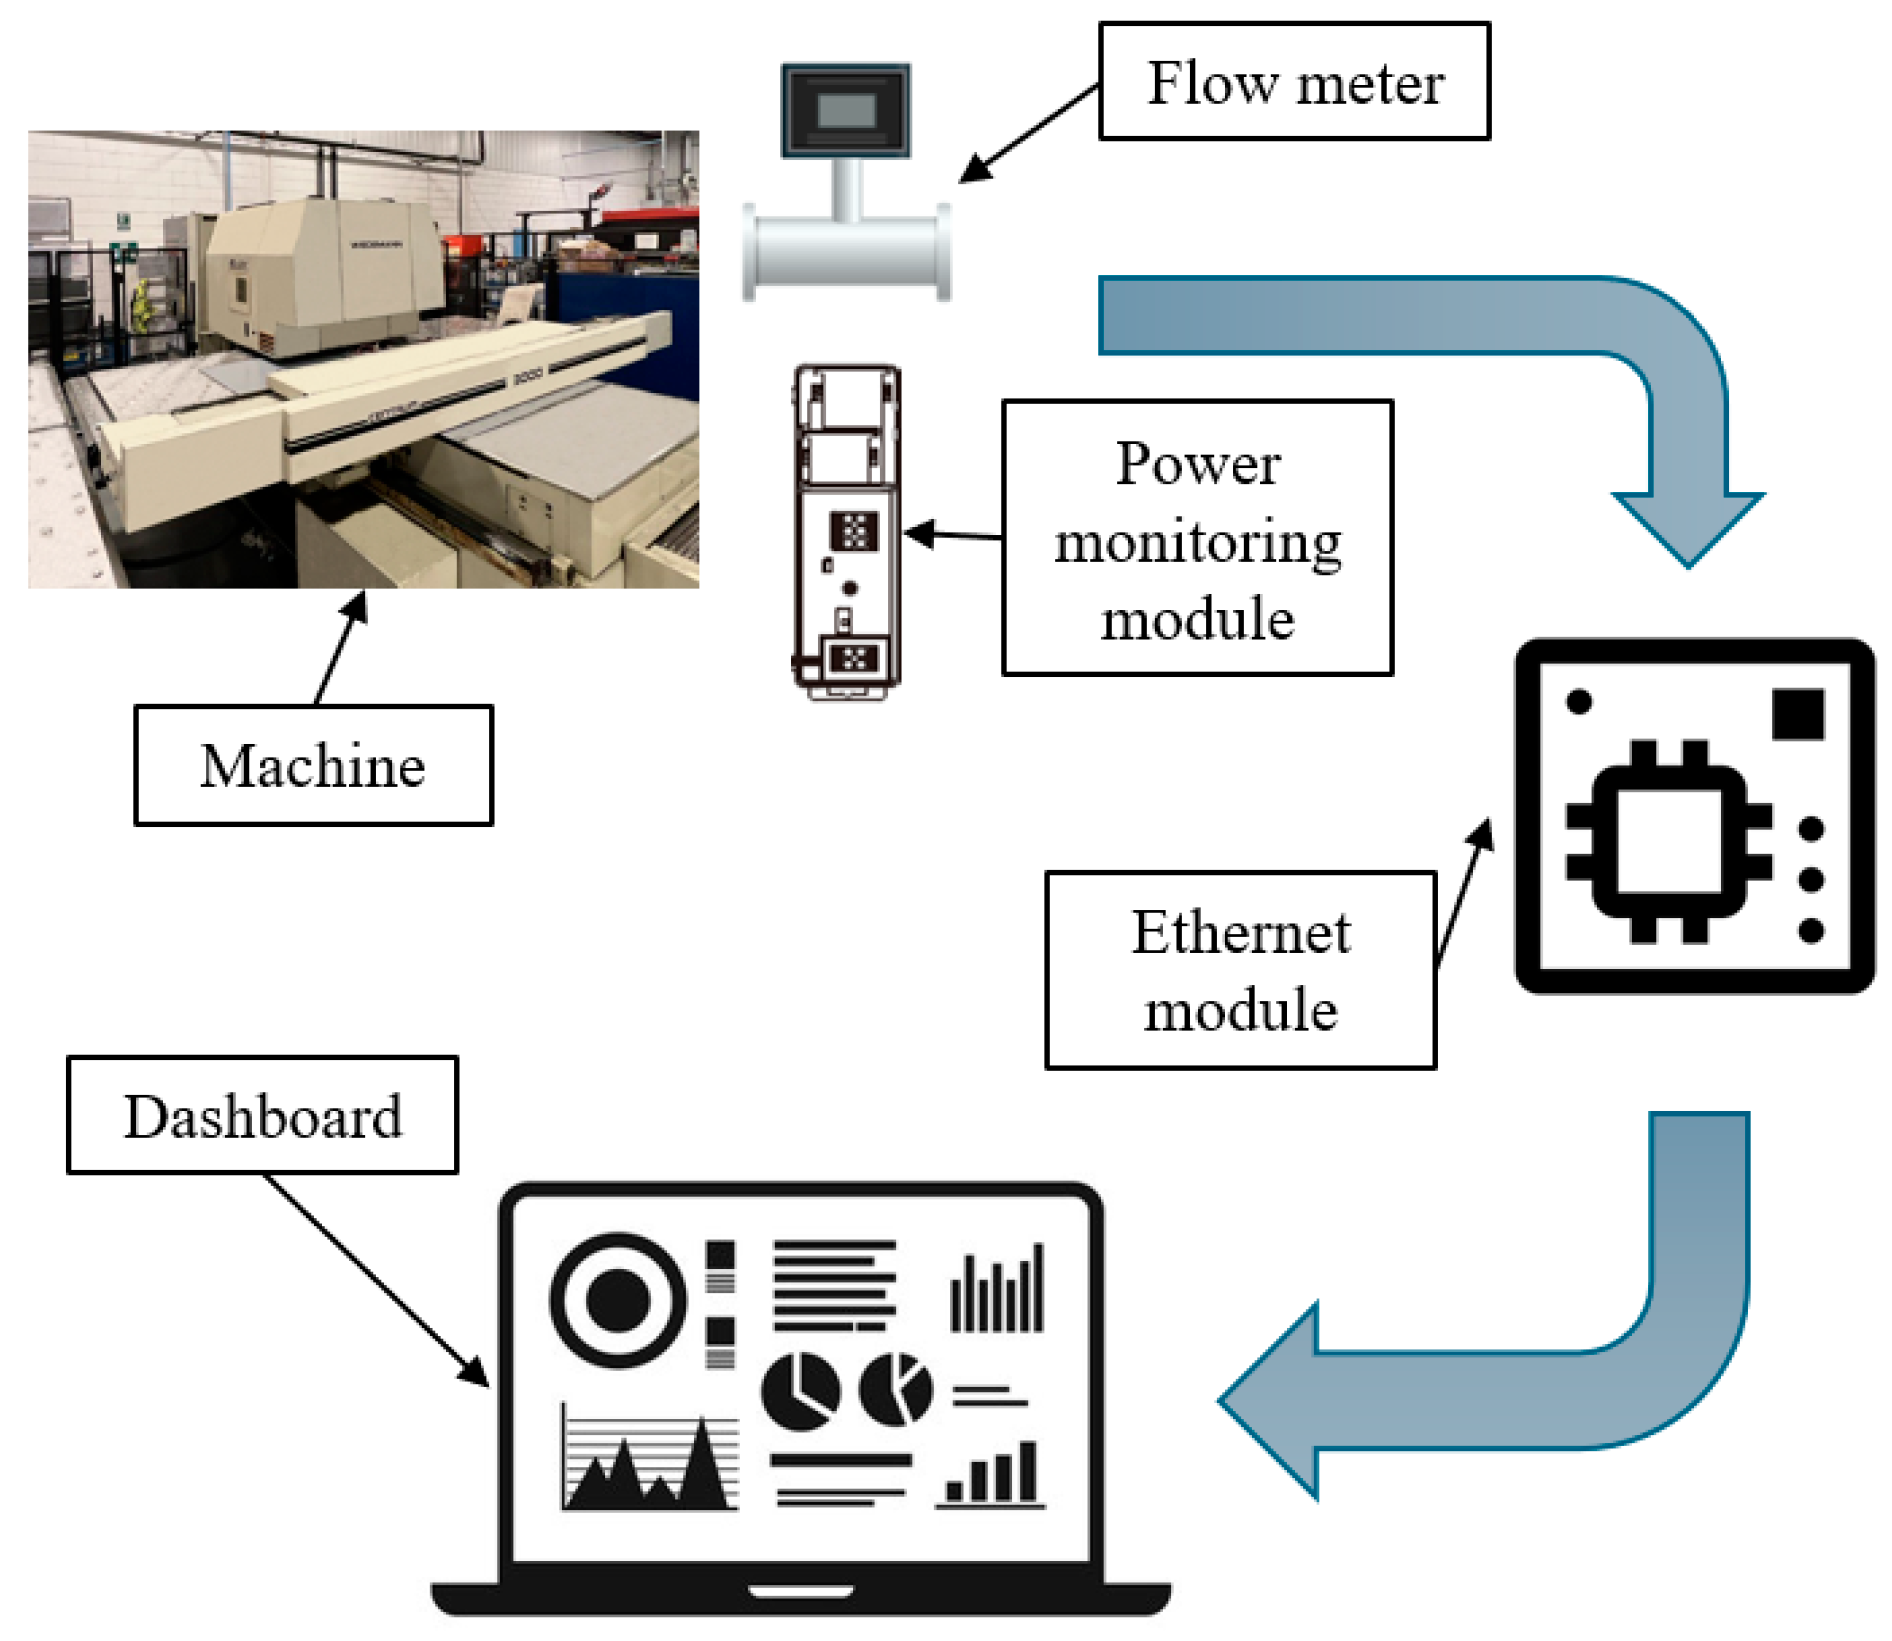
To enable real-time energy and air consumption monitoring, the Wiedemann TPP was retrofitted with an IoT-based system. The setup includes the following:
Smart flow/pressure meter to measure compressed air consumption and pressure.
Energy monitoring modules suitable for factory electrical systems (3-phase, 4-wire, 100–277V AC, 100A CTs) to track active power consumption.
Ethernet communication modules to transmit real-time data to an IoT platform via Modbus TCP/IP.
IoT dashboard for data visualization, storage, and further analysis.
Figure 2 illustrates the data flow from sensors and monitoring modules to the IoT platform.
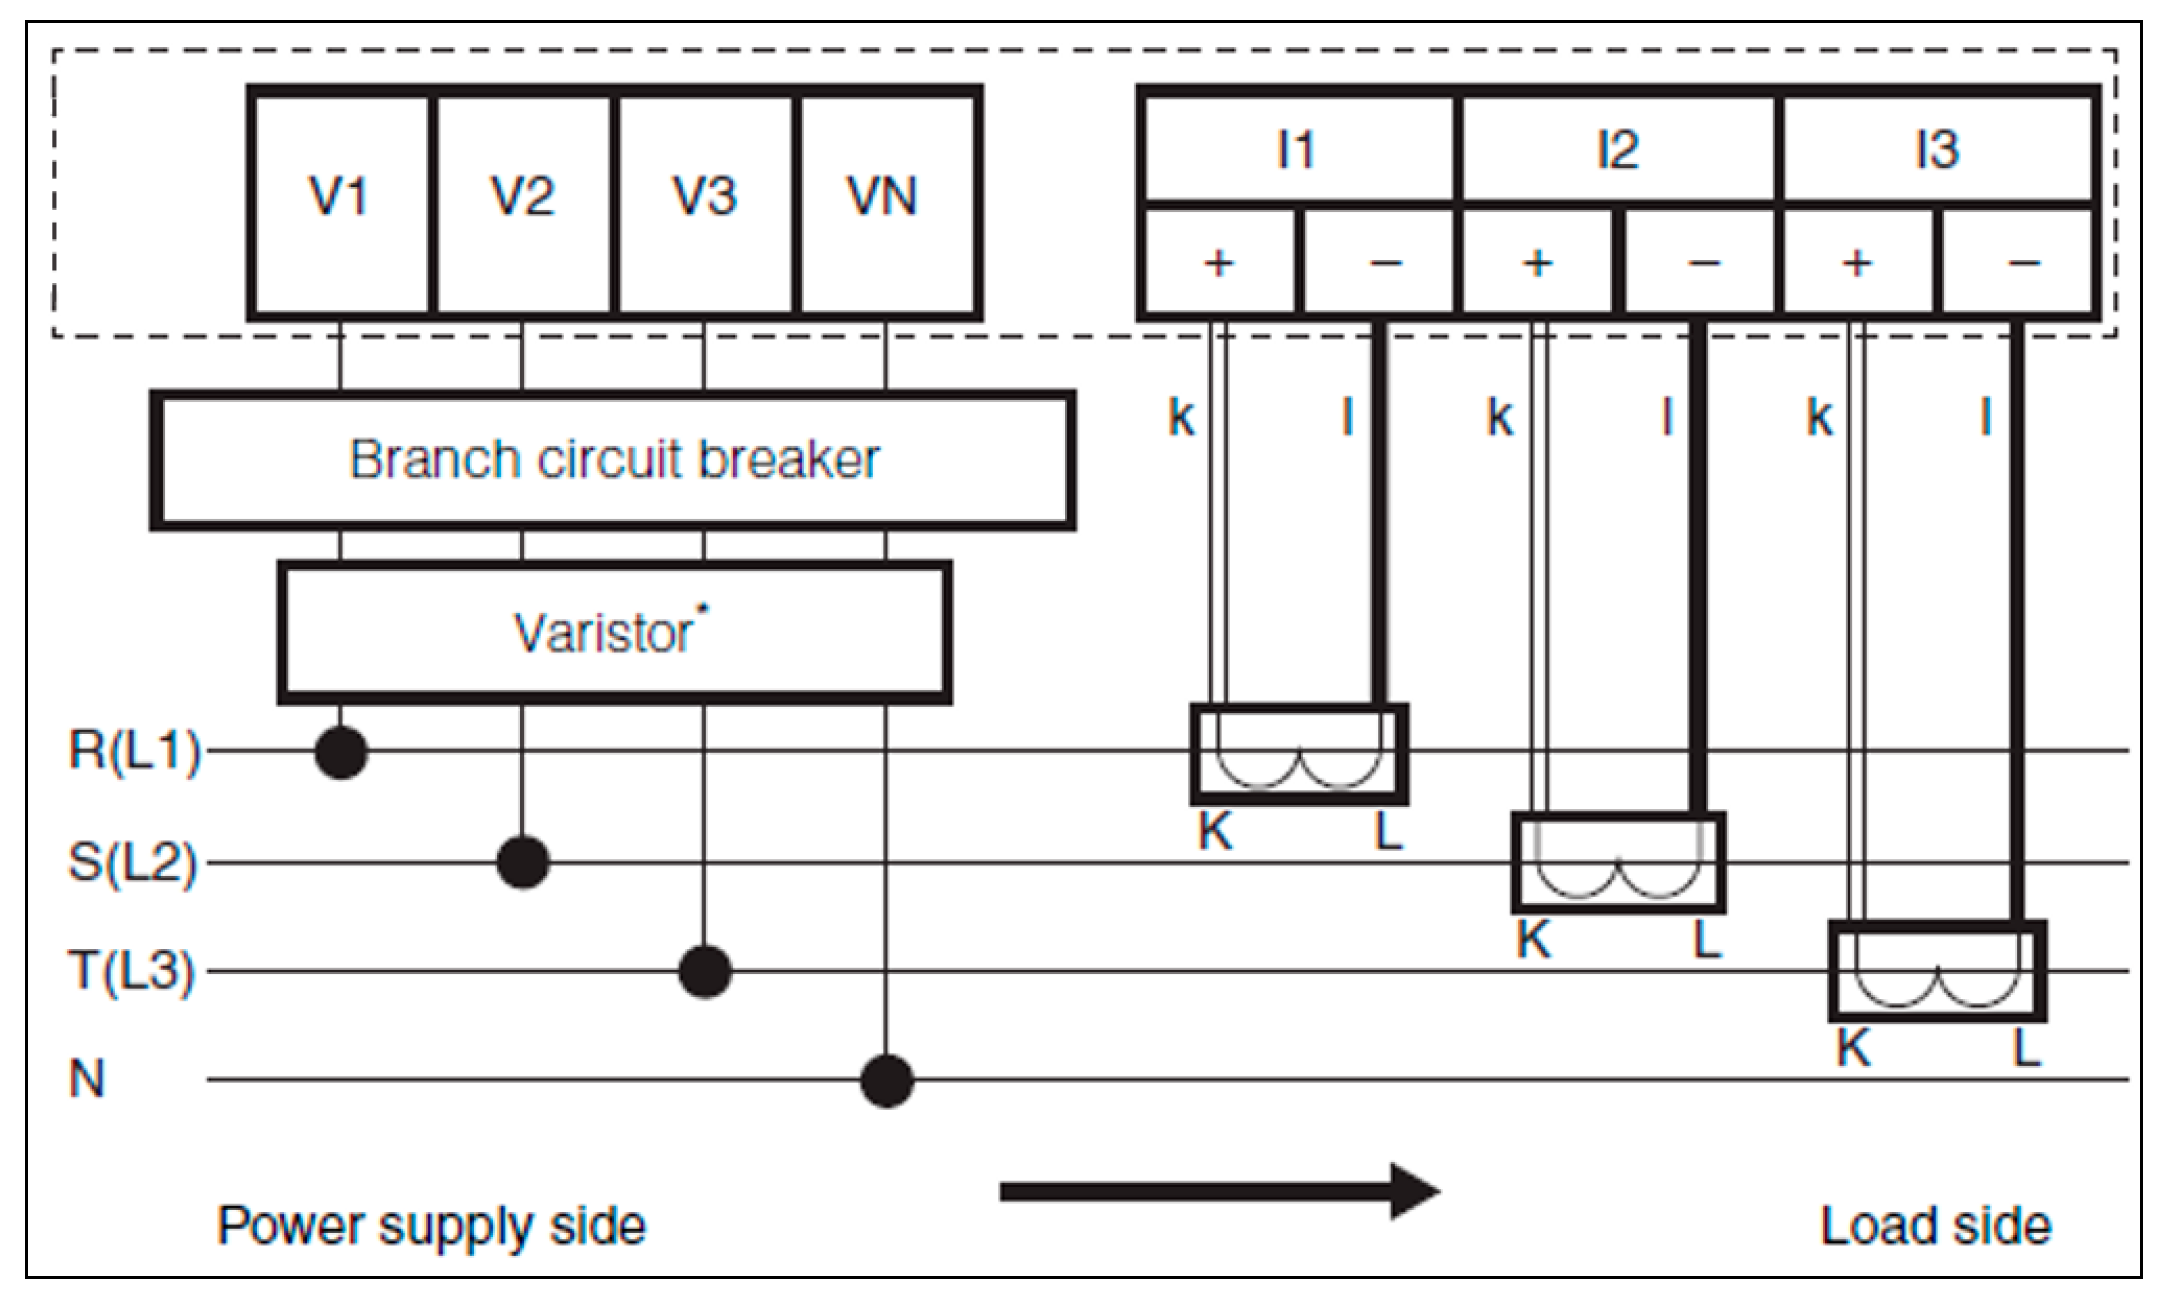
The system measures current and voltage (as shown in
Figure 3), calculates active power, and transmits the data to an edge device for processing and visualization. By integrating Industry 4.0 solutions, this system enhances visibility into machine operations, supporting predictive maintenance, cost reduction, and sustainability efforts at M-ACE.
3. Solution
3.1. Sensor Selection
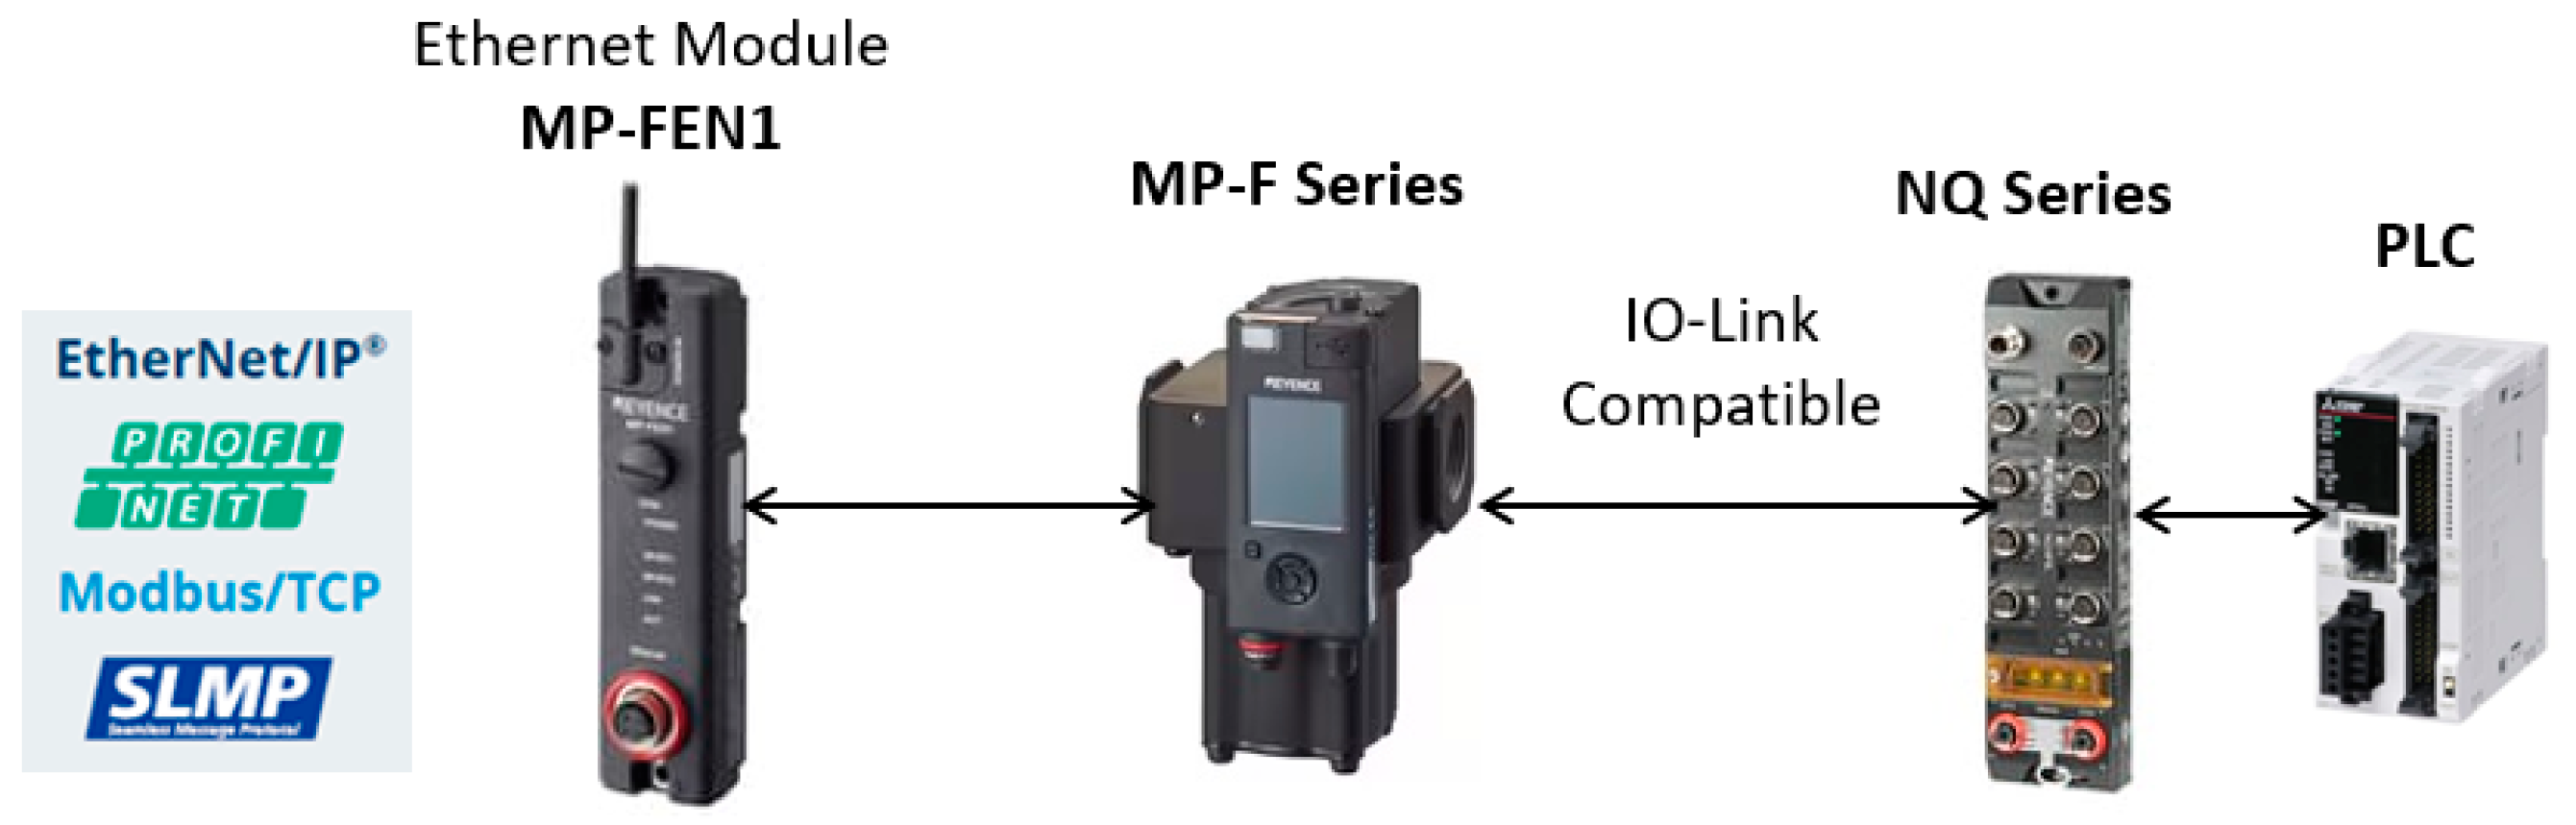
To enable effective monitoring of energy and air consumption from the Wiedemann TPP, KEYENCE MP-F series sensors (
Figure 4) were selected based on their functionality, ease of integration, and cost-effectiveness [
18]. These sensors measure critical air parameters, including pressure, temperature, and humidity, and can also track electricity consumption when used in conjunction with the KEYENCE MP-FEA1 Energy Monitor [
19]. Additionally, the built-in shut-off valve helps minimize air loss by automatically restricting airflow during equipment downtime, contributing to energy conservation.
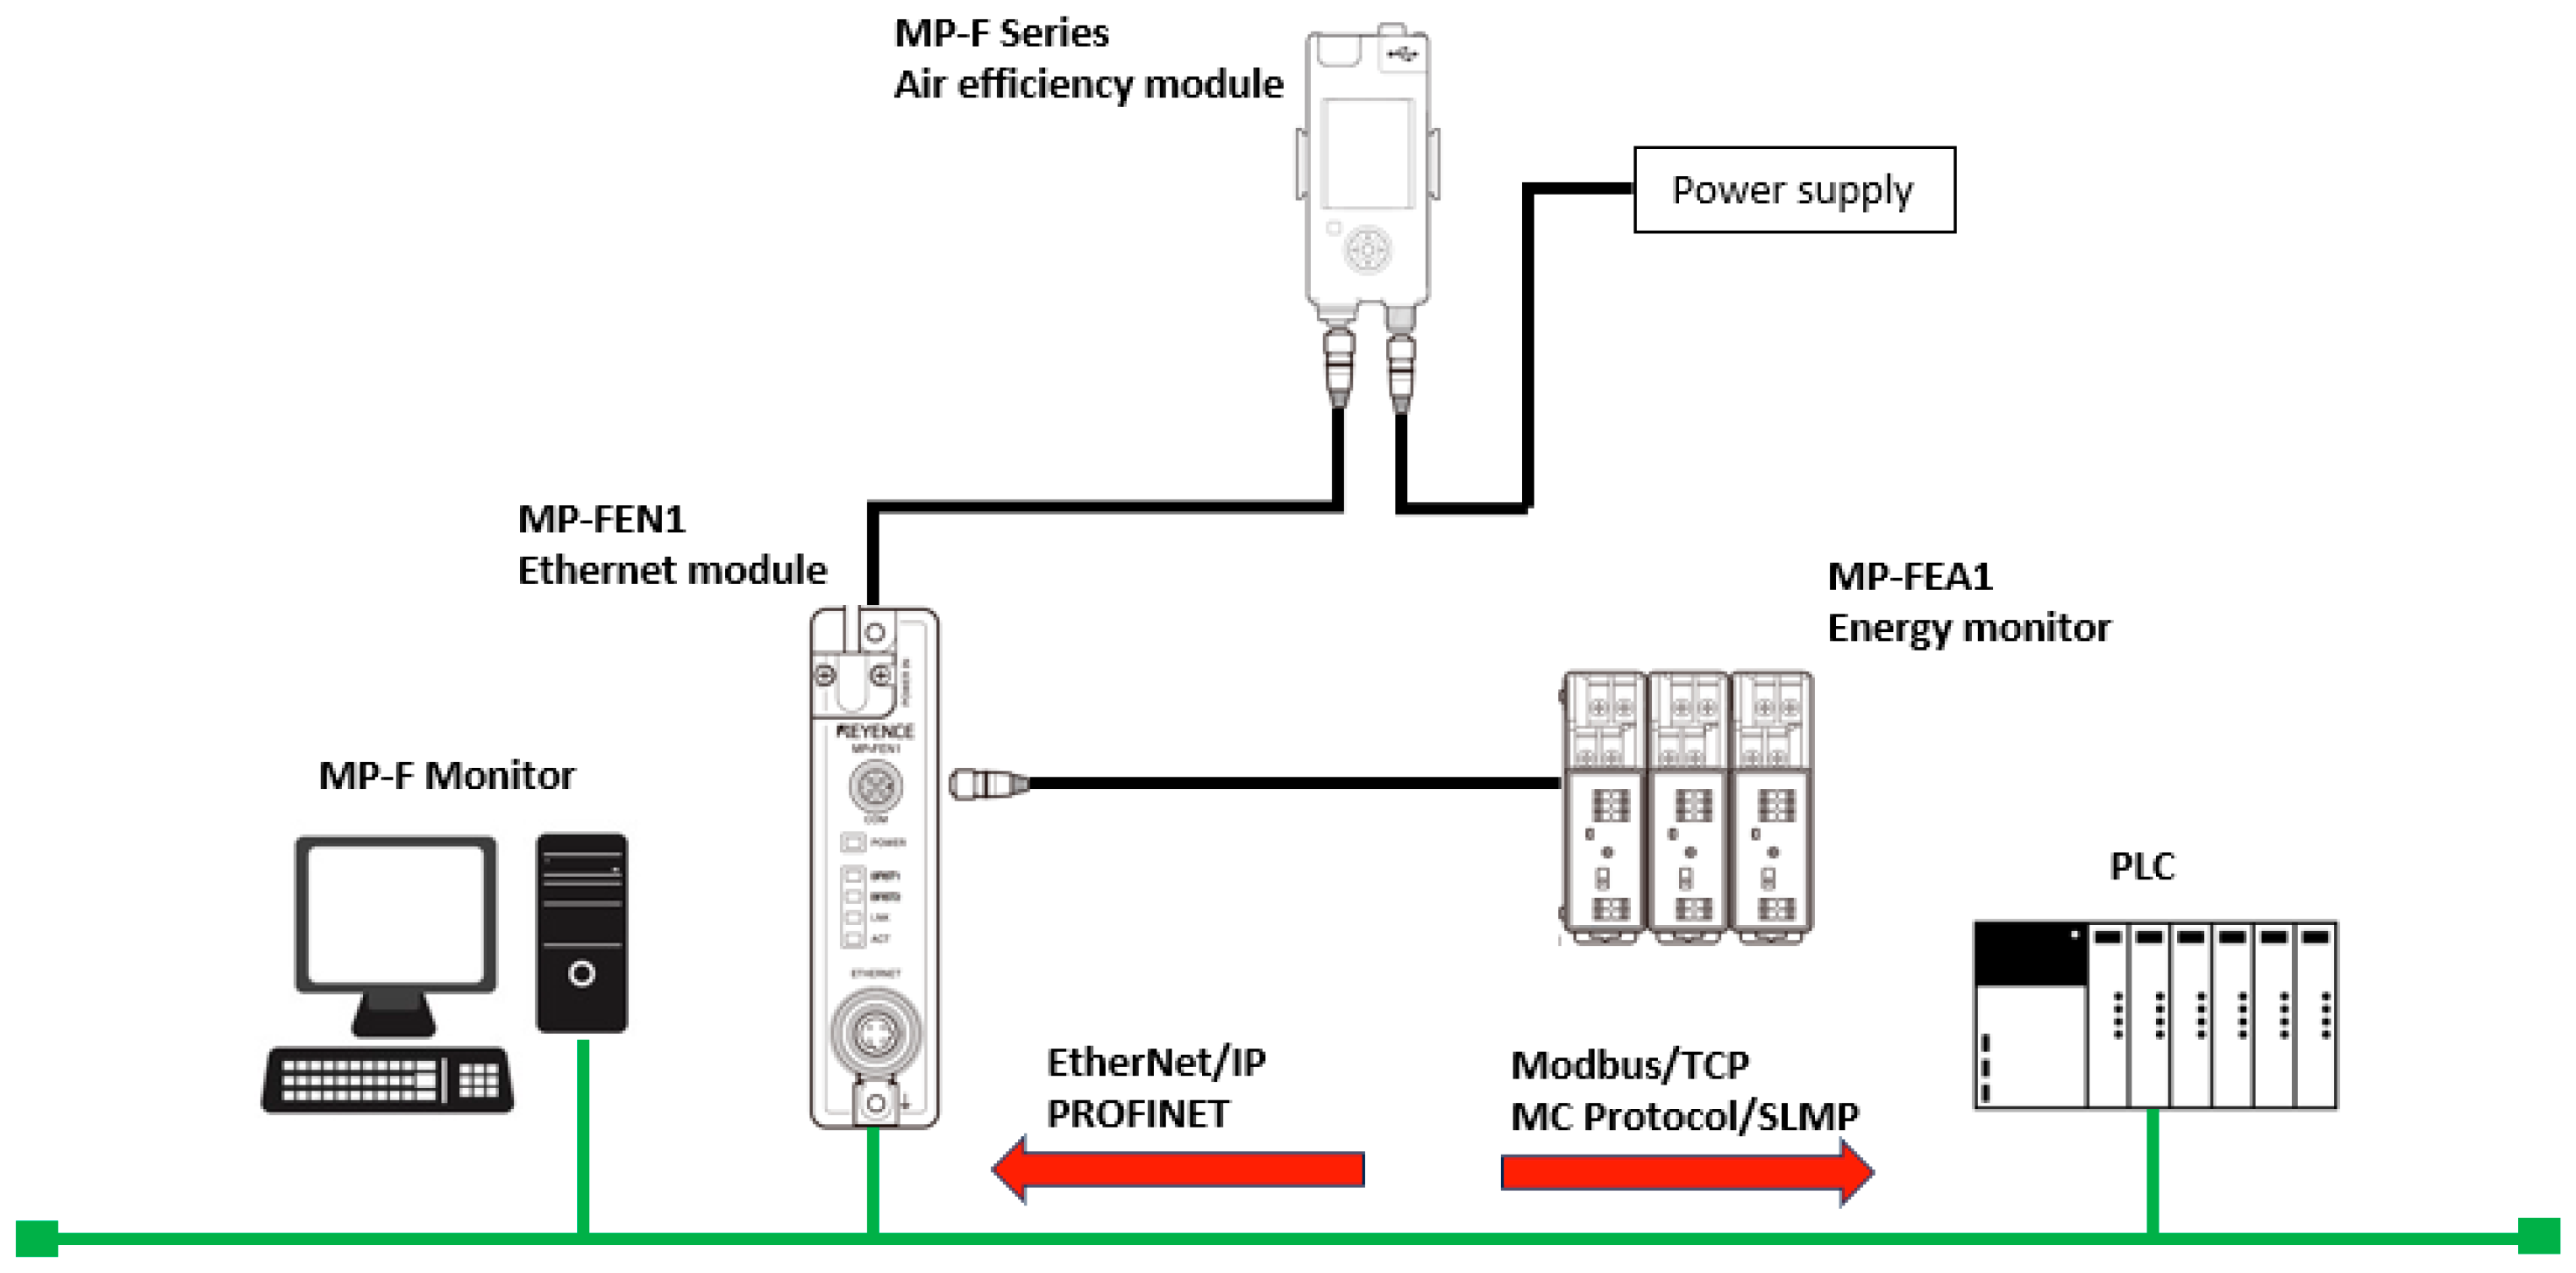
For data transmission and integration into the existing industrial network, these sensors support multiple communication protocols. They can interface with the KEYENCE MP-FEN1 Ethernet Module [
20] and NQ Series network communication modules [
21] (
Figure 4), facilitating seamless connectivity with industrial monitoring and control systems. This setup ensures compatibility with various communication standards, enabling efficient data collection and real-time analysis.
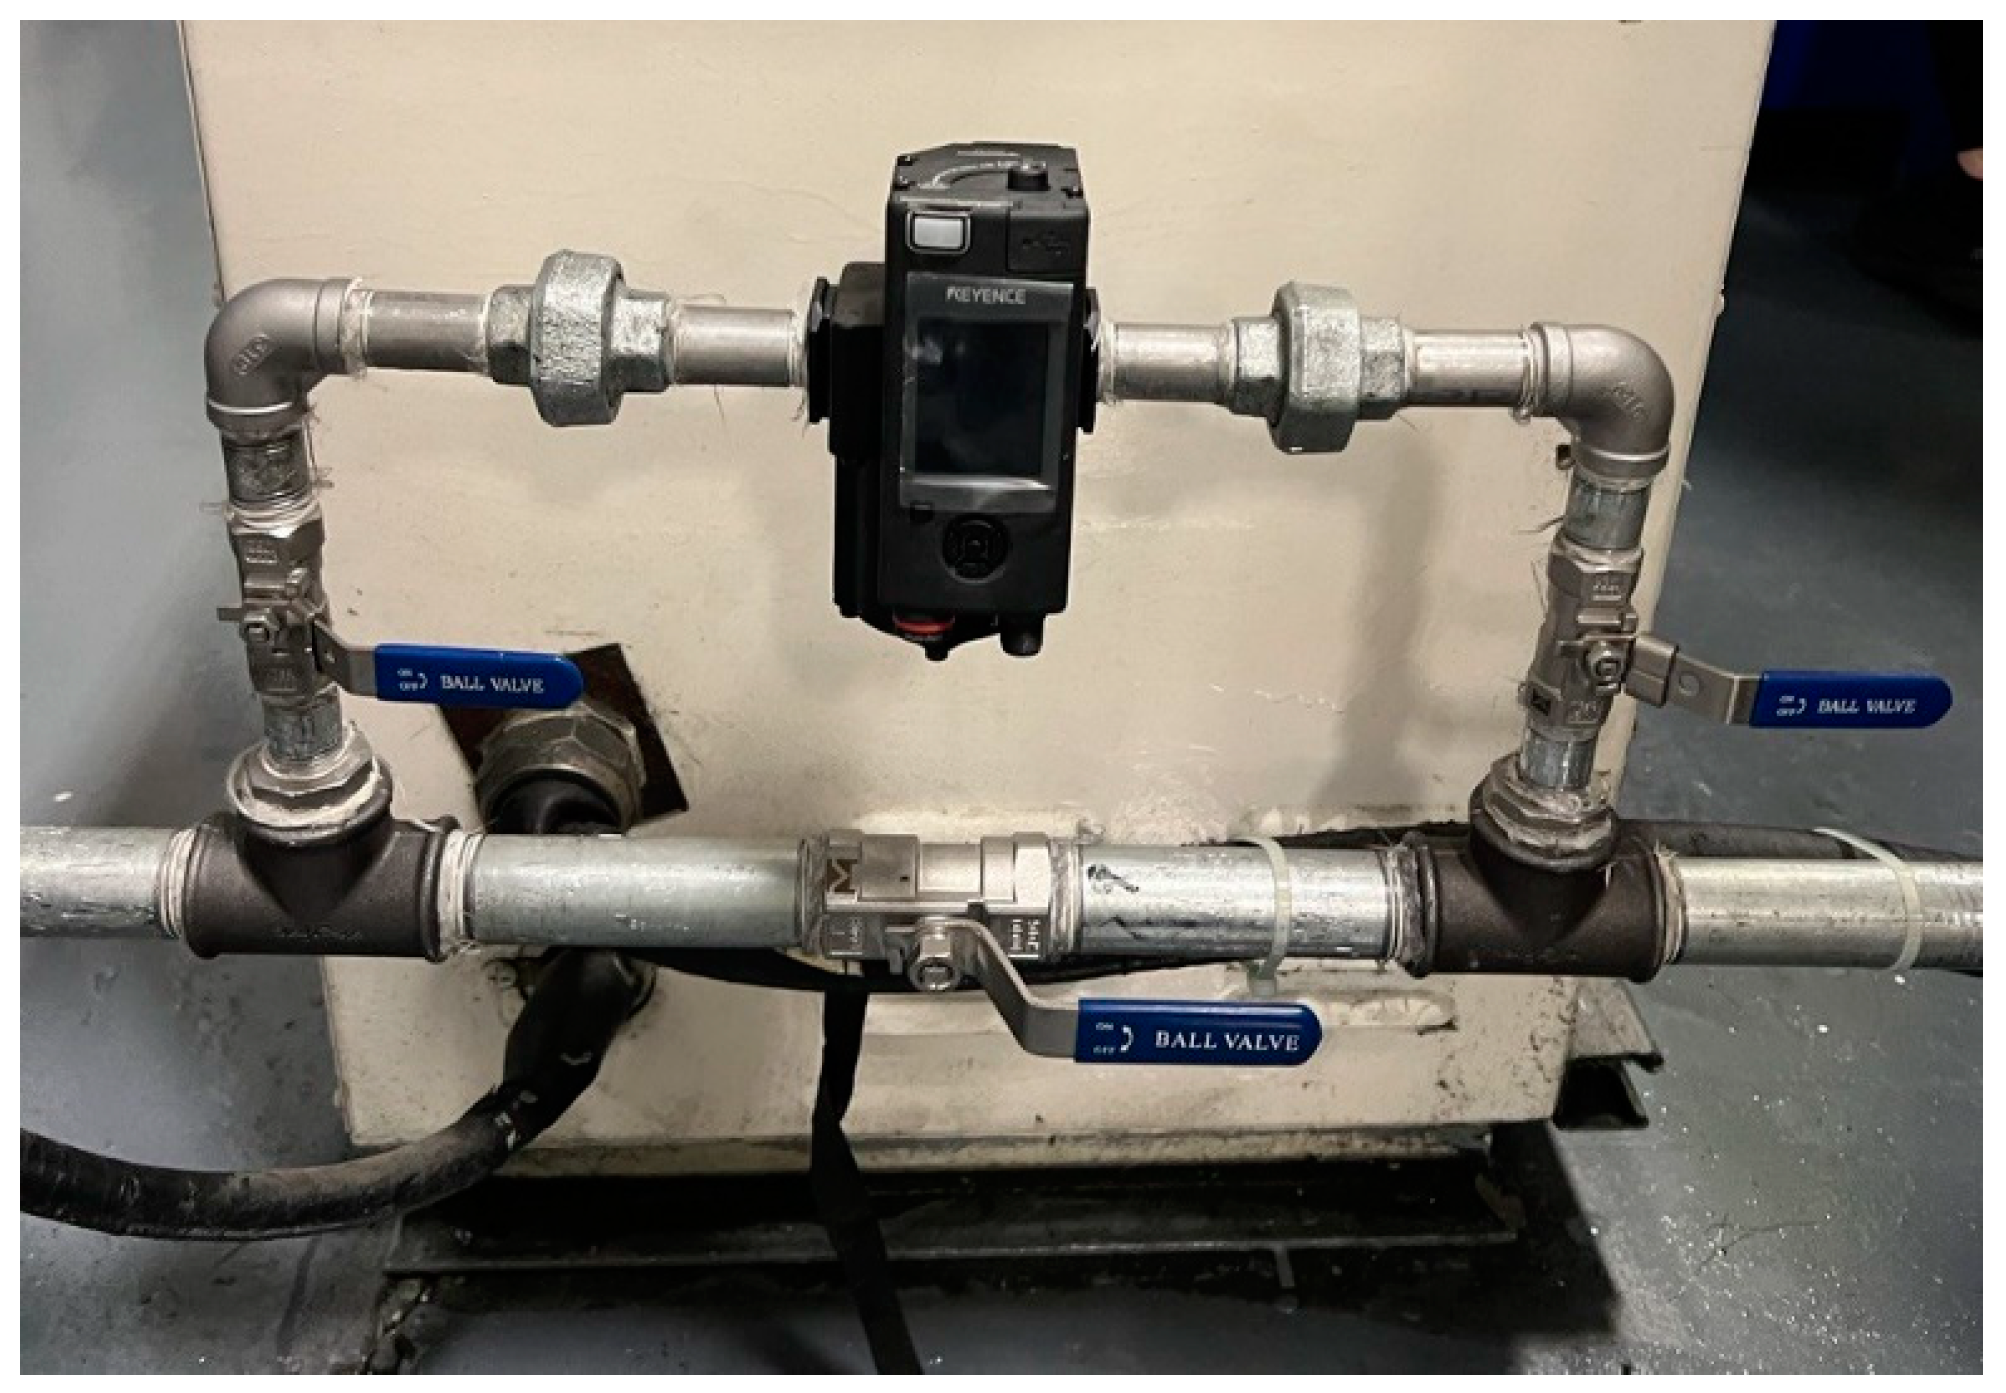
3.2. Sensor Installation
The MP-F sensor was installed in a bypass line on the machine’s compressed air supply, allowing for maintenance or replacement without disrupting operations (
Figure 5).
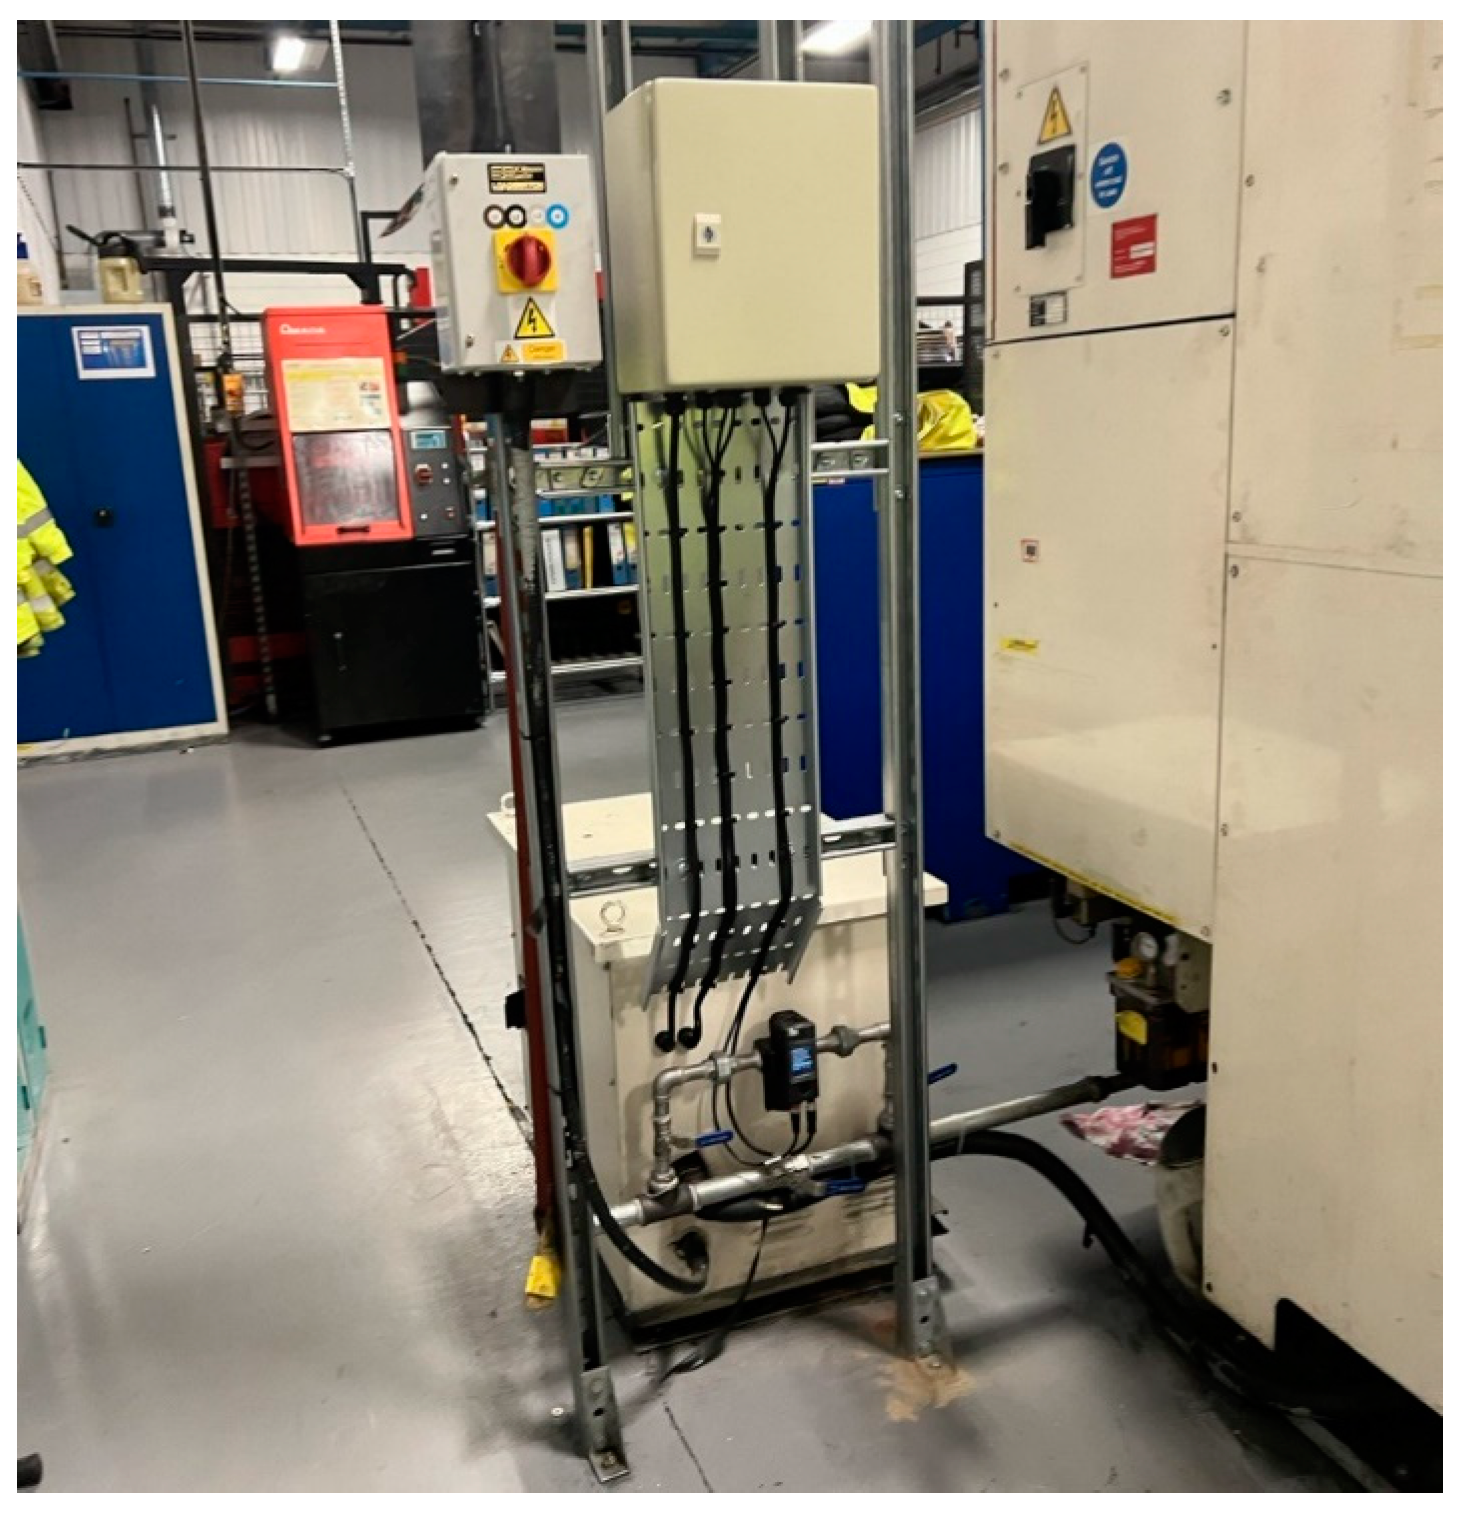
For electricity monitoring, an energy monitoring module with CT clamps was installed on the three-phase power input of the machine, as shown in
Figure 3. This setup enables real-time and cumulative energy tracking. The final installation, including the sensor and electrical panel, is depicted in
Figure 6.
Once installed and configured, the MP-F sensor began visualizing and recording real-time airflow, pressure, temperature, humidity, and power consumption, as seen in
Figure 7. Additionally, users can connect directly via USB and KEYENCE’s dedicated software (Version 1.1.1.0) to access detailed reports, including daily, weekly, and monthly energy consumption logs. The sensor can store up to one year of data, which can also be exported in CSV format for further analysis.
3.3. Sensor Connection to M-ACE Network
To integrate the MP-F sensor into the M-ACE network, the MP-FEN1 Ethernet Module was utilized. This module provides comprehensive remote monitoring and control, allowing for real-time access to machine status, accumulated data, and parameter adjustments from any location within the factory.
The MP-FEN1 module supports major industrial Ethernet protocols, including EtherNet/IP, PROFINET, Modbus/TCP, and Mitsubishi’s MC Protocol/SLMP, making it a versatile solution for seamless data exchange. For this implementation, Modbus TCP/IP was chosen due to its reliability, ease of integration, and wide industry adoption. Modbus TCP/IP operates on a client–server model, where the MP-FEN1 module acts as a Modbus server, responding to data requests from a Modbus client, such as a PLC or an IoT platform.
To ensure seamless communication, the MP-FEN1 module was assigned a static IP address, providing stable connectivity within the factory network. The IP address, subnet mask, and gateway were configured via the module’s built-in web interface to align with M-ACE’s network infrastructure, ensuring conflict-free data access from the MP-F sensor.
The MP-F sensor transmits key metrics via Modbus registers, with each parameter mapped to a specific Modbus address as defined in the sensor manual. For instance, consider the following:
Instantaneous power consumption was retrieved from Modbus register 42123.
Instantaneous flow rate was stored in register 42001.
Air pressure peak was assigned to register 42022.
These Modbus addresses were set up in the Modbus client (IoT platforms), enabling real-time data polling at predefined intervals. This setup allowed for continuous energy monitoring, remote diagnostics, and efficient data logging for further analysis.
The network architecture illustrating the sensor’s connection is shown in
Figure 8. MP-F Monitor software (Version 1.1.1.0) is used for initial sensor setup, parameter configuration, and real-time monitoring. Utilizing Modbus/TCP and EtherNet/IP, the software provides remote access to sensor data, energy consumption trends, and system diagnostics, significantly enhancing efficiency, energy management, and predictive maintenance capabilities across M-ACE’s production environment.
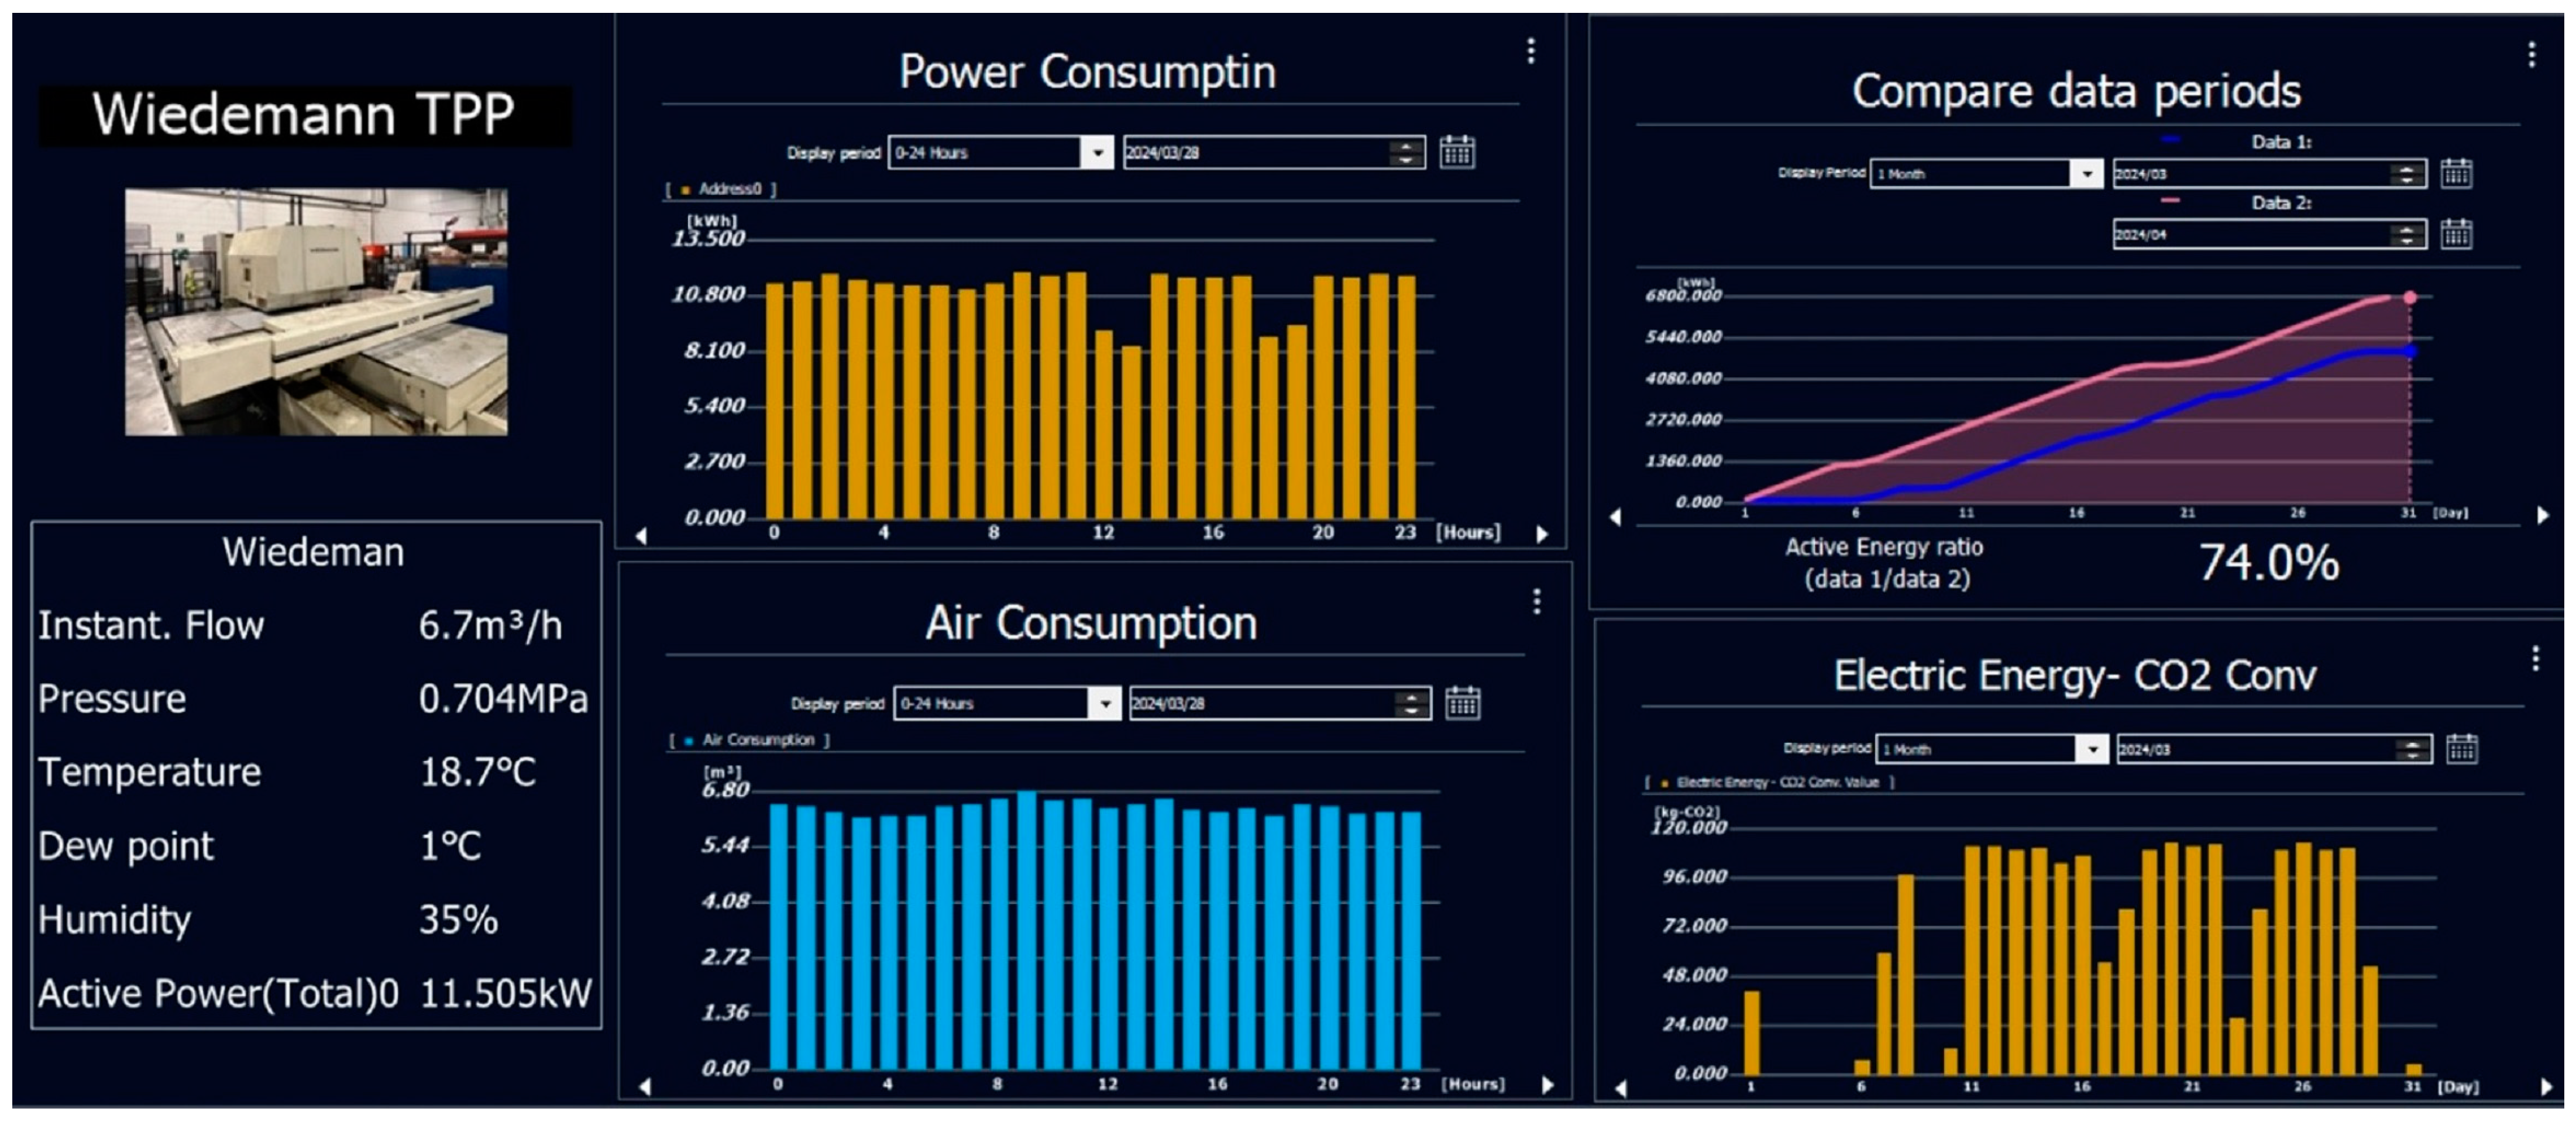
3.4. Dashboarding
To visualize the energy and air consumption of the Wiedemann TPP, an interactive, real-time dashboard (
Figure 9) was developed using Keyence’s dedicated software. This dashboard provides both live operational data and historical performance trends, accessible to authorized users within the M-ACE network.
The dashboard displays the following:
Real-time data: air pressure, temperature, humidity, dew point, power consumption, and air usage.
Consumption trends: interactive plots for daily, weekly, monthly, and annual energy and air consumption patterns.
Comparative analysis: monthly energy consumption trends to support cost analysis and performance optimization.
Environmental impact monitoring: a dedicated plot converting energy consumption into CO2 emissions, supporting M-ACE’s net-zero sustainability goals.
By integrating Industry 4.0 solutions, this system enables efficient energy monitoring, data-driven decision-making, and improved operational efficiency, reinforcing M-ACE’s commitment to sustainability and cost reduction.
4. Outcome
4.1. Air/Energy Consumption Analysis
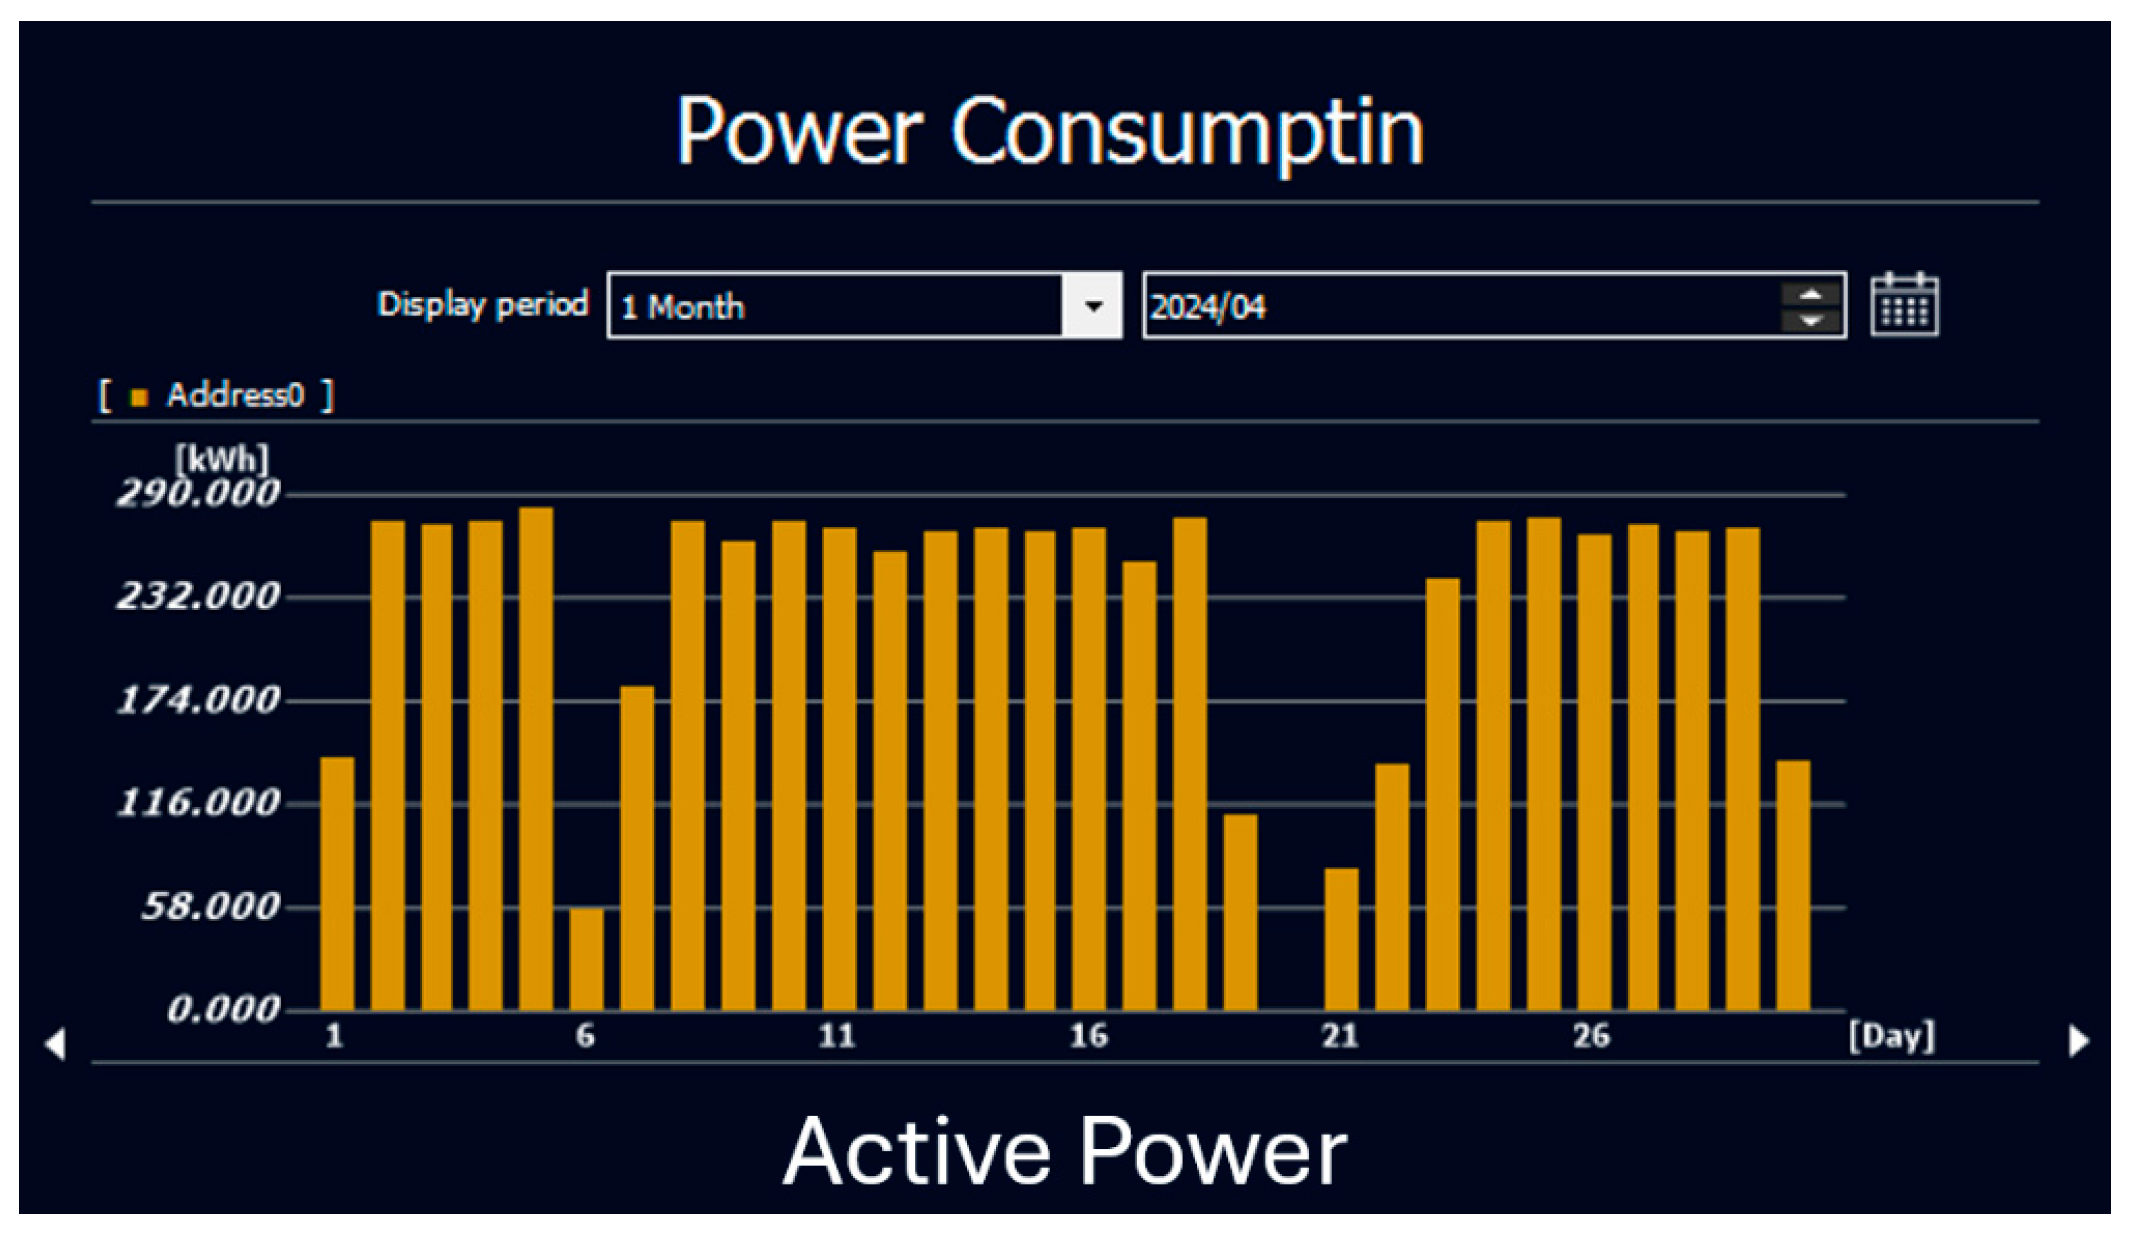
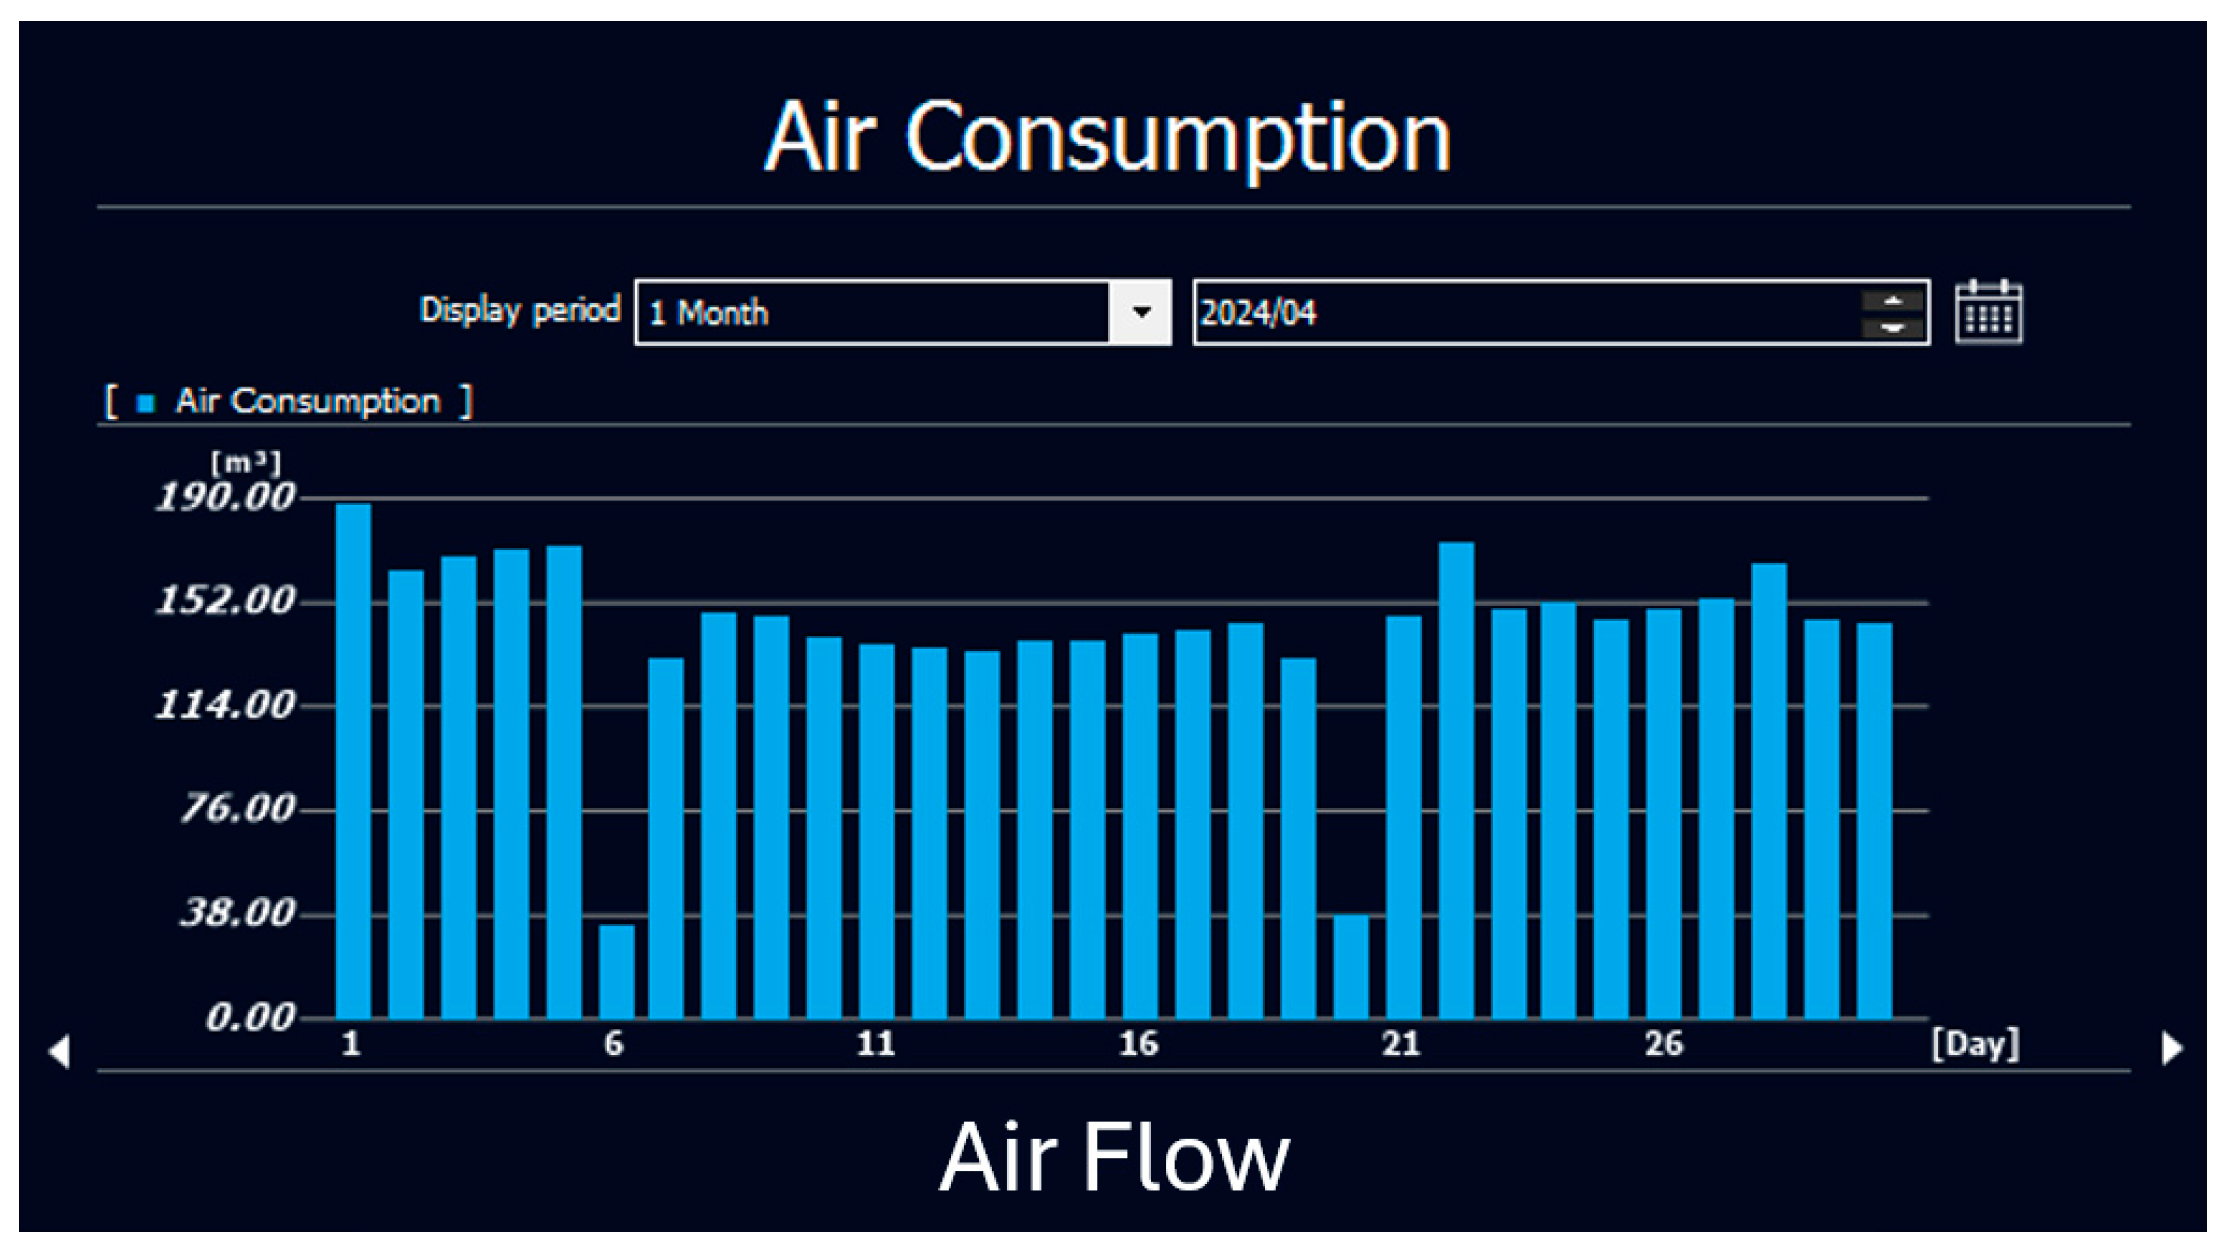
The initial data collection for the Wiedemann Turret Punch Press (TPP) took place in April 2024 (
Figure 10 and
Figure 11). During this period, the machine consumed 6783 kWh of electricity and 4270 cubic meters of air, averaging 270 kWh of energy and 140 m
3 of air per weekday.
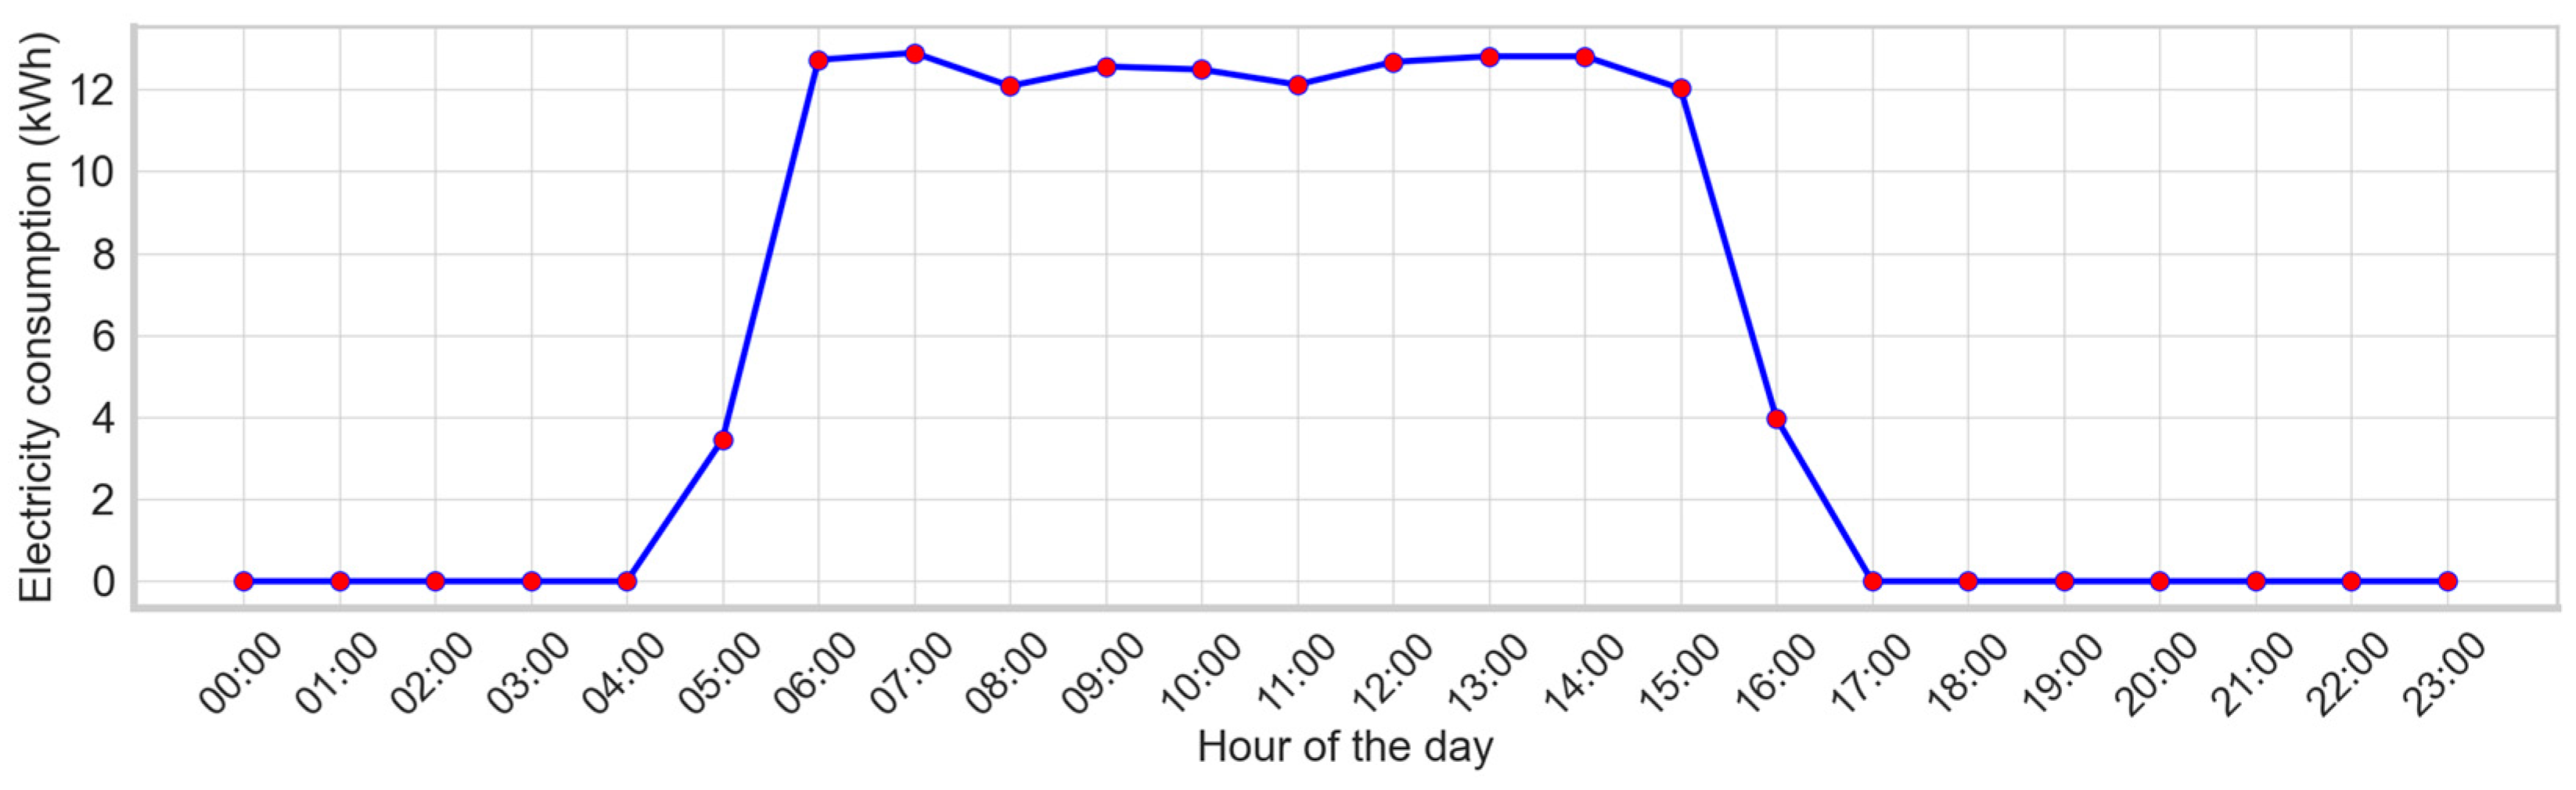
As discussed in
Section 2.1, the machine was frequently idle in automatic mode due to production scheduling uncertainties. Analysis of the hourly electricity consumption distribution (
Figure 12) indicated that values below 10 kWh per hour corresponded to non-operational periods.
To address this inefficiency, operators were instructed to power down the machine when not in use. A comparison of energy consumption between April and June (
Figure 13) showed a significant 51.5% reduction, from 6783 kWh to 3293 kWh.
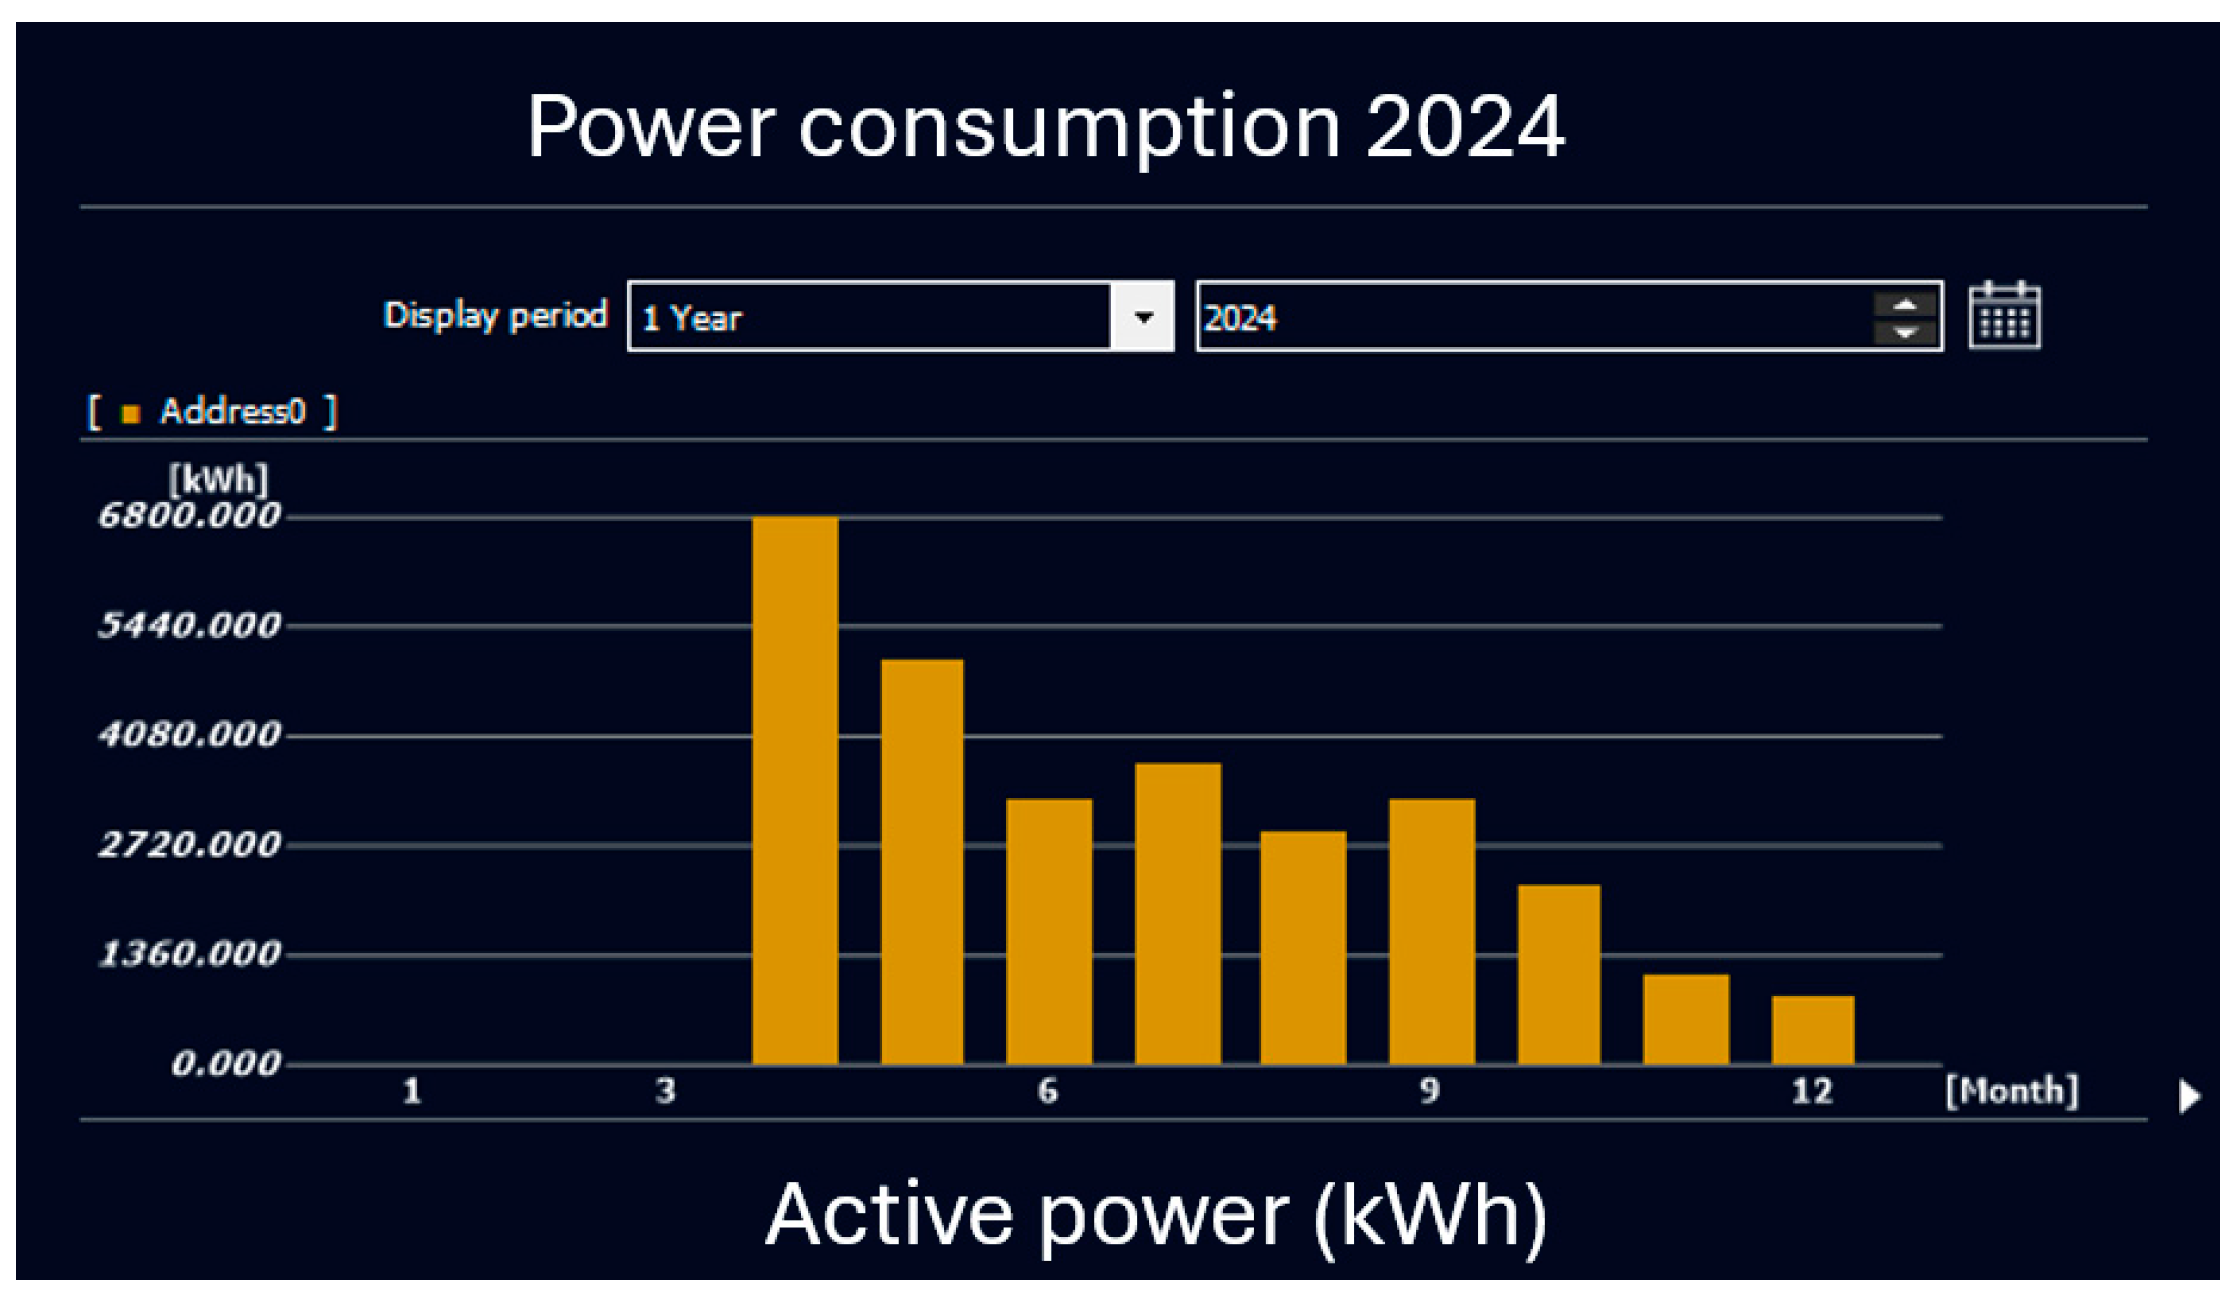
Further analysis over the following months (
Figure 14,
Table 1) confirmed a steady improvement in energy efficiency. The high consumption recorded in April 2024 was never repeated, establishing a benchmark for energy-saving measures. Monthly savings ranged from a minimum reduction of 1741 kWh (25.7%) in May to a maximum of 4564 kWh (56%) in October 2024, demonstrating the success of data-driven optimization strategies.
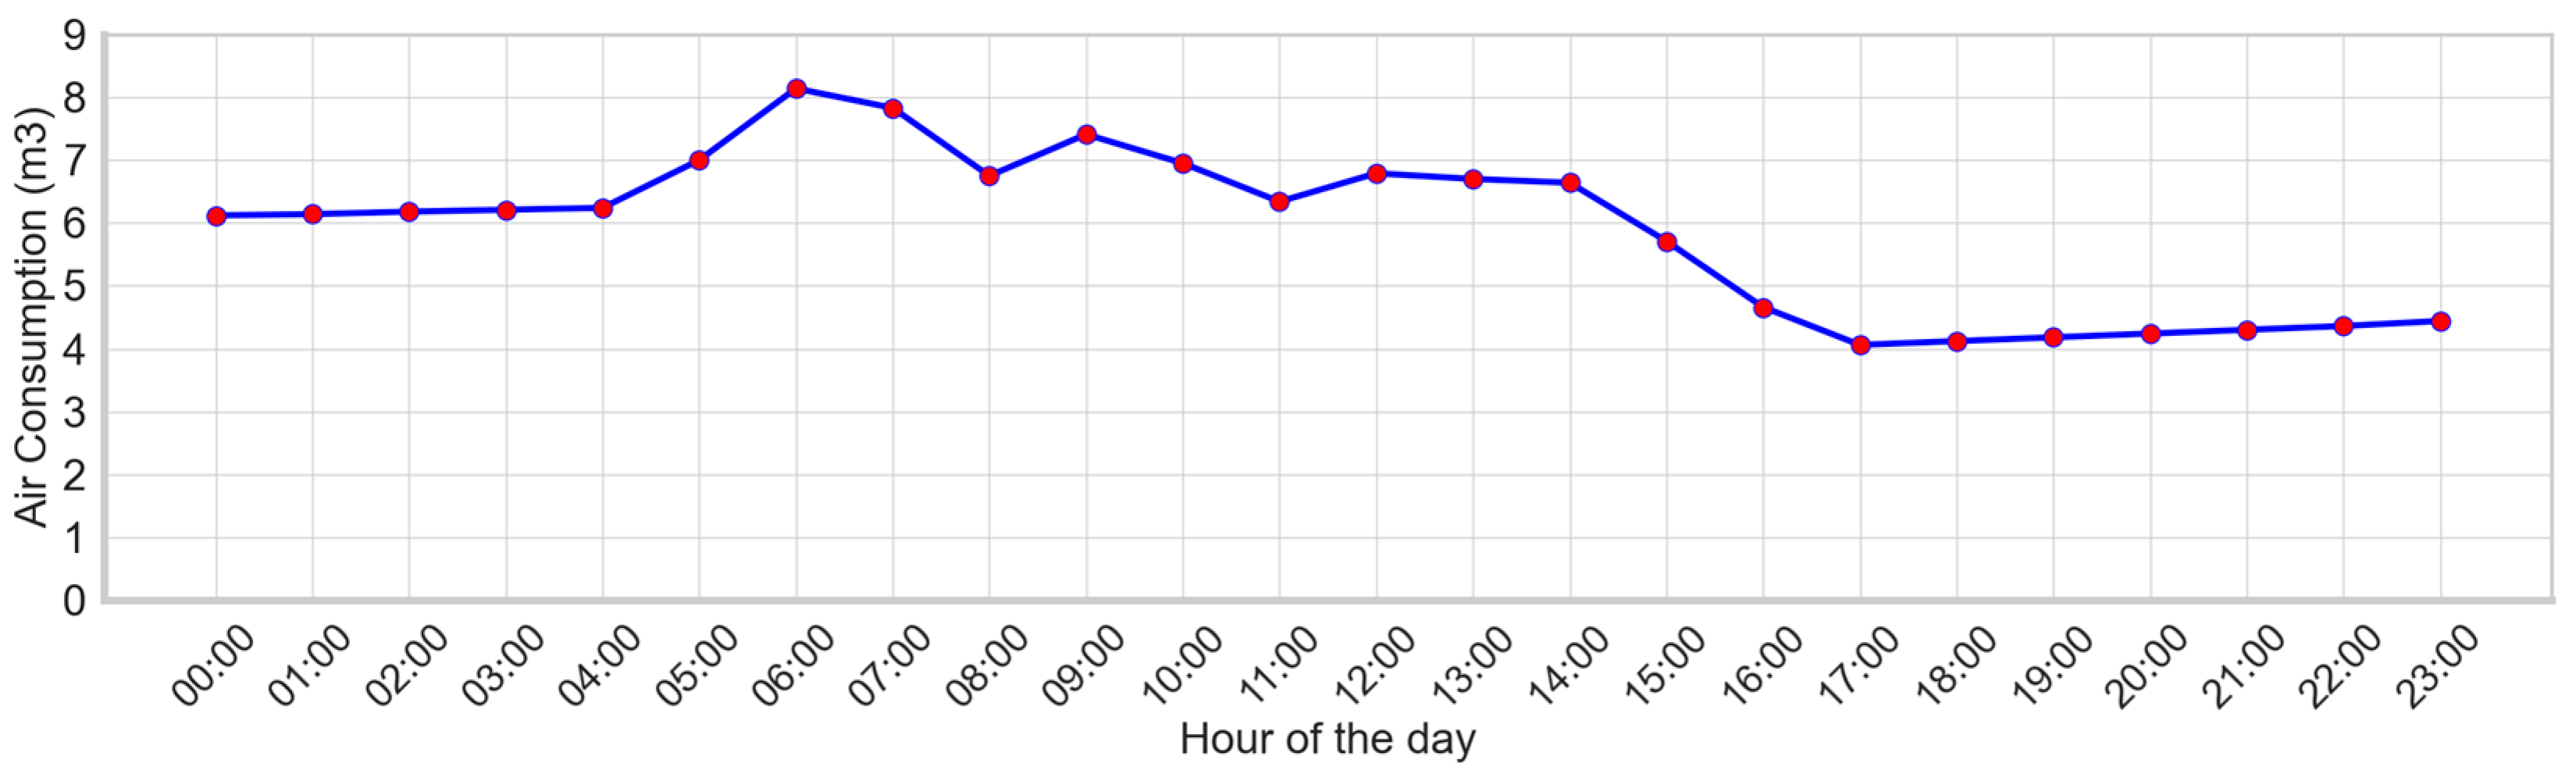
4.2. Detecting and Resolving Air Leaks
Access to collected data and their visualization is essential for identifying operational inefficiencies and detecting hidden issues. A comparison of air and energy consumption graphs (
Figure 15 and
Figure 16) revealed an unexpected anomaly, suggesting a potential air leak. On one day, despite the machine being in standby mode with low energy consumption (midnight to 5 p.m.), air consumption remained unusually high, exceeding 7 m
3/h. This discrepancy raised immediate concerns, prompting further investigation into its cause and impact on efficiency.
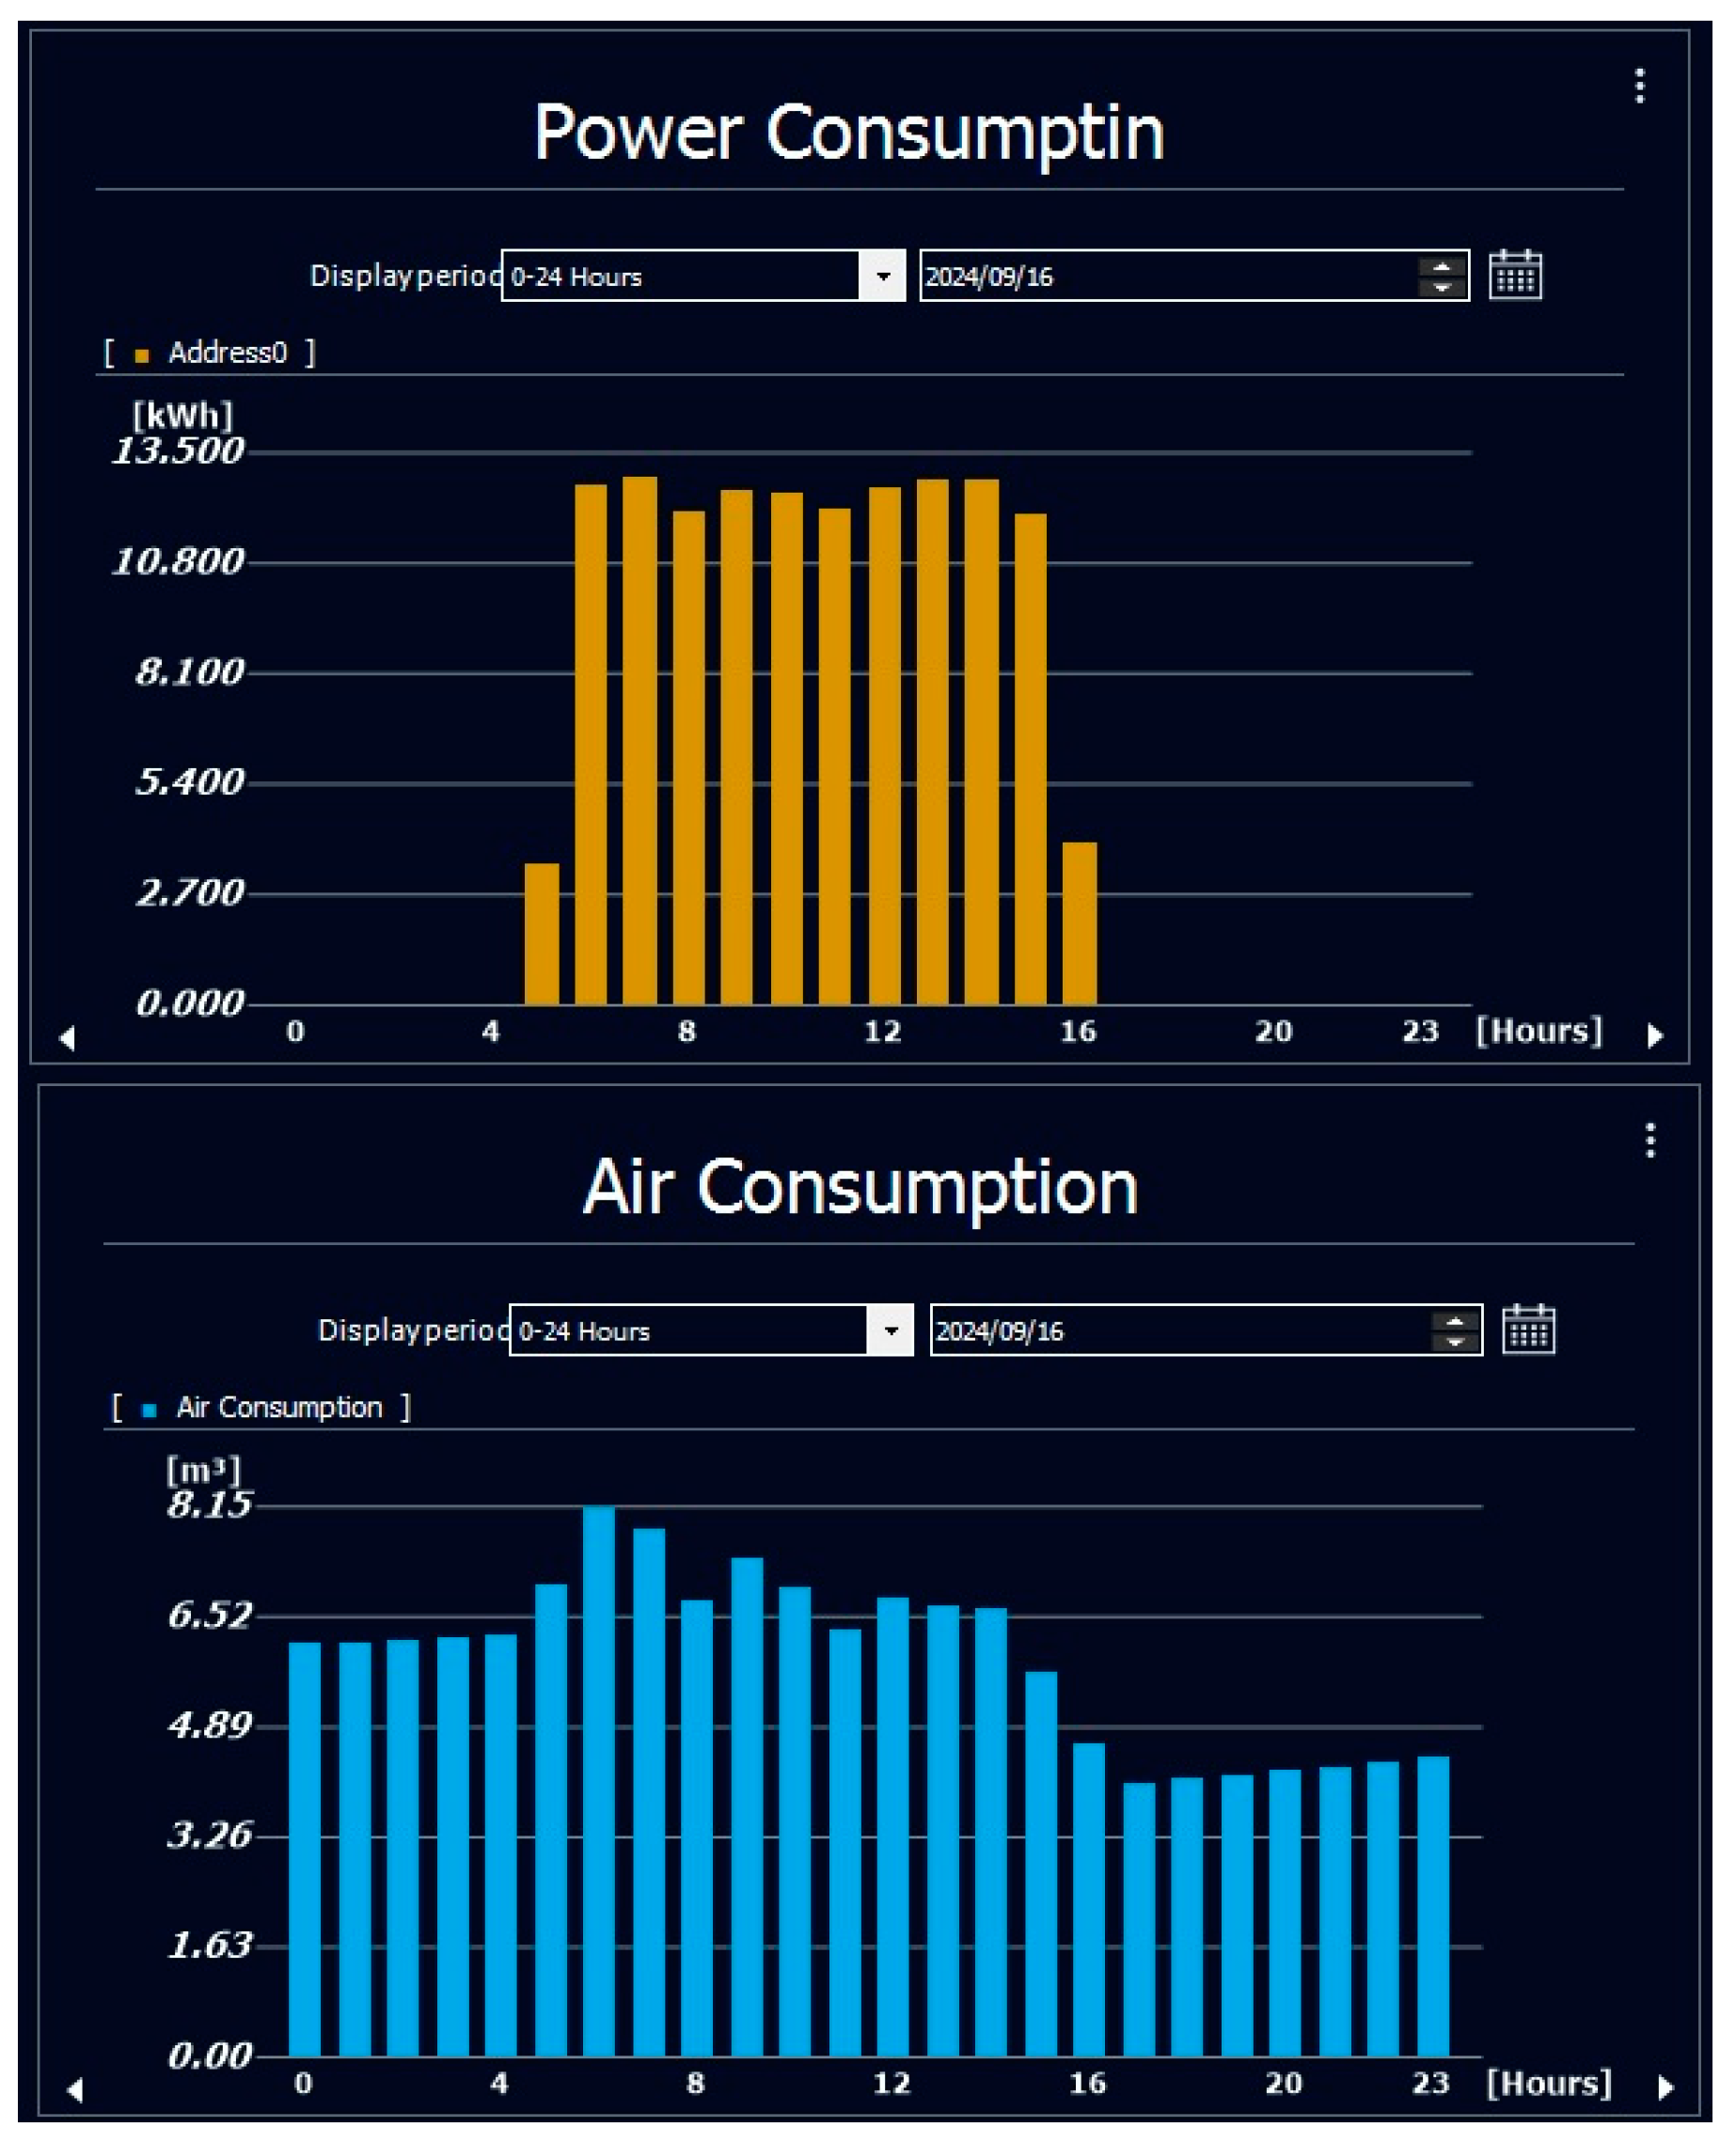
It was noted on September 16th that, even when the machine was completely powered off between 4 a.m. and 5 p.m. (
Figure 17 and
Figure 18), air consumption remained consistently high at 4–6 m
3/h, indicating a persistent air leak. This ongoing leakage increased the load on the factory’s air compressors, which supply compressed air for production. Consequently, the compressors had to operate at a higher capacity, leading to increased power consumption and rising operational costs.
Despite multiple maintenance interventions, the source of the leak remained unidentified. This highlighted the need for automated leak prevention to optimize energy efficiency.
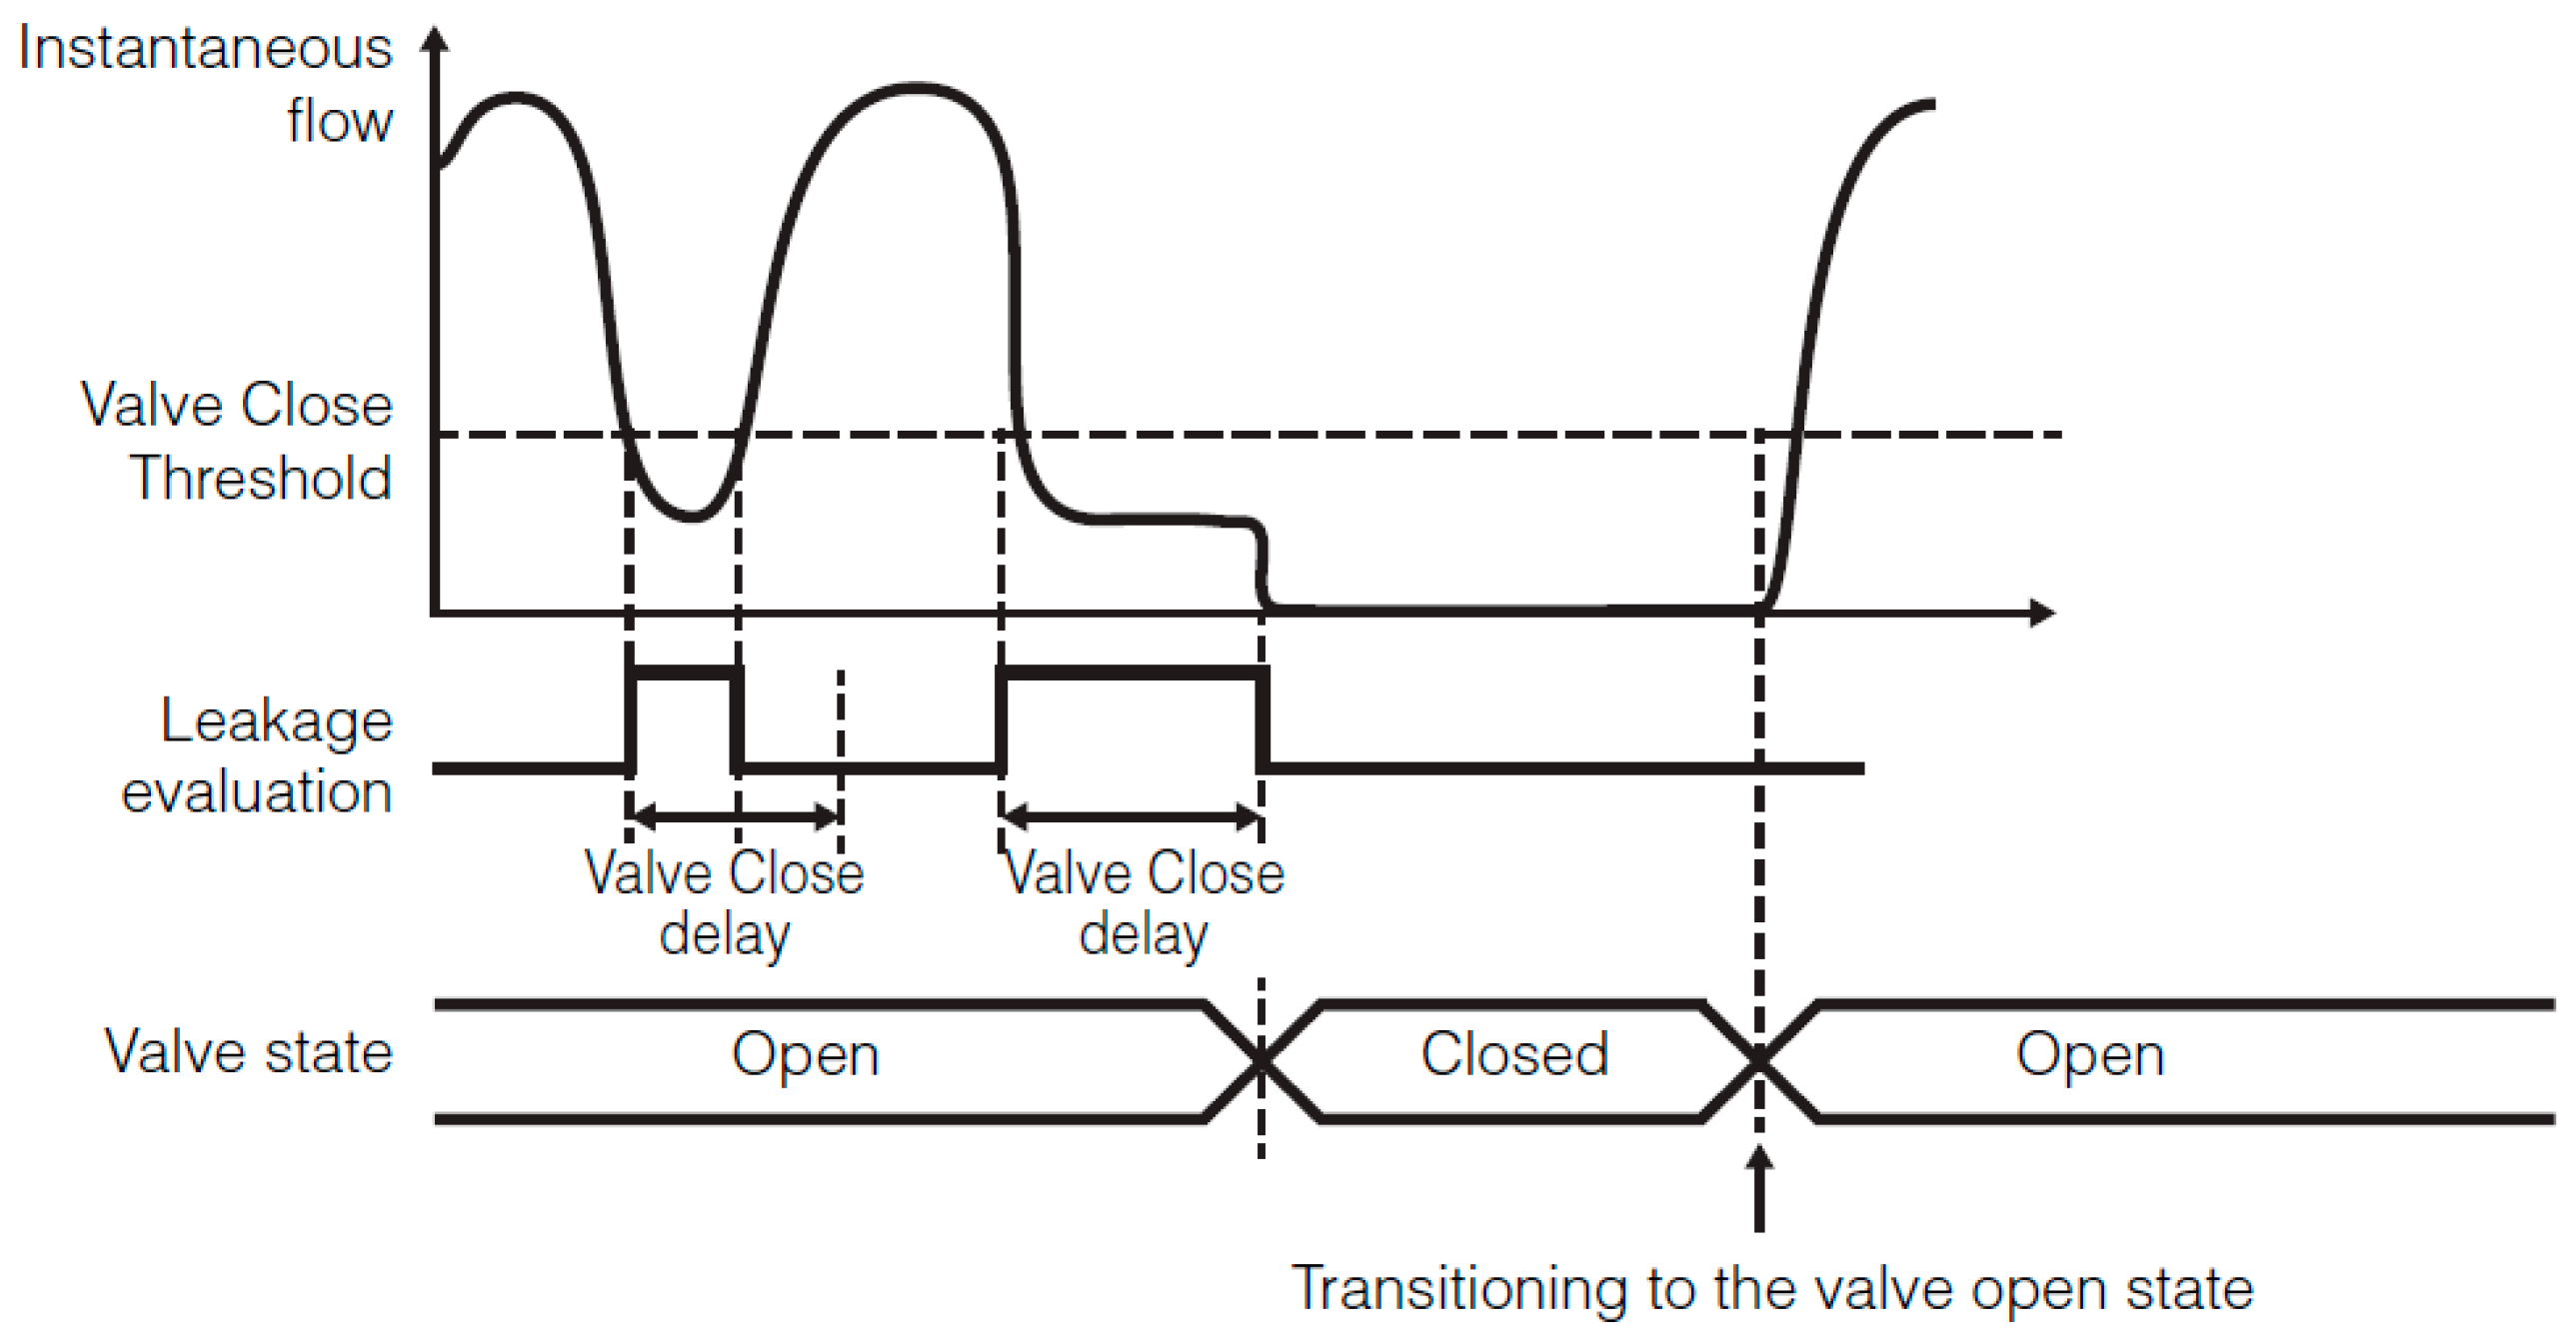
4.3. Implementing an Automatic Shut-Off Valve
The Keyence sensors were initially equipped with an air shut-off valve that activated based on air flow levels (
Figure 19). However, this system did not account for power consumption, leading to continued air loss even when the machine was idle. As a result, unnecessary energy waste occurred, increasing operational costs.
To address this issue and enhance energy efficiency, a customized solution was developed. The sensor was reconfigured to generate an output signal when the machine’s instantaneous power consumption dropped below 1 kW. This signal was integrated into the system to automatically trigger the shut-off valve, stopping air flow during non-operational periods.
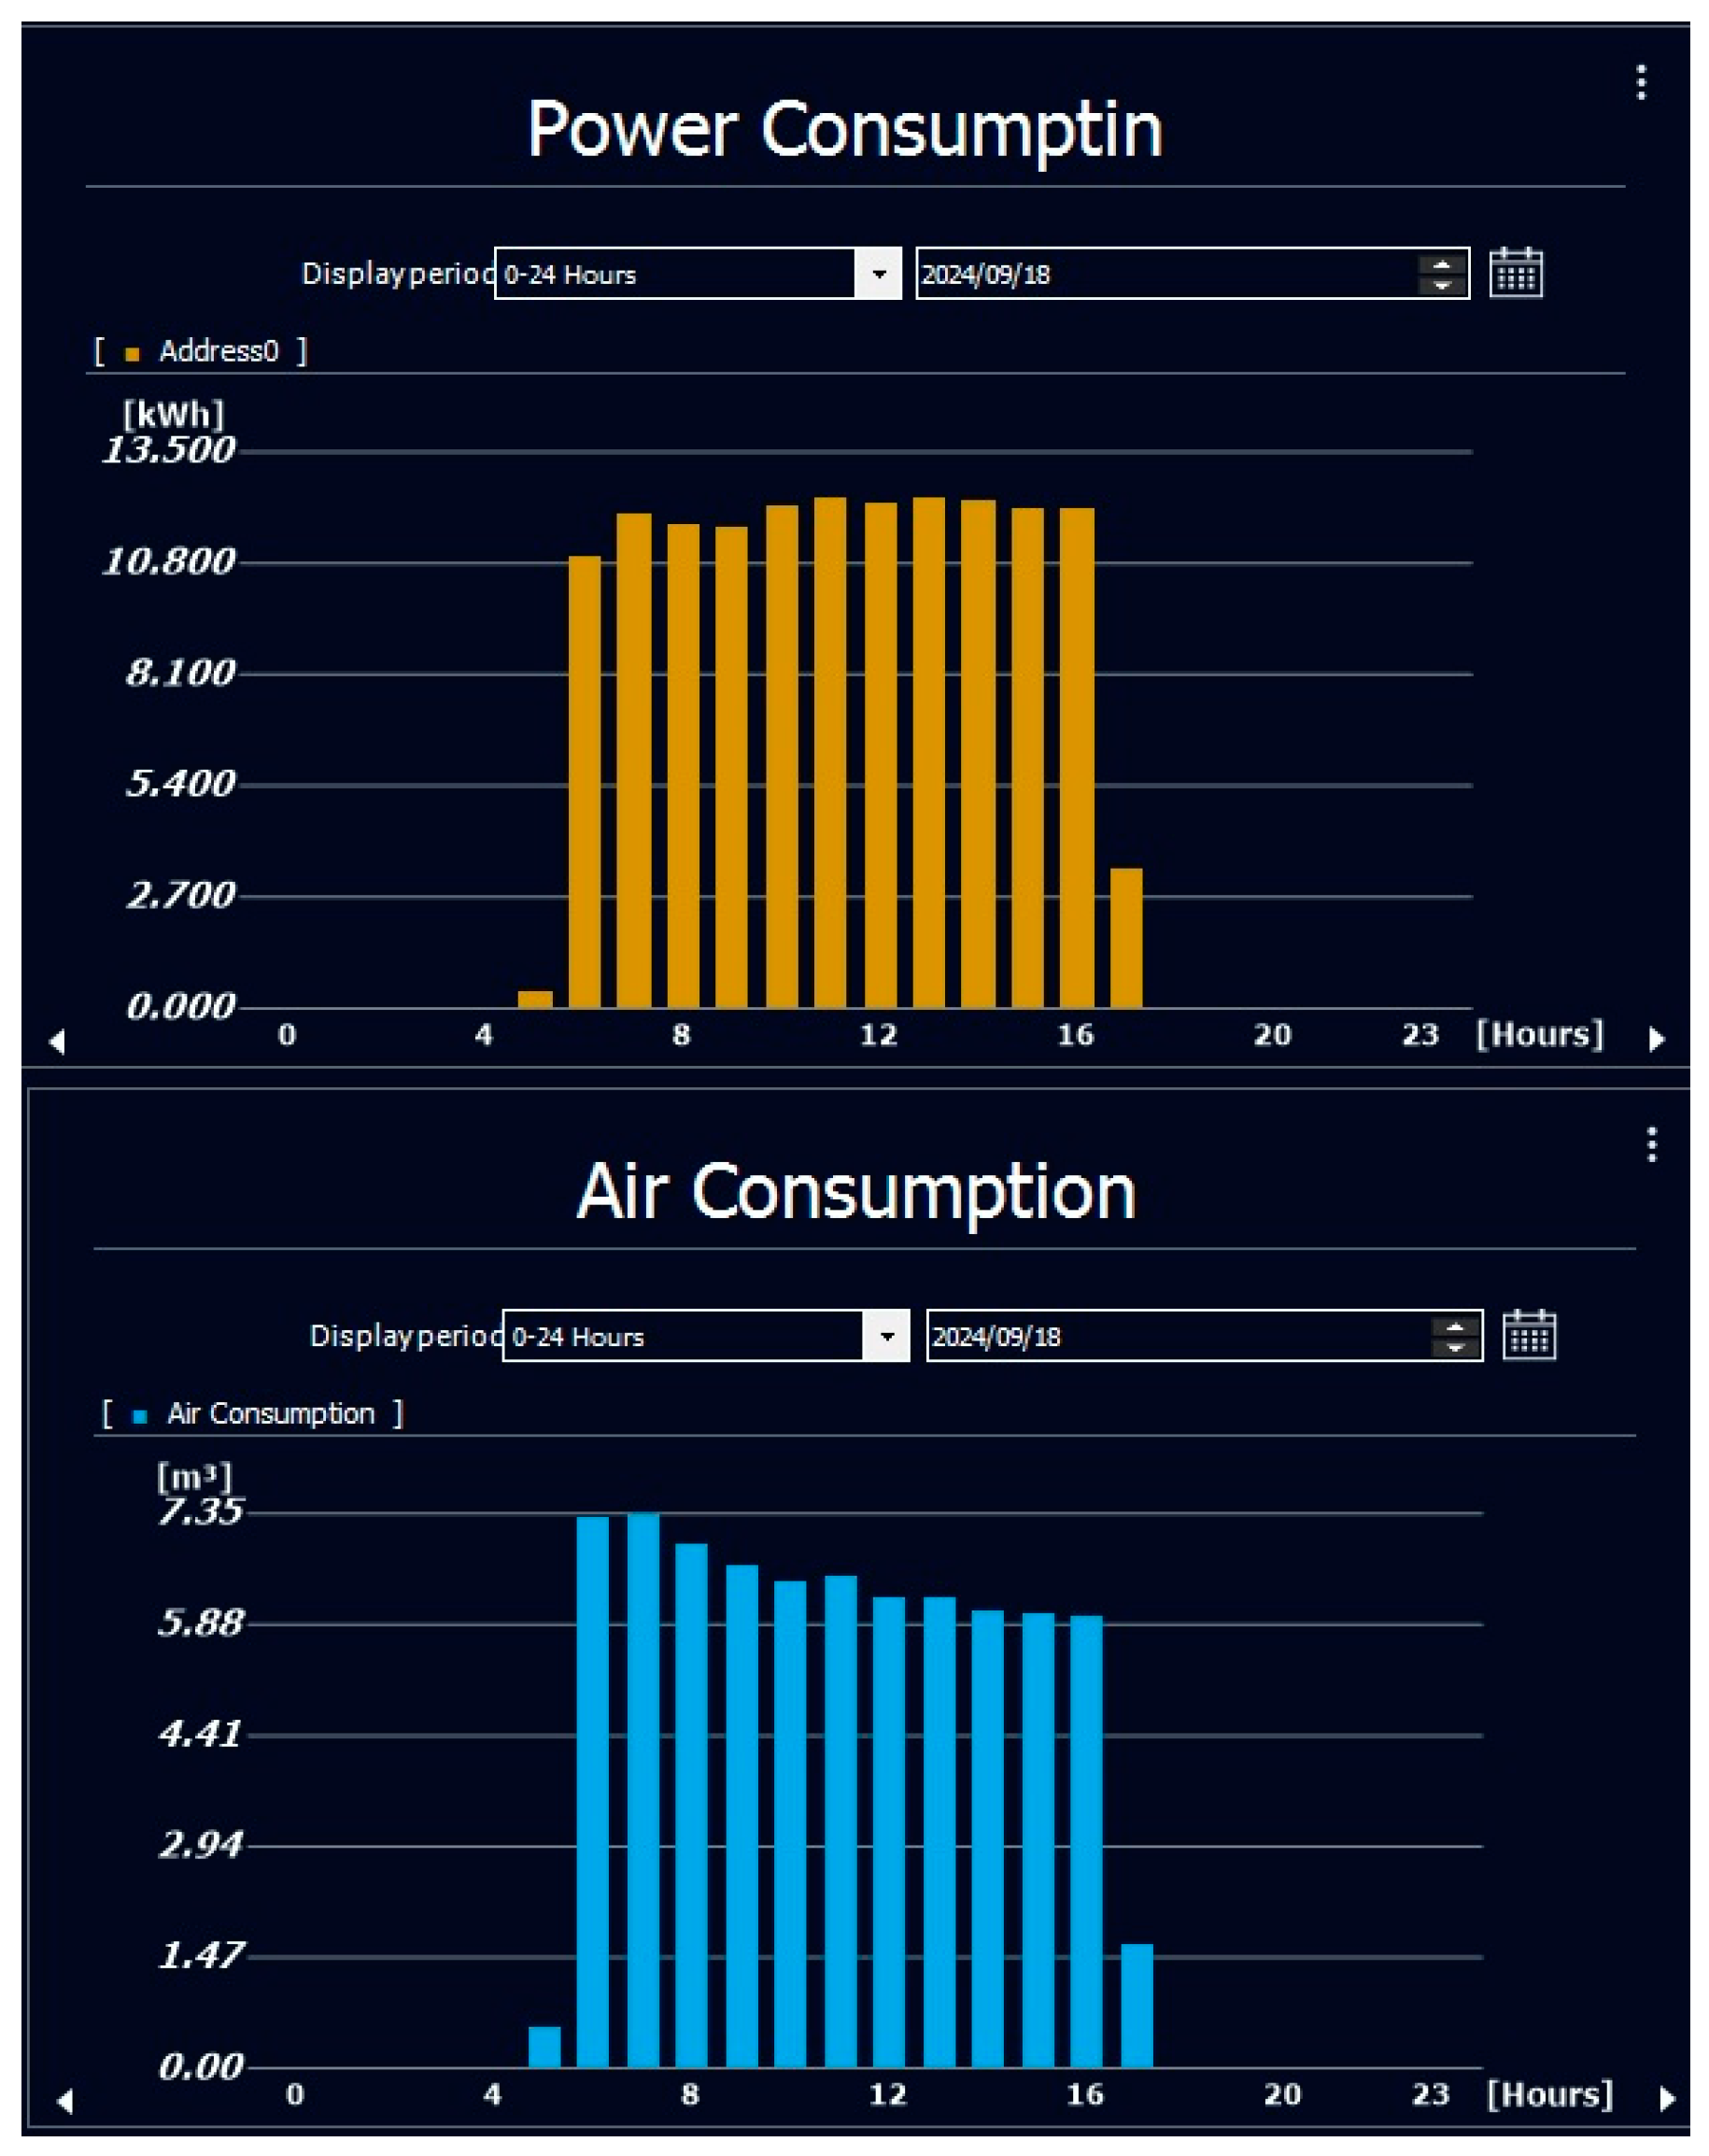
The effectiveness of this modification is clearly demonstrated in the comparison plots (
Figure 20 and
Figure 21), where the system successfully eliminated air leaks. By preventing unnecessary air loss, the solution not only conserved compressed air, but also reduced the workload on air compressors, leading to significant energy savings and cost reductions.
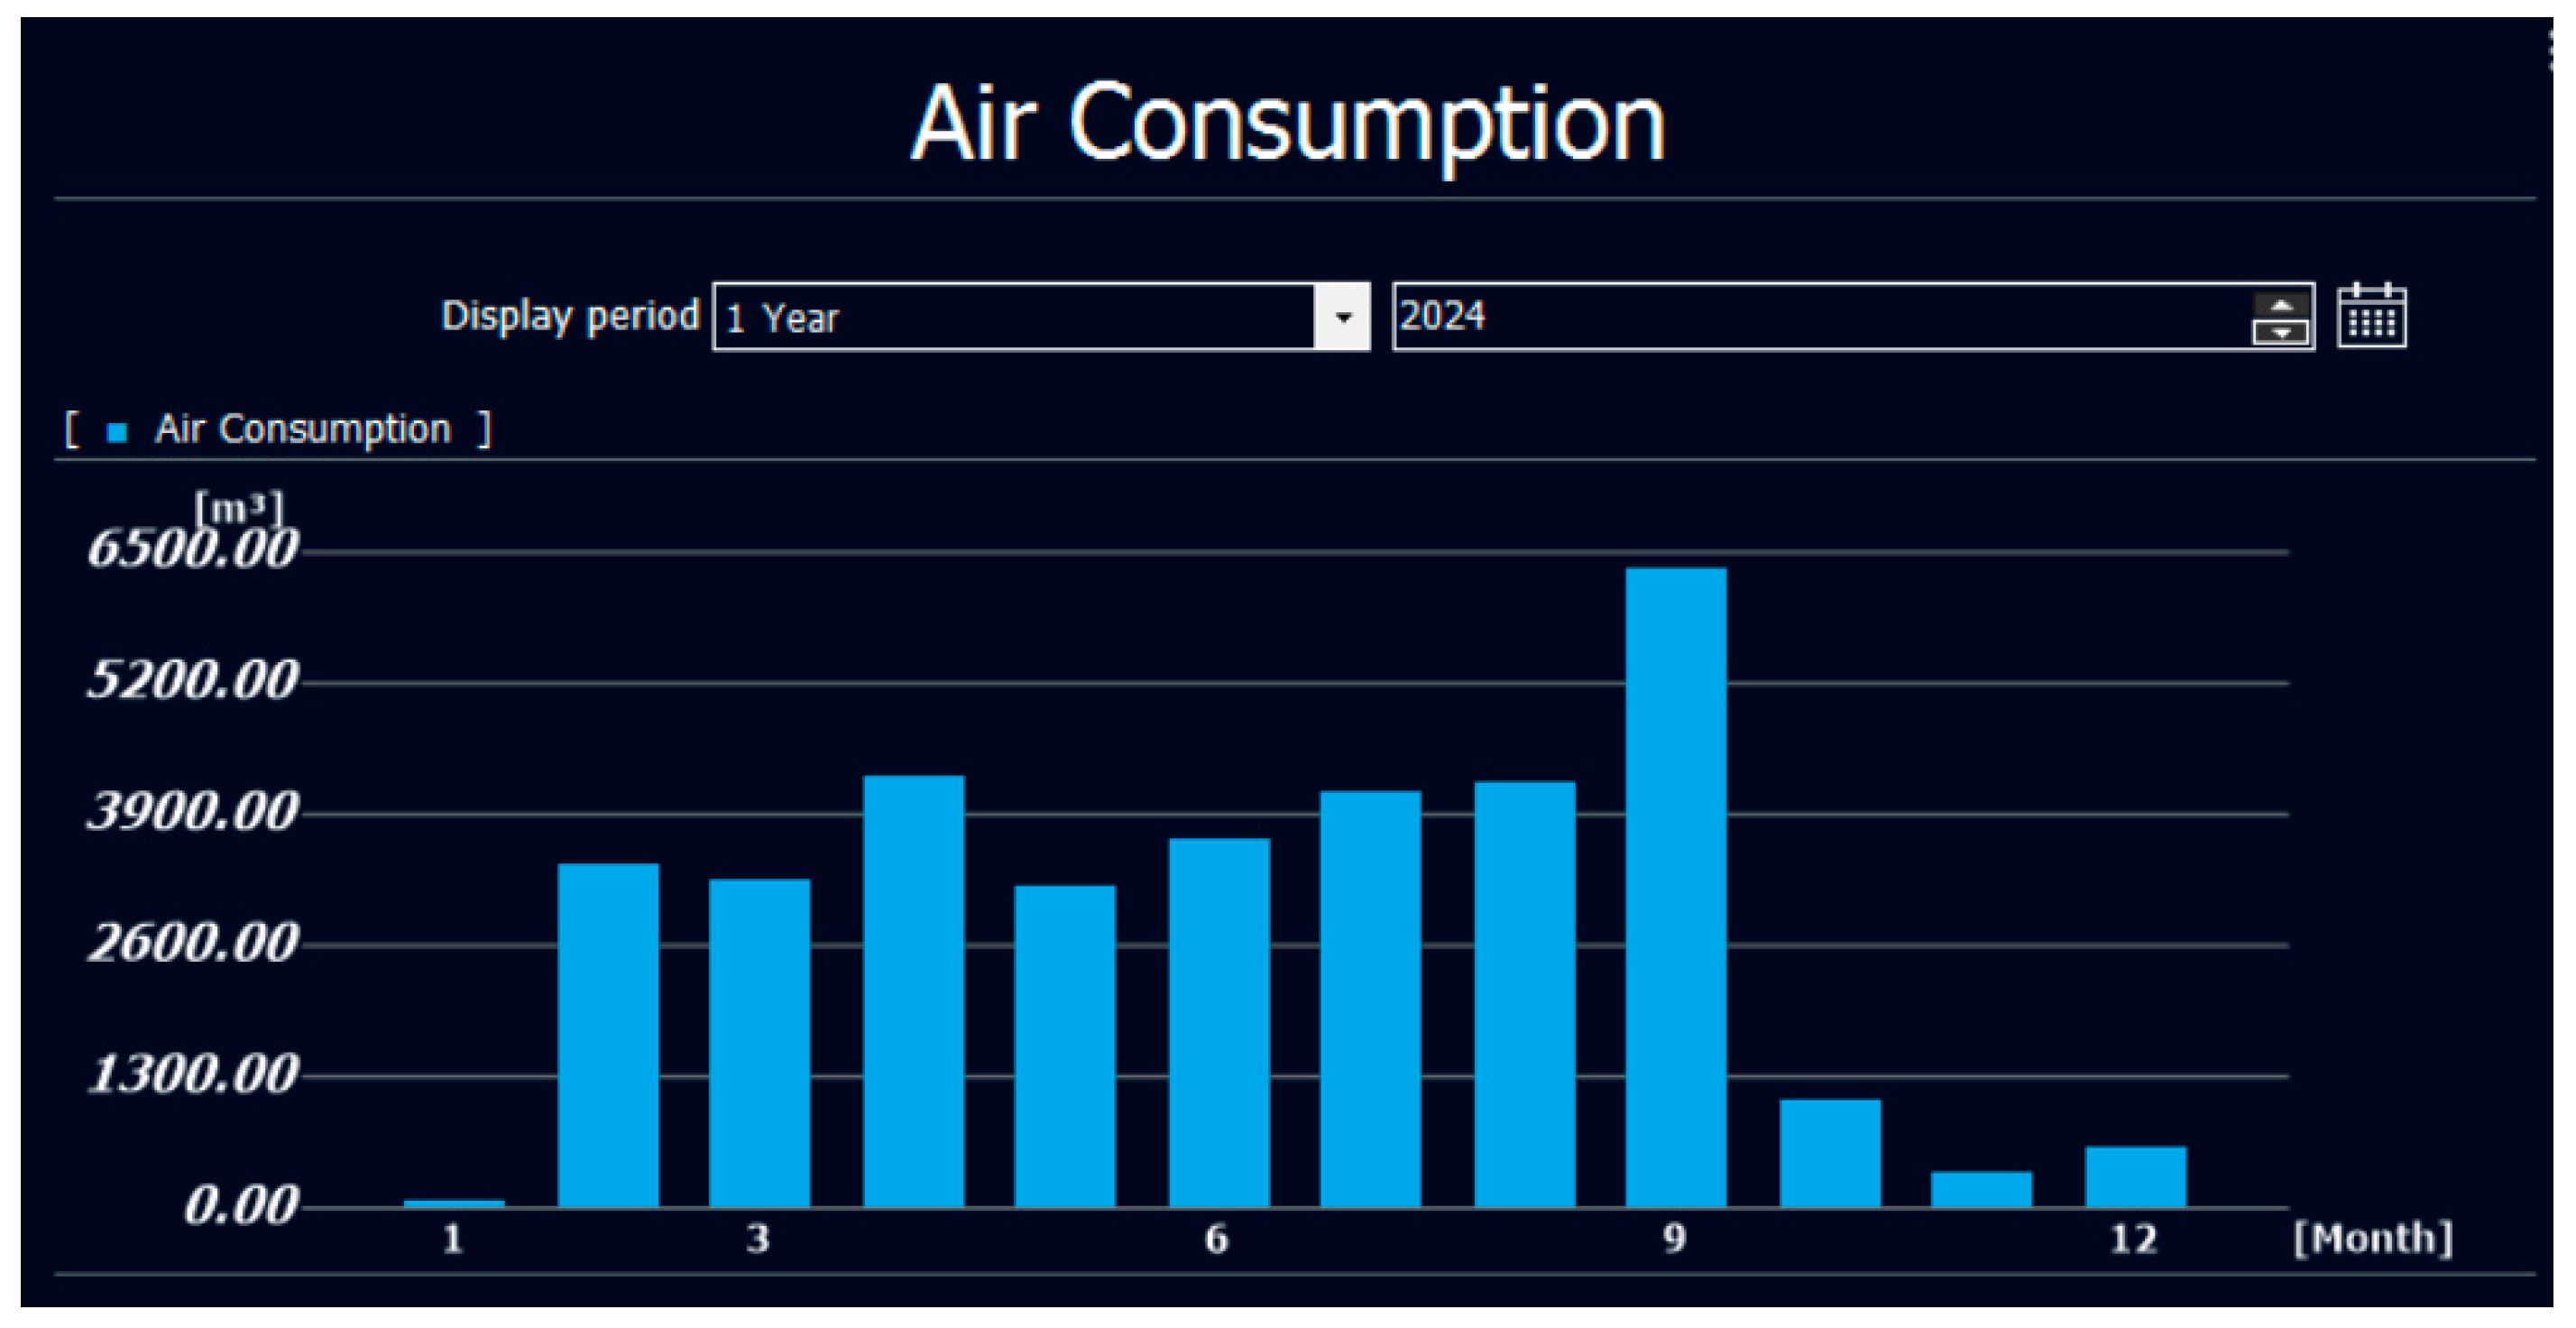
A detailed comparison of monthly air consumption before and after the implementation of the shut-off valve (
Figure 22 and
Table 2) highlights its substantial impact. Prior to the modification, from the installation of the MP-F series sensor in February 2024 until the shut-off valve was set up, the machine’s monthly air consumption consistently exceeded 2500 m
3. The lowest recorded consumption during this period was 3181.41 m
3 in May 2024, while the highest reached 6336.03 m
3 in September 2024, with an average consumption of 4055.51 m
3 per month. A significant portion of this air usage resulted from leaks, which peaked in September 2024.
Following the implementation of the shut-off valve, air consumption dropped dramatically, averaging 675.54 m3 per month over the next three months. This represents an impressive 83.34% reduction in air consumption. Such a substantial decrease has a profound impact on the factory’s main compressors, as it significantly reduces their load. Since these compressors are responsible for maintaining the required air pressure across the facility, reducing their workload translates into lower power consumption, extended equipment lifespan, and decreased maintenance costs. Ultimately, this improvement not only optimizes energy efficiency, but also enhances the overall sustainability of the factory’s operations.
5. Conclusions
In conclusion, the implementation of an energy and air consumption monitoring system for the WIEDEMANN Turret Punch Press (TPP) at Mitsubishi Electric Air Conditioning Systems Europe Ltd. (M-ACE) has demonstrated significant operational, financial, and sustainability benefits. By retrofitting this legacy machine with an IIoT-based monitoring solution, the factory has gained real-time visibility into its energy and compressed air consumption, facilitating data-driven decision-making for improved efficiency and cost reduction.
The integration of KEYENCE MP-F series sensors, along with an energy monitoring module and Ethernet communication via Modbus TCP/IP, has enabled continuous monitoring of power and air usage trends, allowing for the identification of inefficiencies that were previously undetectable. One major discovery was a persistent air leak, which had led to substantial compressed air waste and unnecessary energy consumption. By implementing a smart shut-off valve that automatically stops air flow when the machine is idle, the system successfully eliminated air leakage, reducing compressed air consumption by 83.34% and contributing to substantial energy savings.
Additionally, the monitoring system provides real-time anomaly detection, allowing operators to detect irregularities, monitor machine operation remotely, and make necessary adjustments to optimize performance. The seamless integration of collected data into the factory’s network further enhances operational oversight, offering an effective platform for visualizing consumption trends, identifying optimization opportunities, and making informed maintenance decisions.
Beyond immediate cost savings, this project demonstrates the broader potential of IIoT-based retrofitting for industrial energy efficiency. The 56% reduction in energy consumption highlights the value of modernizing older machines rather than replacing them, making this approach a scalable and cost-effective solution for other industrial settings. This study underscores the critical role of IIoT in smart manufacturing, promoting sustainable production practices while reducing operational costs and environmental impact. Moving forward, this framework can be extended to additional machines and processes, reinforcing M-ACE’s commitment to sustainability, efficiency, and continuous innovation in industrial energy management.
Despite the successful deployment of the energy and air consumption monitoring system at M-ACE, several challenges were encountered. One key limitation was the factory’s 24/7 production cycle, which left minimal opportunities for sensor installation and system integration, requiring careful planning to avoid disruptions. Additionally, the cost of sensors, power modules, and network components posed a challenge for scalability, as expanding the system to additional machines would require significant investment. The need for additional network cabling and IP address configuration for each sensor further added to this complexity.
To further enhance the effectiveness of the energy and air consumption monitoring system and move towards achieving net-zero energy consumption, several key steps are recommended:
Expanding Monitoring to Additional Machines: Extending the system to monitor the energy and air consumption of more machines within the factory will enable a comprehensive analysis of resource usage, uncovering broader inefficiencies and opportunities for optimization.
Comparative Energy and Air Consumption Analysis: Conducting a detailed comparative study across various machines will help identify high-consumption outliers and best-performing systems, allowing for targeted efficiency improvements and informed decision-making.
Centralized Dashboard for Real-Time Insights: Developing a centralized IIoT-based dashboard to integrate and visualize energy and air consumption data from all monitored machines will provide real-time tracking, trend analysis, and data-driven recommendations, enhancing operational efficiency.
Identification and Optimization of High Energy Consumers: Analyzing collected data to pinpoint key electricity-consuming machines and processes will allow for focused energy-saving strategies, including equipment upgrades, process optimizations, and the adoption of energy-efficient technologies to further reduce overall energy demand.
Measuring Total Air Production and Compressor Energy Usage: A critical next step is to measure the total compressed air production of the factory’s main air compressors along with their electricity consumption. This will enable an assessment of how optimizing individual machines impacts overall air production and compressor operating costs, helping to reduce unnecessary energy expenditure and enhance system-wide efficiency.
Enhancing Scalability and Integration: Future work could explore wireless sensor networks, cost-effective alternatives, and adaptive integration strategies to enhance scalability and minimize operational disruptions.
By implementing these advancements, the energy and air consumption monitoring system can be refined into a more robust and scalable framework for reducing energy waste, lowering operational costs, and supporting the factory’s long-term sustainability objectives.


