Article

S-CO2 Brayton Cycle Coupled with Molten Salts Thermal Storage Energy, Exergy and Sizing Comparative Analysis

by
Javier Teixidor-López
1,
Javier Rodríguez-Martín
1,*,
Paul Tafur-Escanta
2,
Robert Valencia-Chapi
2 and
Javier Muñoz-Antón
1
1
ETSI Industriales, Universidad Politécnica de Madrid (UPM), José Gutiérrez Abascal 2, 28006 Madrid, Spain
2
Facultad de Ingeniería en Ciencias Aplicadas, Universidad Técnica del Norte, Av. 17 de Julio 5-21, Ibarra 100105, Ecuador
*
Author to whom correspondence should be addressed.
Appl. Sci. 2025, 15(6), 3216; https://doi.org/10.3390/app15063216
Submission received: 3 February 2025 / Revised: 27 February 2025 / Accepted: 12 March 2025 / Published: 15 March 2025
(This article belongs to the Section Energy Science and Technology)

Abstract

:
In the context of central solar receiver systems, the utilisation of S-CO2 Brayton cycles as opposed to Rankine cycles confers a number of advantages, including enhanced efficiency, the requirement for less sophisticated turbomachinery, and a reduction in water consumption. A pivotal consideration in the design of such systems pertains to the thermal storage system. This work undertakes a comparative analysis of the performance of an S-CO2 Brayton cycle utilising two distinct types of molten salts, namely solar salts and chloride salts (MgCl2–KCl), as the heat transfer fluid on the thermal energy storage medium. The present study adopts an energetic and exergetic perspective with the objective of identifying areas of high irreversibility and proposing mechanisms to reduce them. The work is concluded with an analysis of the size of the different components. The overall energy efficiency is determined as 22.29 % and 23.76 % for solar and chloride salts, respectively. In the case of chloride salts, this efficiency is penalized by the higher losses in the solar receiver due to the higher operating temperature. The exergy analysis shows that using MgCl2–KCl salts increases exergy destruction in the recuperators, lowering irreversibilities in other components. While the sizes of all components decrease when using chloride salts, the volume of the storage system increases. These results demonstrate that the incorporation of MgCl2–KCl salts enhances the performance of S-CO2 recompression cycles operating in conjunction with a central solar receiver.

1. Introduction

Central solar receiver system technology presents a promising solution for the advancement of concentrated solar power (CSP). These systems can reach higher operating temperatures, which improves efficiency and reduces costs compared to other CSP technologies [1]. Currently, commercial central receiver power plants operate with receiver outlet temperatures below 565 °C, using a steam Rankine cycle as the power generation method [2].
Supercritical carbon dioxide (S-CO2) cycles have emerged as a promising alternative to steam Rankine cycles in solar tower power plants, primarily due to their higher efficiency. This efficiency arises from the relatively high density of S-CO2, which decreases the specific work needed during compression. S-CO2 cycles also reduce heat rejection to the environment, thanks to S-CO2’s specific heat properties. The relatively high density leads to lower volumetric flow, allowing for more compact turbomachinery. Additionally, CO2 is cost-effective, abundant, non-explosive, chemically stable, and less corrosive than other working fluids [3].
The S-CO2 Brayton cycle can operate with central solar receiver systems in direct or indirect mode. The direct method circulates CO2 through both the power cycle and the solar receiver. The indirect method uses a different heat transfer fluid (HTF) and requires an intermediate heat exchanger to connect the two systems. This indirect method is preferred because it prevents the direct heating of S-CO2 [4]. Choosing the right HTF is crucial, as its maximum temperature determines the efficiency of the power cycle. Solar salt, a mix of 60% NaNO3 and 40% KNO3, is often used, reaching a maximum of 565 °C, which limits performance. Researchers are exploring chloride salts, a mix of MgCl2 and KCl, because they can be obtained easily and economically through mining or desalination [5,6].
Several authors have compared different HTFs using S-CO2 power cycles driven by central solar receiver systems. Wang et al. [4] investigated six S-CO2 Brayton cycles powered by a solar tower with thermal energy storage. The intercooling cycle had the highest efficiency, while the partial-cooling cycle yielded the greatest specific work. The straightforward recuperation, partial cooling, and precompression cycles presented the largest temperature difference. In the study referenced [7], the authors examined three solar tower power cycles: Rankine recompression and partial cooling S-CO2. They used three molten salts: NaNO3–KNO3, MgCl2–KCl, and Li2CO3–Na2CO3–K2CO3. Conducted in Seville and Dubai, the study aimed to determine annual electricity production efficiency. The results showed that the partial cooling S-CO2 cycle was the most efficient at both locations, with the best performance in Dubai using Li2CO3–Na2CO3–K2CO3. Regarding reference [6], this study compares solar salts and a MgCl2–KCl mixture as heat transfer fluids in a solar tower recompression S-CO2 Brayton cycle. It evaluates thermal efficiency, specific work, and thermal storage capacity. The MgCl2–KCl system shows the highest thermal efficiency and specific work due to its ability to operate at higher temperatures, but it has limitations from its low specific heat capacity and higher viscosity. Polimeni et al. [1] compared two heat transfer fluids: liquid sodium and MgCl2–KCl. They examined four S-CO2 cycle configurations: a simple cycle, a recompression cycle, a partial cooling cycle, and a recompression main compressor intercooling cycle. They calculated the solar electricity efficiency in Seville, Spain, and Las Vegas, USA, under design and yearly conditions. The results showed that liquid sodium provided higher efficiency in both conditions. Qiu et al. [2] optimized the regenerative and recompression cycle of S-CO2 Brayton systems for a solar power application with a maximum operating temperature of 700 °C. The regenerative cycle achieved higher specific work and heat storage temperature difference, while the recompression cycle resulted in greater thermal efficiency. Agyekum et al. [8] assessed a 100 MW solar tower CSP plant in Tibet, China, focusing on its technical and economic aspects. They compared two heat transfer fluids, solar salts and a mixture of 46.5% LiF, 11.5% NaF, and 42% KF, along with two power cycles, S-CO2 and Rankine. Using the System Advisor Model (SAM) [9], they calculated the net present value, payback period, and levelized cost of electricity. Their findings suggest that the S-CO2 cycle with the specified mixture is the more economically favorable option.
Evaluating the economics of S-CO2 cycles is complicated due to a lack of economic data [10]. One approach is to compare different equipment sizes using specific parameters, assuming that smaller equipment offers greater economic benefits. Salim et al. [11] used this method in their exergy analysis of a recompression S-CO2 cycle, including a preliminary cost analysis with size parameters ( S P ) and the total heat transfer coefficient ( U A ). Their study found that the turbine inlet temperature and split ratio are the most important for thermal efficiency. The precooler was highlighted as having the highest exergy destruction. Overall, as turbine and compressor inlet temperatures and pressures rise, total exergy destruction increases. While U A improves with better thermal efficiency, S P rises with higher inlet temperatures, showing a trade-off between cost and efficiency.
This work compares two types of molten salts used in S-CO2 Brayton cycles with a central solar receiver system: traditional solar salts and MgCl2–KCl. These two types of salts were selected to compare the current solar salts to one of the most promising alternatives for replacement due to their lower cost and higher operational temperature range. Energetic, exergetic and equipment sizing analyses are performed in order to determine the advantages and disadvantages of each type of molten salt. Among the several alternative S-CO2 cycles [12], the S-CO2 recompression cycle has been selected because it achieves high efficiencies with a relatively simple configuration [13]. In this cycle, the recuperator is divided into two heat exchangers: a high-temperature recuperator (HTR) and a low-temperature recuperator (LTR). An extra compressor, the re-compressor (RC), is included to minimize the differences in heat capacity between the two sides of the recuperator [4].
The novelty of this work is the simultaneous analysis from the perspectives of energy, exergy, and equipment sizing for a solar tower-driven S-CO2 recompression system utilizing two types of molten salts: solar salts and MgCl2–KCl. This approach enhances our understanding of how the choice of molten salt affects the overall performance of the system. An exergy analysis will help us assess which system achieves higher performance and how each molten salt contributes to the irreversibilities present in each equipment of the system. Additionally, the equipment sizing analysis will provide a preliminary estimate of how selecting one molten salt over another impacts plant costs. As noted in the previously cited works, the influence of the heat transfer fluid (HTF) in an S-CO2 cycle is often studied primarily from an energy perspective, with efficiency, specific work, and the temperature differences of the HTF being the most commonly used parameters for comparison. Some studies extend this energy analysis by incorporating an economic analysis. This paper contributes to the existing literature by including an exergy analysis, which allows us to determine how the use of molten salts impacts the irreversibilities in various pieces of equipment within the S-CO2 cycle. Another significant contribution of this work is using volume as a key parameter to represent storage size. In the reviewed literature, the size of the storage system is typically related to the temperature difference of the HTF, where a larger temperature difference results in a smaller storage system. This study considers the density changes associated with temperature variations using volume as a parameter.
The paper is organized as follows: Section 2 describes the central solar receiver system utilizing the recompression of S-CO2 and details the thermophysical properties of both heat transfer fluids (HTFs). Section 3 summarizes the simulation model developed for the various analyses. The validation of this model is presented in Section 4. The results are presented in Section 5, and finally, Section 6 concludes with a summary of the findings and suggestions for future work.

2. System Description

The layout of the solar tower integrated with the S-CO2 recompression Brayton cycle is depicted in 
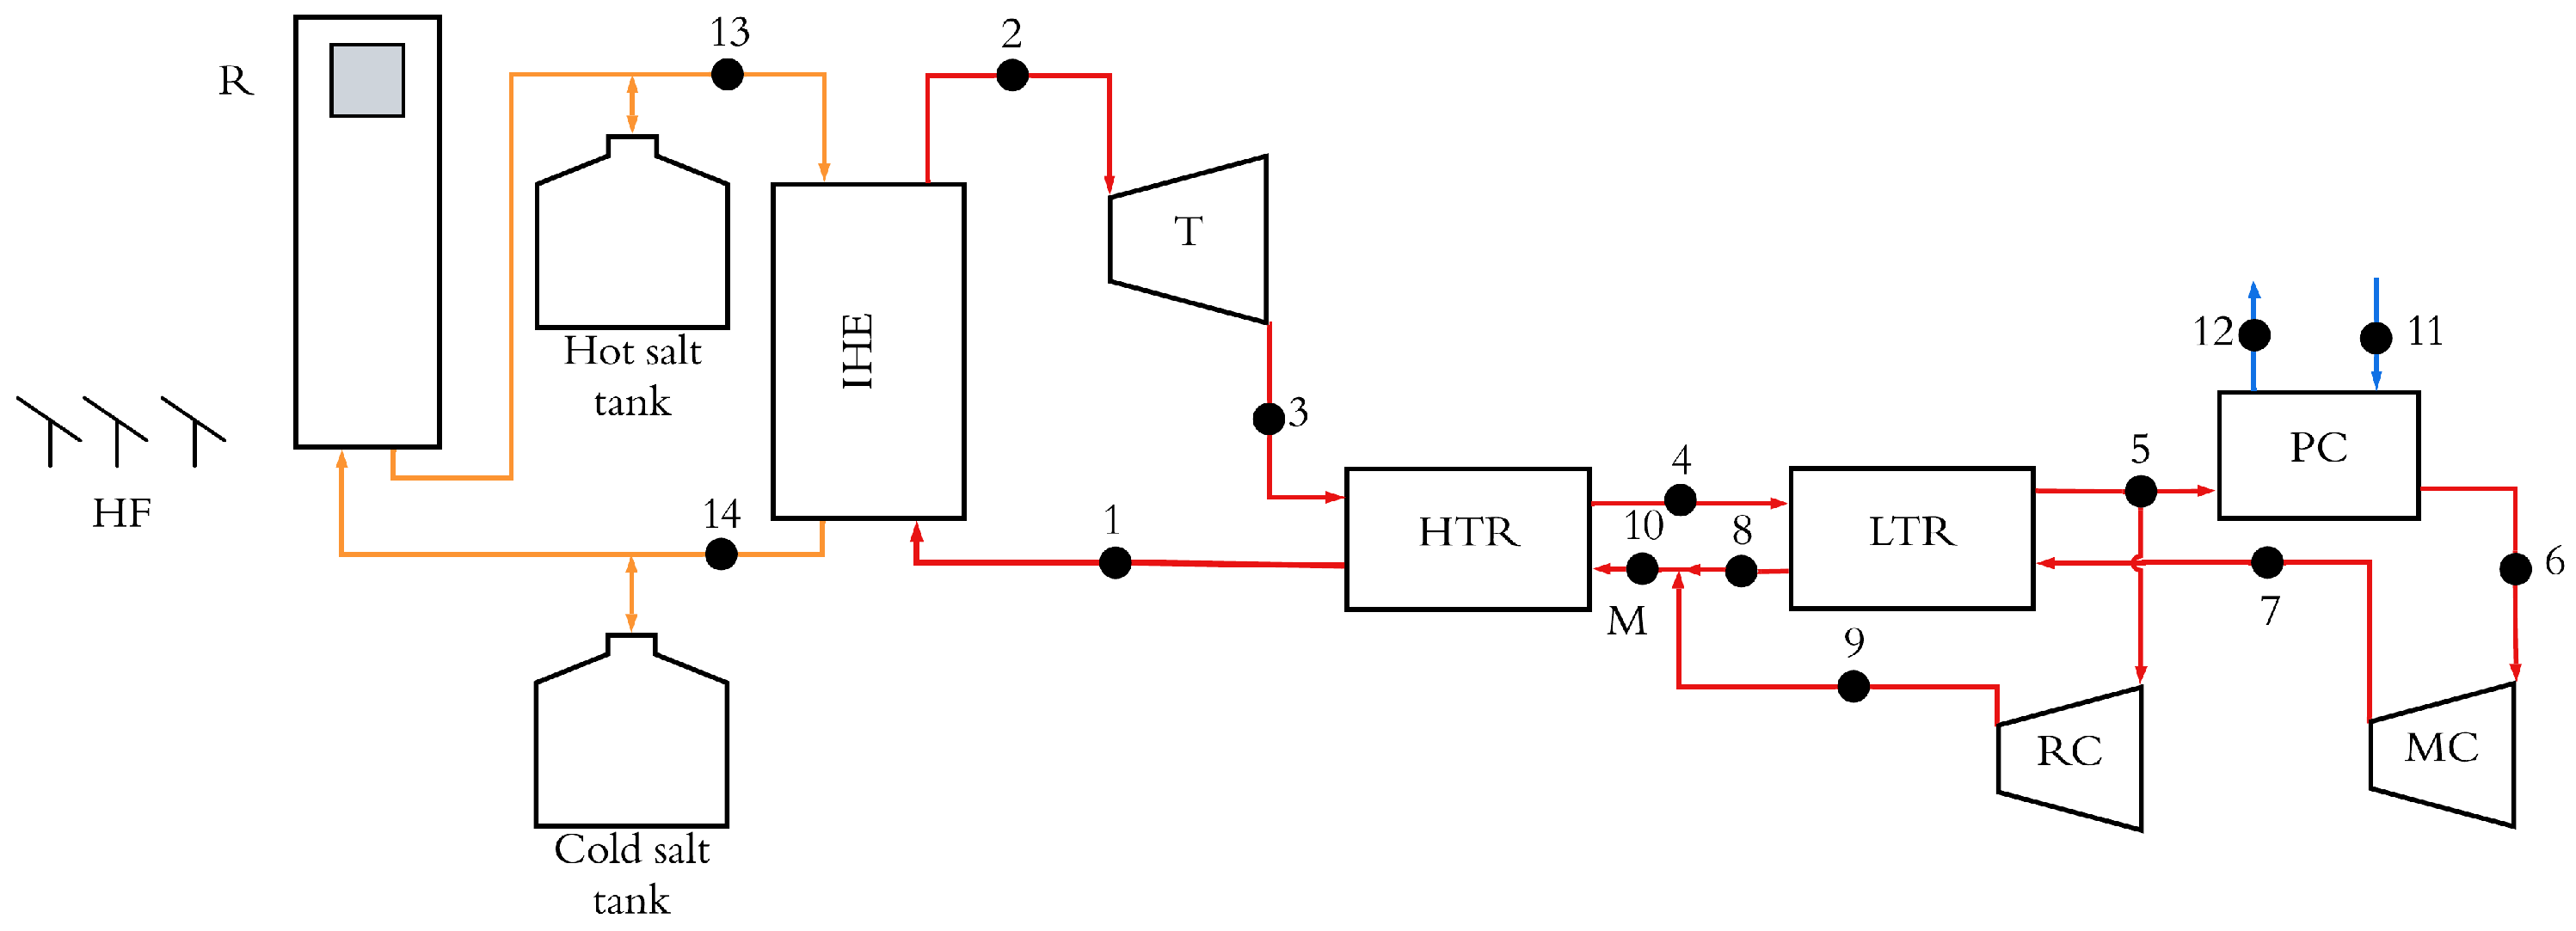
Figure 1. The system consists of the heliostats field, solar receiver, thermal energy storage and the S-CO2 recompression cycle. The solar radiation in the heliostat field (HF) is reflected and concentrated on the solar receiver (R), which is located at the top of the tower. This concentrated radiation heats the HTF, which flows through the solar receiver. The HTF is used to provide thermal power to the S-CO2 power cycle. The thermal storage system is used to take advantage of times when there is a surplus of solar radiation. In conditions of elevated solar radiation, an excess of thermal energy is stored. Conversely, in conditions of reduced solar radiation, the thermal energy that has been stored is discharged. Both operation modes are oriented to maintain the desired electricity production of the cycle. The thermal storage system can consist of two tanks or a single thermocline tank. In this work, the two-tank system is adopted because this method is more reliable and, therefore, more used in commercial projects despite the fact that the method based on the thermocline tank presents lower costs [14]. The intermediate heat exchanger connects the HTF circuit with the S-CO2 cycle. This cycle consists of the following thermodynamic processes:
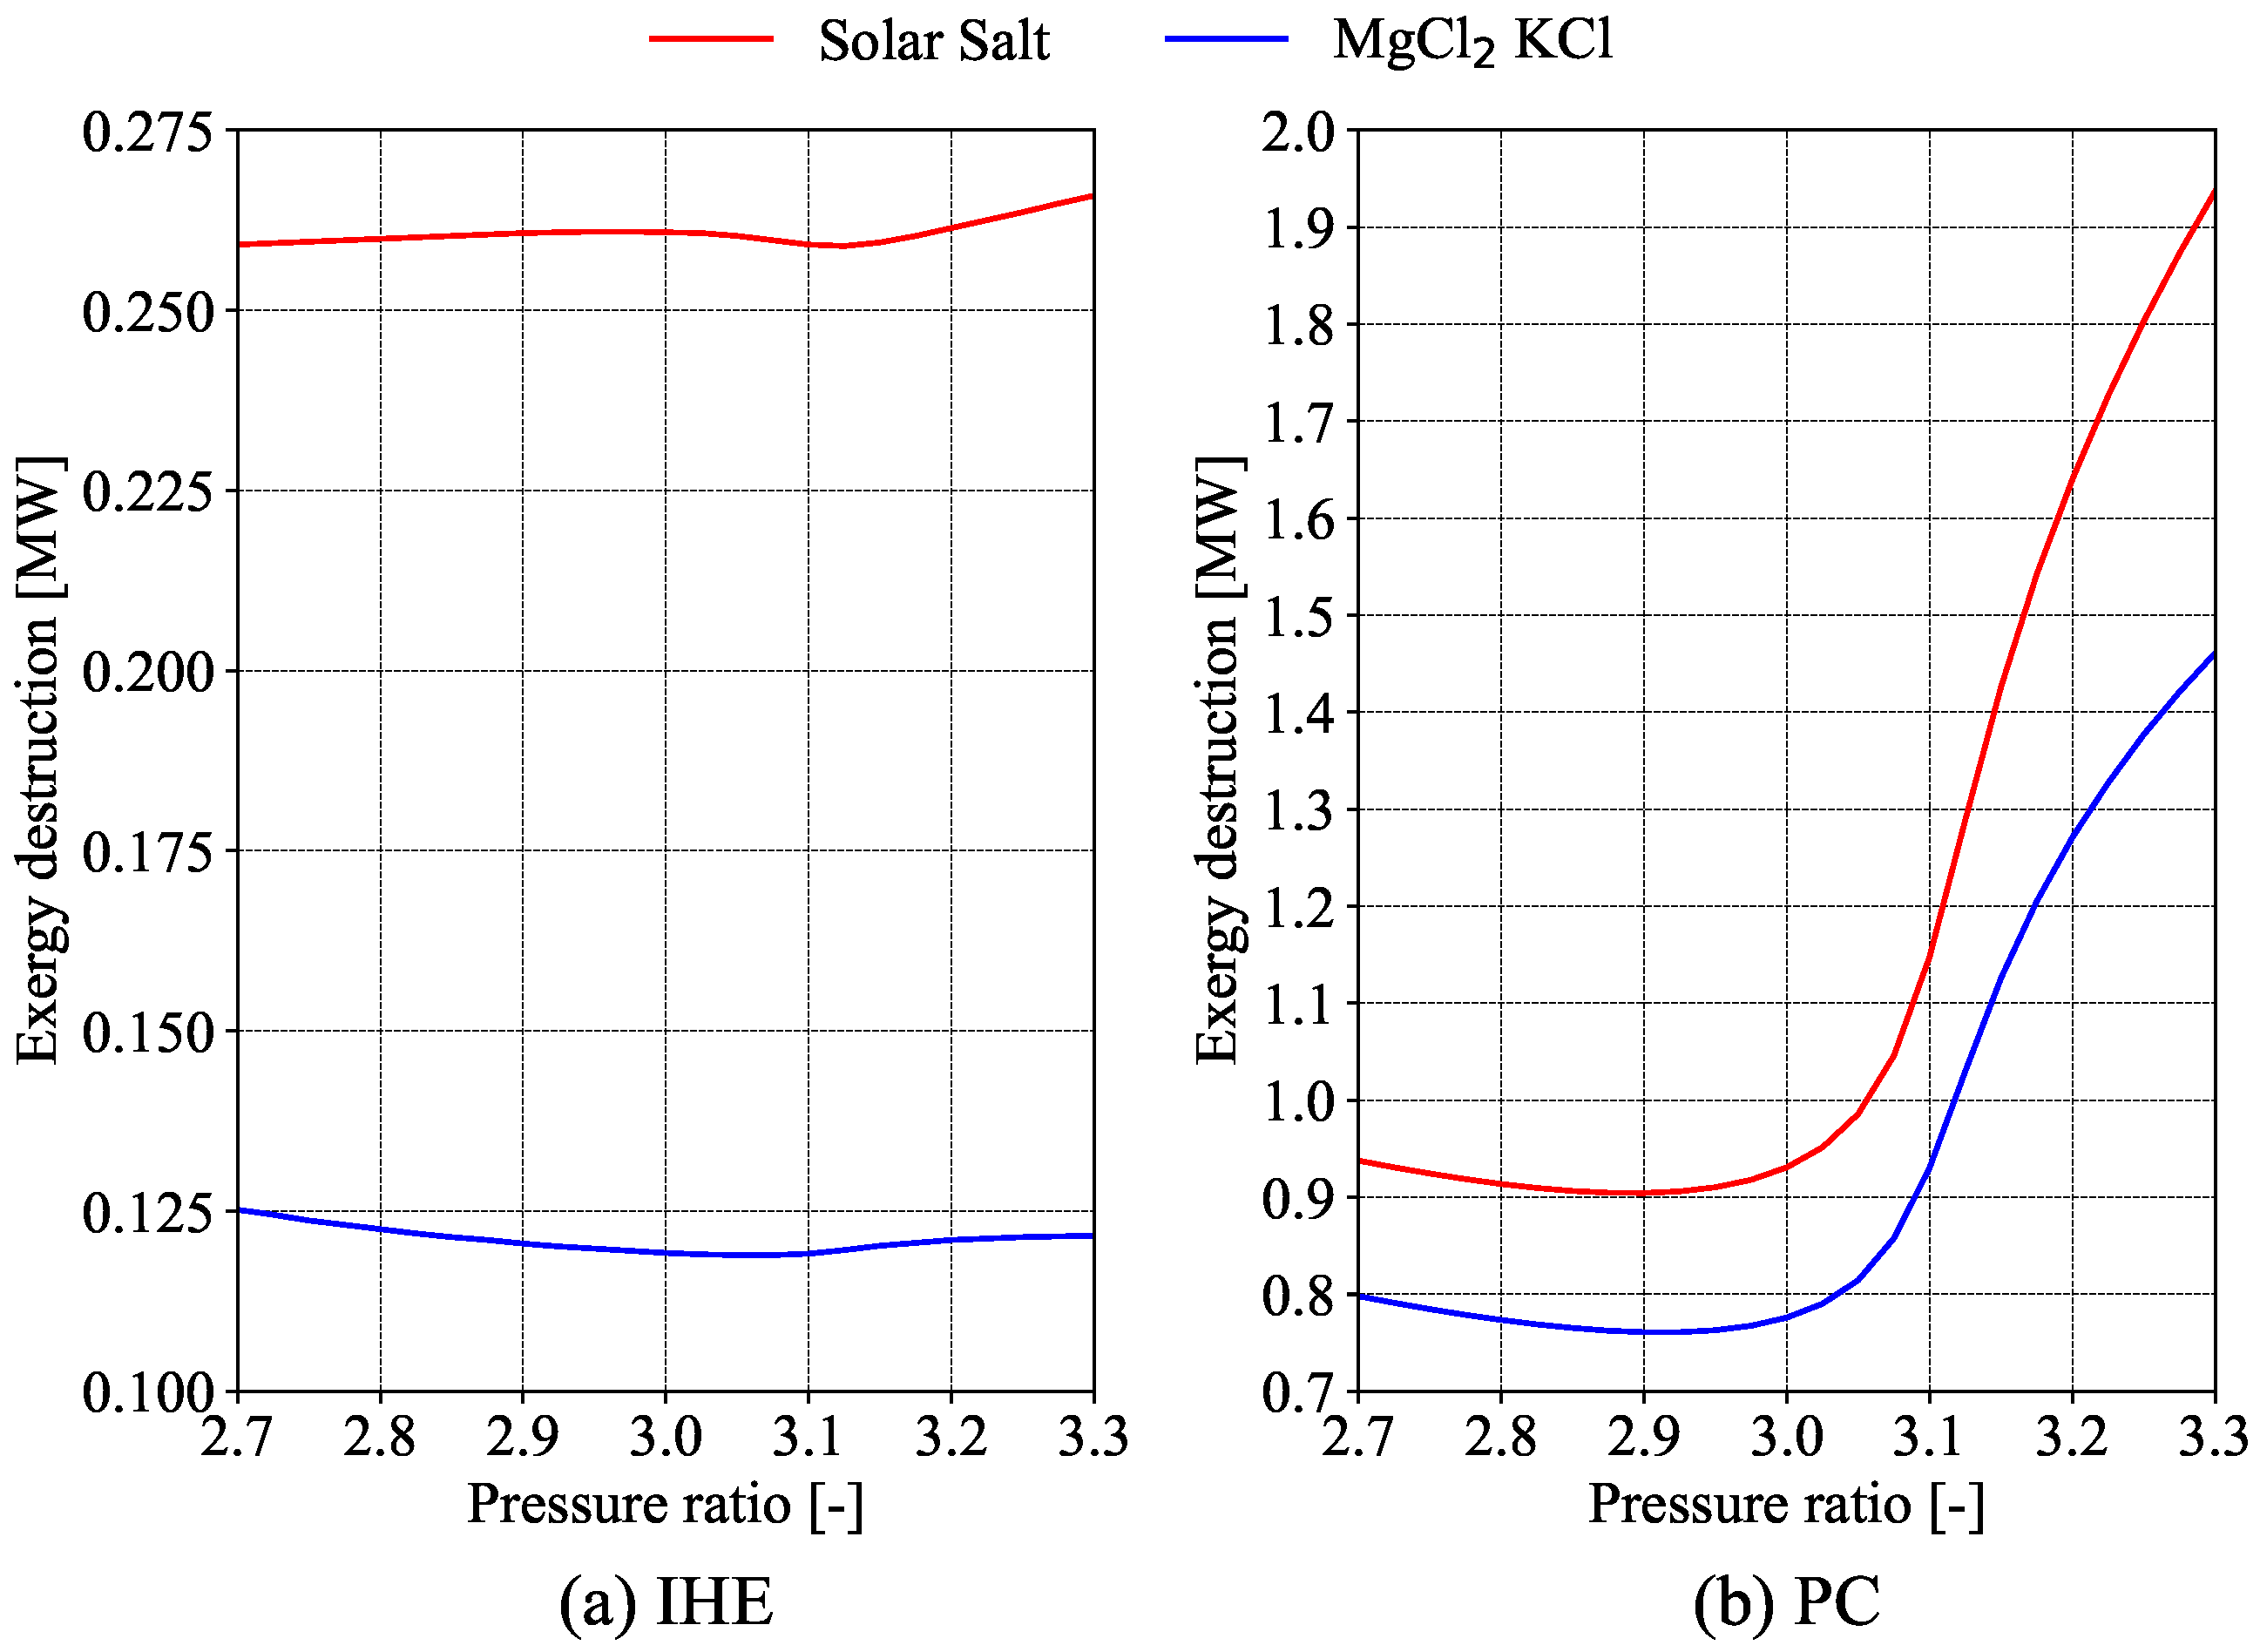
  • Process 1–2 and 13–14: Heat transfer in intermediate heat exchanger (IHE) between the molten salts (states 13–14) to the S-CO2 circulating through the power block (states 1–2).
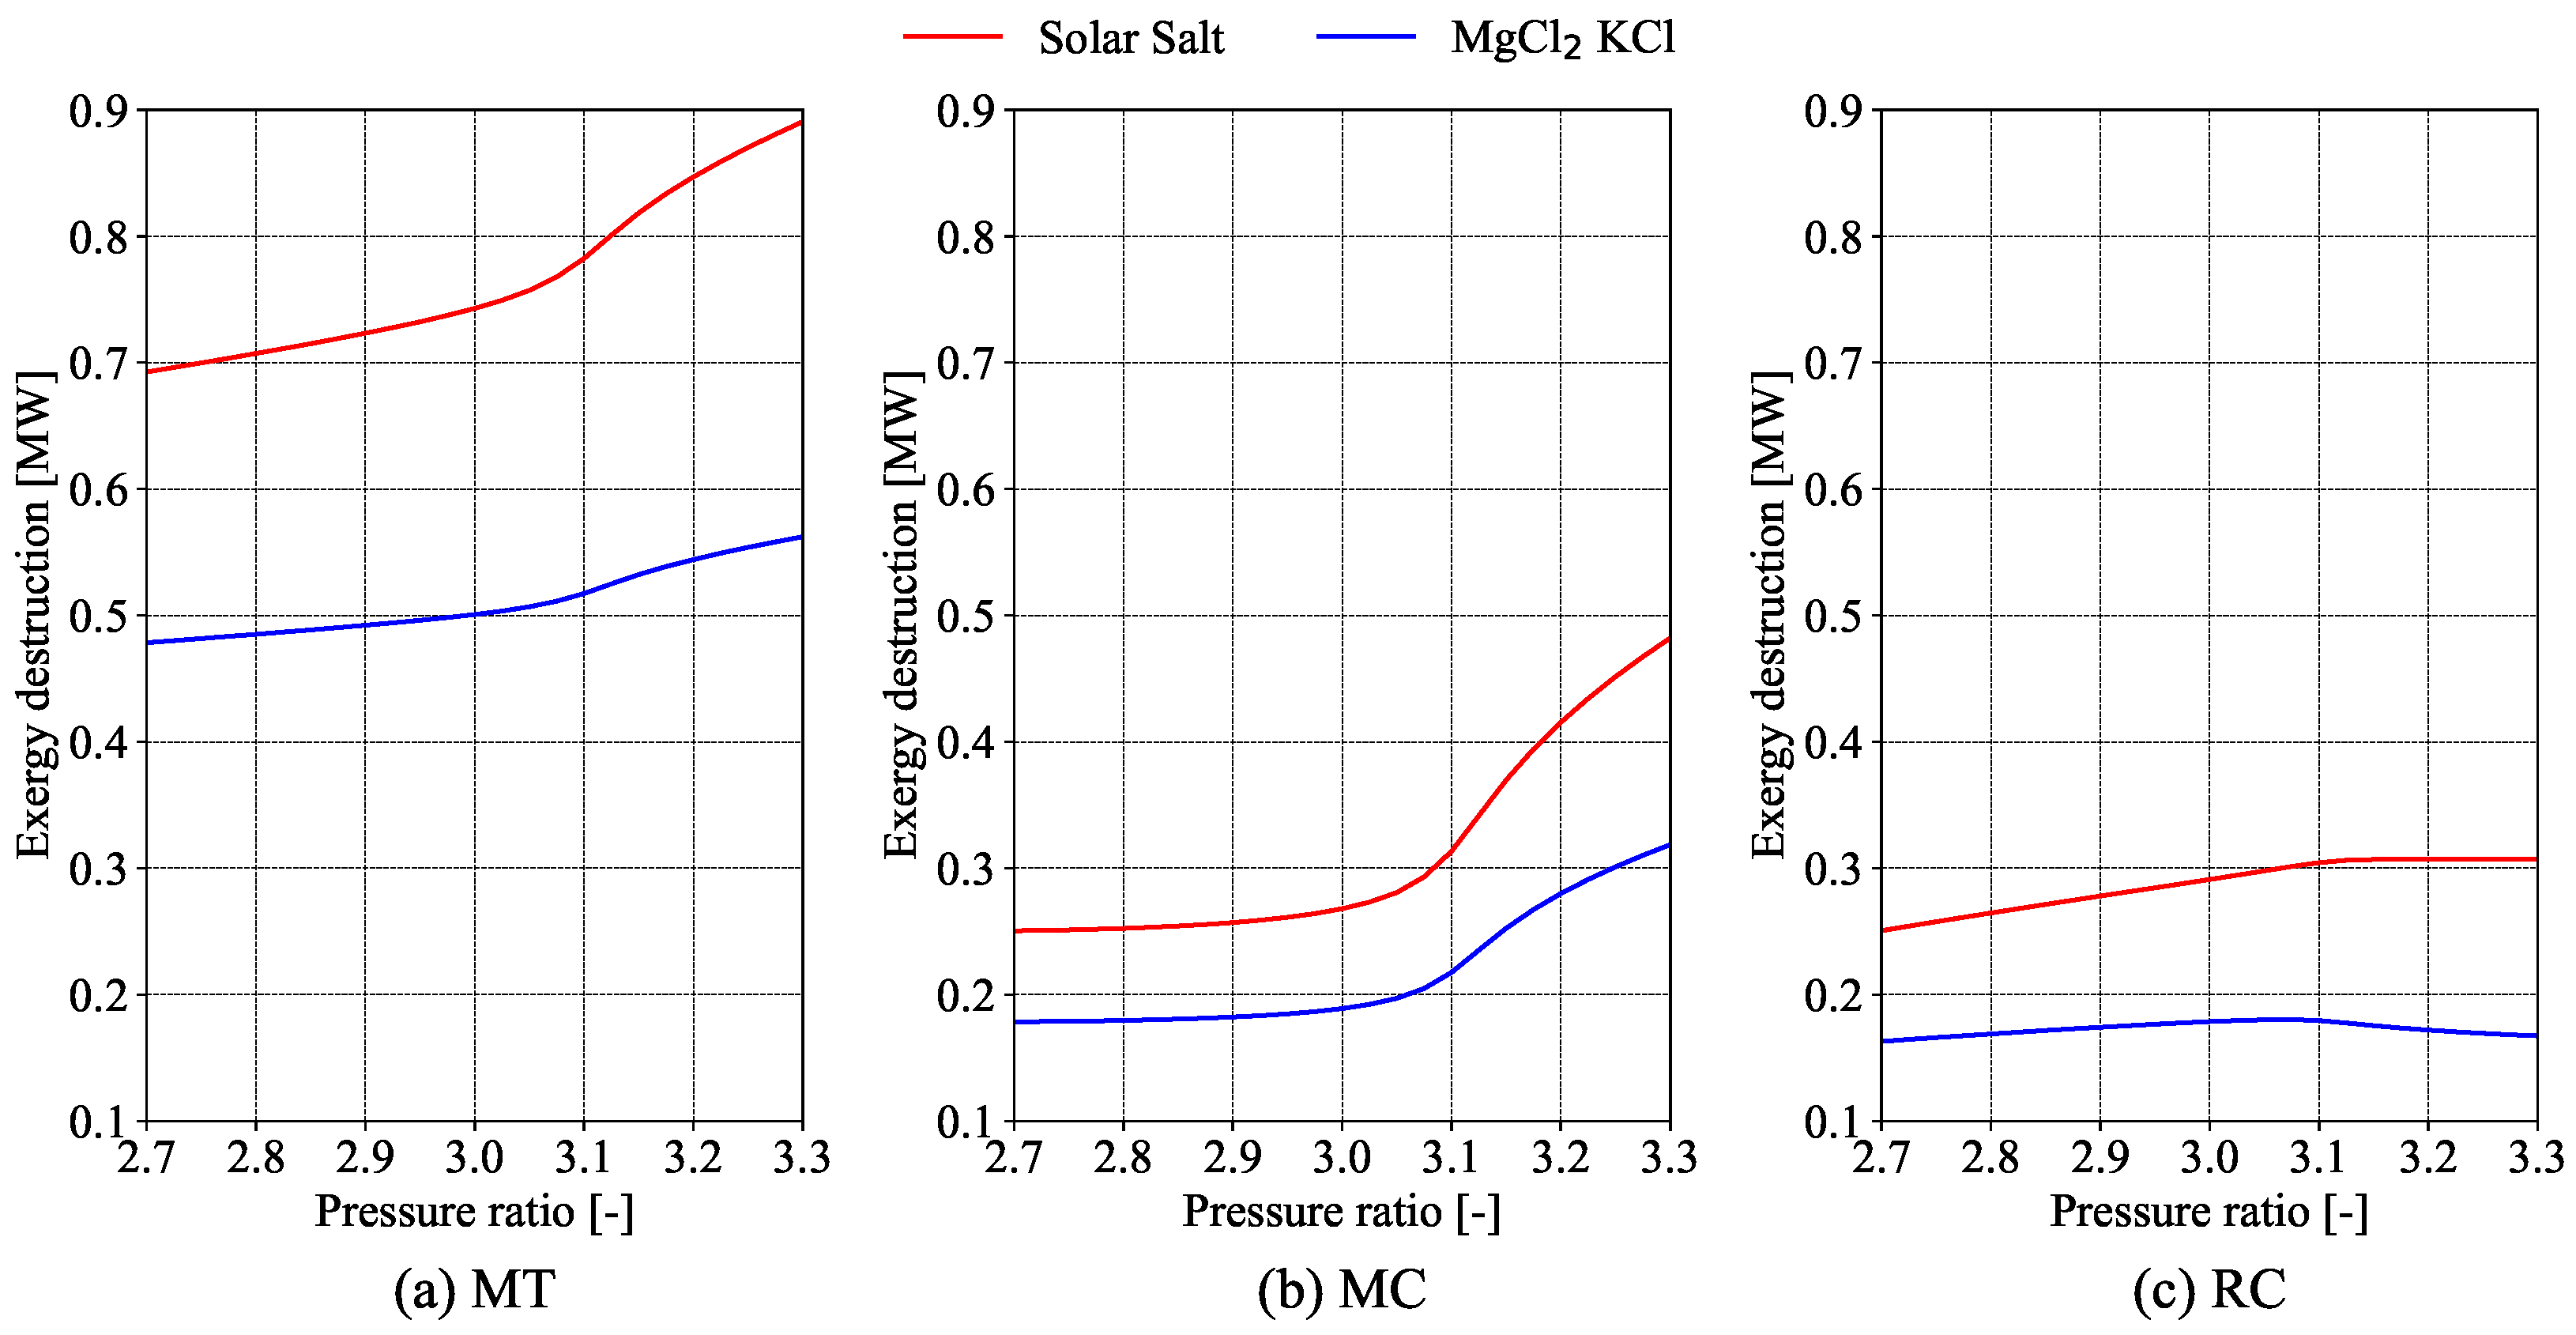
  • Process 2–3: Non-isentropic expansion process in the turbine (T).
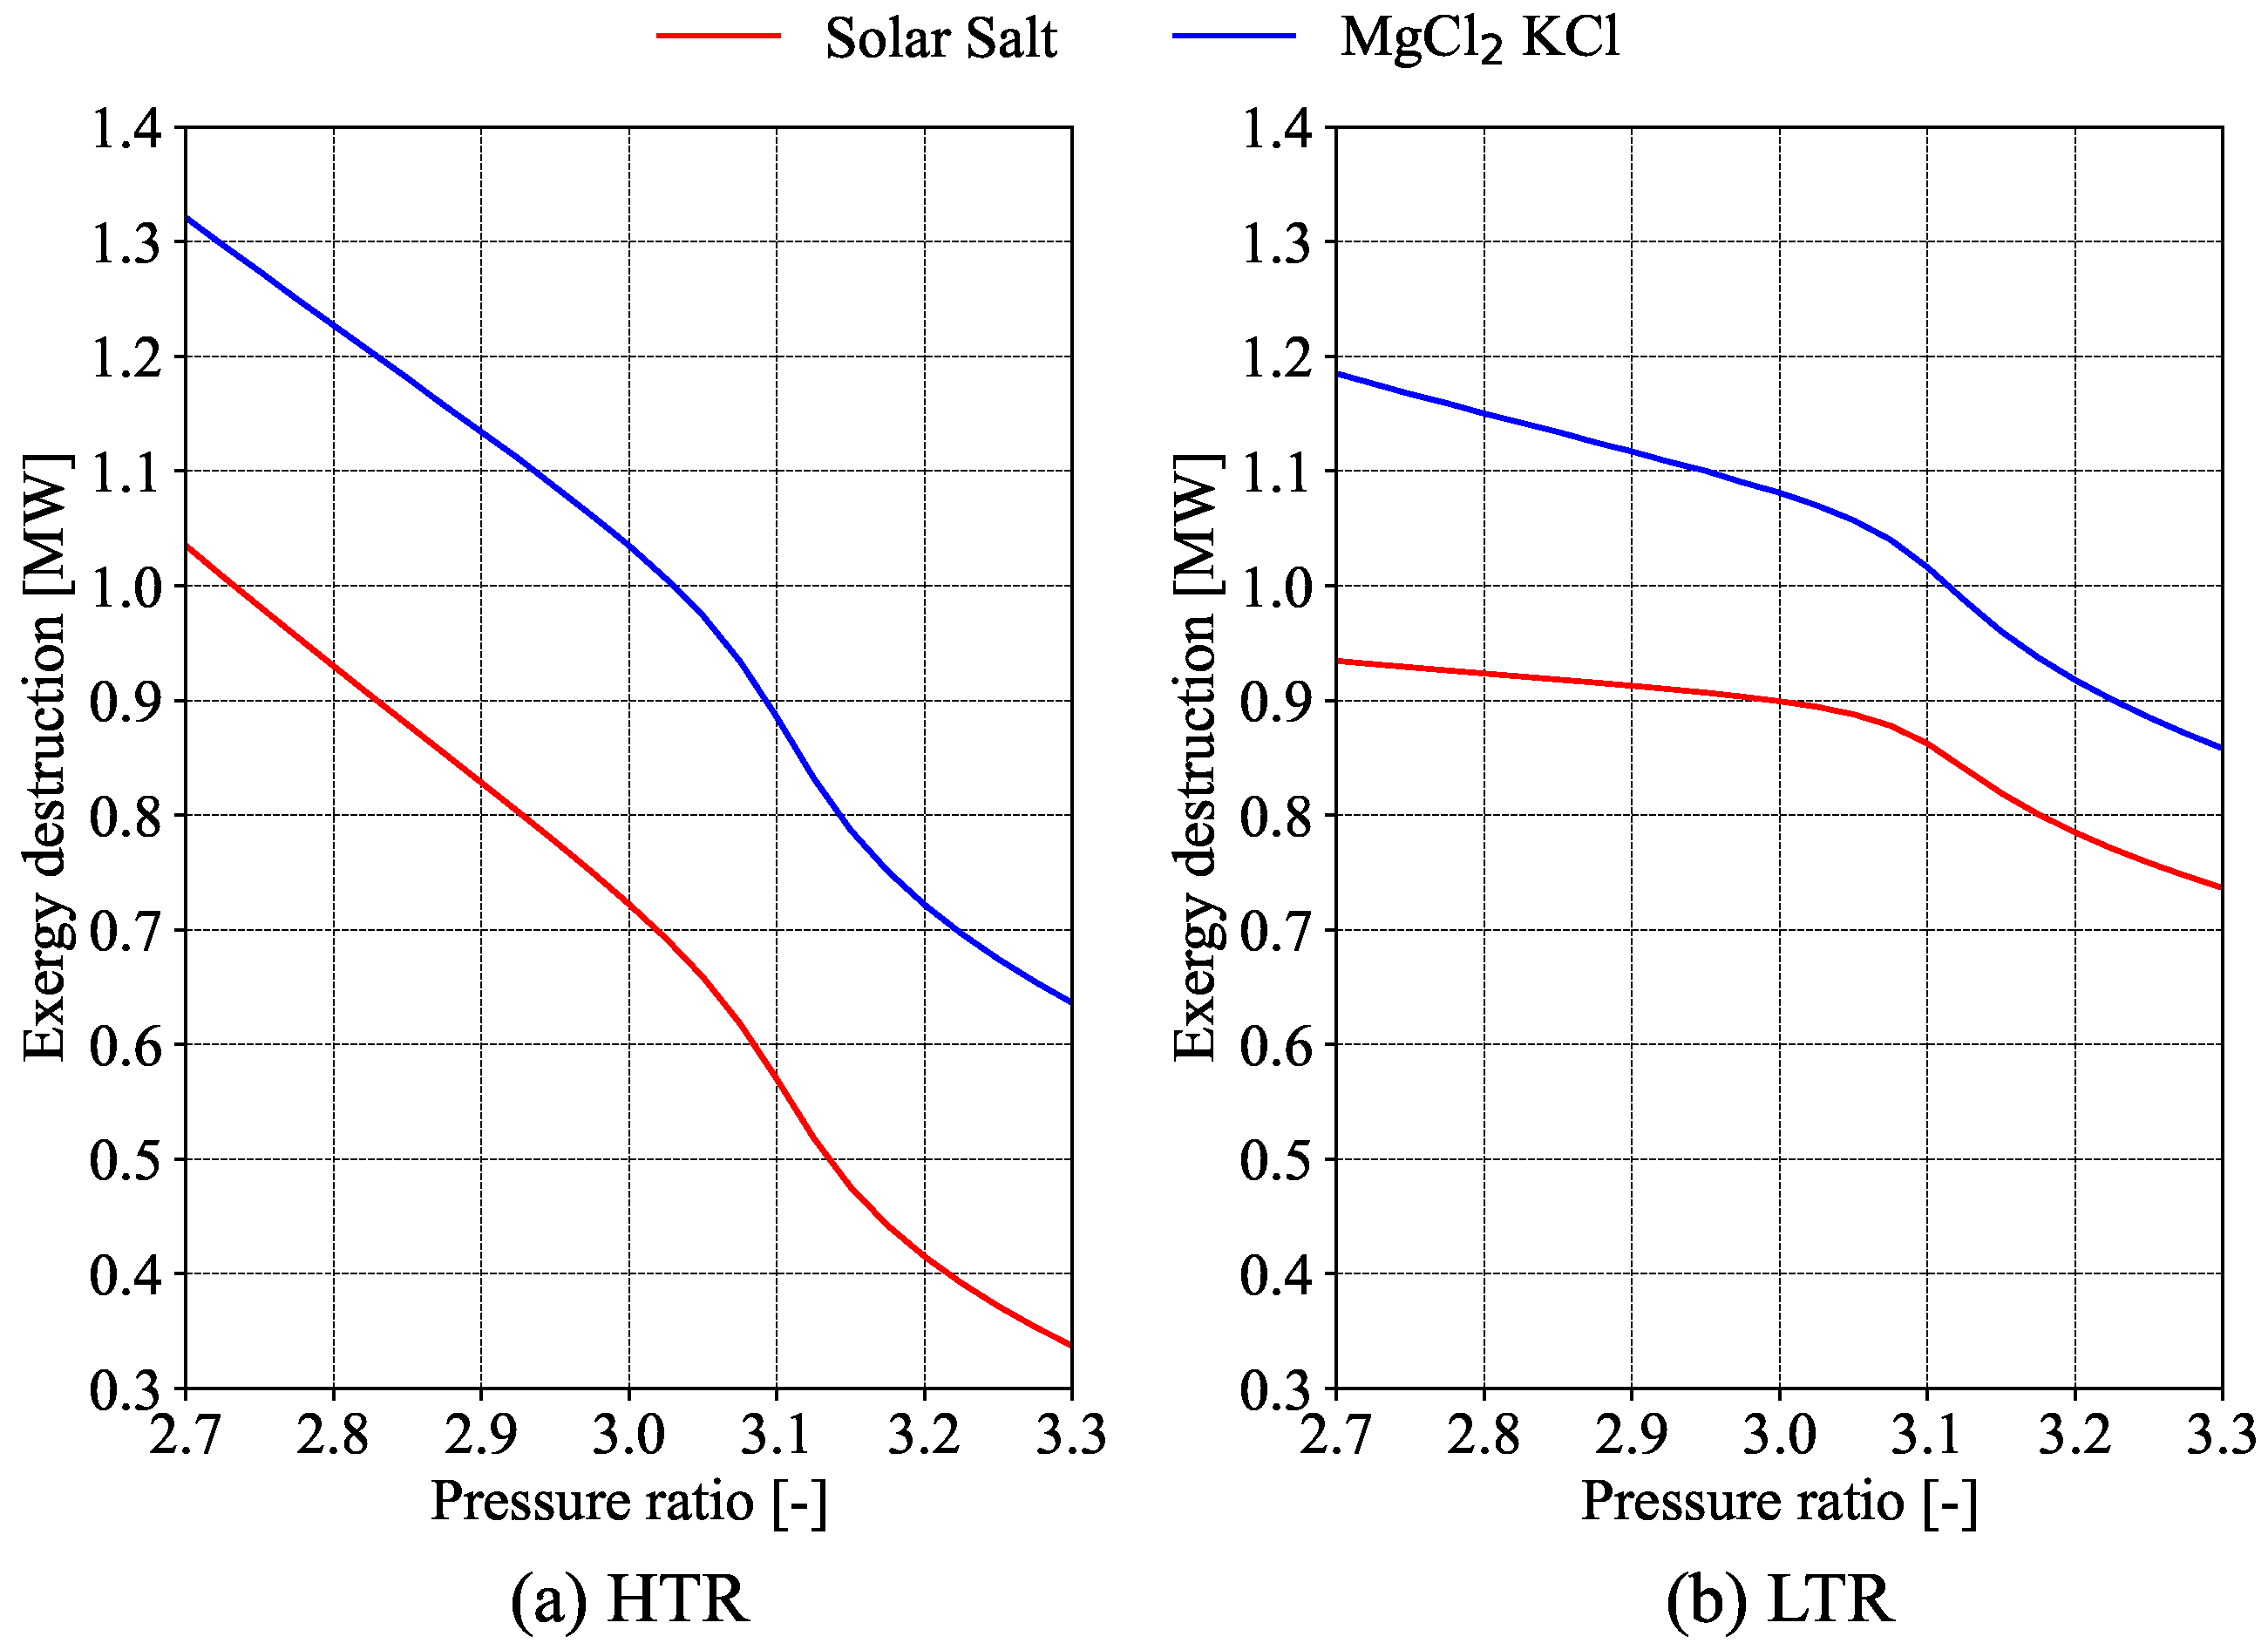
  • Process 3–4 and 1–10: Heat exchange in high-temperature recuperator (HTR).
  • Process 5–6 and 7–8: Heat exchange in low-temperature recuperator (LTR).
  • Process 6–7: Non-isentropic compression process in main compressor (MC).
  • Process 5–9: Non-isentropic compression process in recompression compressor (RC).
  • Process 9, 8 and 10: Adiabiatic mixed flow.
  • Process 5–6 and 11–12: Heat exchange process in precooler (PC) between the S-CO2 (states 5–6) and cooling water (states 11–12).
This paper examines two types of molten salts: solar salts and MgCl2–KCl. Table 1 summarizes the thermophysical properties of both molten salts. The thermophysical properties of the solar salts and MgCl2–KCl were collected by Equation Engineering Solver (EES) [15] from the reference materials [16,17], respectively. The minimum operating temperatures are set with a safety margin of 70 °C above the melting temperature [6]. The specific heat for MgCl2–KCl is 1.56 kJ/kg·K and is minimally influenced by temperature throughout the operating range. Generally, the specific heat of all chloride salts exhibits little dependence on temperature [5]. Although the MgCl2–KCl system presents higher operating temperatures, it has limitations due to its lower density and specific heat capacity, which should be taken into account.

3. Methodology

The energy and exergy analyses are carried out using Equation Engineering Solver (EES) [15]. The thermophysical properties of CO2, molten salts and water are calculated with the libraries included in EES. The following assumptions are adopted to develop both analysis:
  • The system operates in steady conditions.
  • The variations in kinetic and potential energies are neglected.
  • Pressure drops and heat losses are not considered in the design of heat exchangers and pipes.
  • A model based on effectiveness has been used for the recuperators. The effectiveness of each recuperator (Equations (1) and (2)) considers the side with the lower heat capacity [2].
    ε H T R = T 3 T 4 T 3 T 10 if minimum in hot side T 1 T 10 T 3 T 10 if minimum in cold side
    ε L T R = T 4 T 5 T 4 T 7 if minimum in hot side T 8 T 7 T 4 T 7 if minimum in cold side
  • The power block absorbs the thermal power provided by the solar block in the inter-mediate heat exchanger, a counter-flow heat exchanger with a minimum temperature difference of 15 K between the molten salts and the S-CO2 (Equation (3)) [18]. This value is different from the S-CO2/S-CO2 heat exchanger, where the minimum temperature difference is 5 K [19]. The assumption of equal entropy generation at both terminals of this heat exchanger will be made (Equation (4)) [18].
    T 13 = T 2 + 15 K
    d Q 1 T 13 1 T 2 = d Q 1 T 14 1 T 1
  • The salt storage tank is well-insulated, and therefore, heat losses are considered negligible.
Table 2 summarizes the input parameters assumed for this study. The rated power is assumed to be 10 MW, which corresponds to the scale of a demonstration plant [20]. The cooling water inlet and outlet temperatures for the precooler are 25 °C and 35 °C, following the recommendation of the reference [21]. It is hypothesised that the compressor inlet temperature is 35 °C, a supposition that is in accordance with the recommendations set out in the references [21,22]. The efficiency of the power cycle significantly increases with higher recuperator effectiveness. It is asserted that an effectiveness level that exceeds 90% may not be economically viable, as indicated by reference [22]. For this work, a conservative value of 86% is assumed. The assumed values for isentropic efficiency of the turbine (90%) and compressor (85%) are typical values that have been documented in the extant literature [23]. The maximum cycle pressure, defined as the pressure at the outlet of the main compressor, is constant at 250 bar. This value signifies the upper limit of the mechanical strength of the materials commonly employed in S-CO2 at operating temperatures [1]. Throughout the study, this maximum cycle pressure remains constant. The minimum pressure, which is the pressure at the inlet of the main compressor, is determined based on the pressure ratio. The maximum temperature for each type of molten salt, which is the temperature at the outlet of the solar receiver, has been assumed to be the highest possible, as shown in Table 1. The maximum temperature of the molten salt determines the turbine inlet temperature on the power cycle by Equation (4). It is well established that the efficiency of the power cycle improves as the maximum turbine inlet temperature increases.
The energy, the exergy and sizing analyses are summarized in Section 3.1, Section 3.2 and Section 3.3, respectively.

3.1. Energy Analysis

A mass balance and energy balance are conducted for each component. The equations obtained are summarized in Table 3.
The parameter S R indicated the split ratio. This parameter is defined as the mass flow rate circulating through the recompression compressor and the mass flow rate circulating through the turbine by Equation (5).
S R = m ˙ C O 2 , R C m ˙ C O 2 , T
The solar to thermal efficiency of the solar block η S B (heliostat field, central receiver and tower) is defined as the ratio between the power absorbed by the molten salts Q ˙ H T F in the receiver and the total power incident in the heliostat field Q ˙ s . The thermal power absorbed by the molten salts is determined by calculating the power absorbed by the solar receiver Q ˙ r e c and accounting for losses due to radiation Q ˙ r a d and convection Q ˙ c o n .
η S B = Q ˙ H T F Q ˙ s = Q ˙ r e c Q ˙ r a d Q ˙ c o n Q ˙ s = α η h e l F ϵ r e c σ T R 4 T s k y 4 + h c o n T R T 0 C · D N I
where α is the receiver absorptivity, η h e l is the heliostat field efficiency, C is the concentration ratio, ϵ r e c is the receiver emissivity, σ is the Stefan–Boltzmann constant, F is the view factor, T R is the receiver surface temperature, T s k y is the sky temperature, h c o n is the receiver heat transfer coefficient and D N I is the direct normal irradiance [W/m2]. The surface temperature of the receiver is calculated from the transfer coefficient from the receiver surface to HTF [19]. The sky temperature T s k y is calculated using the equation provided by [24]. Equation (6) is derived from the model proposed by reference [19]. Table 4 provides the value of the diferent parameters required to calculated the solar to thermal efficiency of the solar block using the Equation (6). The input parameters assumed for the calculation of the solar to thermal efficiency of the solar block are summarized in Table 4. These values are obtained from the reference [19].
The thermal efficiency of the cycle power is defined as the ratio between the net power produced and the thermal power absorbed by the cycle (Equation (7)).
η P B = W ˙ N Q ˙ H T F
The overall thermal efficiency of the systems is defined as the ratio of the net power and the incident power of the heliostat field.
η = W ˙ N Q ˙ s
The specific work is calculated as the ratio of net power to the mass flow rate of CO2 circulating through the power cycle.
w = W ˙ N m ˙ C O 2

3.2. Exergy Analysis

The exergy analysis predicts the irreversibilities of a component quantifying its exergy destruction. After evaluating the system from the energy point of view, the exergy rate of each current is calculated. The exergy destruction for each component is calculated as the difference between the exergy rate of the fuel and the product. The exergy rate of product and fuel for each component are defined by applying the methodology explained in reference [25]. The equations for each component are summarized in the Table 5. The ambient temperature and pressure were established at 25 °C and 1 bar, respectively.
The solar block’s energy source is solar radiation. The exergy provided by this radiation can be expressed using Equation (10), which is known as the Petela’s formula [26].
E ˙ x s = Q ˙ s 1 4 3 T 0 T s + 1 3 T 0 T s 4
where Q ˙ s is the total power incident in the heliostat field, T s is the sun surface temperature (5700 K) and T 0 is the ambient temperature.
The overall exergy efficiency of the system is expressed by Equation (11)
ψ = W ˙ N E x ˙ s

3.3. Sizing Analysis

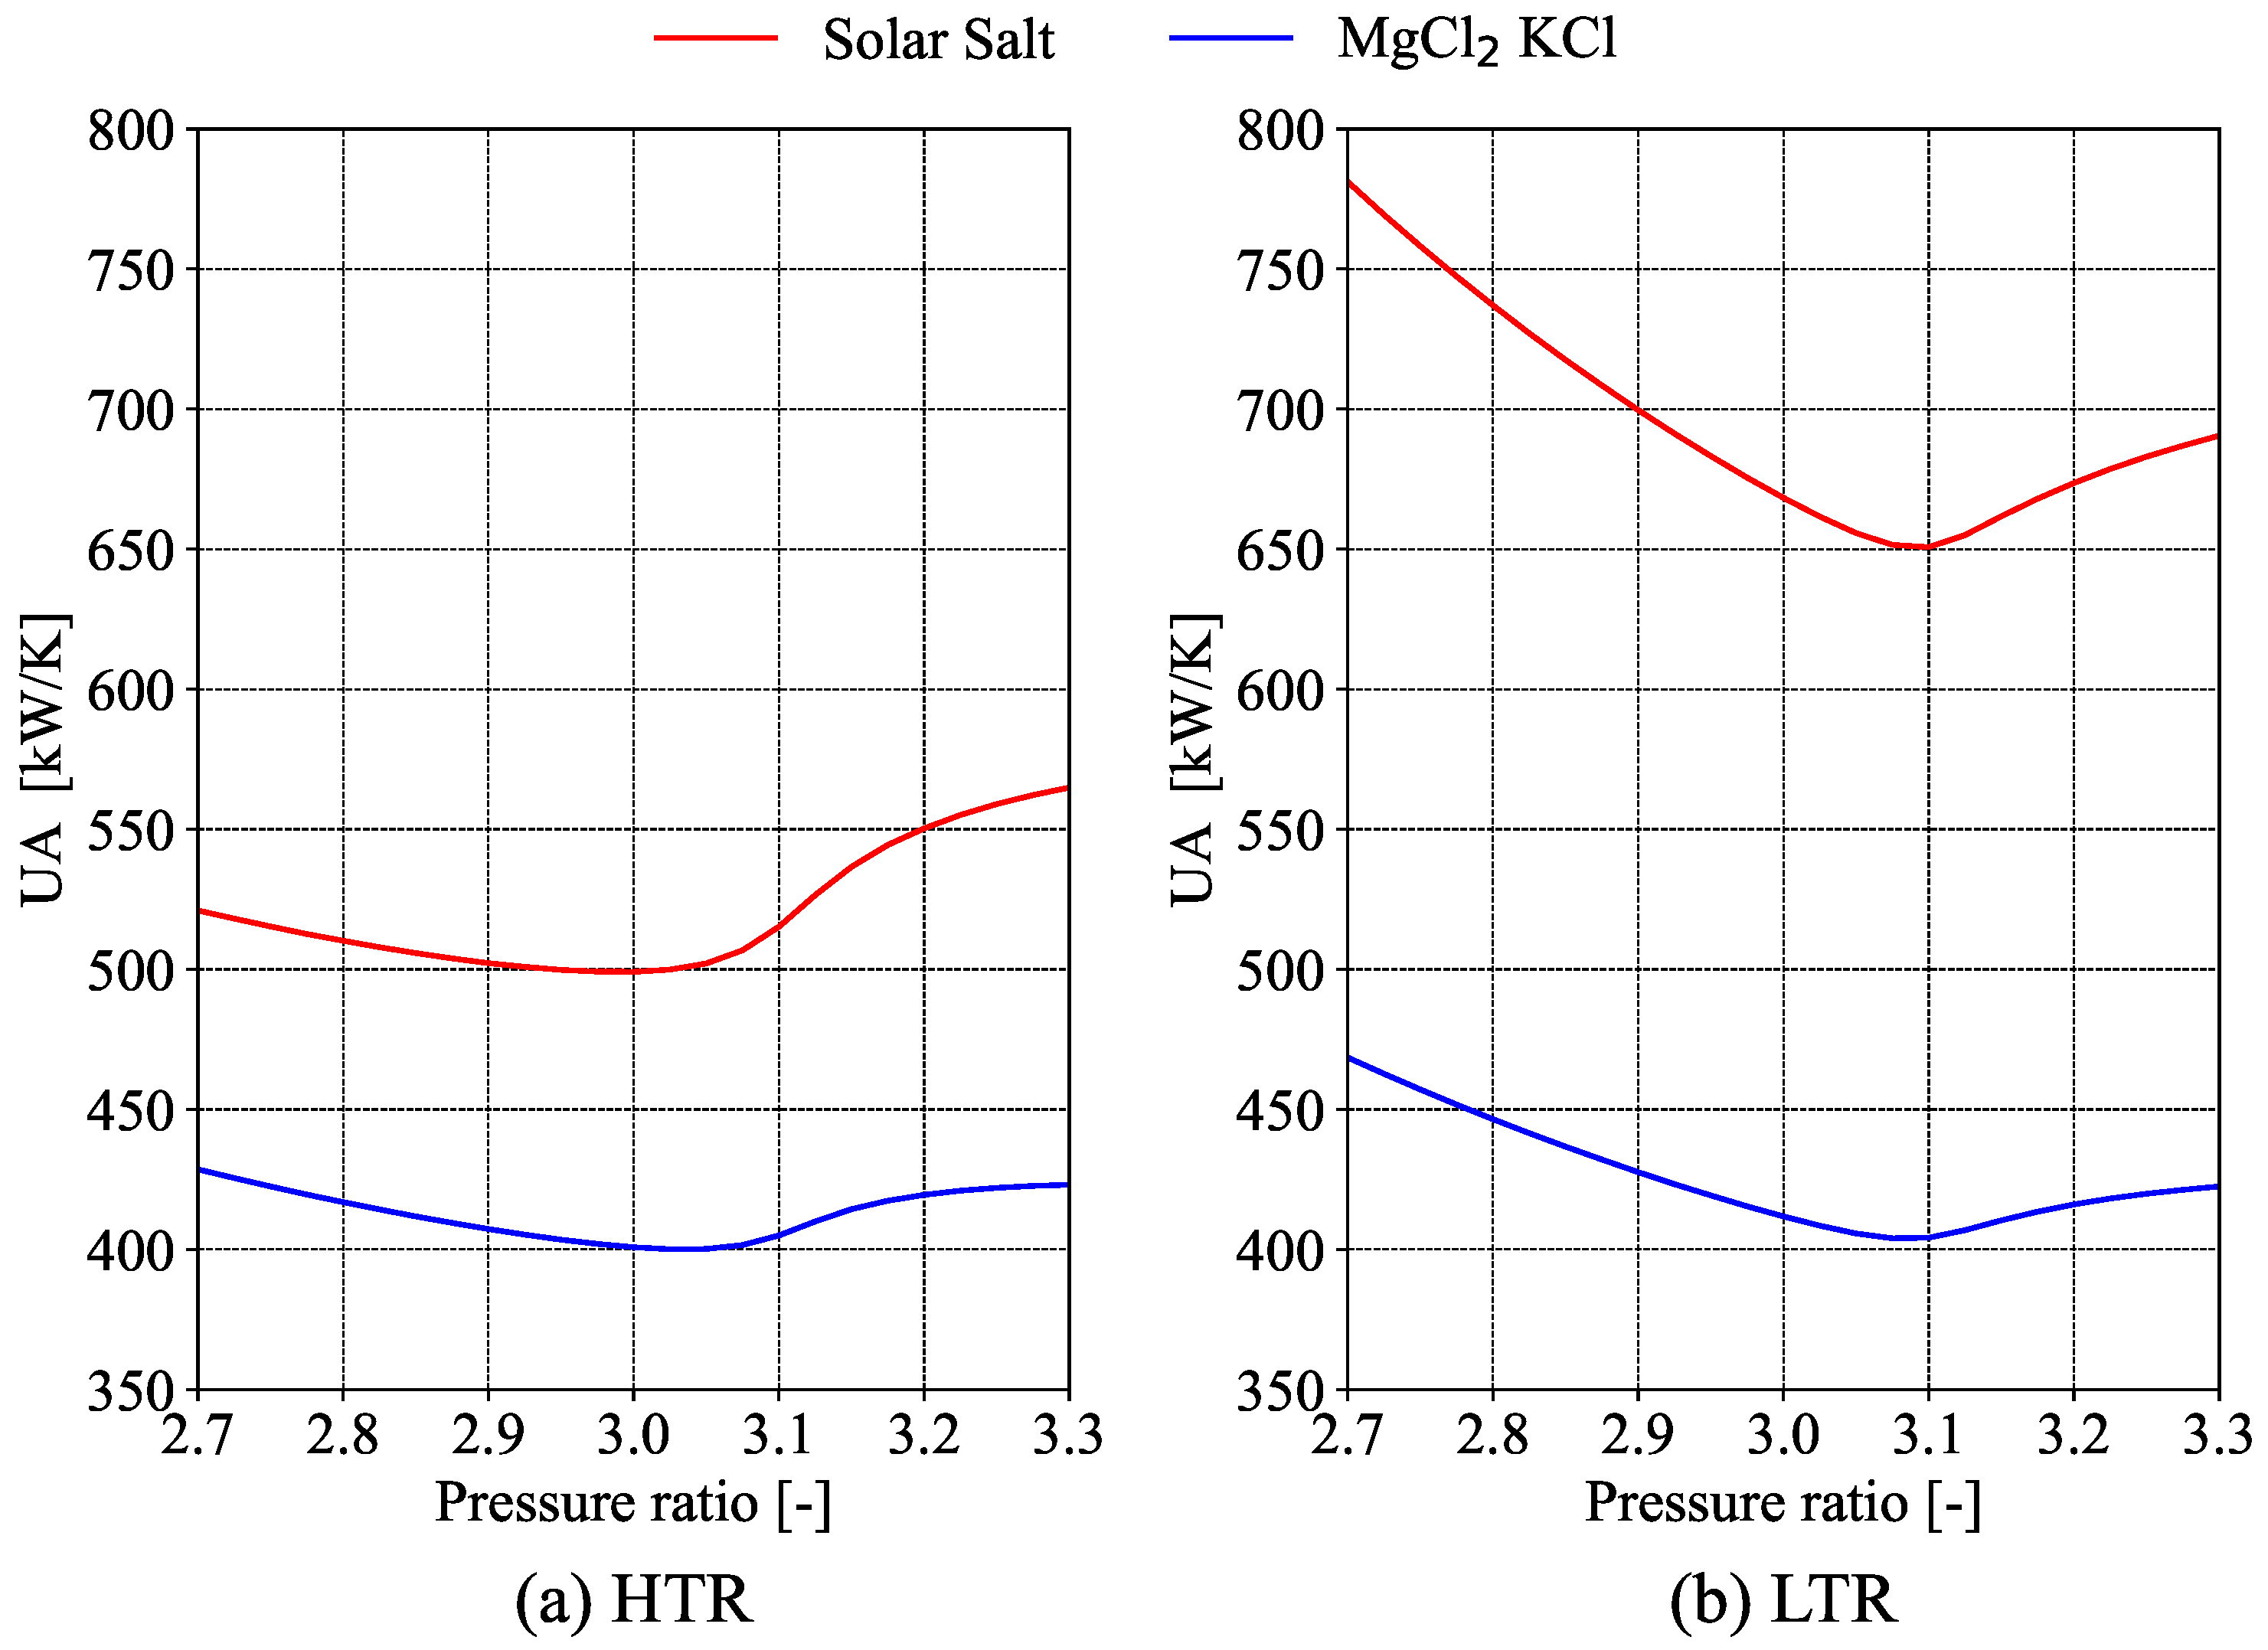
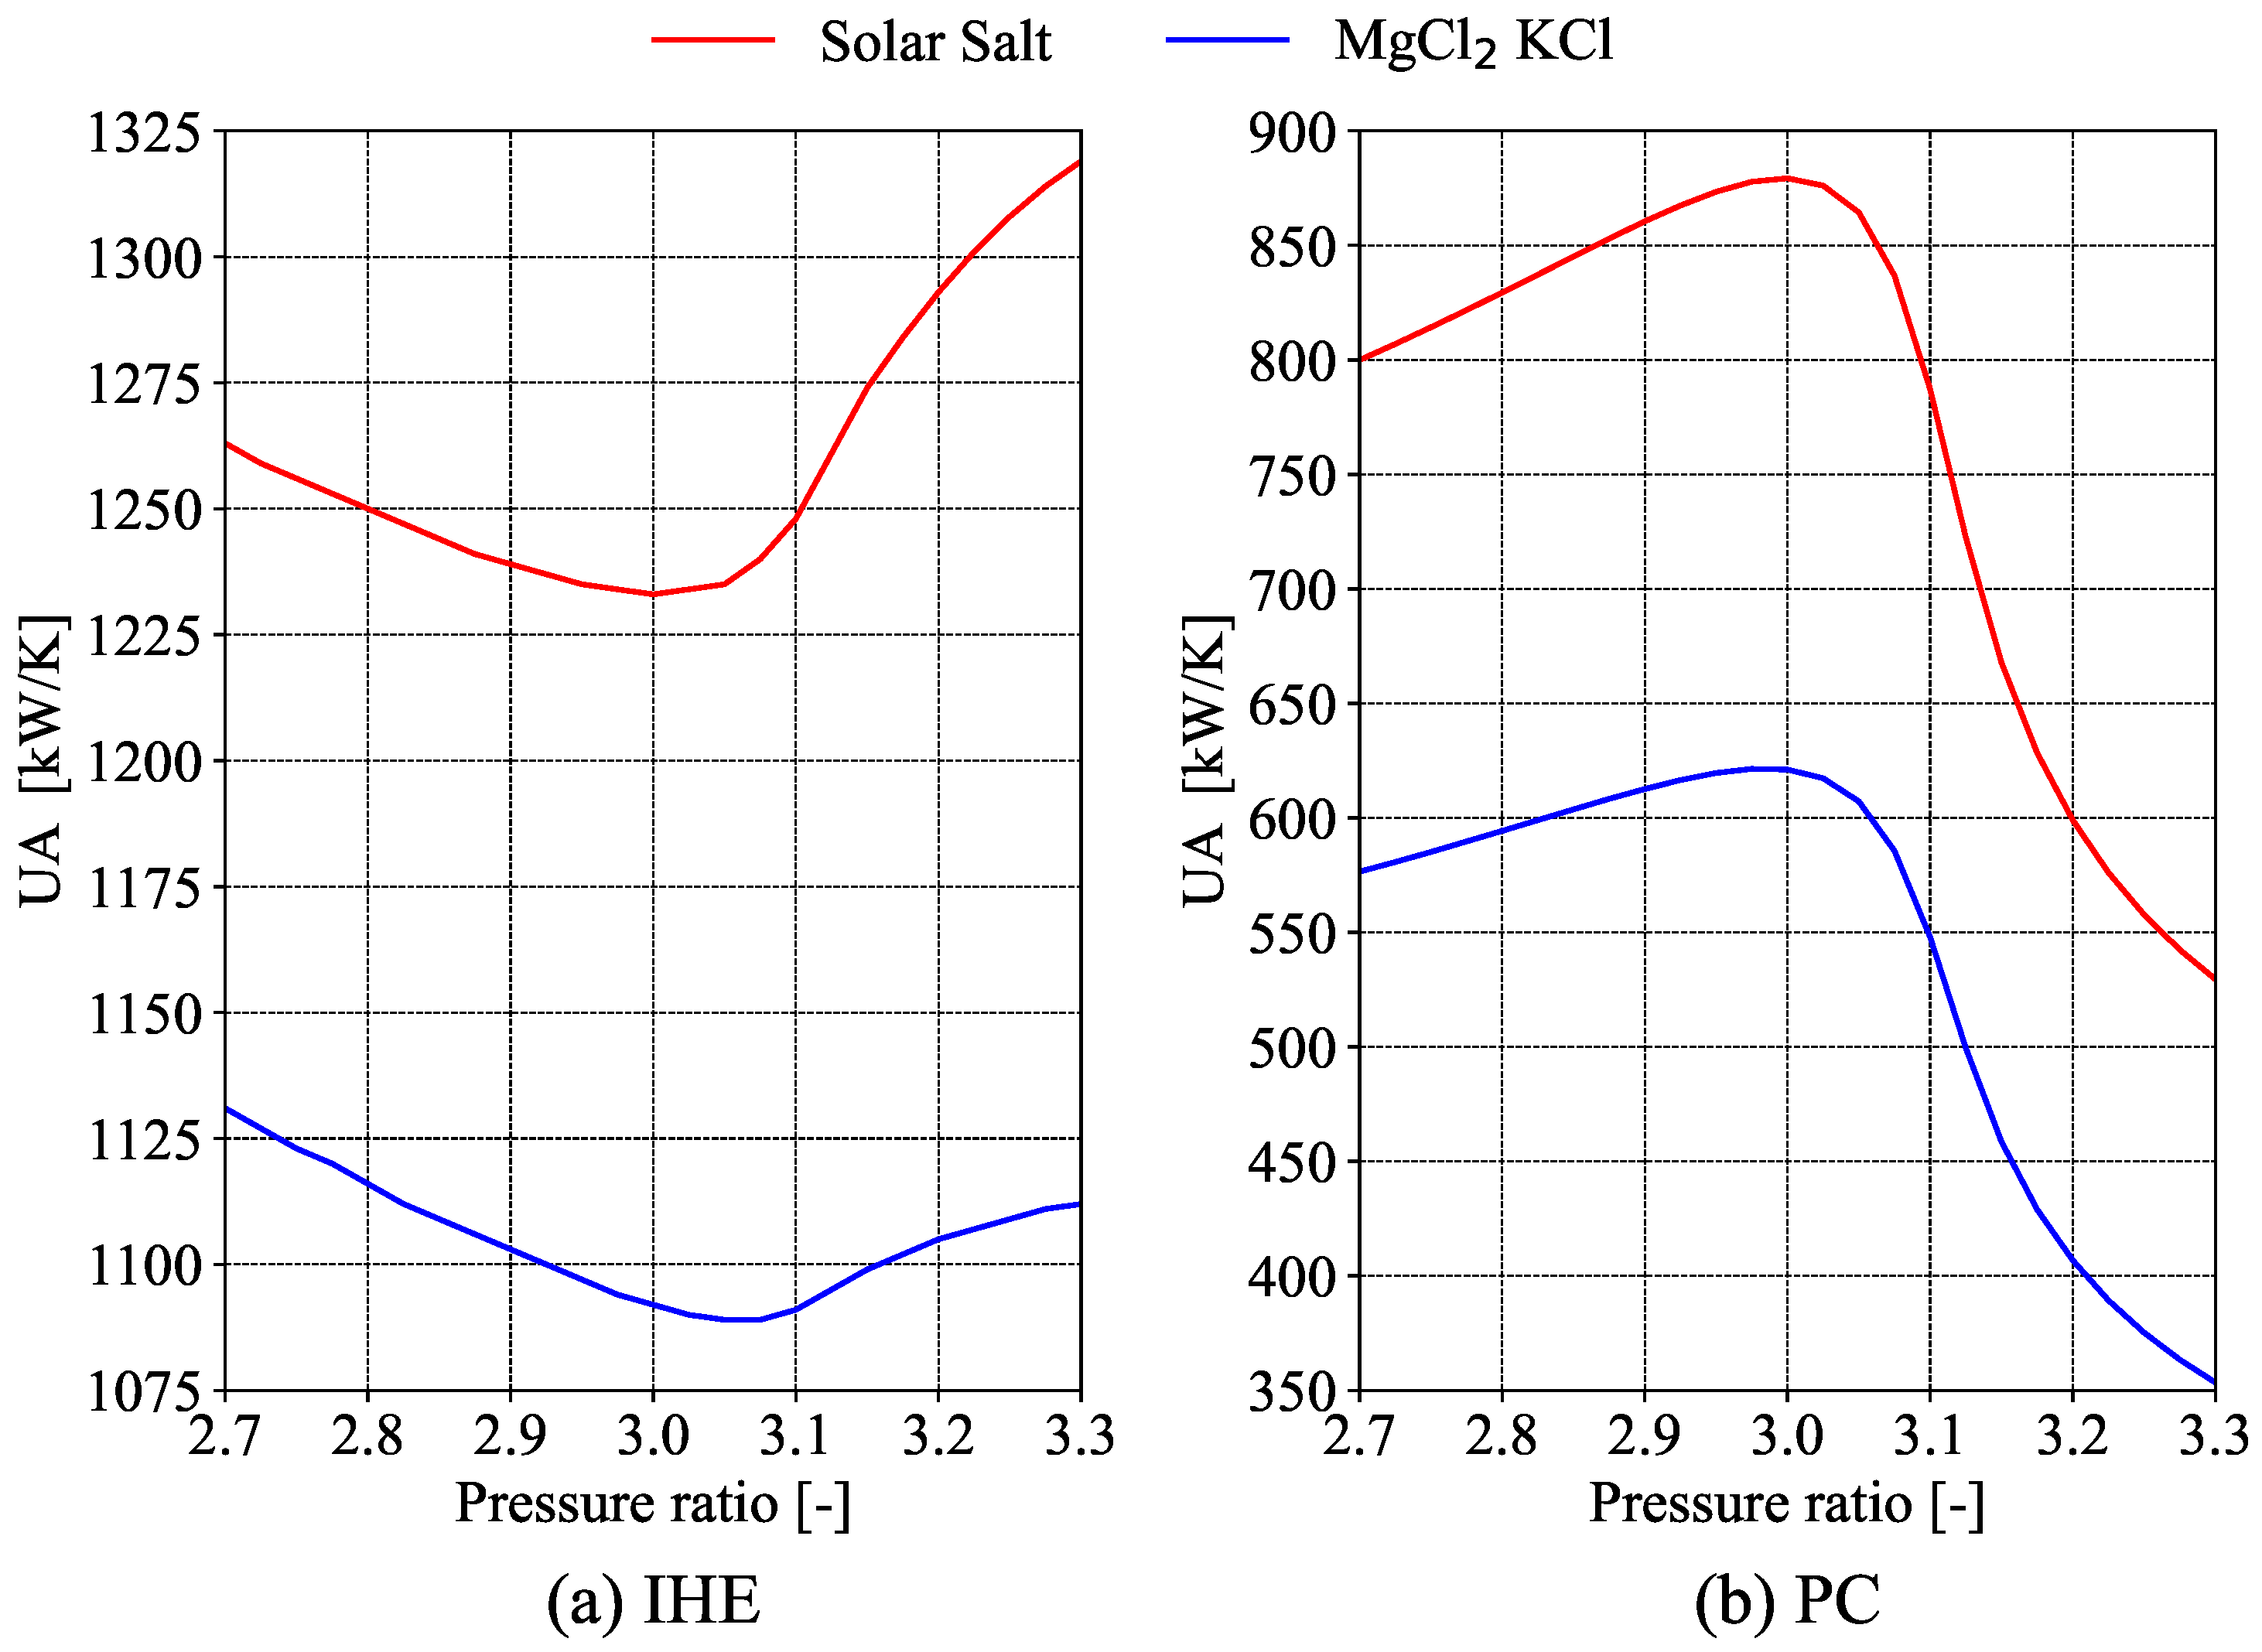
The size of heat exchangers is determined by calculating the U A coefficient, which is related to investment, operating, and maintenance costs [11]. Due to the significant variation in the thermodynamic properties of S-CO2, it is important to divide the heat exchanger into N layers to calculate the U A coefficient accurately. The U A is calculated for the pre-cooler, low-temperature recuperator, high-temperature recuperator, and intermediate heat exchanger.
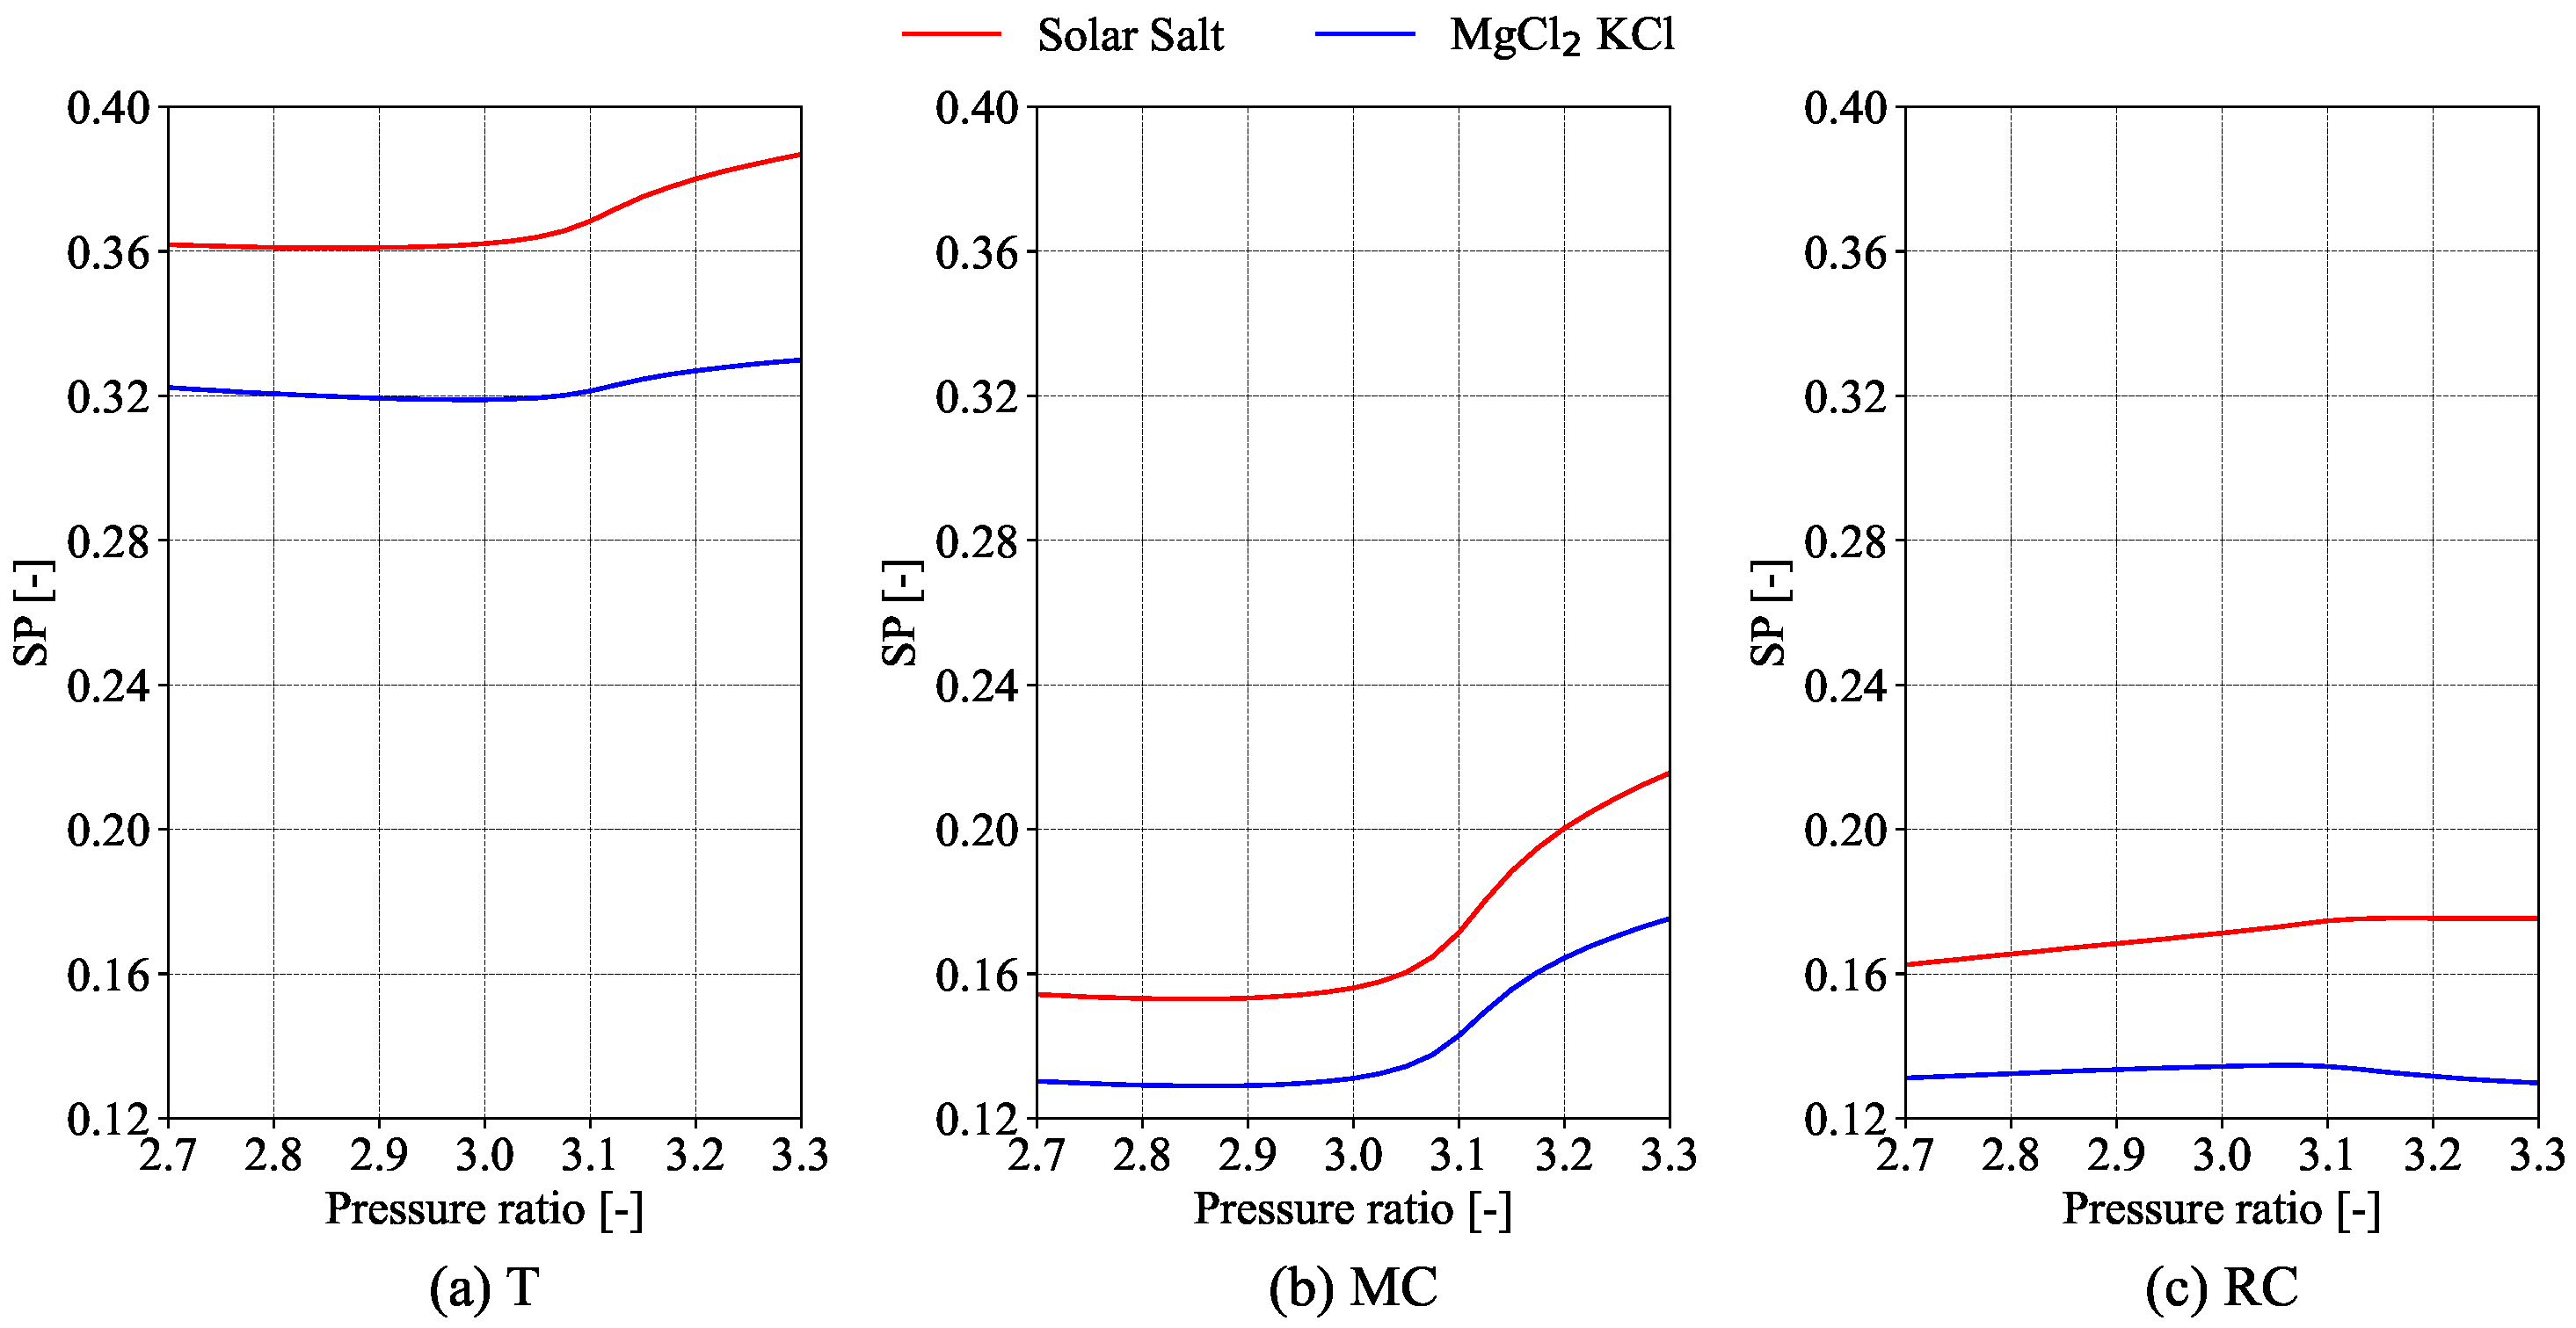
The size parameter ( S P ) is used to estimate the dimensions and associated costs of the turbo components [27]. The equations pertaining to the size parameter for the turbine, main compressor and recompression compressors, respectively, are represented by Equations (12)–(14).
S P T = m ˙ CO 2 v 3 s h 2 h 3 s 4
S P M C = m ˙ CO 2 1 S R v 6 h 7 s h 6 4
S P R C = m ˙ CO 2 S R v 5 h 9 s h 5 4
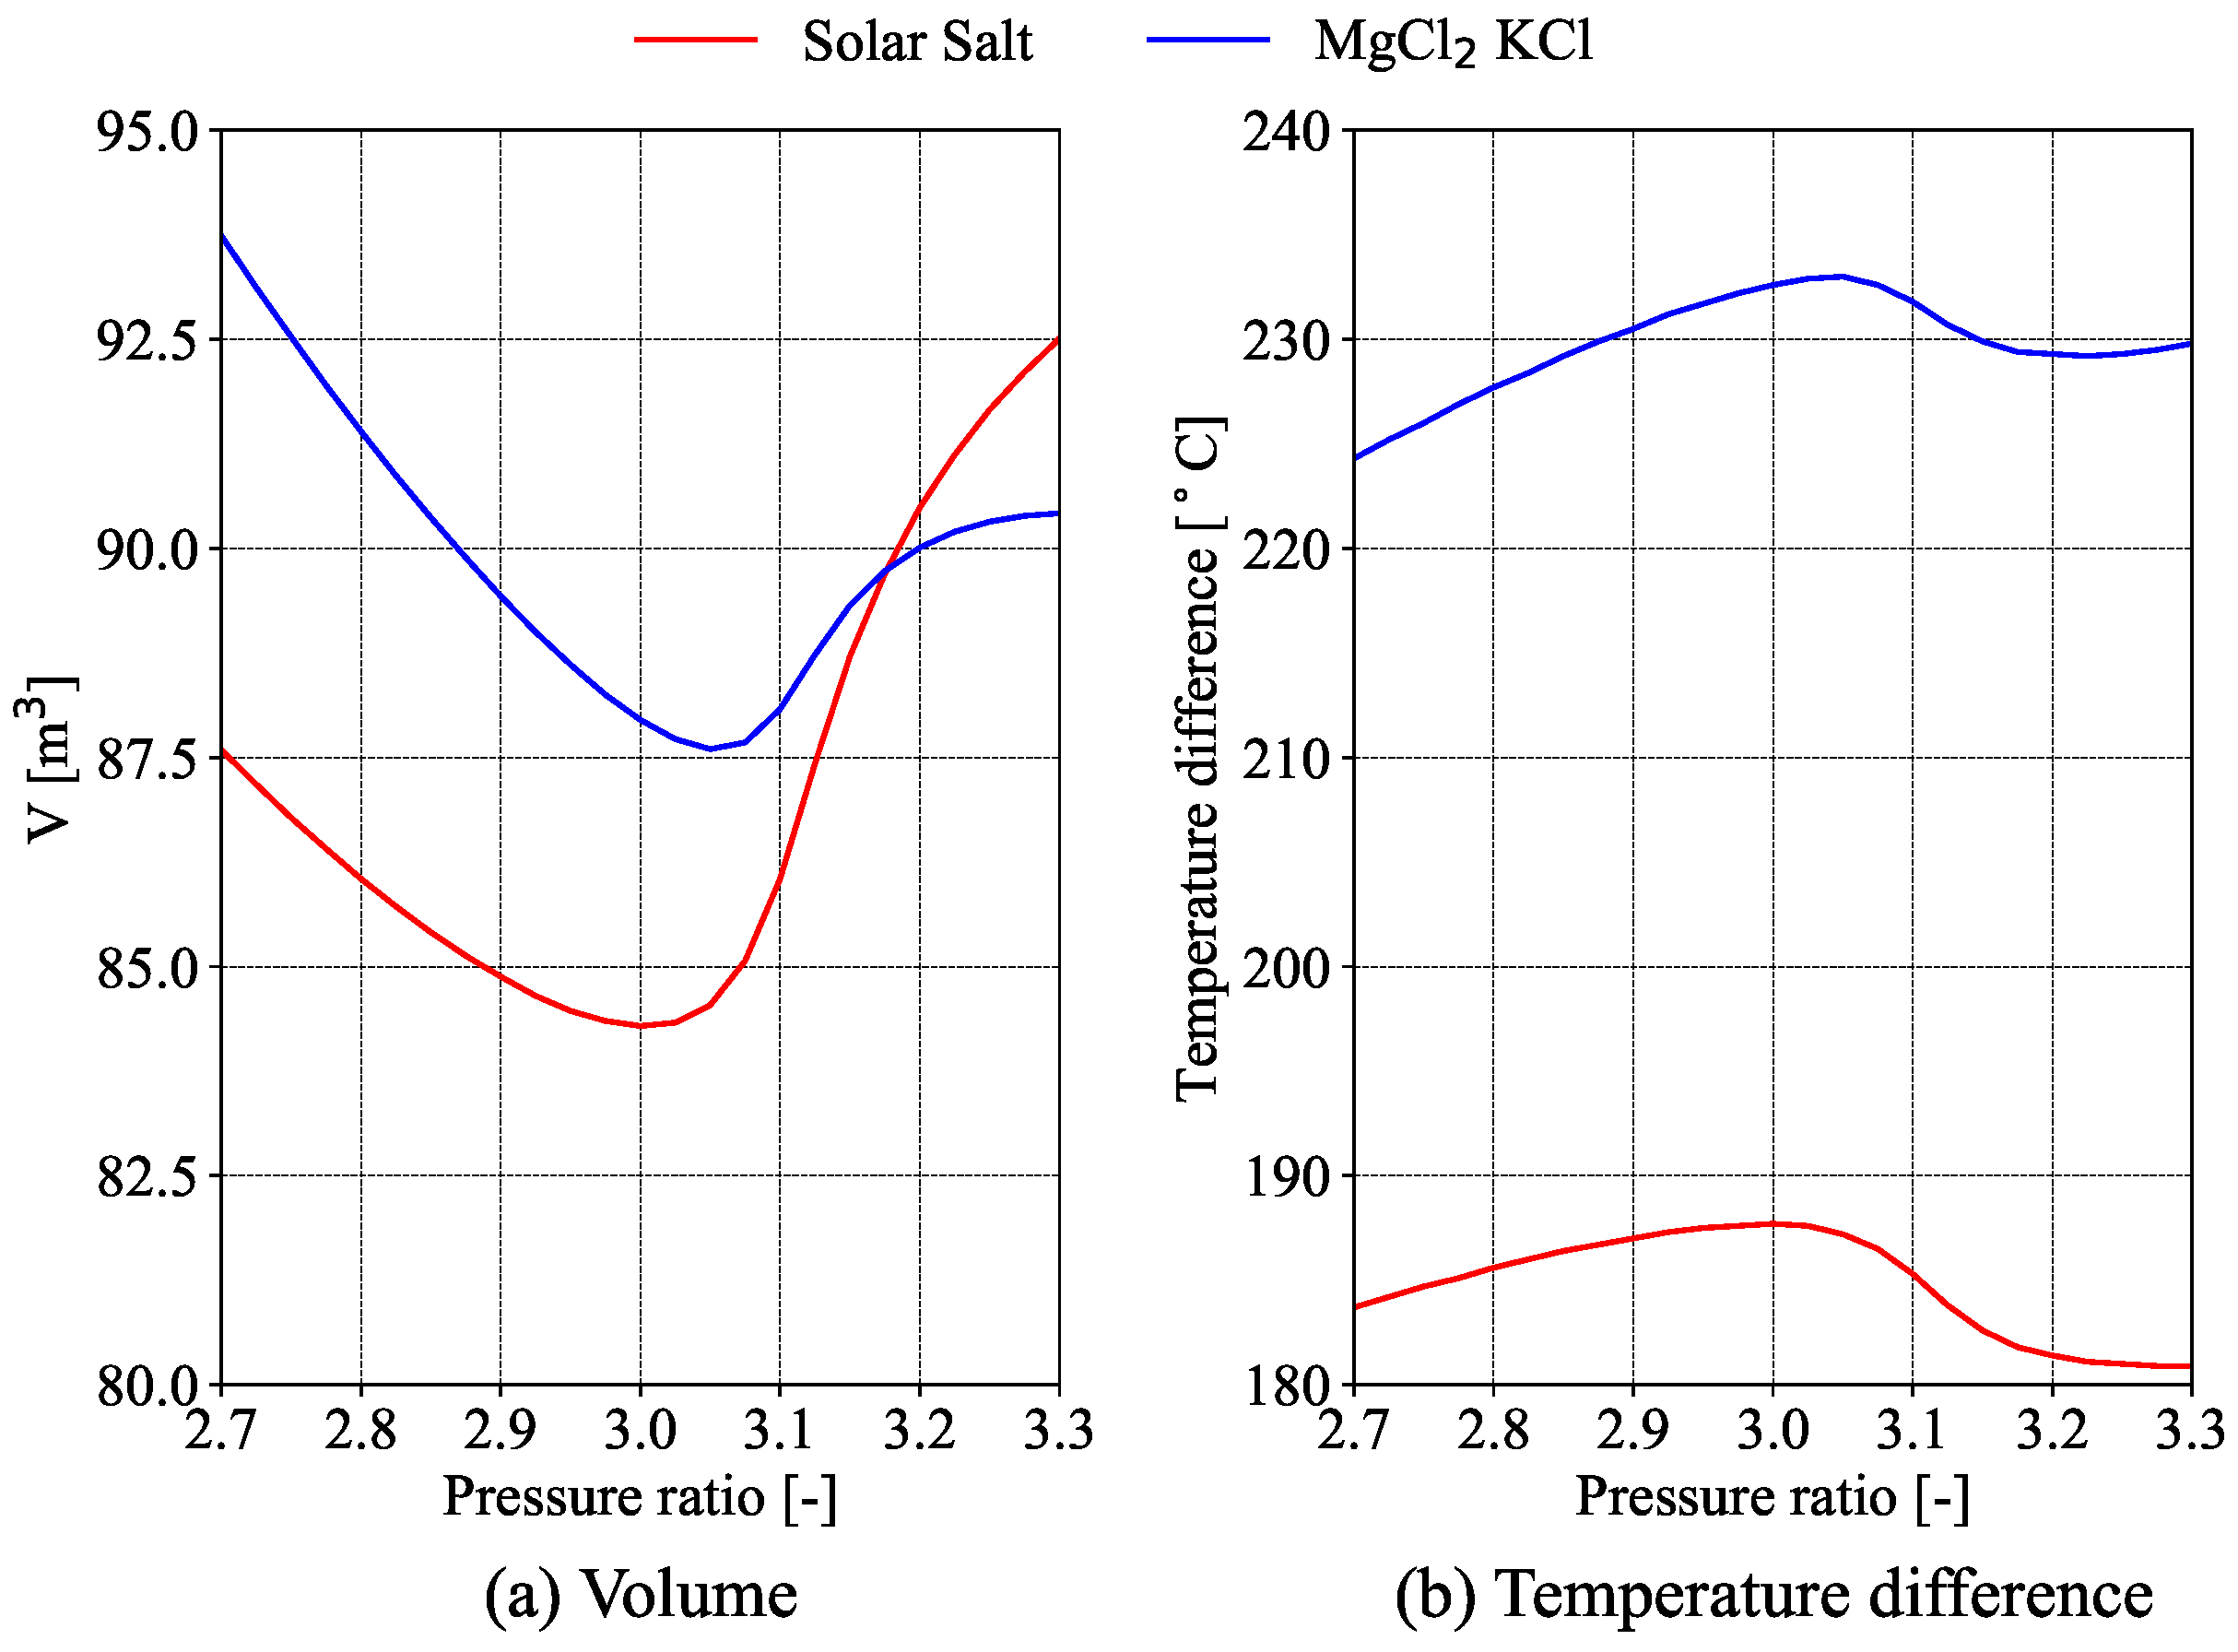
Storage tanks are the main component of the thermal energy storage. The volume of the storage system in the literature [3] is often associated with the temperature difference of the heat transfer fluid (HTF) between the inlet and outlet of the solar receiver. In this study, the volume required to store the thermal energy needed by the power block for one hour is used as a representative parameter for the size of the storage system. This approach will also account for the different densities and the specific heat capacities of both types of molten salts. The volume of the storage tanks required for the cycle to operate at full load for one hour is expressed by Equation (15).
V H T F = m ˙ H T F · 3600 ρ H T F T h o t + ρ H T F T c o l d
where ρ H T F T c o l d is the density of the molten salts at the temperature of the cold tank and ρ H T F T h o t is the density of the molten salts at the temperature of the hot tank. Since it is assumed that the tank’s heat losses are negligible, both temperatures coincide with the inlet and outlet temperatures of the solar receiver.

4. Model Validation

The model presented in this paper for the power block has been validated using data from reference [23]. Table 6 shows a good agreement between the values calculated by the model used in this study and the reference values: higher discrepancy of 0.5% for T m i n = 32 °C, 550 °C and 300 bar, and for the relative discrepancy of 1.34%. The T m a x and T m i n indicate the inlet temperatures of the turbine and main compressor, respectively, while the P m a x is the outlet pressure of the main compressor.

5. Results

In the previous sections, the system and a studied and detailed evaluation model have been described. Based on the explained model, the influence of the pressure ratio in each key parameter will be studied in this section. For each pressure ratio, the split ratio S R will be optimized to achieve the maximum efficiency.

5.1. Energy Analysis

As demonstrated in Figure 2a, the process utilising MgCl2–KCl salts exhibits superior efficiency in comparison to solar salts under all pressure ratios. For both molten salts, there exists a specific pressure ratio that maximizes the cycle efficiency. The cycle using solar salts achieves a maximum efficiency of 41.63% at a pressure ratio of 3.025, while the cycle operating with chloride molten salts reaches a maximum efficiency of 48.86% at a pressure ratio of 3.075. Consequently, the cycle energy efficiency of MgCl2–KCl salts increased by 17.37% in relative terms and 7.23% in absolute terms. It is evident that this fact necessitates a compressor that exhibits a 1.7% increase in pressure ratio, which can be regarded as negligible in this context.
As can be observed in Figure 2b, the maximum overall efficiency is 23.76% for the MgCl2–KCl and 22.29% for the solar salts. The optimum pressure ratio is the same, which maximizes the cycle efficiency. The observed trends are similar to those observed in the cycle energy efficiency (Figure 2). While chloride salts enhance cycle efficiency significantly, the overall efficiency only increases by 6.6%. The higher operating temperature of the chloride salts increases the convection and radiation losses on the solar receiver. As a result, the solar block efficiency drops from 53.55% (solar salts) to 48.86% losses, which diminishes the advantages of using MgCl2–KCl salts.
Figure 2c shows the influence of pressure ratio on the specific work. The maximum specific work value for solar salts is 92.48 kJ/kg, whereas for MgCl2–KCl salts, the value is 138.9 kJ/kg. Plants operating with MgCl2–KCl salts have demonstrated a significant increase in specific work, improving by 50.19%. Both molten salts achieve their maximum specific work at practically the same pressure ratio that corresponds to maximum efficiency.

5.2. Exergy Analysis

The influence of the pressure ratio on the overall exergy efficiency and the total exergy destruction is observed in Figure 3. The cycle operating with MgCl2–KCl salts presents higher exergy efficiency compared to solar salts across all pressure ratios (Figure 3a). The maximum overall exergy efficiency achieved is 23.96% for solar salts and 25.54% for MgCl2–KCl salts. As a result, the use of chloride salts improves the maximum overall exergy efficiency by 6.6%. The pressure ratio that maximizes the overall exergy efficiency aligns with the ratio that optimizes the system from an energy perspective. This pressure ratio also minimizes the exergy destruction (Figure 3b). The minimum exergy destruction is 31.48 MW for the solar salts and 28.94 MW for the MgCl2–KCl salts. The exergy destruction is reduced by 8.78% when working with chloride salts. Table 7 summarizes the exergy destructions of each component at the pressure ratio which minimizes the total exergy destruction. For both molten salts, the component with the highest exergy destruction is the solar system, with approximately 87% of the total exergy destruction. In the components of the power cycle, the highest exergy destruction occurs in the precooler for the system using solar salts, with 3.02%. For the system that utilizes MgCl2–KCl salts, the highest exergy destruction is found in the low-temperature recuperator, with 3.59%. As can be observed, the use of chloride salts increased the exergy destruction in the high and low-temperature recuperator. Exergy destruction in the mixing process is practically negligible.
Figure 4 shows the influence of the pressure ratio on the exergy destruction of the solar block. As can be observed, the optimum ratio that minimizes this exergy destruction is the same that maximizes overall exergy destruction efficiency.
Figure 5 illustrates the impact of the pressure ratio on exergy destruction for both high and low-temperature recuperators. The exergy destruction in both recuperators shows a similar trend with the two molten salts, decreasing as the pressure ratio increases. Notably, exergy destruction is higher for the chloride salts. For these salts, the minimum exergy destruction is 0.64 MW for the high-temperature recuperator and 0.86 MW for the low-temperature recuperator. In contrast, for the solar salts, the minimum exergy destruction is 0.34 MW for the high-temperature recuperator and 0.74 MW for the low-temperature recuperator. Consequently, the utilisation of MgCl2–KCl in the cycle results in an augmentation in minimum exergy destruction of 88.23% and 16.21% for the high and low-temperature recuperators, respectively.
Figure 6 shows the energy destruction occurring in the intermediate heat exchanger (IHE) and the precooler (PC) at different pressure ratios. In both heat exchangers, the exergetic destruction is higher when the cycle operates using solar salts. For the IHE, the impact of the pressure ratio on exergy destruction is minimal. The lowest exergy destruction of 0.12 MW occurs at a pressure ratio of 3.075 when using MgCl2–KCl salts. For solar salts, the minimum exergy destruction on the precooler is 0.26 MW at a pressure ratio of 3.125. In contrast, the effect of the pressure ratio on the exergy destruction of the precooler is significant. The cycle utilizing MgCl2–KCl salts achieves the lowest exergy destruction of 0.76 MW at a pressure ratio of 2.9. In comparison, the minimum exergy destruction for the cases using solar salts is 0.90 MW at a pressure ratio of 2.9. The use of the MgCl2–KCl salts reduces the exergy destruction on the IHE and precooler by 46.15% and 26.7%, respectively.
As illustrated in Figure 7, the exergy destruction in the turbine and compressor grows with the higher pressure ratio in the case of solar salts. In the case of the recompression compressor (Figure 7c), the exergy destruction achieves a maximum at an intermediate pressure ratio higher in solar salts. For the MgCl2–KCl salts, the minimum exergy destruction on the turbine, main and recompression is 0.48 MW, 0.18 MW and 0.16 MW , respectively, at the minimum pressure ratio. In the case of solar salts, the minimum exergy destruction on the turbine, main compressor and recompression compressor are 0.69 MW, 0.25 MW and 0.25 MW, respectively, at the minimum pressure ratio. Consequently, the chloride molten salts reduce exergy destruction in the turbine, main compressor, and recompression compressor by 57%, 28%, and 36%, respectively.

5.3. Sizing Analysis

Figure 8 shows the effect of the pressure ratio on the U A of high and low-temperature recuperators. Solar salts present a higher U A value for both recuperators. For the MgCl2–KCl salts, the minimum U A for the high-temperature recuperator (HTR) is 400.1 kW/K at a pressure ratio of 3.025. The minimum U A for solar salts is 499.1 kW/K at a pressure ratio of 3. For the low-temperature recuperator (LTR), the minimum U A for chloride salts is 404 kW / K at a pressure ratio of 3.075, while for solar salts, it reaches a minimum of 650.7 kW/K at a pressure ratio of 3.1. The results indicate that the system operating with MgCl2–KCl salts reduces U A for both the HTR and LTR by 19.83% and 37.81%, respectively.
Figure 9 shows the U A for the intermediate heat exchanger (IHE) and the precooler (PC) at different pressure ratios. Chloride salts show a lower U A for the intermediate heat exchanger and precooler at all pressure ratios. For MgCl2–KCl salts, the minimum U A for the IHE is 1089 kW/K at a pressure ratio of 3.05, while for solar molten salts, this minimum is 1233 kW/K at a pressure ratio of 3. The minimum U A for the precooler is 353.4 kW/K for the chloride salts compared to 529.5 kW/K for solar salts. As a result, the MgCl2–KCl salts decrease the U A for the IHE and precooler by 11.68% and 33.26%, respectively.
Figure 10 illustrates the S P on the turbine, main and recompression compressors at different pressure ratios. For both the turbine and the main compressor (Figure 10a,b), the S P reaches a minimum at an intermediate pressure ratio. For solar salts, the minimum S P for the turbine is 0.3609, occurring at a pressure ratio of 2.85, while for the main compressor, it is 0.1531 at the same pressure ratio. In the case of MgCl2–KCl salts, the minimum S P for the turbine is 0.3189 at a pressure ratio of 2.975, and for the main compressor, it is 0.129 at a pressure ratio of 2.875. In the case of the recompression compressor (Figure 10c), the S P exhibits a maximum at an intermediate pressure ratio. The minimum S P is achieved at the lowest pressure ratio for the solar salts and at the highest pressure ratio for the chloride salts. The minimum S P for the recompression compressor is 0.1625 for solar salts and 0.1298 for chloride salts. Consequently, the cycle utilizing MgCl2–KCl salts improves the S P of the turbine, main compressor, and recompressor by 11.63%, 15.74%, and 20.12%, respectively.
Figure 11a illustrates the storage volume required per hour at various pressure ratios. Although chloride salts exhibit a larger temperature difference, as shown in Figure 11b, the storage volume required is higher for pressure ratios below 3.175. For both types of molten salts, the minimum storage volume is achieved at the pressure ratio that maximizes the temperature difference between the two tanks. In the case of MgCl2–KCl salts, the minimum storage volume is 87.6 m3, corresponding to a temperature difference of 233 K at a pressure ratio of 3.05. Meanwhile, for solar salts, the minimum volume is 84.29 m3, with a temperature difference of 187.7 K at a pressure ratio of 3. Consequently, the utilisation of MgCl2–KCl salts results in an augmentation of the temperature difference by 24.13%, whilst necessitating a storage volume that is 3.28% larger.

6. Conclusions

This paper explores the impact of molten salts, specifically solar salts and MgCl2–KCl, on a solar power tower (SPT) integrated with the S-CO2 recompression Brayton cycle. A simulation model developed in Engineering Equation Solver (EES) is utilised to evaluate the performance of the solar power system with each type of molten salt. A sensitivity analysis is conducted to assess how the pressure ratio influences various key parameters. Finally, the results regarding the pressure ratio that optimizes efficiency are analyzed. The main conclusions of the study are as follows:
  • It has been demonstrated that the power cycle performance is significantly enhanced when MgCl2–KCl salts are utilised as the heat transfer fluid. However, this enhancement is accompanied by a reduction in the efficiency of the solar receiver, attributable to its operation at higher temperatures. This, in turn, has a detrimental effect on the overall efficiency of the system.
  • The utilisation of chloride salts has been demonstrated to enhance both overall exergy efficiency and the rate of exergy destruction.
  • The major irreversibilities occur in the solar system for both types of molten salts. In the power cycle components, the greatest exergy destruction occurs in the precooler for solar salts and the low-temperature recuperator for MgCl2–KCl salts, respectively.
  • The utilisation of molten salt solutions, such as MgCl2–KCl, has been found to mitigate exergy dissipation in various components, with the notable exceptions of high and low-temperature recuperators.
  • It is evident that an increased storage volume is necessitated in the case of chloride salts, despite the greater temperature difference. The MgCl2–KCl compound has been observed to result in a reduction in the size of the other components.
  • Consequently, MgCl2–KCl salts enhance the efficiency of the system, notwithstanding the augmented storage capacity necessitated.
The present study makes the assumption that the pressure drop occurring within heat exchangers and the solar block is negligible. It is recommended that future research efforts concentrate on the enhancement of models of the solar receiver and heat exchangers, with a view to giving due consideration to the effects of this pressure drop and undertaking a comprehensive analysis of its impact on performance and dimensions.

Author Contributions

Conceptualization, J.T.-L. and J.R.-M.; Data curation, P.T.-E. and R.V.-C.; Formal analysis, J.M.-A.; Investigation, J.T.-L., J.R.-M. and J.M.-A.; Methodology, J.R.-M.; Resources, J.M.-A.; Software, J.T.-L. and J.R.-M.; Supervision, J.R.-M.; Validation, P.T.-E. and R.V.-C.; Visualization, P.T.-E. and R.V.-C.; Writing—original draft, J.R.-M.; Writing—review and editing, J.T.-L., J.R.-M. and J.M.-A. The authors read and approved the manuscript. All authors have read and agreed to the published version of the manuscript.

Funding

This research received no external funding.

Institutional Review Board Statement

Not applicable.

Informed Consent Statement

Not applicable.

Data Availability Statement

The raw data supporting the conclusions of this article will be made available by the authors on request.

Conflicts of Interest

The authors declare no conflicts of interest.

Nomenclature

  • Abbreviations
CSPConcentrated Solar Power
HTFHeat Transfer Fluid
HTRHigh-temperature recuperator
IHEIntermediate heat exchanger
LTRLow-temperature recuperator
MMixer
MCMain compressor
PCPrecooler
RCRecompression compressor
SAMSystema Advisor Model
S-CO2Supercirtical carbon doixide
SRSplit ratio
TTurbine
  • Symbols
C    Concentraion ratio [-]
D N I     Direct normal irradiance [W/m2]
F    View factor [-]
E ˙ x     Exergy power [kW]
h    Specific enthalpy [kJ/kg]
h c o n     Receiver heat transfer coefficient [W/m2· K]
m ˙     Mass flow rate [kg/s]
s    Specific entropy [kJ/kg·K]
v    Specific volume [m3/kg]
S P     Size parameter
T R     Receiver surface temperature [K]
T s k y     Sky temperature [K]
T 0     Ambient temperature [K]
U A     Heat transfer coeficient [W/K]
V    Volume [m3]
v    Specific volume [m3/kg]
w    Specific work [kJ/kg]
W ˙     Electric power [kW]
  • Greek symbols
α      Receiver absorptivity [-]
ε      Recuperator efectiveness [-]
ϵ r e c      Receiver emissivity [-]
η      Energy efficiency [-]
η h e l      Heliostat field efficiency [-]
ψ      Exergy efficiency [-]
r h o      Density [kg/m3]
σ      Stefan-Boltzmann constant [W· m-2 · K-4]

References

  1. Polimeni, S.; Binotti, M.; Moretti, L.; Manzolini, G. Comparison of sodium and KCl-MgCl2 as heat transfer fluids in CSP solar tower with sCO2 power cycles. Sol. Energy 2018, 162, 510–524. [Google Scholar] [CrossRef]
  2. Qiu, Y.; E, E.; Li, Q. Triple-Objective Optimization of SCO2 Brayton Cycles for Next-Generation Solar Power Tower. Energies 2023, 16, 5316. [Google Scholar] [CrossRef]
  3. Ravi Kumar, K.; Krishna Chaitanya, N.V.V. Towards sustainable energy—Exploring the supercritical carbon dioxide (S-CO2) Brayton cycle for various applications: A critical review. Int. J. Ambient. Energy 2024, 45, 2378046. [Google Scholar] [CrossRef]
  4. Wang, K.; He, Y.L.; Zhu, H.H. Integration between supercritical CO2 Brayton cycles and molten salt solar power towers: A review and a comprehensive comparison of different cycle layouts. Appl. Energy 2017, 195, 819–836. [Google Scholar] [CrossRef]
  5. Villada, C.; Ding, W.; Bonk, A.; Bauer, T. Engineering molten MgCl2–KCl–NaCl salt for high-temperature thermal energy storage: Review on salt properties and corrosion control strategies. Sol. Energy Mater. Sol. Cells 2021, 232, 111344. [Google Scholar] [CrossRef]
  6. Wang, K.; Li, M.J.; Zhang, Z.D.; Min, C.H.; Li, P. Evaluation of alternative eutectic salt as heat transfer fluid for solar power tower coupling a supercritical CO2 Brayton cycle from the viewpoint of system-level analysis. J. Clean. Prod. 2021, 279, 123472. [Google Scholar] [CrossRef]
  7. Mahboob, K.; Khan, A.A.; Khan, M.A.; Sarwar, J.; Khan, T.A. Comparison of Li2CO3-Na2CO3-K2CO3, KCl-MgCl2 and NaNO3-KNO3 as heat transfer fluid for different sCO2 and steam power cycles in CSP tower plant under different DNI conditions. Adv. Mech. Eng. 2021, 13, 16878140211011900. [Google Scholar] [CrossRef]
  8. Agyekum, E.B.; Adebayo, T.S.; Bekun, F.V.; Kumar, N.M.; Panjwani, M.K. Effect of two different heat transfer fluids on the performance of solar tower CSP by comparing recompression supercritical CO2 and rankine power cycles, China. Energies 2021, 14, 3426. [Google Scholar] [CrossRef]
  9. National Renewable Energy Laboratory. System Advisor Model. Available online: https://sam.nrel.gov/ (accessed on 3 February 2025).
  10. Penkuhn, M.; Tsatsaronis, G. Systematic evaluation of efficiency improvement options for sCO2 Brayton cycles. Energy 2020, 210, 118476. [Google Scholar] [CrossRef]
  11. Salim, M.S.; Saeed, M.; Kim, M.H. Performance analysis of the supercritical carbon dioxide re-compression Brayton cycle. Appl. Sci. 2020, 10, 1129. [Google Scholar] [CrossRef]
  12. Guo, J.Q.; Li, M.J.; He, Y.L.; Jiang, T.; Ma, T.; Xu, J.L.; Cao, F. A systematic review of supercritical carbon dioxide (S-CO2) power cycle for energy industries: Technologies, key issues, and potential prospects. Energy Convers. Manag. 2022, 258, 115437. [Google Scholar] [CrossRef]
  13. Turchi, C.S.; Vidal, J.; Bauer, M. Molten salt power towers operating at 600–650 °C: Salt selection and cost benefits. Sol. Energy 2018, 164, 38–46. [Google Scholar] [CrossRef]
  14. Yang, J.; Yang, Z.; Duan, Y. A review on integrated design and off-design operation of solar power tower system with S–CO2 Brayton cycle. Energy 2022, 246, 123348. [Google Scholar] [CrossRef]
  15. Klein, S.A. Engineering Equation Solver (EES); Academic Professional Version; F-Chart Software: Middleton, WI, USA, 2013. [Google Scholar]
  16. Pacheco, J.E.; Ralph, M.E.; Chavez, J.M.; Dunkin, S.R.; Rush, E.E.; Ghanbari, C.M.; Matthews, M.W. Results of Molten Salt Panel and Component Experiments for Solar Central Receivers: Cold Fill, Freeze/Thaw, Thermal Cycling and Shock, and Instrumentation Tests (No. SAND-94-2525); Sandia National Lab. (SNL-NM): Albuquerque, NM, USA, 1995. [Google Scholar] [CrossRef]
  17. Williams, D.F. Assessment of candidate molten salt coolants for the NGNP/NHI heat-transfer loop (No. ORNL/TM-2006/69); Oak Ridge National Lab.(ORNL): Oak Ridge, TN, USA, 2006. [Google Scholar] [CrossRef]
  18. Wang, K.; He, Y.L. Thermodynamic analysis and optimization of a molten salt solar power tower integrated with a recompression supercritical CO2 Brayton cycle based on integrated modeling. Energy Convers. Manag. 2017, 135, 336–350. [Google Scholar] [CrossRef]
  19. González-Portillo, L.F.; Muñoz-Antón, J.; Martínez-Val, J.M. Supercritical carbon dioxide cycles with multi-heating in Concentrating Solar Power plants. Sol. Energy 2020, 207, 144–156. [Google Scholar] [CrossRef]
  20. Sathish, S.; Kumar, P.; Nassar, A. Analysis of a 10 MW recompression supercritical carbon dioxide cycle for tropical climatic conditions. Appl. Therm. Eng. 2021, 186, 116499. [Google Scholar] [CrossRef]
  21. Linares, J.I.; Montes, M.J.; Cantizano, A.; Sánchez, C. A novel supercritical CO2 recompression Brayton power cycle for power tower concentrating solar plants. Appl. Energy 2020, 263, 11464. [Google Scholar] [CrossRef]
  22. Weiland, N.; Thimsen, D. A practical look at assumptions and constraints for steady state modeling of sCO2 Brayton power cycles. In Proceedings of the 5th International Symposium e Supercritical CO2 Power Cycles, San Antonio, TX, USA, 28–31 March 2016. [Google Scholar]
  23. Sarkar, J. Second law analysis of supercritical CO2 recompression Brayton cycle. Energy 2009, 34, 1172–1178. [Google Scholar] [CrossRef]
  24. Swinbank, W.C. Long-wave radiation from clear skies. Q. J. R. Meteorol. Soc. 1963, 90, 488–493. [Google Scholar] [CrossRef]
  25. Tsatsaronis, G. Definitions and nomenclature in exergy analysis and exergoeconomics. Energy 2007, 32, 249–253. [Google Scholar] [CrossRef]
  26. Petela, R. Exergy of undiluted thermal radiation. Sol. Energy 2003, 74, 469–488. [Google Scholar] [CrossRef]
  27. Saeed, M.; Kim, M.H. A newly proposed supercritical carbon dioxide Brayton cycle configuration to enhance energy sources integration capability. Energy 2022, 239, 121868. [Google Scholar] [CrossRef]
Figure 1. Layout of S-CO2 recompression Brayton cycle. The red line indicates the S-CO2, the orange line respresents the molten salts and the blue line is the cooling water.
Applsci 15 03216 g001
Figure 2. Comparison of the cycle energy efficiency, overall energy efficiency and specific work at different pressure ratios.
Applsci 15 03216 g002
Figure 3. Impacts of pressure ratio (PR) on overall exergy efficiency and total exergy destruction.
Applsci 15 03216 g003
Figure 4. Comparison of exergy destruction of the solar block at different pressure ratios.
Applsci 15 03216 g004
Figure 5. Comparisonof exergy destruction in recuperators at different pressure ratios.
Applsci 15 03216 g005
Figure 6. Comparison of exergy destruction in intermediate heat exchanger and precooler at different pressure ratios.
Applsci 15 03216 g006
Figure 7. Comparison of exergy destruction in turbines and compressors at different pressure ratios.
Applsci 15 03216 g007
Figure 8. Comparison of U A for the HTR and LTR at different pressure ratios.
Applsci 15 03216 g008
Figure 9. Comparison of U A for the IHE and PC at different pressure ratios.
Applsci 15 03216 g009
Figure 10. Comparison of S P of the turbine, main compressor and recompressor compressor at different pressure ratios.
Applsci 15 03216 g010
Figure 11. Comparison of storage volume required per hour and temperature difference at different pressure ratios.
Applsci 15 03216 g011
Table 1. Thermophysical properties of the Solar salts and MgCl2–KCl [16,17].
ParameterSolar SaltMgCl2–KCl
Mass Composition60% NaNO362% KCl
40% KNO338% MgCl2
Maximum temperature [°C]565800
Minimum temperature [°C]290495
Melting temperature [°C]220424.4
Density at minimum temperature [kg/m3]19051652
Density at maximum temperature [kg/m3]17251510
Specific heat at average temperature [kJ/kg·K]1.521.56
Table 2. Input parameters assumed for the energy analysis.
ParameterValue
Cooling water inlet temperature25 °C
Cooling water outlet temperature35 °C
Inlet compressor temperature35 °C
Rated power10 MW
Effectiveness recuperator86%
Turbine isentropic efficiency90%
Compressor isentropic efficiency85%
Maximum pressure250 bar
Pressure ratio2.7–3.3
Table 3. Energy balance equations for each component.
ParameterEnergy Balance
Solar system Q ˙ H T F = η S B Q ˙ s = m ˙ H T F h 13 h 14
IHE Q ˙ I H E = m ˙ C O 2 h 2 h 1 = m ˙ H T F h 13 h 14
T W ˙ T = m ˙ C O 2 h 2 h 3
HTR Q ˙ H T R = m ˙ C O 2 h 1 h 10 = m ˙ C O 2 h 3 h 4
LTR Q ˙ L T R = m ˙ C O 2 1 S R h 8 h 7 = m ˙ C O 2 h 4 h 5
RC W ˙ R C = m ˙ C O 2 S R h 5 h 9
MC W ˙ M C = m ˙ C O 2 1 S R h 6 h 7
PC Q ˙ P C = m ˙ C O 2 1 S R h 5 h 6 = m ˙ w h 12 h 11
M m ˙ C O 2 h 10 = m ˙ C O 2 1 S R h 8 + m ˙ C O 2 S R h 9
Table 4. Input parameters assumed for the calculation of the solar to thermal efficiency of the solar block [19].
ParameterValue
Direct Normal Irradiance D N I 950 W/m2
Concentration ratio C1000
Receiver absorptivity α 0.95
Receiver emissivity ϵ r e c 0.85
View factor F1
Heat transfer coefficient h c o n v 5 W/m2· K
Heat transfer coefficient heat transfer coefficient from receiver surface to fluid U10 kW/m2· K
Heliostat field efficiency η h e l 0.6
Table 5. Exergy rate of fuel and product definition for each component.
ComponentFuel ExergyProduct Exergy
Solar system E ˙ x s E ˙ x 13 E ˙ x 14
IHE E ˙ x 13 E ˙ x 14 E ˙ x 2 E ˙ x 1
T E ˙ x 2 E ˙ x 3 W ˙ T
HTR E ˙ x 3 E ˙ x 4 E ˙ x 1 E ˙ x 10
LTR E ˙ x 4 E ˙ x 5 E ˙ x 8 E ˙ x 7
RC W ˙ R C E ˙ x 9 E ˙ x 5
MC W ˙ M C E ˙ x 7 E ˙ x 6
PC E ˙ x 5 E ˙ x 6 E ˙ x 12 E ˙ x 11
M E ˙ x 8 + E ˙ x 9 E ˙ x 10
Table 6. Comparison between the simulation results and the data reported by reference [23].
Parameter η (%)
T min [°] T max [°] P max [bar] PR [-] SR [-]Ref. [23]Present Work
325502002.640.33441.1841.18
325503003.860.35543.3242.74
327502002.650.22346.0746.08
327503003.940.28149.8349.83
505502002.400.18436.7136.70
505503002.800.25438.9338.93
507502002.880.10943.5043.55
507503003.080.17545.2845.28
Table 7. Exergy destruction for each component at minimum total exergy destruction conditions.
ComponentSolar SaltMgCl2–KCl
Solar system27.38 MW25.10 MW
IHE0.26 MW0.12 MW
T0.75 MW0.51 MW
HTR0.69 MW0.93 MW
LTR0.89 MW1.04 MW
RC0.29 MW0.18 MW
MC0.27 MW0.20 MW
PC0.95 MW0.86 MW
M≈0 MW≈0 MW
Disclaimer/Publisher’s Note: The statements, opinions and data contained in all publications are solely those of the individual author(s) and contributor(s) and not of MDPI and/or the editor(s). MDPI and/or the editor(s) disclaim responsibility for any injury to people or property resulting from any ideas, methods, instructions or products referred to in the content.

