
Assessing Community-Level Flood Resilience: Analyzing Functional Interdependencies Among Building Sectors


Abstract
1. Introduction
2. Methodology
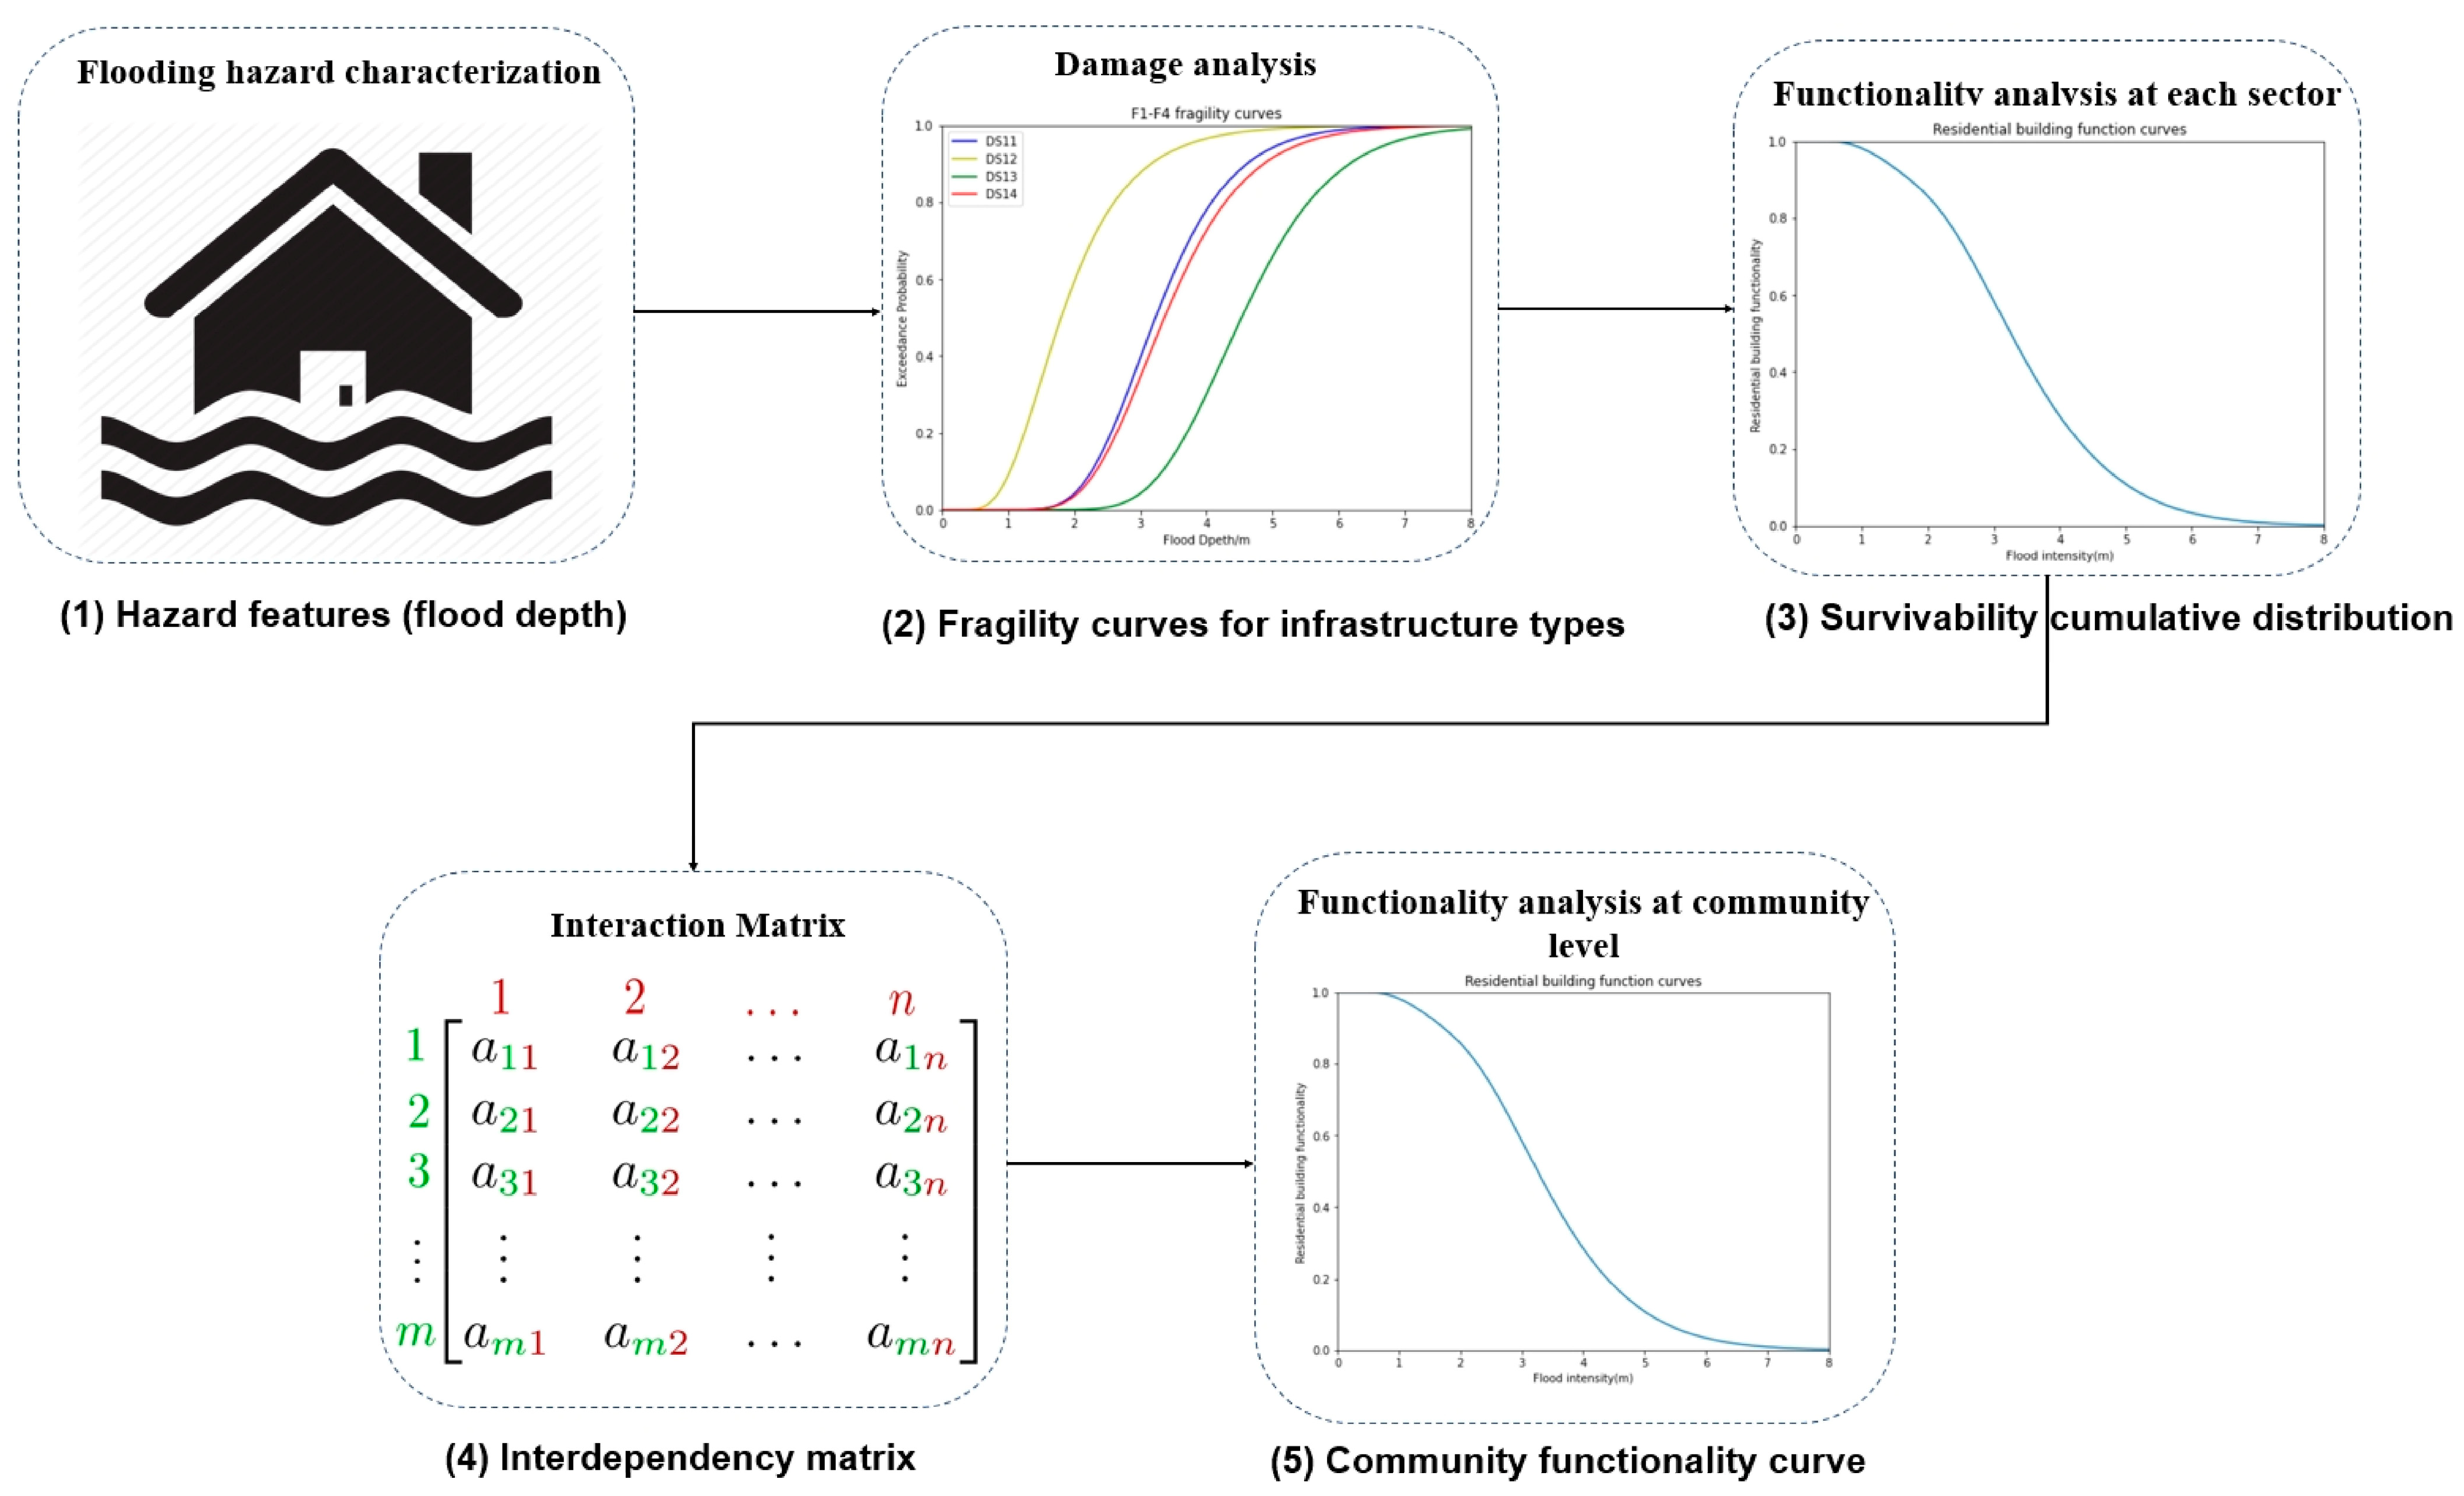
2.1. Overall Procedure
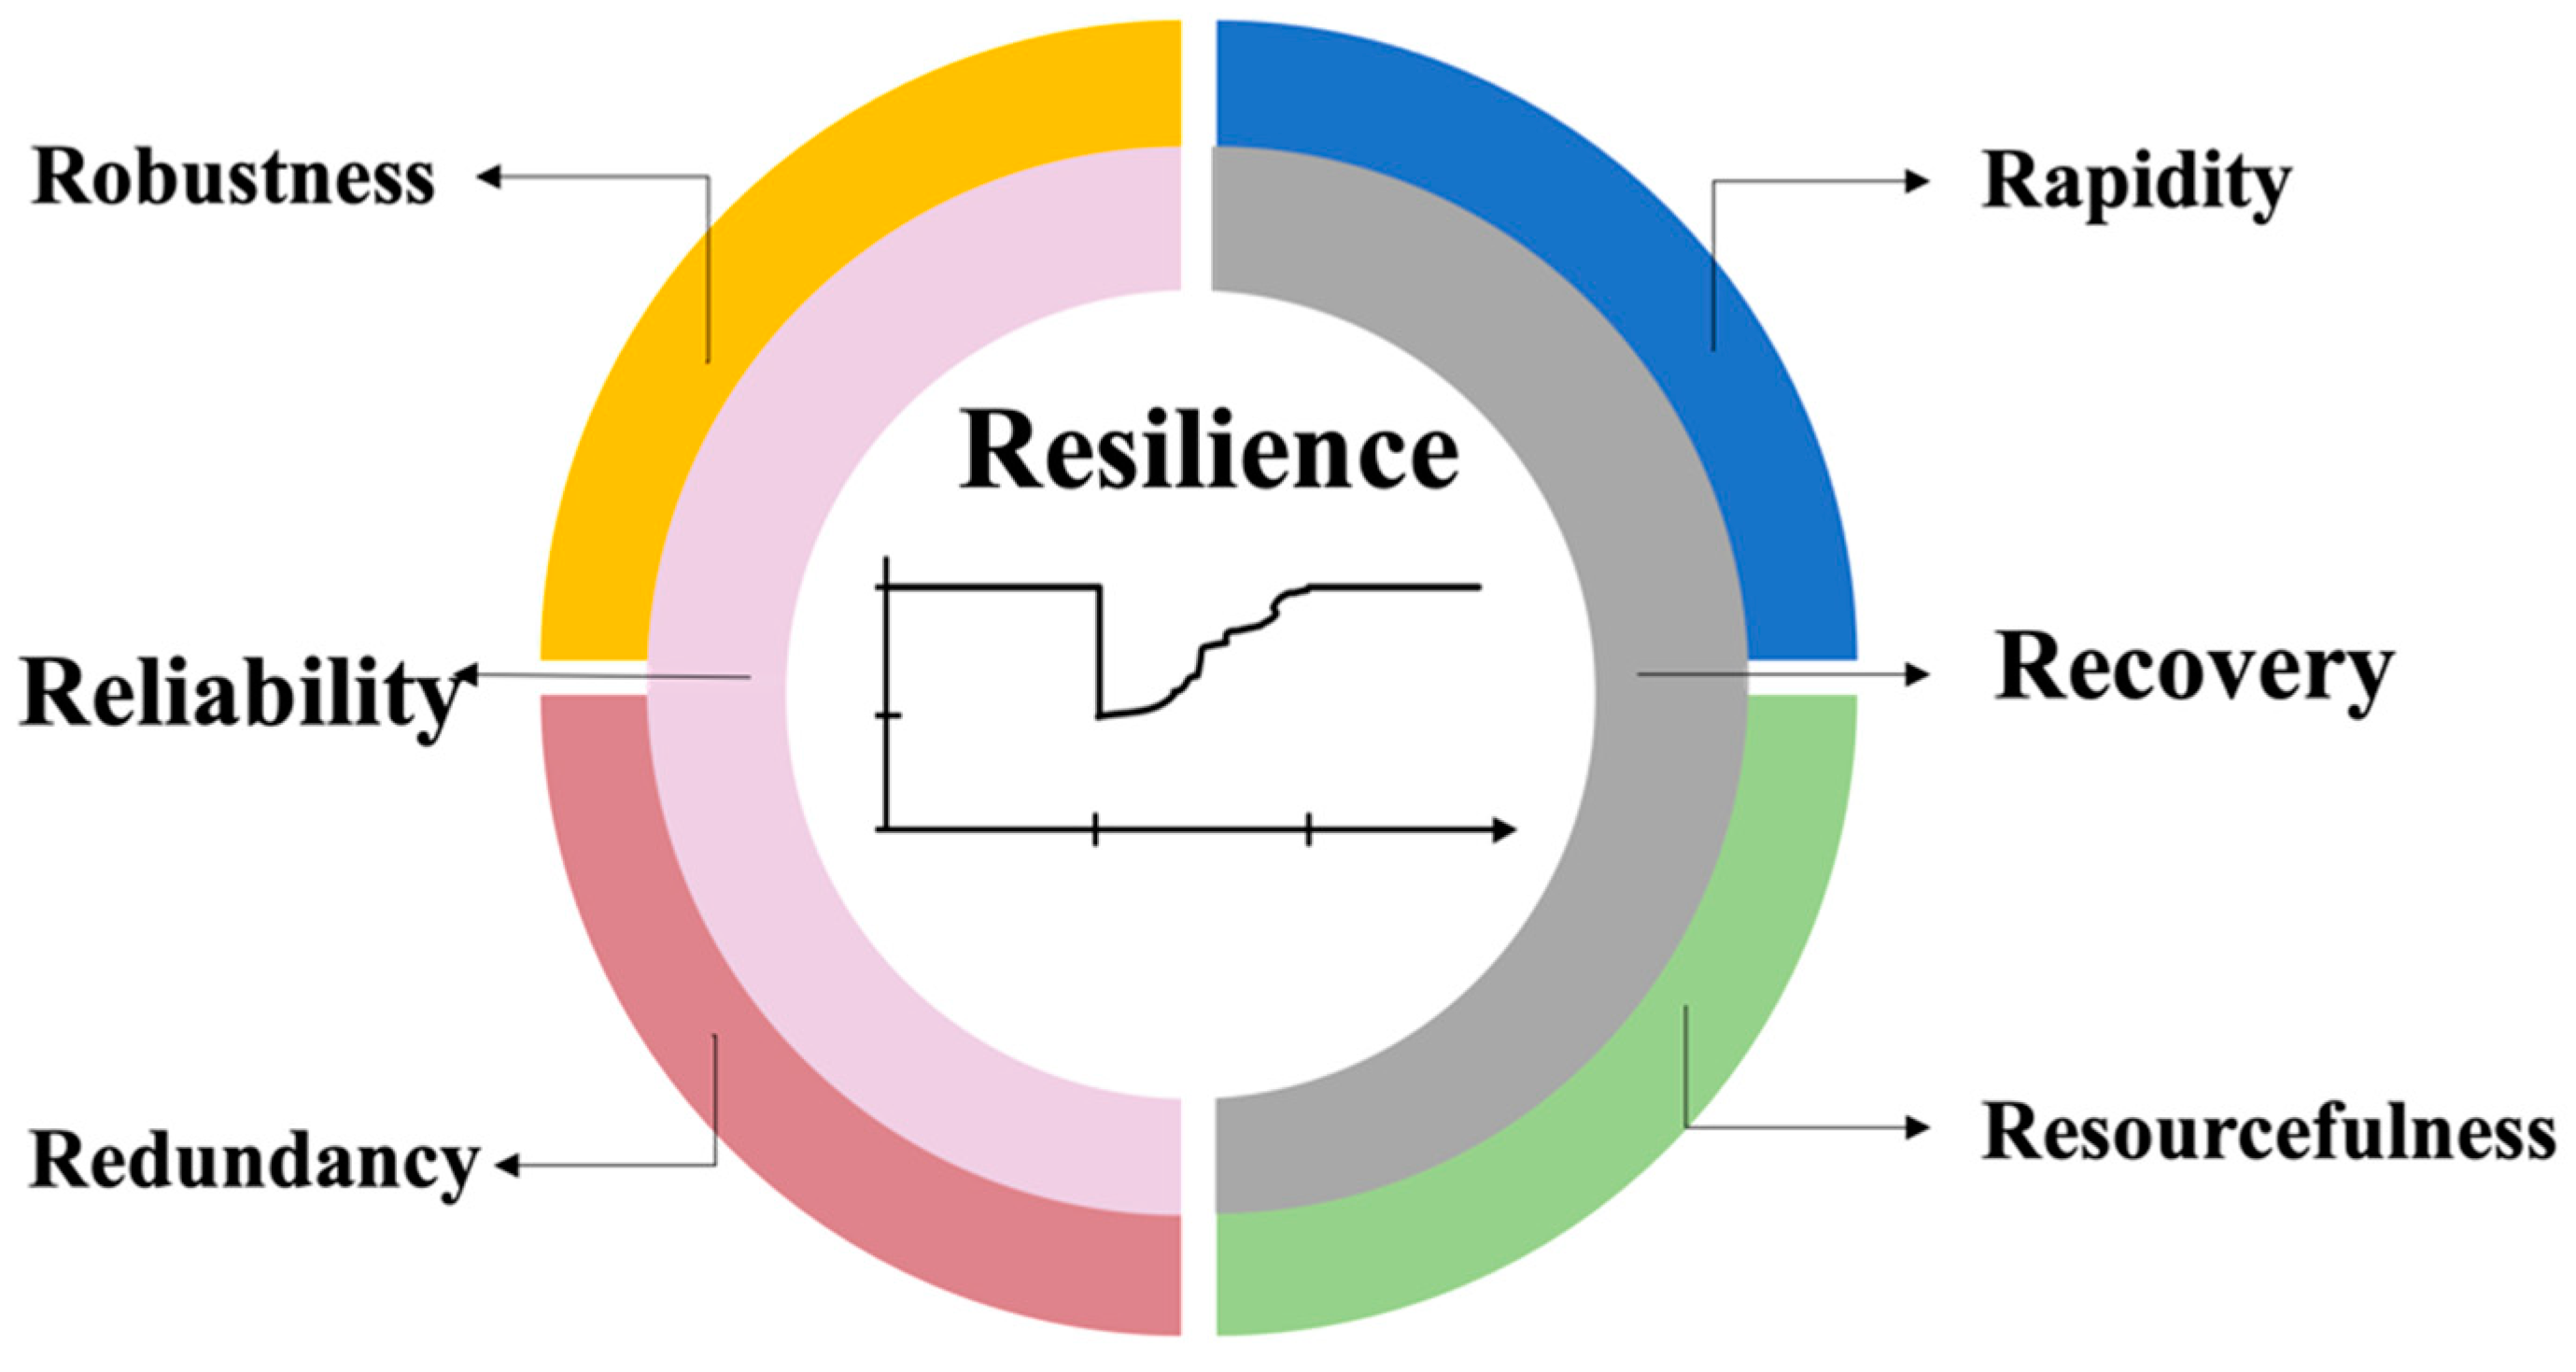
2.2. Quantification of Community-Level Resilience
2.3. Flood Intensity Level and Fragility Curve
2.4. Uncertainty Propagation
2.5. The Functional Interdependencies Among Different Building Sectors
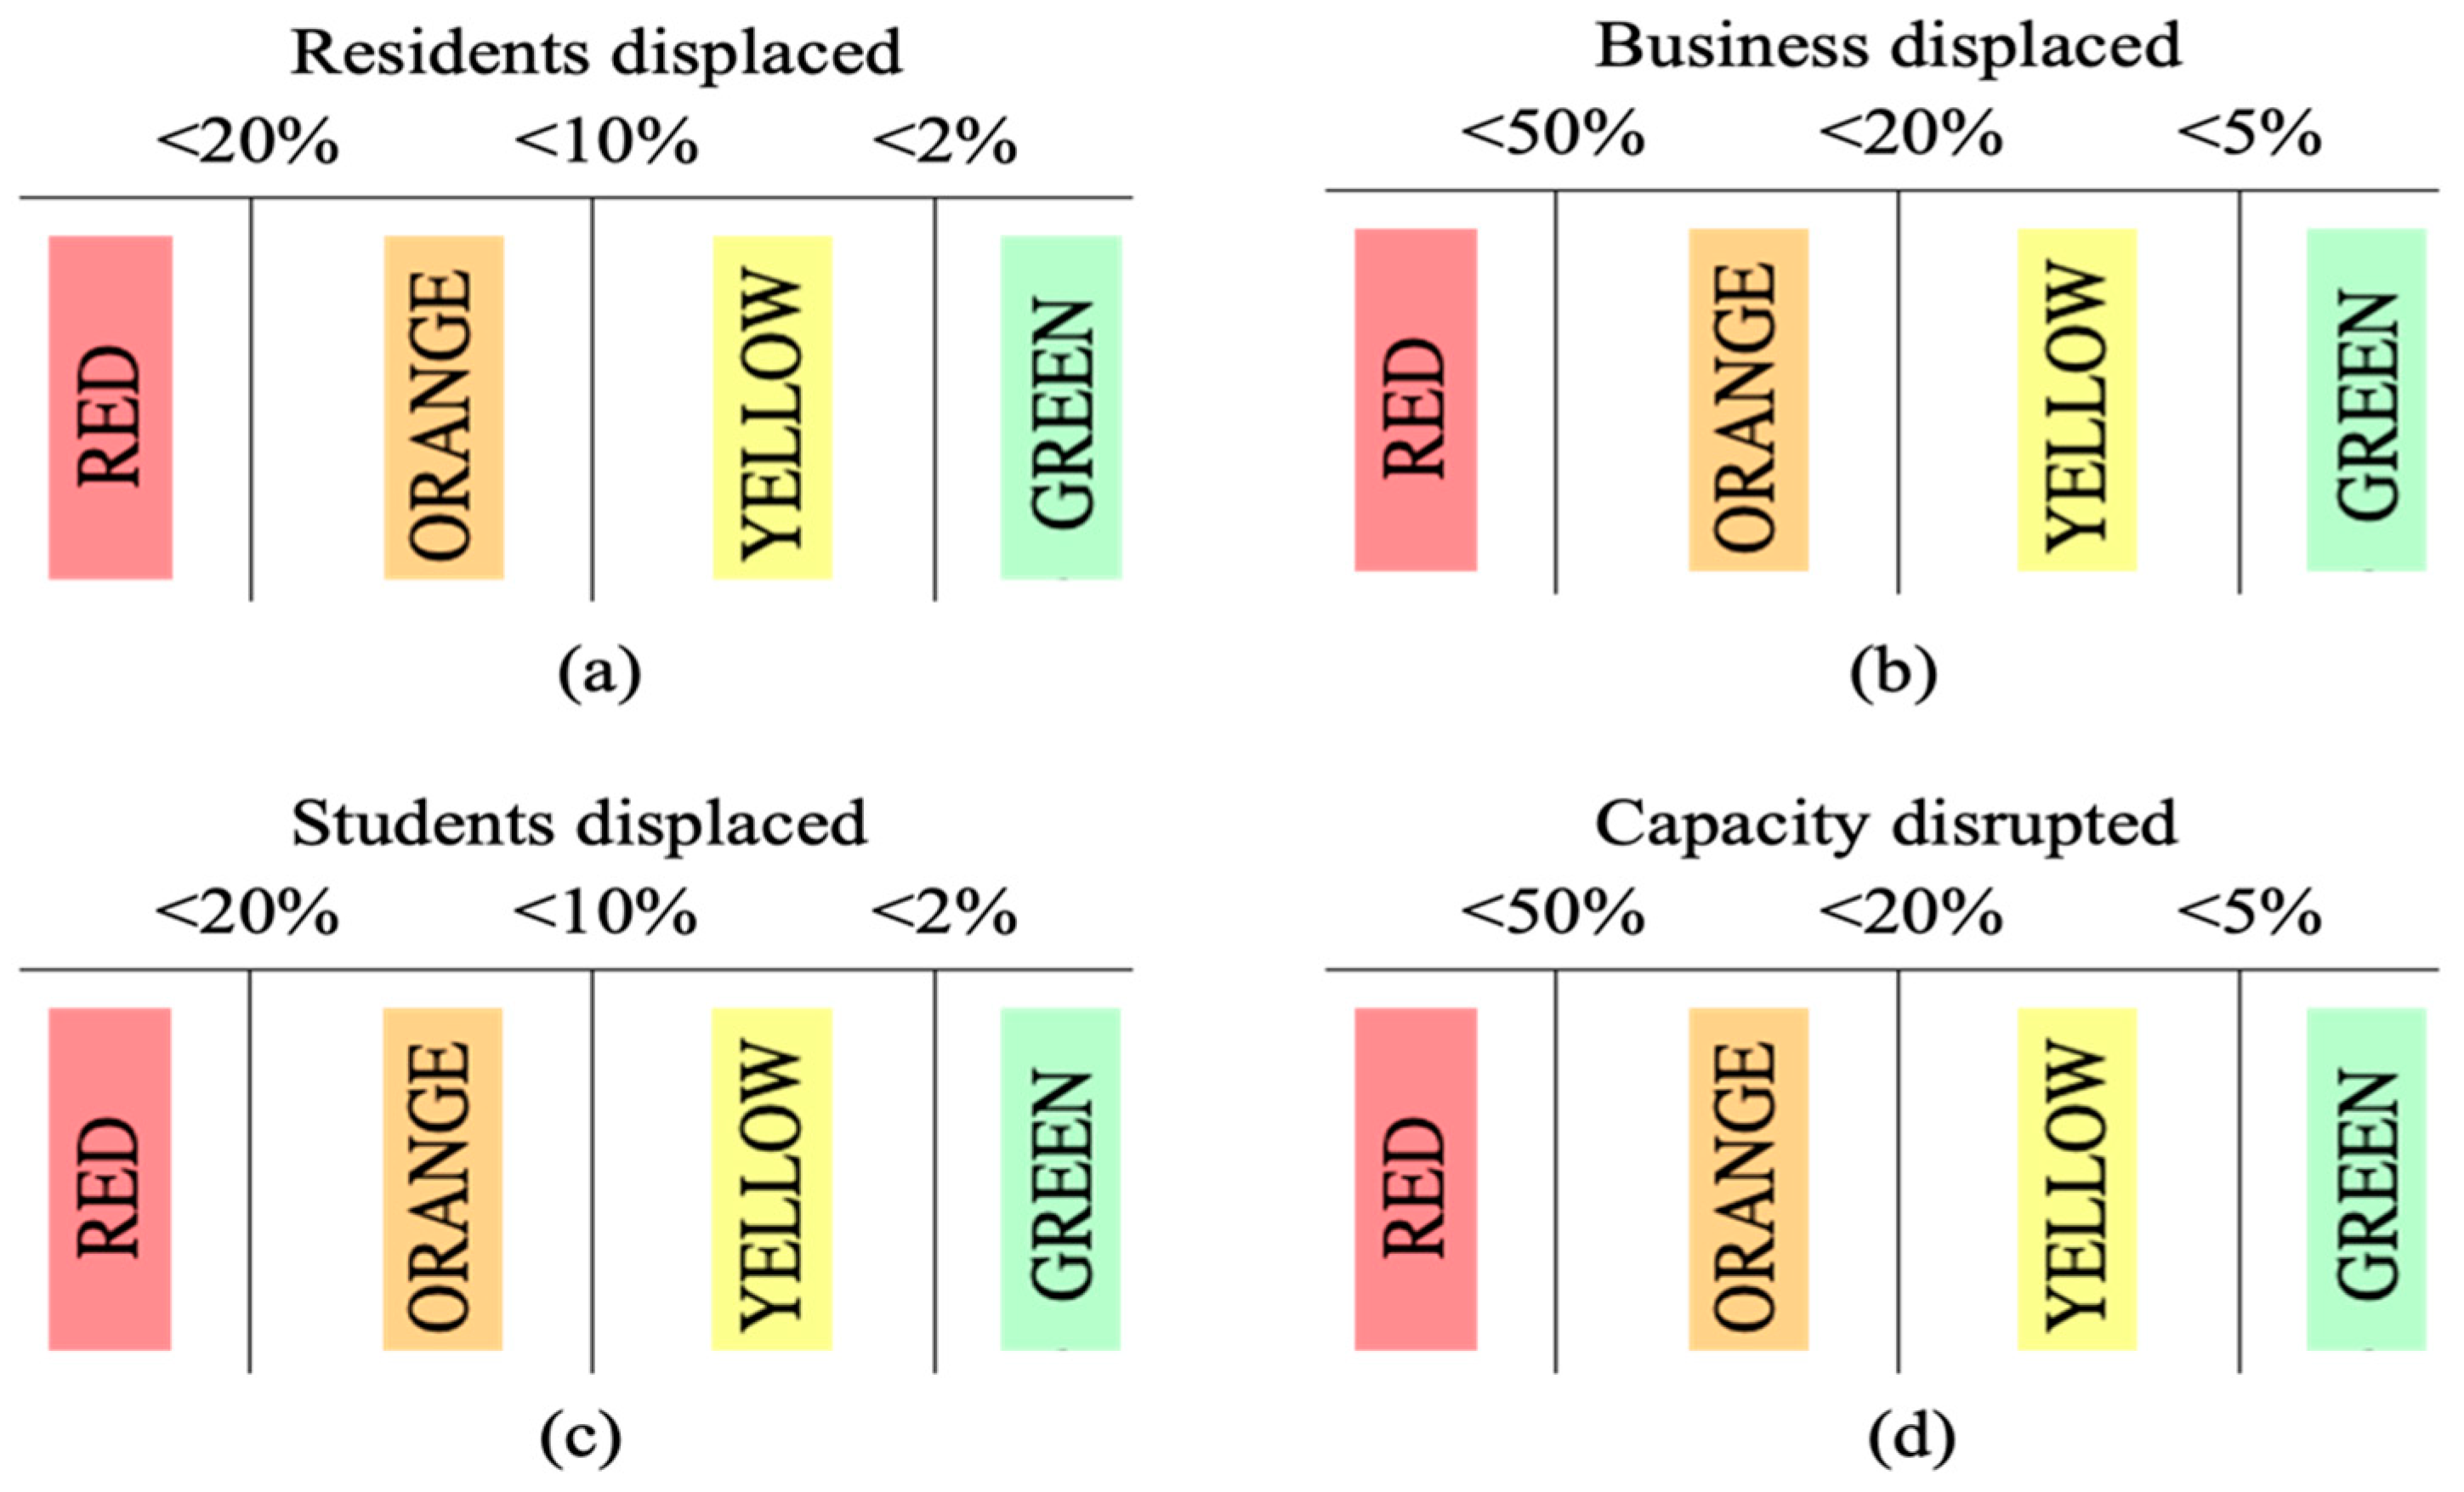
2.6. Flood Performance of Community Supporting Building Sectors
2.7. Calculation of Community Resilience
3. Results and Analysis
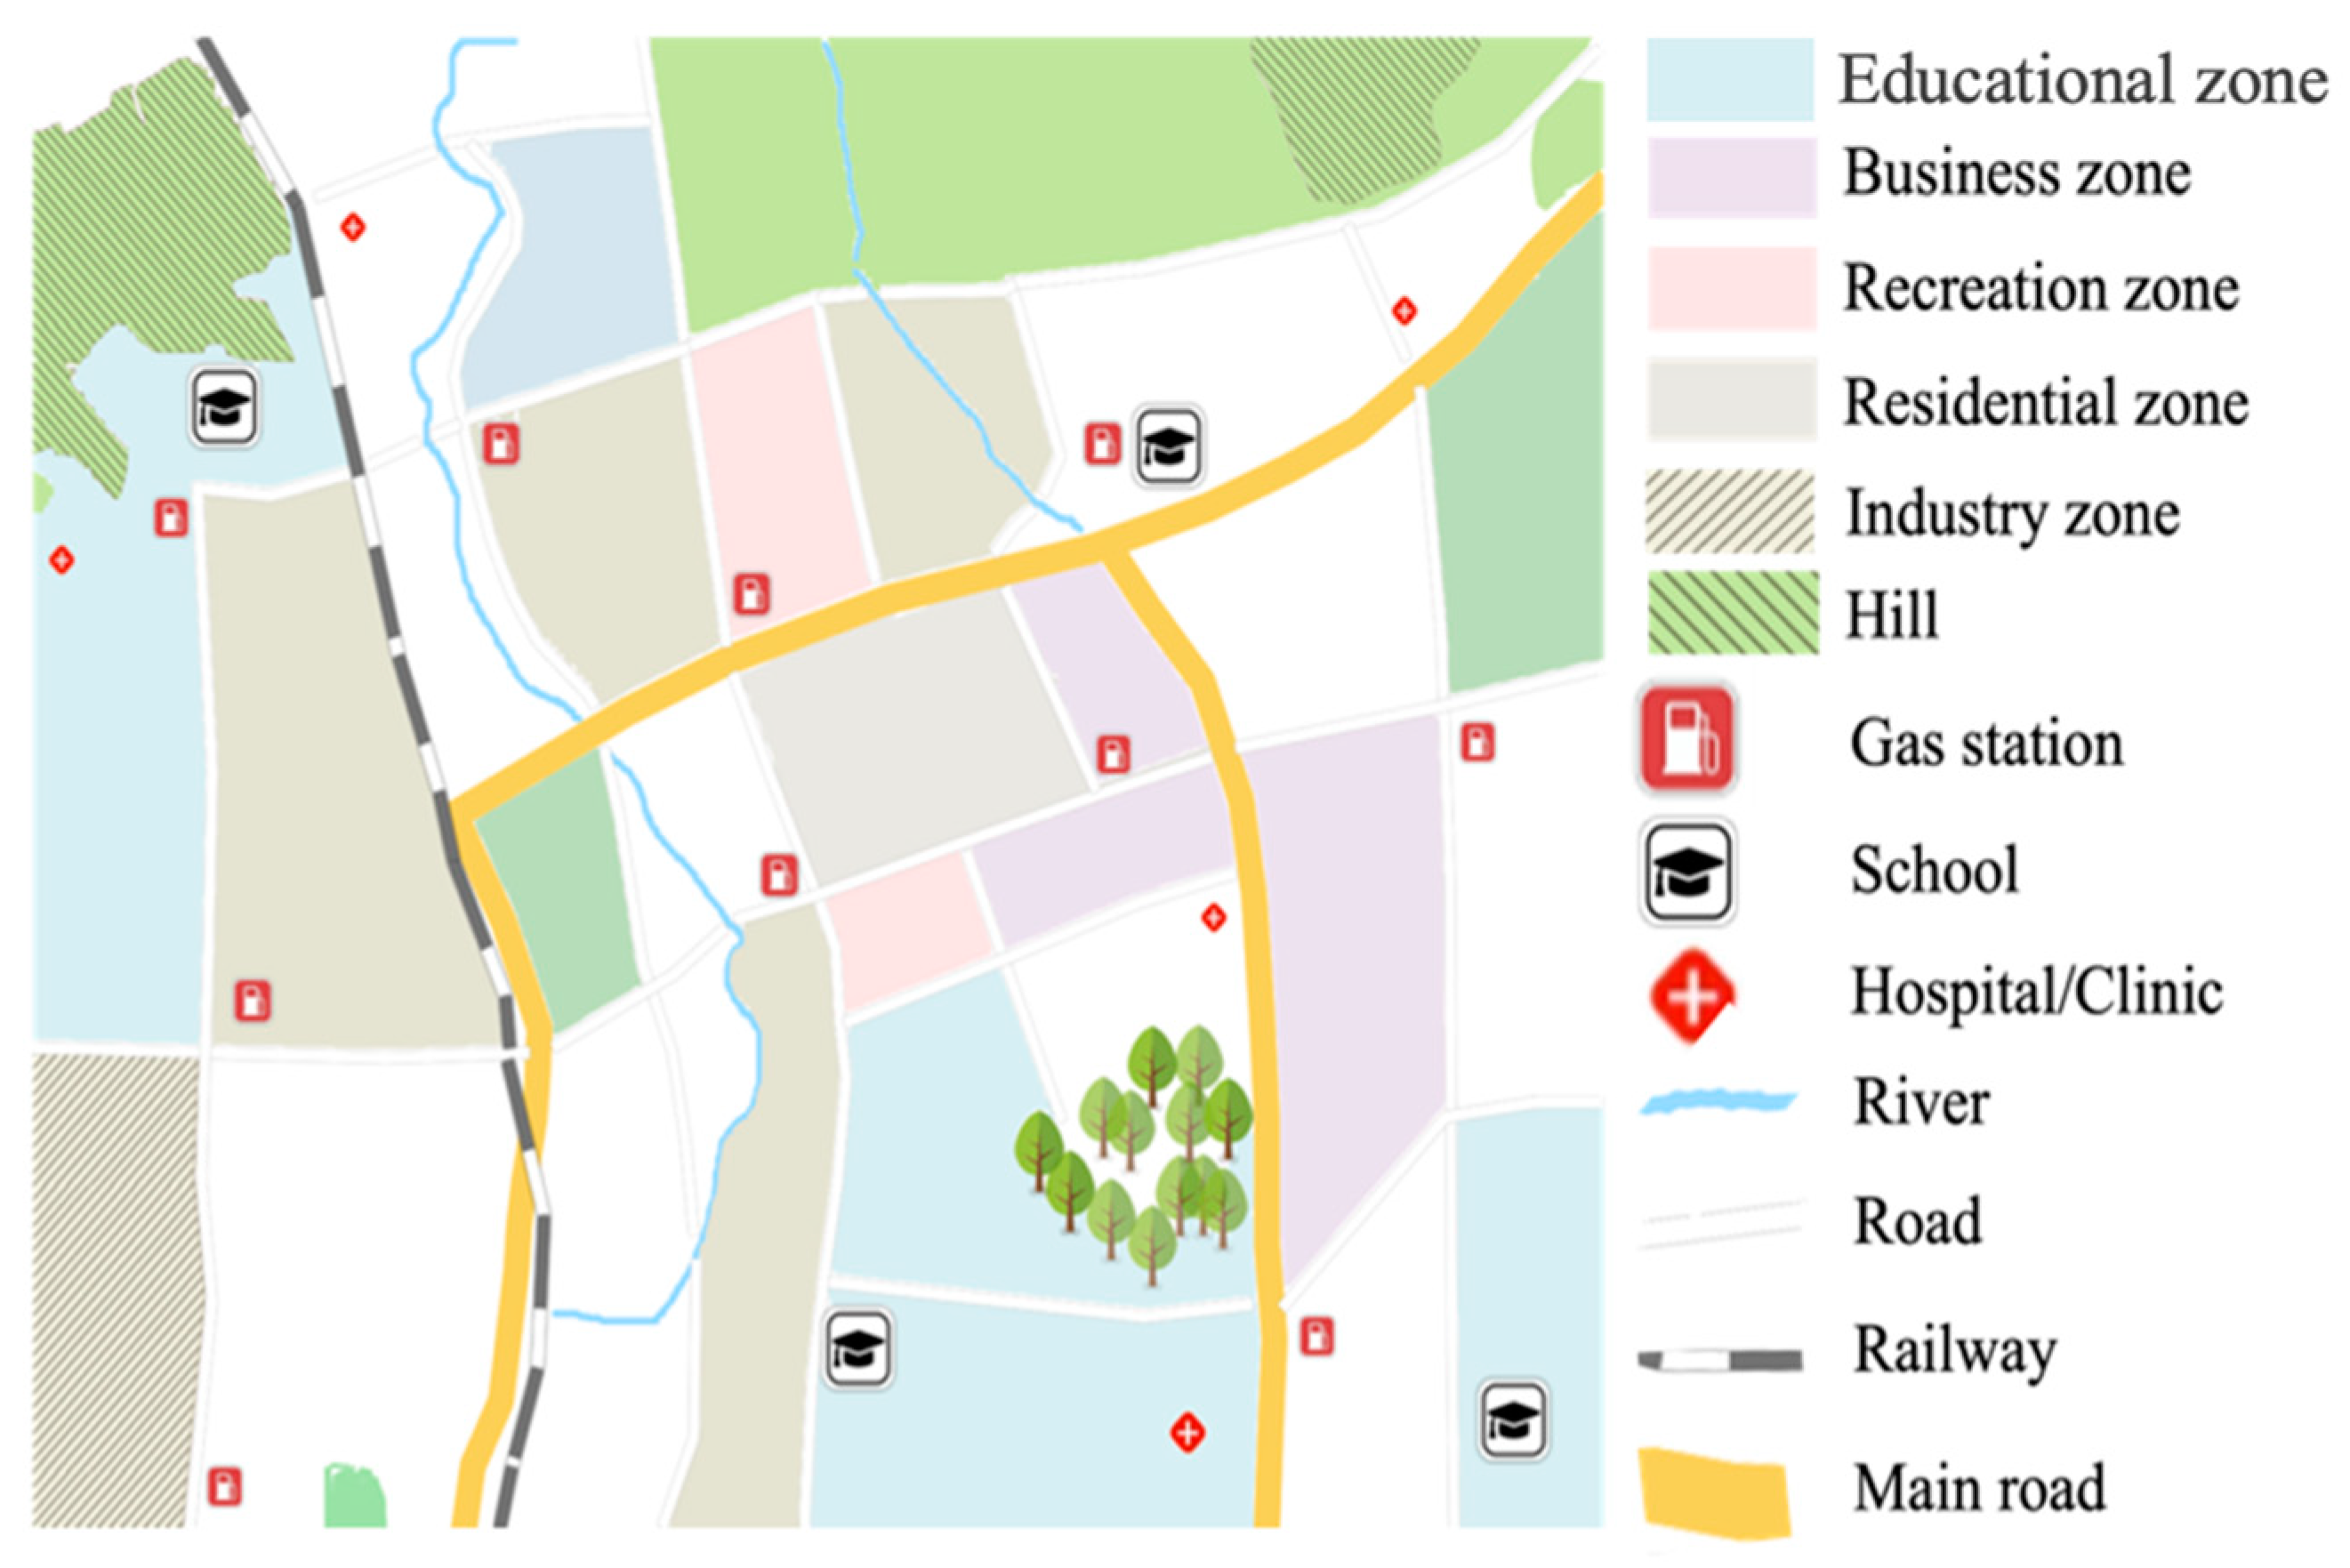
3.1. The Basic Description of the Virtual Community Case
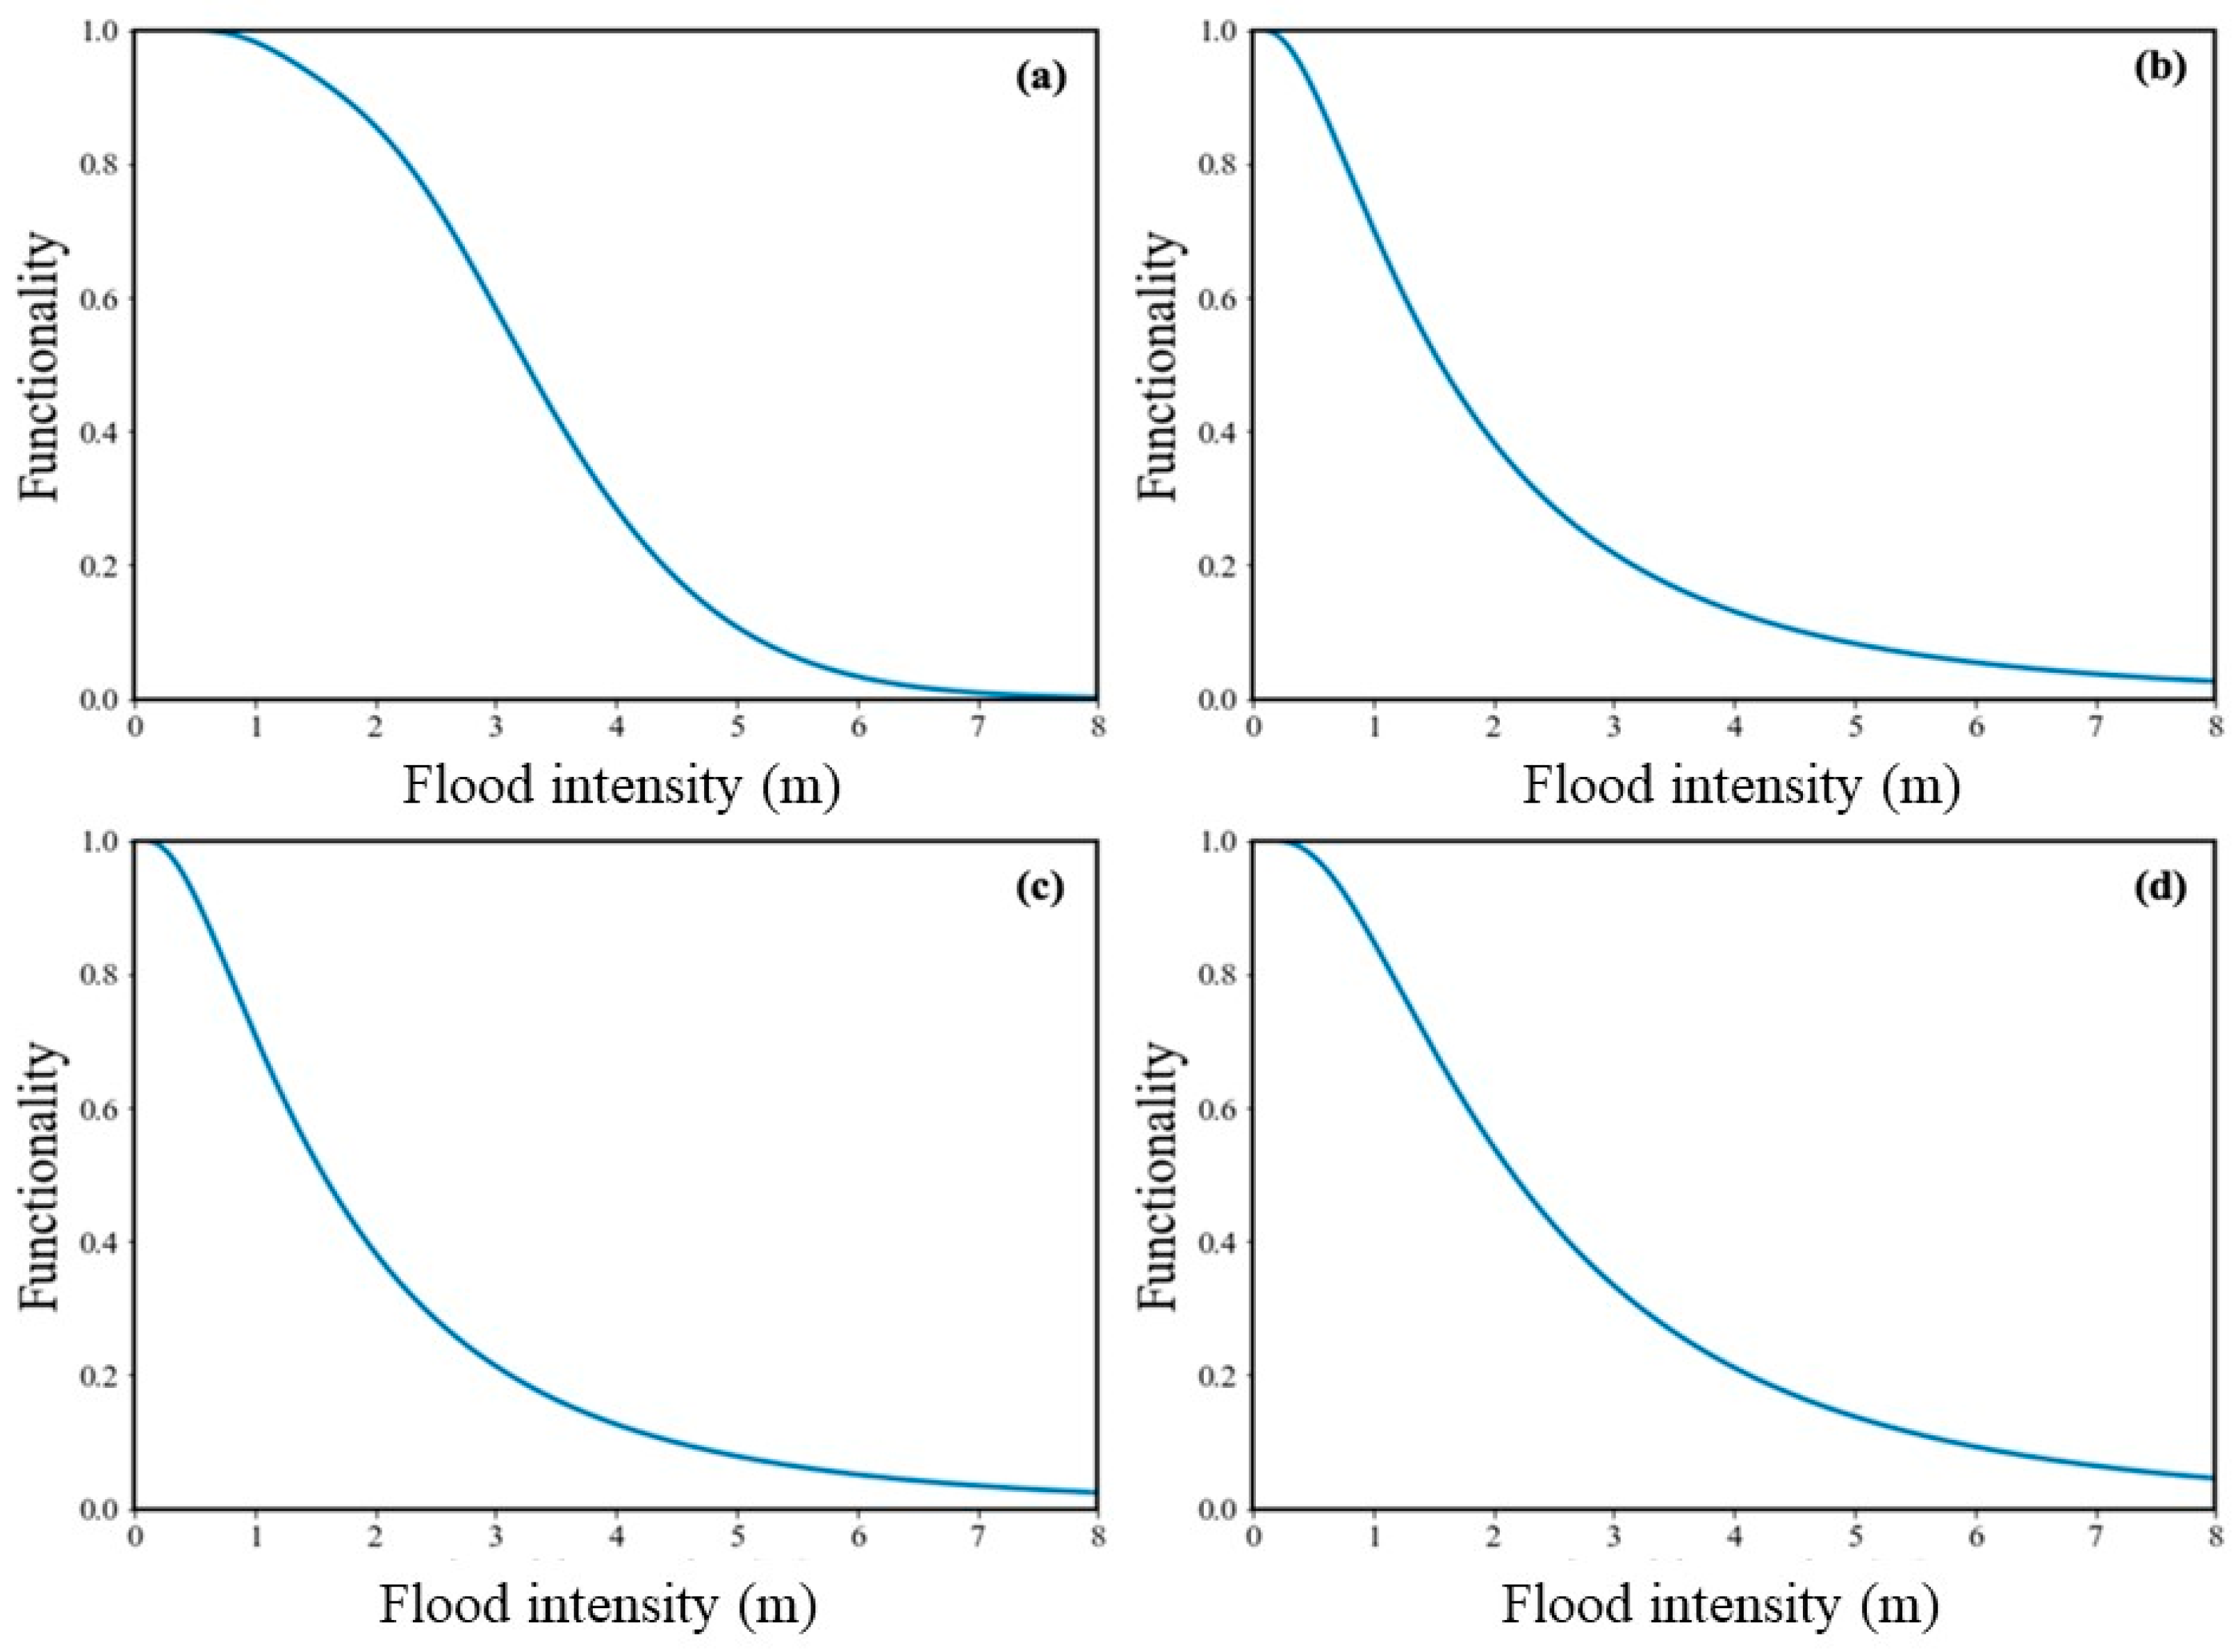
3.2. The Fragility Curves of Community Components
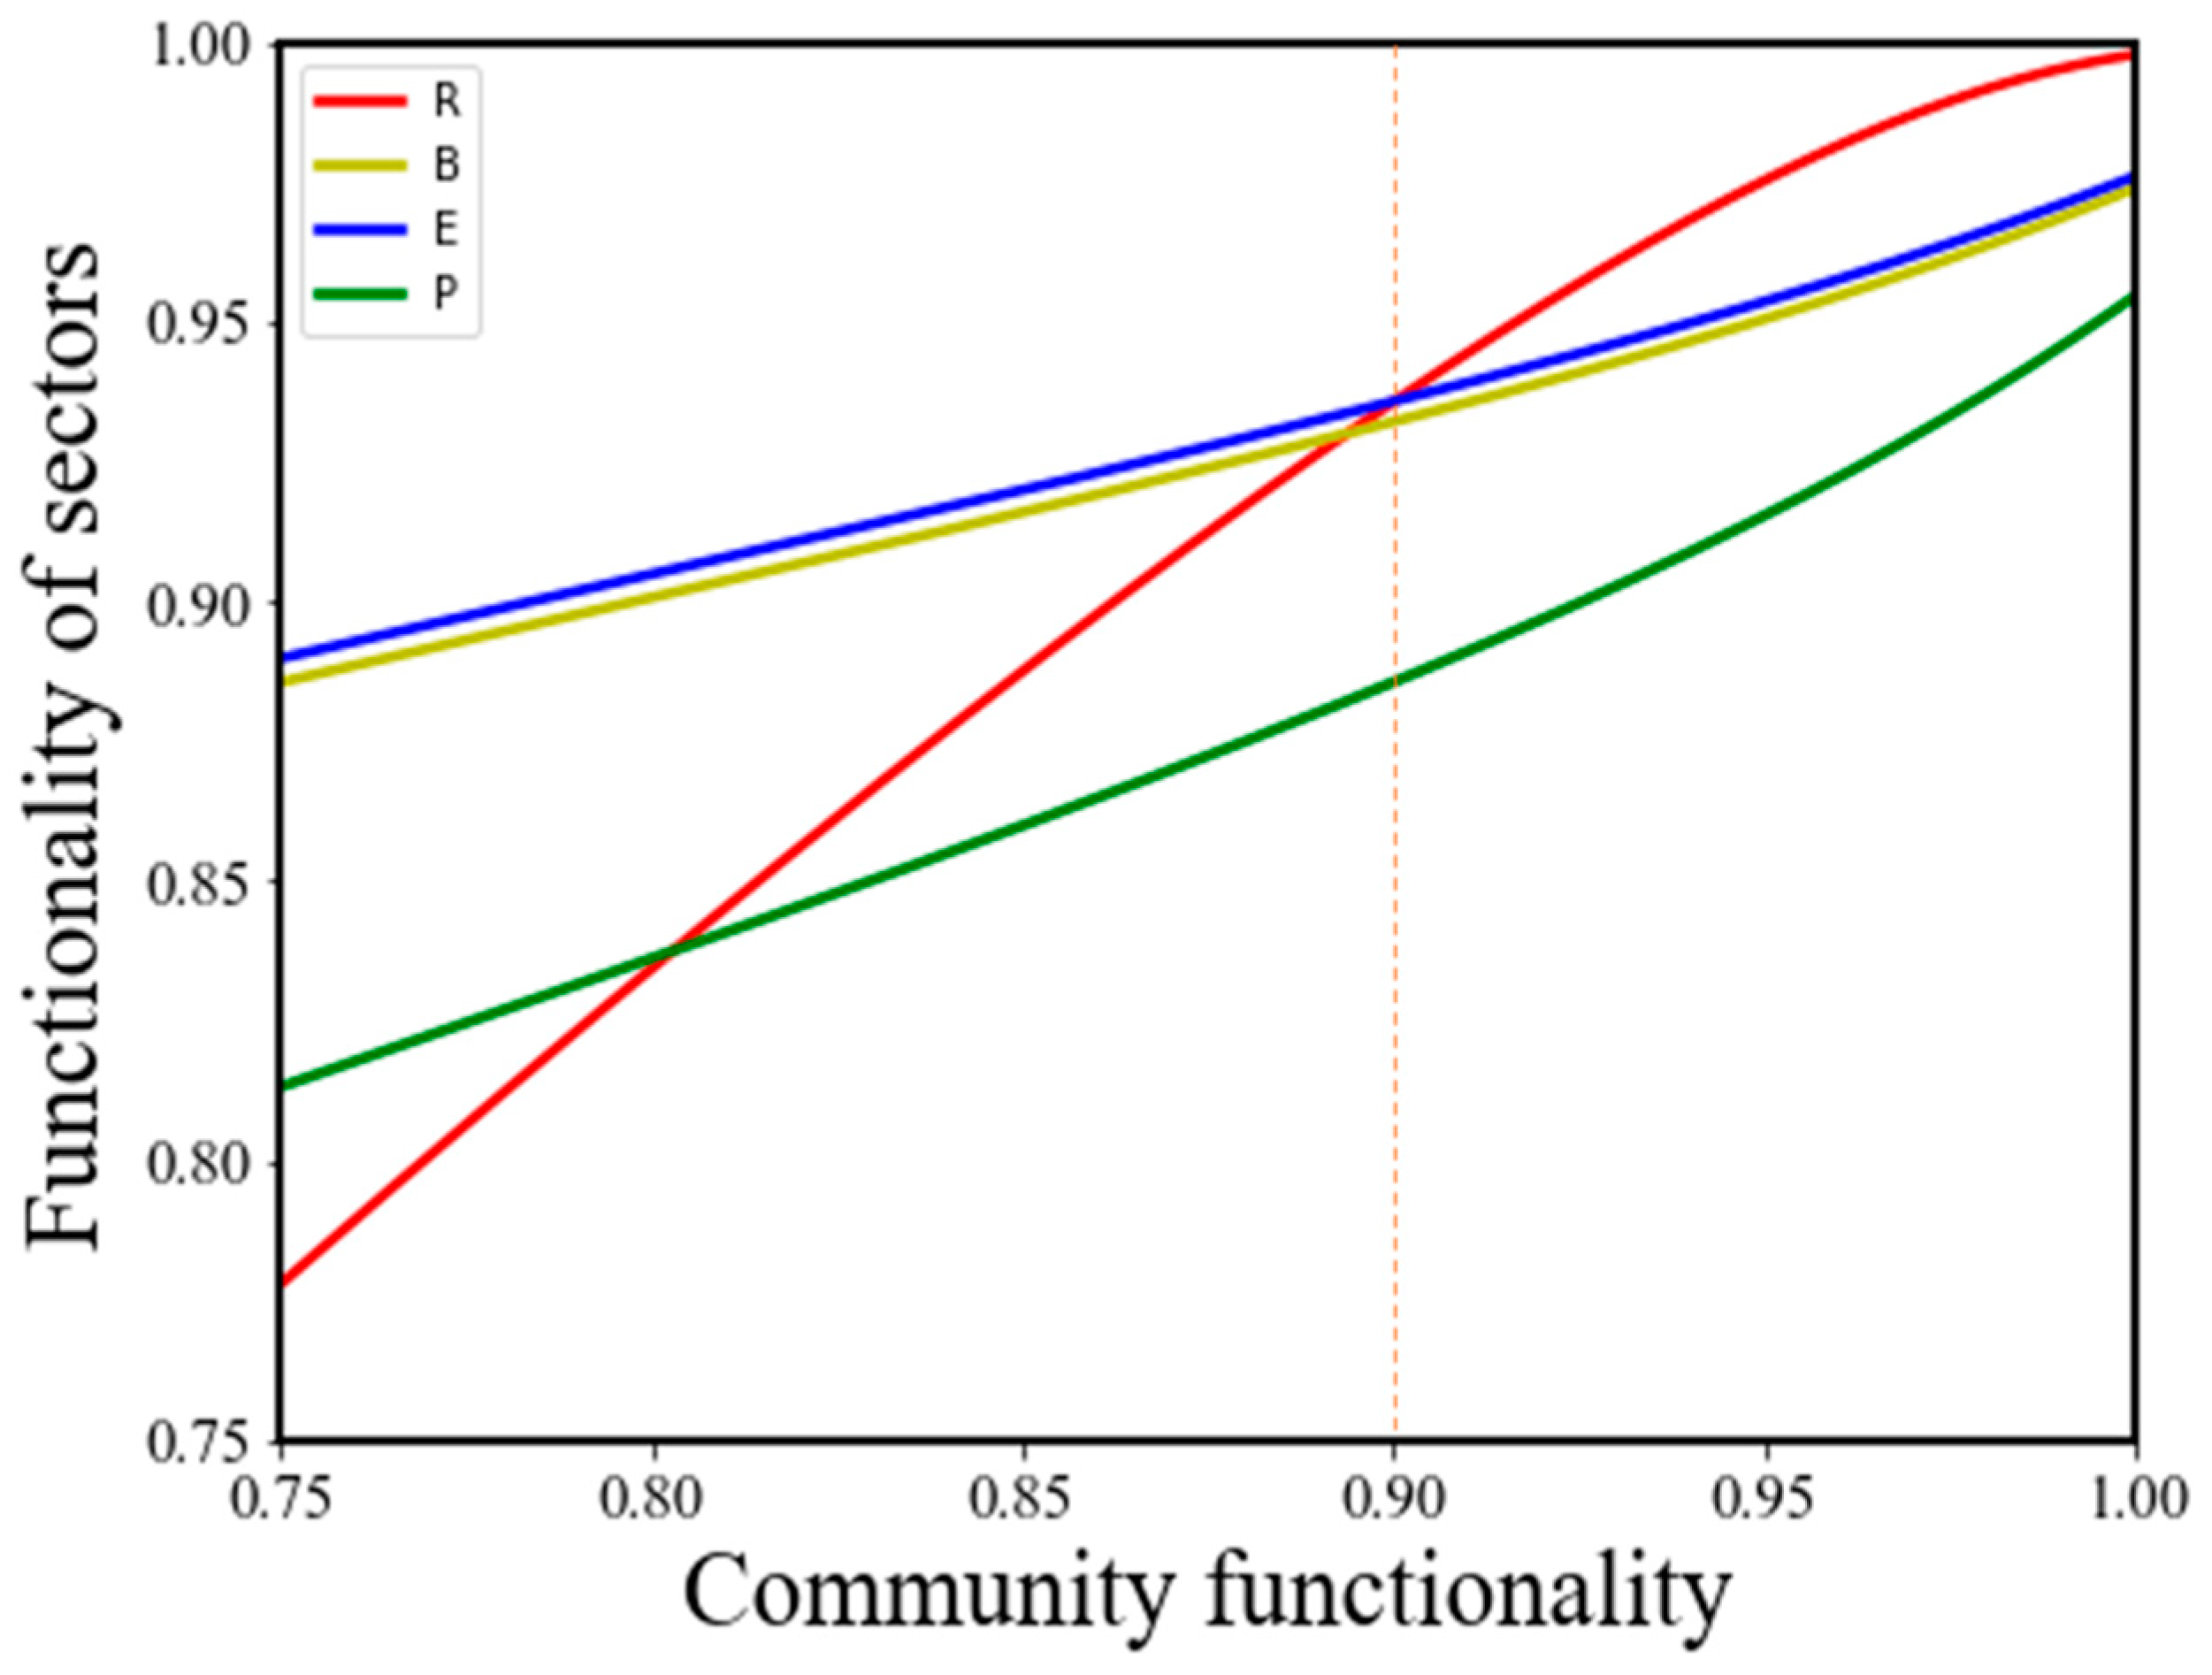
3.3. Functionality at Sector Scale and Community Scale
4. Conclusions
Author Contributions
Funding
Data Availability Statement
Acknowledgments
Conflicts of Interest
References
- Joyner, M.D.; Sasani, M. Multihazard Risk-Based Resilience Analysis of East and West Coast Buildings Designed to Current Codes. J. Struct. Eng. 2018, 144, 04018102. [Google Scholar] [CrossRef]
- Morita, M. Quantification of Increased Flood Risk Due to Global Climate Change for Urban River Management Planning. Water Sci. Technol. 2011, 63, 2967–2974. [Google Scholar] [CrossRef] [PubMed]
- Ghazali, D.A.; Guericolas, M.; Thys, F.; Sarasin, F.; Arcos Gonzalez, P.; Casalino, E. Climate Change Impacts on Disaster and Emergency Medicine Focusing on Mitigation Disruptive Effects: An International Perspective. Int. J. Environ. Res. Public Health 2018, 15, 1379. [Google Scholar] [CrossRef] [PubMed]
- Morrison, A.; Westbrook, C.J.; Noble, B.F. A Review of the Flood Risk Management Governance and Resilience Literature. J. Flood Risk Manag. 2018, 11, 291–304. [Google Scholar] [CrossRef]
- Albano, R.; Sole, A.; Mirauda, D.; Adamowski, J. Modelling Large Floating Bodies in Urban Area Flash-Floods via a Smoothed Particle Hydrodynamics Model. J. Hydrol. 2016, 541, 344–358. [Google Scholar] [CrossRef]
- Nofal, O.M.; van de Lindt, J.W. Minimal Building Flood Fragility and Loss Function Portfolio for Resilience Analysis at the Community Level. Water 2020, 12, 2277. [Google Scholar] [CrossRef]
- FEMA. Flood-Resistant Design and Construction; FEMA: Washington, DC, USA, 2003. [Google Scholar]
- Feng, K.; Wang, N.; Li, Q.; Lin, P. Measuring and Enhancing Resilience of Building Portfolios Considering the Functional Interdependence among Community Sectors. Struct. Saf. 2017, 66, 118–126. [Google Scholar] [CrossRef]
- Mugume, S.N.; Gomez, D.E.; Fu, G.; Farmani, R.; Butler, D. A Global Analysis Approach for Investigating Structural Resilience in Urban Drainage Systems. Water Res. 2015, 81, 15–26. [Google Scholar] [CrossRef]
- Wright, D.B. Methods in Flood Hazard and Risk Assessment; International Bank for Reconstruction and Development, The World Bank: Washington, DC, USA, 2015. [Google Scholar]
- Poland, C.D.; SPUR Resilient City Goals; McAllister, T.; McAllister, T. Developing Guidelines and Standards for Disaster Resilience of the Built Environment: A Research Needs Assessment; US Department of Commerce, National Institute of Standards and Technology: Gaithersburg, MD, USA, 2013. [Google Scholar]
- Patel, S.S.; Rogers, M.B.; Amlôt, R.; Rubin, G.J. What Do We Mean by ‘Community Resilience’? A Systematic Literature Review of How It Is Defined in the Literature. PLoS Curr. 2017, 9. [Google Scholar]
- Rogers, J.D.; Kemp, G.P.; Bosworth, H., Jr.; Seed, R.B. Interaction between the US Army Corps of Engineers and the Orleans Levee Board Preceding the Drainage Canal Wall Failures and Catastrophic Flooding of New Orleans in 2005. Water Policy 2015, 17, 707–723. [Google Scholar] [CrossRef]
- Bruneau, M.; Chang, S.E.; Eguchi, R.T.; Lee, G.C.; O’Rourke, T.D.; Reinhorn, A.M.; Von Winterfeldt, D. A Framework to Quantitatively Assess and Enhance the Seismic Resilience of Communities. Earthq. Spectra 2003, 19, 733–752. [Google Scholar] [CrossRef]
- Mayunga, J.S. Understanding and Applying the Concept of Community Disaster Resilience: A Capital-Based Approach. In Proceedings of the Summer Academy for Social Vulnerability and Resilience Building, Munich, Germany, 22–28 July 2007; Volume 1, pp. 1–16. [Google Scholar]
- Lin, P.; Wang, N. Building Portfolio Fragility Functions to Support Scalable Community Resilience Assessment. Sustain. Resilient Infrastruct. 2016, 1, 108–122. [Google Scholar] [CrossRef]
- Sen, M.K.; Dutta, S.; Kabir, G. Flood Resilience of Housing Infrastructure Modeling and Quantification Using a Bayesian Belief Network. Sustainability 2021, 13, 1026. [Google Scholar] [CrossRef]
- Borba, M.; Warner, J.; Porto, M. Urban Stormwater Flood Management in the Cordeiro Watershed, São Paulo, Brazil: Does the Interaction between Socio-Political and Technical Aspects Create an Opportunity to Attain Community Resilience? J. Flood Risk Manag. 2016, 9, 234–242. [Google Scholar] [CrossRef]
- Hossain, N.U.I.; El Amrani, S.; Jaradat, R.; Marufuzzaman, M.; Buchanan, R.; Rinaudo, C.; Hamilton, M. Modeling and Assessing Interdependencies between Critical Infrastructures Using Bayesian Network: A Case Study of Inland Waterway Port and Surrounding Supply Chain Network. Reliab. Eng. Syst. Saf. 2020, 198, 106898. [Google Scholar] [CrossRef]
- Queiroz, C.; Garg, S.K.; Tari, Z. A Probabilistic Model for Quantifying the Resilience of Networked Systems. IBM J. Res. Dev. 2013, 57, 3:1–3:9. [Google Scholar] [CrossRef]
- Heaslip, K.; Louisell, W.; Collura, J.; Urena Serulle, N. A Sketch Level Method for Assessing Transportation Network Resiliency to Natural Disasters and Man-Made Events. In Proceedings of the Transportation Research Board 89th Annual Meeting, Washington, DC, USA, 10–14 January 2010; Transportation Research Board: Washington, DC, USA, 2010. [Google Scholar]
- Rosowsky, D.V.; Ellingwood, B.R. Performance-Based Engineering of Wood Frame Housing: Fragility Analysis Methodology. J. Struct. Eng. 2002, 128, 32–38. [Google Scholar] [CrossRef]
- Gidaris, I.; Padgett, J.E.; Barbosa, A.R.; Chen, S.; Cox, D.; Webb, B.; Cerato, A. Multiple-Hazard Fragility and Restoration Models of Highway Bridges for Regional Risk and Resilience Assessment in the United States: State-of-the-Art Review. J. Struct. Eng. 2017, 143, 04016188. [Google Scholar] [CrossRef]
- Ellingwood, B.R.; Cutler, H.; Gardoni, P.; Peacock, W.G.; van de Lindt, J.W.; Wang, N. The Centerville Virtual Community: A Fully Integrated Decision Model of Interacting Physical and Social Infrastructure Systems. Sustain. Resilient Infrastruct. 2016, 1, 95–107. [Google Scholar] [CrossRef]
- Enderami, S.A.; Sutley, E.J. Social Vulnerability Score: A Scalable Index for Representing Social Vulnerability in Virtual Community Resilience Testbeds. Nat. Hazards 2024, 120, 6457–6480. [Google Scholar] [CrossRef]
- Nofal, O.M.; van de Lindt, J.W. Probabilistic Flood Loss Assessment at the Community Scale: Case Study of 2016 Flooding in Lumberton, North Carolina. ASCE-ASME J. Risk Uncertain. Eng. Syst. Part A Civ. Eng. 2020, 6, 05020001. [Google Scholar] [CrossRef]
- House, W. Presidential Policy Directive/PPD 21—Critical Infrastructure Security and Resilience; The White House: Washington, DC, USA, 2013. [Google Scholar]
- McGrath, H.; Abo El Ezz, A.; Nastev, M. Probabilistic Depth–Damage Curves for Assessment of Flood-Induced Building Losses. Nat. Hazards 2019, 97, 1–14. [Google Scholar] [CrossRef]
- Mieler, M.; Stojadinovic, B.; Budnitz, R.; Comerio, M.; Mahin, S. A Framework for Linking Community-Resilience Goals to Specific Performance Targets for the Built Environment. Earthq. Spectra 2015, 31, 1267–1283. [Google Scholar] [CrossRef]
- Guidotti, R.; Gardoni, P.; Rosenheim, N. Integration of Physical Infrastructure and Social Systems in Communities’ Reliability and Resilience Analysis. Reliab. Eng. Syst. Saf. 2019, 185, 476–492. [Google Scholar] [CrossRef]
- Van de Lindt, J.W.; Peacock, W.G.; Mitrani-Reiser, J.; Rosenheim, N.; Deniz, D.; Dillard, M.; Crawford, P.S. Community Resilience-Focused Technical Investigation of the 2016 Lumberton, North Carolina, Flood: An Interdisciplinary Approach. Nat. Hazards Rev. 2020, 21, 04020029. [Google Scholar] [CrossRef]
- Wang, W.; van de Lindt, J.W.; Cutler, H.; Rosenheim, N.; Koliou, M.; Lee, J.S.; Calderon, D. Community Resilience Assessment of an EF-5 Tornado Using the IN-CORE Modeling Environment. In Life-Cycle Civil Engineering: Innovation, Theory and Practice; CRC Press: Boca Raton, FL, USA, 2021; pp. 394–398. [Google Scholar]
- Dang, N.M.; Babel, M.S.; Luong, H.T. Evaluation of Food Risk Parameters in the Day River Flood Diversion Area, Red River Delta, Vietnam. Nat. Hazards 2011, 56, 169–194. [Google Scholar] [CrossRef]
- Nofal, O.M.; van de Lindt, J.W.; Do, T.Q. Multi-Variate and Single-Variable Flood Fragility and Loss Approaches for Buildings. Reliab. Eng. Syst. Saf. 2020, 202, 106971. [Google Scholar] [CrossRef]
- Rinaldi, S.M.; Peerenboom, J.P.; Kelly, T.K. Identifying, Understanding, and Analyzing Critical Infrastructure Interdependencies. IEEE Control. Syst. Mag. 2001, 21, 11–25. [Google Scholar]
- Fu, Z.; Gao, R.; Li, Y. Measuring Seismic Resilience of Building Portfolios Based on Innovative Damage Ratio Assessment Model. Structures 2021, 30, 1109–1126. [Google Scholar] [CrossRef]


| Measure/Policy | Description | Reference |
|---|---|---|
| Elevated structures | Raising buildings above flood levels | [6] |
| Green infrastructure | Permeable pavements, retention basins | [4] |
| Flood-resistant materials | Using durable materials in construction | [7] |
| Decentralized utilities | Local power/water systems to reduce dependency | [8] |
| Improved drainage systems | Enhanced urban drainage to reduce runoff | [9] |
| DS Level | Description | Damage Scale | Functionality | Loss Ratio |
|---|---|---|---|---|
| DS0 | In significant damage condition | Insignificant | Operational | 0.00–0.03 |
| DS1 | Water touches floor joists up to minor water entering the building; floodwater touches the foundation with a height of about 2.5 cm from ground level. | Slight | Limited occupancy | 0.03–0.15 |
| DS2 | Drywall damage up to a 30 cm water level from the ground level. | Moderate | Restricted occupancy | 0.15–0.50 |
| DS3 | Damage to the nonstructural components such as electrical appliances and cabinets; equipment, devices, and furniture on the upper floors are also damaged (e.g., attic, second floor, etc.) | Extensive | Restricted use | 0.50–0.70 |
| DS4 | Fully structural damage | Complete | Restricted entry | 0.50–0.70 |
| Sector | Archetype | Description * | N | DS3 * | |
|---|---|---|---|---|---|
| λ | ξ | ||||
| R.S. | R1 | One-story single-family residential building | 500 | 1.173 | 0.278 |
| R2 | One-story multi-family residential building | 200 | 0.589 | 0.439 | |
| R3 | Two-story single-family residential building | 200 | 1.512 | 0.240 | |
| R4 | Two-story multi-family residential building | 100 | 1.214 | 0.288 | |
| BS | B1 | Multi-unit retail building | 7 | 0.450 | 0.860 |
| B2 | Small multi-unit commercial building | 2 | 0.456 | 0.724 | |
| B3 | Super retail center | 1 | 0.412 | 0.913 | |
| ES | E1 | One-story school | 2 | 0.824 | 0.531 |
| E2 | Two-story school | 2 | 1.388 | 0.435 | |
| PS | P1 | Small grocery store/gas station with a convenience store | 10 | 0.533 | 0.681 |
| P2 | Hospital/clinic | 5 | 1.034 | 0.742 | |
| Scale | Flood Depth (m) | Loss | Residual Functionality |
|---|---|---|---|
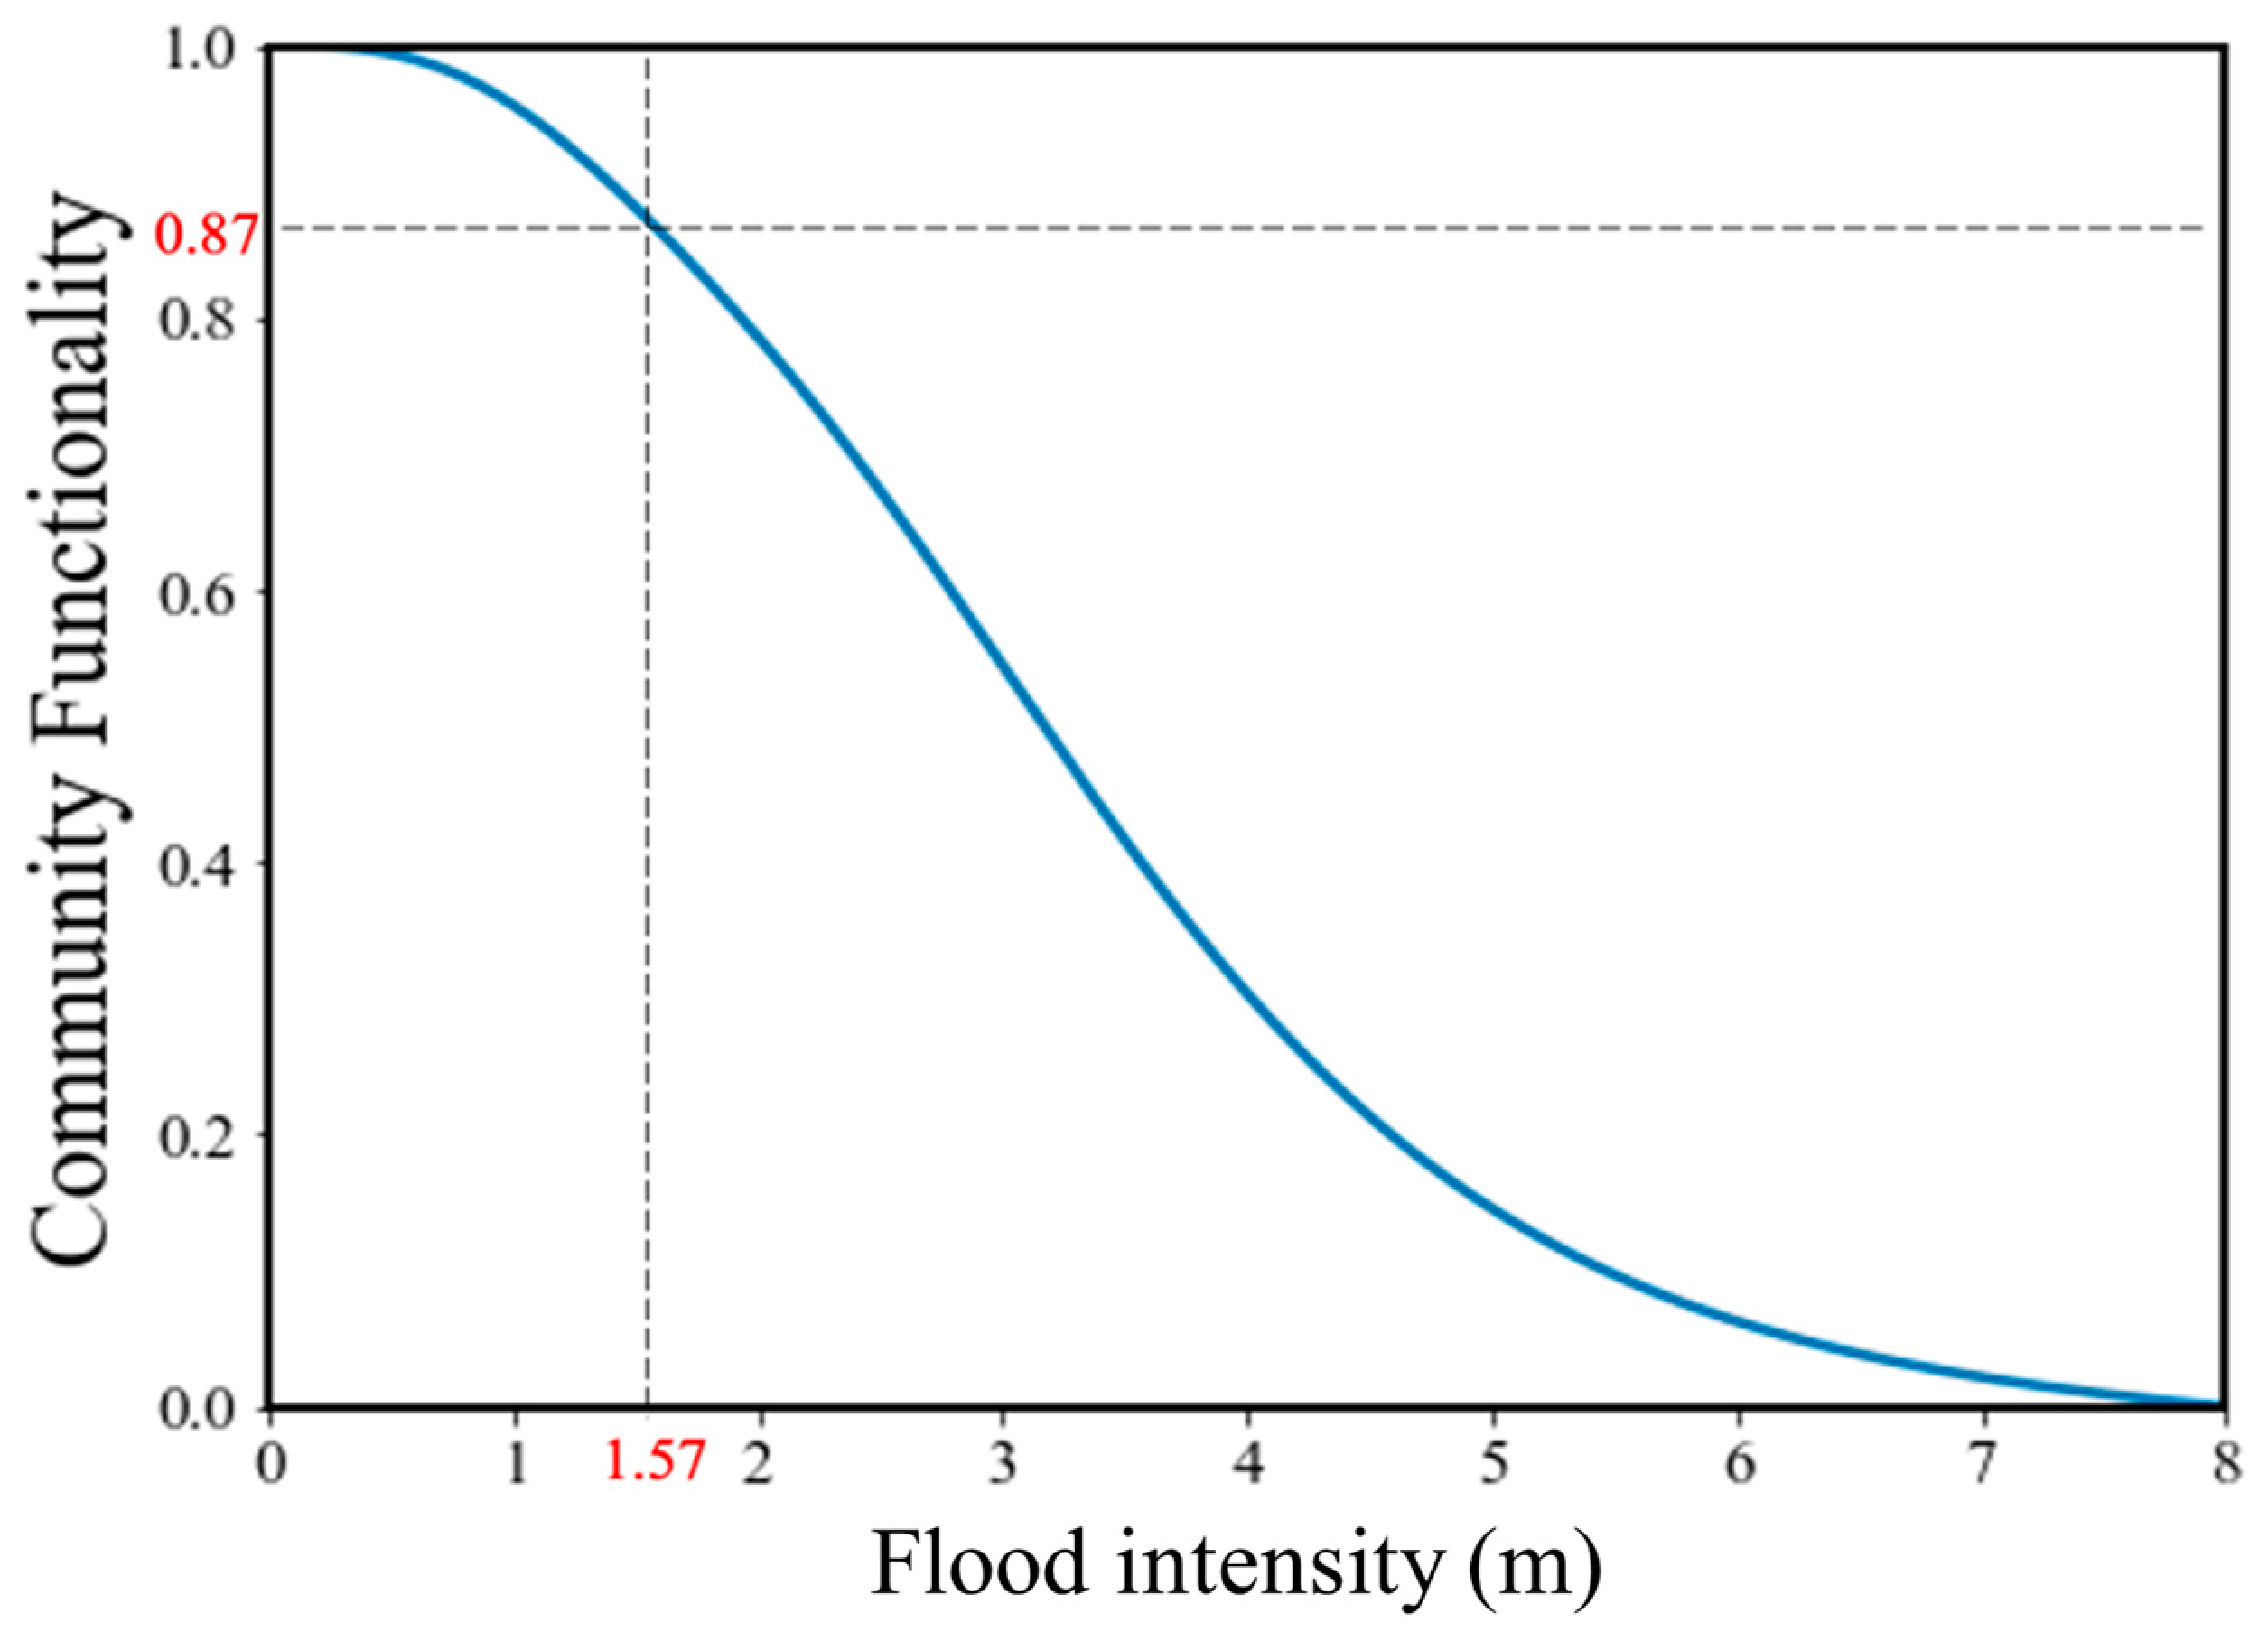
| Community | 1.57 | 0.13 | 0.87 |
| R.S. | 0.20 | 0.80 | |
| B.S. | 0.50 | 0.50 | |
| E.S. | 0.45 | 0.55 | |
| P.S. | 0.33 | 0.67 |
Disclaimer/Publisher’s Note: The statements, opinions and data contained in all publications are solely those of the individual author(s) and contributor(s) and not of MDPI and/or the editor(s). MDPI and/or the editor(s) disclaim responsibility for any injury to people or property resulting from any ideas, methods, instructions or products referred to in the content. |
© 2025 by the authors. Licensee MDPI, Basel, Switzerland. This article is an open access article distributed under the terms and conditions of the Creative Commons Attribution (CC BY) license (https://creativecommons.org/licenses/by/4.0/).
Share and Cite
Lu, Y.; Zhang, G.; Wang, D. Assessing Community-Level Flood Resilience: Analyzing Functional Interdependencies Among Building Sectors. Appl. Sci. 2025, 15, 3161. https://doi.org/10.3390/app15063161
Lu Y, Zhang G, Wang D. Assessing Community-Level Flood Resilience: Analyzing Functional Interdependencies Among Building Sectors. Applied Sciences. 2025; 15(6):3161. https://doi.org/10.3390/app15063161
Chicago/Turabian StyleLu, Yang, Guanming Zhang, and Donglei Wang. 2025. "Assessing Community-Level Flood Resilience: Analyzing Functional Interdependencies Among Building Sectors" Applied Sciences 15, no. 6: 3161. https://doi.org/10.3390/app15063161
APA StyleLu, Y., Zhang, G., & Wang, D. (2025). Assessing Community-Level Flood Resilience: Analyzing Functional Interdependencies Among Building Sectors. Applied Sciences, 15(6), 3161. https://doi.org/10.3390/app15063161