Article

Quantitative Analysis of Risk Coupling Effects in Highway Accidents: A Focus on Primary and Secondary Accidents

1
School of Electronics and Control Engineering, Chang’an University, Xi’an 710064, China
2
School of Information Engineering, Chang’an University, Xi’an 710064, China
3
Guangzhou Road Research Institute Co., Ltd., Guangzhou 511431, China
4
Shaanxi Transportation Holding Group, Xi’an 723003, China
*
Author to whom correspondence should be addressed.
Appl. Sci. 2025, 15(6), 3114; https://doi.org/10.3390/app15063114
Submission received: 18 February 2025 / Revised: 2 March 2025 / Accepted: 11 March 2025 / Published: 13 March 2025
(This article belongs to the Section Transportation and Future Mobility)

Abstract

:
Analyzing risk coupling effects in highway accidents provides guidance for preventive decoupling measures. Existing studies rarely explore the differences in risk coupling between primary accidents (PA) and secondary accidents (SA) from a quantitative perspective. This study proposes a method to measure the risk coupling effects of PA and SA on highways and examine their differences. A domain-pretrained named entity recognition (NER) model, TRBERT-BiLSTM-CRF, is proposed to identify risk factors and risk types based on 431 accident investigation reports published by the emergency management departments in China. The N-K model was applied to calculate the risk coupling values for different coupling scenarios in PA and SA, and the Wilcoxon signed-rank test was performed on them. Finally, the differences between PA and SA were compared, and targeted accident prevention recommendations are provided. The results showed that our proposed NER model achieved the best macro-F1 score in traffic risk entity recognition. Most of the risk coupling values increased with the number of risk types, but the coupling value of the five factors in the SA was lower than that of the four factors, indicating that the risk types do not always superimpose each other in complex scenarios. Moreover, there were significant differences in the risk coupling mechanisms between PA and SA. The results suggest that the likelihood of PA and SA occurrences should be reduced through standardized vehicle inspections and flexible control measures, respectively, thereby enhancing highway safety.

1. Introduction

Road traffic safety is the foundation of the development of the transportation industry. Road transport professionals worldwide have tirelessly tried to improve highway safety for many years, but inherent risks persist. The road transportation system is a highly interconnected and tightly coupled complex system involving multiple elements such as humans, vehicles, road surface environment, weather conditions, and management, with dynamic characteristics [1,2]. Therefore, traffic operation safety is influenced by various factors such as driver behavior, vehicle conditions, road conditions, traffic flow conditions, meteorological environment, and daily management measures, and this influence exhibits nonlinear coupling [3]. This inevitably increases the complexity of accident analysis and the difficulty of prevention.
In addition, the hazardous environment created by a traffic accident often puts noninvolved vehicles and accident response personnel at risk of further collisions, known as secondary accidents (SA). SA are defined as accidents occurring within the spatial and temporal boundaries of the impact area formed by primary accidents (PA) rather than as a different phase of PA [4]. It is estimated that the risk of SA is six times greater than that of PA [5]. Because of the spatial and temporal overlap between SA and PA, the risk coupling mechanisms of SA are more complex and difficult to block (see, for example, the 6.26 accident on the Yifeng Expressway in Hunan, the 3.1 accident on the Jinji Expressway in Shanxi, and the 6.13 accident on the Shenhai Expressway in Zhejiang). These accidents often trigger chain collisions, hazardous material leaks, fires, and even explosions after PA occurs, leading to severe human and economic losses while also posing significant challenges to rescue operations.
Given the enormous economic and social costs, as well as the potential for prevention, mitigating PA and SA has become a top priority for transportation agencies worldwide. A study found that reducing the complexity of the risk chain and the coupling degree between risk factors can reduce the impact of abnormal risks and the likelihood of their occurrence [6]. Moreover, coupling analysis is particularly suitable for recovering from inevitable component failures [7]. Therefore, analyzing the risk coupling mechanisms in specific accident categories (ACs) is of significant importance. It provides guidance for preventive decoupling measures to reduce potential accident risks, which is crucial for the prevention of PA and the blocking of SA.
It has been well established that PA and SA differ significantly in terms of triggering mechanisms, impact scope, and intervention measures [5]. However, existing studies rarely quantify their differences in risk coupling. Moreover, given that the analysis of risk coupling mechanisms relies on the combination of different risk factors, identifying these risk factors is highly valuable. However, because of domain-specific characteristics, general models perform poorly. Therefore, this study builds an NER model for identifying traffic accident risk factors and risk types by introducing a domain-specific corpus. This is one contribution of this study. Based on this, this study attempts to answer a key question from a quantitative perspective: whether the risk coupling mechanisms of PA and SA are different. The N-K model was applied to calculate the risk coupling values for different coupling scenarios in PA and SA, and the Wilcoxon signed-rank test was performed on them. This was also the main contribution of this study. The research findings can provide guidance for preventive decoupling measures of PA and SA to reduce potential accident risks, thereby enhancing highway safety. Meanwhile, highway emergency response departments can make targeted decisions by capturing these differences to prevent PA and block SA.

2. Related Works

2.1. Risk Factor Identification

In current accident analysis methods, such as Accident Mapping Analysis (AcciMap) [8], the Human Factors Analysis and Classification System (HFACS) [9], and the Systems Theoretic Accident Model and Process (STAMP) [10], an important preliminary step is the identification of hazards, accident causes, risk factors, and other related entities. This typically requires a thorough manual review and analysis of accident investigation reports, followed by the extraction of relevant entities [11,12], which is also referred to as an expert-based method. For example, Zhang et al. [13] used HFACS, with the help of research teams from universities and transportation companies, to categorize accident causes into five categories: unsafe behaviors, preconditions for unsafe behaviors, unsafe supervision, organizational influences, and outside factors. Stanton et al. [14] organized two human factor analysts, each with a Ph.D. and 30 years of experience, to categorize 37 accident investigation reports into 19 categories, identifying 1656 contributing and protective factors for road safety interventions. However, although this method can extract factors with relatively high accuracy, as the accident dataset continues to grow, it can lead to additional labor costs.
In recent years, with the development of artificial intelligence (AI) and natural language processing (NLP) technology, text mining methods such as keyword extraction [15], topic modeling [16,17], text classification [18,19,20,21], and clustering analysis [22,23,24,25] can automatically or semiautomatically obtain valuable information from accident investigation reports and are widely used in accident analysis. In keyword extraction, TF-IDF [26,27] and text-rank [28] not only extract keywords but can also serve as prior knowledge for text classification. For example, Ahadh et al. [29] used YAKE for keyword extraction and as a prior for LDA to identify accident causes, achieving 80% classification accuracy on aviation and pipeline accident datasets. Zhong et al. [30] combined convolutional neural networks (CNN) and LDA to classify 34 types of hazards in construction accidents, achieving an average F1 score of 71%. Building on this, Pan et al. [31] used text-rank and graph convolutional networks (GCNs) to identify accident types and injury types, achieving an average F1 score of 74%. Although these methods can automate the analysis of accident reports, the accuracy of identification is difficult to guarantee.
Named entity recognition (NER), one of the typical tasks in NLP, is a method for identifying entities with specific meanings or significance from text data [32]. In recent years, it has been widely used in various transportation fields such as aviation [33], maritime [34], road transport [35], and railways [36]. NER algorithms aim to identify the locations of entities in unstructured text and classify them into the correct categories [37]. For example, Liu et al. [38] integrated bidirectional long short-term memory (BiLSTM), conditional random fields (CRF), and hidden Markov models (HMM) to identify 71 hazard sources in railway accidents, achieving an F1 score of 98.16%. However, they used 17 text augmentation algorithms to enhance the data. BERT has gained rapid popularity due to its rich word embeddings and low-cost continuous pretraining [39]. Its combination with the BiLSTM-CRF model has been shown to outperform other frameworks across multiple datasets [34,36,40]. However, unlike conventional NER tasks, the risk-factor-related entities we focused on were not general entities (e.g., names of people or places). Therefore, the BERT-BiLSTM-CRF framework needed not only to recognize but to understand the semantics of the entities themselves. This study enhances the semantic understanding capability of BERT by introducing domain-specific corpora for continuous pretraining, aiming to improve the accuracy of risk factor identification.

2.2. Risk Coupling Analysis

In physics, coupling refers to the phenomenon where two or more systems or forms of motion interact through various interactions, influencing each other, resulting in a joint effect [41]. The theory of self-organization posits that interactions between systems represent a universal paradigm of existence, a paradigm referred to as coupling [42]. Coupling analysis is an important method for qualitatively or quantitatively revealing the relationships between accident factors and has been widely used in industries such as road transport [3,43], aviation [17], maritime [7], railways [44], and tunnel operations [45]. Risk coupling refers to the interdependence and influence relationships between risk factors within a system [46]. When certain risk factors in the system exceed their critical thresholds, they may be correlated with other risk factors. If this interrelated impact surpasses the safety threshold of the system, it results in a positive coupling effect, thereby increasing the risk of system failure. For example, Hu et al. [17] based on traffic accident data from highways in the mountainous regions of Yunnan, China, found that the coupling of human–vehicle–road had the greatest impact on the system. Ren et al. [43] used Bayesian networks (BNs) to perform coupling analysis and inference of the risk nodes that lead to system failure before, during, and after hazardous chemical road transportation accidents.
The N-K model uses mutual information to measure the degree of correlation and coupling between system elements and has been widely applied in the quantitative analysis of risk coupling effects [7,42]. For example, Hu et al. [17] based on highway traffic accident data, used the N-K model to measure the coupling relationship between geological and meteorological risk factors. However, they considered only the coupling between two types of factors. Guo et al. [3], based on the analytic hierarchy process (AHP) and the N-K model, quantified the risk coupling degrees between driver, vehicle, hazmat, meteorological environment, road environment, and management in 362 hazardous-goods road transportation accidents in coastal areas. Hu et al. [47], combining the N-K model, AHP, and the theory of variable weights, quantified the coupling relationships between four risk factor types (i.e., human, vehicle, road, and environment) under different driving ages. This study expands on previous research by applying the N-K model to the risk coupling analysis of SA on highways.

3. Methods

3.1. Data Collection and Preprocessing

The data were sourced from 431 traffic accident investigation reports on highways issued by the Ministry of Emergency Management (MEM) of the People’s Republic of China and the relevant emergency management departments of various provinces and cities over the past decade (2014–2024). The accident reports covered 28 provinces, with 364 reports about PA and 67 reports involving SA. Each accident report was documented by the Guidelines for the Preparation of Investigation Reports on Work Safety Accidents (Trial) issued by MEM. The reports included accident processes, causes and nature of accidents, accountability and losses, emergency response processes, key issues exposed by the accidents, and corrective and preventive measures. The accident cause was the primary data source for identifying risk factors and calculating risk coupling values. The remaining parts were used as the domain corpus for continued pretraining of BERT. Finally, each accident report underwent preprocessing involving UTF-8 encoding conversion and the removal of abnormal characters.

3.2. Framework

In this paper, we interpreted risk coupling as the interaction and interdependence between risk factors that contribute to the occurrence of PA or further evolve into SA. To quantify the risk coupling values of accidents and explore the coupling mechanism of different accident categories (ACs), this paper proposes a risk coupling analysis framework for traffic accidents, as depicted in Figure 1. The proposed framework consists of four steps, which are explained further below.
Step 1: Text preprocessing
In Step 1, all accident reports are categorized into PA and SA. Then, the safety risk factors contributing to the occurrence of PA or the evolution into SA are manually extracted. In a former study [48], the authors manually extracted 22 risk factors for PA. This study expanded the scope to 61 risk factors for PA and 45 risk factors for SA, forming a manually labeled set. Finally, according to the types of factors classified in the previous literature [48], these factors are summarized into human (H), vehicle (V), road environment (R), weather (W), and management (M). At this stage, this process relies on expert input and relevant literature.
Step 2: Risk factor identification
In this step, a semiautomated method is developed for extracting traffic accident risk factors, enabling high-precision extraction of risk factors and their types from accident investigation reports, thereby reducing the cost of subsequent risk factor identification. Specifically, a traffic accident risk factor identification model is developed, namely, TRBERT-BiLSTM-CRF, based on domain-specific pretraining and the manually labeled set generated in Step 1. Then, cosine similarity is used for entity alignment to eliminate redundant risk factors. Finally, the risk of PA and SA is identified in the following format:
R i s k   f a c t o r   belongs   to   R i s k   t y p e
Step 3 Risk type mapping and counting
The accident samples are labeled using the five risk types defined in Step 2. For example, if an accident in PA is caused by two risk types, e.g., human and vehicle, this accident is marked as “11000” in PA. This step is repeated in each of the two ACs for all accidents in the dataset so that each accident in the two ACs is assigned a mark. Then, a statistical analysis is performed on the given ACs, calculating the frequency of the combination of different risk types. Since this study examined five risk types, the number of risk types in these combinations ranged from one to five.
Step 4 Risk coupling value generation
Based on the risk type coupling frequency in the given ACs in step 3, the risk coupling probability under different combinations is calculated by Equations (7), (8), (10), and (12). Then, based on the N-K model and mutual information, i.e., Equations (6), (9), (11), and (13), the risk coupling values for two to five risk coupling scenarios in a given AC are generated. Finally, the Wilcoxon signed-rank test is used to perform hypothesis testing on the risk coupling values of the two ACs, exploring the differences in risk coupling between PA and SA.

3.3. Risk Factor Extraction

Extracting risk factors from unstructured text is a critical step in analyzing risk coupling relationships. NER is a widely studied and well-validated task in the field of NLP. Among them, the BERT-BiLSTM-CRF framework has shown superior performance on multiple datasets and has been proven to be superior to other frameworks in NER tasks [34,40]. For high-precision extraction and identification of risk factors in the two ACs, we optimized the BERT-BiLSTM-CRF framework, as shown in Figure 2. Specifically, BERT is a language representation model based on a transformer encoder that can convert text into word embeddings and sentence embeddings [39]. However, since its pretraining is based on general-purpose corpora, its performance in understanding accident risks still has room for improvement. To this end, we performed continued pretraining on BERT using an accident-risk-specific corpus, resulting in the TRBERT model and the TRBERT-BiLSTM-CRF framework. The framework is capable of semiautomatically extracting risk factors and identifying risk types from accident reports, thereby reducing the cost of subsequent risk factor identification.

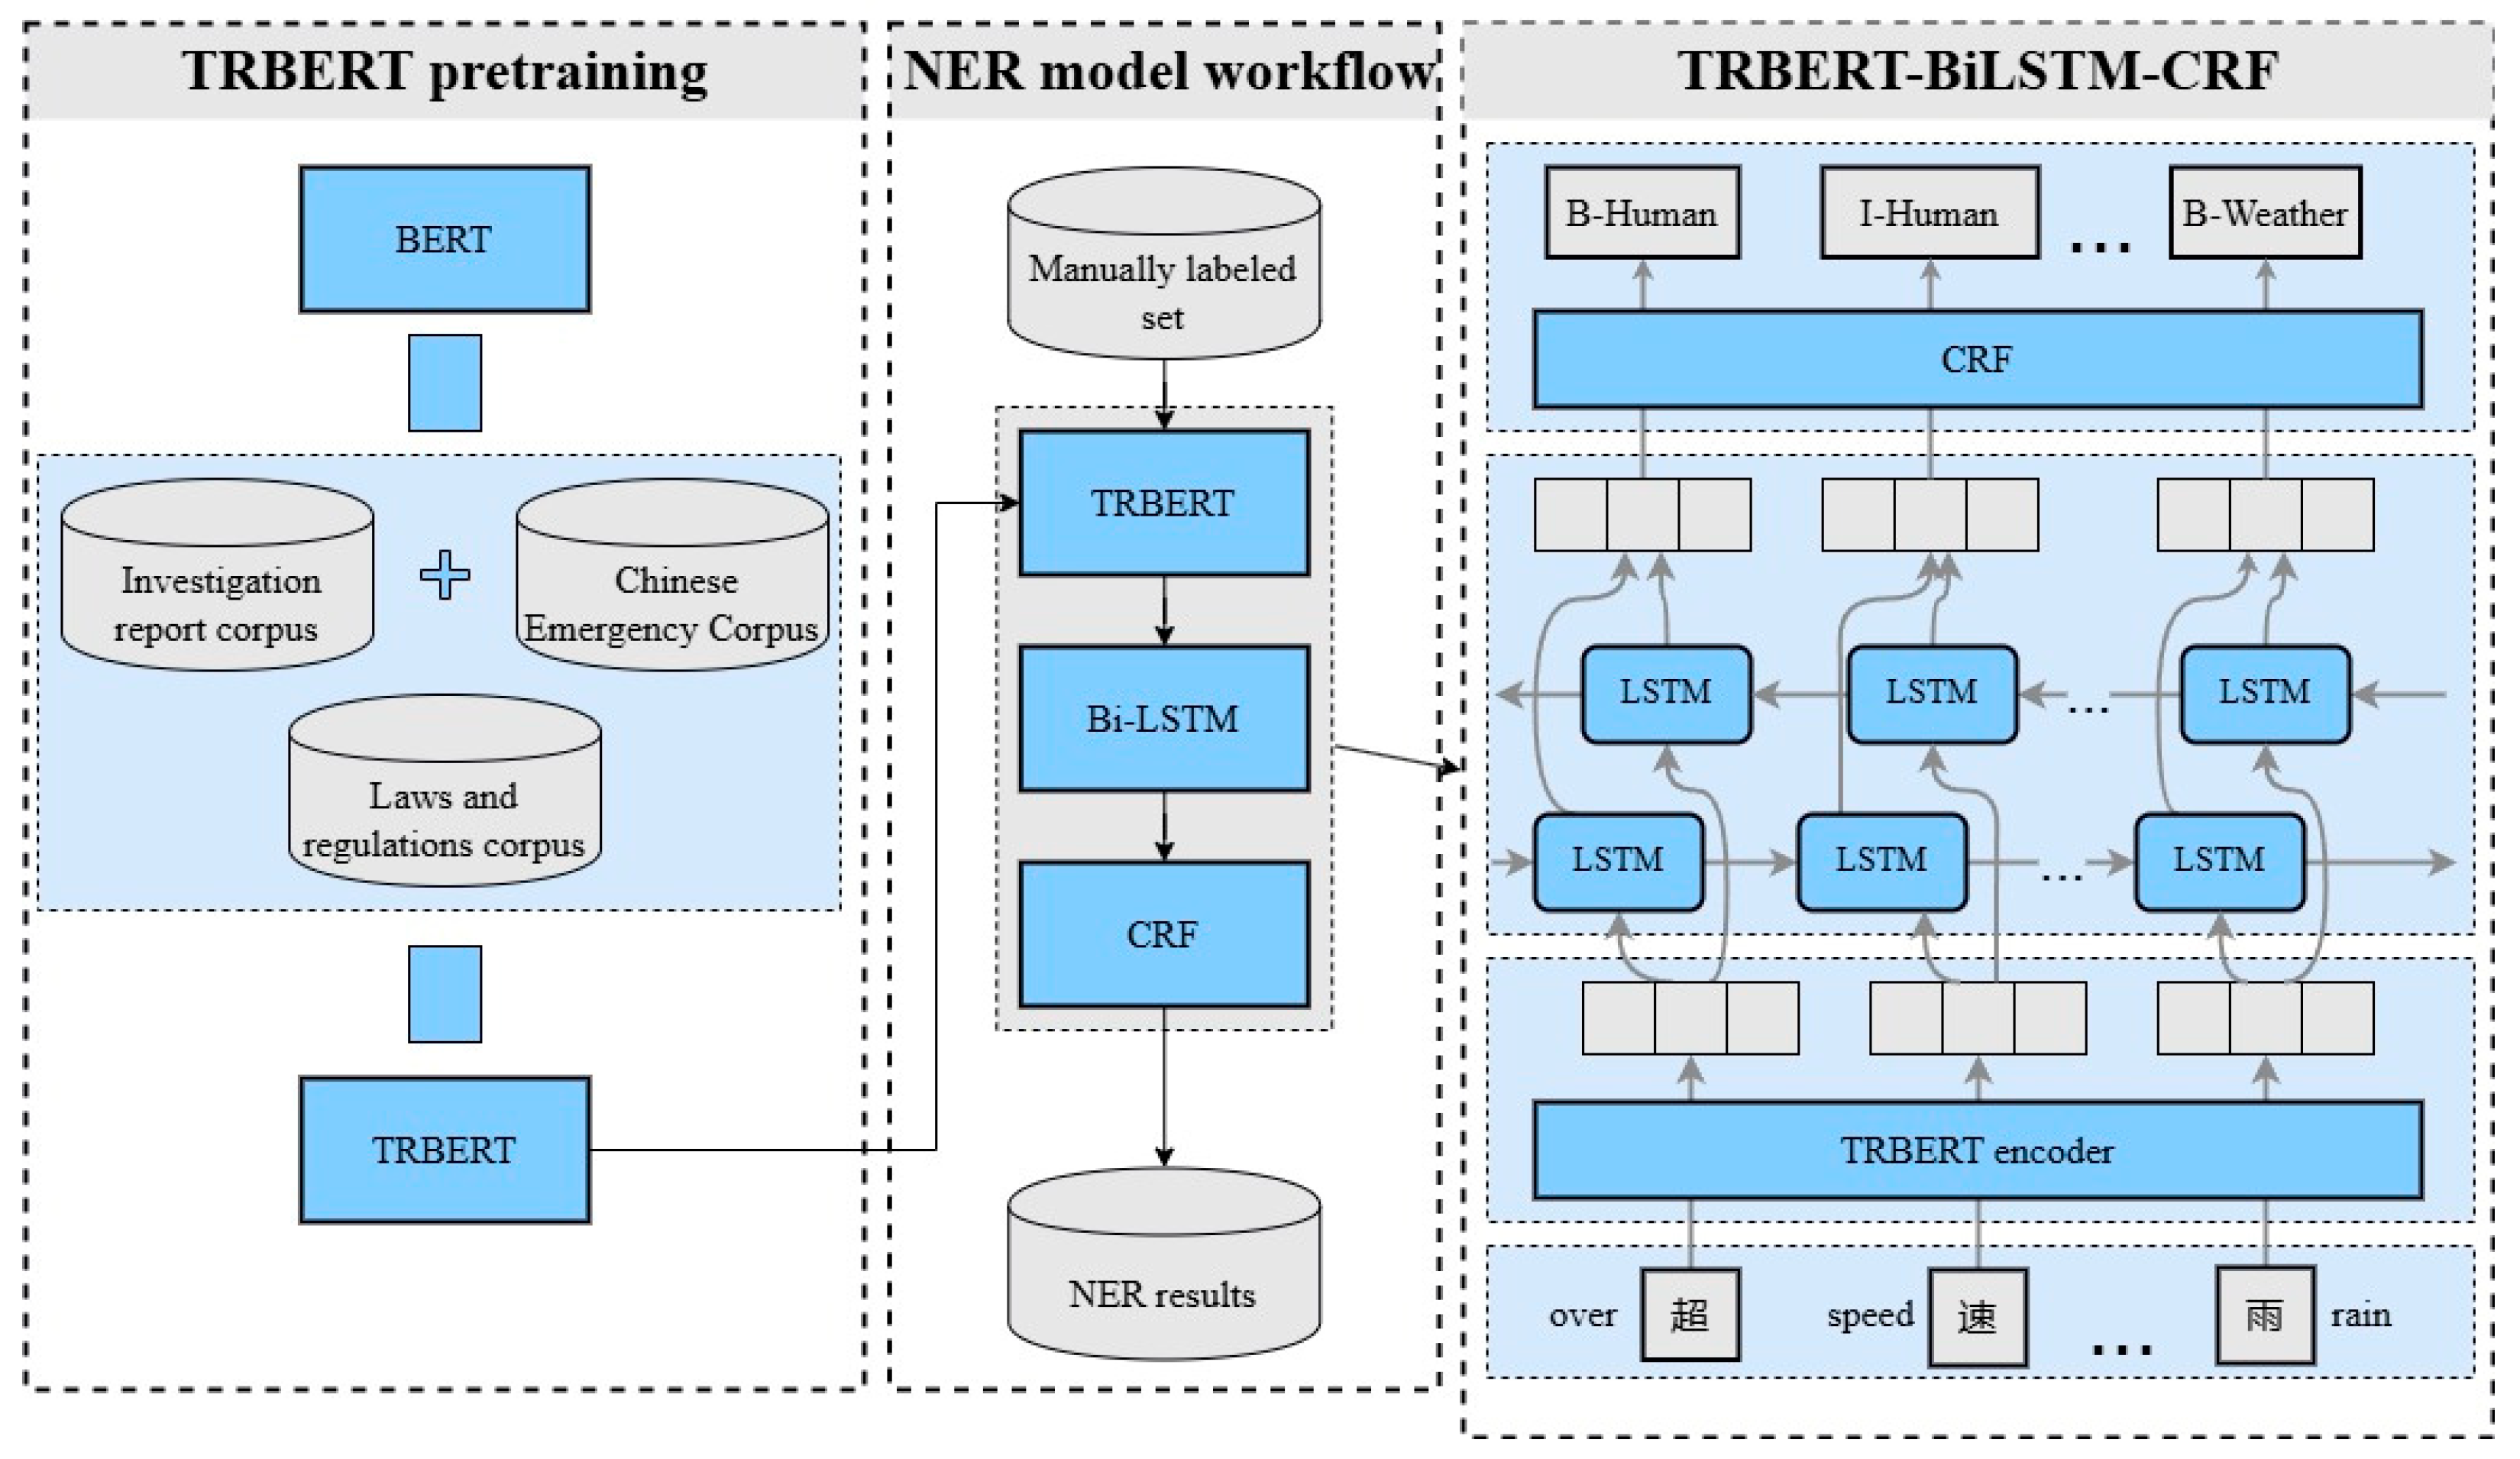
3.3.1. TRBERT Pretraining

BERT employs a transformer encoder with 12 layers as its core architecture, capturing contextual information from surrounding text to produce word embeddings [39]. In addition, BERT leverages the masked language model (MLM) approach to learn contextual semantic information from the corpus. To improve the performance of the pretrained model in terms of accident risk understanding, we followed the training process of the BERT model based on the transformer architecture and developed the pretrained model TRBERT using a specific accident-risk corpus. In a previous study, Liu et al. [34] developed a specific pretraining model for the maritime domain, and we followed the same practice in the continuous pretraining of BERT. Specifically, given a character sequence c = c 1 , c 2 , c T , 15% of the input characters are randomly selected for processing; 80% of these characters are randomly replaced for [MASK] tokens, 10% are replaced with any random token, and the remaining 10% remain the original tokens [39]. Given the hidden outputs of the last layer h 1 L , h 2 L , , h T L , for each mask character c t in a character sequence, the predicted probability p c t c < t c > t of the MLM is calculated as follows [49]:
p c t c < t c > t = exp E c T c t h t L + b c t c V exp E c T c h t L + b c
where E c is the character embedding lookup table and V is the character vocabulary.
The domain-specific corpus originated from accident investigation reports, the Chinese Emergency Corpus (CEC), and law and regulation documents, totaling 546 MB and approximately 600,000 sentences, as shown in Table 1. Notably, to avoid contamination of the NER dataset, the accident cause section in the report was excluded from the pretraining corpus.

3.3.2. TRBERT-BiLSTM-CRF

TRBERT transforms the input accident cause text sequence c = c 1 , c 2 , c m into a word embedding e = e 1 , e 2 , e m , which can be further fine-tuned on the labeled text [40]. BiLSTM obtains context-aware word embeddings from the TRBERT encoder to further model the long-distance dependencies of the character sequences so as to capture more sequence features [34]. BiLSTM extends the classical LSTM by introducing additional LSTMs: one LSTM models the sequence in a forward direction l = l 1 , l 2 , , l m , and the other LSTM models the sequence in a backward direction l = l 1 , l 2 , , l m . The forward and backward sequences are then combined to form a complete BiLSTM output l = l 1 , l 2 , , l m [50].
The CRF serves as the final decoding layer and is used to generate a sequence of predicted labels for named entities [51,52]. Given the output sequence l = l 1 , l 2 , , l m of the BiLSTM, the CRF produces the predicted label sequence y = y 1 , y 2 , , y m , the prediction score S c o r e l , y is defined as:
S c o r e l , y = i = 1 m T y i , y i + 1 + i = 1 m P i , y i
where T is the transition matrix, T y i , y i + 1 denotes the transition probability from label y i to label y i + 1 , and P i , y i denotes the probability of the i - th character being assigned to the label y i . The conditional probability of generating the label sequence y is calculated as follows:
p y l = e S c o r e l , y y ~ Y e S c o r e l , y ~
where Y represents the set of all possible label sequences and y ~ represents a specific label sequence in the set. The training objective of CRF is to iteratively optimize the model parameters to maximize the conditional probability of the true label sequence, thereby minimizing the negative log-likelihood loss. With y as the true label sequence, the CRF loss function is shown as:
L = ( S c o r e ( l , y ) ln ( y ~ Y e S c o r e l , y ~ ) )

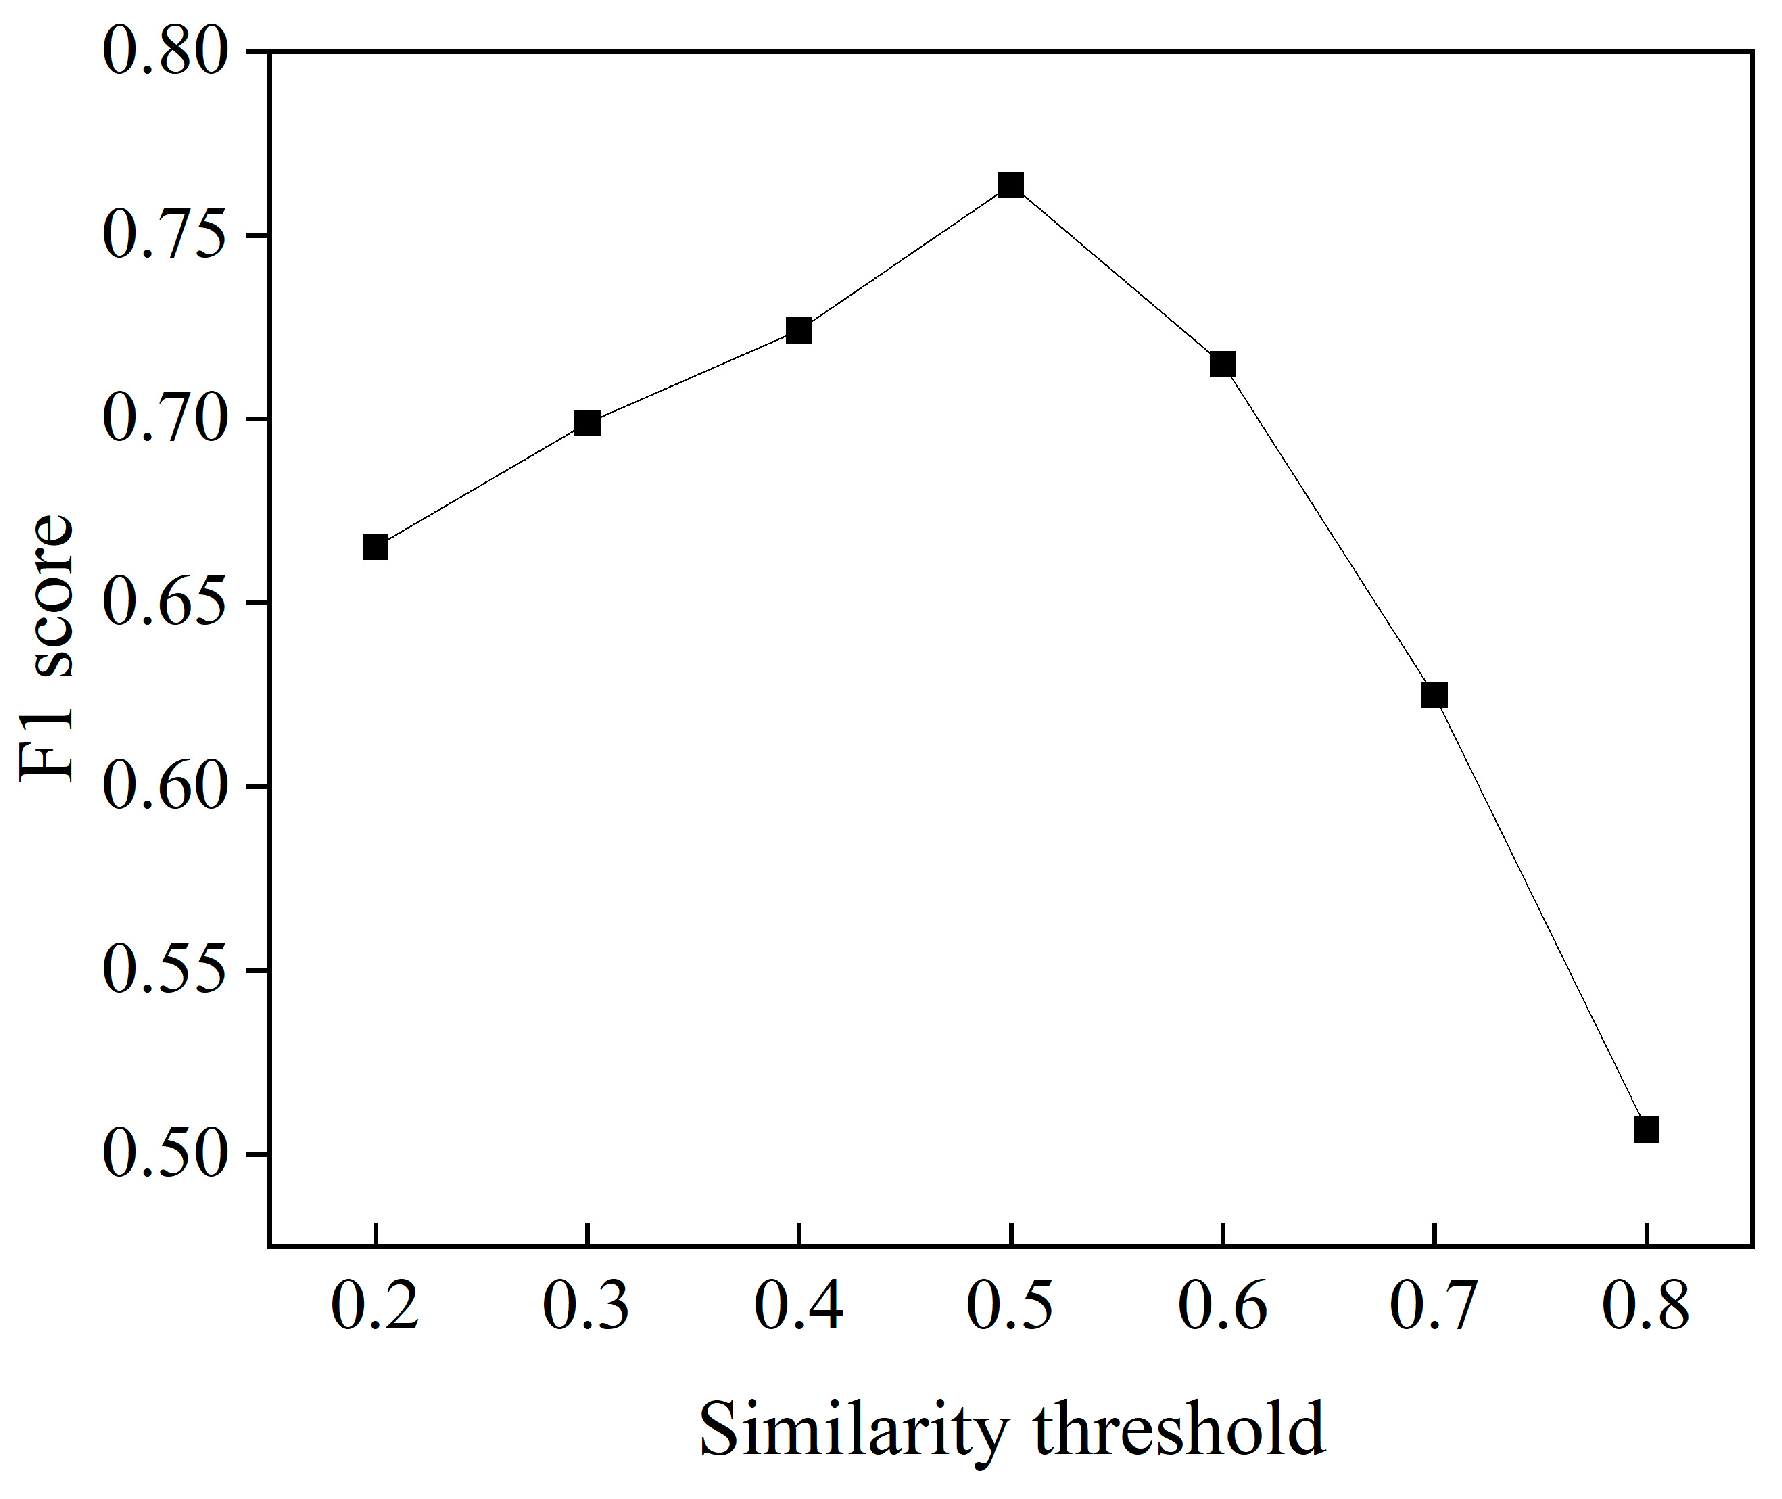
3.3.3. Entity Alignment

In this study, risk factors were regarded as a type of entity. In the process of identifying risk factors, variations in the descriptions of the same risk factor across different reports may lead to entity redundancy. For example, “speeding” and “exceeding the maximum speed indicated by the speed limit sign” represent the same risk factor. Therefore, it was necessary to perform entity alignment to eliminate redundant risk factors. To achieve this, we used cosine similarity to represent the semantic similarity between entities.
The pretrained TRBERT maps entities to a high-dimensional vector space, i.e., word embedding e = e 1 , e 2 , , e m . Given entities e a = e 1 a , e 2 a , , e 3 a and e b = e 1 b , e 2 b , , e 3 b , the cosine similarity between the two embeddings is calculated as shown in Equation (5). Risk factors with similarity scores exceeding a specified threshold are regarded as the same risk factor.
S i m i l a r i t y e a , e b = cos θ = e a e b e a e b = i = 1 m e i a × e i b i = 1 m ( e i a ) 2 × i = 1 m ( e i b ) 2

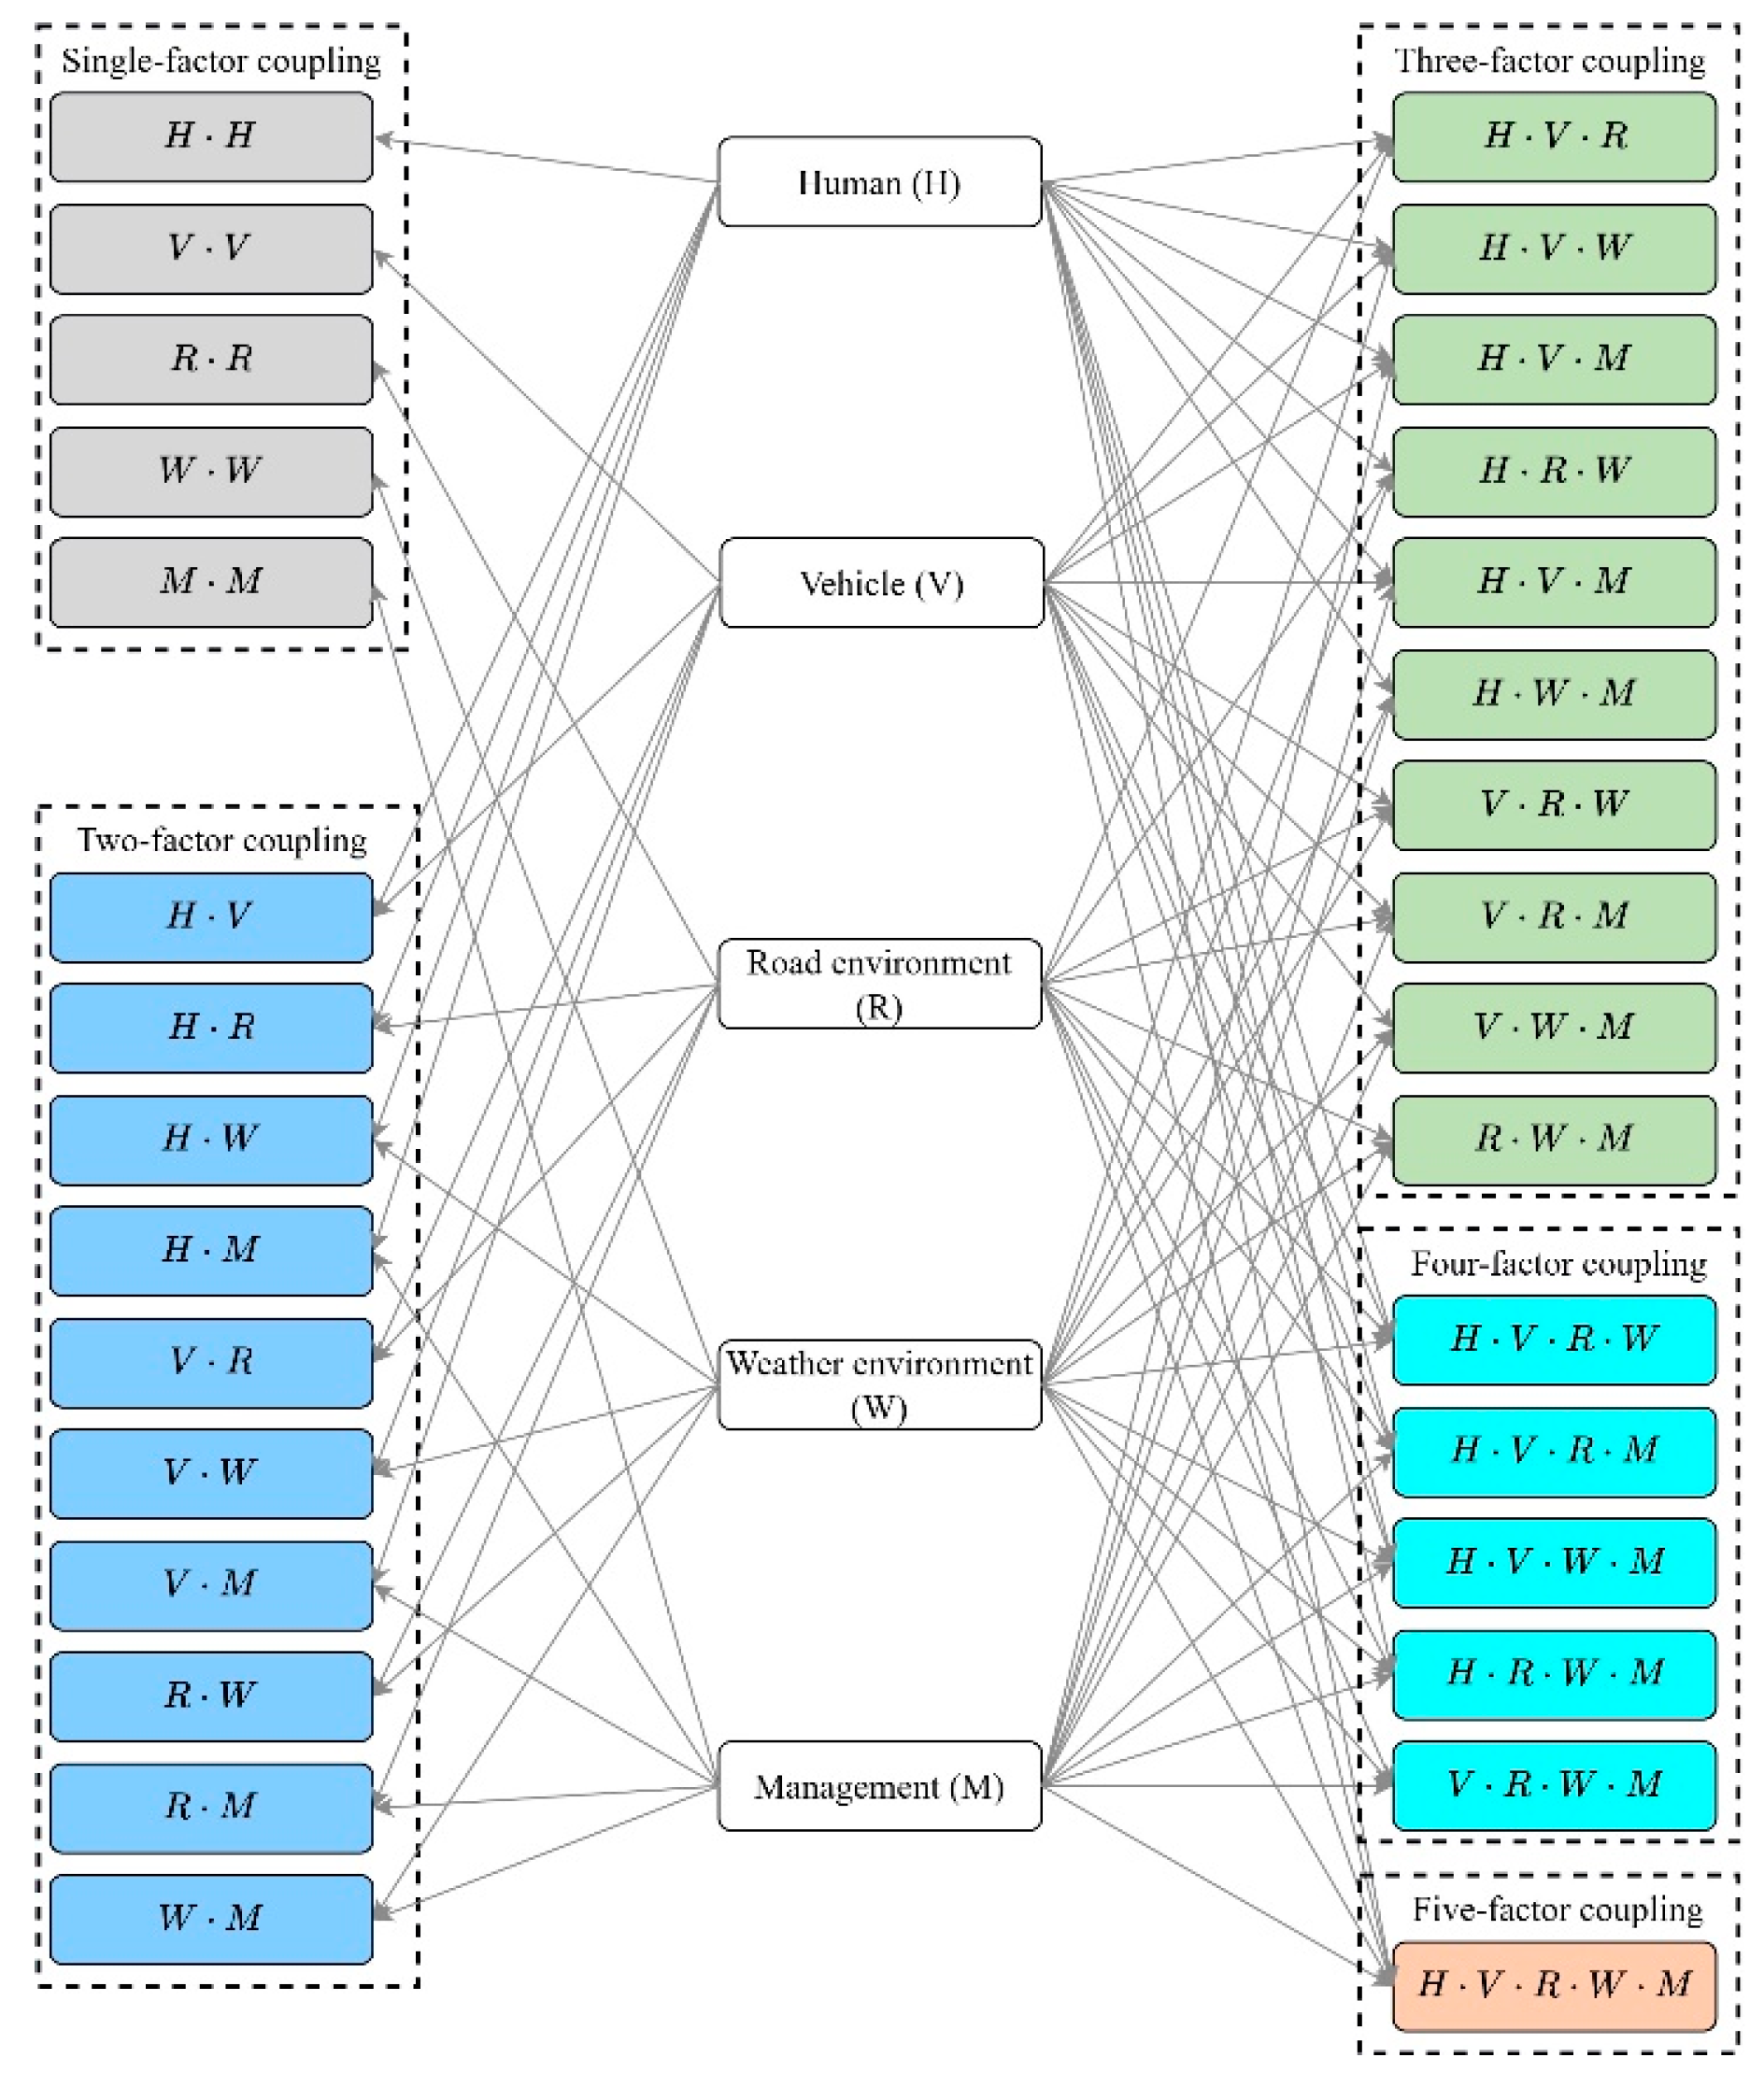
3.4. Risk Factor Coupling Analysis

Risk coupling refers to the interactions and interdependencies between systems or among risk factors within a system [53]. This study interpreted risk coupling as the mutual interaction and mutual dependencies among risk factors that lead to accidents or drive accident evolution. When two or more risk factors in the five risk types of human, vehicle, road environment, weather, and management are coupled, the equilibrium state of the system is disrupted, resulting in coupling risk [54]. If the coupling risk exceeds the tolerable threshold of the system, a positive coupling effect is triggered, leading to the occurrence of PA or the evolution into SA. The risk coupling types as shown in Figure 3.

3.4.1. N-K Model

The N-K model was initially developed to address problems in biological adaptive evolution [55]. In the field of risk assessment, the N-K model has been applied to analyze the coupling relationships and quantify the extent of dependency among multiple risk factors [3,56,57]. In recent years, it has evolved into a theoretical framework for analyzing the interdependencies among elements in complex systems.
In the N-K model, N represents the number of elements involved in the system, and K represents the number of coupling relationships among these N elements. Generally, K 0 , N 1 , and when K 0 , N 1 , the state of the system is affected by two or more elements. In our study, the system elements were the risk factor types, namely human (H), vehicle (V), road environment (R), weather (W), and management (M). The coupling relationship was determined by the co-occurrence relationship among risk types that led to an accident or further evolution. To this end, h , v , r , w , and m with binary numbers 0 and 1, i.e., h , v , r , w , m 0,1 , were used to represent the state of these five risk factor types in an accident. For example, if an accident involves human-related risk factors, then h = 1 ; otherwise, h = 0 .
A common approach to quantifying the coupling values between risk factors is to calculate the mutual information between them [3,57]. Given that mutual information T n , m X 1 , X 2 , , X n represents the coupling value of the combination of the n - th coupling scenario among N risk coupling types, X i is the i - th risk type, i 1,2 , n . In our study, N = 5,1 i 5 . For example, if n = 2 , and there were 10 coupling scenarios (i.e., combinations of the five risk factor types) of the two-factor coupling type, m 1,2 , 10 . Specifically, m = 1 , X 1 = H , and X 2 = V , T 2,1 H , V represents the risk coupling value in the human–vehicle coupling scenario of the two-factor coupling type. Since single-factor coupling involves the exchange of information and energy within a single system, it is generally considered a special case of multifactor risk coupling and cannot be calculated using mutual information to determine the coupling values [58]. Therefore, there were four risk coupling types: two-factor coupling, three-factor coupling, four-factor coupling, and five-factor coupling. These four coupling types corresponded to 10, 10, 5, and 1 coupling scenarios, respectively.
The risk coupling value for the two-factor coupling type was calculated as follows:
T 2,1 H , V = h v P h , v log 2 P h , v P h P v T 2,2 H , R = h r P h , r log 2 P h , r P h P r T 2,3 H , W = h w P h , w log 2 P h , w P h P w T 2,4 H , M = h m P h , m log 2 P h , m P h P m T 2,5 V , R = v r P v , r log 2 P v , r P v P r T 2,6 V , W = v w P v , w log 2 P v , w P v P w T 2,7 V , M = v m P v , m log 2 P v , m P v P m T 2,8 R , W = r w P r , w log 2 P r , w P r P w T 2,9 R , M = r m P r , m log 2 P r , m P r P m T 2,10 W , M = w m P w , m log 2 P w , m P w P m
where P h , v , P h , r , P h , w , P h , m , P v , r , P v , w , P v , m , P r , w , P r , m , and P w , m represent the joint probabilities (or coupling probabilities) of two-factor risk. Taking P h , v as an example, it is calculated as follows:
P h , v = r w m P h v r w m
where P h v r w m represents the frequency of the combinations of the five risk factors. For example, in this study, there are no cases without risk coupling. This indicates that if h , v , r , w , m = 0 , then P h v r w m = P 00000 = 0 . Given 0 or 1 mapped to h and v , and pointing to r , w , m 0,1 , with P 00 , P 01 , P 10 and P 11 , and P 00 + P 10 + P 01 + P 11 = 1 . Furthermore, in P 10 , h = 1 , v = 0 , and r , w , m 0,1 , P 10 is the sum of all P h v r w m with h = 1 and v = 0 . This means that it requires calculating the frequency of accident samples where human-related risk is present and vehicle-related risk is absent, independent of the other three risk types.
P h , P v , P r , P w and P m represent the probability of a single risk type. Taking P h as an example, it is calculated as follows:
P h = v r w m P h v r w m
Given 0 or 1 mapped to h , and pointing to v , r , w , m 0,1 , with P 0 and P 1 , and P 0 + P 1 = 1 . In P 1 , h = 1 , v , r , w , m 0,1 , and P 1 is the sum of all P h v r w m with h = 1 . This means that it requires calculating the frequency of accident samples where human-related risk is present, independent of the other four risk types.
Similarly, the risk coupling value for the three-factor coupling type was calculated as follows:
T 3,1 H , V , R = h v r P h , v , r log 2 P h , v , r P h P v P r T 3,2 H , V , W = h v w P h , v , w log 2 P h , v , w P h P v P w T 3,3 H , V , M = h v m P h , v , m log 2 P h , v , m P h P v P m T 3,4 H , R , W = h r w P h , r , w log 2 P h , r , w P h P r P w T 3,5 H , R , M = h r m P h , r , m log 2 P h , r , m P h P r P m T 3,6 H , W , M = h w m P h , w , m log 2 P h , w , m P h P w P m T 3,7 V , R , W = v r w P v , r , w log 2 P v , r , w P v P r P w T 3,8 V , R , M = v r m P v , r , m log 2 P v , r , m P v P r P m T 3,9 V , W , M = v w m P v , w , m log 2 P v , w , m P v P w P m T 3,10 R , W , M = r w m P r , w , m log 2 P r , w , m P r P w P m
where P h , v , r , P h , v , w , P h , v , m , P h , r , w , P h , r , m , P h , w , m , P v , r , w , P v , r , m , P v , w , m , and P r , w , m represent the joint probabilities of three-factor risk. Taking P h , v , r as an example, it is calculated as follows:
P h , v , r = w m P h v r w m
The risk coupling value for the four-factor coupling type was calculated as follows:
T 4,1 H , V , R , W = h v r w P h , v , r , w log 2 P h , v , r , w P h P v P r P w T 4,2 H , V , R , M = h v r m P h , v , r , m log 2 P h , v , r , m P h P v P r P m T 4,3 H , V , W , M = h v w m P h , v , w , m log 2 P h , v , w , m P h P v P w P m T 4,4 H , R , W , M = h r w m P h , r , w , m log 2 P h , r , w , m P h P r P w P m T 4,5 V , R , W , M = v r w m P v , r , w , m log 2 P v , r , w , m P v P r P w P m
where P h , v , r , w , P h , v , r , m , P h , v , w , m , P h , r , w , m , and P v , r , w , m represent the joint probabilities of four-factor risk. Taking P h , v , r , w as an example, it is calculated as follows:
P h , v , r , w = m P h v r w m
The risk coupling value for the five-factor coupling was calculated as follows:
T 5 H , V , R , W , M = h v r w m P H , V , R , W , M log 2 P H , V , R , W , M P H P V P R P W P M

3.4.2. Wilcoxon Signed-Rank Test

The Wilcoxon signed-rank test, proposed by F. Wilcoxon, is a nonparametric statistical test method [59]. The Wilcoxon signed-rank test determines whether the differences between two paired samples are statistically significant by comparing the signs and ranks of the differences. This method was developed based on the sign test for paired observational data, offering greater efficiency compared to the traditional test that relies solely on positive and negative signs. In the previous section, we can calculate the risk coupling values for different coupling types in both PA and SA. Importantly, the coupling scenarios in PA and SA are identical, forming paired samples. For example, T 2,1 H , V in both PA and SA represents human–vehicle coupling. Therefore, we applied the Wilcoxon signed-rank test to compare the 26 risk coupling values in PA and SA and tested two hypotheses:
  • H0: There is no significant difference in the risk coupling values between PA and SA;
  • H1: There is a significant difference in the risk coupling values between PA and SA.
If the p-value in the test is less than 0.05, H0 is rejected; otherwise, it is not.

4. Results

4.1. Performance of the Risk Factor Identification Model

The risk factor annotation follows the common BIO annotation strategy, where “B-X” indicates that the character belongs to type X and is the beginning character of an entity, “I-X” indicates that the character belongs to type X and is the internal character of an entity, and “O” indicates that the character does not belong to any type. We used Label Studio to annotate five entity categories, namely human, vehicle, road, weather and management. Since PA and SA have the same entity types and most of the entities are consistent, the data samples of PA and SA were annotated and trained together. Consistently with prior studies [40], the annotated dataset was divided into training, validation, and testing sets with an 8:1:1 ratio to ensure reliable evaluation. Noticeably, since BERT has a maximum input sequence length of 512, and the dataset in this study generally exceeded this limit, we split the paragraph set into a sentence set during the model training and optimization phases to ensure the integrity of risk factor identification for individual accident samples. During the risk factor extraction phase, the recognition results were then merged.
The model development was conducted using Python 3.7. During the model training, the grid search method was chosen to find the optimal parameter settings for the models. The final hyperparameters of the model were tuned as shown in Table 2. We compared our proposed model with several mainstream NER models on our dataset. The three NER models were BiLSTM-CRF [60], BERT-BiLSTM-CRF [40], and RoBERTA-BiLSTM-CRF [61]. To ensure the credibility of the experimental results, all NER experiments were repeated five times to report the final average performance.
The model performance was evaluated by p r e c i s i o n , r e c a l l , and f 1 s c o r e , defined as follows [36]:
p r e c i s i o n = T P T P + F P
r e c a l l = T P T P + F N
f 1 s c o r e = 2 p r e c i s i o n r e c a l l p r e c i s i o n + r e c a l l
where T P , F P , and F N represent the true positive, false positive, and false negative rates of the prediction results, respectively. A risk factor was considered T P only when its start position, end position, and type were all accurately recognized. Furthermore, we also calculated the micro average m i c r o   a v g , macro average m a c r o   a v g , and weighted average w e i g h t e d   a v g to assess the test results of the model according to Equations (17)–(19) [36].
m i c r o   a v g = m i c r o   p r e c i s i o n = ( i = 1 n T P i ) / ( i = 1 n T P i + i = 1 n F P i ) m i c r o   r e c a l l = ( i = 1 n T P i ) / ( i = 1 n T P i + i = 1 n F N i ) m i c r o   f 1 s c o r e = 2 m i c r o   p r e c i s i o n m i c r o   r e c a l l m i c r o   p r e c i s i o n + m i c r o   r e c a l l
m a c r o   a v g = i = 1 n i n d i c a t o r n
w e i g h t e d   a v g = i = 1 n i n d i c a t o r i × s u p p o r t i i = 1 n s u p p o r t i
where n is the number of entity categories, i n d i c a t o r = p r e c i s i o n , r e c a l l , f 1 s o c r e , and s u p p o r t is the number of entities in the corresponding entity category.
Table 3 presents the macro average results for five entities across four models. The results showed that our proposed TRBERT-BiLSTM-CRF model achieved the best performance. By introducing the pretrained language model, there was a significant improvement in performance, with the macro-F1 score increasing by approximately 10% compared with the model that was not pretrained on a specific corpus. This highlights the effectiveness of incorporating a domain-specific corpus for the NER task.
We also tested the performance of the TRBERT-BiLSTM-CRF model on different entities, as shown in Table 4. It is worth noting that the precision and recall rates for the ROAD and WEATHER were higher because their corresponding entity descriptions are more singular, while other entities have wide varieties, inconsistent descriptions, and unclear boundaries. Additionally, the limited descriptions of the MANAGEMENT corresponding entities in the domain-specific corpus are also a reason for its poor performance. In short, the TRBERT-BiLSTM-CRF model could accurately and automatically extract risk factors and risk types from accident reports, laying the foundation for subsequent risk coupling analysis.

4.2. Risk Factor Extraction

The trained and optimized TRBERT-BiLSTM-CRF model was applied to PA and SA reports to extract risk factors and risk types, respectively. Subsequently, a sensitivity analysis of the similarity threshold was conducted. Specifically, we manually labeled 600 pairs of risk factors to evaluate the F1 score at different similarity thresholds and determine the optimal threshold. Figure 4 shows the F1 score at different similarity thresholds. The results showed that a similarity threshold of 0.5 yielded a higher F1 score and accurately distinguished risk factors. Additionally, we found that, compared with higher thresholds, lower thresholds achieved higher F1 scores, which could be attributed to the presence of many entities in the dataset that had low similarity but were still correctly matched.
On this basis, the similarity threshold was set to 0.5, and redundant risk factors were removed using the cosine similarity method. Figure 5 presents the entity deduplication results for the five risk types in PA and SA. The redundancy of the “management” risk type was the highest, possibly because the associated risk factor descriptions were relatively vague and frequently mentioned. Finally, 61 and 45 risk factors, along with five risk types, were extracted from PA and SA, respectively, as listed in Table A1 and Table A2 in Appendix A.

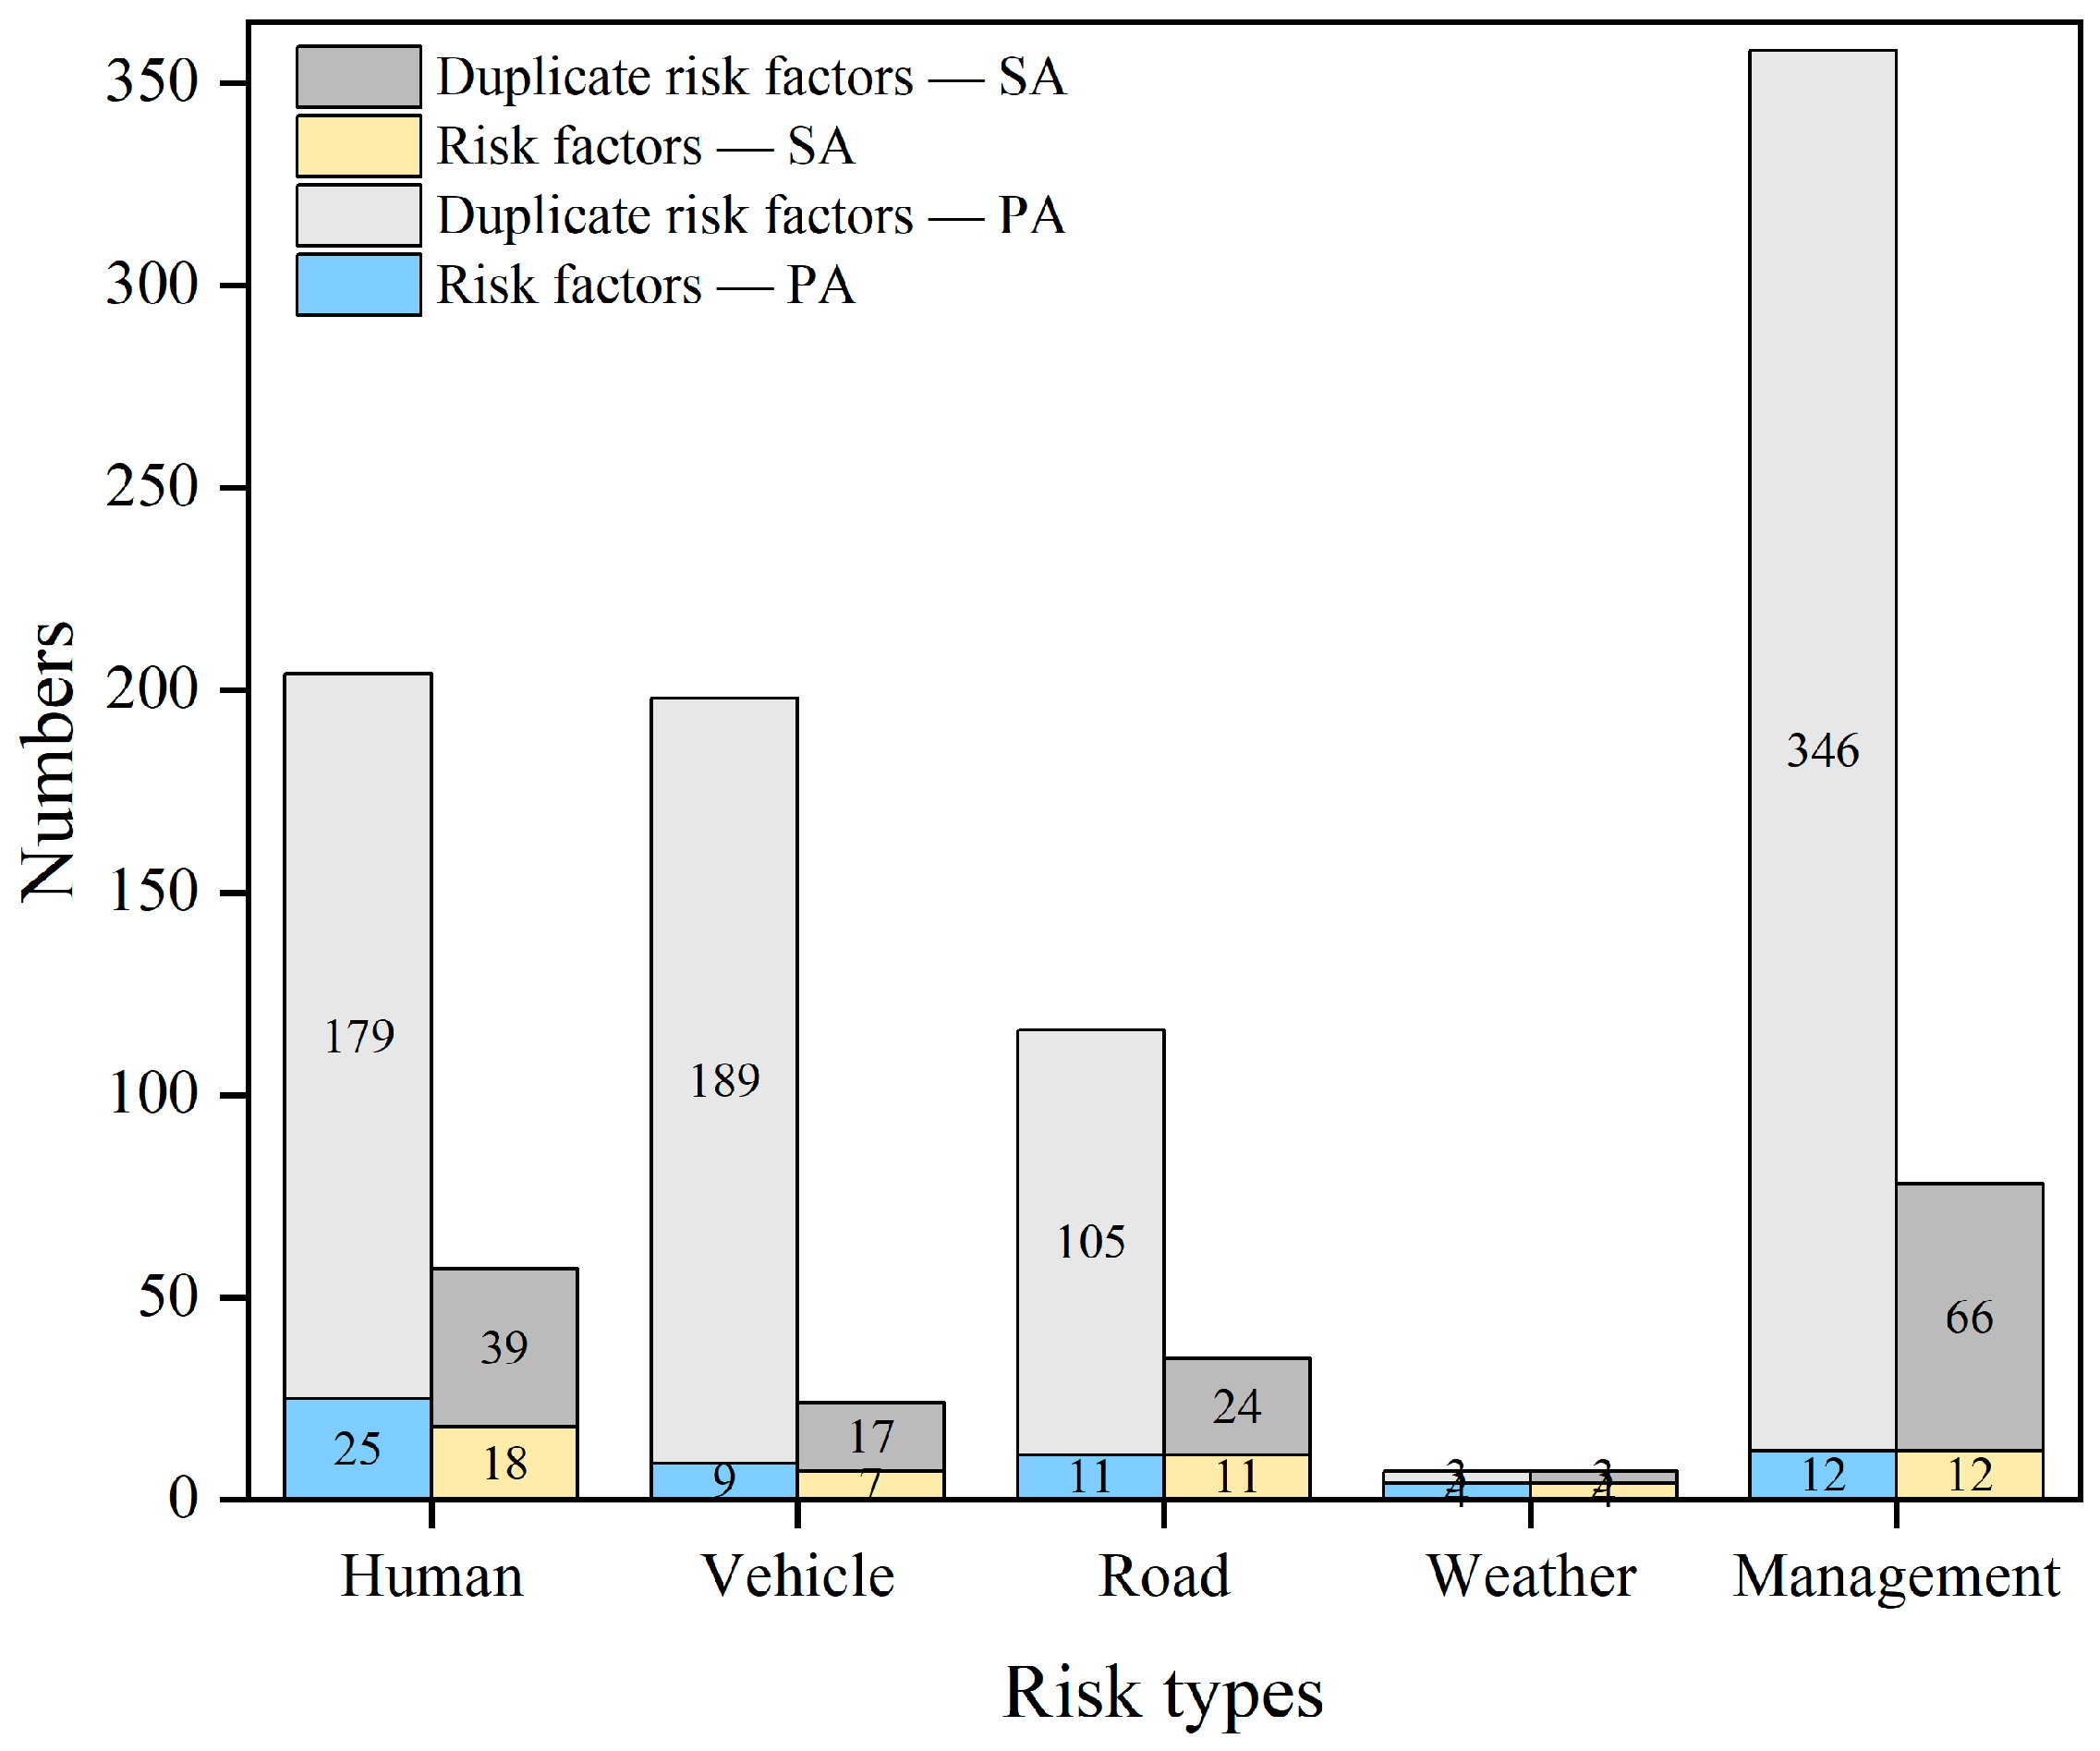
4.3. Risk Type Mapping and Counting

As discussed in the previous section, the risk factors and their corresponding risk types were extracted for each accident sample. Then, a binary mapping of risk types was applied to each sample in different ACs, with duplicate risk types removed. This involved assigning values of 0 or 1 to h , v , r , w , and m , resulting in a five-bit encoding. For example, given an accident sample in PA, if the accident involved only human factors, then h = 1 , v = 0 , r = 0 , w = 0 , and m = 0 . The status encoding for H, V, R, W, and M was “10000”. By performing binary mapping on all accident samples in PA and SA, the risk type status encoding for each accident sample was obtained, and the quantity and frequency of the status encodings were counted. Figure 6 and Figure 7 show the frequencies of different risk type status encodings in PA and SA, respectively.
As shown in Figure 6, the risk types in PA were generally balanced. Specifically, in accident samples involving a single risk type, accidents with the status encoding “10000” occurred most frequently, while accidents with status encodings “00010” and “00001” had frequencies of zero. This indicates that isolated weather and management factors do not lead to accidents. An interesting phenomenon was that, for accidents involving four risk factors, the combination of human, vehicle, road, and management factors (status encoding “11101”) occurred most frequently, while the combination without human factors (status encoding “01110”) occurred at a much lower frequency. This suggests that human factors may be the primary driving force behind the occurrence of accidents. The same phenomenon was also observed in SA, as shown in Figure 7. In SA involving three risk factors, the combination of human, vehicle, and management factors (status encoding “11001”) occurred most frequently, while the combination of only vehicle and management factors (status encoding “01001”) occurred with a frequency of only 0.0192. In addition, nearly half of the accident samples involved three risk types in SA. This was also a key difference between PA and SA.

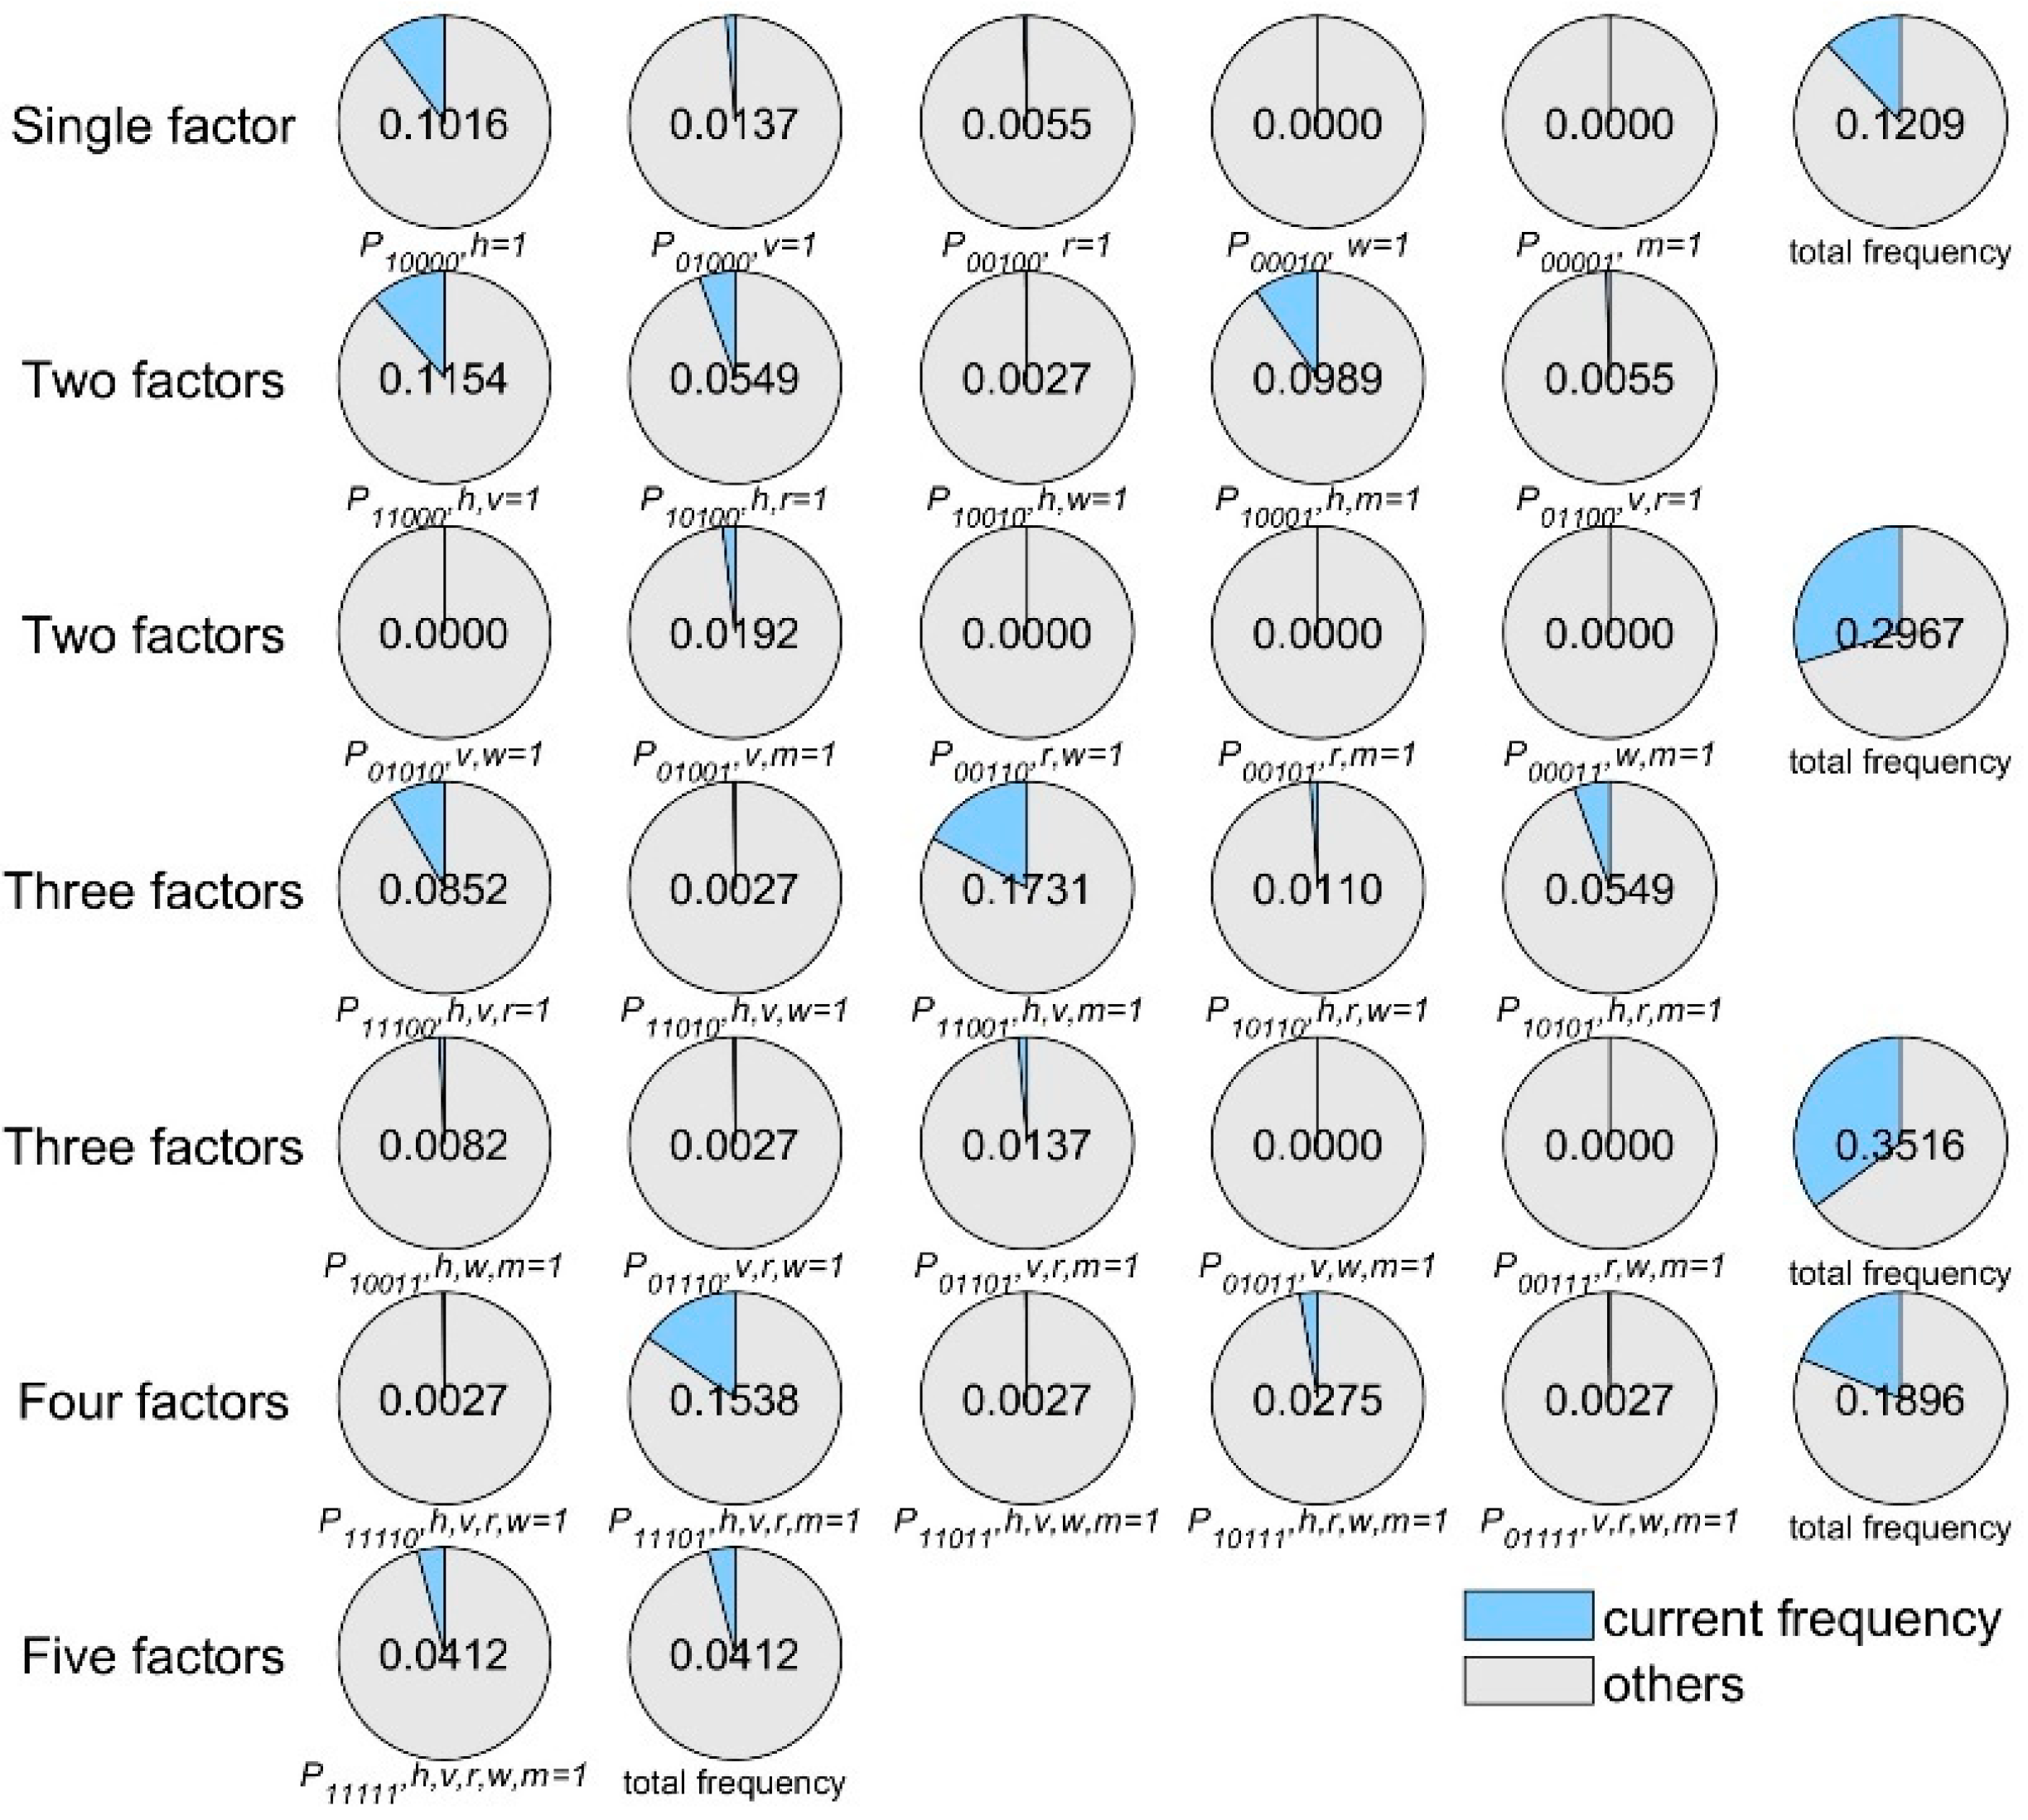
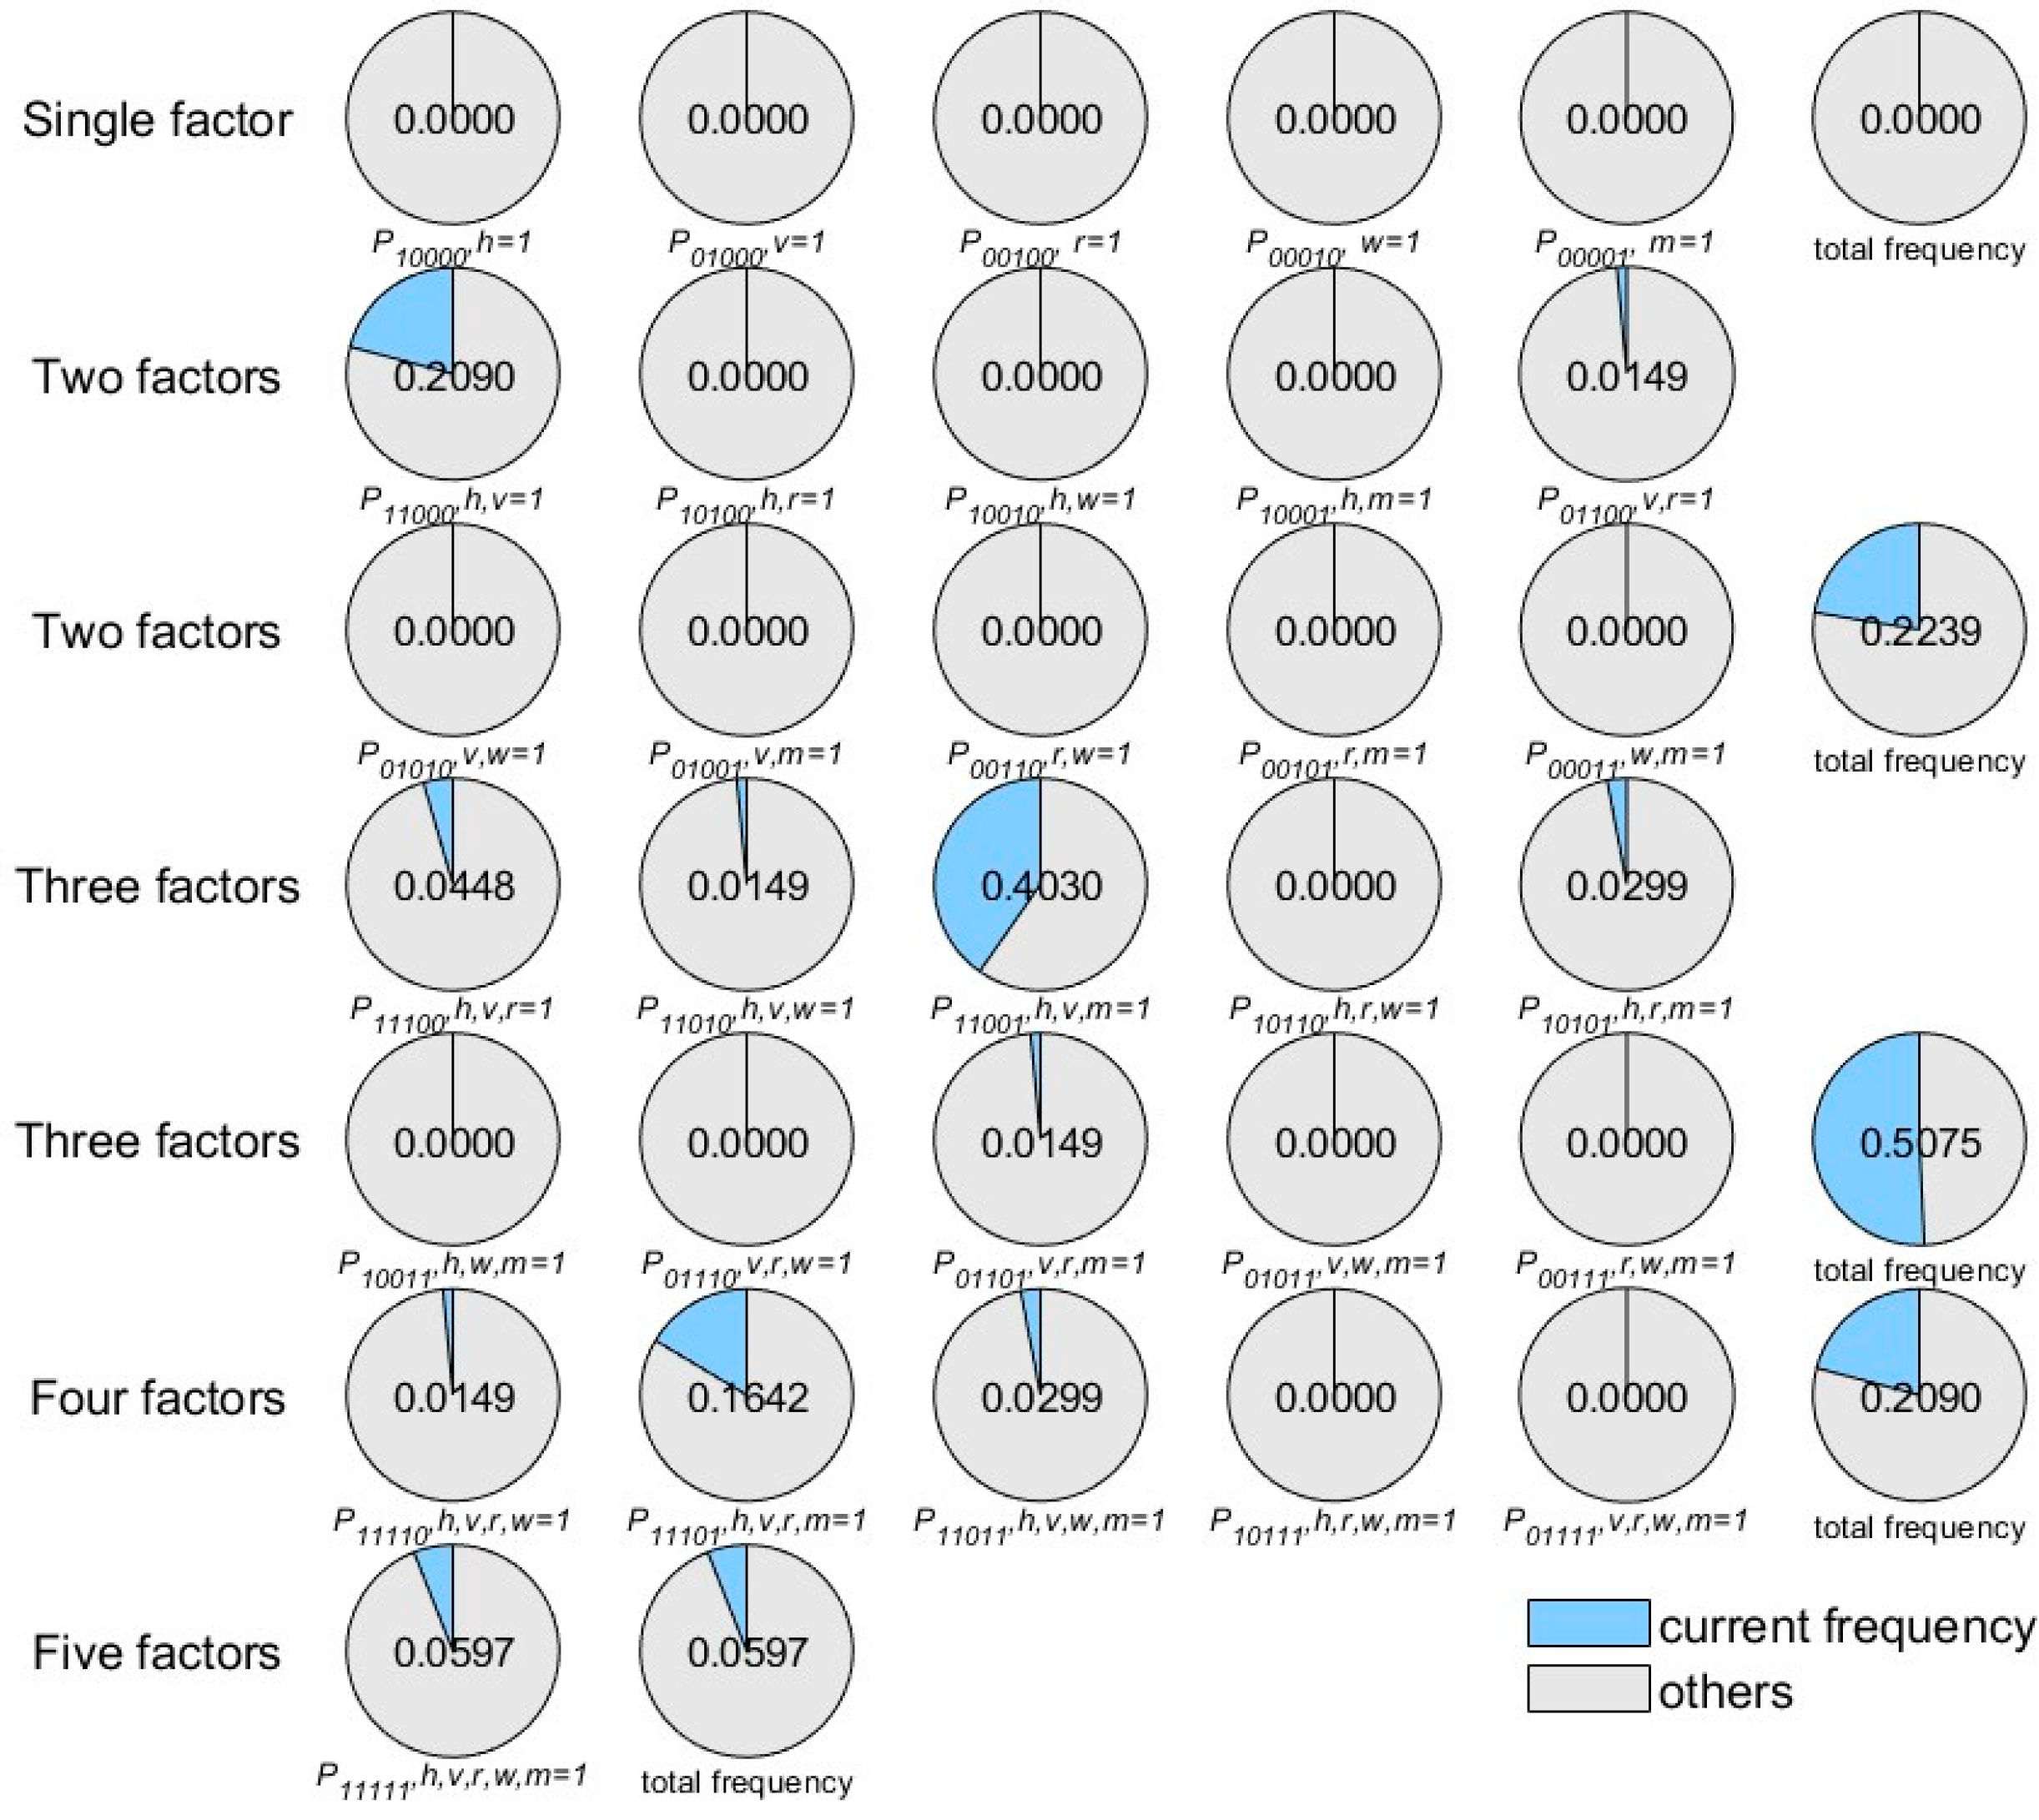
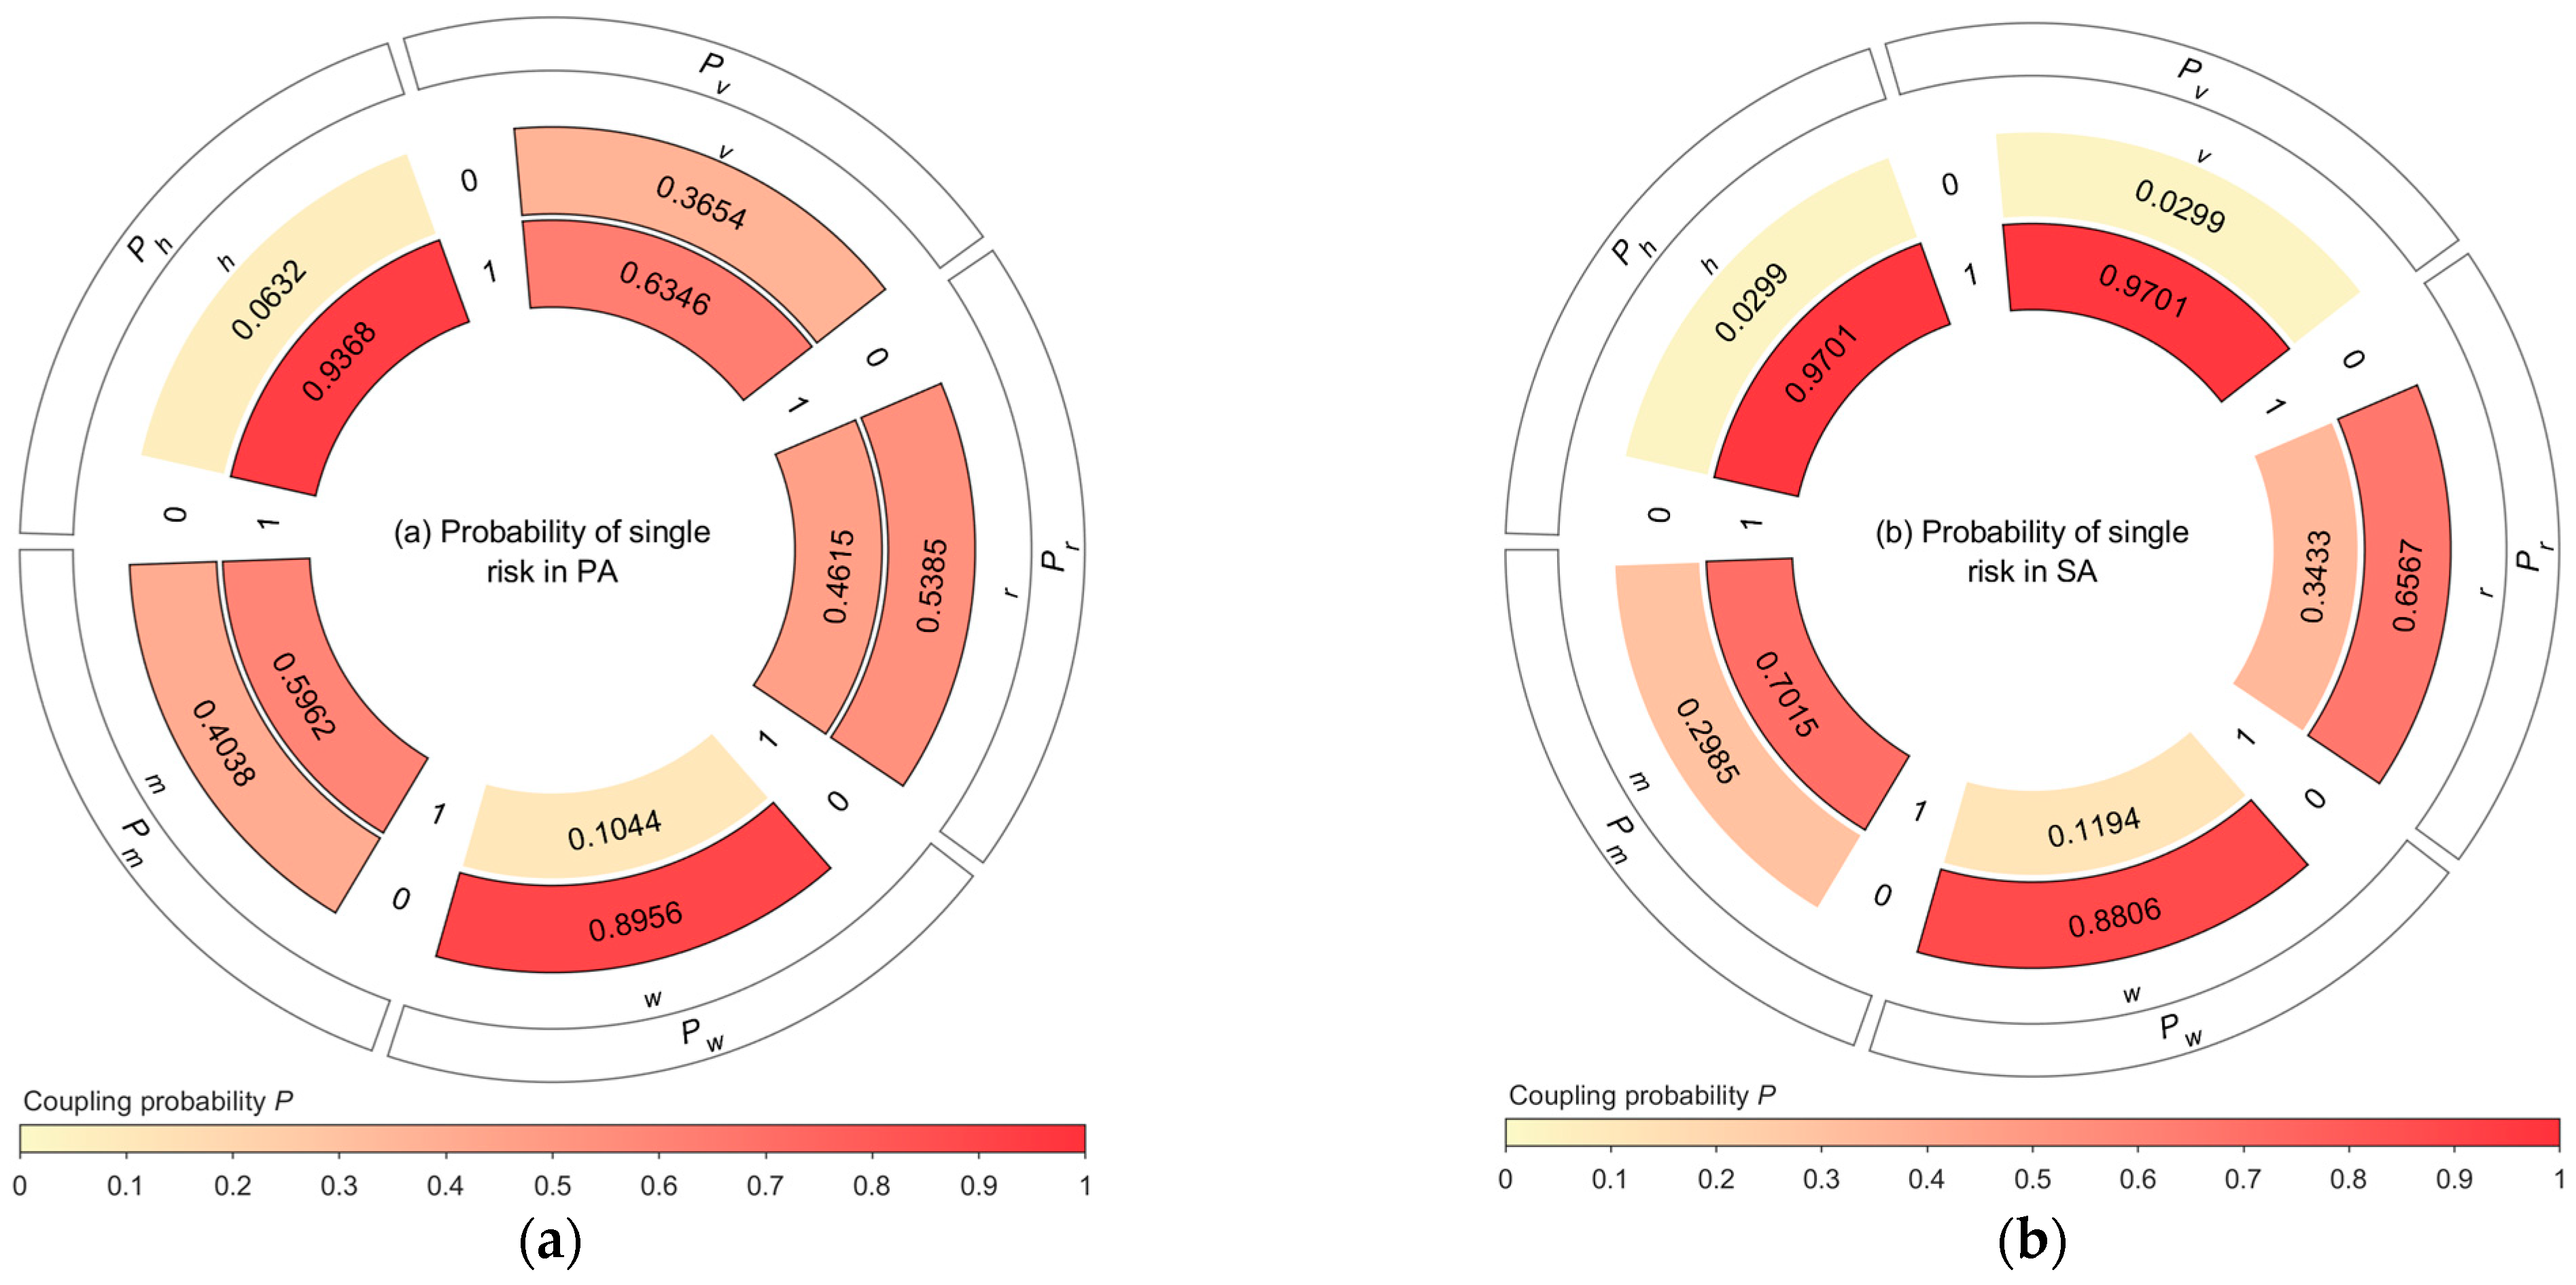
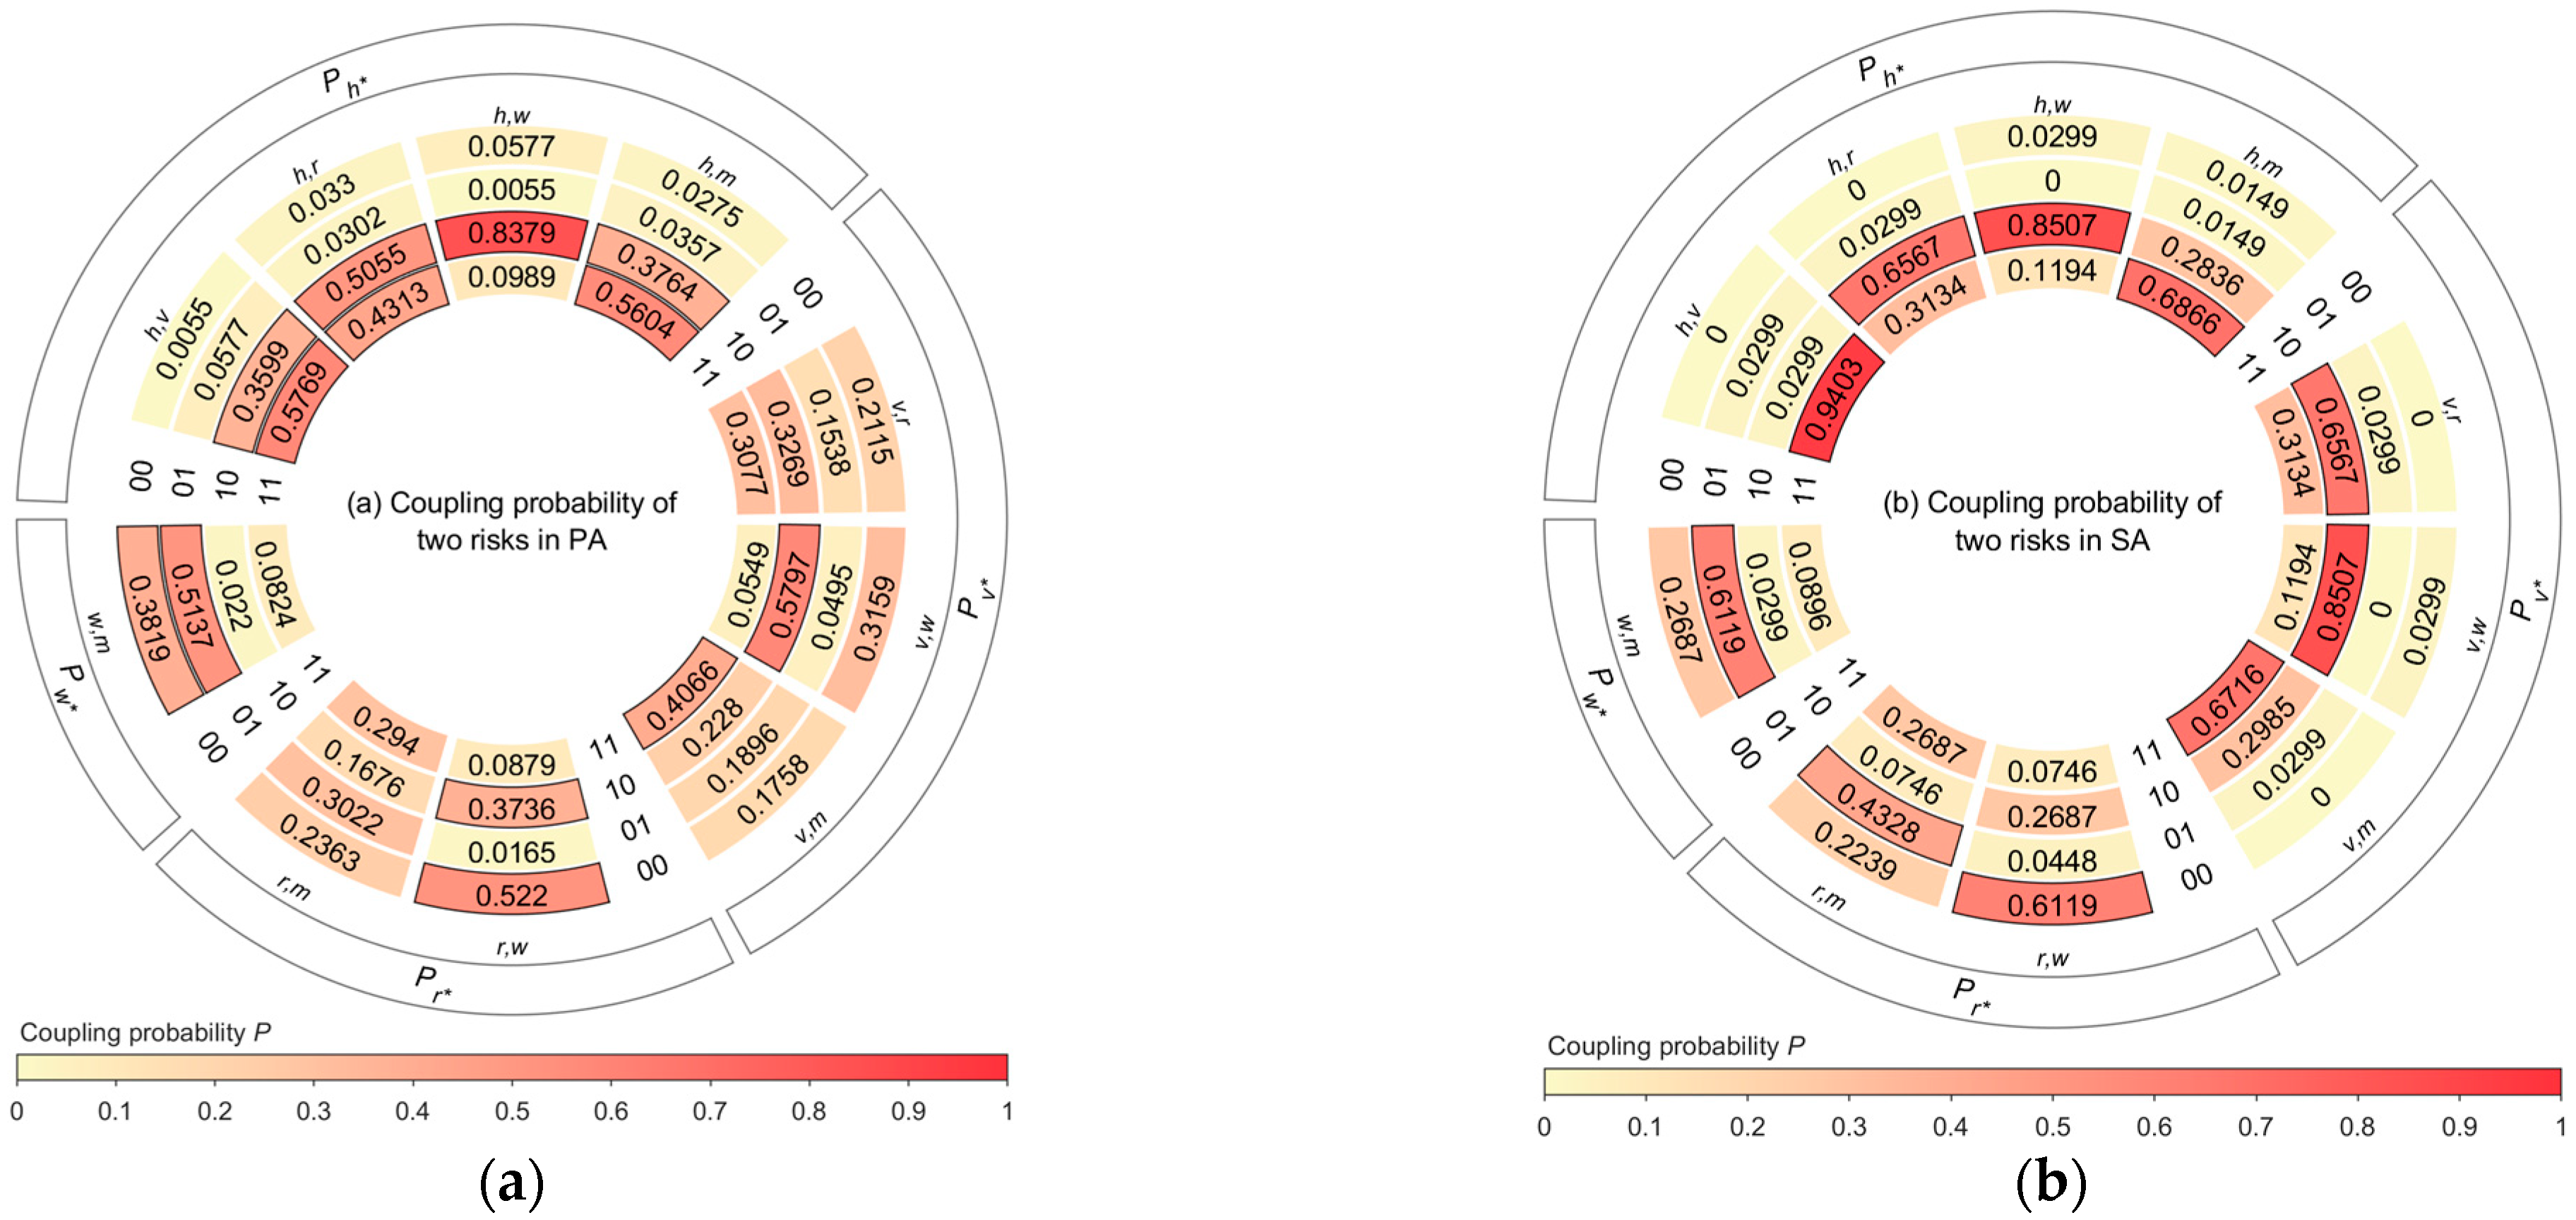
4.4. Risk Coupling Probability Calculation

Based on the risk combination frequencies in the previous section, the risk coupling probabilities for one to four risk types in different ACs were calculated according to Equations (7), (8), (10), and (12). There was no need to calculate for five types, as all factors were coupled. For clarity, the calculation process for the coupling probabilities of different risk types is provided below.
The risk probabilities of single risks in different ACs are shown in Figure 8. Taking P h in PA as an example, if h = 0 , v , r , w , m 0,1 , P h is the sum of all P h v r w m with h = 0 shown in Figure 6, resulting in P 0 = 0.0632 . Because P 0 + P 1 = 1 , P 1 = 0.9368 . The results showed that when a single risk type status was 1 in PA, the probability of human-related risks was the highest. This suggests that once human-related factors exceed the safety threshold, they are more likely to lead to system failure and cause an accident. This conclusion is similar to that in the previous section. In addition, the probability of weather-related risks was the lowest. Since single-factor risk probabilities cannot analyze the coupling relationships between risk types, this result can be attributed to the insufficient number of accident samples involving weather-related factors.
The risk coupling probabilities of two risks in different ACs are shown in Figure 9. Taking P h , v in PA as an example, if h = 0 and v = 0 , r , w , m 0,1 , P h , v is the sum of all P h v r w m with h = 0 and v = 0 shown in Figure 6, resulting in P 00 = 0.0055 . Similarly, it can be concluded that P 01 = 0.0577 , P 10 = 0.3599 , and P 11 = 0.5769 . The results showed that when the two risk type statuses were 1, the risk coupling probability of the human–vehicle factors were the highest across different ACs. This indicates that, regardless of how the risk scenario evolves, human and vehicle factors are the main sources of danger and tend to occur together. An interesting phenomenon occurred in SA, where the road–weather risk coupling frequency is the lowest. This suggests that poor weather and poor road environment are less likely to coexist. This seems counterintuitive, as adverse weather typically leads to a poor road environment. This contradiction can be attributed to the classification of risk factors. In the road risk type, only slippery roads and icy roads are caused by weather, while the other risk factors in the road type are not significantly associated with those in the weather type.
The risk coupling probabilities of three risks in different ACs are shown in Figure 10. Taking P h , v , r in PA as an example, if h = 0 , v = 0 , and r = 0 , w , m 0,1 , P h , v , r is the sum of all P h v r w m with h = 0 , v = 0 , and r = 0 shown in Figure 6, resulting in P 000 = 0 . Similarly, it can be concluded that P 001 = 0.0055 , P 010 = 0.033 , P 011 = 0.0247 , P 100 = 0.2115 , P 101 = 0.1484 , and P 110 = 0.294 , because P 000 + P 001 + P 010 + P 011 + P 100 + P 101 + P 110 + P 111 = 1 , P 111 = 0.283 . The results showed that when the three risk type statuses were 1, the risk coupling probability of the human–vehicle–management factors was the highest across the different ACs. This indicates that, compared with road and weather factors, insufficient management is more likely to lead to accidents and exacerbate the evolution of those accidents.
The risk coupling probabilities of four risks in different ACs are shown in Figure 11. Taking P h , v , r , w in PA as an example, if h = 0 , v = 0 , r = 0 , and w = 0 , m 0,1 , P h , v , r , w is the sum of all P h v r w m with h = 0 , v = 0 , r = 0 , and w = 0 shown in Figure 6, resulting in P 0000 = 0 . Similarly, it can be concluded that P 0001 = 0 , P 0010 = 0.0055 , P 0011 = 0 , P 0100 = 0.033 , P 0101 = 0 , P 0110 = 0.0192 , P 0111 = 0.0055 , P 1000 = 0.2005 , P 1001 = 0.0110 , P 1010 = 0.1099 , P 1011 = 0.0385 , P 1100 = 0.2885 , P 1101 = 0.0055 , and P 1110 = 0.239 . Because P 0000 + P 0001 + P 0010 + P 0011 + P 0100 + P 0101 + P 0110 + P 0111 + P 1000 + P 1001 + P 1010 + P 1011 + P 1100 + P 1101 + P 1110 + P 1111 = 1 , P 1111 = 0.044 . The results show that when the four risk type statuses were 1, the risk coupling probability of the human–vehicle–road–management factors was the highest and human–vehicle–weather–management was the lowest across the different ACs. This indicates that, in both PA and SA, road factors are more critical in complex coupling scenarios, while the impact of weather factors diminishes.

4.5. Risk Coupling Value Generation

As discussed in the previous section, the risk coupling probabilities for different risk types across different ACs were calculated as shown in Figure 8, Figure 9, Figure 10 and Figure 11. Based on the N-K model and mutual information, the risk coupling values for coupling scenarios involving two to five risk types in both PA and SA were calculated according Equations (6), (9), (11), and (13).
The top three and bottom three risk coupling scenarios in PA and SA are listed in Table 5. Overall, the lowest risk coupling value occurred in the two-factor coupling type ( T 2,2 H , R ), while the risk coupling value for the five-factor coupling type was the highest ( T 5 H , V , R , W , M ). An interesting phenomenon was observed in the two-factor coupling type, where the human–road coupling scenario T 2,2 H , R exhibited the lowest coupling value of 0.000052. However, as discussed in the previous section, the human–road risk coupling probability P h , r ( h = 1 and r = 1 ) was relatively high. This indicates that although human and road factors frequently occur together, accidents are not primarily caused by the coupling of these two factors alone. Instead, the involvement of additional risk factors may exacerbate the progression of risks. For example, in the three-factor coupling type, when human–road–weather coupling occurs ( T 3,4 H , R , W ), the risk coupling value increased to 0.0538.
Unlike in PA, the highest risk coupling value occurred in the four-factor coupling type ( T 4,1 H , V , R , W ). Similarly, the risk coupling values for the two-factor coupling type were the lowest ( T 2,10 W , M ). It is worth noting that, in the two-factor coupling type, the road–weather coupling scenario T 2,8 R , W had the higher risk coupling value of 0.032453. As discussed in the previous section, the coupling probability for the road–weather scenario P r , w ( r = 1 and w = 1 ) was the lowest. This suggests that road-related and weather-related factors rarely coexist, but when they do, they exacerbate the evolution of PA, leading to SA.

4.6. Risk Coupling Value Test in the Two Accident Categories

To explore whether there are significant differences in risk coupling values between the two ACs, the Wilcoxon signed-rank test was applied to the risk coupling values. The test examined the two hypotheses, H0 and H1, presented in the previous section. The result is shown in Table 6, where the statistic represents the cumulative extent of the positive or negative differences between the two sets of risk coupling values; Z indicates the extent to which the observed test statistic deviated from the expected value under the null hypothesis, with the sign indicating the direction of the difference and the absolute value reflecting the significance of the deviation; and the p-value represents the probability of observing the test statistic under the assumption that the null hypothesis (H0) is true. If the p-value in the test was less than 0.05, H0 was rejected; otherwise, it was not.
According to Table 6, the p-value for the comparison between PA and SA was 0.0292, which was below the commonly used significance level of 0.05. This indicates that there was a statistically significant difference between the risk coupling values of PA and SA, meaning that the observed difference was unlikely to be due to chance. Furthermore, the z-value of −2.1588 further confirmed this finding, with a negative value indicating that the risk coupling values in SA were significantly higher than those in PA. This result supports the hypothesis that the risk coupling mechanisms are distinct between PA and SA. Specifically, the stronger coupling in SA suggests a higher level of complexity and interaction among risk factors as the accident evolves. This difference is likely due to SA incorporating additional risk factors that accumulate and interact with those already present in PA, leading to stronger coupling effects. Moreover, while PA tend to be more isolated events, SA involve multiple stages of development, introducing dynamic changes and new risk factors over time. These evolving interactions significantly increase the overall risk coupling values in SA. Thus, the statistical significance of the findings strengthens the conclusion that the risk coupling mechanisms in PA and SA are fundamentally different, which is critical for developing targeted risk mitigation strategies for both types of accidents.

5. Discussion

The differences in risk coupling values across two ACs are discussed in this section. Next, the risk coupling values in both ACs are ranked to identify the key coupling scenarios and risk types for PA and SA. Then, prevention recommendations for PA and SA are provided based on the identified key coupling scenarios and risk types. Finally, the limitations of this study and directions for future work are discussed.

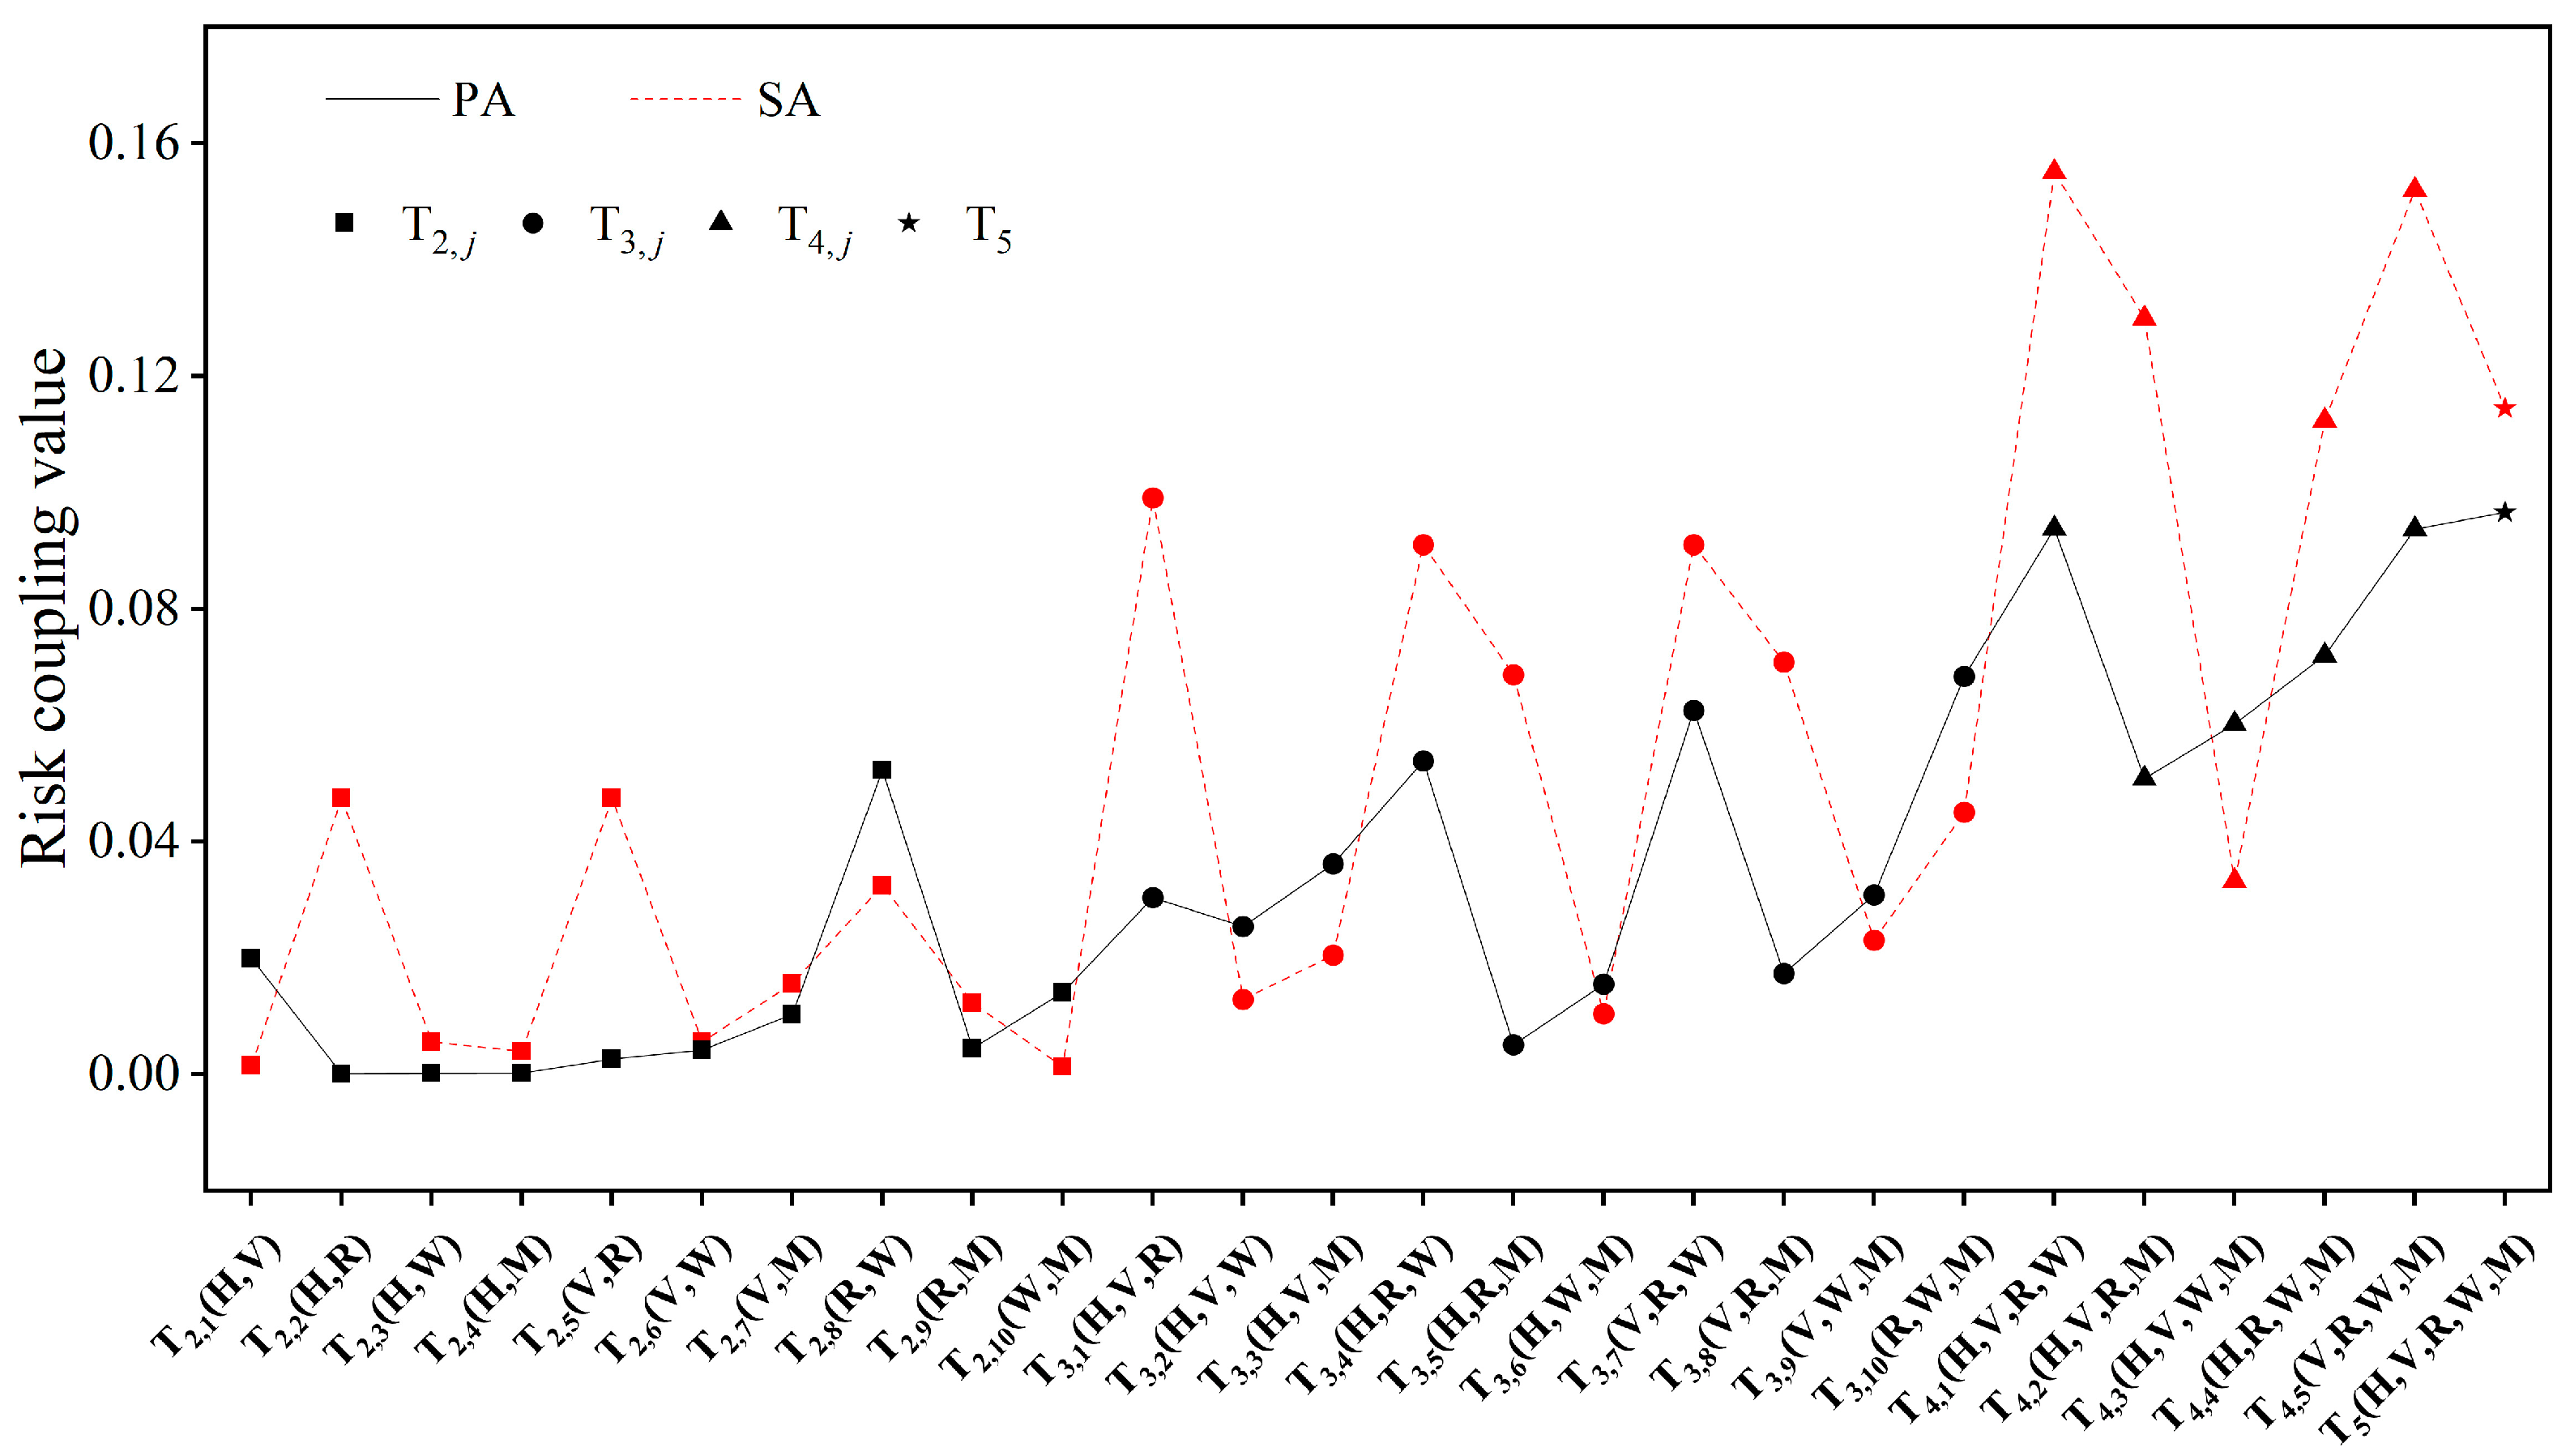
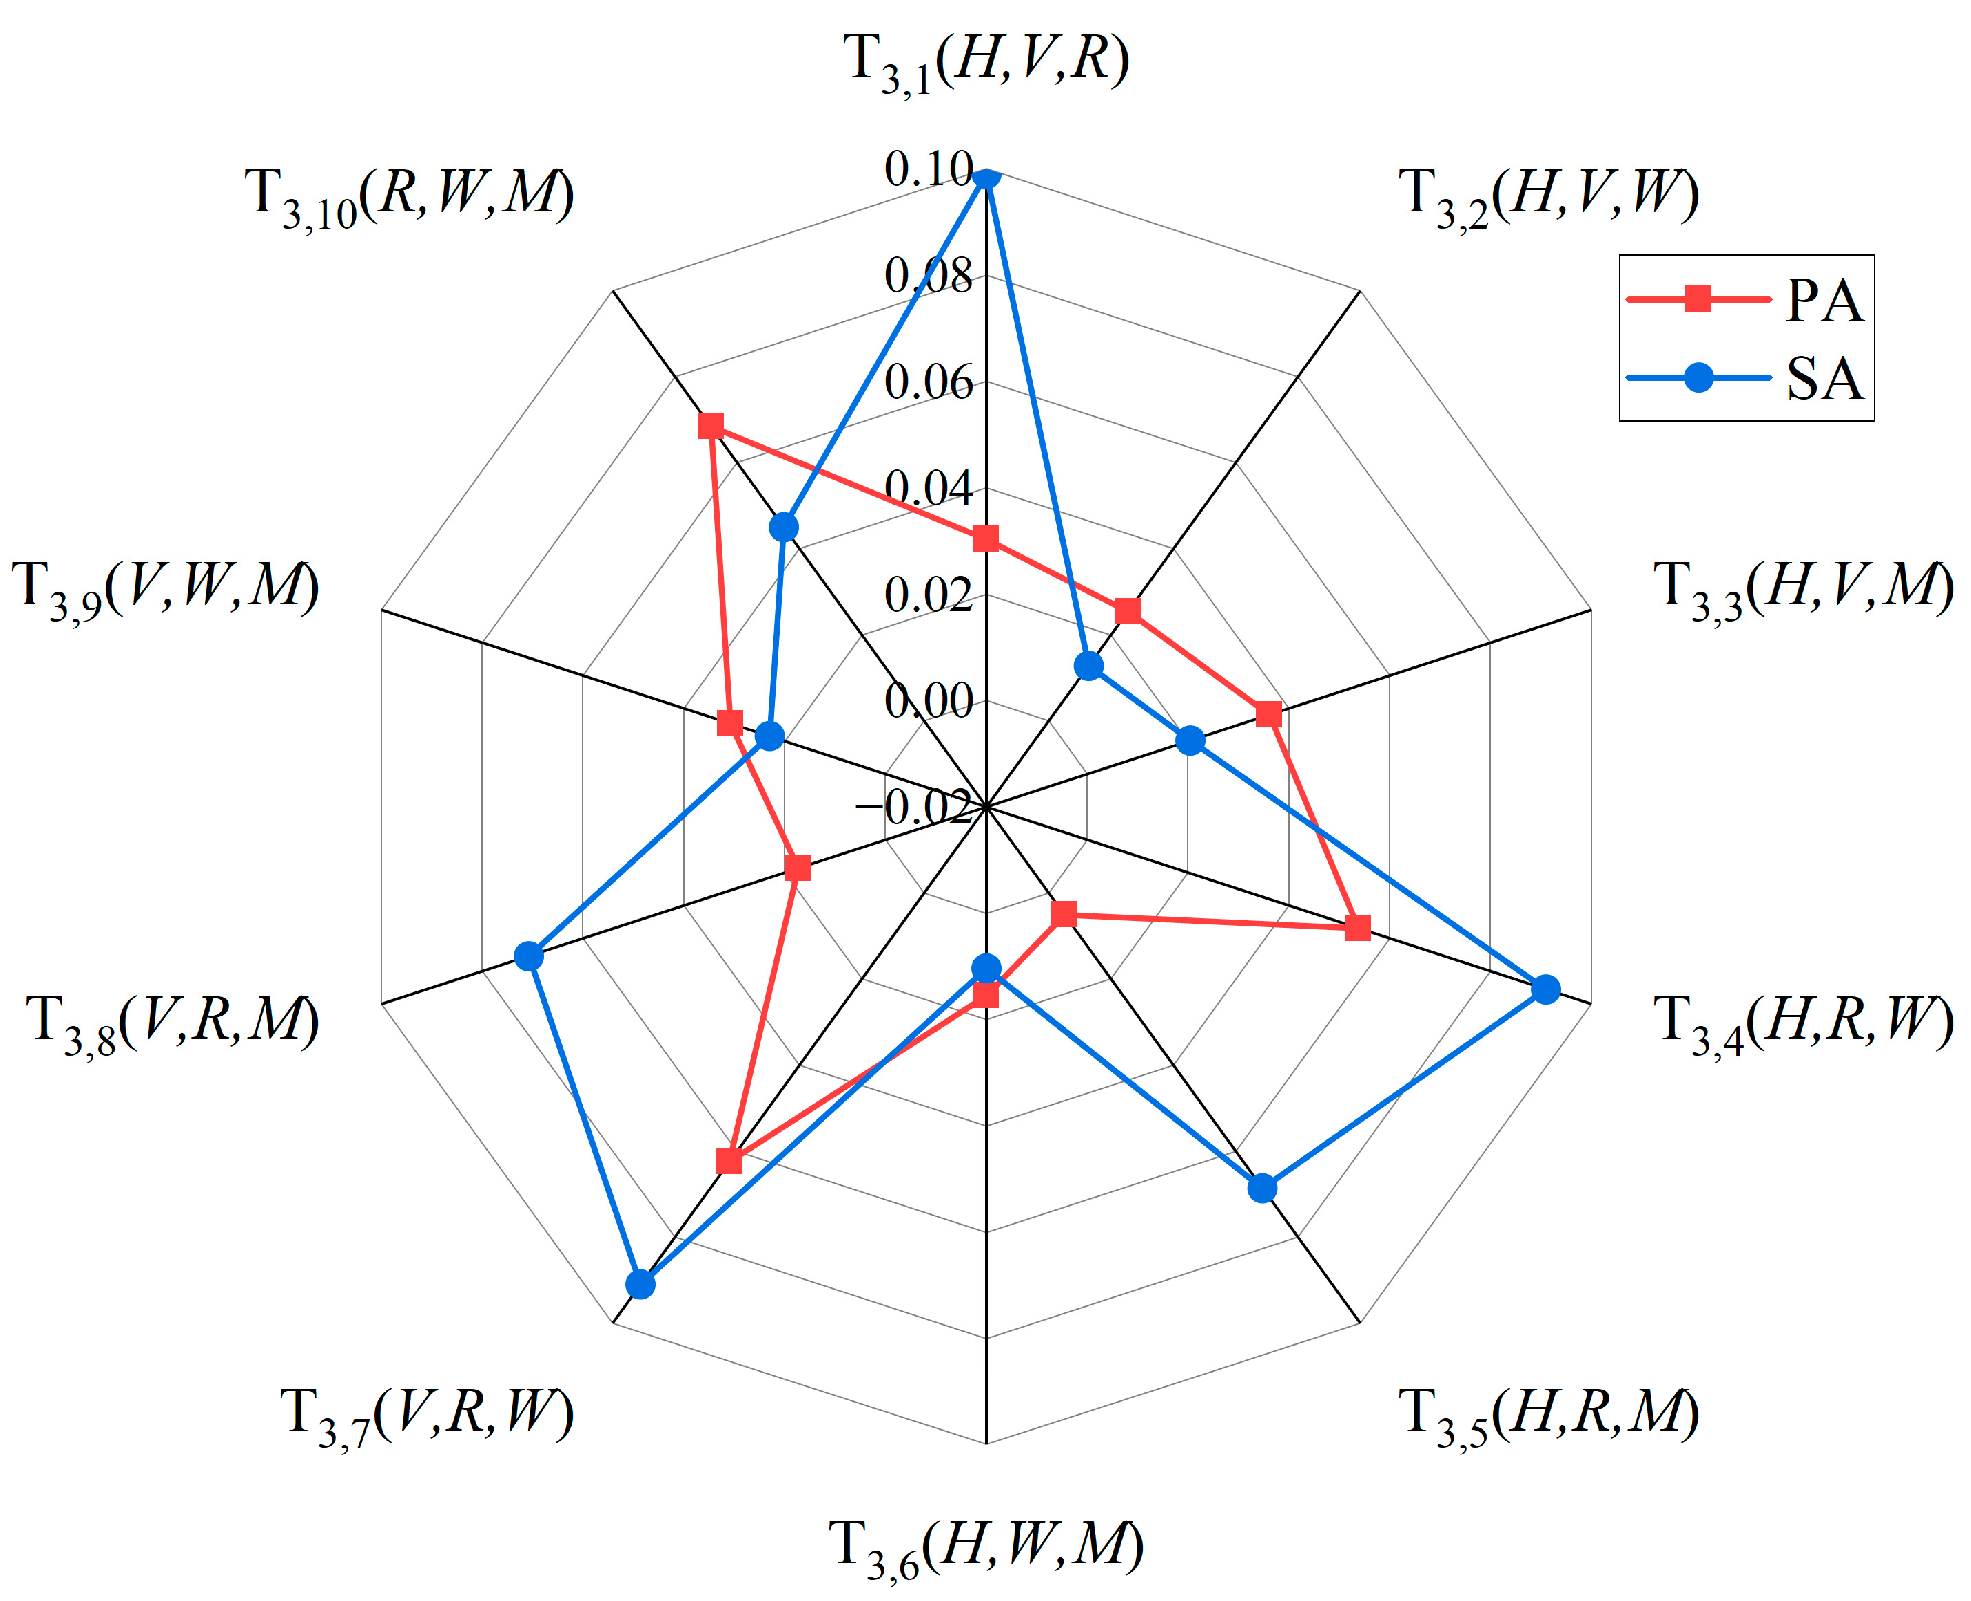
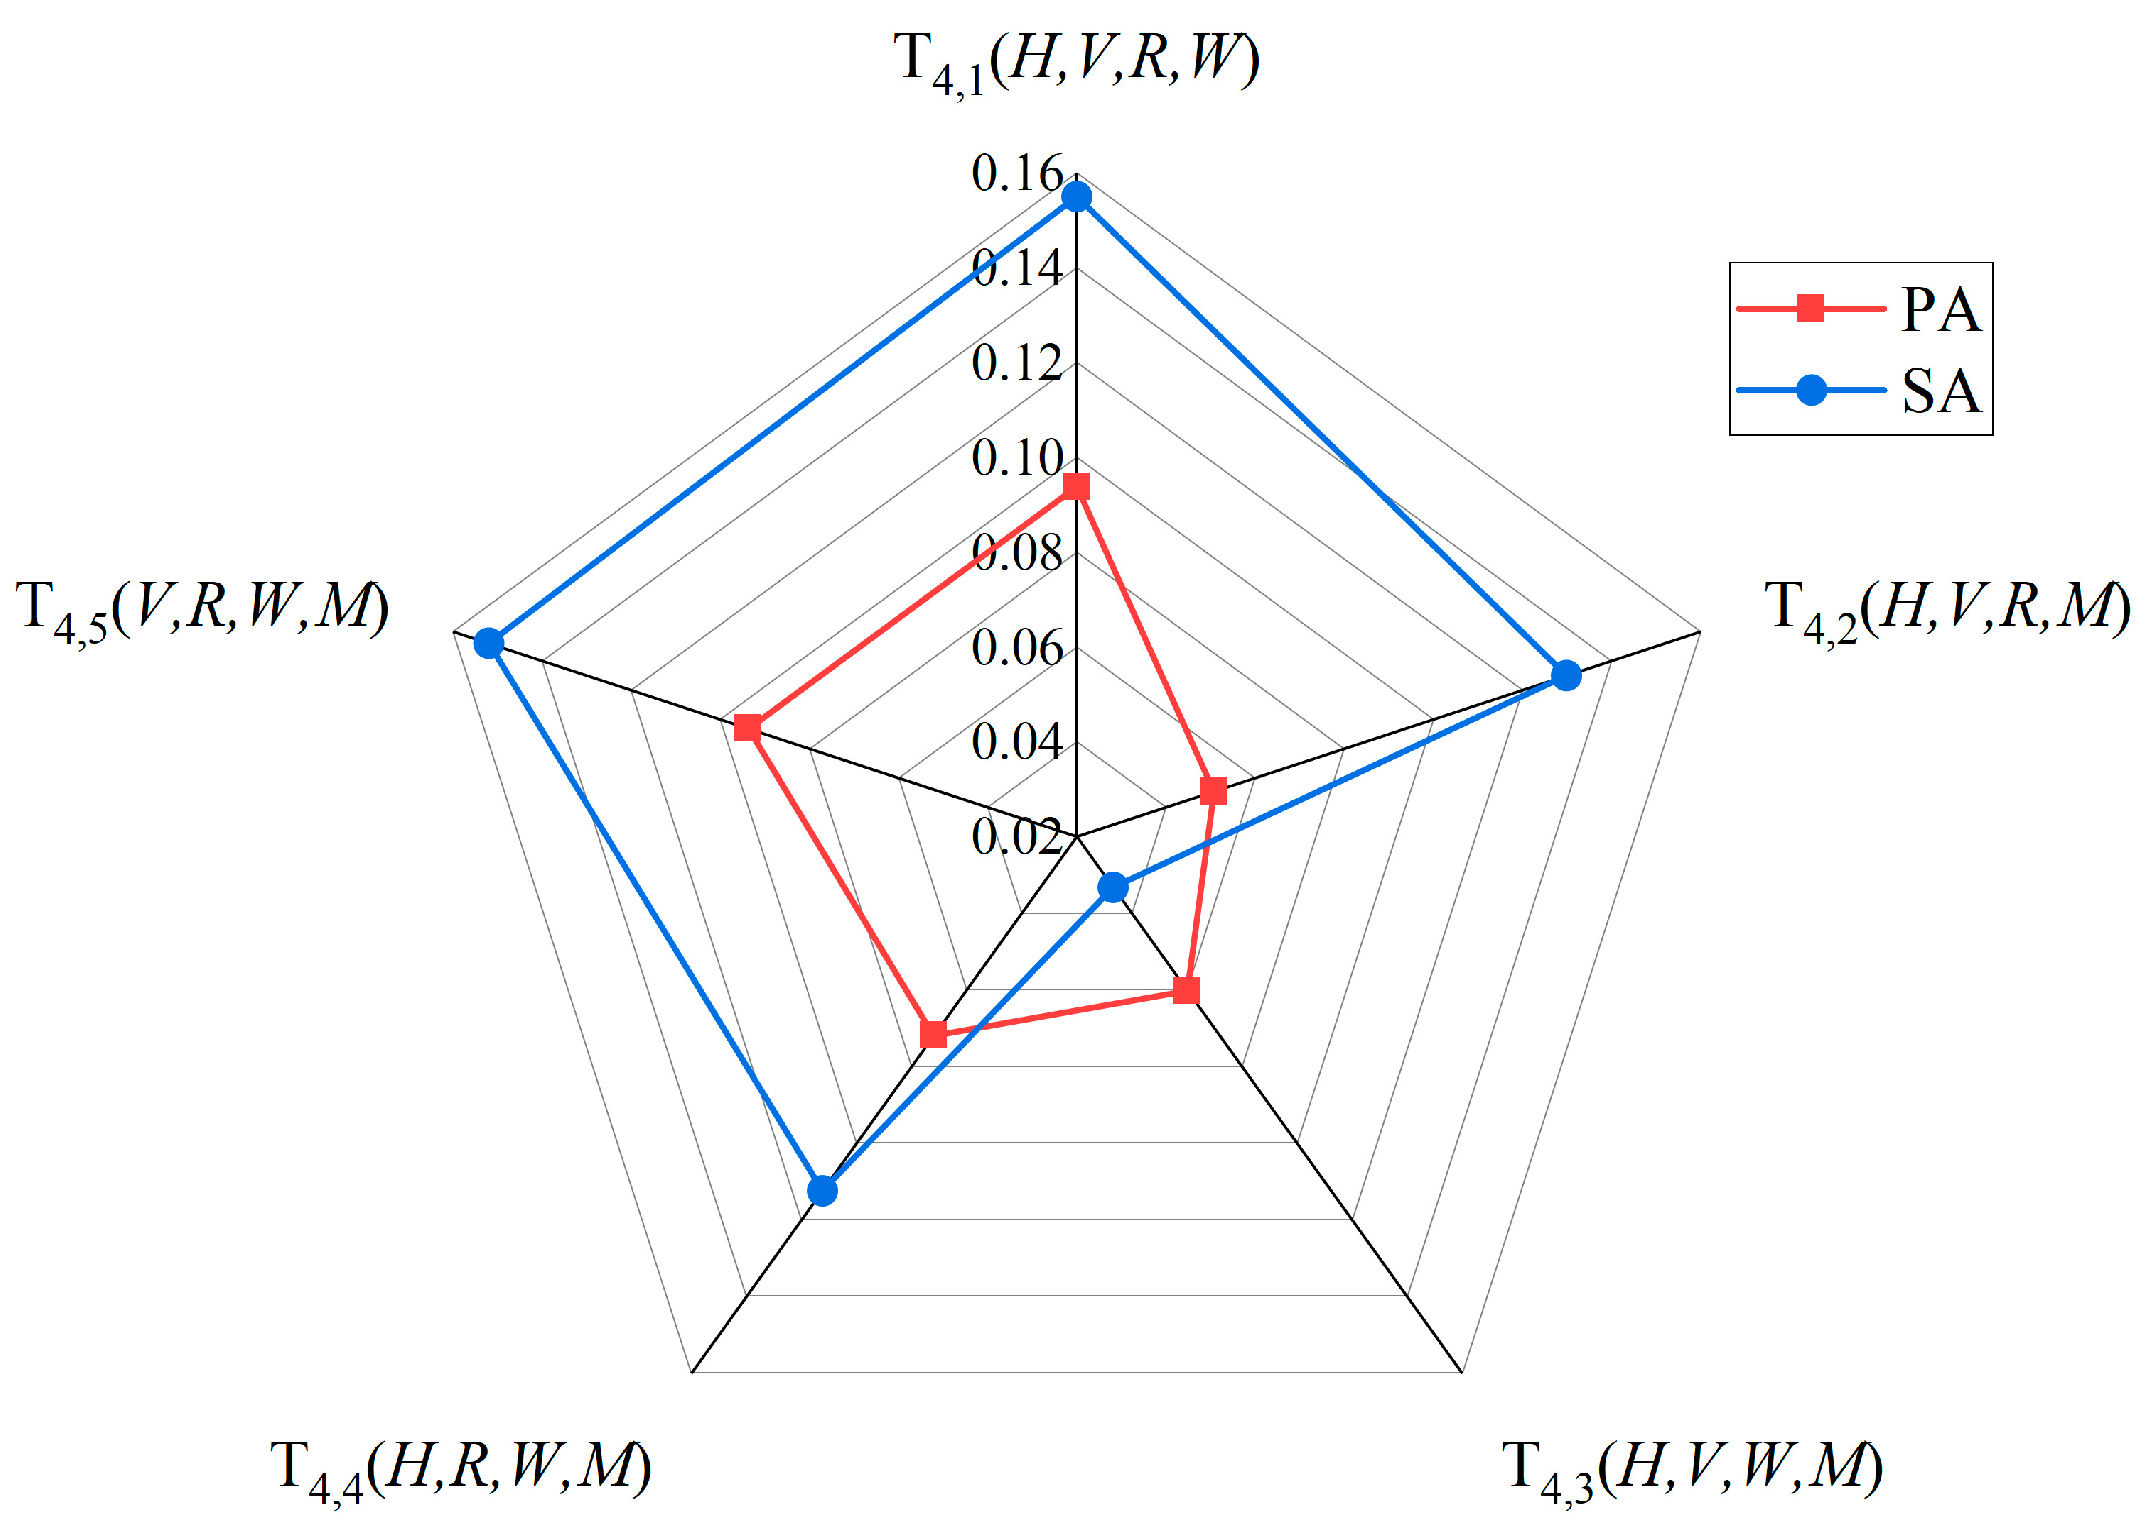
5.1. Risk Coupling Value Comparison in the Two Accident Categories

To compare the differences in risk coupling values between the two ACs, the risk coupling values were plotted as a line chart, as shown in Figure 12. Overall, the risk coupling values for different coupling scenarios in both ACs showed significant fluctuations that depended on the specific risk types. For example, the road–weather coupling scenario corresponded to a higher risk coupling value in PA, while scenarios involving road-related factors corresponded to higher risk coupling values in SA. This indicates that the involvement of road-related factors is more likely to lead to accidents or exacerbate their evolution. Another noticeable phenomenon was that the coupling values increased with the number of the risk coupling types in both ACs, a trend that has also been confirmed in other accidents [3,7,56,57]. However, in SA, the risk coupling values of several coupling scenarios in the four-factor coupling type were higher than those in the five-factor coupling type, such as T 4,1 H , V , R , W > T 5 H , V , R , W , M . This indicates that in SA, the risk coupling is more concentrated.
In addition, the risk coupling values in SA were generally higher than those in PA, a conclusion that was also confirmed by the Wilcoxon signed-rank test results ( Z = 2.1588 ) in the previous section. This can be attributed to the cumulative coupling of new risk factors with initial risk factors and the complex evolving scenarios in SA.
In the two-factor coupling type, the road–weather ( T 2,8 R , W ) coupling scenario in PA had the highest risk coupling value, while the human–vehicle ( T 2,2 H , R ) and vehicle–road ( T 2,5 V , R ) coupling scenarios in SA exhibited the highest risk coupling values. This indicates that the coupling of objective factors (e.g., adverse environmental condition) is more likely to lead to PA, with a certain inevitability, and is relatively easier to prevent compared with the coupling of subjective factors (e.g., human and vehicle). In contrast, the coupling of subjective factors (e.g., human and vehicle) with objective factors (e.g., road) is more likely to result in SA, reflecting a degree of randomness and being harder to intervene in.
In the three-factor coupling type, the risk coupling value in the vehicle–road–weather ( T 3,7 V , R , W ) coupling scenario was the highest in PA, while the human–vehicle–road coupling value ( T 3,1 H , V , R ) was relatively low. This suggests that weather-related factors are more significant in PA, whereas the influence of human-related factors diminishes. In SA, the risk coupling value was highest in the human–vehicle–road ( T 3,1 H , V , R ) coupling scenario, while the human–vehicle–weather ( T 3,2 H , V , W ) coupling value was the lowest. This indicates that road-related factors play a more critical role in SA and that the influence of weather-related factors diminishes. An interesting phenomenon here is that, as the accident evolves, road-related factors gradually take the dominant role, while the impact of weather-related factors weakens after the accident occurs. One possible explanation for this is that weather-related factors can affect visibility and judgment for drivers during high-speed driving. However, once an accident occurs, the scene transitions from dynamic traffic flow to a relatively static road environment (such as road congestion), and speeds may decrease, allowing drivers more time to react to adverse weather.
In the four-factor coupling type, the highest risk coupling value for both ACs occurred in the human–vehicle–road–weather ( T 4,1 H , V , R , W ) coupling scenario, while the lowest values corresponded to the human–vehicle–road–management ( T 4,2 H , V , R , M ) and human–vehicle–weather–management ( T 4,3 H , V , W , M ) coupling scenarios for PA and SA, respectively. A similar phenomenon was observed in complex coupling scenarios across both ACs, where the influence of management-related factors tended to diminish. One possible explanation is that management-related factors are indirect contributors and that the risks generated by the coupling of the other four direct factors interact, easily triggering PA or further evolving into SA.

5.2. Risk Coupling Value Ranking in the Two Accident Categories

To identify the key coupling scenarios and risk types, the risk coupling values in both ACs were displayed in a radar chart and ranked. Figure 13 presents the risk coupling values for the two-factor coupling type. Figure 13 indicates the following:
  • In PA, the top five risk coupling scenarios were T 2,8 R , W , T 2,1 H , V , T 2,10 W , M , T 2,7 V , M , and T 2,9 R , M ;
  • In SA, the top five risk coupling scenarios were T 2,2 H , R , T 2,5 V , R , T 2,8 R , W , T 2,7 V , M , and T 2,9 R , M .
The importance can be determined by the frequency of each risk type appearing in the coupling scenarios. It can be inferred that the most important factor in PA was management-related factors (appearing three times), while in SA, the most important factor was road-related factors (appearing four times). This suggests that the risks leading to PA are not short-term in nature and that improving daily management measures could potentially eliminate these risks. However, the evolution from PA to SA requires specific road conditions, such as curved roads, slippery surfaces, traffic congestion, or nighttime.
Figure 14 presents the risk coupling values for the three-factor coupling type, and it can be summarized as follows:
  • In PA, the top five risk coupling scenarios were T 3,10 R , W , M , T 3,7 V , R , W , T 3,4 H , R , W , T 3,3 H , V , M , and T 3,9 V , W , M ;
  • In SA, the top five risk coupling scenarios were T 3,1 H , V , R , T 3,4 H , R , W , T 3,7 V , R , W , T 3,8 V , R , M , and T 3,5 H , R , M .
It can be inferred that the most important factor in PA was weather-related factors (appearing four times), while the most important factor in SA was road-related factors (appearing five times). This suggests that adverse weather creates a disaster-prone environment where the coupling effect of risks is stronger, easily surpassing the safety threshold and leading to PA.
Figure 15 presents the risk coupling values for the four-factor coupling type, and it can be summarized as follows:
  • In PA, the top three risk coupling scenarios were T 4,1 H , V , R , W , T 4,5 V , R , W , M , and T 4,4 H , R , W , M ;
  • In SA, the top three risk coupling scenarios were T 4,1 H , V , R , W , T 4,5 V , R , W , M , and T 4,2 H , V , R , M .
It can be inferred that in PA, road-related factors and weather-related factors (appearing three times) were equally important, while in SA, vehicle-related and road-related factors (appearing three times) were equally important. As mentioned in the previous section, objective factors are the dominant factors in PA, with inevitability and ease of intervention. In contrast, most factors related to vehicles are triggered by the subjective intentions of the drivers, such as overloading and illegal modifications. Therefore, both objective and subjective factors can lead to SA, indicating that SA have a certain degree of randomness and are harder to intervene in. Additionally, in PA, complex coupling scenarios are more dependent on weather-related factors. However, regardless of how coupling scenarios evolve in SA, road-related factors remain the primary source of danger leading to the evolution from PA to SA.

5.3. Accident Prevention Suggestions

Based on accident investigation report data, this study quantified the degree of risk coupling in both ACs through methods such as risk factor extraction, risk type identification, and coupling analysis. Then, the differences in the risk coupling mechanisms of PA and SA were analyzed, and the key risk coupling scenarios and potential interactions between risk types in both ACs were identified. The formation of PA is inevitable and easily intervened, while the formation of SA is random and more difficult to intervene in. It is necessary to provide accident prevention recommendations based on the different risk coupling mechanisms leading to PA and SA, to reduce the occurrence of PA and prevent their evolution into SA. This constitutes the primary practical application of our study. Furthermore, accident investigation recommendations are provided to help investigators determine the scope of the investigation for both ACs and focus on key risk factors, as listed in Table 7.

5.4. Limitations and Future Work

The proposed framework can semiautomatically extract the risk factors and risk types that lead to PA or the evolution of PA into SA from accident reports and subsequently measure the risk coupling effects of different risk types in both ACs. The results can provide guidance for the prevention of PA and the blocking of SA to develop control measures, aiming to decouple such effects. However, this study also has certain limitations.
Risk factor identification limitations
This study has achieved semiautomated identification and extraction of risk factors and risk types. However, the identification of these entities relied on manual labeling. The challenge of high labeling costs can be overcome by using semi-supervised learning methods, such as a collection of pseudo label sets and manual label sets generated by self-training strategies [34]. Furthermore, at this stage, the mapping of risk factors to risk types still relies on expert experience [57,62]. Different mappings of risk factors would directly affect the calculation of risk coupling probabilities and risk coupling values in this study, and the risk coupling mechanisms may also vary. This remains a challenge in the field of risk assessment.
Coupling analysis limitations
A notable limitation is that all the risk factors were assigned to five risk types for coupling analysis. This simplified the mapping of risk state encoding in the previous section, as well as the calculation of risk coupling probabilities and coupling values in the previous section, because the number of coupling scenarios was reduced. The fact that the N-K model can analyze only a single layer of risk factors is a well-known and reasonable limitation [63,64]. With each additional risk factor, the computational complexity of the N-K model increases exponentially. For example, with 61 risk factors in PA, there were 2 4 × C 61 4 = 521855 possible coupling scenarios for four risk factors. Capturing the correlations between microlevel factors in coupling analysis requires resource-intensive accident analysis techniques or considering only high-risk nodes [63,64], which will be left for future work.
Data-related limitations
The data used in this study also had certain limitations. There were only 67 SA samples, which led to some coupling scenarios having a frequency of zero in Figure 7, such as the frequency of single factor scenarios being zero ( P 10000 , P 01000 , P 00100 , P 00010 , and P 00001 ). This poses a challenge to the reliability of the risk coupling mechanism analysis in SA. Expert elicitation is expected to overcome the challenge of data missing in SA, as supplementing expert experience in cases of insufficient data is a common approach in the field of accident analysis [3]. However, this inevitably introduces subjective uncertainty into the coupling analysis in SA. In particular, applying expert experience simultaneously to both the mapping of risk factors to risk types and the data supplementation step further increases the uncertainty of the analysis results.

6. Conclusions

This study proposes a risk coupling analysis framework for PA and SA in highways, aiming to extract risk factors and risk types from accident reports to measure the risk coupling effects. Specifically, a domain-specific NER model, TRBERT-BiLSTM-CRF, which combines a transformer pretrained on domain-specific corpora (TRBERT) with bidirectional LSTM and CRF layers, was used for risk factor extraction, achieving the best macro-F1 score in traffic risk entity recognition. Subsequently, the N-K model was employed to quantify the interactions between risk factors based on the statistical analysis of risk factors, and the Wilcoxon signed-rank test was applied to compare the differences in risk coupling between PA and SA. Finally, recommendations for the prevention of PA and the blocking of SA were formulated based on the analysis results. The main findings of this study were as follows:
  • The risk coupling values increased with the number of risk coupling types in both ACs. However, this was not absolute, as the coupling values for the five risk coupling types in SA were lower than those for the four risk coupling types, suggesting that the occurrence of SA may be more dependent on specific risk types;
  • The risk coupling values in SA were generally higher than in PA, indicating that more complex accident scenarios led to an increase in risk coupling values. This can be attributed to the cumulative coupling of new risk factors with initial risk factors and the complex evolving scenarios in SA;
  • There was a significant difference in the risk coupling values between PA and SA. The coupling of objective factors (e.g., adverse environmental conditions) is more likely to lead to PA and is easier to prevent. In contrast, the interaction between subjective (e.g., vehicle) and objective factors (e.g., road conditions) is more likely to result in SA, reflecting greater randomness and being harder to prevent.
These coupling results and quantitative evidence indicate that the risk coupling mechanisms between PA and SA differ. We suggest that these differences should be considered in the prevention of PA and the blocking of SA. Specifically, given the practical challenges in addressing environmental factors, this study suggests reducing the risk of PA from the perspectives of management and vehicle factors. Specific measures include standardized vehicle inspections, comprehensive training and education programs, and rigorous hazard inspections. Road traffic enforcement agencies and transportation companies should strengthen dynamic vehicle monitoring and control of overloaded vehicles to minimize vehicle-related risks. Additionally, this study suggests reducing the risk of PA evolving into SA from the perspective of road factors and implementing specific measures to establish a robust risk management system. Comprehensive risk management includes information alerts for hazardous road sections, flexible control measures, and nighttime hazard warnings. More importantly, highway emergency response departments should implement safety barriers after a PA occurs to decouple complex accident scenarios and weaken the evolution of PA.
This study provides a semiautomated integrated framework for road traffic accident risk analysis. The research findings help prioritize and focus monitoring on the most impactful risk factors, providing valuable insights for informed decision-making and proactive risk mitigation strategies, ultimately reducing the likelihood of PA and SA occurrence. By integrating the TRBERT-BiLSTM-CRF model into existing traffic incident management systems (TIMSs) to automatically process unstructured accident reports, it can enable dynamic risk assessment dashboards for operators, while the extracted risk entities can be used to construct detailed road traffic accident risk knowledge graphs and risk diffusion networks to enhance proactive safety measures. However, it must be acknowledged that this study relied on a limited dataset extracted from accident reports, which may have resulted in inaccurate risk coupling effects. Future research should consider establishing a continuous data collection system to incorporate more dynamic data. This, in turn, will enrich the database and broaden the approach for real-time traffic accident risk assessment.

Author Contributions

Conceptualization, Y.J. and P.G.; methodology, P.G.; software, L.L; validation, N.C. and L.L.; formal analysis, Y.J.; investigation, P.G.; resources, J.D.; data curation, P.G.; writing—original draft preparation, P.G.; writing—review and editing, Y.J.; visualization, P.G.; supervision, Y.J.; funding acquisition, N.C. All authors have read and agreed to the published version of the manuscript.

Funding

This research received no external funding.

Institutional Review Board Statement

Not applicable.

Informed Consent Statement

Not applicable.

Data Availability Statement

The raw data supporting the conclusions of this article will be made available by the authors on request.

Conflicts of Interest

Author Nan Chen was employed by the company Guangzhou Road Research Institute Co., Ltd. Author Jiashui Du was employed by the company Shaanxi Transportation Holding Group. The remaining authors declare that the research was conducted in the absence of any commercial or financial relationships that could be construed as a potential conflict of interest.

Appendix A

Table A1. Risk factors of primary accidents.
No.Risk FactorRisk TypeNo.Risk FactorRisk Type
1SpeedingHuman14Driving without a licenseHuman
2Fatigue drivingHuman15Drunk drivingHuman
3Distracted drivingHuman16Illegal operationsHuman
4Lack of attentionHuman17CarelessnessHuman
5Improper overtakingHuman18OverconfidenceHuman
6Illegal U-turnHuman19Improper operationHuman
7Failure to follow lane rulesHuman20Lack of safety awarenessHuman
8Illegal lane changeHuman21Failing to place warning signs properlyHuman
9Driving below minimum speedHuman22Negligence in observationHuman
10Driving in the opposite directionHuman23Failure to maintain safe distanceHuman
11Failure to wear a seatbeltHuman24Failure to use lights properlyHuman
12Illegal reversingHuman25Improper parkingHuman
13Driving a vehicle not permitted by licenseHuman
26Noncompliant vehicle specificationsVehicle31Decreased braking performanceVehicle
27Carrying flammable or explosive goodsVehicle32Illegal modificationsVehicle
28Seat detachmentVehicle33Overloading or oversize loadVehicle
29Improper cargo securingVehicle34Missing or unclear reflective markingsVehicle
30Tire blowoutVehicle
35DownhillRoad41Missing or unclear road signs and markingsRoad
36UphillRoad42Failure to install required safety facilitiesRoad
37Curved roadsRoad43Road congestionRoad
38Road debrisRoad44Poor visibilityRoad
39Slippery road surfaceRoad45NighttimeRoad
40Icy road surfaceRoad
46RainyWeather48FoggyWeather
47SnowyWeather49Low visibilityWeather
50Failure to implement safety responsibilityManagement56Inadequate risk analysis and assessmentManagement
51Negligence in safety managementManagement57Ineffective overload controlManagement
52Lack of supervisionManagement58Noncompliance with emergency plansManagement
53Insufficient education and trainingManagement59Ineffective dynamic monitoringManagement
54Unscientific allocation of police resourcesManagement60Insufficient hazard identification and remediationManagement
55Insufficient perception equipmentManagement61Insufficient traffic safety campaignsManagement
Table A2. Risk factors of secondary accidents. The bold text highlights risk factors specific to secondary accidents.
No.Risk FactorRisk TypeNo.Risk FactorRisk Type
1SpeedingHuman10Improper operationHuman
2Fatigue drivingHuman11Lack of safety awarenessHuman
3Distracted drivingHuman12Failing to place warning signs properlyHuman
4Lack of attentionHuman13Negligence in observationHuman
5Improper overtakingHuman14Failure to maintain safe distanceHuman
6Illegal U-turnHuman15Failure to use lights properlyHuman
7Failure to follow lane rulesHuman16Failure to report in timeHuman
8Failure to wear a seatbeltHuman17Improper handlingHuman
9Driving a vehicle not permitted by licenseHuman18Failure to evacuate people properlyHuman
19Noncompliant vehicle specificationsVehicle23Abnormal parkingVehicle
20Carrying flammable or explosive goodsVehicle24Tire combustionVehicle
21Overloading or oversize loadVehicle25Hazardous material leakageVehicle
22Missing or unclear reflective markingsVehicle
26DownhillRoad30Icy road surfaceRoad
27Curved roadsRoad31Road congestionRoad
28Road debrisRoad32NighttimeRoad
29Slippery road surfaceRoad
33RainyWeather35FoggyWeather
34SnowyWeather36Low visibilityWeather
37Failure to implement safety responsibilityManagement42Noncompliance with emergency plansManagement
38Negligence in safety managementManagement43Ineffective dynamic monitoringManagement
39Lack of supervisionManagement44Insufficient hazard identification and remediationManagement
40Insufficient education and trainingManagement45Ineffective patrolsManagement
41Unscientific allocation of police resourcesManagement

References

  1. Híjar, M.; Carrillo, C.; Flores, M.; Anaya, R.; Lopez, V. Risk Factors in Highway Traffic Accidents: A Case Control Study. Accid. Anal. Prev. 2000, 32, 703–709. [Google Scholar] [CrossRef]
  2. Li, L.; Tan, E.; Gao, P.; Jin, Y. Enhancing Concurrent Emergency Response: Joint Scheduling of Emergency Vehicles on Freeways with Tailored Heuristic. Appl. Sci. 2024, 14, 7433. [Google Scholar] [CrossRef]
  3. Guo, J.; Luo, C.; Ma, K. Risk Coupling Analysis of Road Transportation Accidents of Hazardous Materials in Complicated Maritime Environment. Reliab. Eng. Syst. Saf. 2023, 229, 108891. [Google Scholar] [CrossRef]
  4. Yang, H.; Wang, Z.; Xie, K.; Ozbay, K.; Imprialou, M. Methodological Evolution and Frontiers of Identifying, Modeling and Preventing Secondary Crashes on Highways. Accid. Anal. Prev. 2018, 117, 40–54. [Google Scholar] [CrossRef] [PubMed]
  5. Wang, J.; Liu, B.; Fu, T.; Liu, S.; Stipancic, J. Modeling When and Where a Secondary Accident Occurs. Accid. Anal. Prev. 2019, 130, 160–166. [Google Scholar] [CrossRef]
  6. Fan, D.; Lo, C.K.Y.; Zhou, Y. Sustainability Risk in Supply Bases: The Role of Complexity and Coupling. Transp. Res. Part E Logist. Transp. Rev. 2021, 145, 102175. [Google Scholar] [CrossRef]
  7. Fan, C.; Montewka, J.; Bolbot, V.; Zhang, Y.; Qiu, Y.; Hu, S. Towards an Analysis Framework for Operational Risk Coupling Mode: A Case from MASS Navigating in Restricted Waters. Reliab. Eng. Syst. Saf. 2024, 248, 110176. [Google Scholar] [CrossRef]
  8. Rasmussen, J. Risk Management in a Dynamic Society: A Modelling Problem. Saf. Sci. 1997, 27, 183–213. [Google Scholar] [CrossRef]
  9. Shappell, S.A.; Wiegmann, D.A. Applying Reason: The Human Factors Analysis and Classification System (HFACS). Hum. Factors Aerosp. Saf. 2001, 1, 59–86. [Google Scholar]
  10. Leveson, N. A New Accident Model for Engineering Safer Systems. Saf. Sci. 2004, 42, 237–270. [Google Scholar] [CrossRef]
  11. Dong, C.; Zhang, Y.; Wang, Z.; Liu, J.; Zhang, J. The Hybrid Systems Method Integrating STAMP and HFACS for the Causal Analysis of the Road Traffic Accident. Ergonomics 2024, 67, 971–994. [Google Scholar] [CrossRef] [PubMed]
  12. Li, K.; Wang, S. A Network Accident Causation Model for Monitoring Railway Safety. Saf. Sci. 2018, 109, 398–402. [Google Scholar] [CrossRef]
  13. Zhang, Y.; Liu, T.; Bai, Q.; Shao, W.; Wang, Q. New Systems-Based Method to Conduct Analysis of Road Traffic Accidents. Transp. Res. Part F Traffic Psychol. Behav. 2018, 54, 96–109. [Google Scholar] [CrossRef]
  14. Stanton, N.A.; Box, E.; Butler, M.; Dale, M.; Tomlinson, E.-M.; Stanton, M. Using Actor Maps and AcciMaps for Road Safety Investigations: Development of Taxonomies and Meta-Analyses. Saf. Sci. 2023, 158, 105975. [Google Scholar] [CrossRef]
  15. Hossain, A.; Sun, X.; Alam, S.; Das, S.; Sheykhfard, A. Crash Contributing Factors and Patterns Associated with Fatal Truck-Involved Crashes in Bangladesh: Findings from the Text Mining Approach. Transp. Res. Rec. 2024, 2678, 706–725. [Google Scholar] [CrossRef]
  16. Xu, P.; Wang, Q.; Ye, Y.; Wong, S.C.; Zhou, H. Text as Data: Narrative Mining of Non-Collision Injury Incidents on Public Buses by Structural Topic Modeling. Travel Behav. Soc. 2025, 39, 100981. [Google Scholar] [CrossRef]
  17. Xiong, M.; Wang, H.; Che, C.; Sun, M. Application of Text Mining and Coupling Theory to Depth Cognition of Aviation Safety Risk. Reliab. Eng. Syst. Saf. 2024, 245, 110032. [Google Scholar] [CrossRef]
  18. Goldberg, D.M. Characterizing Accident Narratives with Word Embeddings: Improving Accuracy, Richness, and Generalizability. J. Saf. Res. 2022, 80, 441–455. [Google Scholar] [CrossRef]
  19. Goh, Y.M.; Ubeynarayana, C.U. Construction Accident Narrative Classification: An Evaluation of Text Mining Techniques. Accid. Anal. Prev. 2017, 108, 122–130. [Google Scholar] [CrossRef]
  20. Hughes, P.; Shipp, D.; Figueres-Esteban, M.; van Gulijk, C. From Free-Text to Structured Safety Management: Introduction of a Semi-Automated Classification Method of Railway Hazard Reports to Elements on a Bow-Tie Diagram. Saf. Sci. 2018, 110, 11–19. [Google Scholar] [CrossRef]
  21. Kutela, B.; Dzinyela, R.; Haule, H.; Sheykhfard, A.; Msechu, K. Leveraging Autonomous Vehicles Crash Narratives to Understand the Patterns of Parking-Related Crashes. Traffic Saf. Res. 2023, 4, e000033. [Google Scholar] [CrossRef]
  22. Ma, Z.; Chen, Z.-S. Mining Construction Accident Reports via Unsupervised NLP and Accimap for Systemic Risk Analysis. Autom. Constr. 2024, 161, 105343. [Google Scholar] [CrossRef]
  23. Singh, K.; Maiti, J.; Dhalmahapatra, K. Chain of Events Model for Safety Management: Data Analytics Approach. Saf. Sci. 2019, 118, 568–582. [Google Scholar] [CrossRef]
  24. Dzinyela, R.; Dadashova, B.; Westfall, G.; Das, S.; Silvestri-Dobrovolny, C.; Adanu, E.K.; Lord, D. Analysis of Motorcyclists Crash Severity Using Cluster Correspondence and Hierarchical Binary Logit Models. Multimodal Transp. 2025, 4, 100197. [Google Scholar] [CrossRef]
  25. Das, S.; Dzinyela, R.; Liu, J.; Dadashova, B.; Silvestri-Dobrovolny, C. Understanding Patterns of Factor Influences in Motorcycle Crashes with Fixed Objects. J. Transp. Saf. Secur. 2024, 1–27. [Google Scholar] [CrossRef]
  26. Zhu, Y.; Liao, H.; Huang, D. Using Text Mining and Multilevel Association Rules to Process and Analyze Incident Reports in China. Accid. Anal. Prev. 2023, 191, 107224. [Google Scholar] [CrossRef] [PubMed]
  27. Xu, N.; Ma, L.; Liu, Q.; Wang, L.; Deng, Y. An Improved Text Mining Approach to Extract Safety Risk Factors from Construction Accident Reports. Saf. Sci. 2021, 138, 105216. [Google Scholar] [CrossRef]
  28. Shen, J.; Liu, S.; Zhang, J. Using Text Mining and Bayesian Network to Identify Key Risk Factors for Safety Accidents in Metro Construction. J. Constr. Eng. Manag. 2024, 150, 04024052. [Google Scholar] [CrossRef]
  29. Ahadh, A.; Binish, G.V.; Srinivasan, R. Text Mining of Accident Reports Using Semi-Supervised Keyword Extraction and Topic Modeling. Process Saf. Environ. Prot. 2021, 155, 455–465. [Google Scholar] [CrossRef]
  30. Zhong, B.; Pan, X.; Love, P.E.D.; Sun, J.; Tao, C. Hazard Analysis: A Deep Learning and Text Mining Framework for Accident Prevention. Adv. Eng. Inform. 2020, 46, 101152. [Google Scholar] [CrossRef]
  31. Pan, X.; Zhong, B.; Wang, Y.; Shen, L. Identification of Accident-Injury Type and Bodypart Factors from Construction Accident Reports: A Graph-Based Deep Learning Framework. Adv. Eng. Inform. 2022, 54, 101752. [Google Scholar] [CrossRef]
  32. Li, J.; Sun, A.; Han, J.; Li, C. A Survey on Deep Learning for Named Entity Recognition. IEEE Trans. Knowl. Data Eng. 2020, 34, 50–70. [Google Scholar] [CrossRef]
  33. Xiong, M.; Wang, H.; Wong, Y.D.; Hou, Z. Enhancing Aviation Safety and Mitigating Accidents: A Study on Aviation Safety Hazard Identification. Adv. Eng. Inform. 2024, 62, 102732. [Google Scholar] [CrossRef]
  34. Liu, D.; Cheng, L. MAKG: A Maritime Accident Knowledge Graph for Intelligent Accident Analysis and Management. Ocean Eng. 2024, 312, 119280. [Google Scholar] [CrossRef]
  35. Wu, Q.; Yao, P.; Zhu, H.; Zhu, W.; Wu, Y.; Li, L. A Deep Learning Approach to Recognizing Fine-Grained Expressway Location Reference from Unstructured Texts in Chinese. Int. J. Geogr. Inf. Sci. 2024, 38, 654–674. [Google Scholar] [CrossRef]
  36. Liu, C.; Yang, S. A Text Mining-Based Approach for Understanding Chinese Railway Incidents Caused by Electromagnetic Interference. Eng. Appl. Artif. Intell. 2023, 117, 105598. [Google Scholar] [CrossRef]
  37. Kwon, S.; Ko, Y.; Seo, J. Effective Vector Representation for the Korean Named-Entity Recognition. Pattern Recognit. Lett. 2019, 117, 52–57. [Google Scholar] [CrossRef]
  38. Liu, C.; Yang, S. Using Text Mining to Establish Knowledge Graph from Accident/Incident Reports in Risk Assessment. Expert Syst. Appl. 2022, 207, 117991. [Google Scholar] [CrossRef]
  39. Devlin, J.; Chang, M.-W.; Lee, K.; Toutanova, K. BERT: Pre-Training of Deep Bidirectional Transformers for Language Understanding 2019. In Proceedings of the 2019 Conference of the North American Chapter of the Association for Computational Linguistics: Human Language Technologies, Volume 1 (Long and Short Papers), Minneapolis, MN, USA, 2–7 June 2019. [Google Scholar]
  40. Cai, B.; Tian, S.; Yu, L.; Long, J.; Zhou, T.; Wang, B. ATBBC: Named Entity Recognition in Emergency Domains Based on Joint BERT-BILSTM-CRF Adversarial Training. J. Intell. Fuzzy Syst. 2024, 46, 4063–4076. [Google Scholar] [CrossRef]
  41. Luo, F.; Liu, T. Analysis of Coupled Risk of Air Traffic Safety Based on N-K Model. J. Wuhan Univ. Technol. (Inf. Manag. Eng.) 2011, 33, 267–270. [Google Scholar]
  42. Liu, Z.; Ma, Q.; Cai, B.; Shi, X.; Zheng, C.; Liu, Y. Risk Coupling Analysis of Subsea Blowout Accidents Based on Dynamic Bayesian Network and NK Model. Reliab. Eng. Syst. Saf. 2022, 218, 108160. [Google Scholar] [CrossRef]
  43. Ren, C.; Yang, M. Risk Assessment of Hazmat Road Transportation Accidents before, during, and after the Accident Using Bayesian Network. Process Saf. Environ. Prot. 2024, 190, 760–779. [Google Scholar] [CrossRef]
  44. Fa, H.; Shuai, B.; Yang, Z.; Niu, Y.; Huang, W. Mining the Accident Causes of Railway Dangerous Goods Transportation: A Logistics-DT-TFP Based Approach. Accid. Anal. Prev. 2024, 195, 107421. [Google Scholar] [CrossRef] [PubMed]
  45. Yang, G.D.; Liu, J.; Wang, W.Q.; Zhou, H.W.; Wang, X.D.; Lu, F.; Wan, L.T.; Teng, L.Y.; Zhao, H. Integration of the BBN-NK-Boltzmann Model of Tunnel Fire Network Scenarios with Coupled Forward and Reverse Rendition Analysis. Reliab. Eng. Syst. Saf. 2023, 240, 109546. [Google Scholar] [CrossRef]
  46. Zhang, W.; Zhang, Y. Research on Coupling Mechanism of Intelligent Ship Navigation Risk Factors Based on N-K Model. J. Mar. Sci. Technol. 2023, 28, 195–207. [Google Scholar] [CrossRef]
  47. Hu, L.; Xue, Y.; Zhao, X.; Lyu, Y.; Lei, G.; Liu, F.; Zhang, C. Study on the Coupling Effect of Road Traffic Risk Causes under Different Driving Ages. Saf. Environ. Eng. 2023, 30, 1–9. [Google Scholar] [CrossRef]
  48. Hu, L.; Yu, H.E.; Zhi, H.; Ruijie, Z.; Chen, C.; Bing, L. Multi-Dimensional Coupling Study on Traffic Accident Risk of Highway in Mountainous Areas. China Saf. Sci. J. 2024, 34, 17–27. [Google Scholar] [CrossRef]
  49. Jia, C.; Shi, Y.; Yang, Q.; Zhang, Y. Entity Enhanced BERT Pre-Training for Chinese NER. In Proceedings of the 2020 Conference on Empirical Methods in Natural Language Processing (EMNLP), Online, 16–20 November 2020; Association for Computational Linguistics: Stroudsburg, PA, USA; pp. 6384–6396. [Google Scholar]
  50. Zhang, S.; Zheng, D.; Hu, X.; Yang, M. Bidirectional Long Short-Term Memory Networks for Relation Classification. In Proceedings of the 29th Pacific Asia Conference on Language, Information and Computation, Shanghai, China, 30 October–1 November 2015; pp. 73–78. [Google Scholar]
  51. Sutton, C.; McCallum, A. An Introduction to Conditional Random Fields. Found. Trends Mach. Learn. 2012, 4, 267–373. [Google Scholar] [CrossRef]
  52. Huang, Z.; Xu, W.; Yu, K. Bidirectional LSTM-CRF Models for Sequence Tagging 2015. arXiv 2015, arXiv:1508.01991. [Google Scholar]
  53. Xue, Y.; Liu, Y.; Zhang, T. Research on Formation Mechanism of Coupled Disaster Risk. J. Nat. Disasters 2013, 22, 44–50. [Google Scholar] [CrossRef]
  54. Pan, F.Q.; Zhang, Y.; Yang, J.S.; Zhang, L.X.; Chen, X.F.; Yang, X.X. Risk Coupling Evaluation of Undersea Tunnel Traffic Accident Based on Catastrophe Theory. Adv. Transp. Stud. 2022, 58, 179–196. [Google Scholar]
  55. Kauffman, S.A.; Weinberger, E.D. The NK Model of Rugged Fitness Landscapes and Its Application to Maturation of the Immune Response. J. Theor. Biol. 1989, 141, 211–245. [Google Scholar] [CrossRef] [PubMed]
  56. Hu, L.; Xue, G.; Li, L.; Wang, M. Analysis of Coupling of Highway Traffic Risks in Geological and Meteorological Environment of Plateau Regions. China J. Highw. Transp. 2018, 31, 110–119. [Google Scholar] [CrossRef]
  57. Meng, X.; Li, H.; Zhang, W.; Zhou, X.-Y.; Yang, X. Analyzing Ship Collision Accidents in China: A Framework Based on the N-K Model and Bayesian Networks. Ocean Eng. 2024, 309, 118619. [Google Scholar] [CrossRef]
  58. Ganco, M. NK Model as a Representation of Innovative Search. Res. Policy 2017, 46, 1783–1800. [Google Scholar] [CrossRef]
  59. Woolson, R.F. Wilcoxon Signed-Rank Test. In Encyclopedia of Biostatistics; John Wiley & Sons, Ltd.: Hoboken, NJ, USA, 2005; ISBN 978-0-470-01181-2. [Google Scholar]
  60. Luo, L.; Yang, Z.; Yang, P.; Zhang, Y.; Wang, L.; Lin, H.; Wang, J. An Attention-Based BiLSTM-CRF Approach to Document-Level Chemical Named Entity Recognition. Bioinformatics 2018, 34, 1381–1388. [Google Scholar] [CrossRef] [PubMed]
  61. Xu, Y.; Zhang, L. Drilling Risk Named Entity Recognition Based on RoBERTa-BiLSTM-CRF. In Proceedings of the Third International Conference on Machine Vision, Automatic Identification, and Detection (MVAID 2024), Kunming, China, 16 August 2024; SPIE: Kunming, China; Volume 13230, pp. 246–251. [Google Scholar]
  62. Zhang, H.; Geng, H. A Methodology to Identify and Assess High-Risk Causes for Electrical Personal Accidents Based on Directed Weighted CN. Reliab. Eng. Syst. Saf. 2023, 231, 109027. [Google Scholar] [CrossRef]
  63. Yao, J.; Zhang, B.; Wang, D.; Lei, D.; Tong, R. Risk Coupling Analysis under Accident Scenario Evolution: A Methodological Construct and Application. Risk Anal. 2024, 44, 1482–1497. [Google Scholar] [CrossRef]
  64. Qiao, W. Analysis and Measurement of Multifactor Risk in Underground Coal Mine Accidents Based on Coupling Theory. Reliab. Eng. Syst. Saf. 2021, 208, 107433. [Google Scholar] [CrossRef]
Figure 1. Risk coupling analysis framework for traffic accidents.
Applsci 15 03114 g001
Figure 2. Risk factor identification framework for traffic accident.
Applsci 15 03114 g002
Figure 3. Risk coupling types.
Applsci 15 03114 g003
Figure 4. F1 scores at different similarity thresholds.
Applsci 15 03114 g004
Figure 5. Entity alignment result.
Applsci 15 03114 g005
Figure 6. Frequencies of different risk type status encodings in primary accidents (PA).
Applsci 15 03114 g006
Figure 7. Frequencies of different risk type status encodings in secondary accidents (SA).
Applsci 15 03114 g007
Figure 8. Risk probabilities of single risk types in different accident categories: (a) probabilities of single risks in PA; (b) probabilities of single risks in SA. Risk coupling probability values greater than 0.35 are highlighted with a black border.
Applsci 15 03114 g008
Figure 9. Risk coupling probabilities of two risk types in different accident categories: (a) coupling probabilities of two risks in PA; (b) coupling probabilities of two risks in SA. Risk coupling probability values greater than 0.35 are highlighted with a black border.
Applsci 15 03114 g009
Figure 10. Risk coupling probabilities of three risk types in different accident categories: (a) coupling probabilities of three risks in PA; (b) coupling probabilities of three risks in SA. Risk coupling probability values greater than 0.35 are highlighted with a black border.
Applsci 15 03114 g010
Figure 11. Risk coupling probabilities of four risk types in different accident categories: (a) coupling probabilities of four risks in PA; (b) coupling probabilities of four risks in SA. Risk coupling probability values greater than 0.35 are highlighted with a black border.
Applsci 15 03114 g011
Figure 12. Risk coupling values for different coupling scenarios in the two accident categories.
Applsci 15 03114 g012
Figure 13. Risk coupling values for the two-factor coupling type.
Applsci 15 03114 g013
Figure 14. Risk coupling values for the three-factor coupling type.
Applsci 15 03114 g014
Figure 15. Risk coupling values for the four-factor coupling type.
Applsci 15 03114 g015
Table 1. TRBERT pretraining corpus.
Data SourcesData DescriptionNo.
Sentences
Size (MB)
Accident investigation reports Text of case reports on traffic accidents issued by the China MEM and the relevant emergency management departments of various provinces and cities.584,654536
Chinese Emergency Corpus (CEC)CEC is built by the Data Semantic Laboratory at Shanghai University. This corpus is divided into five categories—earthquake, fire, traffic accident, terrorist attack, and intoxication of food. We extracted the text related to traffic accidents from this corpus.14,1496
Laws and regulationsText of Chinese road traffic law and regulation documents.10,0184
Table 2. Hyperparameter tuning of the TRBERT-BiLSTM-CRF model.
HyperparameterTuning RangeSelected Value
Learning rate1 × 10−5, 3 × 10⁻⁵, 5 × 10−53 × 10−5
Batch size8, 168
Training epoch10, 20, 3020
Dropout rate0.2, 0.4, 0.60.2
Max length128, 256,512256
Table 3. Comparison of the macro average results across different NER models.
Model p r e c i s i o n r e c a l l f 1 s c o r e
BiLSTM-CRF0.74300.77170.7570
RoBERTa-BiLSTM-CRF0.84200.84900.8455
BERT-BiLSTM-CRF0.84160.85080.8462
TRBERT-BiLSTM-CRF0.91000.94640.9278
Table 4. Performance of the TRBERT-BiLSTM-CRF model.
Entity Category p r e c i s i o n r e c a l l f 1 s c o r e s u p p o r t
HUMAN0.88330.92980.9060114
VEHICLE0.88460.93880.910949
ROAD0.93100.96430.947428
WEATHER1.00001.00001.00006
MANAGEMENT0.85110.89890.874389
m i c r o   a v g 0.88030.92660.9029286
m a c r o   a v g 0.91000.94640.9278286
w e i g h t e d   a v g 0.88060.92660.9030286
Table 5. Top three and bottom three risk coupling scenarios in PA and SA.
RankCoupling ScenarioCoupling ValueCoupling ScenarioCoupling Value
PASA
1 T 5 H , V , R , W , M 0.096555 T 4,1 H , V , R , W 0.155031
2 T 4,1 H , V , R , W 0.093765 T 4,5 V , R , W , M 0.151980
3 T 4,5 V , R , W , M 0.093676 T 4,2 H , V , R , M 0.129920
24 T 2,4 H , M 0.000196 T 2,4 H , M 0.003938
25 T 2,3 H , W 0.000165 T 2,1 H , V 0.001474
26 T 2,2 H , R 0.000052 T 2,10 W , M 0.001270
Table 6. Wilcoxon signed-rank test results for risk coupling values in the two accident categories.
GroupACQ1MediumQ3StatisticZp-ValueHypothesis Accepted
PA-SAPA0.00490.02790.096690.0−2.15880.0292H1
SA0.01180.03910.0930
Table 7. Accident prevention and investigation suggestions.
ACKey Risk TypesRisk FactorsPrevention and Control MeasuresInvestigation Suggestions
PAManagementNegligence in safety management, lack of supervision, insufficient education and training, insufficient perception equipment, ineffective dynamic monitoring, insufficient hazard identification and remediation, etc.Strengthen dynamic monitoring of key vehicles, regularly check safety training and education records, conduct regular safety hazard inspections and rectifications, and strengthen traffic safety publicity through various channels such as online platforms and offline activities. Focus on providing safety training for drivers of operational vehicles.After PA, focus on investigating the driver, the operating management unit of the accident vehicle, and the supervising unit.
WeatherRainy, snowy, foggy, low visibility.Traffic operators can use third-party platforms to push adverse weather alerts and should also strengthen signal guidance. When necessary, control measures such as speed limits and temporary road closures should be implemented.After PA, collect and analyze information such as rainfall, snowfall, and visibility for the accident location, with particular focus on agglomerate fog in mountainous areas.
VehicleNoncompliant vehicle specifications, illegal modifications, overloading or oversize load, missing or unclear reflective markings, etc.Regularly inspect and maintain the vehicle’s driving system, braking system, lighting system, safety system, and facilities to eliminate safety hazards. Strengthen the work on controlling overloaded vehicles.After PA, the vehicle specifications should be checked for defects and faults, with particular attention given to any overloading or weight limit violations.
SARoadDownhill, curved roads, road debris, slippery road surfaces, road congestion, nighttime, etc.Strengthen accident information reminders upstream of unfavorable road conditions. Implement remote traffic flow diversion and speed limit measures when necessary. Warnings at the scene of the accident should be strengthened at night.After SA, the road design and layout should be checked for any design defects, with a focus on the road conditions and traffic conditions at the time of SA.
VehicleNoncompliant vehicle specifications, illegal modifications, overloading or oversize load, missing or unclear reflective markings, etc.The vehicles involved in PA should be moved to the hard shoulder as soon as possible, and signal guidance should be provided upstream of the accident area. The cargo should be promptly verified to determine whether it contains flammable or explosive materials.After SA, the accident vehicle specifications should be checked for defects and faults and whether the vehicle is loaded with flammable and explosive goods. Attention should be paid to whether there is abnormal parking behavior after the occurrence of PA.
Disclaimer/Publisher’s Note: The statements, opinions and data contained in all publications are solely those of the individual author(s) and contributor(s) and not of MDPI and/or the editor(s). MDPI and/or the editor(s) disclaim responsibility for any injury to people or property resulting from any ideas, methods, instructions or products referred to in the content.

