Article

Automated Coronary Artery Identification in CT Angiography: A Deep Learning Approach Using Bounding Boxes

by
Marin Sakamoto
1,
Takaaki Yoshimura
2,3,4,5 and
Hiroyuki Sugimori
4,5,6,*
1
Graduate School of Health Sciences, Hokkaido University, Sapporo 060-0812, Japan
2
Department of Health Sciences and Technology, Faculty of Health Sciences, Hokkaido University, Sapporo 060-0812, Japan
3
Department of Medical Physics, Hokkaido University Hospital, Sapporo 060-8648, Japan
4
Global Center for Biomedical Science and Engineering, Faculty of Medicine, Hokkaido University, Sapporo 060-8638, Japan
5
Clinical AI Human Resources Development Program, Faculty of Medicine, Hokkaido University, Sapporo 060-8638, Japan
6
Department of Biomedical Science and Engineering, Faculty of Health Sciences, Hokkaido University, Sapporo 060-0812, Japan
*
Author to whom correspondence should be addressed.
Appl. Sci. 2025, 15(6), 3113; https://doi.org/10.3390/app15063113
Submission received: 9 February 2025 / Revised: 5 March 2025 / Accepted: 11 March 2025 / Published: 13 March 2025

Abstract

:
Introduction: Ischemic heart disease represents one of the main causes of mortality and morbidity, requiring accurate, noninvasive imaging. Coronary Computed Tomography Angiography (CCTA) offers a detailed coronary assessment but can be labor-intensive and operator-dependent. Methods: We developed a bounding box-based object detection method using deep learning to identify the right coronary artery (RCA), left anterior descending artery (LCA-LAD), and left circumflex artery (LCA-CX) in the CCTA cross-sections. A total of 19,047 images, which were recorded from 52 patients, underwent a five-fold cross-validation. The evaluation metrics included Average Precision (AP), Intersection over Union (IoU), Dice Similarity Coefficient (DSC), and Mean Absolute Error (MAE) to achieve both detection accuracy and spatial localization precision. Results: The mean AP scores for RCA, LCA-LAD, and LCA-CX were 0.71, 0.70, and 0.61, respectively. IoU and DSC indicated a better overlap for LCA-LAD, whereas LCA-CX was more challenging to detect. The MAE analysis showed the largest centroid deviation in RCA, highlighting variable performance across the artery classes. Discussion: These findings demonstrate the feasibility of automated coronary artery detection, potentially reducing observer variability and expediting CCTA analysis. They also highlight the need to refine the approach for complex anatomical variants or calcified plaques. Conclusion: A bounding box-based approach can thereby streamline clinical workflows by localizing major coronary arteries. Future research with diverse datasets and advanced visualization techniques may further enhance diagnostic accuracy and efficiency.

1. Introduction

Ischemic heart disease (IHD) remains one of the most significant contributors to morbidity and mortality worldwide, imposing a substantial burden on healthcare systems and resources. Despite the advances in preventive strategies and therapeutic interventions, the global prevalence of IHD continues to rise, driven in part by population aging, changing lifestyles, and the growing incidence of risk factors such as diabetes and obesity [1]. IHD encompasses a range of clinical presentations, including chronic stable angina, acute coronary syndromes, and myocardial infarction, all of which have profound implications for patient outcomes. A central mechanism underlying these conditions is atherosclerosis, a progressive inflammatory process characterized by the accumulation of lipids, cholesterol, and fibrous elements within the arterial wall. Over time, atherosclerosis can lead to luminal narrowing in the coronary arteries, impairing myocardial perfusion and heightening the likelihood of ischemic events. Therefore, the timely detection and accurate quantification of coronary artery lesions are essential for guiding clinical decision-making and improving patient prognosis [1].
Over the past two decades, Coronary Computed Tomography Angiography (CCTA) has emerged as a key noninvasive imaging modality for the assessment of coronary artery disease (CAD). Compared to invasive coronary angiography, CCTA offers the advantage of visualizing both the coronary lumen and the arterial wall, enabling the early identification of plaque burden and the degree of luminal stenosis [2]. Advances in scanner technology, such as higher temporal and spatial resolution, have further improved the diagnostic accuracy of CCTA. Additionally, its relatively lower risk profile and broader accessibility in many clinical settings have encouraged wider adoption. By providing detailed anatomical information, CCTA can also reduce the need for unnecessary invasive procedures in individuals ultimately found to have nonobstructive or minimal disease, thereby optimizing resource utilization [3]. Nevertheless, substantial challenges remain in CCTA image processing and interpretation. The manual post-processing of CCTA datasets is both time-consuming and operator-dependent; approaches like maximum intensity projection (MIP) and curved planar reformation (CPR) [4,5,6,7] can help but still produce artifacts due to vessel overlap and the complex three-dimensional structure of the coronary arteries.
In recent years, deep learning has shown remarkable potential in advancing the field of medical imaging, offering powerful tools for automated detection, segmentation, and classification across diverse imaging modalities such as CT [8,9], MRI [10,11,12], and X-ray [13,14]. Convolutional neural networks (CNNs), in particular, have revolutionized object recognition tasks and are widely employed to detect and characterize pathological structures. While many of these efforts have focused on disease detection or classification [15,16,17,18,19], there is an increasing need to leverage deep learning for more efficient image preprocessing and visualization workflows. In the context of coronary imaging, deep learning can alleviate the high volume of manual CCTA post-processing by identifying, tracking, and segmenting coronary arteries with minimal user input [20]. However, the issues of variability in imaging protocols, scanner hardware, and patient populations persist, underscoring the necessity for robust, generalizable algorithms that integrate seamlessly into clinical workflows. Recent works leveraging U-Net and Mask R-CNN for coronary segmentation underscore the complexity of arterial geometry and potential misregistration near branching points [21,22,23,24,25]. In contrast, our bounding box strategy focuses on localizing vessels without merging distinct structures.
In this work, we aim to address these challenges by focusing on an object-detection approach for identifying coronary arteries in cross-sectional CCTA images. Rather than relying solely on labor-intensive segmentation, we propose bounding box-based detection to streamline the visualization and interpretation process. This approach may reduce operator dependence by more quickly highlighting relevant vessel segments. Crucially, achieving accurate detection in CCTA entails addressing complex anatomical structures, variable image quality, and potential motion artifacts—factors that can affect both model training and real-world performance.
In summary, our contributions are as follows:
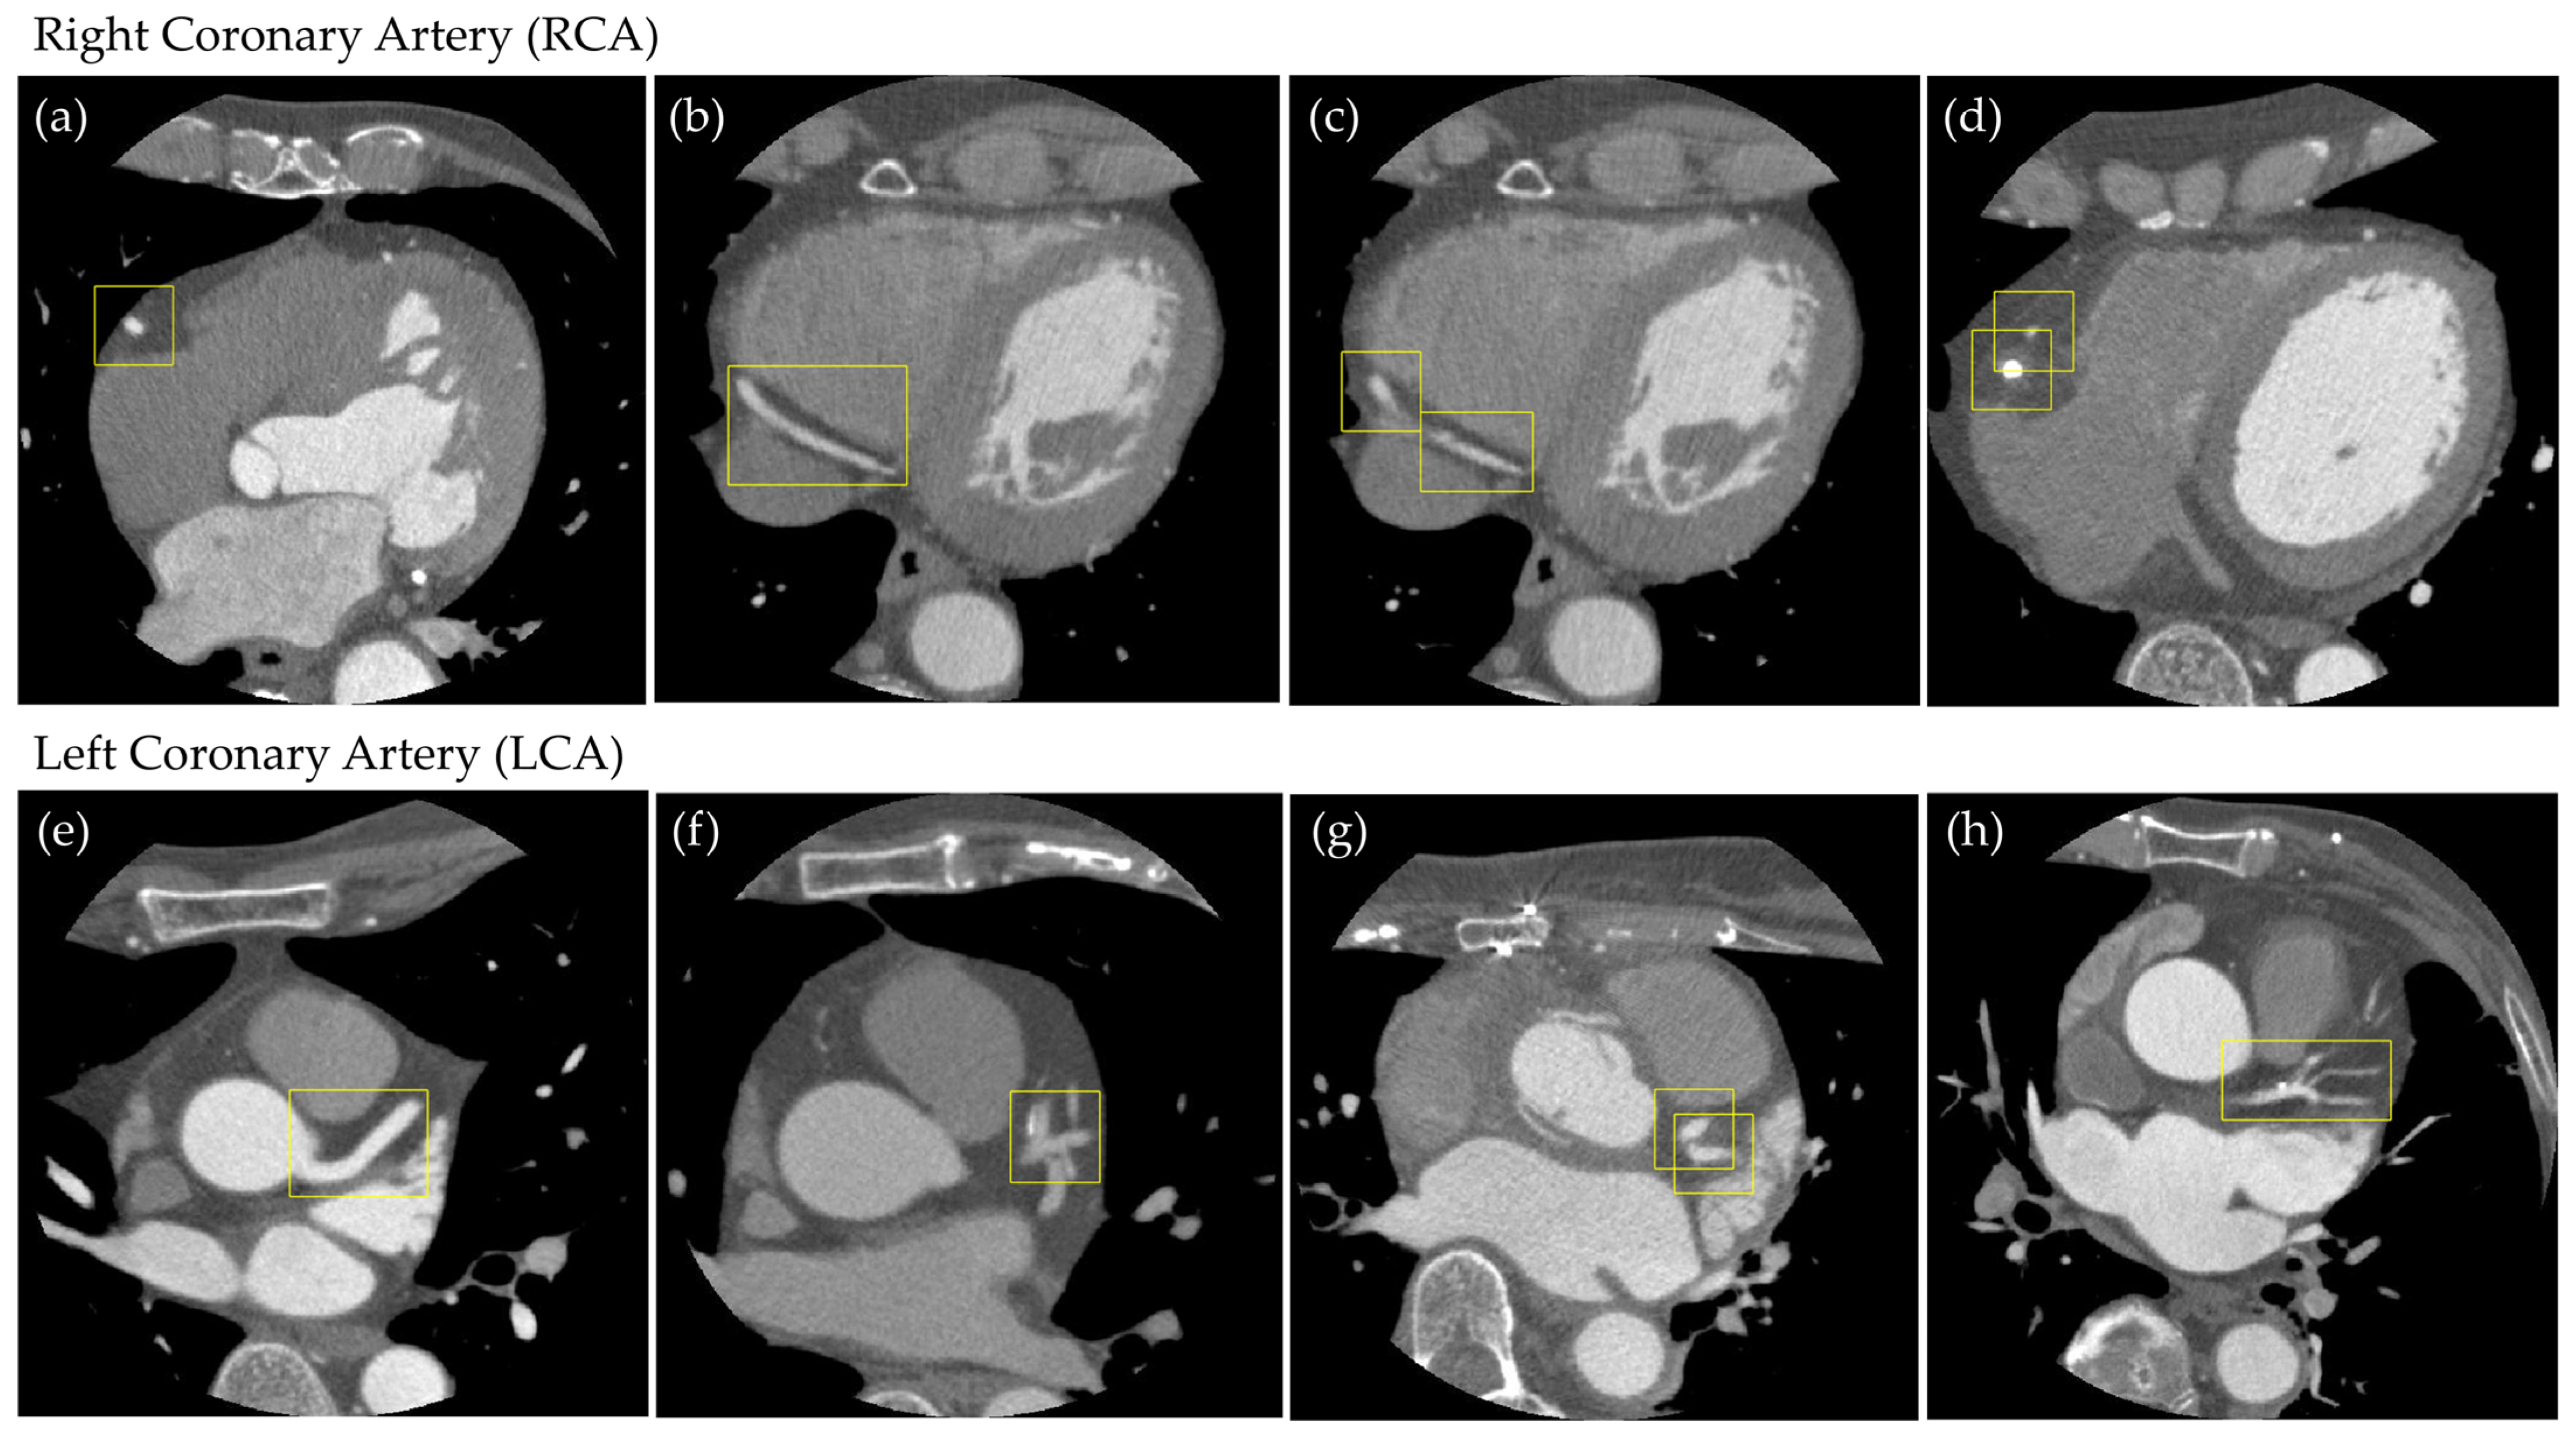
  • We propose an annotation method that defines bounding boxes for major coronary arteries (RCA, LCA-LAD, and LCA-CX) in cross-sectional CCTA slices, enabling systematic and reproducible labeling.
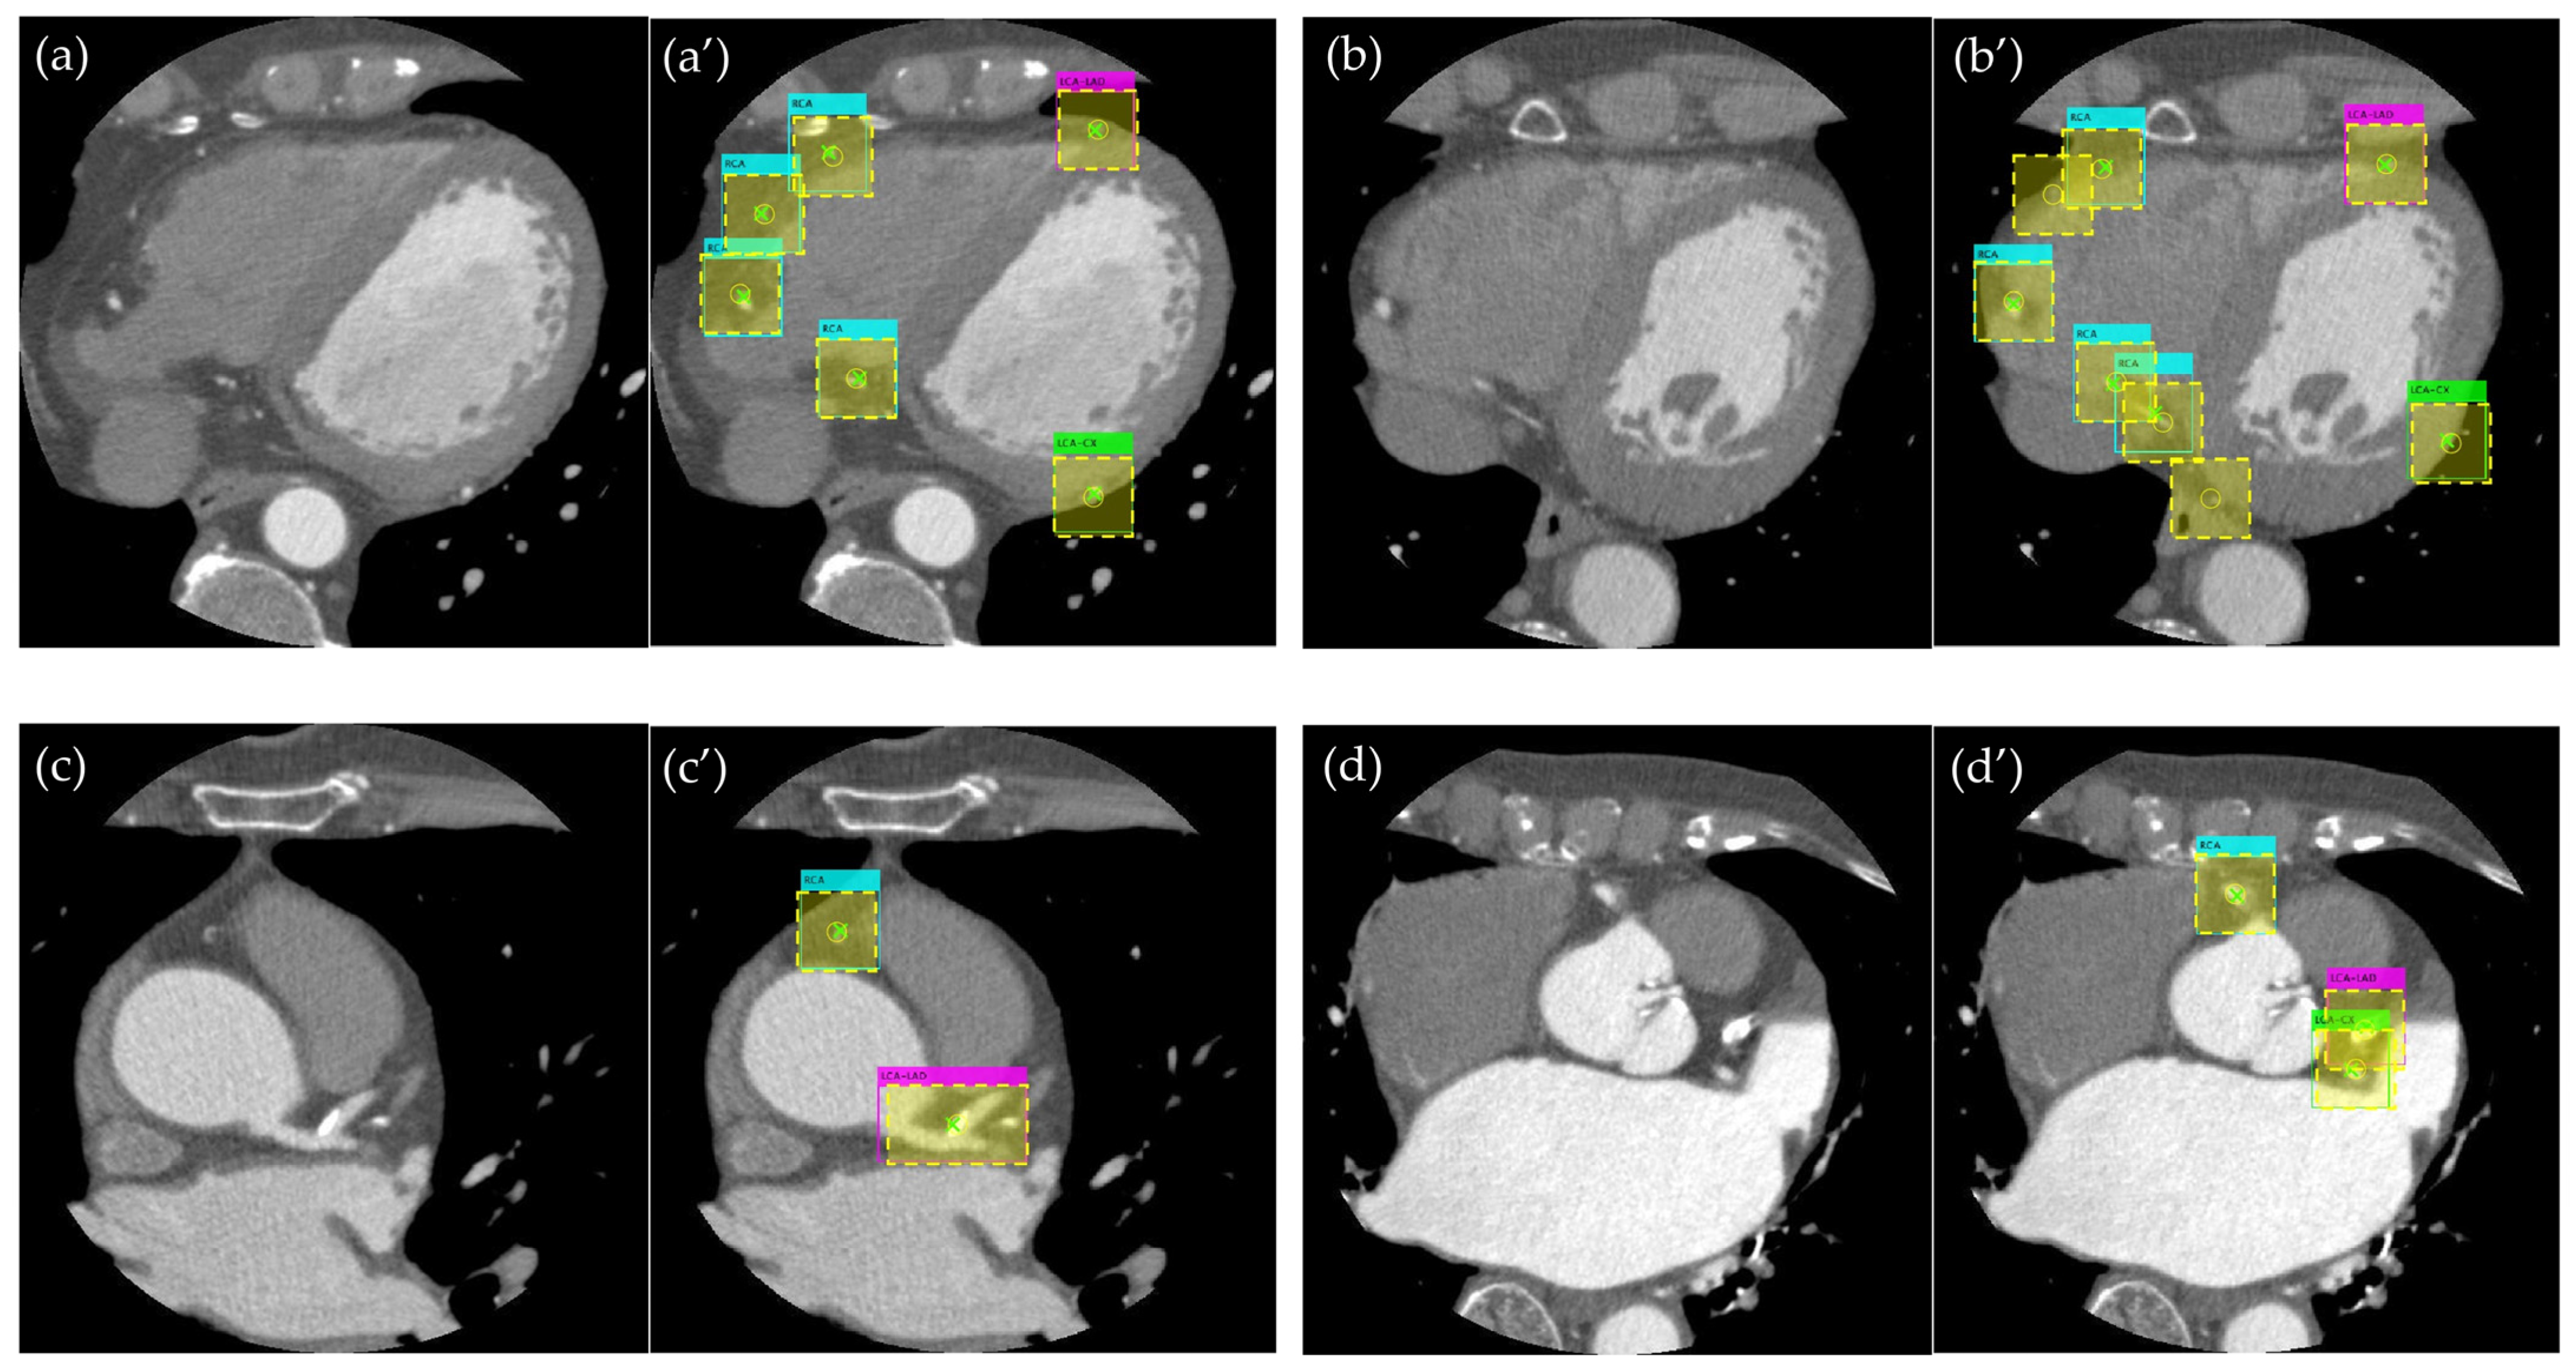
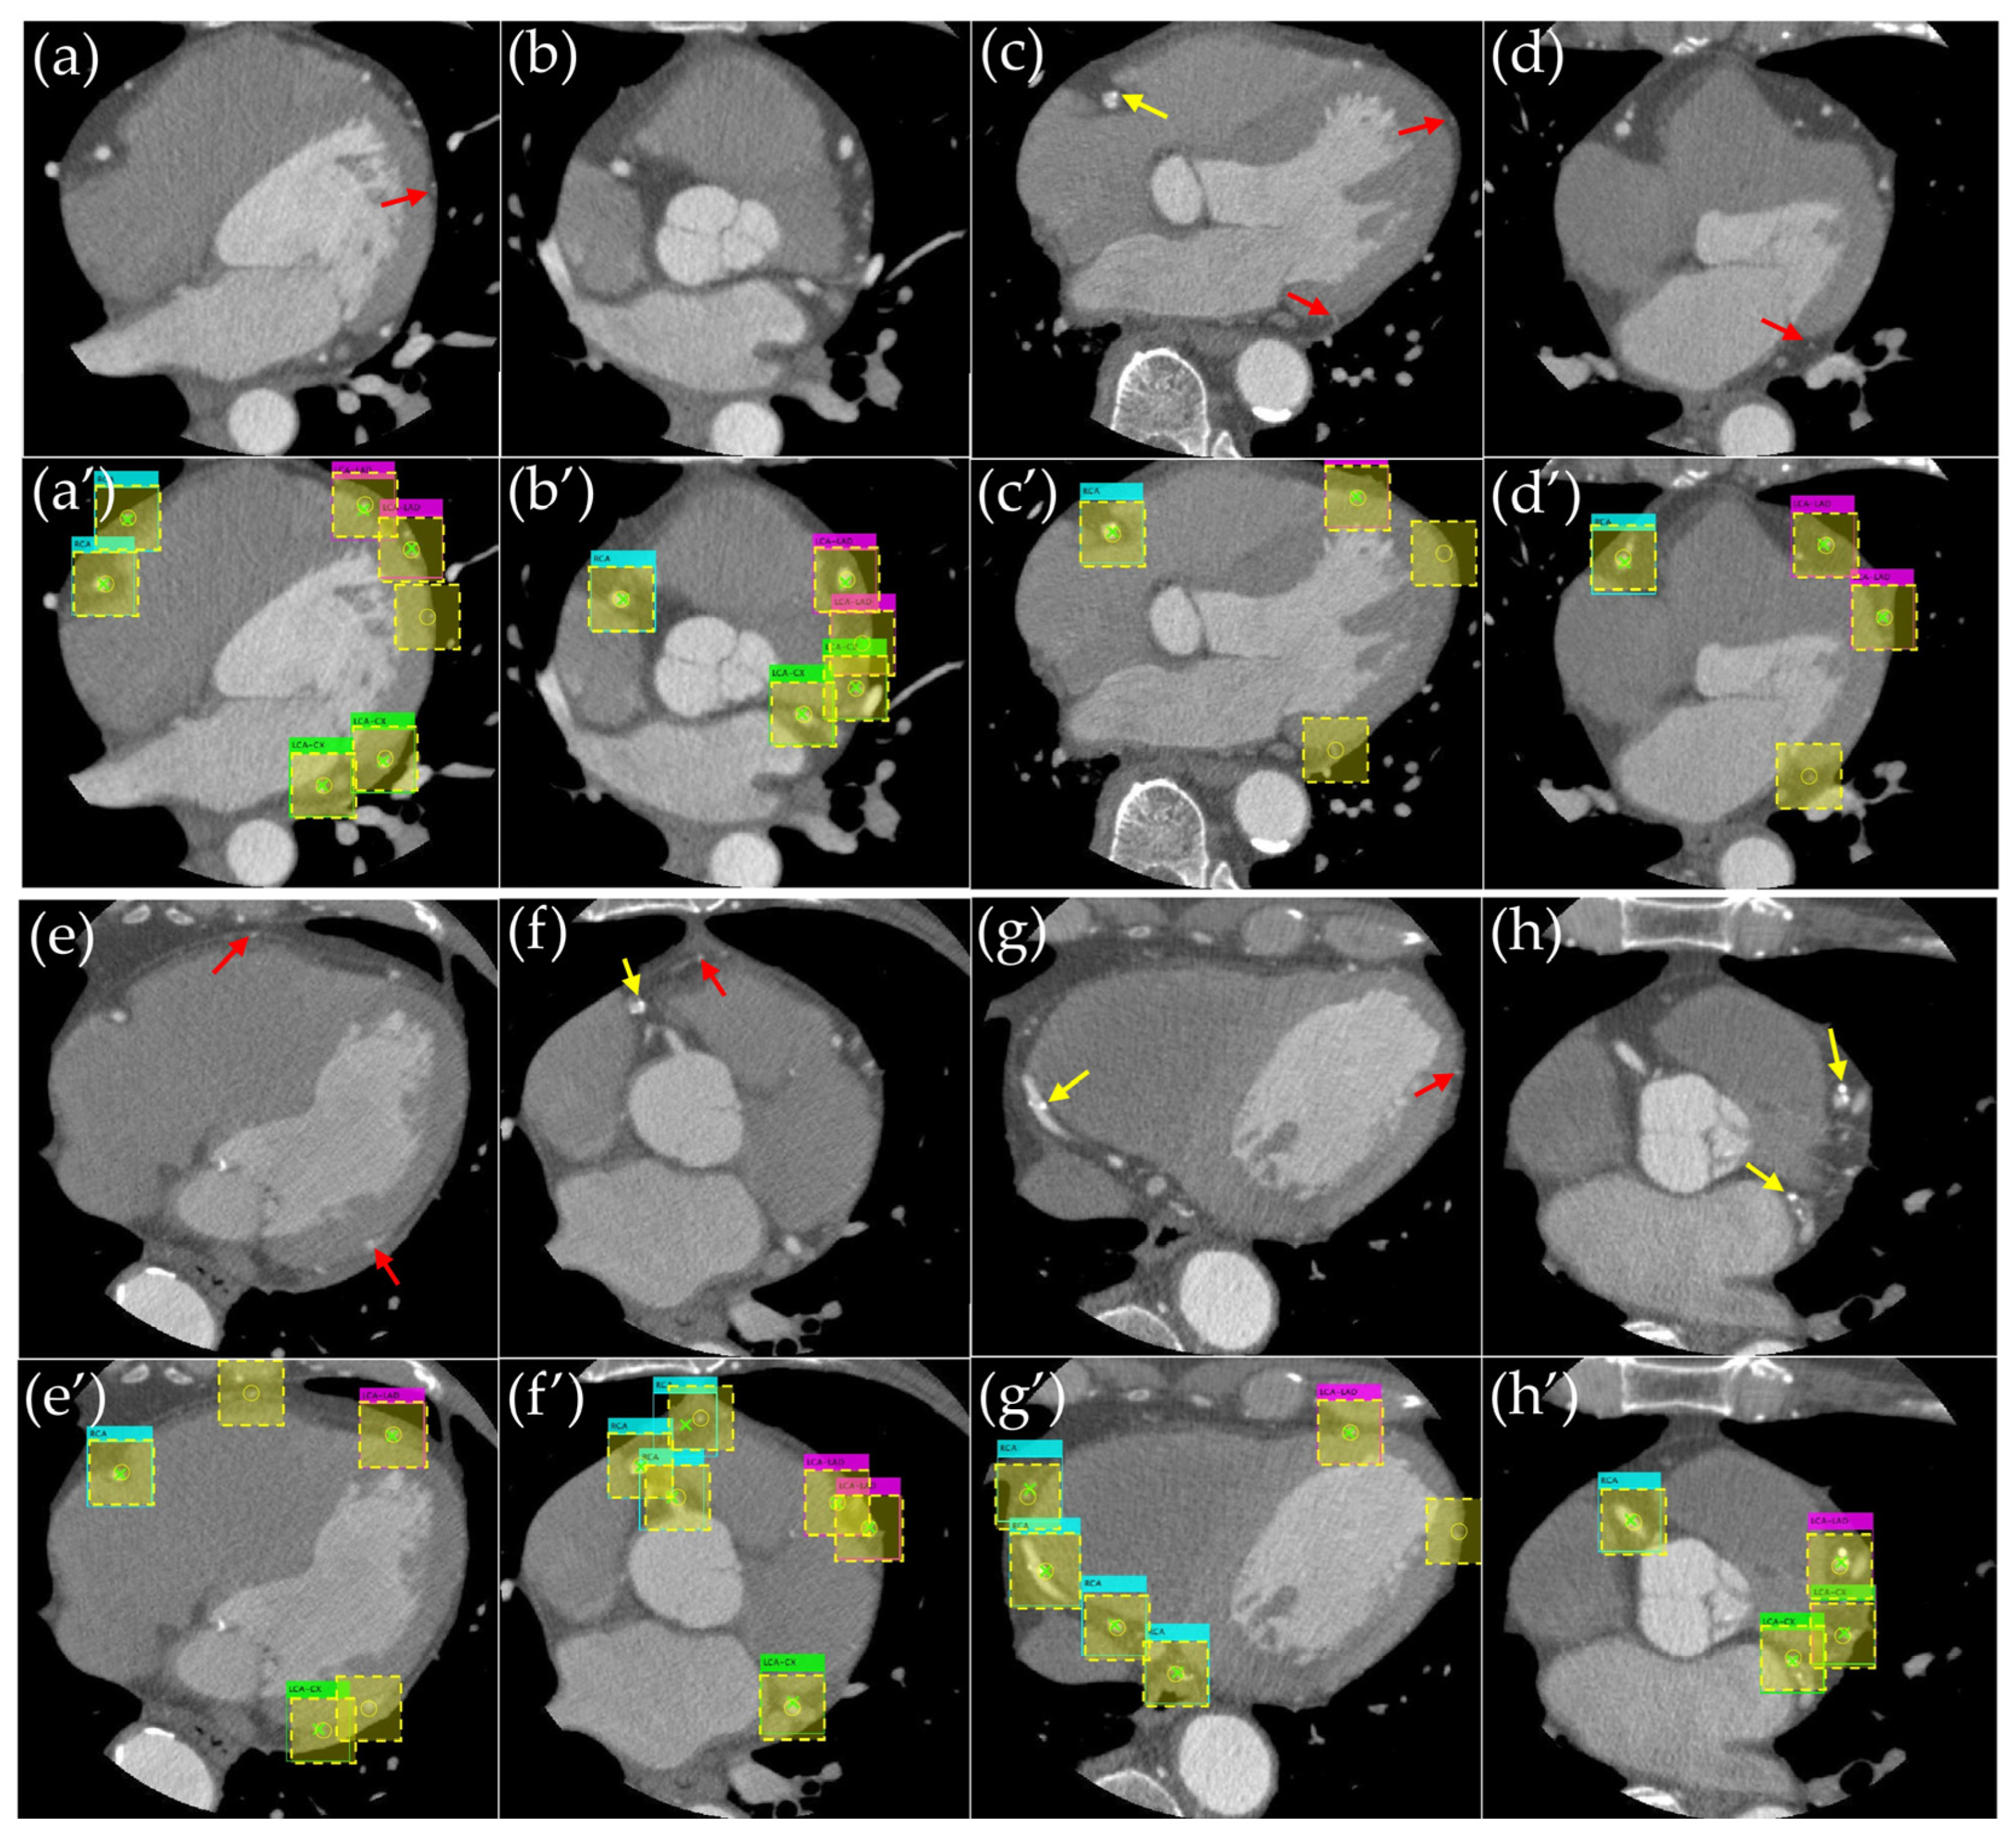
  • We develop and evaluate a deep learning pipeline using object detection techniques, integrating conventional metrics (e.g., Average Precision) with novel criteria (e.g., localization error) to capture the distinct ways detection failures manifest.
  • We provide a comprehensive framework that highlights the most significant sources of detection error, offering insights into potential improvements in automated CCTA preprocessing. This framework can be further extended to advanced visualization strategies or 3D reconstructions, promoting more standardized and reliable coronary vessel identification.
Through these efforts, our study offers a new perspective on streamlining CCTA interpretation. By systematically detecting coronary vessels and elucidating error patterns, we aim to reduce the manual burden in clinical workflows.

Related Work

Recent studies in coronary CT imaging have demonstrated the importance of optimizing visualization and diagnostic accuracy through both advanced hardware and post-processing algorithms. For instance, the application of high-resolution CT scanners and iterative reconstruction techniques has improved the reliability of plaque characterization, as well as the detection of subtle calcifications [26,27]. However, such advancements still rely heavily on time-consuming manual review, which can introduce subjectivity and reduce clinical throughput.
To address this limitation, various automated or semi-automated methods have been explored. Conventional approaches often employ vessel centerline extraction, followed by lumen segmentation, requiring careful initialization and extensive parameter tuning [28,29]. More recently, deep learning architectures tailored to heart CT images have shown promise in automatically delineating key structures with minimal user interaction [30]. By leveraging large, annotated datasets and sophisticated network designs, these solutions aim to reduce operator dependence while achieving robust performance across different patient cohorts. Although promising, challenges such as heterogeneous acquisition protocols, motion artifacts, and inter-patient anatomical variability highlight the need for generalizable pipelines capable of adapting to real-world clinical settings. Future directions may thus include domain adaptation strategies, multi-scale feature extraction, and the incorporation of explainable AI components, each of which could further improve both the interpretability and reliability of automated coronary CT analysis.

2. Materials and Methods

2.1. Subjects

In this study, we employed retrospectively acquired CCTA images from the Hokkaido University Hospital for the purpose of developing and evaluating an automated coronary artery extraction algorithm based on deep learning. Due to privacy and ethical restrictions, the dataset is not publicly available. The dataset included 52 individuals who underwent CCTA to assess the presence of coronary artery disease, resulting in a total of 19,047 cross-sectional images. All images were anonymized prior to analysis to safeguard patient confidentiality, and the institutional review board requirements of the Hokkaido University Hospital were observed.
To standardize image quality and ensure reproducibility, each patient’s CCTA examination was performed using electrocardiogram (ECG)-gated multidetector computed tomography. Typical scanning parameters included a tube voltage of 120 kV, a current of 350–750 mA (modulated according to patient body habitus), and a slice thickness of 0.5 mm. The field of view was optimized to capture the entire heart and the proximal portions of the coronary vessels. All raw data were reconstructed using kernels specifically designed for cardiac imaging thus highlighting vascular structures and reducing motion and noise artifacts.

2.2. Hardware

We conducted all data analyses on a high-performance workstation equipped with substantial computational resources to accommodate the large-scale training of deep neural networks in MATLAB (2024b; The MathWorks, Inc., Natick, MA, USA). This system featured an Intel Core i9-10980XE CPU running at 3.0 GHz, with 64 GB of DDR4-2933 RAM in a quad-channel configuration, and two NVIDIA RTX A6000 GPUs, each with 48 GB of memory. These specifications provided sufficient processing power to handle large batch sizes and accelerated training routines. The workstation, running MATLAB on a Windows 11 operating system, was primarily used for training and validating the object detection network.

2.3. Supervised Data Creation

Ground truth annotations were generated to serve as the training basis for object detection. CCTA slices were examined by trained operators who identified the coronary segments according to predefined criteria. To avoid potential interobserver bias, all bounding boxes were determined by consensus among three radiological technologists (including one with over 20 years of experience in cardiac imaging). Each coronary artery was designated as a region of interest (ROI), bounding it precisely to capture the lumen and proximal branches. In the subsequent subsection, the specifics of object detection and how these bounding boxes were defined are discussed.

Object Detection

We used MATLAB for all the steps related to object detection, classifying the coronary arteries into three categories—right coronary artery (RCA), left anterior descending artery (LCA-LAD), and left circumflex artery (LCA-CX). When annotating vessels in each slice, we aimed to align the bounding box center with the arterial center while maintaining a fixed size of 64 × 64 pixels whenever possible. If an arterial segment extended horizontally beyond the bounding box edges, we expanded the bounding box accordingly. For discontinuous arteries or those with significant branching within a single slice, we assigned multiple bounding boxes to ensure accuracy. When multiple arteries appeared in a single bounding box, classification was performed according to the following guidelines: If all arteries were fully enclosed, we selected the highest-intensity artery for central alignment. If a lower-intensity vessel intersected the bounding box boundary, it was assigned a separate bounding box centered on its lumen.
A similar approach was applied to the left coronary system. The left main trunk (LMT) was categorized under the LCA-LAD label unless it was clearly continuous with the LCA-CX segment, in which case it was labeled as LCA-CX. When the LCA-LAD and LCA-CX were distinctly separate but fit within a single bounding box, additional bounding boxes were created to prevent the merging of distinct vessels in one annotation. Variants such as the high lateral branch, arising between the LAD and LCX, were included in the LCA-LAD category if they could not be distinctly separated in a given 2D slice. This overall annotation definition is illustrated in Figure 1.
The YOLOX [19] model was trained in MATLAB with an initial learning rate of 5.0 × 10⁻⁴ and a piecewise schedule reducing by 0.99 each epoch. The momentum was set to 0.9, and an L2 regularization factor of 5.0 × 10⁻⁴ was applied. We used a mini-batch size of 192, with the maximum number of epochs set to 5, and performed gradient clipping via the L2-norm method, with a threshold value of 30. No separate validation set was specified, and training loss was monitored as the objective metric. Training proceeded in a multi-GPU environment, utilizing moving averages for batch normalization statistics. These hyperparameter settings were not extensively optimized but were selected to ensure stable training under our hardware constraints.

2.4. Evaluation Methods

2.4.1. Object Detection

We used MATLAB to classify coronary arteries as RCA, LCA-LAD, and LCA-CX. For our primary evaluation metric, we adopted Average Precision (AP), which integrated both precision and recall. Following a common convention, we set IoU ≥ 0.5 as the criterion for a correct detection and calculated AP at this threshold. We then split the original set of 52 subjects (19,047 images) into training and test subsets in a 4:1 ratio. We performed five-fold cross-validation to capture the potential variations across the different patient subsets and to estimate the model’s ability to generalize. We then calculated AP by graphing precision against recall and measuring the area under the precision–recall curve, producing a single score between 0 and 1. Higher AP values indicated superior performance in terms of localization and classification accuracy.

2.4.2. Evaluation of Detection Accuracy Using Additional Metrics

While the object detection model evaluated in Section 2.4.1 provided the AP for three classes, AP alone does not fully capture the accuracy of localization, particularly in the context of coronary artery detection. Since the object detection model was trained and evaluated on cross-sectional images from coronary CT scans, bounding boxes of 64 × 64 pixels were centered on the vessels of interest. To assess whether the predicted bounding boxes were accurately centered on the target vessels, additional evaluation metrics beyond AP were introduced.
To quantify the overlap between the predicted bounding boxes and the ground truth annotations, the proportion of bounding boxes achieving IoU > 0.5 was calculated for each class. IoU measures the ratio of the intersection area to the union area between the predicted and ground truth bounding boxes, as follows:
I o U =   | B p   B g | | B p   B g |
where B p and B g represent the predicted and ground truth bounding boxes, respectively. The percentage of bounding boxes meeting this threshold was computed and normalized by the total number of annotated vessels per class.
Similarly, the Dice Similarity Coefficient (DSC) was calculated to evaluate spatial overlap, using the following formula:
D S C =   2 | B p   B g | B p + | B g |
For each coronary artery class—right coronary artery (RCA), left coronary artery–left anterior descending (LCA-LAD), and left coronary artery–circumflex (LCA-CX)—the number of bounding boxes with DSC > 0.5 was determined, and the results were normalized as with IoU.
To further evaluate localization accuracy, an additional analysis was conducted based on the midpoints of the bounding boxes. Since each bounding box was expected to be centered on a coronary artery, measuring the deviation of the detected bounding box center from the ground truth annotation provided an intuitive assessment of localization performance. The Euclidean distance between the midpoints of the predicted and ground truth bounding boxes was computed using the following equation:
d   = x p x g 2 y p y g 2
where (xp,yp) represents the coordinates of the predicted bounding box center, and (xg,yg) represents the coordinates of the ground truth bounding box center. For each image, the centroid of the ground truth bounding box was compared to the centroid of the detected bounding box, and the smallest distance among detected instances was considered as the localization error. The mean of these distances was used as the Mean Absolute Error (MAE) to quantify how far the detected bounding box centers deviated from the actual vessel centers. Additionally, to ensure consistency with the clinical applications, the pixel-wise MAE values were converted into millimeters using the known spatial resolution of the CT images. To account for the variations across the different patient subsets and ensure robust evaluation, a five-fold cross-validation was performed, and all the above metrics (IoU, DSC, and MAE) were evaluated separately for each fold.
By combining these evaluations, a more comprehensive assessment of detection accuracy was obtained. The IoU- and DSC-based analysis provided insights into the spatial overlap between the detected and ground truth bounding boxes, while the midpoint deviation analysis directly quantified how precisely the bounding boxes were centered on the target vessels (Figure 2). These additional evaluations complemented AP by offering a more detailed understanding of both spatial alignment and localization precision.

3. Results

3.1. Evaluation of the Object Detection Model

The results of the object detection model are summarized in Table 1, which presents the AP values for each of the three major coronary arteries (RCA, LCA-LAD, and LCA-CX) across five folds. For the RCA, the AP values ranged from 0.68 (fold5) to 0.72 (fold2 and fold4), resulting in a mean of 0.71. The LCA-LAD showed the lowest AP of 0.62 in fold2, while the highest was 0.78 in fold4, with a mean of 0.70. Meanwhile, the AP for the LCA-CX varied between 0.57 (fold4) and 0.64 (fold3), producing an overall mean of 0.61. Notably, the highest single-fold AP observed was 0.78 (LCA-LAD in fold4), whereas the lowest was 0.57 (LCA-CX in fold4). These findings indicate that the model performed best in detecting the RCA, followed by the LCA-LAD, and lastly the LCA-CX.

3.2. Evaluation of Detection Accuracy Using Additional Metrics

The performance of the object detection model was assessed using three metrics—IoU, DSC, and MAE. These metrics were evaluated for three coronary artery types—RCA, LCA-LAD, and LCA-CX. The results were analyzed across a five-fold cross-validation.

3.2.1. IoU Above Threshold Rates

The IoU-based analysis evaluated the proportion of bounding boxes achieving a spatial overlap above a threshold of 0.5. The results, summarized in Table 2, indicate consistent detection performance for all artery types. The mean IoU rates were 77.2% for the RCA, 79.3% for the LCA-LAD, and 71.1% for the LCA-CX. Notably, the LCA-LAD demonstrated the highest mean IoU rate among the three arteries, suggesting better spatial alignment for this class. The fold-wise results showed some variability, with the RCA achieving its highest rate of 82.0% in fold3 and the LCA-LAD reaching a peak of 84.2% in fold4. For the LCA-CX, the rates were relatively lower, with a peak of 76.7% in fold1.

3.2.2. DSC Above Threshold Rates

The DSC metric provided an additional perspective on spatial overlap. The results, as shown in Table 3, indicate that the mean DSC values were 79.0% for the RCA, 81.1% for the LCA-LAD, and 73.8% for the LCA-CX. Similar to the IoU results, the LCA-LAD demonstrated a superior performance in terms of overlap, achieving its highest fold-wise value of 85.5% in fold4. The RCA also exhibited a strong performance, with a peak DSC of 84.0% in fold3. In contrast, the LCA-CX had the lowest mean DSC, with fold4 showing the weakest performance at 66.1%. These results highlight a consistent pattern where the LCA-LAD and the RCA achieved higher spatial overlap compared to the LCA-CX.

3.2.3. Mean Absolute Error (MAE)

The localization accuracy was evaluated using the MAE, which measured the average deviation between the predicted and ground truth bounding box centers. The results are presented in Table 4. The mean MAE values were 15.6 mm for the RCA, 10.5 mm for tyeh LCA-LAD, and 5.8 mm for the LCA-CX. The LCA-CX achieved the best localization precision, reflected in the lowest MAE value. Conversely, the RCA had the highest MAE, indicating larger deviations in localization. Fold-wise analysis revealed that the LCA-CX consistently maintained low MAE values across all folds, with the best performance of 4.5 mm in fold5. Meanwhile, RCA exhibited the highest MAE of 18.3 mm in fold4, showing variability in its localization accuracy.
Overall, the results indicate that the object detection model demonstrated the best overlap-based performance (IoU, DSC) in detecting and localizing the LCA-LAD, followed by the RCA, whereas the LCA-CX exhibited lower overlap metrics but the best localization accuracy, as evidenced by the smallest MAE. These findings underscore that different evaluation metrics can highlight different aspects of detection accuracy, and they collectively provide a comprehensive assessment of the model’s performance across multiple arterial classes.
Figure 3 illustrates an example of this variability. The yellow arrow highlights a coronary artery that appears relatively faint, leading to a missed detection by the model despite being annotated as a ground truth. In contrast, the red arrow indicates a calcified lesion with a high CT value, which was accurately detected at the vessel center. This outcome suggests that the model may not be heavily influenced by random high-intensity values such as calcification and instead appears more sensitive to low-contrast vessels. Coronary artery detection can fail when the arterial lumen appears only slightly brighter than the surrounding tissues, whereas strong calcifications might not necessarily degrade localization performance.

4. Discussion

This study employed a bounding box-based object detection approach to identify and localize coronary arteries (RCA, LCA-LAD, and LCA-CX) in CCTA images, building on the foundations laid out in our Introduction, Materials and Methods, and Results Sections. By highlighting the arterial lumen on cross-sectional slices, our model aimed to simplify a process that has traditionally been time-consuming and operator-dependent. Although the existing object detection literature often focuses on metrics such as Average Precision (AP), our study revealed that a broader set of metrics (IoU Above Threshold Rates, DSC Above Threshold Rates, and MAE) offers deeper insights.
A major finding was the varying performance across the three arterial classes. The LCA-LAD consistently showed stronger overlap-based metrics (IoU and DSC), suggesting that it is more conspicuous on the CCTA cross-sections. However, the LCA-CX exhibited lower mean IoU and DSC values, implying that its anatomical course around the mitral valve annulus, along with a complex branching pattern, introduces challenges during model training and inference. Notably, the LCA-CX often displayed relatively low MAE values in some folds, indicating that, when identified, the center of its bounding box tended to be aligned precisely on the arterial lumen. These class-dependent differences underscore the importance of using multiple metrics rather than relying on AP alone. While direct comparisons with voxel-based segmentation approaches are difficult due to differing annotation protocols, our measured DSC is essentially the same as the DSC = 0.74 reported in [31]. This finding suggests that our bounding box-based method achieves a comparable overlap accuracy to segmentation-based studies, even though the methodologies differ.
From a clinical perspective, these findings are significant. Coronary artery disease continues to be a leading cause of morbidity and mortality worldwide, necessitating the accurate interpretation of CCTA images for risk stratification and treatment planning [32]. Recent studies have further emphasized the importance of automated image analysis in improving clinical workflow efficiency and diagnostic accuracy [24,33]. By providing automated bounding boxes that highlight candidate arterial cross-sections, the proposed approach can streamline interpretation, reduce the time radiologists spend on routine tasks, and potentially improve diagnostic consistency. Although our bounding box-based approach has the potential to reduce inter-operator variability in identifying coronary arteries, the level of expertise required to acquire CCTA images remains crucial. Trained personnel are needed to ensure proper gating, contrast administration, and artifact minimization. Therefore, automation in post-processing does not eliminate the need for skilled operators but rather complements their efforts to enhance overall workflow efficiency. One unique strength of the bounding box-based methodology, as opposed to voxel-wise or pixel-wise segmentation approaches, is that it naturally avoids merging arteries and veins when their attenuation or morphology is ambiguous. Bounding boxes demand that each coronary artery be treated as a distinct object, reducing the risk of blending different structures into a single segmented region. This distinction is particularly important in complex anatomical configurations where traditional segmentation methods often struggle [34]. From a methodological standpoint, bounding box detection offers a simplified alternative to conventional voxel-based or centerline-based approaches. While segmentation methods can provide more detailed morphological information, they may inadvertently merge adjacent vascular structures in complex anatomical regions. Our approach aims to rapidly highlight relevant arterial segments, minimizing overlap errors and facilitating potential downstream analyses of stenosis or plaque burden. However, fully automated segmentation can be advantageous when a more precise quantification of vessel geometry is required, underscoring the complementary nature of these methods.
This study has several limitations that should be acknowledged. First, while bounding box detection helps mitigate confusion with adjacent veins, it does not capture the vessel’s full luminal geometry. For tasks requiring precise measurements of stenosis severity or plaque burden, additional segmentation or plaque quantification tools may be necessary. Second, our dataset, though comprising over 19,000 images, was derived from a relatively homogeneous patient cohort in a single institution. Future work would benefit from external validation using more heterogeneous data, especially in cases involving heavy calcifications, coronary stents, or bypass grafts. Unfortunately, expanding our study to include multi-institutional data or implementing extensive new experiments was beyond the scope of the current research due to regulatory and resource constraints. Similarly, the public release of patient data was not possible due to privacy regulations and institutional policies governing protected health information [35]. Third, interpretability remains an inherent challenge of deep learning; clinicians cannot always discern which features the network relies upon for its predictions. Recent advances in explainable AI techniques might offer potential solutions to this challenge in the future iterations of our model [36]. Fourth, we did not systematically compare YOLOX with other commonly used deep learning architectures (e.g., U-Net, Mask R-CNN, nnU-Net) in a head-to-head manner. Although we performed the initial segmentation trials using U-Net, frequent misclassifications of adjacent vascular structures prompted us to shift toward bounding box detection. A more comprehensive evaluation of multiple architectures would clarify the relative performance and feasibility of YOLOX-based detection, potentially revealing the advantages or limitations compared to other network designs. Finally, smaller secondary branches and rarer anatomical variants, which can be clinically significant, were not extensively evaluated in this study.
Looking ahead, a promising extension of this work is to integrate bounding box detection with 3D visualization workflows, such as curved planar reformations (CPRs) or volume-rendered images, to further reduce operator dependence in generating clinically relevant views. The bounding boxes could serve as initial regions of interest for more advanced segmentation or computational fluid dynamics analyses. This integration could potentially address some of the current limitations in the quantitative assessment of coronary stenosis and plaque characterization [37]. As the volume of CCTA studies continues to grow, automating the detection and localization of coronary arteries has the potential to expedite clinical workflows and enhance diagnostic consistency. Further optimization and validation in diverse clinical settings will be essential to fully realize these benefits. Ultimately, bounding box-based object detection could become a key component in the standardization and automation of CCTA interpretation, contributing to better patient outcomes in the management of ischemic heart disease.

5. Conclusions

In this study, we demonstrated that a bounding box-based object detection framework can effectively identify and localize the three major coronary arteries (RCA, LCA-LAD, and LCA-CX) in cross-sectional CCTA images. By enriching our evaluation beyond the conventional Average Precision (AP) metric to include IoU Above Threshold Rates, DSC Above Threshold Rates, and MAE, we obtained a more thorough understanding of the method’s spatial precision and positional alignment. Although the LCA-LAD exhibited generally superior performance across most metrics, class-dependent differences highlighted the variability in coronary anatomy and imaging conditions that can challenge machine learning-based detection.
These findings underscore the merit of bounding box detection in reducing the risk of misidentifying cardiac veins or other structures as arterial cross-sections. Future work will include validating the framework on larger, multi-institutional datasets, refining artifact correction strategies, and integrating bounding box detections with 3D visualization tools. Ultimately, these efforts aim to further streamline and standardize CCTA interpretation, improving diagnostic workflows and patient outcomes in ischemic heart disease management.

Author Contributions

M.S. contributed to the data analysis, algorithm construction, and writing and editing of the manuscript. T.Y. reviewed and edited the manuscript. H.S. proposed the idea and contributed to the data acquisition, performed supervision and project administration, and reviewed and edited the manuscript. All authors have read and agreed to the published version of the manuscript.

Funding

This research received no external funding.

Institutional Review Board Statement

This study was conducted by the principles of the Declaration of Helsinki and was approved by the Institutional Review Board of Hokkaido University Hospital (No. 016-0495: May 2017).

Informed Consent Statement

This study is a retrospective study; therefore, the information has already been disclosed on the website of the institution by the opt-out method.

Data Availability Statement

Due to privacy and ethical restrictions, the dataset is not publicly available. The models created in this study are available on request from the corresponding author. The source code of this study is available at https://github.com/MIA-laboratory/CCTA_artery_detection/ (accessed on 8 February 2025).

Acknowledgments

The authors would like to thank the laboratory members of the Medical Image Analysis Laboratory for their help.

Conflicts of Interest

The authors declare that no conflicts of interest exist.

Abbreviations

The following abbreviations are used in this manuscript:
IHDIschemic Heart Disease
CADCoronary Artery Disease
CCTACoronary Computed Tomography Angiography
MIPMaximum Intensity Projection
CPRCurved Planar Reformation
CNNConvolutional Neural Network
ECGElectrocardiogram
ROIRegion of Interest
RCARight Coronary Artery
LCA-LADLeft Coronary Artery–Left Anterior Descending
LCA-CXLeft Coronary Artery–Circumflex
LMTLeft Main Trunk
IoUIntersection over Union
DSCDice Similarity Coefficient
MAEMean Absolute Error
APAverage Precision
SGDMStochastic Gradient Descent with Momentum
CPRCurved Planar Reformations
CTComputed Tomography
MRIMagnetic Resonance Imaging
X-rayX-ray Imaging

References

  1. Tsao, C.W.; Aday, A.W.; Almarzooq, Z.I.; Anderson, C.A.M.; Arora, P.; Avery, C.L.; Baker-Smith, C.M.; Beaton, A.Z.; Boehme, A.K.; Buxton, A.E.; et al. Heart Disease and Stroke Statistics—2023 Update: A Report from the American Heart Association. Circulation 2023, 147, E93–E621. [Google Scholar] [CrossRef]
  2. Neumann, F.J.; Sechtem, U.; Banning, A.P.; Bonaros, N.; Bueno, H.; Bugiardini, R.; Chieffo, A.; Crea, F.; Czerny, M.; Delgado, V.; et al. 2019 ESC Guidelines for the Diagnosis and Management of Chronic Coronary Syndromes. Eur. Heart J. 2020, 41, 407–477. [Google Scholar] [CrossRef]
  3. Yamaguchi, M.; Hoshino, M.; Sugiyama, T.; Kanaji, Y.; Nagamine, T.; Misawa, T.; Hada, M.; Araki, M.; Hamaya, R.; Usui, E.; et al. Association of Near-Infrared Spectroscopy-Defined Lipid Rich Plaque with Lesion Morphology and Peri-Coronary Inflammation on Computed Tomography Angiography. Atherosclerosis 2022, 346, 109–116. [Google Scholar] [CrossRef] [PubMed]
  4. Tonet, E.; Amantea, V.; Lapolla, D.; Assabbi, P.; Boccadoro, A.; Berloni, M.L.; Micillo, M.; Marchini, F.; Chiarello, S.; Cossu, A.; et al. Cardiac Computed Tomography in Monitoring Revascularization. J. Clin. Med. 2023, 12, 7104. [Google Scholar] [CrossRef] [PubMed]
  5. Vecsey-Nagy, M.; Jermendy, Á.L.; Kolossváry, M.; Vattay, B.; Boussoussou, M.; Suhai, F.I.; Panajotu, A.; Csőre, J.; Borzsák, S.; Fontanini, D.M.; et al. Heart Rate-Dependent Degree of Motion Artifacts in Coronary CT Angiography Acquired by a Novel Purpose-Built Cardiac CT Scanner. J. Clin. Med. 2022, 11, 4336. [Google Scholar] [CrossRef] [PubMed]
  6. Prokop, M.; Shin, H.O.; Schanz, A.; Schaefer-Prokop, C.M. Use of Maximum Intensity Projections in CT Angiography: A Basic Review. Radiographics 1997, 17, 433–451. [Google Scholar] [CrossRef] [PubMed]
  7. Karlo, C.A.; Leschka, S.; Stolzmann, P.; Glaser-Gallion, N.; Wildermuth, S.; Alkadhi, H. A Systematic Approach for Analysis, Interpretation, and Reporting of Coronary CTA Studies. Insights Imaging 2012, 3, 215–228. [Google Scholar] [CrossRef]
  8. Manabe, K.; Asami, Y.; Yamada, T.; Sugimori, H. Improvement in the Convolutional Neural Network for Computed Tomography Images. Appl. Sci. 2021, 11, 1505. [Google Scholar] [CrossRef]
  9. Ichikawa, S.; Itadani, H.; Sugimori, H. Toward Automatic Reformation at the Orbitomeatal Line in Head Computed Tomography Using Object Detection Algorithm. Phys. Eng. Sci. Med. 2022, 45, 835–845. [Google Scholar] [CrossRef]
  10. Asami, Y.; Yoshimura, T.; Manabe, K.; Yamada, T.; Sugimori, H. Development of Detection and Volumetric Methods for the Triceps of the Lower Leg Using Magnetic Resonance Images with Deep Learning. Appl. Sci. 2021, 11, 12006. [Google Scholar] [CrossRef]
  11. Inomata, S.; Yoshimura, T.; Tang, M.; Ichikawa, S.; Sugimori, H. Estimation of Left and Right Ventricular Ejection Fractions from Cine-MRI Using 3D-CNN. Sensors 2023, 23, 6580. [Google Scholar] [CrossRef]
  12. Yoshimura, T.; Nishioka, K.; Hashimoto, T.; Mori, T.; Kogame, S.; Seki, K.; Sugimori, H.; Yamashina, H.; Nomura, Y.; Kato, F.; et al. Prostatic Urinary Tract Visualization with Super-Resolution Deep Learning Models. PLoS ONE 2023, 18, e0280076. [Google Scholar] [CrossRef] [PubMed]
  13. Usui, K.; Yoshimura, T.; Ichikawa, S.; Sugimori, H. Development of Chest X-Ray Image Evaluation Software Using the Deep Learning Techniques. Appl. Sci. 2023, 13, 6695. [Google Scholar] [CrossRef]
  14. Zhang, Y.; Gorriz, J.M.; Dong, Z. Deep Learning in Medical Image Analysis. J. Imaging 2021, 7, 74. [Google Scholar] [CrossRef] [PubMed]
  15. Reza-Soltani, S.; Fakhare Alam, L.; Debellotte, O.; Monga, T.S.; Coyalkar, V.R.; Tarnate, V.C.A.; Ozoalor, C.U.; Allam, S.R.; Afzal, M.; Shah, G.K.; et al. The Role of Artificial Intelligence and Machine Learning in Cardiovascular Imaging and Diagnosis. Cureus 2024, 16, e68472. [Google Scholar] [CrossRef] [PubMed]
  16. Serruys, P.W.; Kotoku, N.; Nørgaard, B.; Garg, S.; Nieman, K.; Dweck, M.; Bax, J.; Knuuti, J.; Narula, J.; Perera, D.; et al. Computed Tomographic Angiography in Coronary Artery Disease. EuroIntervention 2023, 18, E1307–E1327. [Google Scholar] [CrossRef]
  17. Mansoor, C.M.M.; Chettri, S.K.; Naleer, H.M.M. Development of an Efficient Novel Method for Coronary Artery Disease Prediction Using Machine Learning and Deep Learning Techniques. Technol. Health Care 2024, 32, 4545–4569. [Google Scholar] [CrossRef]
  18. Jafari, M.; Shoeibi, A.; Khodatars, M.; Ghassemi, N.; Moridian, P.; Alizadehsani, R.; Khosravi, A.; Ling, S.H.; Delfan, N.; Zhang, Y.D.; et al. Automated Diagnosis of Cardiovascular Diseases from Cardiac Magnetic Resonance Imaging Using Deep Learning Models: A Review. Comput. Biol. Med. 2023, 160, 106998. [Google Scholar] [CrossRef]
  19. Ge, Z.; Liu, S.; Wang, F.; Li, Z.; Sun, J. YOLOX: Exceeding YOLO Series in 2021. arXiv 2021, arXiv:2107.08430. [Google Scholar]
  20. Lücke, C.; Foldyna, B.; Andres, C.; Boehmer-Lasthaus, S.; Grothoff, M.; Nitzsche, S.; Gutberlet, M.; Lehmkuhl, L. Post-Processing in Cardiovascular Computed Tomography: Performance of a Client Server Solution versus a Stand-Alone Solution. RoFo 2014, 186, 1111–1121. [Google Scholar] [CrossRef] [PubMed]
  21. Merkow, J.; Marsden, A.; Kriegman, D.; Tu, Z. Dense Volume-to-Volume Vascular Boundary Detection. In Medical Image Computing and Computer-Assisted Intervention—MICCAI 2016; Lecture Notes in Computer Science; Springer: Cham, Switzerland, 2016; Volume 9902, pp. 371–379. [Google Scholar] [CrossRef]
  22. Lee, M.C.H.; Petersen, K.; Pawlowski, N.; Glocker, B.; Schaap, M. TeTrIS: Template Transformer Networks for Image Segmentation with Shape Priors. IEEE Trans. Med. Imaging 2019, 38, 2596–2606. [Google Scholar] [CrossRef]
  23. Yao, H.; Williamson, C.; Soroushmehr, R.; Gryak, J.; Najarian, K. Hematoma Segmentation Using Dilated Convolutional Neural Network. In Proceedings of the 2018 40th Annual International Conference of the IEEE Engineering in Medicine and Biology Society (EMBC), Honolulu, HI, USA, 18–21 July 2018; pp. 5902–5905. [Google Scholar] [CrossRef]
  24. Zreik, M.; Lessmann, N.; van Hamersvelt, R.W.; Wolterink, J.M.; Voskuil, M.; Viergever, M.A.; Leiner, T.; Išgum, I. Deep Learning Analysis of the Myocardium in Coronary CT Angiography for Identification of Patients with Functionally Significant Coronary Artery Stenosis. Med. Image Anal. 2018, 44, 72–85. [Google Scholar] [CrossRef]
  25. Wolterink, J.M.; van Hamersvelt, R.W.; Viergever, M.A.; Leiner, T.; Išgum, I. Coronary Artery Centerline Extraction in Cardiac CT Angiography Using a CNN-Based Orientation Classifier. Med. Image Anal. 2019, 51, 46–60. [Google Scholar] [CrossRef] [PubMed]
  26. Dey, D.; Schuhbaeck, A.; Min, J.K.; Berman, D.S.; Achenbach, S. Non-Invasive Measurement of Coronary Plaque from Coronary CT Angiography and Its Clinical Implications. Expert Rev. Cardiovasc. Ther. 2013, 11, 1067–1077. [Google Scholar] [CrossRef] [PubMed]
  27. Leipsic, J.; Abbara, S.; Achenbach, S.; Cury, R.; Earls, J.P.; Mancini, G.B.J.; Nieman, K.; Pontone, G.; Raff, G.L. SCCT Guidelines for the Interpretation and Reporting of Coronary CT Angiography: A Report of the Society of Cardiovascular Computed Tomography Guidelines Committee. J. Cardiovasc. Comput. Tomogr. 2014, 8, 342–358. [Google Scholar] [CrossRef]
  28. Yang, G.; Kitslaar, P.; Frenay, M.; Broersen, A.; Boogers, M.J.; Bax, J.J.; Reiber, J.H.C.; Dijkstra, J. Automatic Centerline Extraction of Coronary Arteries in Coronary Computed Tomographic Angiography. Int. J. Cardiovasc. Imaging 2012, 28, 921–933. [Google Scholar] [CrossRef] [PubMed]
  29. Lesage, D.; Angelini, E.D.; Bloch, I.; Funka-Lea, G. A Review of 3D Vessel Lumen Segmentation Techniques: Models, Features and Extraction Schemes. Med. Image Anal. 2009, 13, 819–845. [Google Scholar] [CrossRef]
  30. Wolterink, J.M.; Leiner, T.; de Vos, B.D.; van Hamersvelt, R.W.; Viergever, M.A.; Išgum, I. Automatic Coronary Artery Calcium Scoring in Cardiac CT Angiography Using Paired Convolutional Neural Networks. Med. Image Anal. 2016, 34, 123–136. [Google Scholar] [CrossRef]
  31. Jawaid, M.M.; Rajani, R.; Liatsis, P.; Reyes-Aldasoro, C.C.; Slabaugh, G. A Hybrid Energy Model for Region Based Curve Evolution—Application to CTA Coronary Segmentation. Comput. Methods Programs Biomed. 2017, 144, 189–202. [Google Scholar] [CrossRef]
  32. Mangla, A.; Oliveros, E.; Williams, K.A.S.; Kalra, D.K. Cardiac Imaging in the Diagnosis of Coronary Artery Disease. Curr. Probl. Cardiol. 2017, 42, 316–366. [Google Scholar] [CrossRef]
  33. Wolterink, J.M.; Leiner, T.; Takx, R.A.P.; Viergever, M.A.; Išgum, I. Automatic Coronary Calcium Scoring in Non-Contrast-Enhanced ECG-Triggered Cardiac CT with Ambiguity Detection. IEEE Trans. Med. Imaging 2015, 34, 1867–1878. [Google Scholar] [CrossRef] [PubMed]
  34. Kirişli, H.A.; Schaap, M.; Metz, C.T.; Dharampal, A.S.; Meijboom, W.B.; Papadopoulou, S.L.; Dedic, A.; Nieman, K.; de Graaf, M.A.; Meijs, M.F.L.; et al. Standardized Evaluation Framework for Evaluating Coronary Artery Stenosis Detection, Stenosis Quantification and Lumen Segmentation Algorithms in Computed Tomography Angiography. Med. Image Anal. 2013, 17, 859–876. [Google Scholar] [CrossRef] [PubMed]
  35. Price, W.N.; Cohen, I.G. Privacy in the Age of Medical Big Data. Nat. Med. 2019, 25, 37–43. [Google Scholar] [CrossRef] [PubMed]
  36. Rudin, C. Stop Explaining Black Box Machine Learning Models for High Stakes Decisions and Use Interpretable Models Instead. Nat. Mach. Intell. 2019, 1, 206–215. [Google Scholar] [CrossRef]
  37. van Assen, M.; De Cecco, C.N.; Eid, M.; von Knebel Doeberitz, P.; Scarabello, M.; Lavra, F.; Bauer, M.J.; Mastrodicasa, D.; Duguay, T.M.; Zaki, B.; et al. Prognostic Value of CT Myocardial Perfusion Imaging and CT-Derived Fractional Flow Reserve for Major Adverse Cardiac Events in Patients with Coronary Artery Disease. J. Cardiovasc. Comput. Tomogr. 2019, 13, 26–33. [Google Scholar] [CrossRef]
Figure 1. Example of ROI annotation and bounding box placement, illustrating alignment with arterial lumens, adjustments for branching or overlapping segments, and classification rules for coronary. (a) A fixed-size region of interest (ROI) of 64 × 64 pixels is set so that the blood vessel is centered in the cross-section. (b) If a transverse blood vessel is continuously visualized without interruption, the ROI is expanded until it fits within a single ROI. (c) A blood vessel running horizontally in the cross-sectional image but appearing interrupted is assigned separate ROIs. (d) If the cross-sections of two arteries do not fit within a 64 × 64 pixel ROI, two ROIs are assigned. (e) Left main trunk (LMT) is defined as left anterior descending artery (LCA-LAD). (f,h) If other vascular branches are visualized, the label of the most prominently visualized vessel is assigned. (g) Even if a blood vessel fits within a single 64 × 64 pixel ROI, separate ROIs are defined if the vessel segments are different.
Applsci 15 03113 g001
Figure 2. (ad) show axial views of CCTA images. (a’d’) display the corresponding bounding boxes for the ground truth (yellow dashed lines with yellow filling) and inference results (RCA: cyan, LCA-LAD: magenta, LCA-CX: green). The center points of the bounding boxes are marked with yellow circles for the ground truth and green “×” marks for the inference results.
Applsci 15 03113 g002
Figure 3. (ah) show axial views of CCTA images. (a’h’) display the corresponding bounding boxes for the ground truth (yellow dashed lines with yellow filling) and inference results (RCA: cyan, LCA-LAD: magenta, LCA-CX: green). The center points of the bounding boxes are marked with yellow circles for the ground truth and green “×” marks for the inference results. The yellow arrow highlights a relatively faint vessel segment that was missed by the detection model despite being annotated as ground truth. The red arrow indicates a calcified lesion with high CT attenuation value that was accurately detected at the vessel center.
Applsci 15 03113 g003
Table 1. Average Precision (AP) for RCA, LCA-LAD, and LCA-CX Across Five Folds.
RCALCA-LADLCA-CX
fold10.710.670.63
fold20.720.620.61
fold30.700.700.64
fold40.720.780.57
fold50.680.720.62
mean0.710.700.61
Table 2. IoU Above Threshold Rates for RCA, LCA-LAD, and LCA-CX Across Five Folds.
IoU Above Threshold Rates
RCALCA-LADLCA-CX
fold177.576.776.7
fold276.377.273.6
fold382.083.174.8
fold478.984.264.2
fold571.375.266.4
mean77.279.371.1
RCA = Right Coronary Artery; LCA-LAD = Left Coronary Artery–Left Anterior Descending; LCA-CX = Left Coronary Artery–Circumflex; IoU = Intersection over Union.
Table 3. DSC Above Threshold Rates for RCA, LCA-LAD, and LCA-CX Across Five Folds.
DSC Above Threshold Rates
RCALCA-LADLCA-CX
fold179.878.880.4
fold277.880.076.6
fold384.085.077.0
fold480.585.566.1
fold573.176.068.9
mean79.081.173.8
RCA = Right Coronary Artery; LCA-LAD = Left Coronary Artery–Left Anterior Descending; LCA-CX = Left Coronary Artery–Circumflex; DSC = Dice Similarity Coefficient.
Table 4. Mean Absolute Error (MAE) for RCA, LCA-LAD, and LCA-CX Across Five Folds.
MAE [mm]
RCALCA-LADLCA-CX
fold113.110.14.6
fold215.713.45.4
fold313.99.47.9
fold418.312.26.8
fold517.27.54.5
mean15.610.55.8
RCA = Right Coronary Artery; LCA-LAD = Left Coronary Artery–Left Anterior Descending; LCA-CX = Left Coronary Artery–Circumflex; MAE = Mean Absolute Error.
Disclaimer/Publisher’s Note: The statements, opinions and data contained in all publications are solely those of the individual author(s) and contributor(s) and not of MDPI and/or the editor(s). MDPI and/or the editor(s) disclaim responsibility for any injury to people or property resulting from any ideas, methods, instructions or products referred to in the content.

