
Experimental Research and Theoretical Analysis of the Coupling Mechanism Between Microstructure and Acoustics in Porous Materials

Abstract
1. Introduction
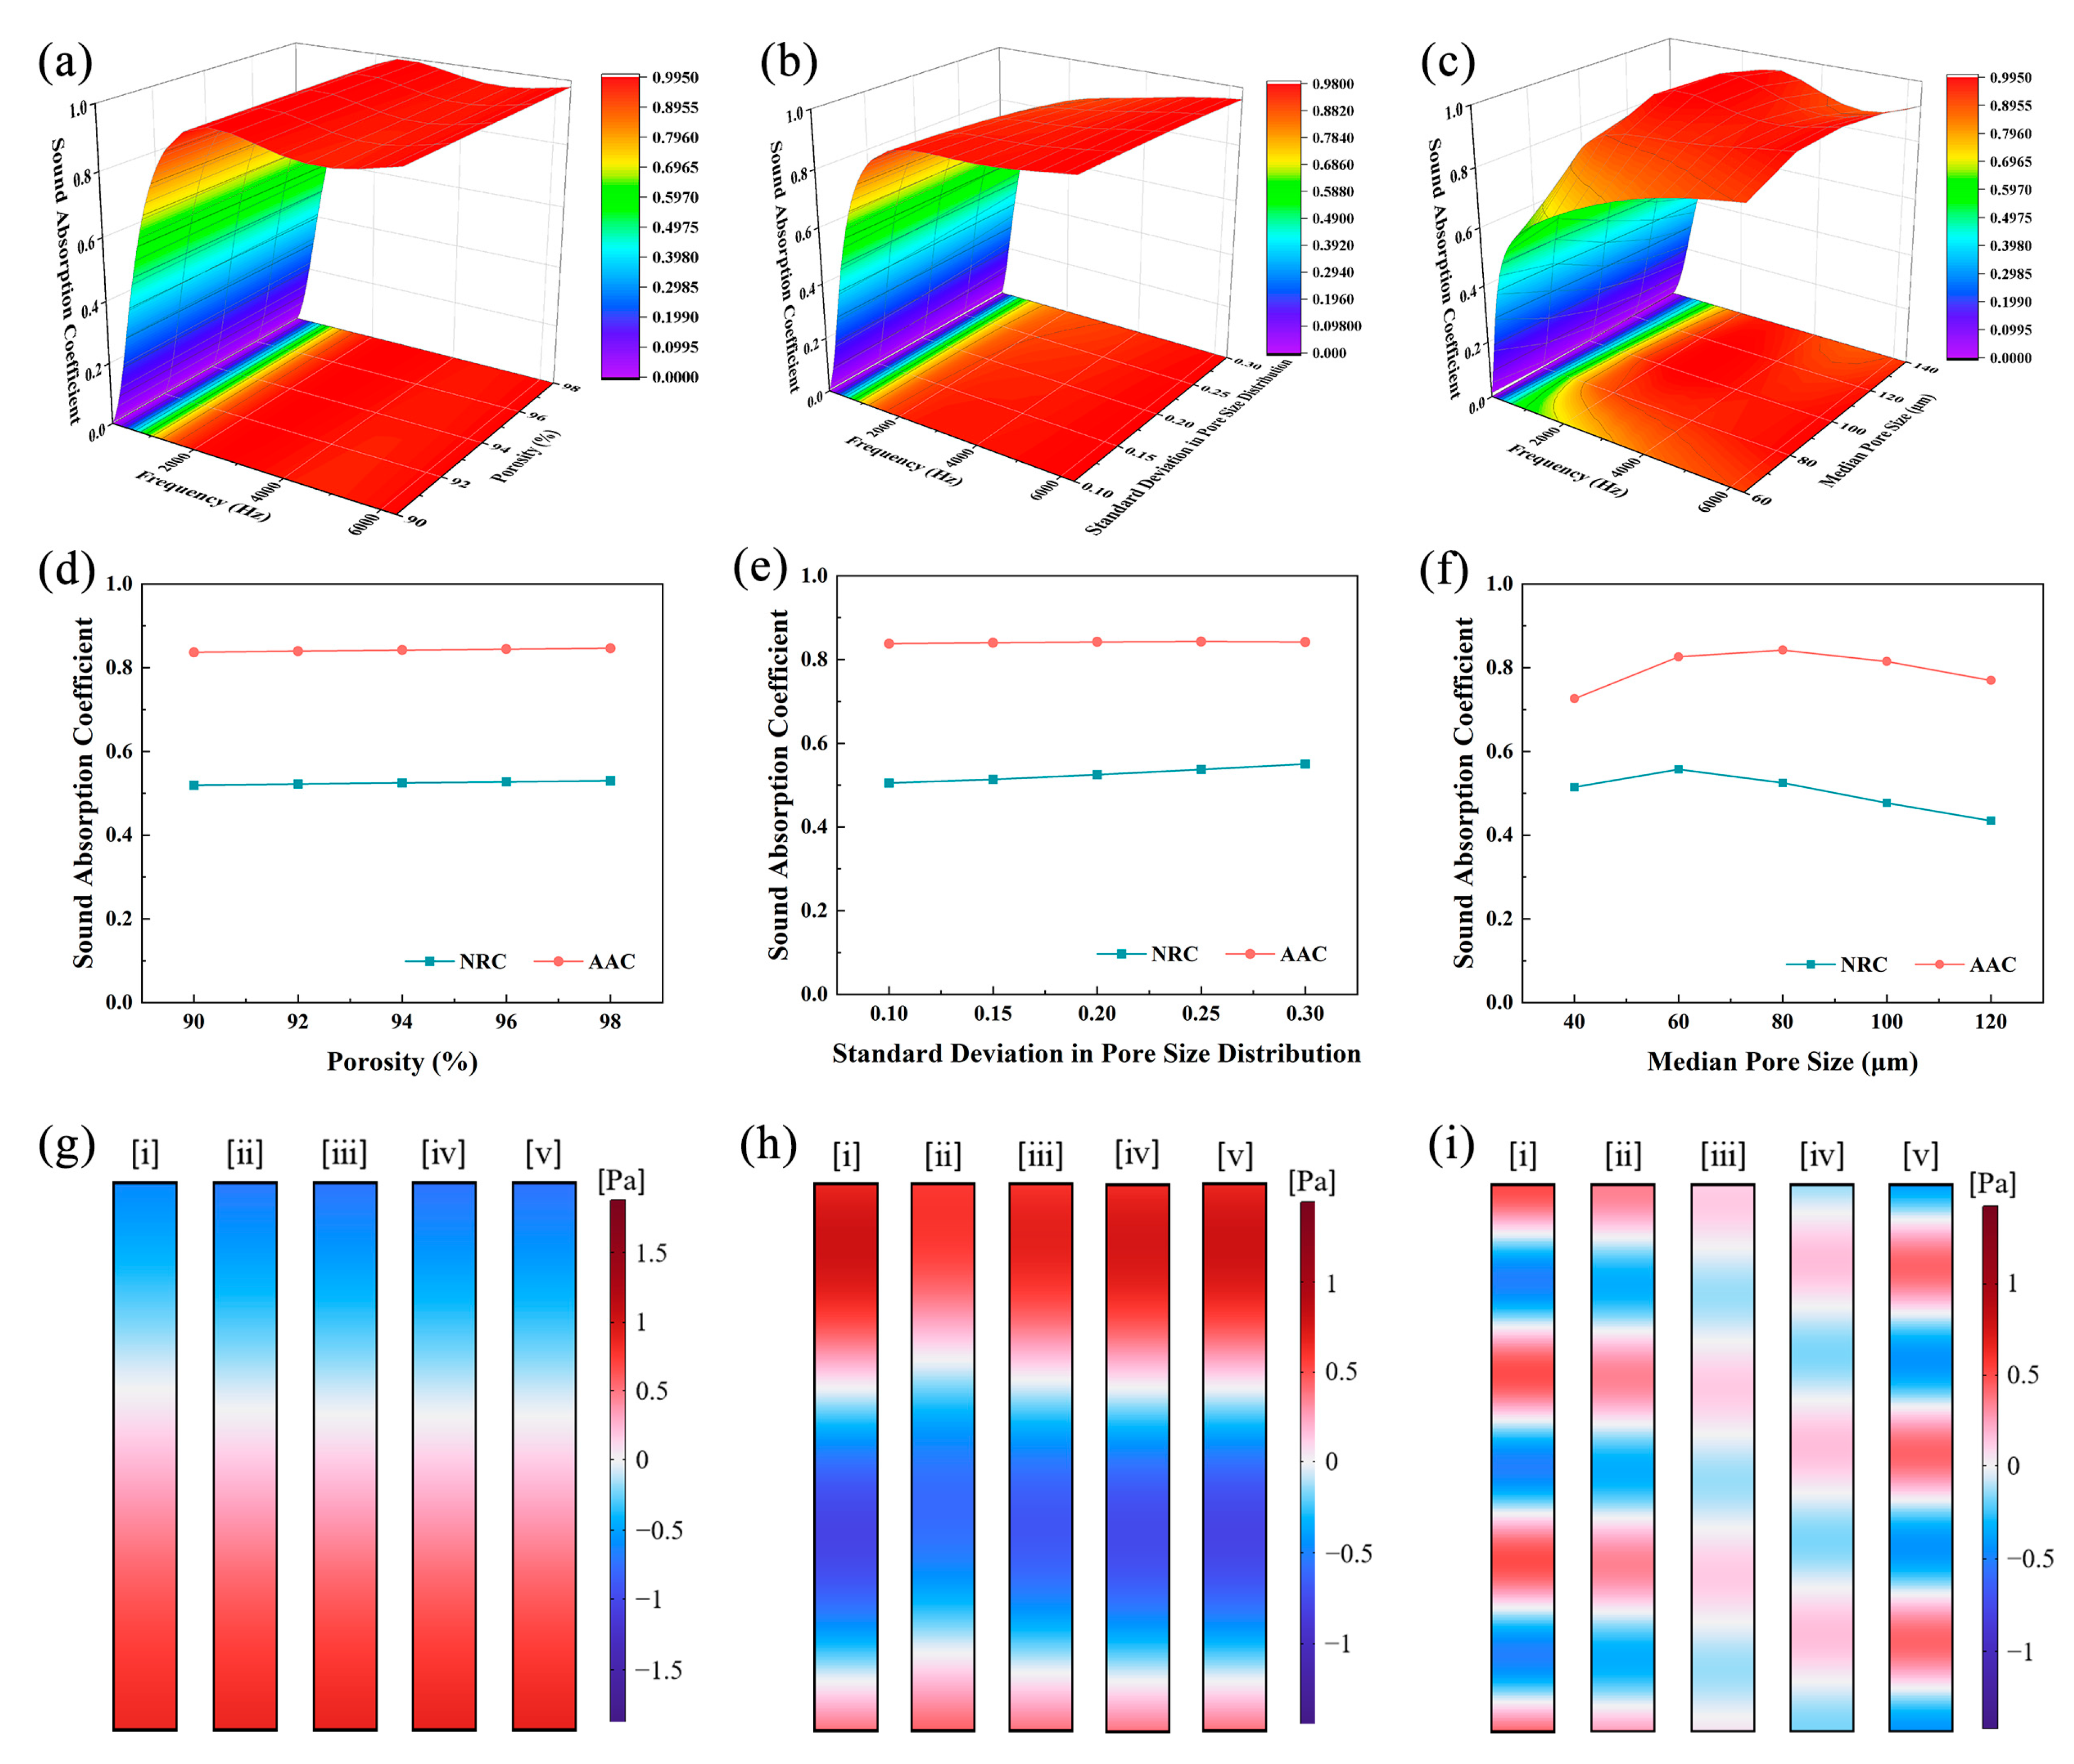
2. Model Analysis
3. Materials and Methods
3.1. Materials and Preparation
3.2. Experiment Test Method
3.2.1. Porosity Test Method
3.2.2. Microscopic Morphology
3.2.3. Pore Size Testing
- (1)
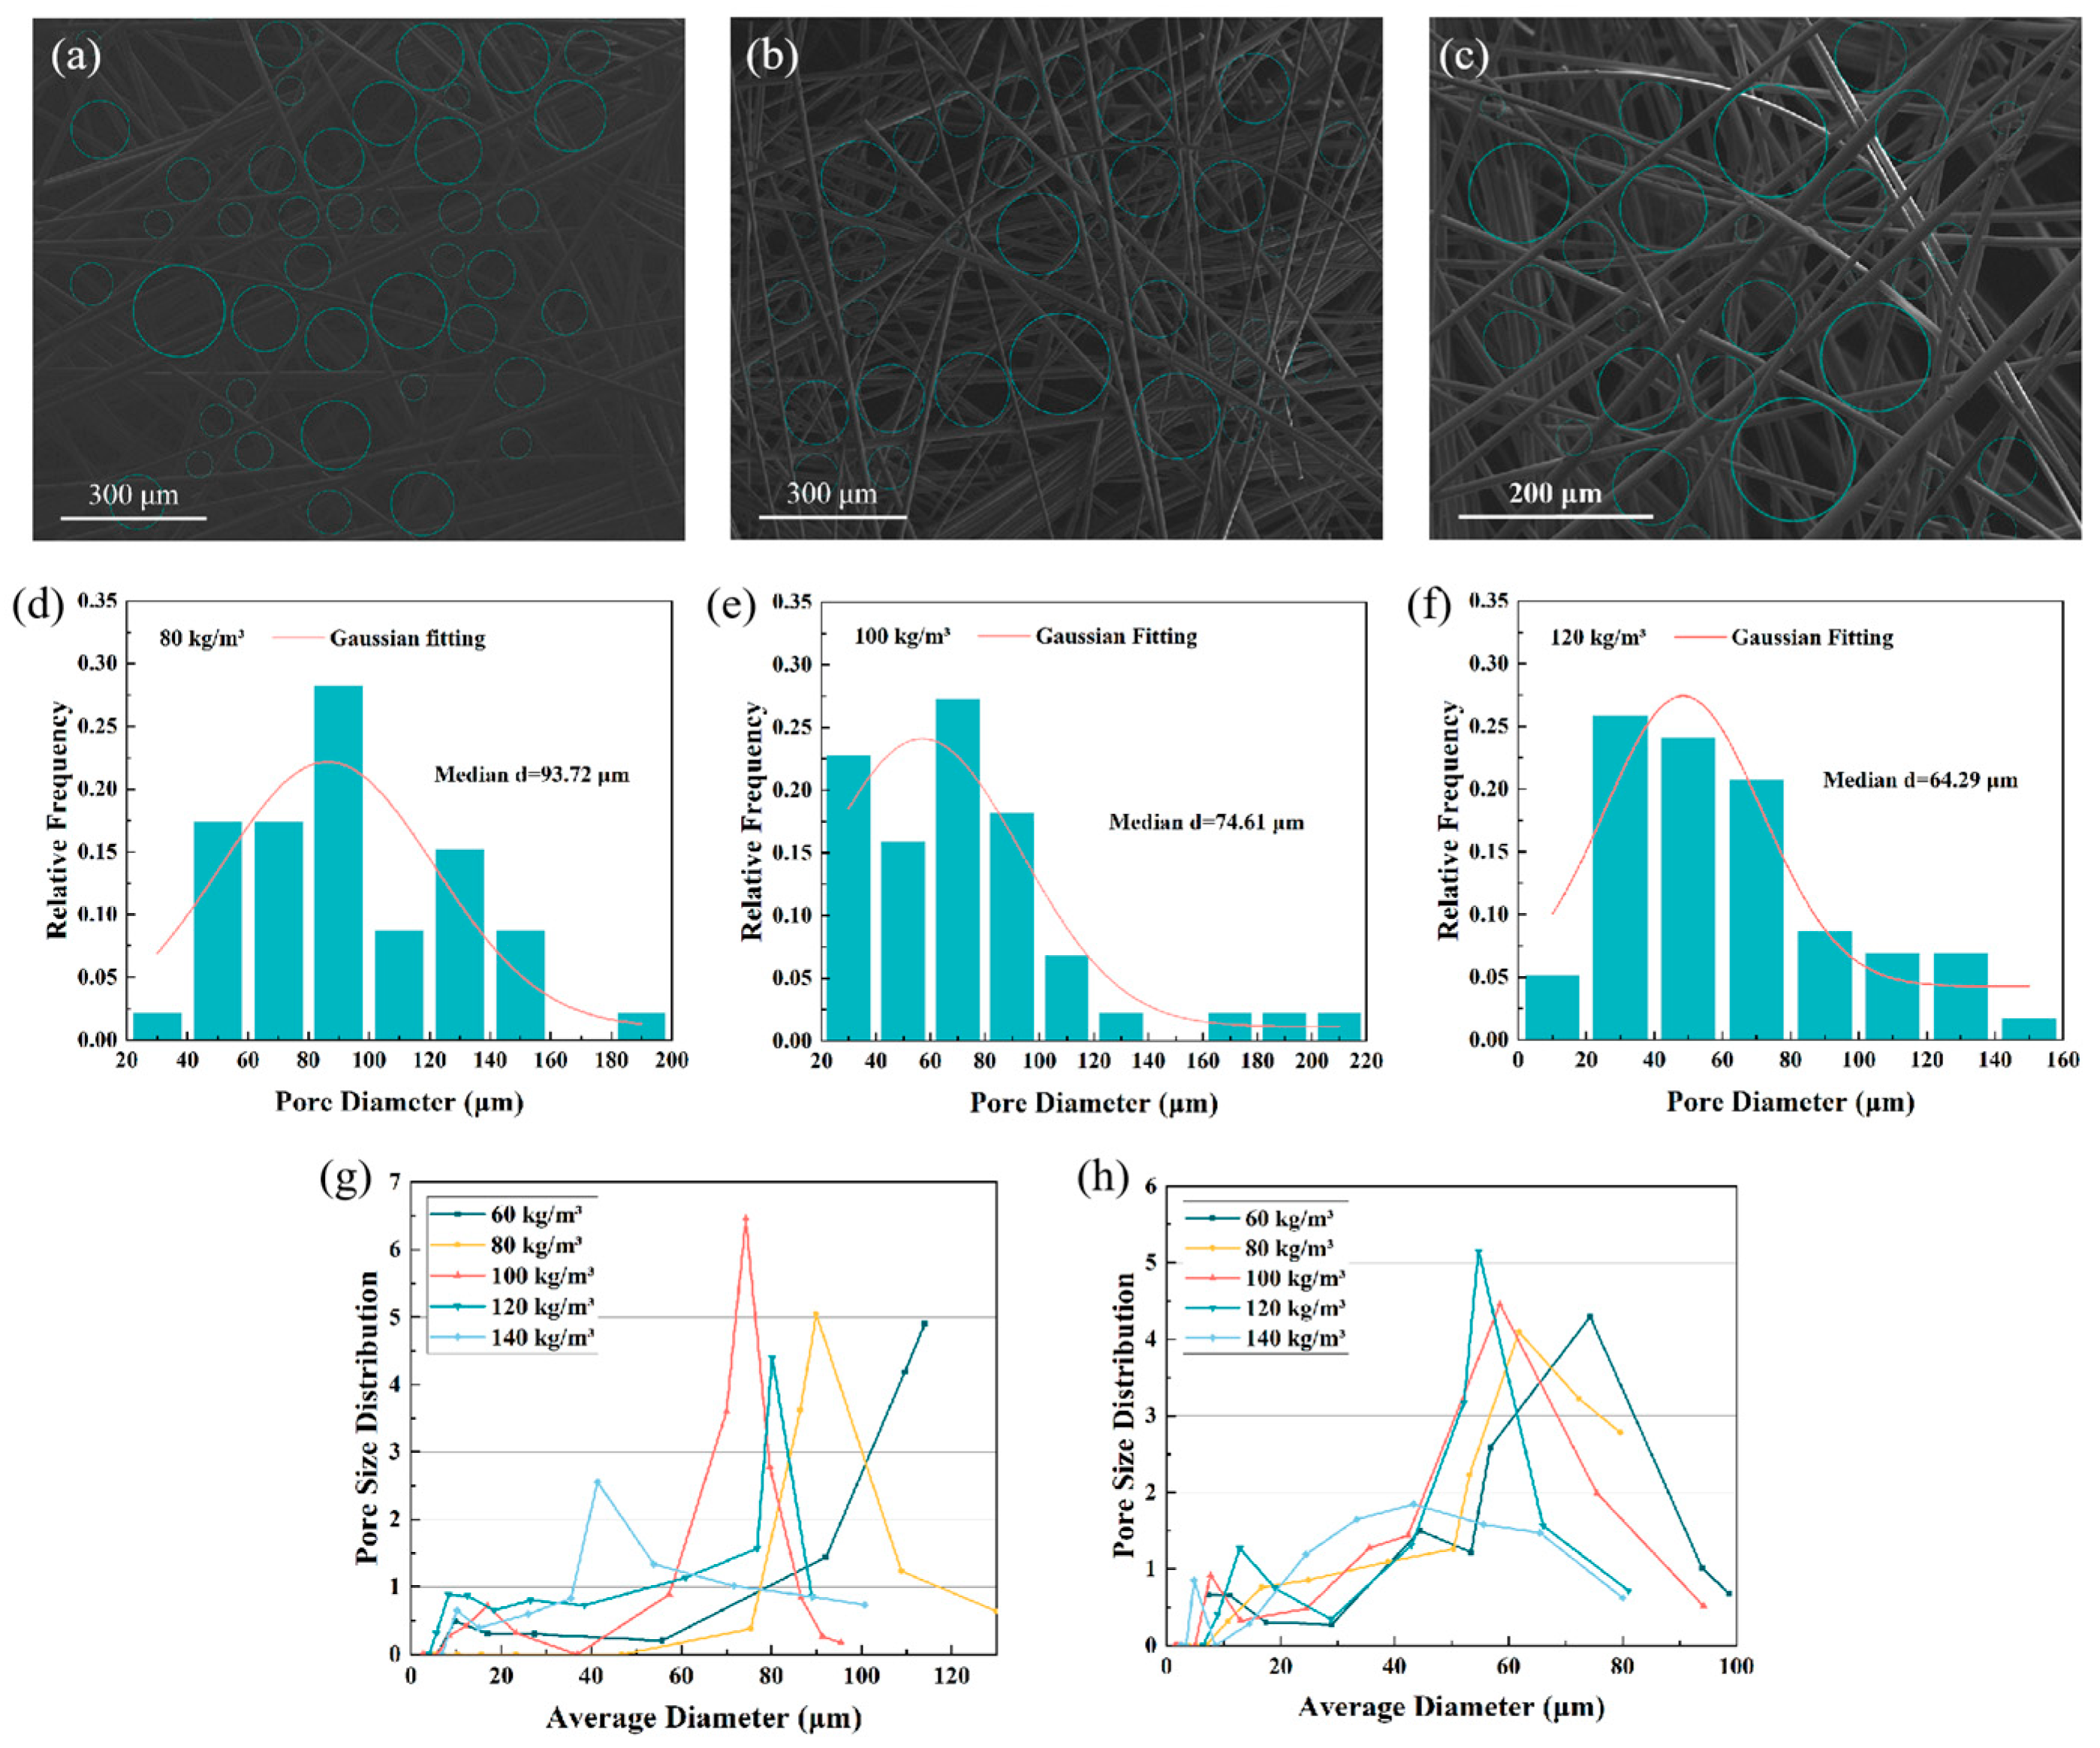
- Multiple SEM images of the same porous material were selected for pore size measurement. The pore sizes were determined by measuring the diameters of inscribed circles formed by fiber overlaps in the images, using ImageJ 1.54f software. The pore sizes were then statistically analyzed to calculate their distribution, and a pore size distribution chart was generated. The median pore size was calculated based on the measurements.
- (2)
- The median pore size and pore size distribution of the fiber porous materials were tested using a CFP-1500AE capillary pore size analyzer (Porous Materials Inc., Ithaca, NY, USA), following the ASTM F316-03 (2019) standard [42].
3.2.4. Measurement of Sound Absorption Coefficient
4. Results and Discussion
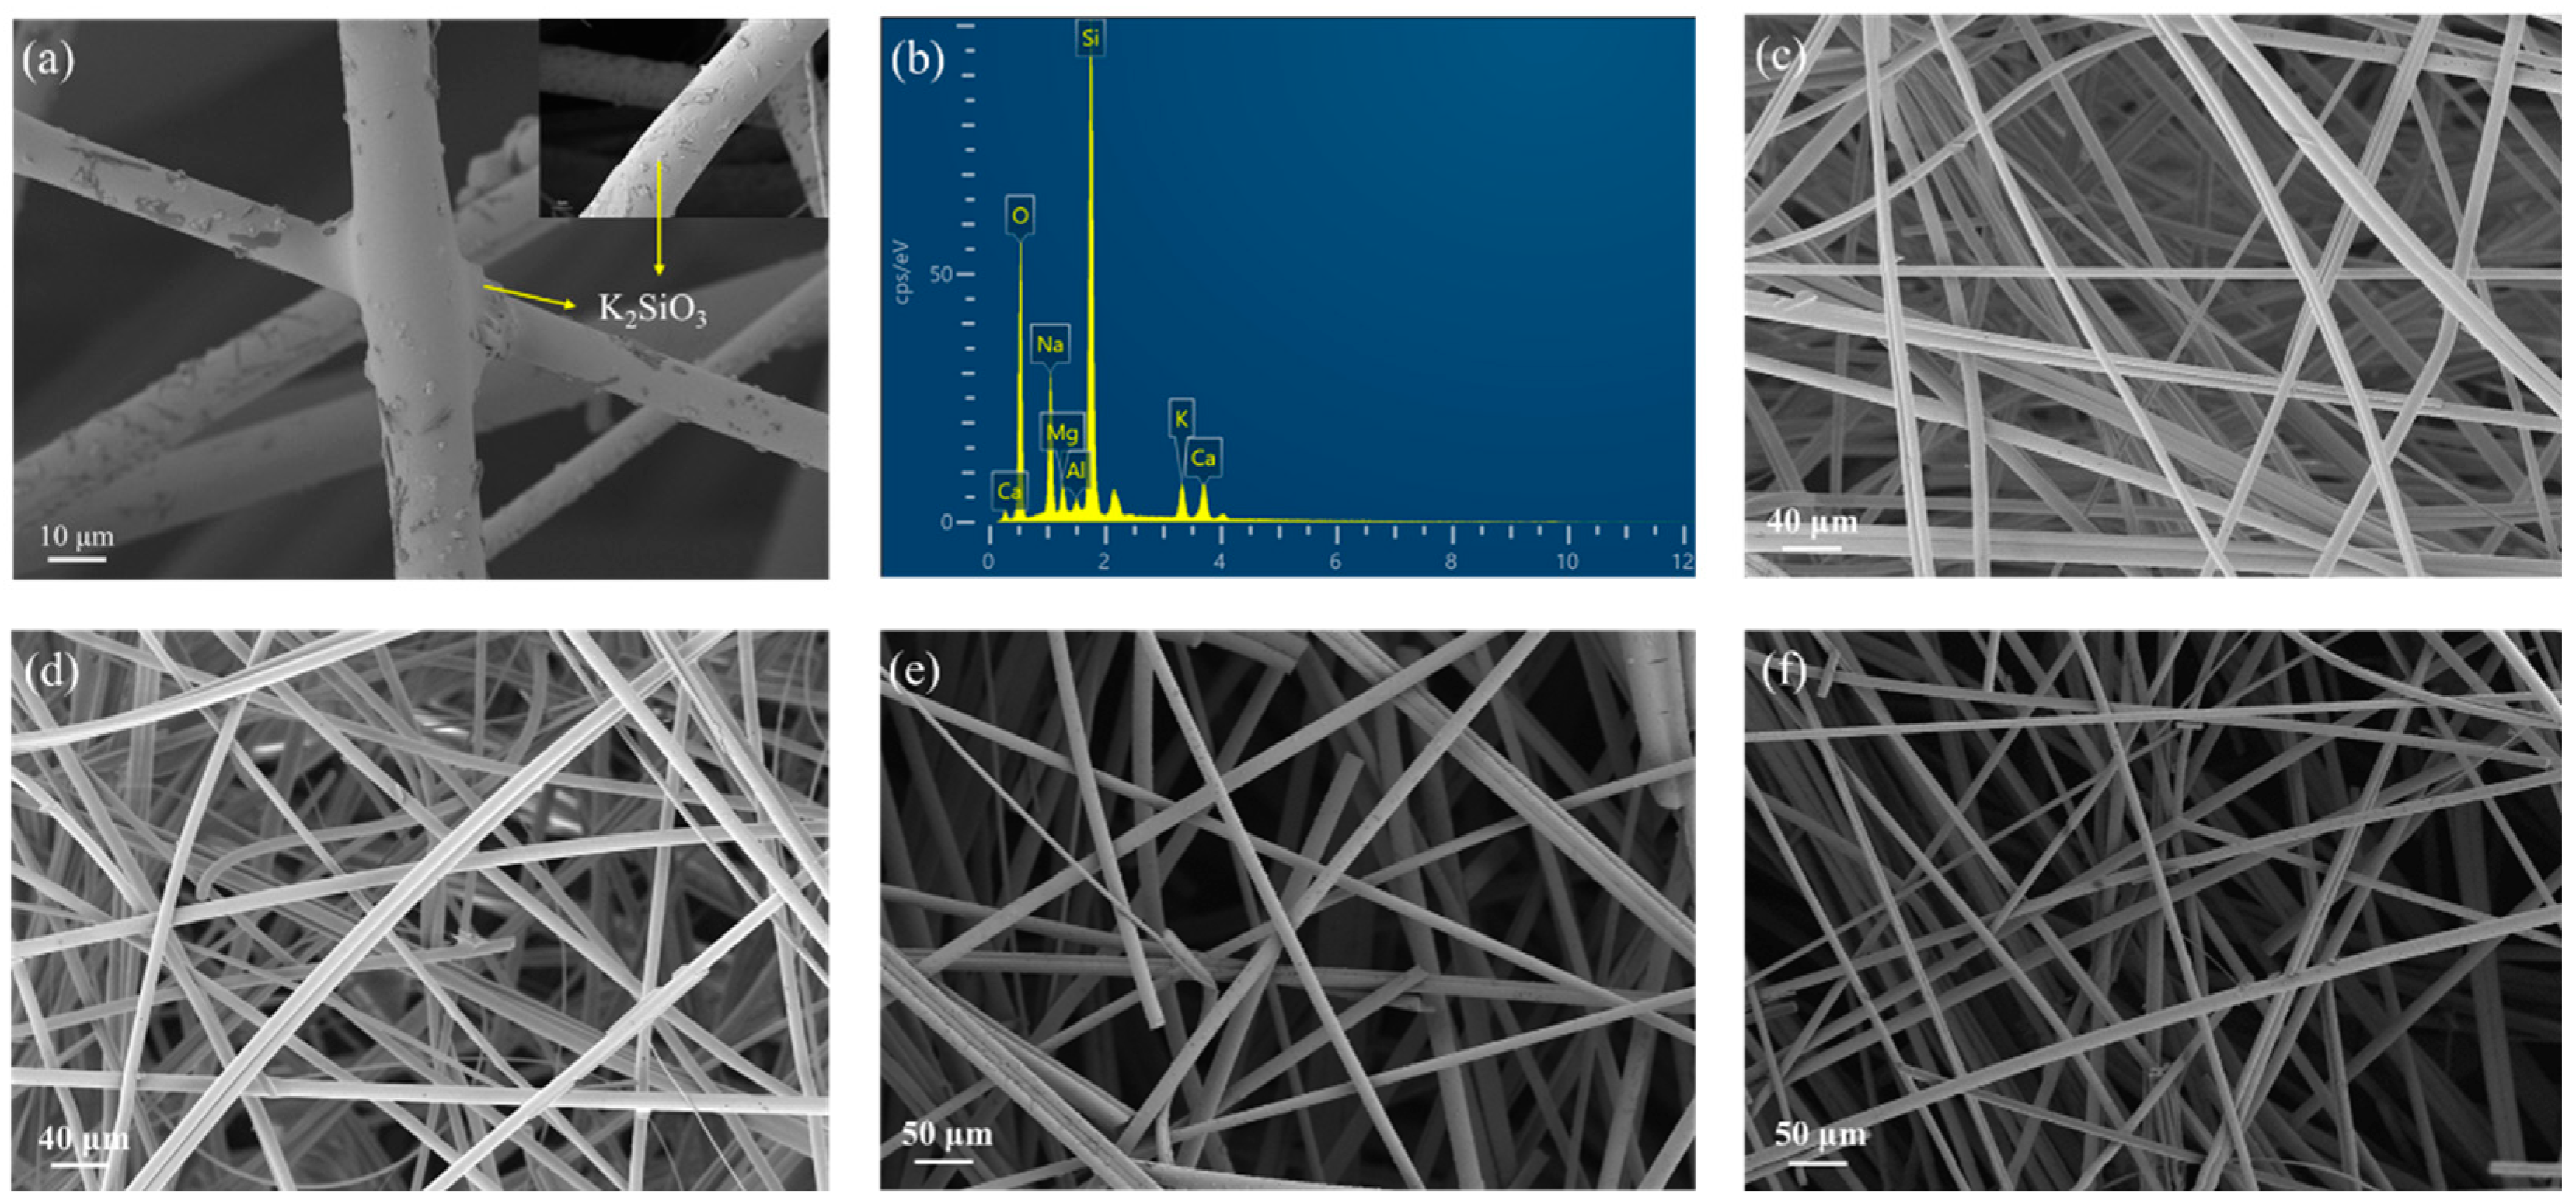
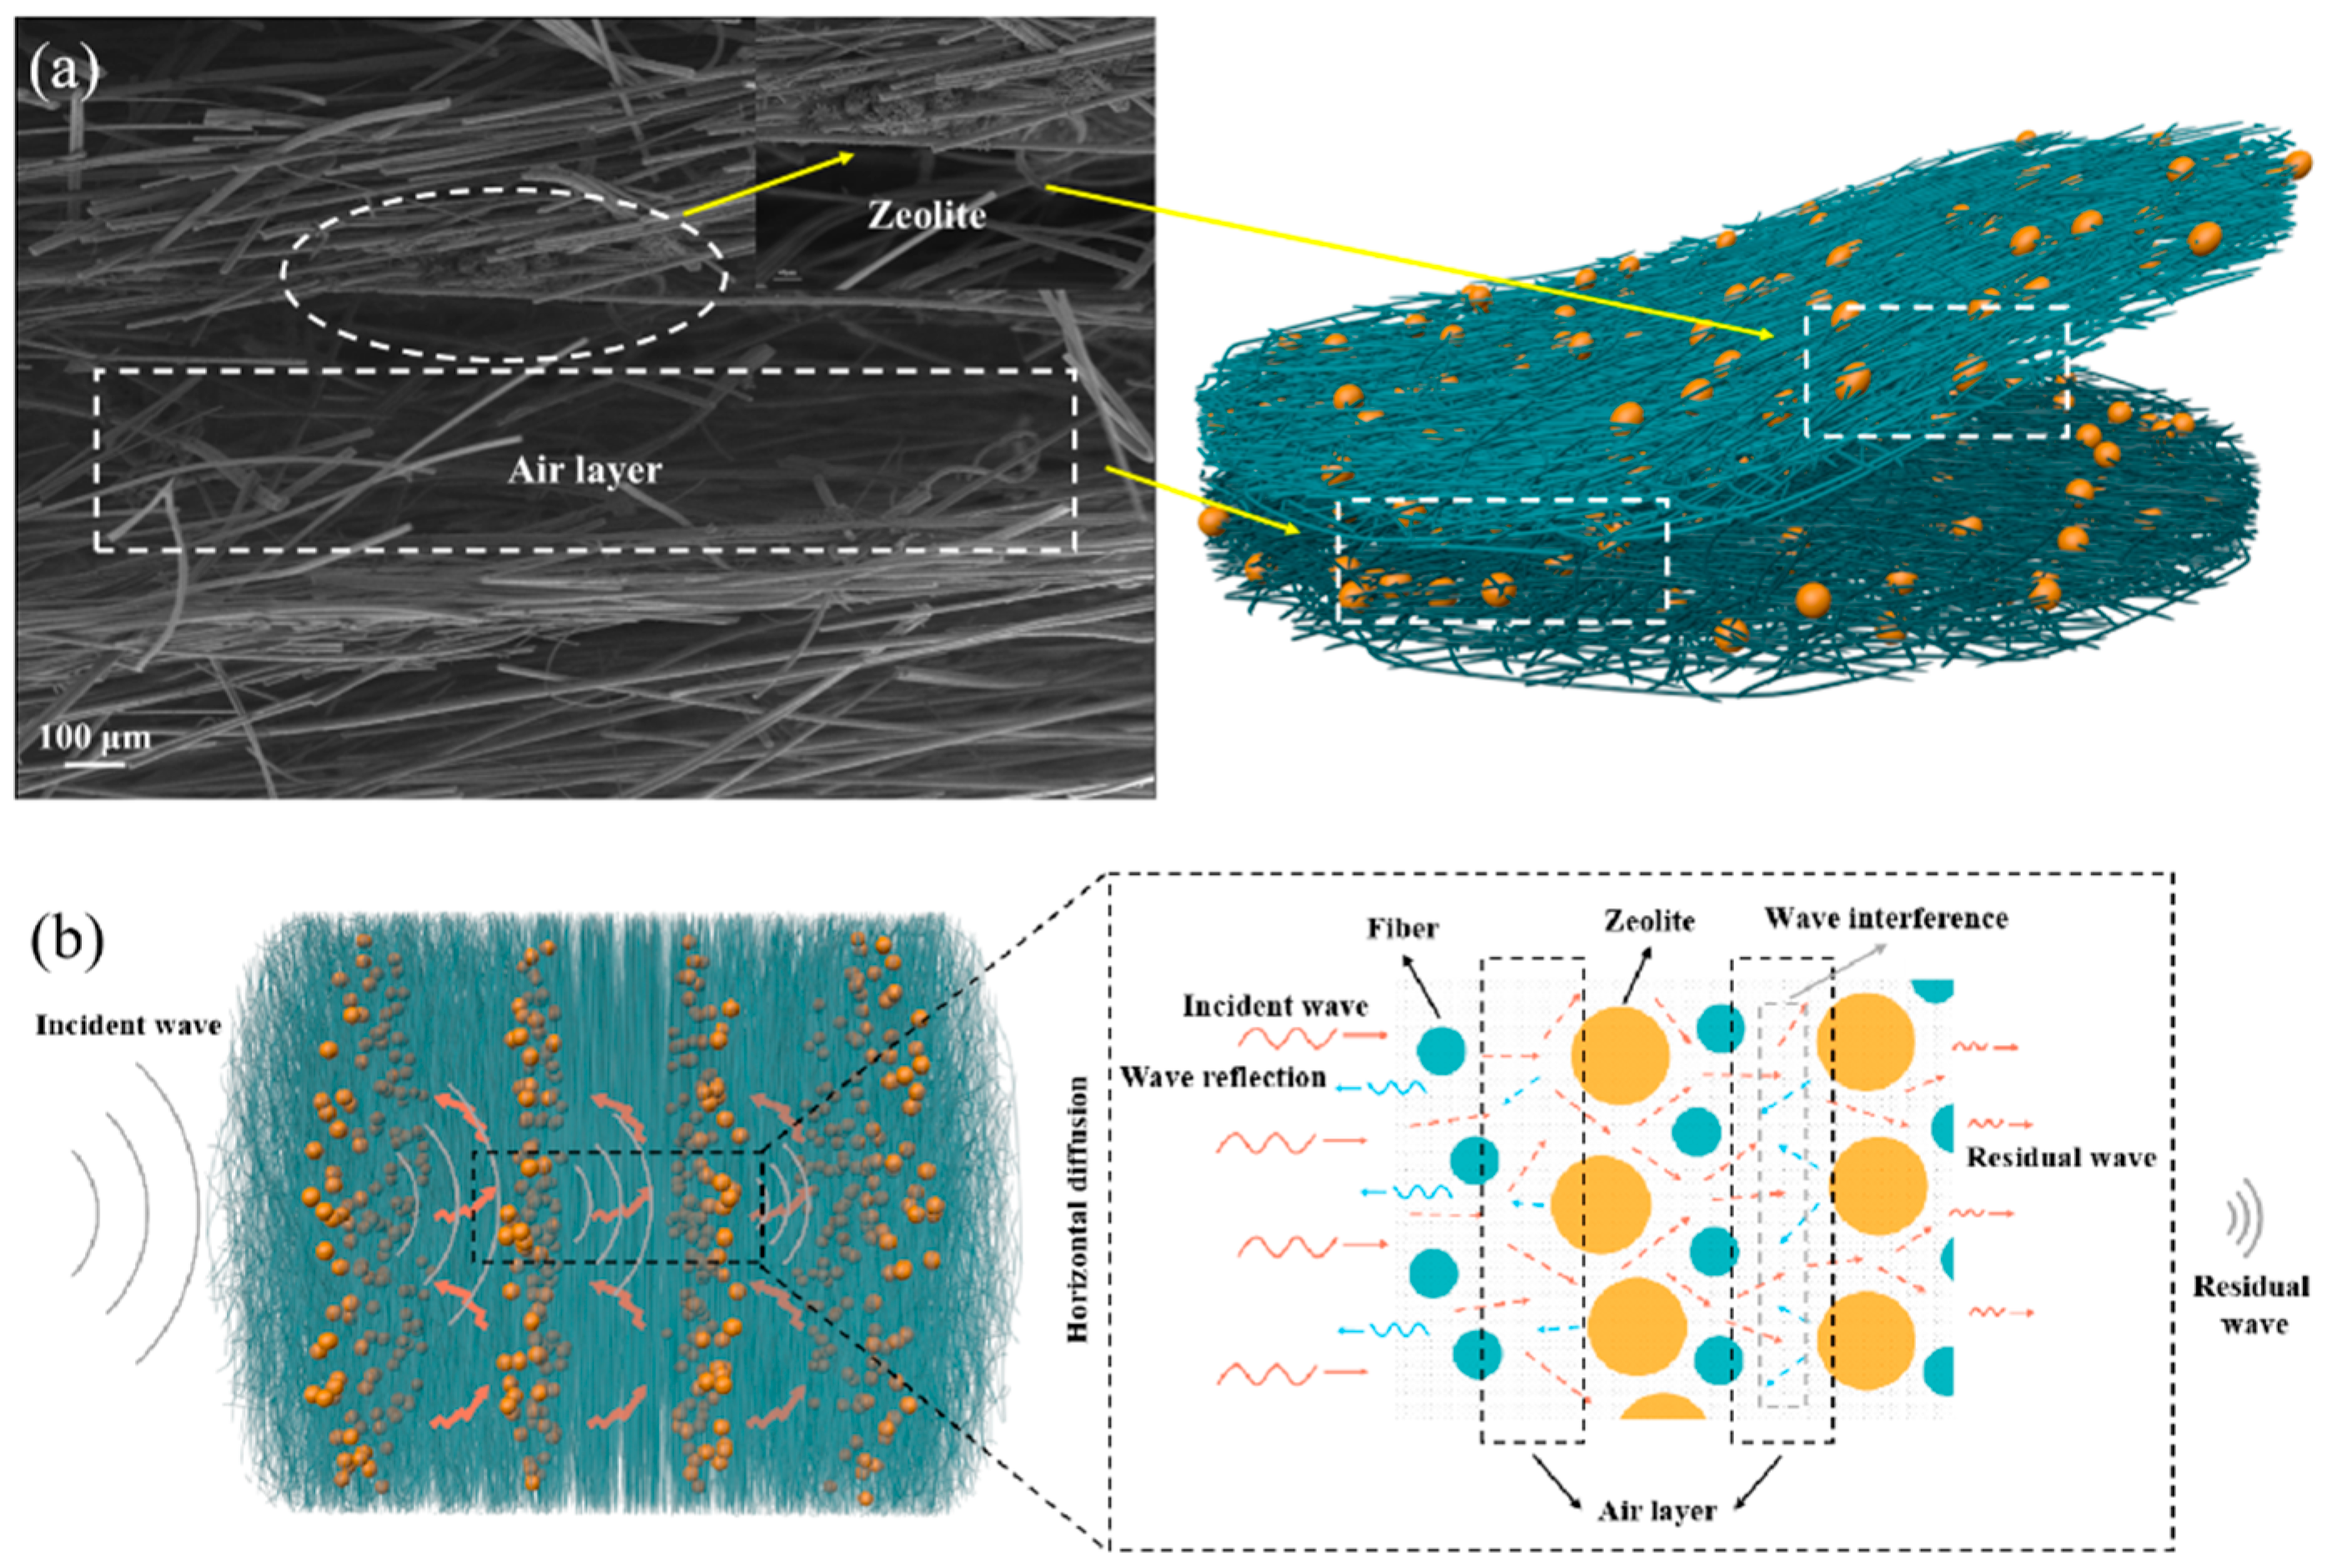
4.1. Morphology and Porosity Structure of Porous Materials
4.1.1. Morphology and Pore Size Distribution of Single-Fiber Porous Materials
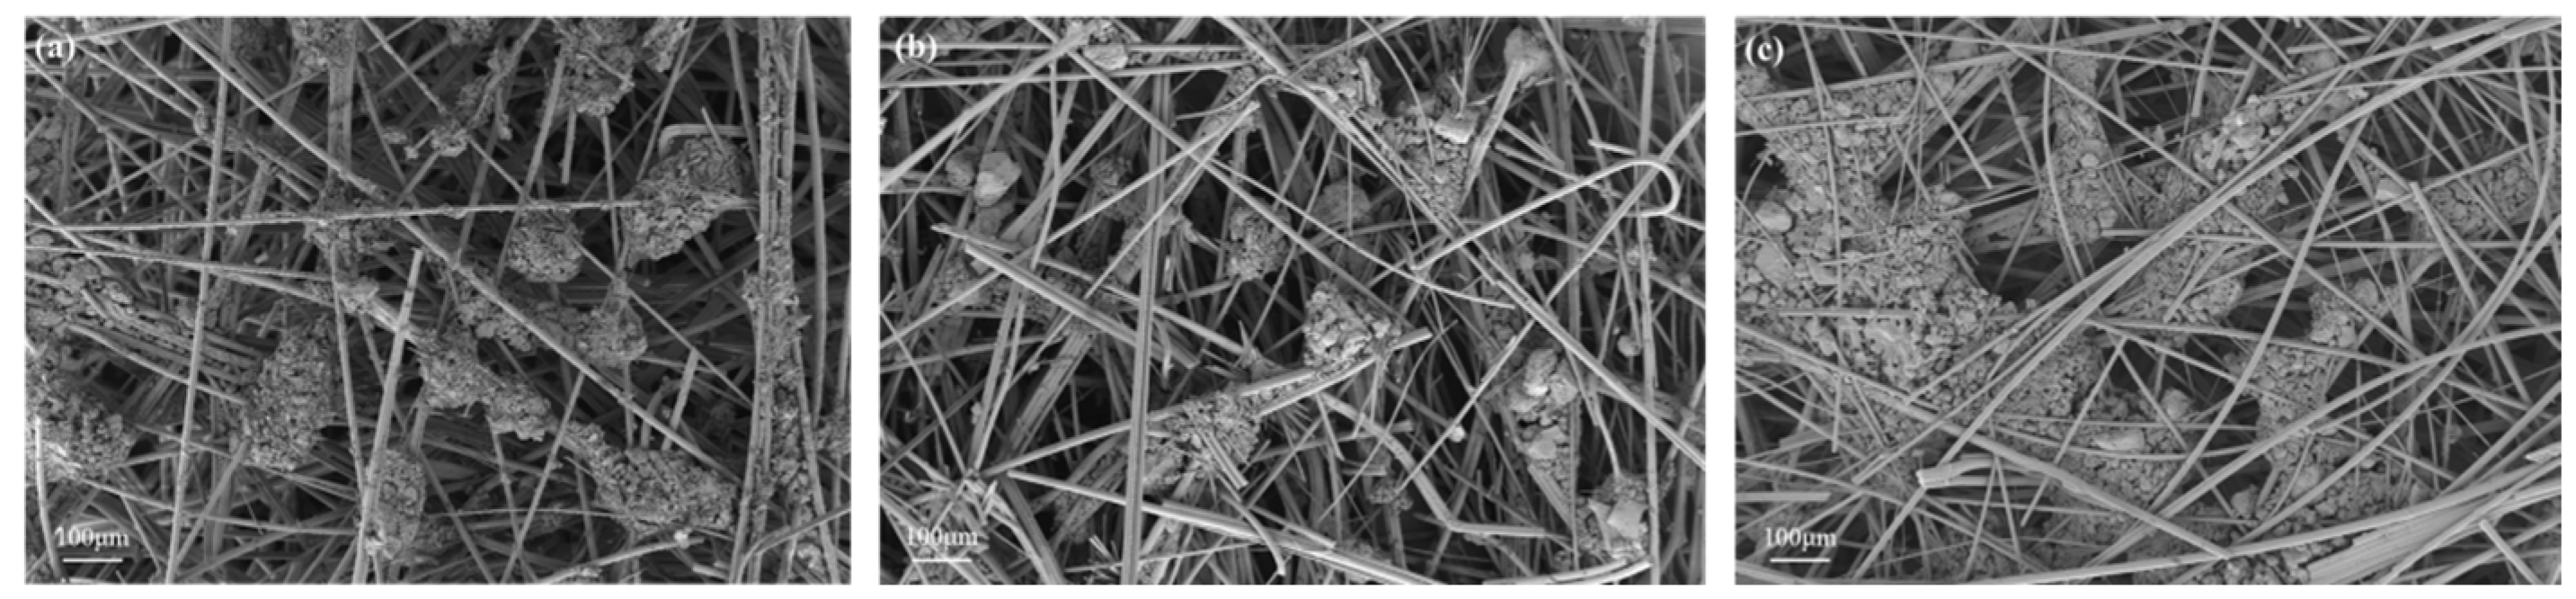
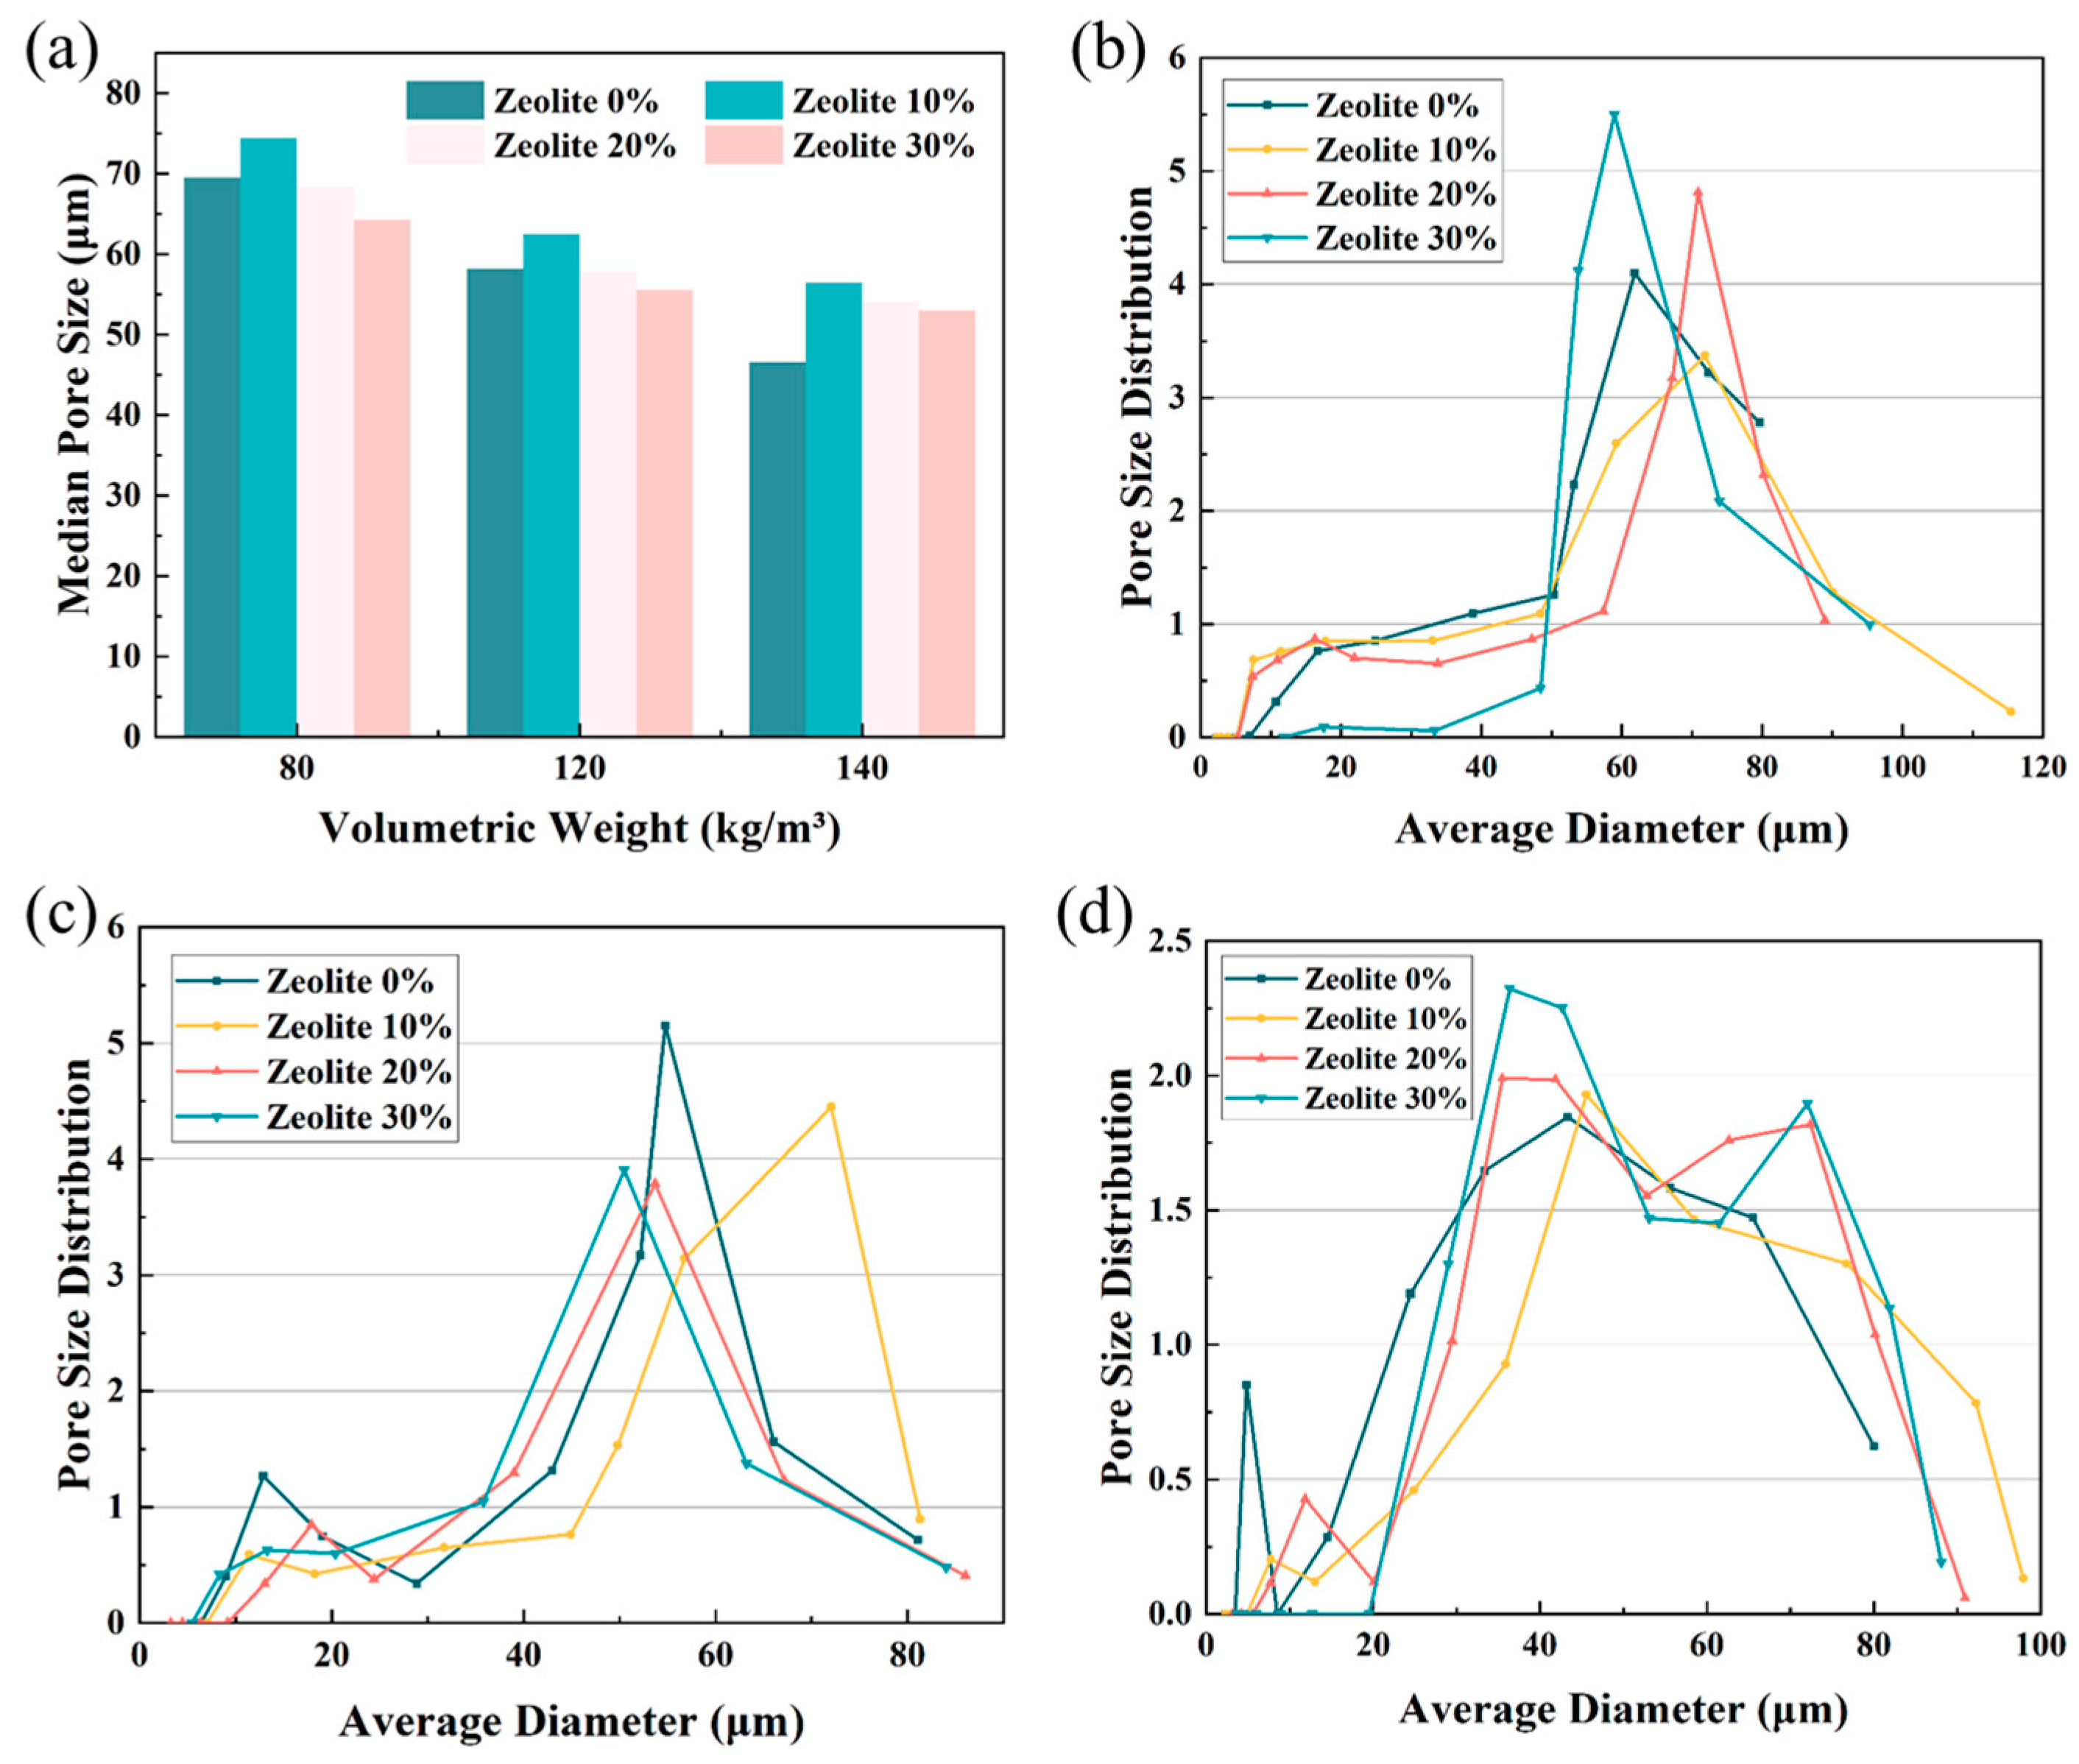
4.1.2. Morphology and Pore Size Distribution of Composite Porous Materials
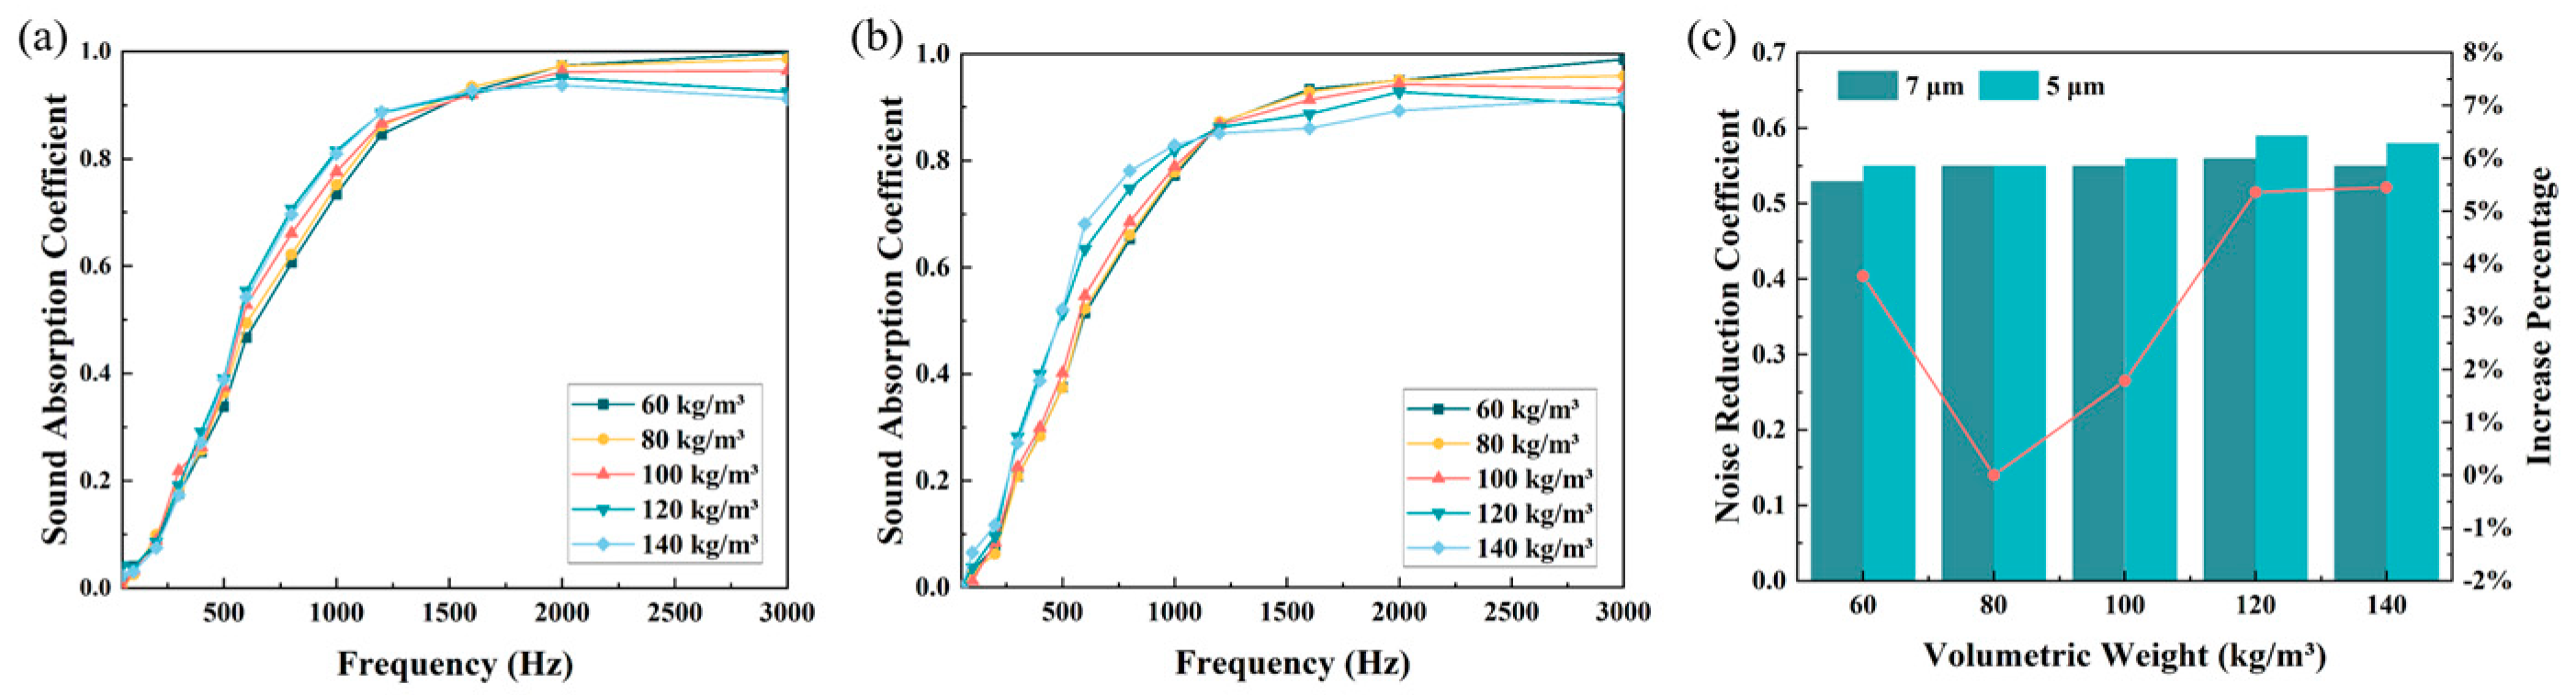
4.2. Effect of Fiber Diameter on the Sound Absorption Performance of Porous Materials
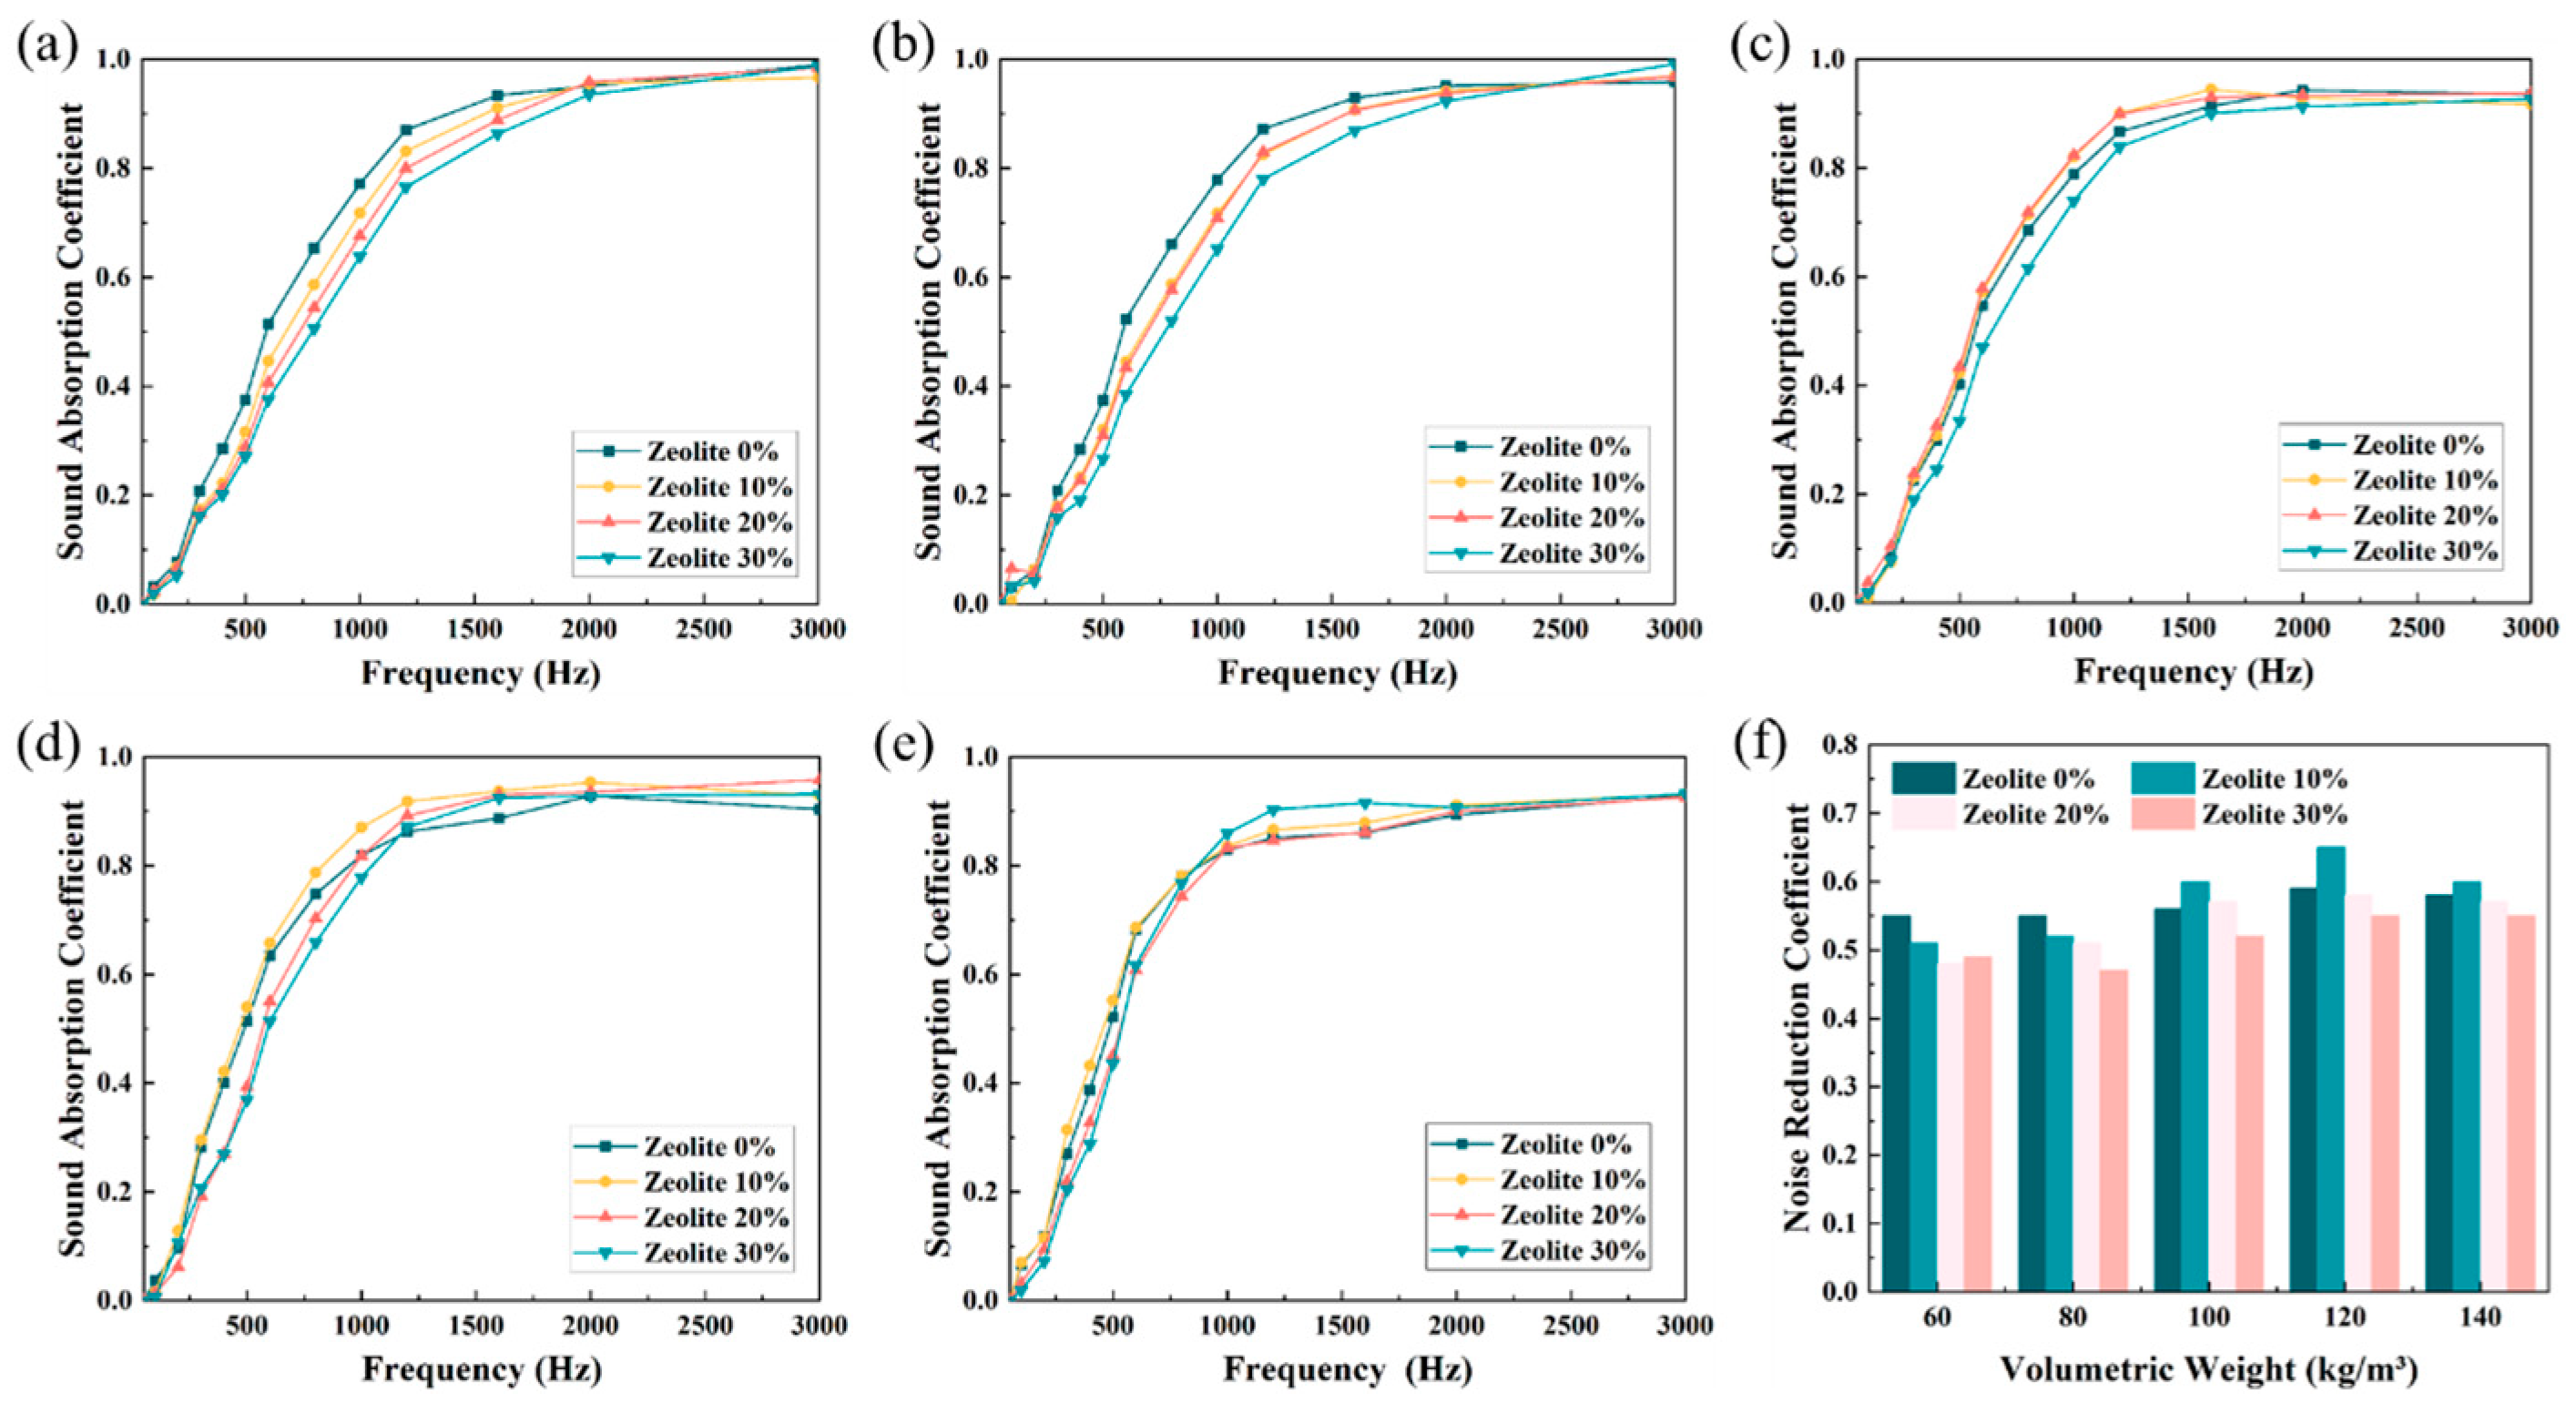
4.3. Effect of Lightweight Particles on the Sound Absorption Performance of Composite Porous Materials
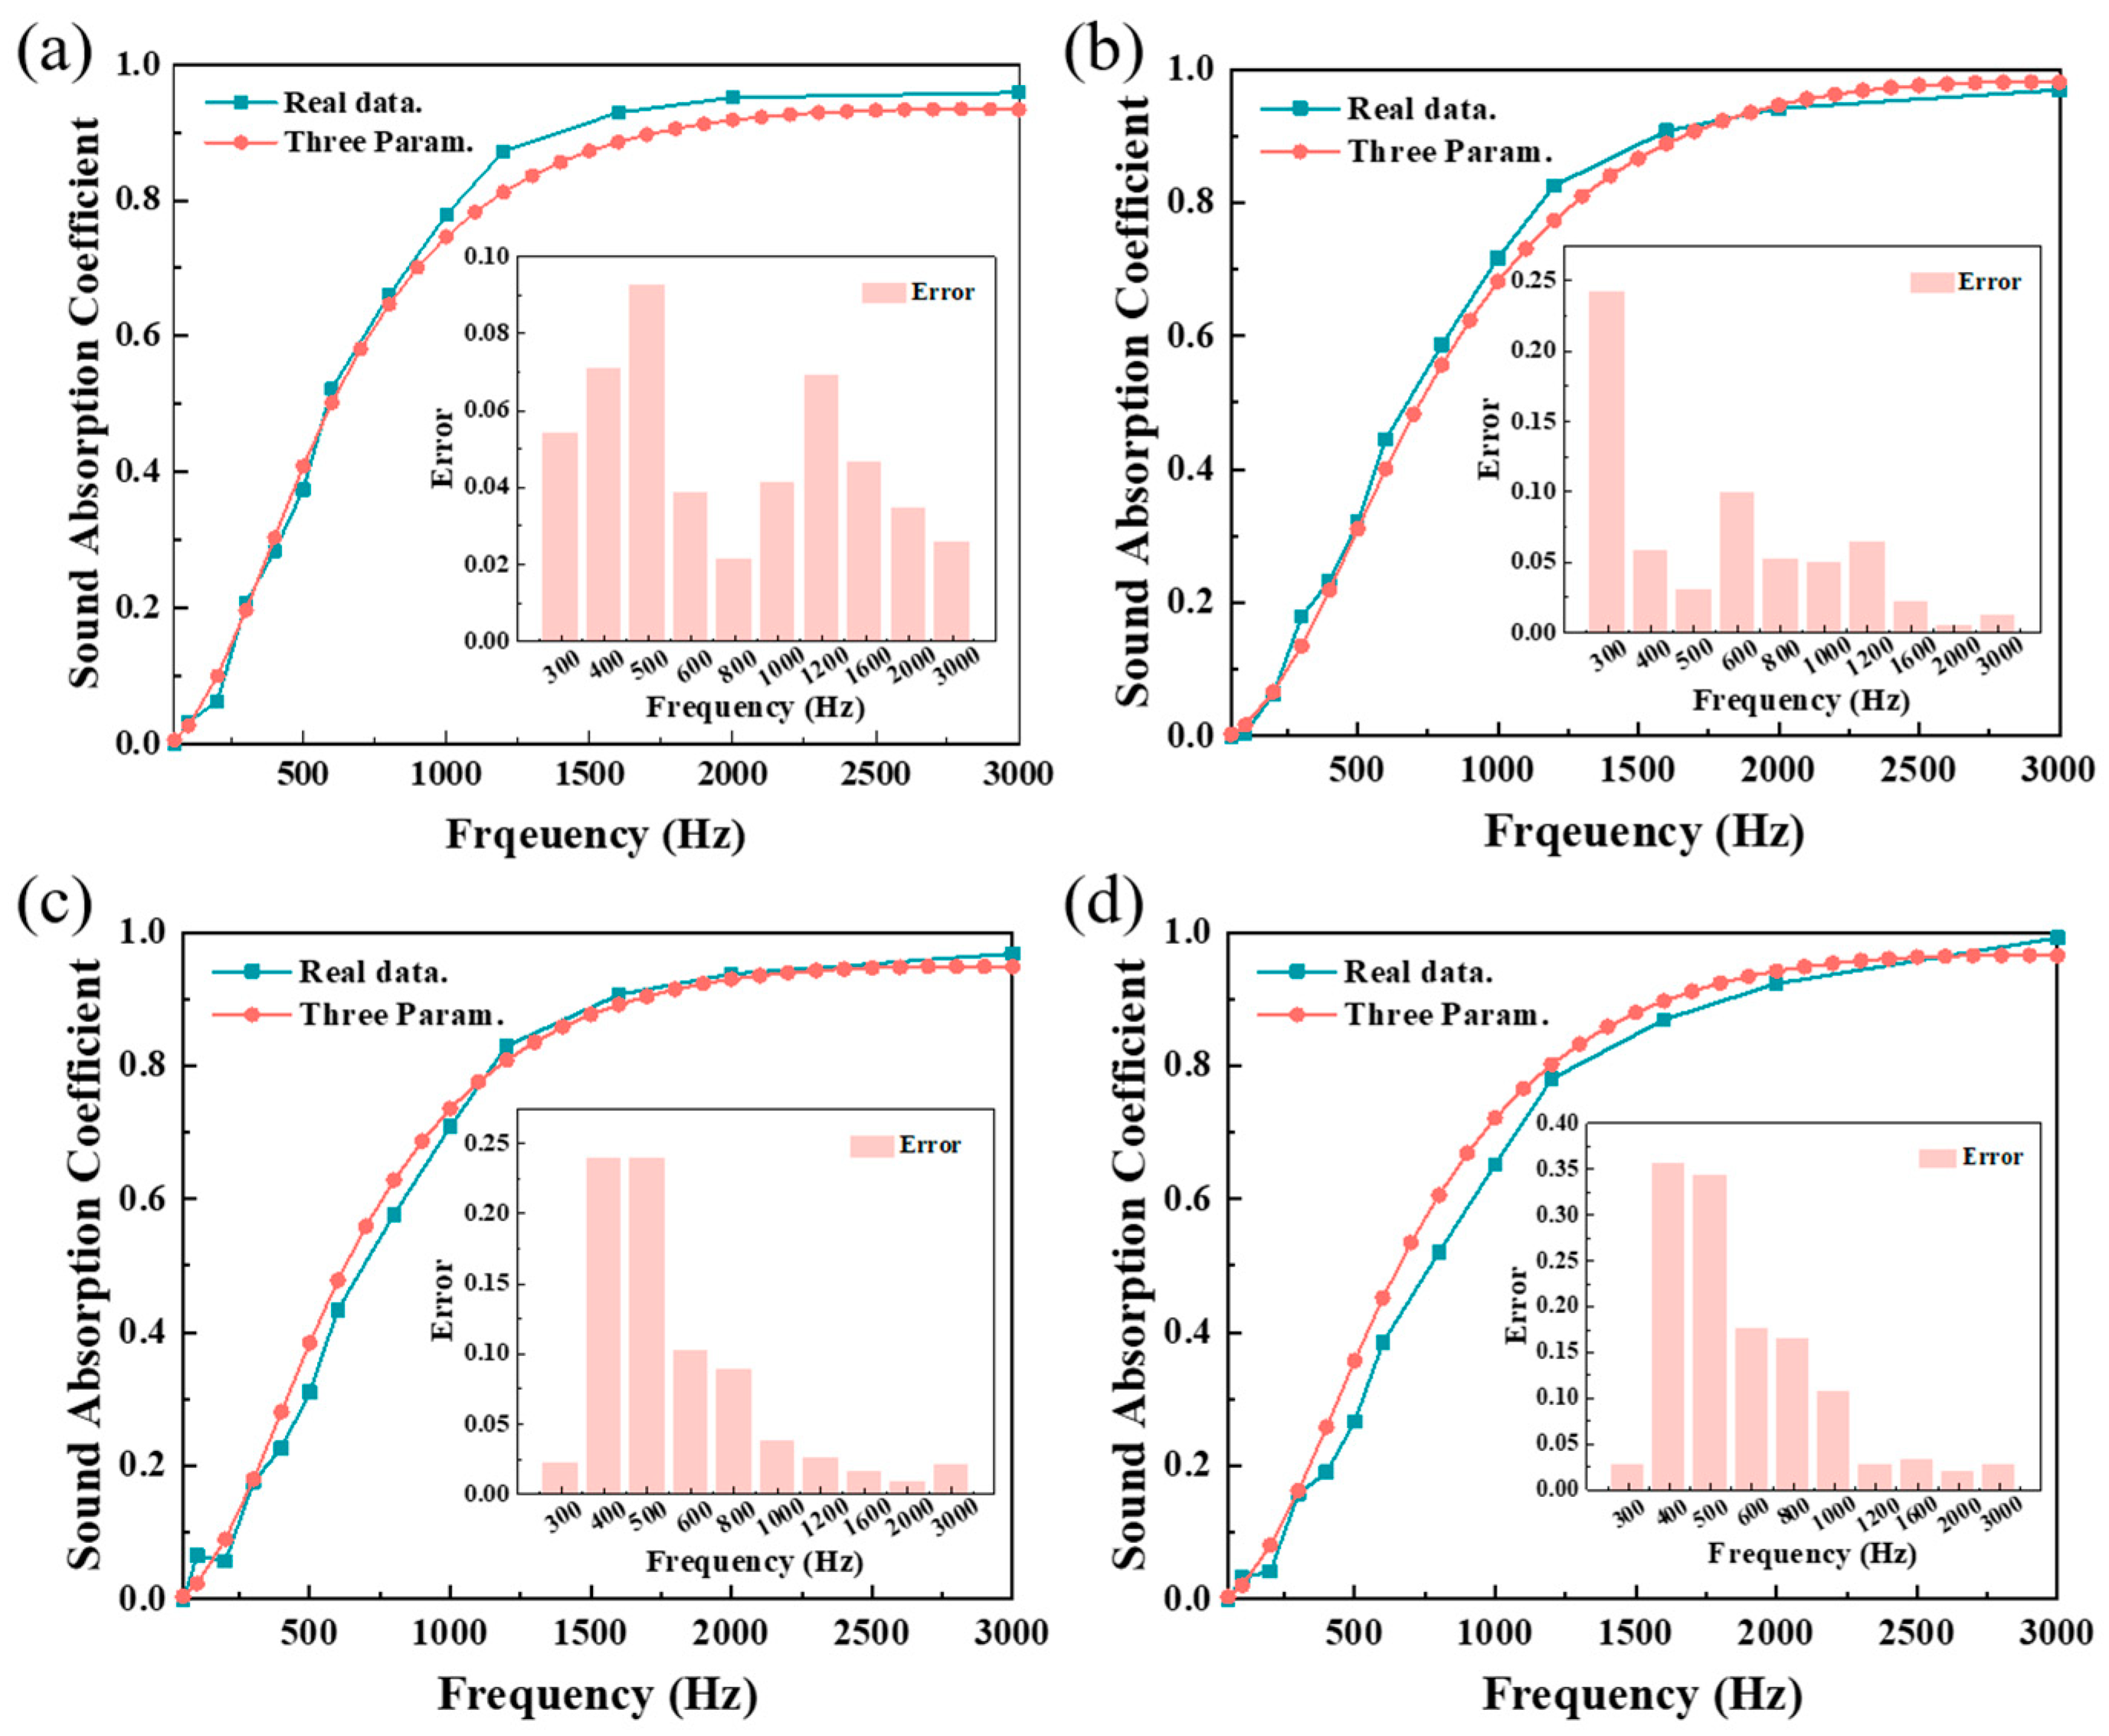
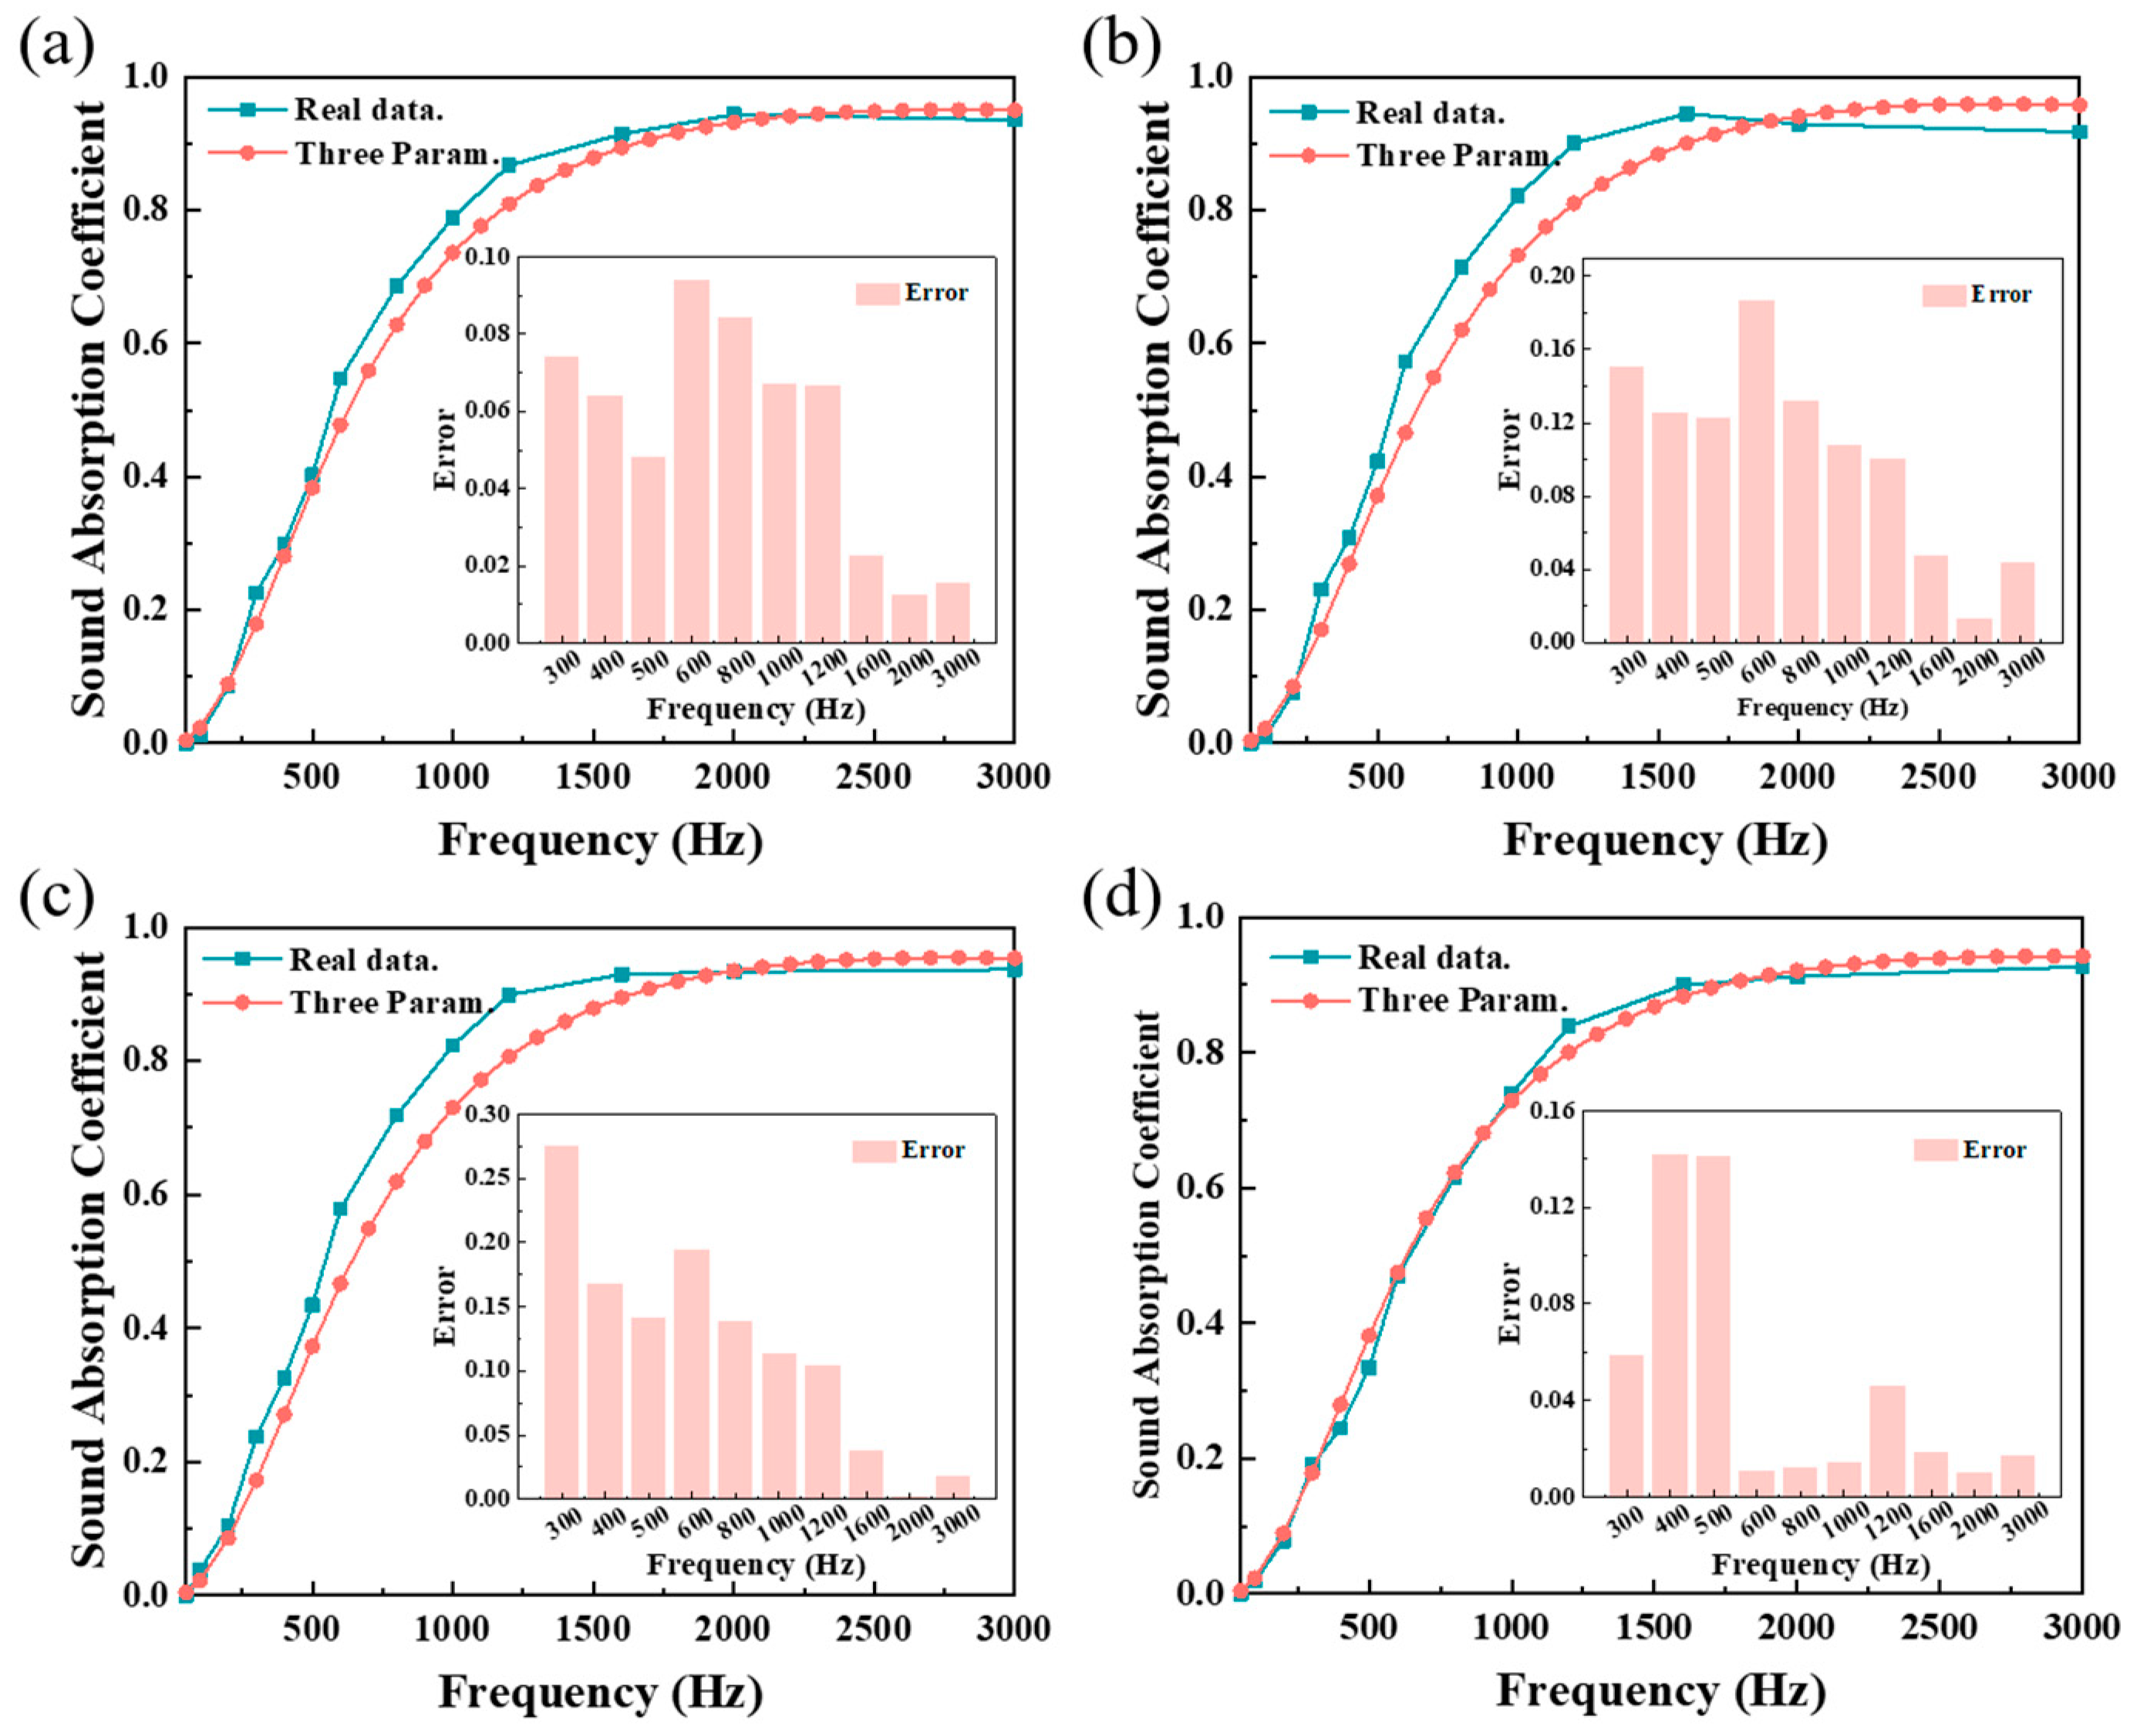
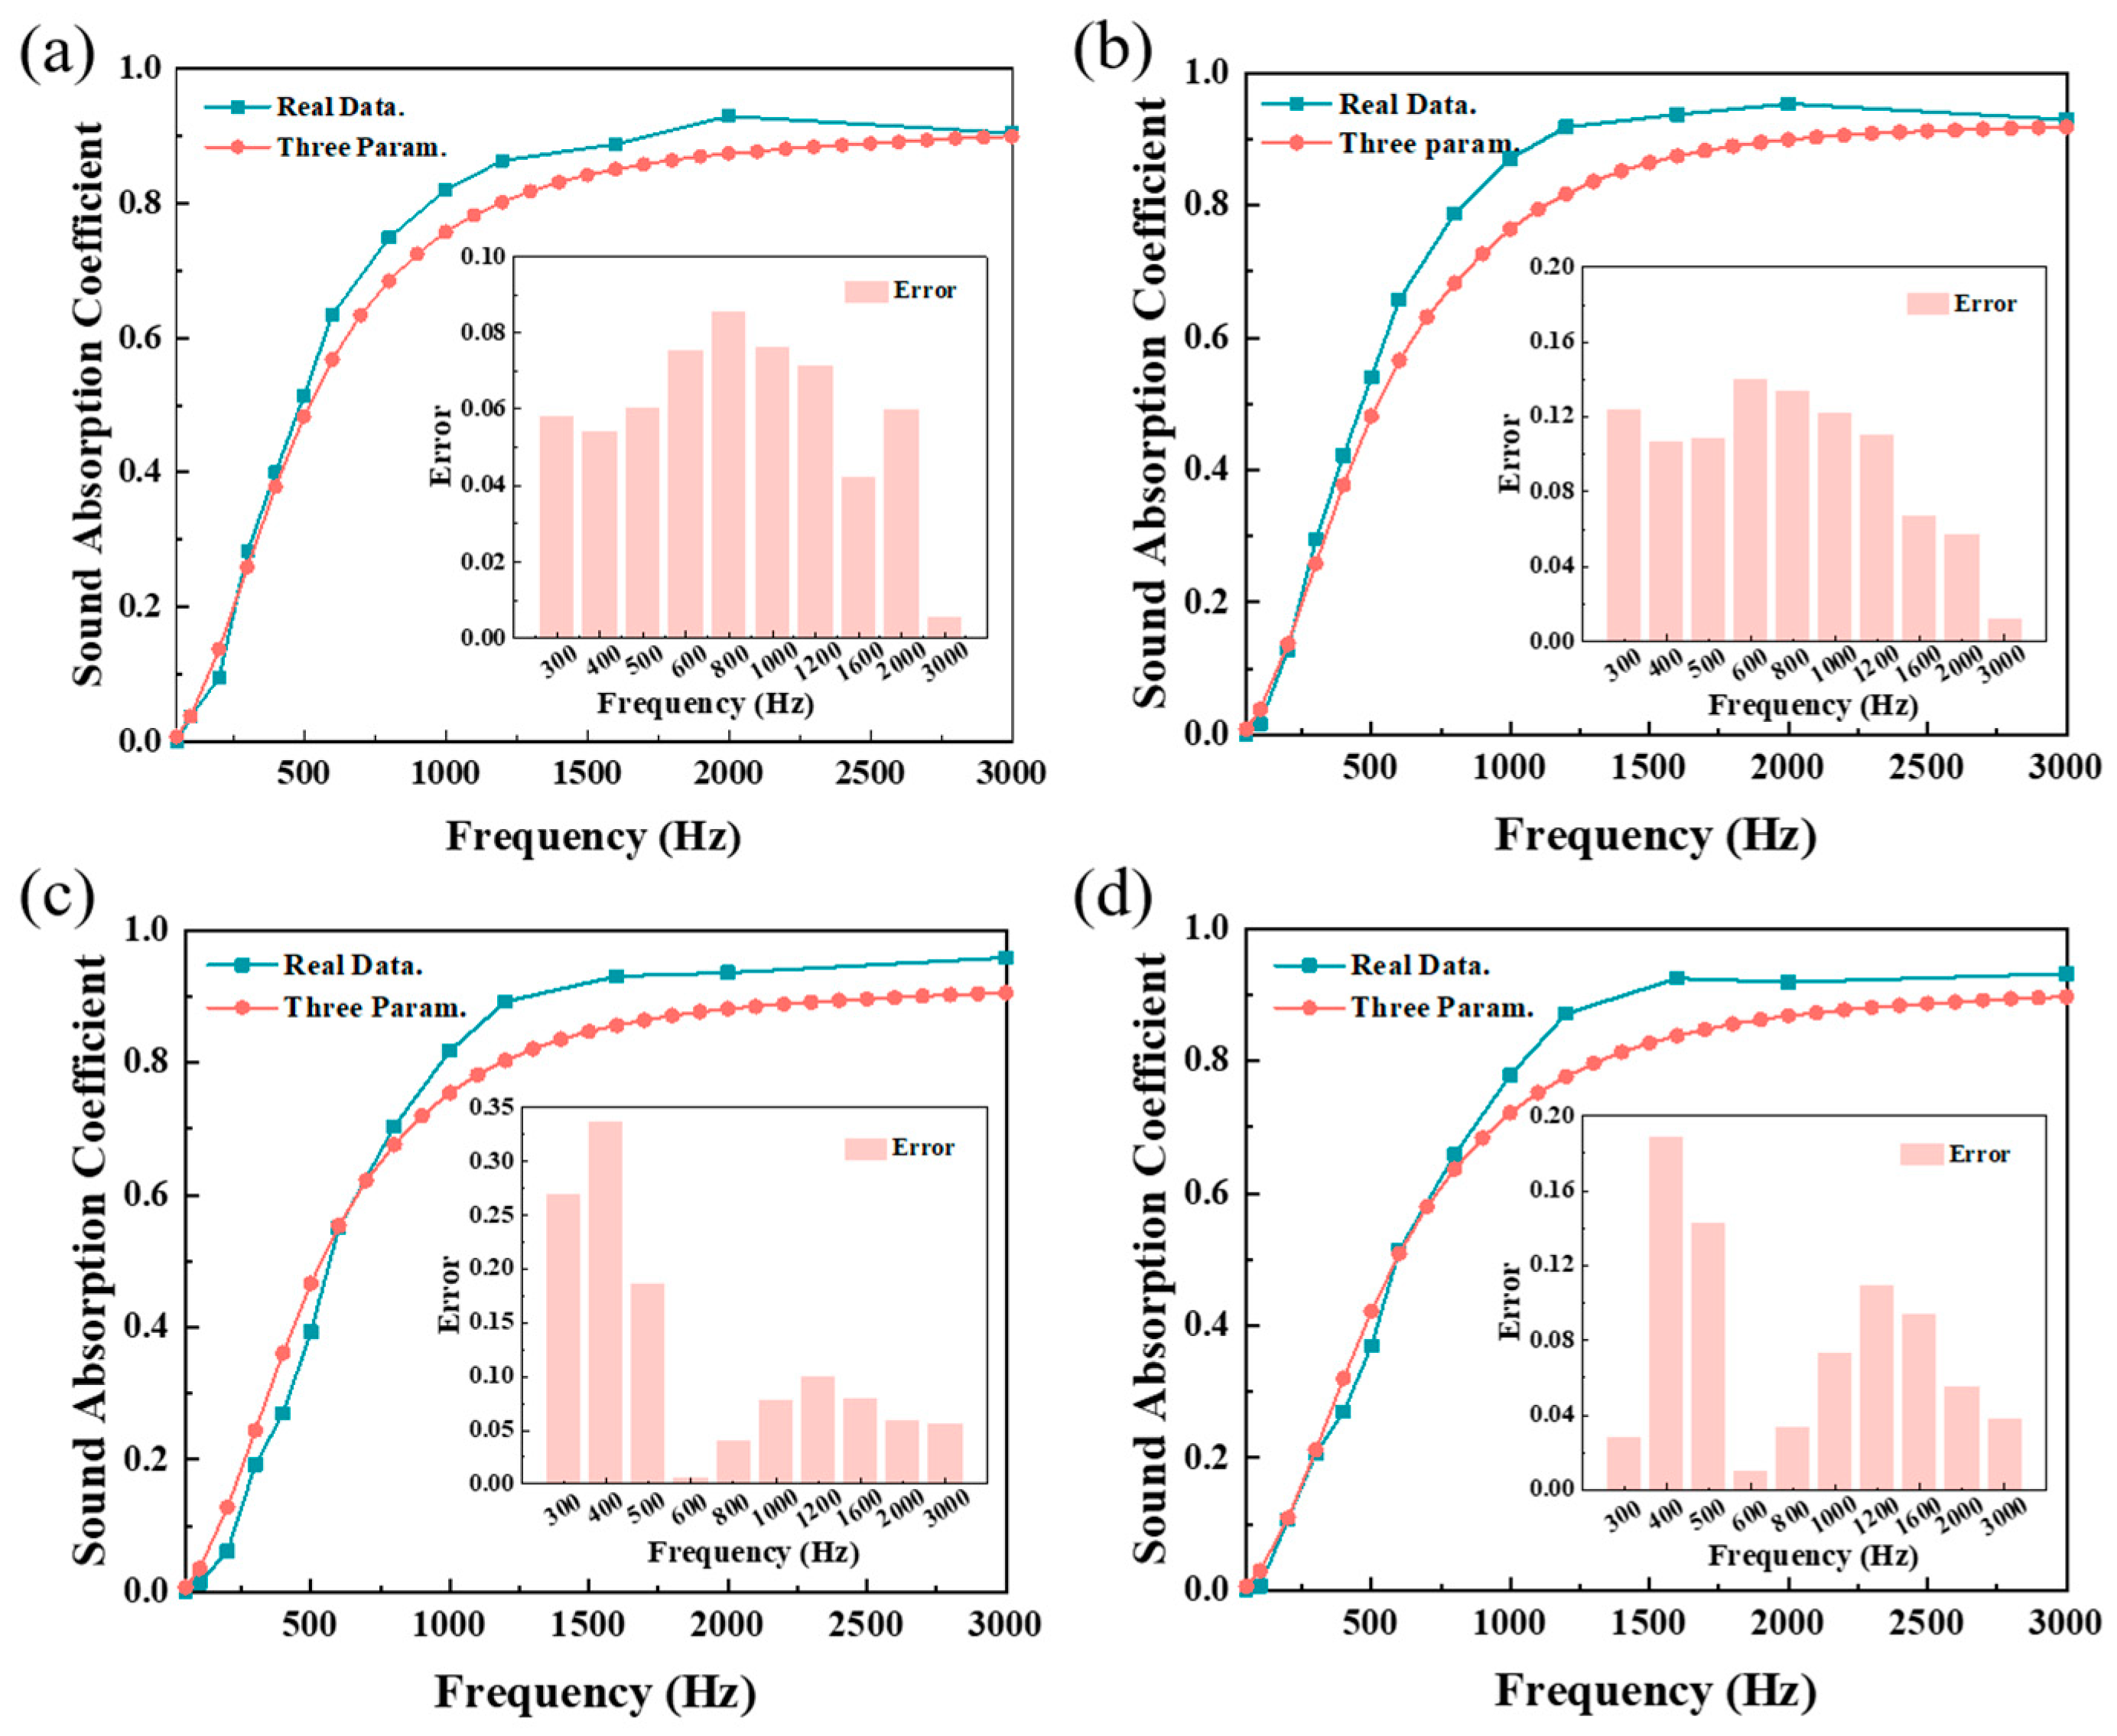
4.4. Model Validation
5. Conclusions
Supplementary Materials
Author Contributions
Funding
Institutional Review Board Statement
Informed Consent Statement
Data Availability Statement
Conflicts of Interest
References
- Montenegro, A.L.; Rey-Gozalo, G.; Arenas, J.P.; Suárez, E. Streets classification models by urban features for road traffic noise estimation. Sci. Total Environ. 2024, 932, 173005. [Google Scholar] [CrossRef]
- Bulkin, V.V.; Khromulina, T.D.; Kirillov, I.N. Analysis of the Acoustically Noise Situation in an Urbanized Area in the Presence of Vehicular and Industrial Noise. IOP Conf. Ser. Earth Environ. Sci. 2019, 272, 022237. [Google Scholar] [CrossRef]
- Cao, L.; Fu, Q.; Si, Y.; Ding, B.; Yu, J. Porous materials for sound absorption. Compos. Commun. 2018, 10, 25–35. [Google Scholar] [CrossRef]
- Tang, X.; Yan, X. Acoustic energy absorption properties of fibrous materials: A review. Compos. Part A Appl. Sci. Manuf. 2017, 101, 360–380. [Google Scholar] [CrossRef]
- Sharma, S.; Sudhakara, P.; Singh, J.; Singh, S.; Singh, G. Emerging progressive developments in the fibrous composites for acoustic applications. J. Manuf. Process. 2023, 102, 443–477. [Google Scholar] [CrossRef]
- Wang, Z.; Novack, T.; Yan, Y.; Zipf, A. Quiet Route Planning for Pedestrians in Traffic Noise Polluted Environments. IEEE Trans. Intell. Transp. Syst. 2021, 22, 7573–7584. [Google Scholar] [CrossRef]
- Berkhout, B.W. Anthropogenic noise pollution and wildlife diseases. Trends Parasitol. 2023, 39, 181–190. [Google Scholar] [CrossRef]
- Sordello, R. Evidence of the environmental impact of noise pollution on biodiversity: A systematic map protocol. Environ. Evid. 2019, 8, 8. [Google Scholar] [CrossRef]
- King, E.A. Here, There, and Everywhere: How the SDGs Must Include Noise Pollution in Their Development Challenges. Environ. Sci. Policy Sustain. Dev. 2022, 64, 17–32. [Google Scholar] [CrossRef]
- Adewale, B.A.; Stephanie, M. Investigation of The Impact of Noise Control Strategies in Sustainable Building Design. IOP Conf. Ser. Earth Environ. Sci. 2022, 1054, 012033. [Google Scholar] [CrossRef]
- Yang, W.; Jeon, J.Y. Design strategies and elements of building envelope for urban acoustic environment. Build. Environ. 2020, 182, 107121. [Google Scholar] [CrossRef]
- Zhang, X.; Zhou, S. Building a City with Low Noise Pollution: Exploring the Mental Health Effect Thresholds of Spatiotemporal Environmental Noise Exposure and Urban Planning Solution. Int. J. Environ. Res. Public Health 2023, 20, 4222. [Google Scholar] [CrossRef]
- Radicchi, A. Quietness as a commons: Integrating soundscape in urban planning for the environmentally just city. J. Acoust. Soc. Am. 2017, 142, 2671. [Google Scholar] [CrossRef]
- Morillas, J.M.B.; Gozalo, G.R.; González, D.M.; Moraga, P.A.; Vílchez-Gómez, R. Noise Pollution and Urban Planning. Curr. Pollut. Rep. 2018, 4, 208–219. [Google Scholar] [CrossRef]
- Liu, R.; Hou, L.; Zhou, W.; Chen, Y. Design, fabrication and sound absorption performance investigation of porous copper fiber sintered sheets with rough surface. Appl. Acoust. 2020, 170, 107525. [Google Scholar] [CrossRef]
- Xi, Z.; Zhu, J.; Tang, H.; Ao, Q.; Zhi, H.; Wang, J.; Li, C. Progress of Application Researches of Porous Fiber Metals. Materials 2011, 4, 816–824. [Google Scholar] [CrossRef] [PubMed]
- Venegas, R.; Umnova, O. Acoustical properties of double porosity granular materials. J. Acoust. Soc. Am. 2011, 130, 2765–2776. [Google Scholar] [CrossRef]
- Liu, X.; Yan, X.; Zhang, H. Effects of pore structure on sound absorption of kapok-based fiber nonwoven fabrics at low frequency. Text. Res. J. 2016, 86, 755–764. [Google Scholar] [CrossRef]
- Dong, C.; Liu, Z.; Liu, X.; Pierce, R.S.; Yi, X. Sound absorption performance of folded structures prepared from woven prepreg and porous material composites. Appl. Acoust. 2023, 212, 109591. [Google Scholar] [CrossRef]
- Hirosawa, K. Numerical study on the influence of fiber cross-sectional shapes on the sound absorption efficiency of fibrous porous materials. Appl. Acoust. 2020, 164, 107222. [Google Scholar] [CrossRef]
- Puguan, J.M.C.; Agbayani, D.B.A.; Sadural, A.J.V.; Kim, H. Enhanced Low Frequency Sound Absorption of Bilayer Nanocomposite Acoustic Absorber Laminated with Microperforated Nanofiber Felt. ACS Appl. Polym. Mater. 2023, 5, 8880–8889. [Google Scholar] [CrossRef]
- Chen, J.H.; Liu, P.S.; Sun, J.X. Sound absorption performance of a lightweight ceramic foam. Ceram. Int. 2020, 46, 22699–22708. [Google Scholar] [CrossRef]
- Chen, J. Research Progress on Sound Absorption of Fiber-Based Materials and Their Composites. Fibers Polym. 2024, 25, 4529–4555. [Google Scholar] [CrossRef]
- Delany, M.E.; Bazley, E.N. Acoustical properties of fibrous absorbent materials. Appl. Acoust. 1970, 3, 105–116. [Google Scholar] [CrossRef]
- Miki, Y. Acoustical properties of porous materials. Modifications of Delany-Bazley models. J. Acoust. Soc. Jpn. (E) 1990, 11, 19–24. [Google Scholar] [CrossRef]
- Komatsu, T. Improvement of the Delany-Bazley and Miki models for fibrous sound-absorbing materials. Acoust. Sci. Tech. 2008, 29, 121–129. [Google Scholar] [CrossRef]
- He, Y.; Hu, C.; Wang, J.; Yao, Z.; Cai, J. Optimized Delany-Bazley sound absorption model of flat polyester fiber. Tech. Acoust. 2022, 41, 252–256. [Google Scholar] [CrossRef]
- Allard, J.-F.; Champoux, Y. New empirical equations for sound propagation in rigid frame fibrous materials. J. Acoust. Soc. Am. 1992, 91, 3346–3353. [Google Scholar] [CrossRef]
- Kino, N. Ultrasonic measurements of the two characteristic lengths in fibrous materials. Appl. Acoust. 2007, 68, 1427–1438. [Google Scholar] [CrossRef]
- Kino, N. Further investigations of empirical improvements to the Johnson–Champoux–Allard model. Appl. Acoust. 2015, 96, 153–170. [Google Scholar] [CrossRef]
- Champoux, Y.; Allard, J.-F. Dynamic tortuosity and bulk modulus in air-saturated porous media. J. Appl. Phys. 1991, 70, 1975–1979. [Google Scholar] [CrossRef]
- Pride, S.R.; Morgan, F.D.; Gangi, A.F. Drag forces of porous-medium acoustics. Phys. Rev. B 1993, 47, 4964–4978. [Google Scholar] [CrossRef]
- Horoshenkov, K.V.; Hurrell, A.; Groby, J.-P. A three-parameter analytical model for the acoustical properties of porous media. J. Acoust. Soc. Am. 2019, 145, 2512–2517. [Google Scholar] [CrossRef] [PubMed]
- Nguyen, C.T.; Langlois, V.; Guilleminot, J.; Duval, A.; Perrot, C. Effect of pore size polydispersity on the acoustic properties of high-porosity solid foams. Phys. Fluids 2024, 36, 047101. [Google Scholar] [CrossRef]
- Nguyen, C.T.; Li, D.; Xiong, Z.; He, M.; Gautron, L.; Duval, A.; Perrot, C. Structure-property relationships of polydisperse open-cell foams: Application to melamine foams. Acta Acust. 2024, 8, 54. [Google Scholar] [CrossRef]
- Gao, J.; Dong, F.; Jia, J.; Tan, C. Calibration-free temperature monitoring of pulverized coal powder based on the dual-mode acoustic tomography. Powder Technol. 2024, 448, 120220. [Google Scholar]
- Saati, F.; Hoppe, K.-A.; Marburg, S.; Horoshenkov, K.V. The accuracy of some models to predict the acoustical properties of granular media. Appl. Acoust. 2022, 185, 108358. [Google Scholar] [CrossRef]
- Hurrell, A.; Horoshenkov, K.V.; King, S.G.; Stolojon, V. On the relationship of the observed acoustical and related non-acoustical behaviours of nanofibers membranes using Biot- and Darcy-type models. Appl. Acoust. 2021, 179, 108075. [Google Scholar] [CrossRef]
- Begum, H.; Horoshenkov, K.V. Acoustical Properties of Fiberglass Blankets Impregnated with Silica Aerogel. Appl. Sci. 2021, 11, 4593. [Google Scholar] [CrossRef]
- Pan, Q.; Hu, J.; Hu, C.; Yan, Y. Reparation and characterization of carbon nanotubes coated on expanded perlite as sound absorption composite materials. Mater. Sci. Eng. B 2023, 296, 116697. [Google Scholar] [CrossRef]
- Wei, Z.; Weavers, L.K. Combining COMSOL modeling with acoustic pressure maps to design sono-reactors. Ultrason. Sonochemistry 2016, 31, 490–498. [Google Scholar] [CrossRef] [PubMed]
- ASTM F316-03; Standard Test Methods for Pore Size Characteristics of Membrane Filters by Bubble Point and Mean Flow Pore Test. ASTM: West Conshohocken, PA, USA, 2019.
- GB/T 18696.2-2002; Acoustics—Determination of Sound Absorption Coefficient and Impedance in Impedance tubes—Part 2: Transfer Function Method. National Standard of the People’s Republic of China: Beijing, China, 2002.
- ASTM C634-13 (2021); Standard Terminology Relating to Building and Environmental Acoustics. ASTM: West Conshohocken, PA, USA, 2021.
- Tascan, M.; Vaughn, E.A.; Stevens, K.A.; Brown, P.J. Effects of total surface area and fabric density on the acoustical behavior of traditional thermal-bonded highloft nonwoven fabrics. J. Text. Inst. 2011, 102, 746–751. [Google Scholar] [CrossRef]
- Bai, H.; Qian, X.; Fan, J.; Qian, Y.; Duo, Y.; Liu, Y.; Wang, X. Computing Pore Size Distribution in Non-woven Fibrous Filter Media. Fibers Polym. 2020, 21, 196–203. [Google Scholar] [CrossRef]
- Everett, D.H. Manual of Symbols and Terminology for Physicochemical Quantities and Units, Appendix II: Definitions, Terminology and Symbols in Colloid and Surface Chemistry. Pure Appl. Chem. 1972, 31, 577–638. [Google Scholar] [CrossRef]
- Xin, F.; Ma, X.; Liu, X.; Zhang, C. A multiscale theoretical approach for the sound absorption of slit-perforated double porosity materials. Compos. Struct. 2019, 223, 110919. [Google Scholar] [CrossRef]
- Wang, Y.; Chen, Y.; Yang, S.; Liu, J.; Xie, H. Experimental Study on Gypsum-based Sound-absorbing Ceramsite Materials. Chongqing Archit. 2020, 19, 25–28. [Google Scholar]
- Ishikawa, S.; Hirata, R.; Kijimoto, S. Improved effectiveness of acoustic absorbing materials by using air layers in a one-dimensional tube. Appl. Acoust. 2021, 178, 107984. [Google Scholar] [CrossRef]
- Jiang, X.; Wang, Z.; Yang, Z.; Zhang, F.; You, F.; Yao, C. Structural Design and Sound Absorption Properties of Nitrile Butadiene Rubber-Polyurethane Foam Composites with Stratified Structure. Polymers 2018, 10, 946. [Google Scholar] [CrossRef]


| porosity | 0.90 | 0.92 | 0.94 | 0.96 | 0.98 |
| median pore size (μm) | 40 | 60 | 80 | 100 | 120 |
| standard deviation in pore size distribution | 0.10 | 0.15 | 0.20 | 0.25 | 0.30 |
| Na2O | MgO | Al2O3 | SiO2 | SO3 | K2O | CaO | TiO2 | Fe2O3 | P2O5 | MnO | |
|---|---|---|---|---|---|---|---|---|---|---|---|
| Fiber | 16.07 | 3.22 | 1.87 | 67.15 | 0.30 | 0.53 | 10.43 | 0.08 | 0.24 | / | / |
| Zeolite | 1.04 | 2.31 | 16.37 | 65.14 | / | 4.28 | 5.22 | 0.59 | 4.62 | 0.14 | 0.13 |
| density | 60 | 80 | 100 | 120 | 140 | |
| porosity (%) | 97.59 | 96.79 | 95.98 | 95.18 | 94.38 | |
| median pore size (μm) | 7 μm | 97.6425 | 91.7545 | 76.7821 | 68.5024 | 52.9058 |
| 5 μm | 74.4599 | 69.4861 | 65.9613 | 58.1597 | 46.5611 | |
Disclaimer/Publisher’s Note: The statements, opinions and data contained in all publications are solely those of the individual author(s) and contributor(s) and not of MDPI and/or the editor(s). MDPI and/or the editor(s) disclaim responsibility for any injury to people or property resulting from any ideas, methods, instructions or products referred to in the content. |
© 2025 by the authors. Licensee MDPI, Basel, Switzerland. This article is an open access article distributed under the terms and conditions of the Creative Commons Attribution (CC BY) license (https://creativecommons.org/licenses/by/4.0/).
Share and Cite
Suo, H.; Xu, J.; Feng, Y.; Liu, D.; Tang, P.; Feng, Y. Experimental Research and Theoretical Analysis of the Coupling Mechanism Between Microstructure and Acoustics in Porous Materials. Appl. Sci. 2025, 15, 3104. https://doi.org/10.3390/app15063104
Suo H, Xu J, Feng Y, Liu D, Tang P, Feng Y. Experimental Research and Theoretical Analysis of the Coupling Mechanism Between Microstructure and Acoustics in Porous Materials. Applied Sciences. 2025; 15(6):3104. https://doi.org/10.3390/app15063104
Chicago/Turabian StyleSuo, Haoshuai, Junhuai Xu, Yaohan Feng, Dongsheng Liu, Pei Tang, and Ya Feng. 2025. "Experimental Research and Theoretical Analysis of the Coupling Mechanism Between Microstructure and Acoustics in Porous Materials" Applied Sciences 15, no. 6: 3104. https://doi.org/10.3390/app15063104
APA StyleSuo, H., Xu, J., Feng, Y., Liu, D., Tang, P., & Feng, Y. (2025). Experimental Research and Theoretical Analysis of the Coupling Mechanism Between Microstructure and Acoustics in Porous Materials. Applied Sciences, 15(6), 3104. https://doi.org/10.3390/app15063104