Article

Real-Time AI-Based Power Demand Forecasting for Peak Shaving and Consumption Reduction Using Vehicle-to-Grid and Reused Energy Storage Systems: A Case Study at a Business Center on Jeju Island

1
Department of Mechanical Engineering, Yonsei University, Seoul 03722, Republic of Korea
2
Smart Grid Business Division/R&D Center, Daekyung Engineering Co., Ltd., Jeju 63309, Republic of Korea
*
Author to whom correspondence should be addressed.
Appl. Sci. 2025, 15(6), 3050; https://doi.org/10.3390/app15063050
Submission received: 10 February 2025 / Revised: 6 March 2025 / Accepted: 10 March 2025 / Published: 11 March 2025
(This article belongs to the Special Issue Green Technologies and Applications)

Abstract

:
The increasing demand for electricity and the environmental challenges associated with traditional fossil fuel-based power generation have accelerated the global transition to renewable energy sources. While renewable energy offers significant advantages, including low carbon emissions and sustainability, its inherent variability and intermittency create challenges for grid stability and energy management. This study contributes to addressing these challenges by developing an AI-driven power consumption forecasting system. The core of the proposed system is a multi-cluster long short-term memory model (MC-LSTM), which combines k-means clustering with LSTM neural networks to enhance forecasting accuracy. The MC-LSTM model achieved an overall prediction accuracy of 97.93%, enabling dynamic, real-time demand-side energy management. Furthermore, to validate its effectiveness, the system integrates vehicle-to-grid technology and reused energy storage systems as external energy sources. A real-world demonstration was conducted in a commercial building on Jeju Island, where the AI-driven system successfully reduced total energy consumption by 21.3% through optimized peak shaving and load balancing. The proposed system provides a practical framework for enhancing grid stability, optimizing energy distribution, and reducing dependence on centralized power systems.

1. Introduction

Electrical energy is a fundamental driving force across all sectors of modern society, including residential, commercial, and industrial applications. According to the International Energy Agency (IEA), global electricity demand is projected to grow at an annual rate of approximately 3% by 2030, with emerging economies expected to contribute over 70% of this increase. This sustained growth necessitates advancements in power generation and distribution systems to ensure a stable energy supply and efficient resource utilization.
Traditionally, electricity generation has relied heavily on centralized, non-renewable sources such as coal, natural gas, and nuclear power. However, these sources are major contributors to greenhouse gas emissions, accelerating climate change. In response, international agreements such as the Paris Climate Agreement have set ambitious emission reduction targets and promoted policies to expand the share of renewable energy. Renewable energy offers multiple advantages, including low carbon emissions, reduced maintenance costs, and improved power quality, making it a key pillar in the global energy transition.
As part of this transition, Jeju Island, the southernmost region of South Korea, launched the Carbon-Free Island 2030 (CFI 2030) initiative [1,2] to establish a fully renewable energy-based system. A critical component of this strategy is the promotion of electric vehicles (EVs) to reduce greenhouse gas emissions in the transportation sector. As of July 2024, the number of registered EVs on Jeju Island reached 43,117, reflecting a 208% increase over the past five years. Additionally, most public buses have been replaced with electric models, significantly contributing to the island’s clean energy goals.
Furthermore, Jeju Island has been expanding its renewable energy infrastructure to support this transition to ensure a stable and sustainable energy supply. According to the CFI 2030 implementation plan established in 2019, the island aims to deploy 4085 MW of renewable energy capacity by 2030, exceeding 106% of its projected electricity demand [3]. Progress toward this goal includes increasing residential solar panel adoption to 32.7% and operating South Korea’s first commercial offshore wind farm since 2017. As a result, renewable energy accounts for 18.3% of Jeju Island’s electricity mix in 2021—the highest share in the country.
However, while these kinds of transitions have rapidly advanced due to environmental benefits, such as reducing carbon emissions, they also pose challenges related to rising electricity demand and peak loads. Increased EV adoption, despite its role in lowering carbon emissions, further contributes to these challenges. According to several studies, surges in EV charging during peak commuting hours or high-tourism seasons can place significant stress on the grid [4,5]. Additionally, the variability in renewable energy generation, which depends on climate conditions and time of day, complicates grid management. For example, solar power is only available during daylight hours, limiting its support for nighttime EV charging, while wind power fluctuates with weather conditions, making it difficult to maintain a stable supply. These rapid shifts in electricity demand, combined with the intermittency of renewable energy sources, can lead to grid instability.
To address these challenges, various strategies have been proposed to minimize the imbalance between power demand and supply. For example, there are policy-based demand-side management approaches that aim to reduce energy consumption by adopting incentive mechanisms—such as imposing additional energy charges during peak hours [6,7]. Additionally, there is active research on hardware approaches, such as integrating external energy storage systems (ESSs) into the grid [8]. Furthermore, to address the uncertainty of renewable energy sources (RESs), studies on energy management and scheduling have been actively pursued [9,10]. In particular, approaches using linear programming have been employed to achieve a stable and reliable power supply in the presence of limited available energy sources [11]. Other studies have employed stochastic optimization [12], which utilizes the probability density function of RESs to schedule system operations, along with robust optimization methods [13] that ensure the feasibility of optimization results under worst-case scenarios.
To further enhance the effectiveness of these diverse strategies, extensive research has been conducted on direct demand forecasting techniques. By predicting future peak loads and considering load uncertainty, more efficient energy management becomes possible. A wide range of statistical models have been explored for power consumption forecasting, including time-series analysis and regression analysis [14]. However, the nonlinearity and complex interactions within the data cannot be fully captured by these traditional approaches [15]. Over the past decade, machine learning has emerged as a powerful tool for energy consumption forecasting, distinguishing itself in various fields. Machine learning techniques—such as artificial neural networks [16] and support vector machines [17]—have emerged as powerful tools to identify complex correlations and trends in power consumption data, thereby generating reliable predictions. More recently, various deep learning-based forecasting methods, such as recurrent neural networks [18] and convolutional neural networks [19], have also been proposed.
In line with these developments, this study proposes an AI-driven power consumption forecasting system. The core of this system is a multi-cluster long short-term memory (MC-LSTM) model, which combines k-means clustering with LSTM neural networks to achieve highly accurate power demand predictions. By clustering the entire power consumption data—which exhibits a wide range of variability—into groups with similar characteristics, each model can be fine-tuned to its respective cluster’s features.
To evaluate the effectiveness of this AI-based power demand forecasting system, the study integrates vehicle-to-grid (V2G) technology and reused energy storage systems (R-ESSs) as validation tools. V2G enables bidirectional energy exchange between EVs and the grid, allowing EVs to function as short-term distributed energy storage units, while the R-ESS, repurposed from electric bus batteries, provides long-term storage to mitigate fluctuations in renewable energy generation. By combining AI-driven forecasting with these energy storage solutions, the system dynamically allocates resources, reducing peak loads and stabilizing power demand.
The proposed system was implemented in a commercial building within Jeju Technovalley to assess its real-world impact on peak power reduction and load optimization. Jeju Island has emerged as an ideal demonstration site due to its ambitious renewable energy targets, unique grid challenges arising from geographic isolation, and progressive smart grid initiatives. The island’s dynamic energy landscape, driven by factors such as increased tourism and EV adoption, further underscores its suitability as a testing ground for innovative energy management solutions.
Unlike many previous studies that evaluated forecasting performance solely through simulation on a validation set, our study extends the evaluation to a real-world case study, demonstrating the model’s practical applicability. This case study provides valuable insights into how an AI-driven demand forecasting system can contribute to energy management for island regions, microgrids, and energy-independent communities, demonstrating a scalable solution for future smart grids and autonomous energy networks.

2. Methodology

Accurate power consumption forecasting is essential for optimizing energy distribution, improving efficiency, and maintaining grid stability. Reliable predictions allow energy suppliers to allocate resources more effectively, minimizing waste and preventing grid overloads [20,21,22]. By leveraging predictive models to assess energy demand, power plants can generate only the required amount of electricity, reducing resource consumption. At the same time, grid operators can mitigate overload risks, while consumers can optimize their electricity usage.
Traditional forecasting methods primarily rely on statistical models that analyze historical data to predict future consumption trends. However, these models struggle to incorporate external factors such as weather variations, social events, and complex user behavior. Additionally, they often fail to capture the nonlinear characteristics of power consumption data, limiting their accuracy and scalability.
To address these limitations, this study introduces an AI-driven approach called the MC-LSTM model. This method integrates k-means clustering with LSTM neural networks to enhance prediction reliability and efficiency. The k-means clustering algorithm categorizes power consumption data based on seasonal and time-dependent characteristics, identifying structural consumption patterns. Separate LSTM models are then trained for each cluster, enabling them to learn long-term dependencies in time-series data with greater specificity. By combining clustering with deep learning, the MC-LSTM model effectively incorporates diverse external factors and delivers highly accurate power consumption forecasts.

2.1. Data Preprocessing

The dataset used for model training was preprocessed to ensure data integrity and optimize forecasting performance. Power consumption data were collected from the headquarters of Daekyung Engineering Co., Ltd., located in Jeju, Republic of Korea. The data, obtained from the Korea Electric Power Corporation (KEPCO) public data portal, was recorded at 15 min intervals from 1 June 2022 to 31 May 2024. The raw dataset contained timestamps (year, month, day, hour, and minute) and corresponding power consumption values.
To improve predictive accuracy, additional features influencing power consumption were incorporated. These included meteorological variables (temperature, humidity, wind speed, precipitation, and solar radiation), working day/non-working day indicators, and the COVID-19 social distancing index, alongside the number of employees present in the building. During the COVID-19 period, South Korea implemented a social distancing index, which significantly influenced corporate remote work policies. Given that employee presence directly affects energy usage, this factor was included as a key feature.
To address missing data, linear interpolation was applied between preceding and succeeding power consumption values. This method preserves data continuity and effectively manages gaps over short time intervals, ensuring the reliability of the dataset for model training. Additionally, to enable the effective processing of the time-series data by the model, a sliding window algorithm was applied. This algorithm restructured the dataset into sequences with a fixed length of 10 time steps, providing sufficient context for the model while maintaining computational efficiency.

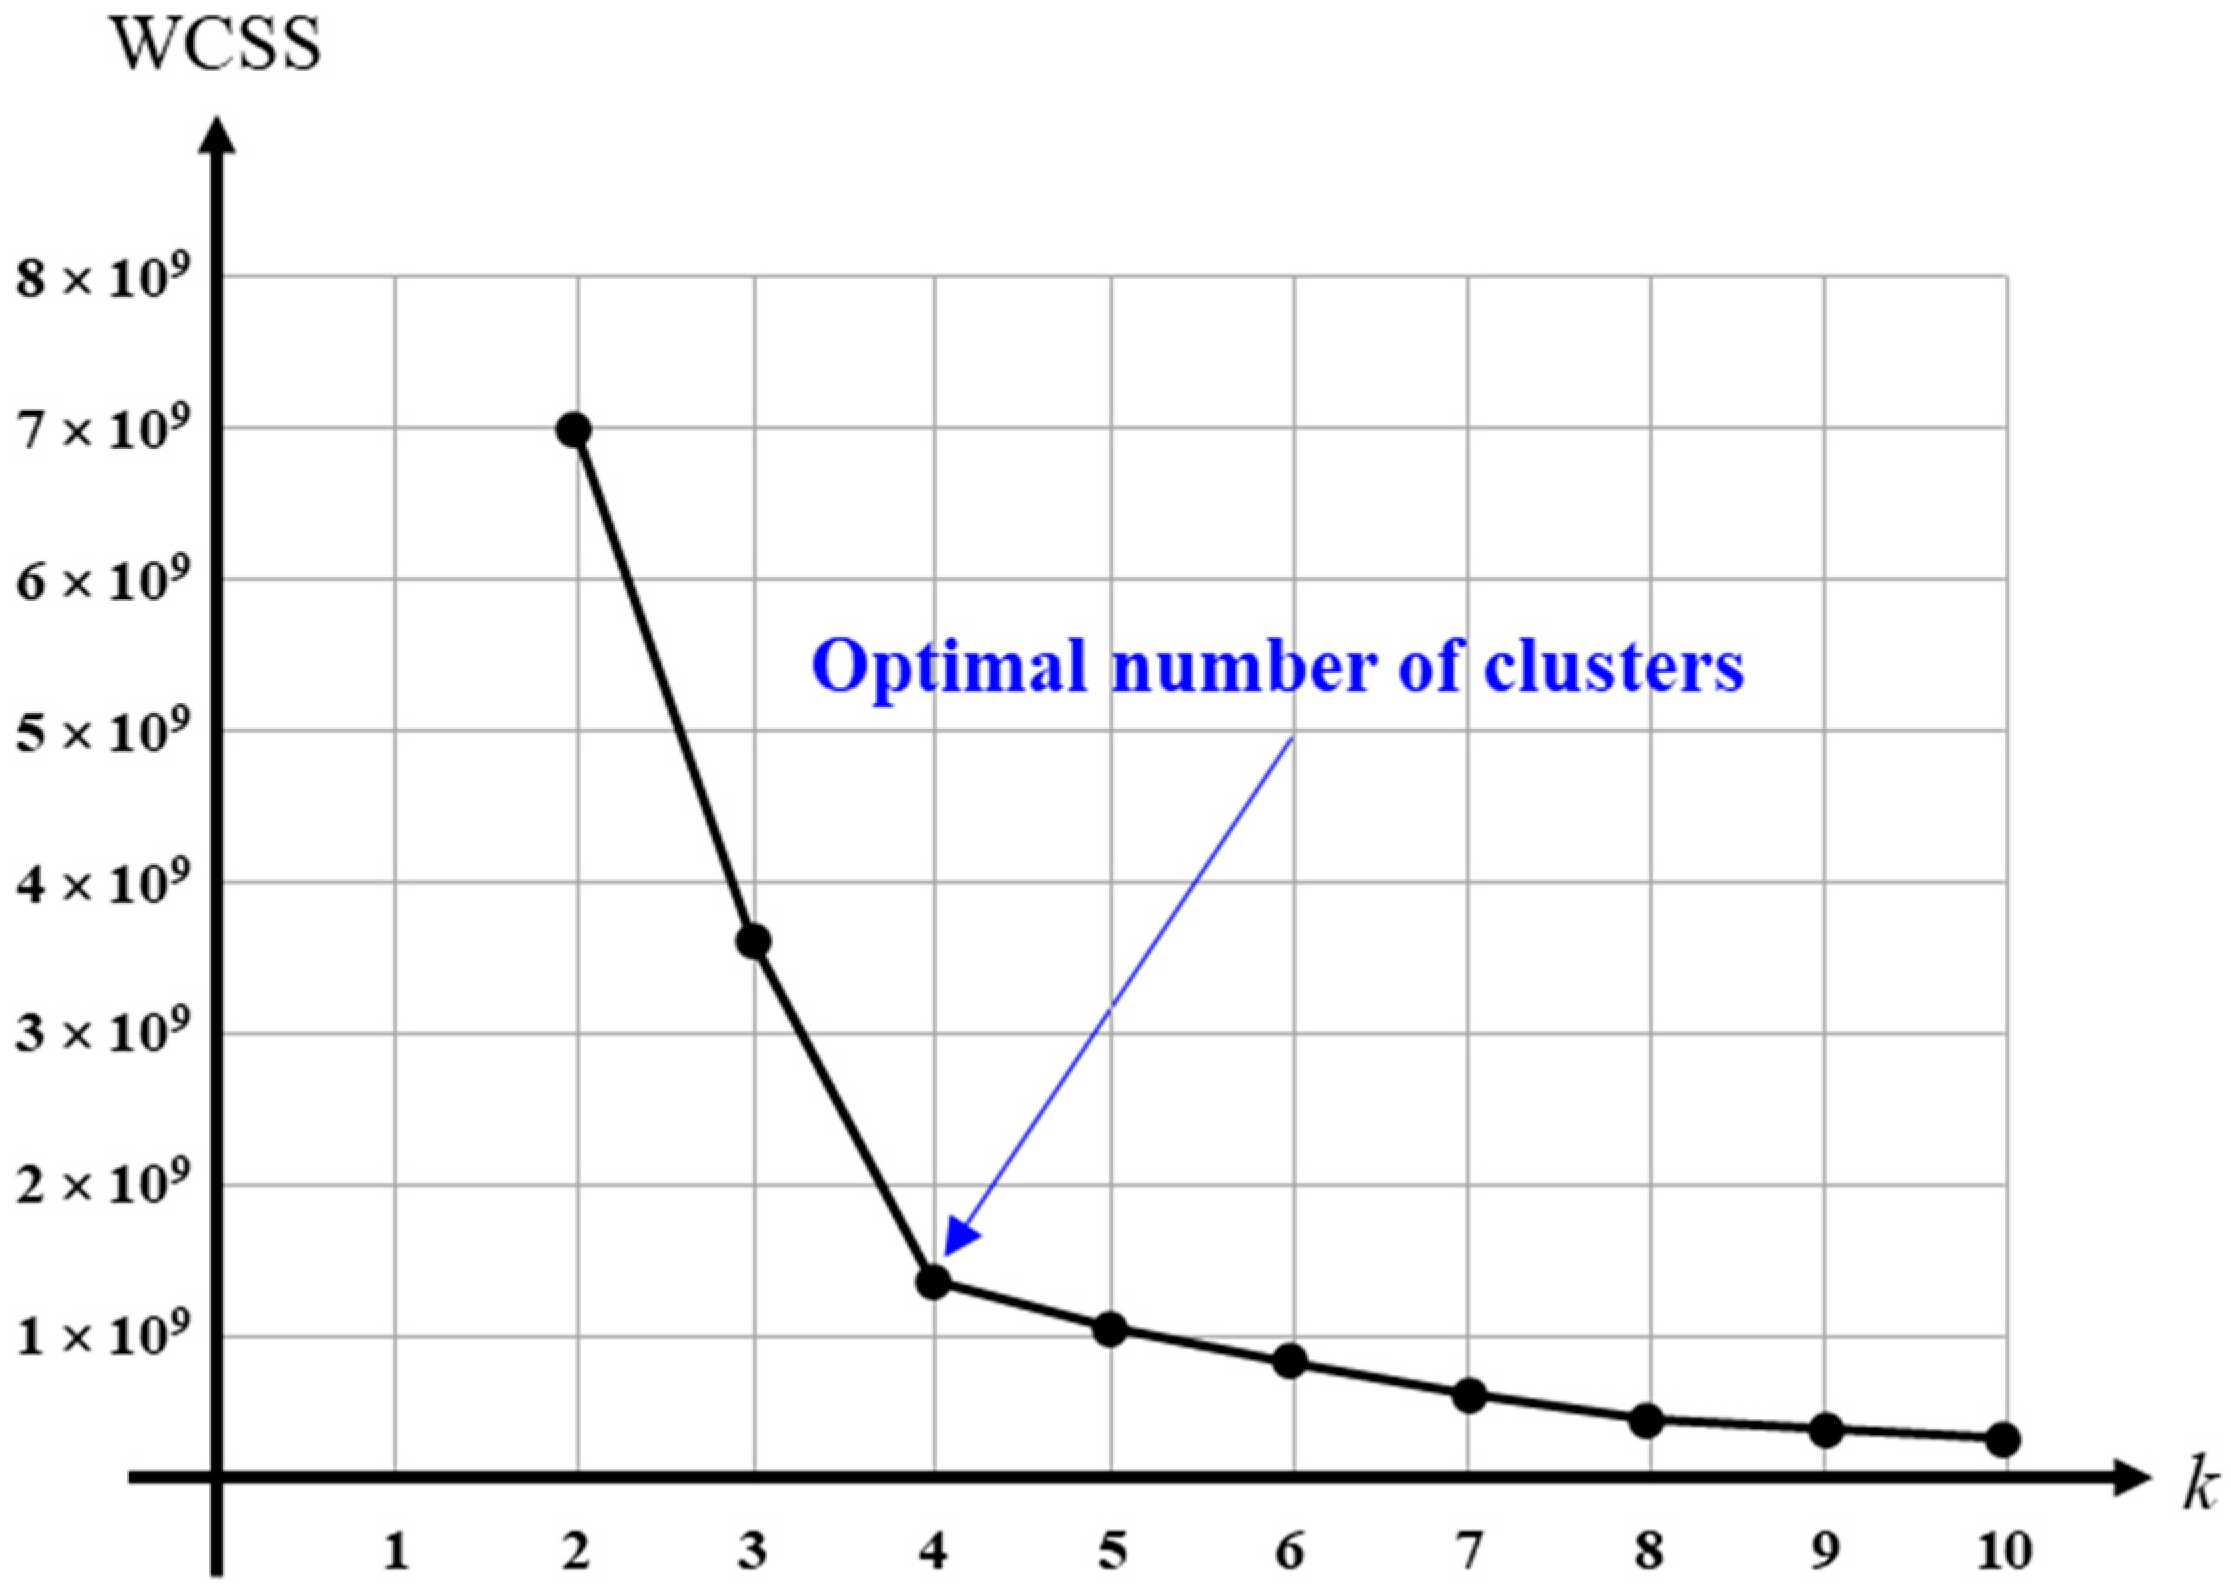
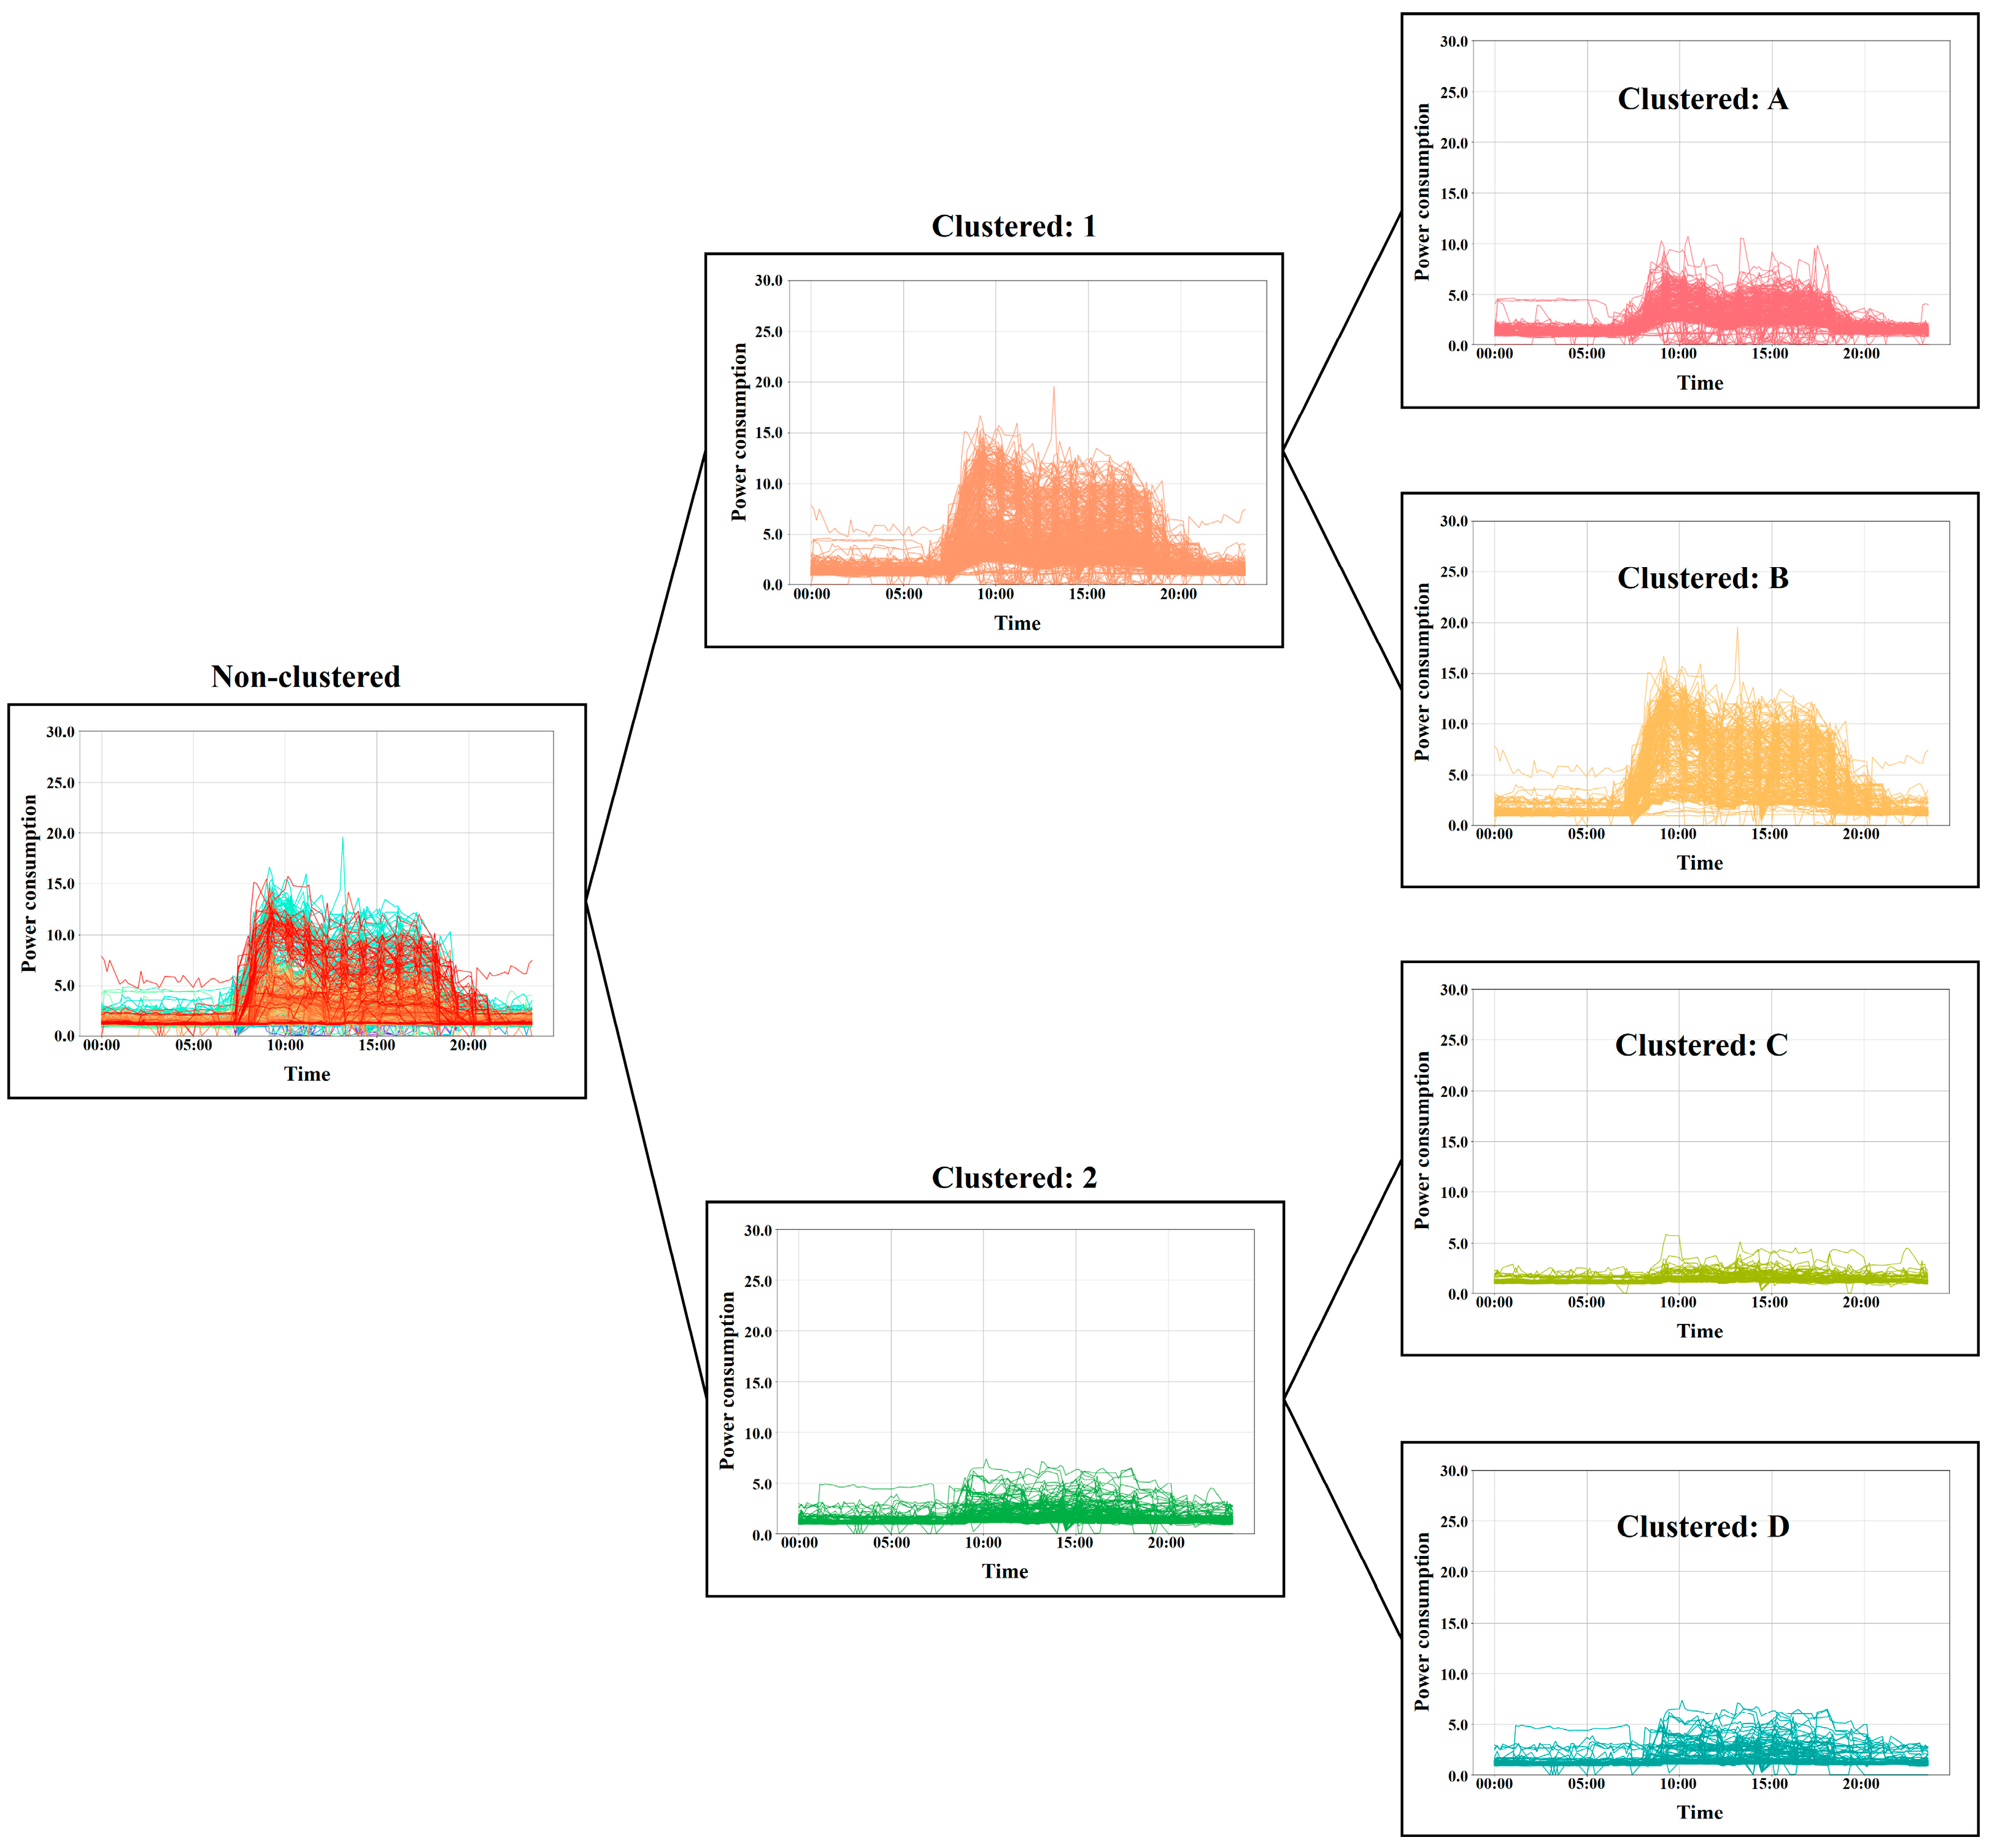
2.2. k-Means Clustering

k-means clustering is a widely used technique in data mining and statistics for partitioning datasets into k clusters based on feature similarities [23,24,25]. Although there are various clustering techniques available—such as hierarchical clustering [26], DBSCAN [27], and Gaussian Mixture Models (GMMs) [28]—we focused on computational complexity and, therefore, selected k-means clustering to efficiently cluster large-scale daily power consumption data. k-means clustering has a relatively low computational complexity and employs a simple process of iterative mean calculation and assignment, resulting in fast computation.
In this study, k was treated as a variable to allow optimization based on the building’s operational characteristics (e.g., residential, commercial, or industrial). The optimal k value was determined using the elbow method, which evaluates the within-cluster sum of squares (WCSS) to identify the point at which additional clusters provide diminishing improvements in clustering performance [29,30,31]. WCSS is computed as follows:
W C S S = i = 1 k x C i x μ i 2 ,
where C i represents the set of data points in the i th cluster, μ i is the centroid of cluster C i , and x μ i 2 denotes the squared Euclidean distance between a data point x and the cluster centroid. The optimal number of clusters was determined by identifying the elbow point in the WCSS curve.
The clustering process began by randomly selecting k initial centroids. Each data point was then assigned to the nearest centroid based on the Euclidean distance. The centroids were iteratively updated by computing the mean of all data points within each cluster until convergence was achieved.
By optimizing the number of clusters using the elbow method, the dataset effectively captured seasonal variations and operational conditions specific to different building types. This adaptive clustering approach ensured that each model was trained on data with similar underlying consumption patterns, significantly improving forecasting accuracy.

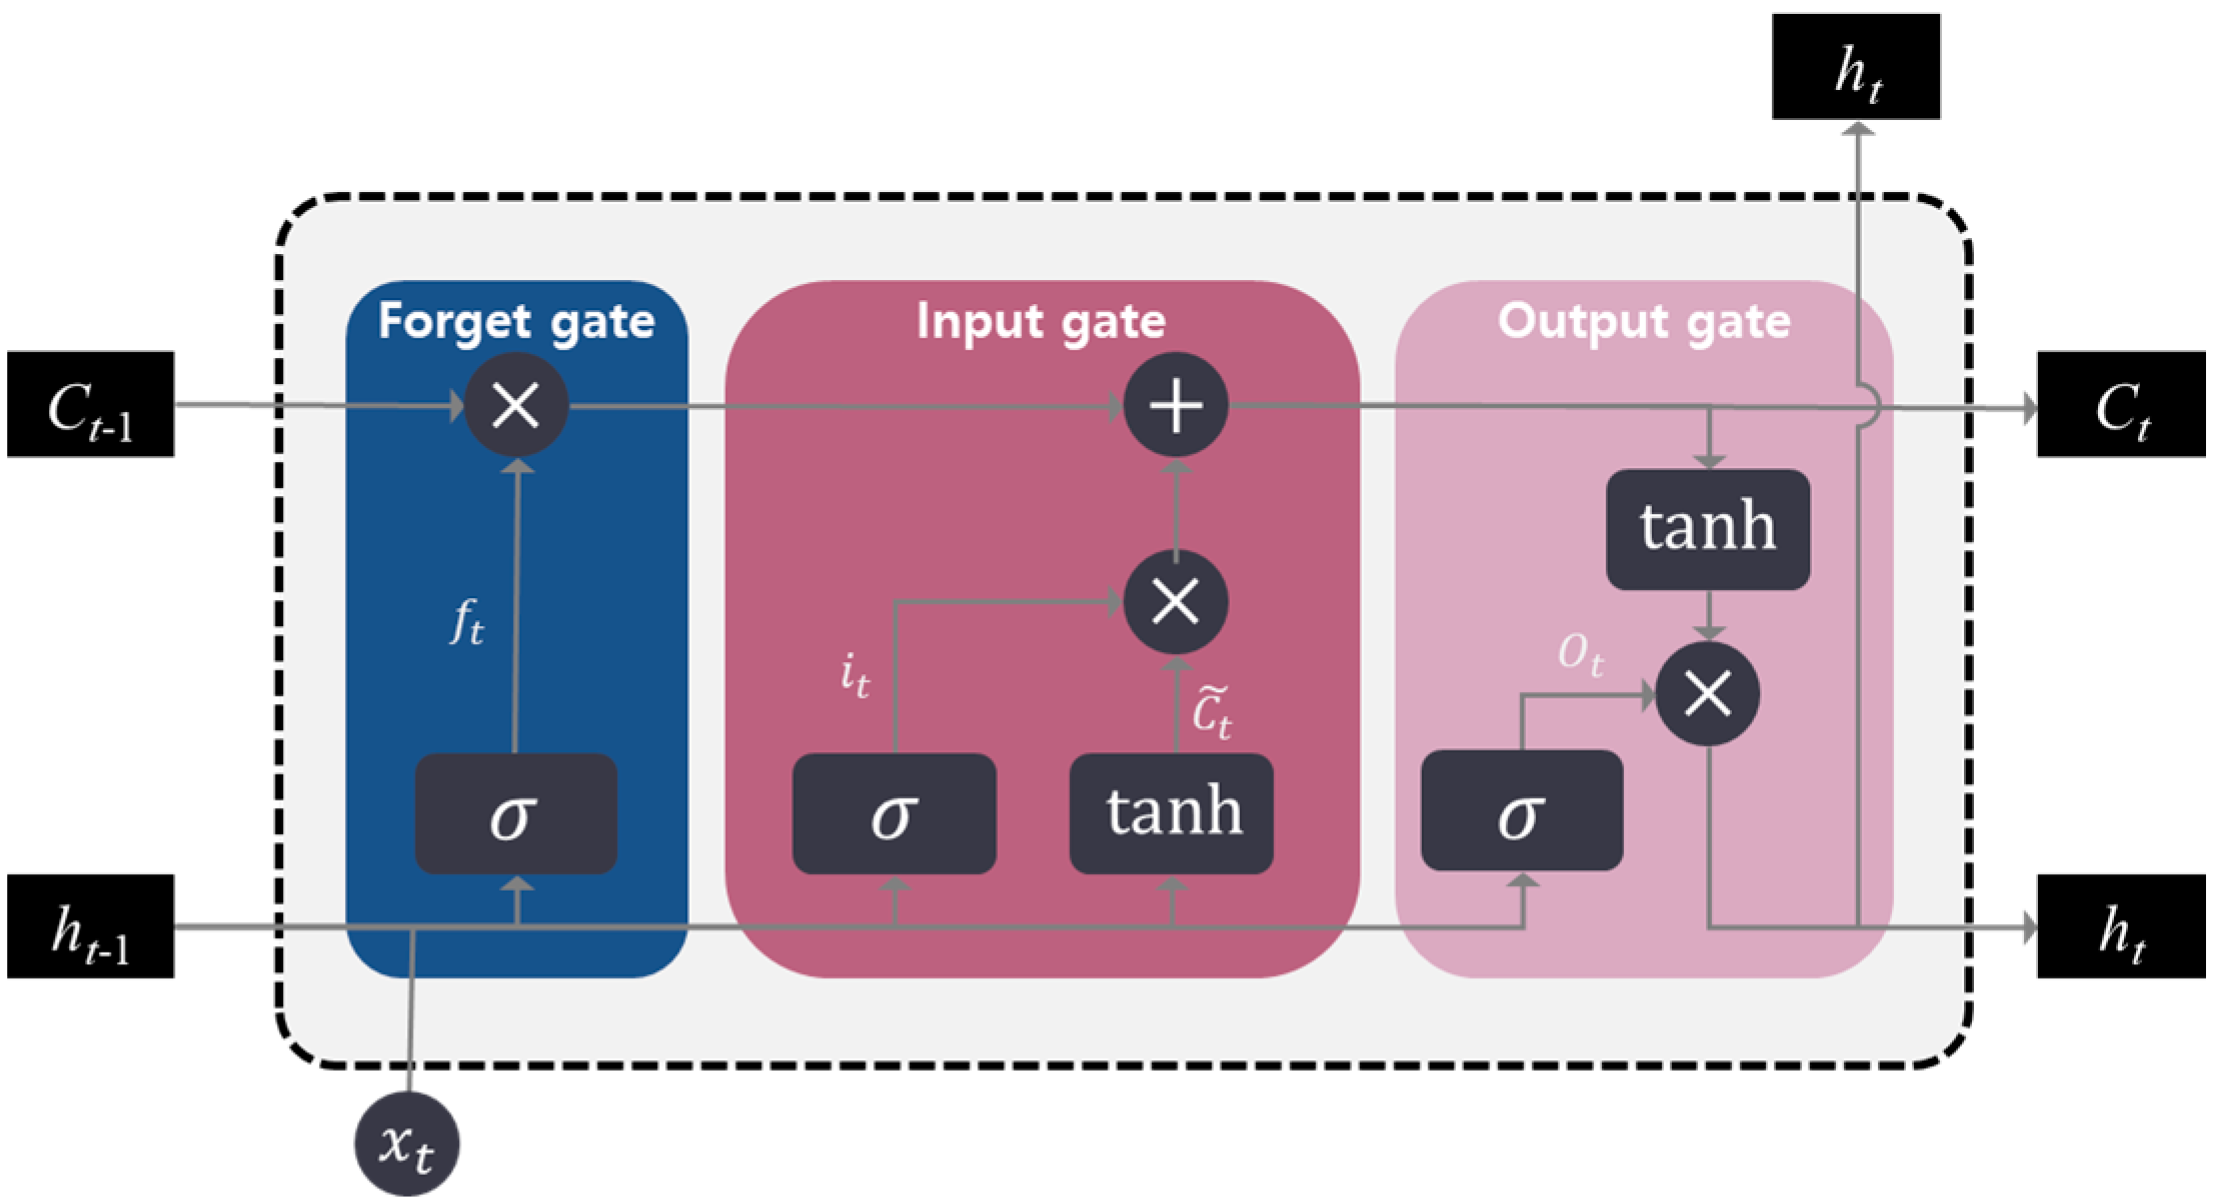
2.3. Long Short-Term Memory (LSTM)

The LSTM model is an advanced variant of recurrent neural networks (RNNs) designed for processing sequential data, such as time-series datasets [32,33,34]. While traditional RNNs rely on past information to predict future values, they suffer from the vanishing gradient problem, which limits their ability to capture long-term dependencies effectively [35,36,37]. LSTM overcomes this limitation by incorporating memory cells that selectively retain or discard information over time, enabling the model to learn long-range dependencies more efficiently than conventional RNNs.
LSTM networks utilize three primary gates—the input gate, forget gate, and output gate—to regulate the flow of information, as shown in Figure 1. The input gate controls how much new information is added to the memory cell, while the forget gate determines which information from the previous cell state should be discarded. The output gate generates the final hidden state based on the current cell state. These gates employ sigmoid activation functions ( σ ) to produce values between 0 and 1, thereby controlling the extent to which information is retained or forgotten. Additionally, the hyperbolic tangent function (tanh) is used to generate candidate values for updating the memory cell.
The LSTM operates as follows:
  • Forget gate: determines how much information from the previous cell state C t 1 should be retained, using the previous hidden state h t 1 and the current input x t :
    f t = σ W f h t 1 ,   x t + b f .
  • Input gate: decides how much new information should be added to the memory cell:
    i t = σ W i h t 1 ,   x t + b i .
  • Candidate cell state: computes a potential new memory cell value using the hyperbolic tangent function:
    C t ~ = tanh W C h t 1 ,   x t + b C .
  • Memory cell update: updates the memory cell state by combining the forget gate’s output with the new candidate value:
    C t = f t C t 1 + i t C t ~ .
  • Output gate: determines the final hidden state h t based on the updated memory cell state:
    o t = σ W o h t 1 ,   x t + b o ,
    h t = o t tanh C t .
In the above equations, each b represents the bias term for the corresponding gate or cell state (e.g., b f for the forget gate, b i for the input gate, b C for the candidate cell state, and b o for the output gate). This process is repeated at each time step, allowing the LSTM to effectively capture long-term dependencies in sequential data.
To address the challenges of power consumption prediction in time-series data, a customized LSTM model was designed and implemented. This model was tailored to process multi-dimensional input features and generate accurate predictions by learning both short-term and long-term dependencies.
Each input sequence comprised 10 consecutive time steps, with 14 features per time step, including:
  • Temporal attributes (year, month, day, hour, and minute);
  • Environmental factors (temperature, humidity, wind speed, precipitation, and solar radiation);
  • Operational indicators (working day/non-working day indicator, COVID-19 social distancing index, and number of employees present);
  • Power consumption data.
These features were selected to capture environmental and operational factors affecting energy usage.
The LSTM architecture consisted of a single LSTM layer with six hidden units. During the forward pass, the LSTM processed the input sequence, generating a hidden state for each time step along with a final cell state. The final hidden state was then passed to a fully connected layer, which mapped it to a single scalar output representing the predicted power consumption. This fully connected layer served as the final stage of the model, ensuring that the sequential information learned by the LSTM was translated into actionable predictions.
To ensure effective learning, the hidden and cell states were initialized to zero at the start of each sequence. These states, with dimensions corresponding to the number of layers, batch size, and hidden units, were dynamically updated as the LSTM processed each time step. The model was trained using the mean squared error (MSE) loss function to minimize the difference between predicted and actual power consumption values. Additionally, the Adam optimizer was employed to enhance the learning efficiency by leveraging adaptive learning rates to improve convergence.

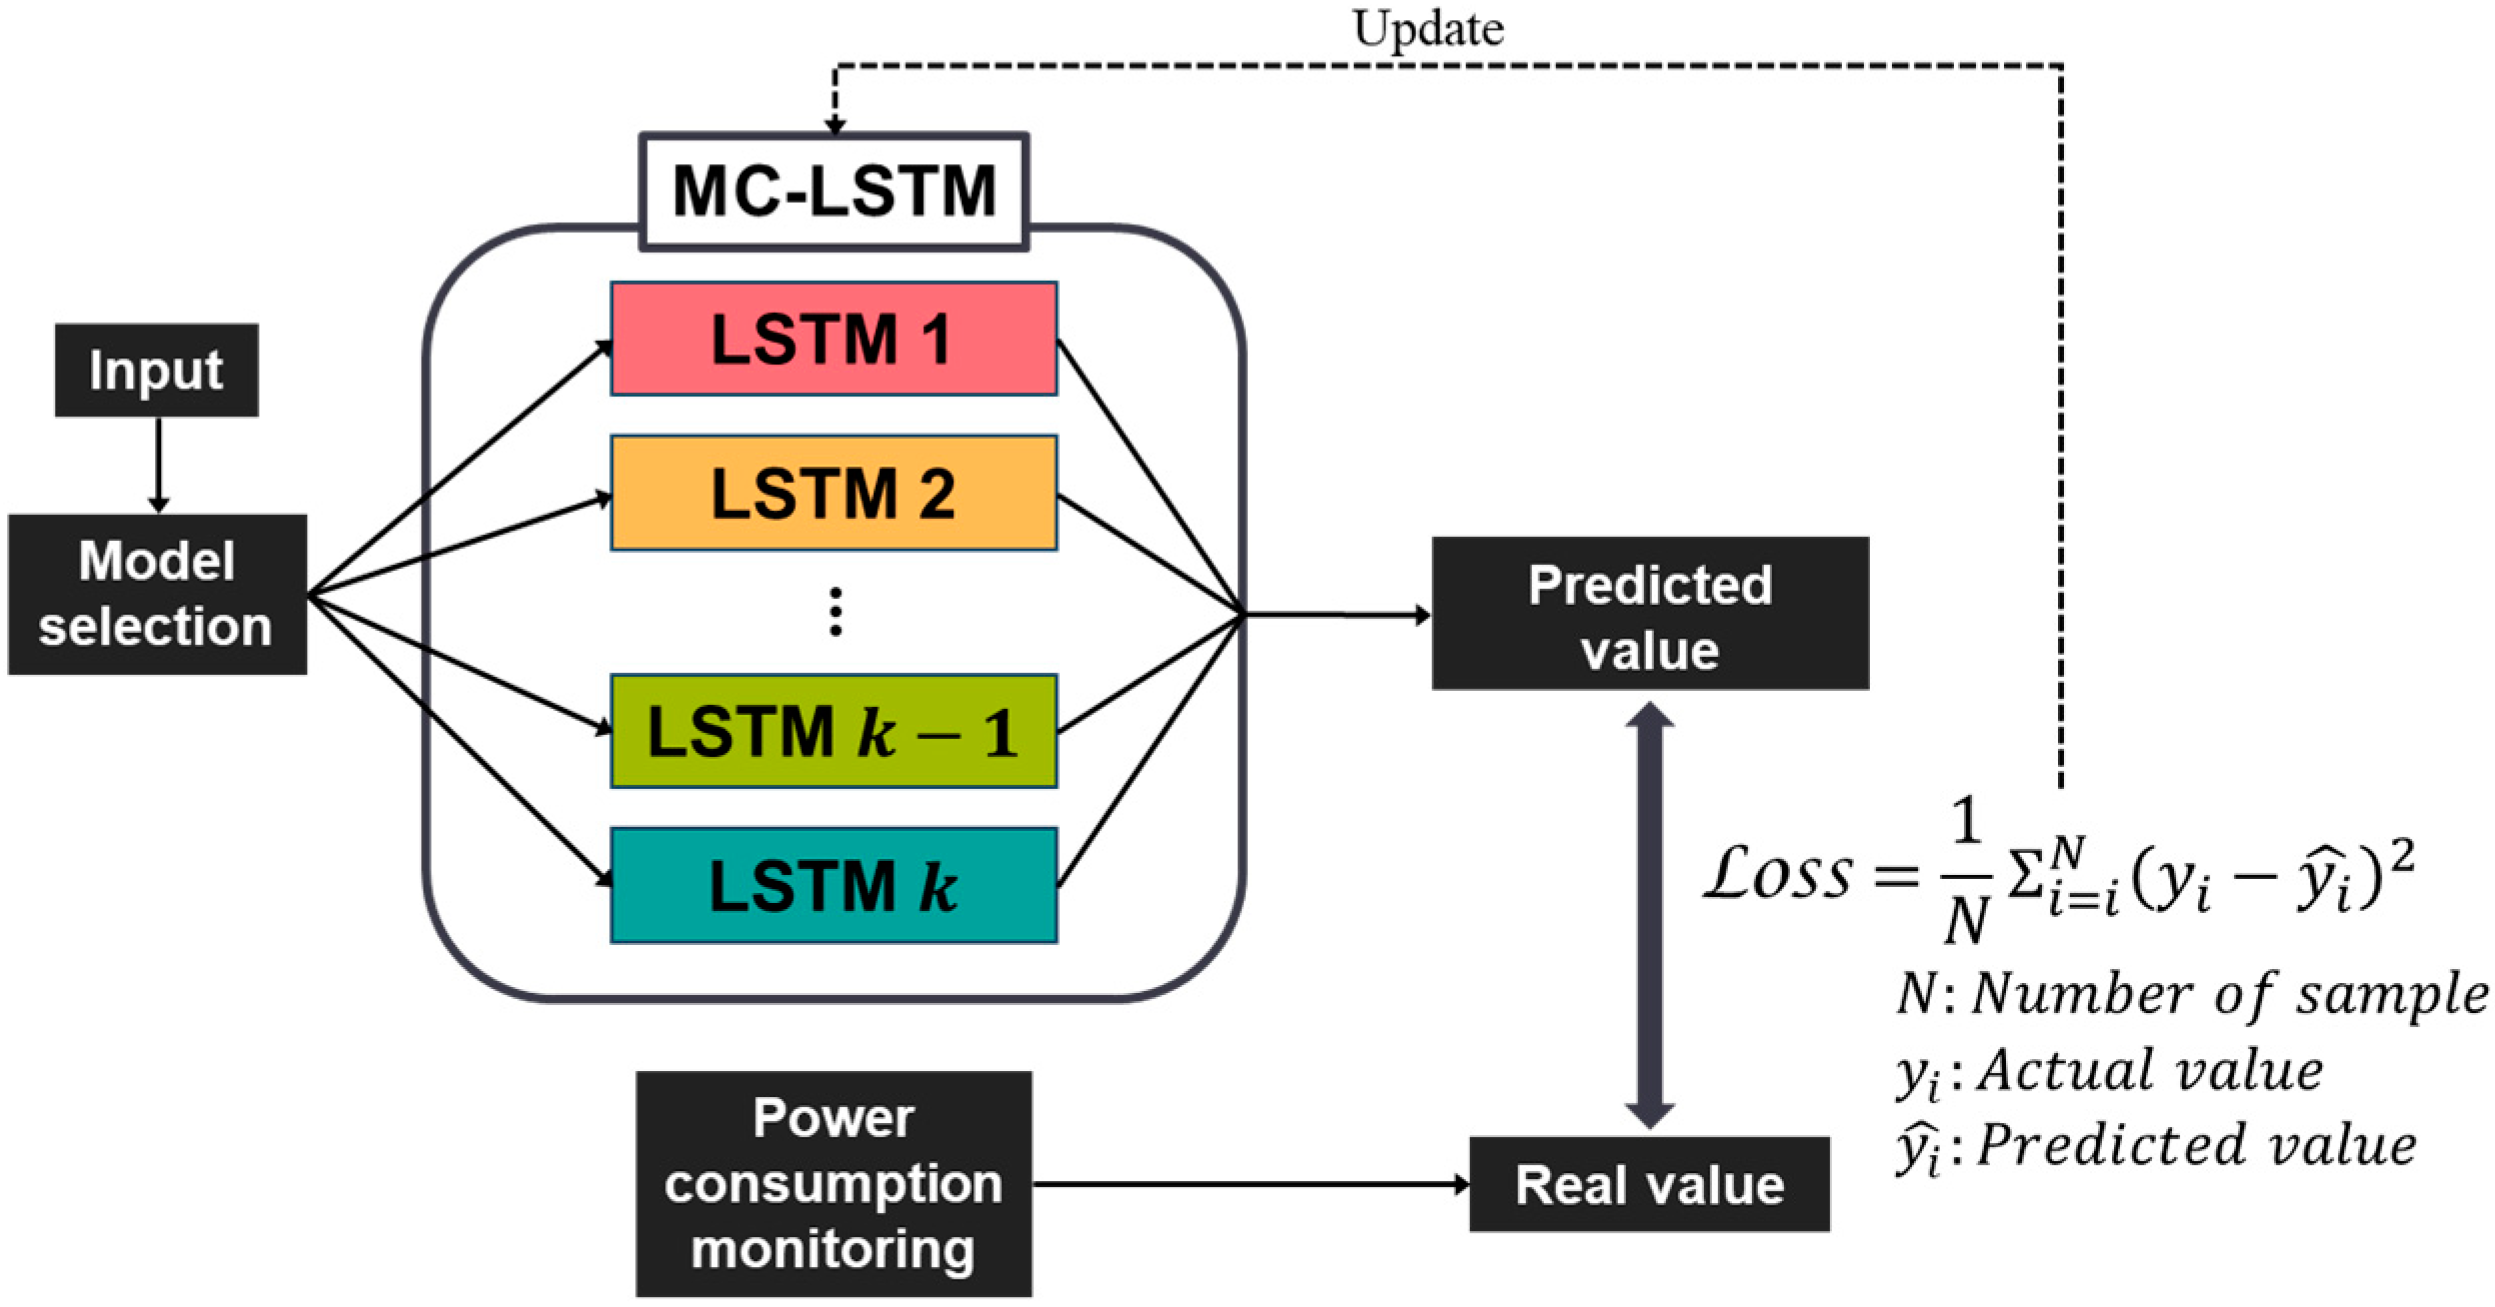
2.4. Multi-Cluster Long Short-Term Memory (MC-LSTM)

The architecture of the proposed MC-LSTM model is depicted in Figure 2. Unlike a standard LSTM, MC-LSTM incorporates a clustering mechanism to enhance predictive accuracy. Each LSTM model is independently trained on data categorized using k-means clustering, where the optimal number of clusters k is determined using the elbow method based on WCSS. This adaptive clustering approach ensures the optimal segmentation of power consumption data for different building types, such as residential homes, business offices, and industrial facilities, rather than relying on a predefined k value.
By segmenting the dataset based on seasonal and operational conditions, the clustering-based approach allows each LSTM model to specialize in learning the unique temporal and seasonal characteristics of its assigned cluster. This method significantly improves prediction accuracy and reliability, as each model is trained on data with similar underlying consumption patterns. The integration of optimized clustering with deep learning enables MC-LSTM to capture both short-term fluctuations and long-term dependencies in energy consumption effectively. Several key hyperparameters that influence the model’s performance are as follows:
  • Input Features: The model processes 14 input features at each time step, capturing various aspects of power consumption.
  • Number of Layers: The network is composed of 3 stacked LSTM layers, allowing it to model complex temporal dependencies.
  • Hidden State Dimension: Each LSTM cell has a hidden state dimension of 6, balancing the model’s capacity and computational complexity.
  • Sequence Length: The model considers 10 time steps for each prediction, providing sufficient context while maintaining efficiency.
  • Output Features: The model is designed to predict a single value per time step.
Furthermore, the system incorporates a real-time feedback loop that continuously refines the MC-LSTM model. The loss, computed as the mean squared error between the actual power consumption values and the model’s predictions, is used to adjust the model parameters dynamically. This ongoing calibration ensures that the model remains robust and accurate under varying operational conditions.
This high level of predictive accuracy is particularly valuable for downstream energy management applications, including peak shaving and demand response. Precise power forecasting enables the real-time optimization of distributed energy resources, allowing for more efficient and adaptive energy usage across diverse operational environments. By leveraging multiple LSTM models tailored to distinct clusters, MC-LSTM offers a scalable, data-driven solution for intelligent energy management.

3. Experimental Setup

3.1. Hardware Implementation

The experimental setup incorporates several hardware components designed to efficiently manage and optimize power consumption in the target building, as shown in Figure 3. These components include the R-ESS, photovoltaic (PV) panels, V2G bidirectional chargers, and advanced metering infrastructure (AMI) monitoring devices for real-time power monitoring. They communicate using different protocols and are connected to a gateway that performs data conversion, integration, and mapping, transmitting the data in a unified format over the internal LAN. The database server collects, stores, and analyzes these data, which are then forwarded to the integrated control center for real-time monitoring and control by the operator. The building is connected to the main power line supplied by KEPCO, while the interconnected devices are linked via dedicated power lines. When the building’s power consumption exceeds the predefined peak threshold, external energy sources discharge stored power to balance demand and supply, ensuring grid stability.

3.1.1. Reused Energy Storage System (R-ESS)

The R-ESS is an energy storage system built using repurposed second-life batteries from EVs [38,39,40], particularly electric buses that still retain usable capacity. Compared to traditional ESSs, R-ESSs improves resource efficiency and cost-effectiveness by utilizing EV batteries that would otherwise be discarded. This approach extends the life cycle of the batteries and reduces waste. The R-ESS stores excess energy generated by the PV panels and discharges power during peak demand periods to stabilize the grid. With a total storage capacity of 150 kW and a maximum output of 100 kW, the R-ESS is critical for peak shaving and demand response. By utilizing high-capacity batteries from electric buses, the R-ESS provides enhanced reliability and scalability for grid stabilization.

3.1.2. Photovoltaic (PV) Panels

The PV panels convert solar energy into electricity, which is used either within the building or supplied to the main power grid. Any surplus energy is stored in the R-ESS for later use during high-demand periods. The PV panels consist of monocrystalline silicon panels with a generation capacity of 24 kW, offering high efficiency and long-term durability.

3.1.3. Vehicle-to-Grid (V2G) Charger

The V2G charger utilizes EVs as mobile energy storage units, enabling bidirectional energy exchange between the vehicles and the building’s power system [41,42,43]. During peak demand periods, the EVs can discharge stored energy into the building, reducing reliance on grid electricity and enhancing flexibility in demand-side energy management. The charger features a specially designed charging and discharging unit, developed for demonstration purposes, to ensure optimal integration with the building’s power infrastructure. The vehicles used in this demonstration are commercially available EV models, adapted specifically for V2G functionality, allowing for controlled energy transfer and real-time performance evaluation. The V2G charger supports a maximum charging power of 50 kW per vehicle and a maximum discharging power of 7 kW per vehicle, making it a key component in stabilizing power demand fluctuations.

3.1.4. Advanced Metering Infrastructure (AMI) Monitoring Device

The AMI monitoring device enables the real-time monitoring of power consumption, serving as a critical tool for continuous optimization. It measures the building’s total power consumption and transmits these data to the AI-based prediction model, which uses the feedback to refine its forecasting accuracy through iterative learning. The AMI monitoring device also supports energy management decisions by providing precise consumption data, allowing comparisons between predicted and actual power usage. Smart meters within the AMI communicate via Ethernet, ensuring fast and reliable data transmission for real-time power monitoring and model enhancement.

3.2. Software Implementation

3.2.1. Data Input and Real-Time Acquisition

The input data consist of real-time timestamps and weather information, sourced via OpenAPI from the nearest meteorological station to the target building. This integration ensures that the data remain accurate and relevant, which is essential for generating reliable power consumption predictions. Key weather parameters—including temperature, humidity, wind speed, solar radiation, and precipitation—are incorporated as features to account for environmental influences on energy consumption patterns.

3.2.2. Classification and Prediction Process

The input data are classified into k clusters, where k is determined using the elbow method. Each incoming data point is assigned to the most relevant cluster based on feature similarity. Once categorized, the appropriate pre-trained LSTM model, optimized for each cluster, is used to predict power consumption.
The prediction interval is set to 15 min, consistent with the electricity billing cycle used by KEPCO. Predictions are made 5 min in advance to allow time for real-time energy management decisions. For instance, the model predicts power consumption for noon at 11:55, giving the system ample time to optimize energy allocation and implement any necessary demand-side management actions.

3.2.3. Peak Shaving Implementation

To reduce power consumption, the system relies on predicted values. Users can define peak shaving targets, which in this study are set at 2.5 kW for summer and 4.5 kW for winter. If predicted power consumption exceeds the set threshold, the system automatically discharges power from external distributed energy resources such as the R-ESS or V2G charger to reduce the peak load. This proactive approach ensures that the building’s power consumption stays within the specified limits, minimizing energy costs and improving grid stability.

3.2.4. Real-Time Validation and Feedback Loop

Predicted power consumption is continuously validated against actual consumption data recorded by the AMI monitoring devices installed in the building. At the prediction time, the discrepancy between predicted and actual consumption is analyzed, providing feedback for ongoing model calibration. This iterative process helps improve the accuracy and reliability of the MC-LSTM model by allowing it to adjust to real-time fluctuations in energy consumption, including unexpected changes due to weather conditions or operational shifts.

3.2.5. Integration of Prediction and Management

The software framework is fully integrated with the hardware components, enabling autonomous energy management. The MC-LSTM prediction model drives energy optimization decisions, triggering automated actions, such as discharging external energy sources when necessary. This seamless integration ensures that the system operates autonomously, maintaining optimal energy efficiency and grid stability without the need for constant manual intervention.

4. Results and Discussion

4.1. Clustering Results

To determine the optimal number of clusters k , the elbow method was applied by calculating the WCSS for k values ranging from two to ten, as shown in Figure 4. The WCSS curve exhibited a clear inflection point at k = 4, suggesting that four clusters offer the best balance between compactness and variance reduction. Based on this finding, k-means clustering was performed with k = 4, dividing the dataset into clusters that reflect seasonal variations and working conditions.
With k = 4, the clustering results, shown in Figure 5, reveal that power consumption patterns were effectively categorized based on seasonal factors and work schedules. Cluster A represents working days from April to September, Cluster B represents working days from October to March, Cluster C corresponds to non-working days from April to September, and Cluster D represents non-working days from October to March. These clusters were then paired with corresponding LSTM models, each optimized for its specific cluster.

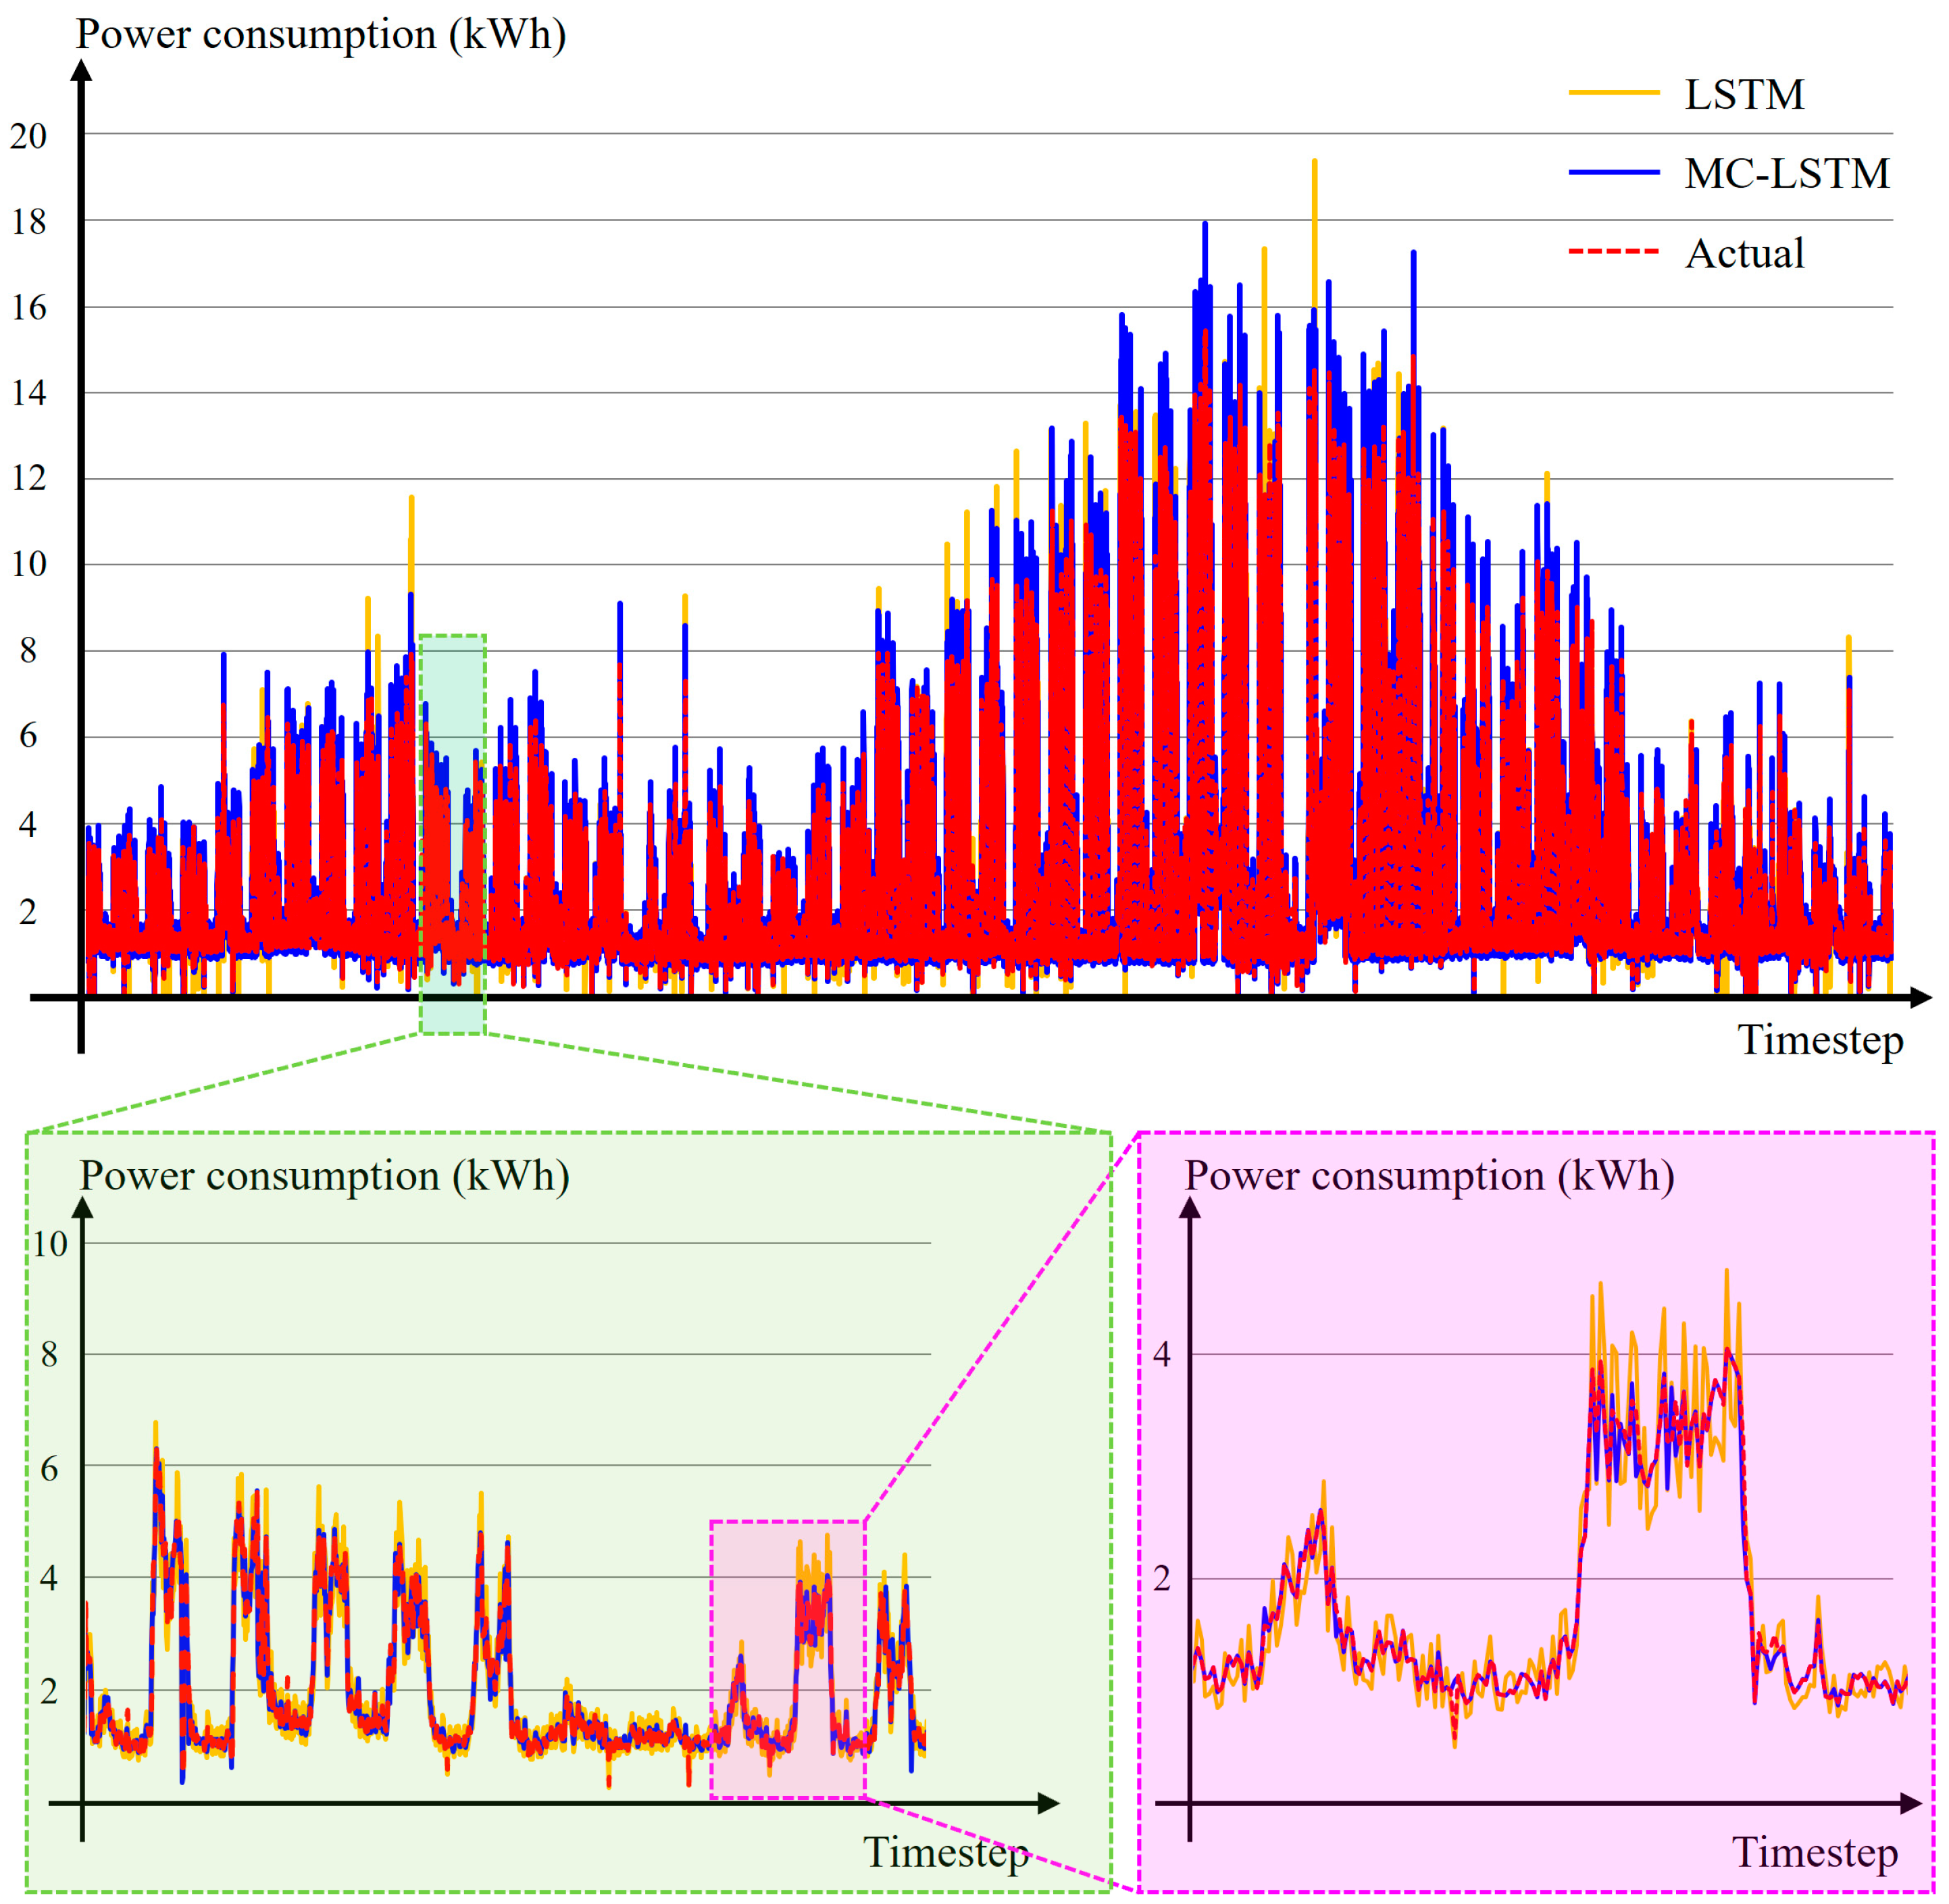
4.2. Accuracy of the MC-LSTM Model

To assess the performance of the proposed MC-LSTM model, an ablation study was conducted comparing the MC-LSTM with a single LSTM model using multiple evaluation metrics. The test set consisted of power consumption data from 1 June 2023 to 31 May 2024—data that were not included in the training set. Figure 6 compares the predicted power consumptions of LSTM and MC-LSTM (yellow and blue solid lines, respectively) with the actual consumption (red dashed line).
The prediction accuracy was evaluated using the mean arctangent absolute percentage error (MAAPE), calculated as follows [44,45]:
MAAPE = 1 n i = 1 n arctan y i y i ^ y i .
To interpret the MAAPE values, the metric was converted into a percentage and then subtracted from 100% to intuitively represent prediction accuracy. The accuracy for the MC-LSTM models in each cluster was 98.21%, 97.51%, 97.73%, and 98.27%, with an overall average accuracy of 97.93%. In contrast, the single LSTM model achieved an average accuracy of 91.20%. In addition to the average accuracy, the maximum and minimum accuracies achieved across the clusters were compared between the two models. For the MC-LSTM model, the maximum accuracy was 99.24% and the minimum accuracy was 84.51%. The corresponding values for the single LSTM model were 92.42% and 82.03%, respectively.
The total computational complexity of both models was evaluated in terms of floating-point operations per second (FLOPs), providing a precise measurement of the computational workload [46,47]. In LSTM cells, the primary computational burden arises from the matrix multiplication operations performed at each time step in each gate. Since each LSTM cell comprises four gates, the FLOPs per time step for a single LSTM layer l can be expressed as
FLOPs LSTM l = T × 4 × I l × h l + h l 2
where
  • T represents the sequence length (i.e., the number of time steps);
  • I l denotes the input dimension for the l -th LSTM layer (with I 1 equal to the number of input features for the first layer and I l = h l 1 for subsequent layers);
  • h l is the hidden state dimension of the l -th layer.
Summing the overall layers, the total computational complexity for an LSTM model is given by
Total   FLOPs = l = 1 L FLOPs LSTM l
where L is the total number of LSTM layers. In our experiments, with T = 10 , the input feature size I 1 = 14 , the hidden state dimension h = 6 , and three layers, both models required 10.56 kFLOPs. Although the MC-LSTM model incorporates identical LSTM models for each cluster—resulting in a total model size that is four times larger—only one model is selected for execution during prediction, ensuring that the computational complexity remains equivalent to that of the single LSTM. This observation reinforces the robustness of the MC-LSTM approach for real-time energy management. For an intuitive comparison of performance metrics, these results are tabulated in Table 1.
The relatively stable and predictable energy consumption patterns at the company headquarters contributed to minimal deviations between predicted and actual values, with no significant anomalies observed.

4.3. Power Consumption and Peak Reduction

The MC-LSTM model was integrated into the real-time monitoring system at Daekyung Engineering Headquarters to evaluate its effectiveness in reducing reliance on centralized power supplies and mitigating peak loads. The system was actively tested from 1 June 2024 to 30 September 2024, with real-time validation of its performance.
The peak shaving strategy was designed with a user-defined threshold of 2.5 kWh. If the predicted power consumption exceeded this threshold for the upcoming 15 min interval, the external energy sources, such as R-ESSs and V2G, were automatically discharged to reduce peak demand.
To evaluate its performance, validation focused on five consecutive working days, from 8 July to 12 July 2024, during which an external verification agency (Korea Institute of Green Climate Technology) supervised the process. The results, presented in Figure 7, show the actual and optimized power consumption during this period. The red dashed line represents the peak demand threshold, the yellow solid line shows the total power consumption before peak shaving, and the blue solid line illustrates the optimized power consumption after peak shaving. The green-shaded area indicates the power discharged from the external energy sources to reduce peak loads. A total of 246 kW was reduced from an initial 1155 kW, resulting in an energy saving of approximately 21.3%.
The impact of the MC-LSTM-based peak shaving system on electricity cost reduction was also assessed by comparing monthly electricity costs before and after its implementation. The results showed that the system effectively reduced electricity costs, achieving an 11% reduction in June, 17% in July, 19% in August, and 8% in September 2024. These reductions demonstrate the effectiveness of the proposed system in enhancing energy efficiency and lowering operational costs by mitigating peak demand.
Overall, the experimental results demonstrate that the MC-LSTM-based power consumption prediction system successfully identified real-time consumption patterns and effectively integrated external energy sources such as the R-ESS and V2G charger. The system achieved significant reductions in peak consumption and total power usage, highlighting its capability to maintain a reliable power supply while enhancing grid stability.

5. Conclusions

This study developed and validated an AI-driven energy management system designed for power consumption forecasting and peak reduction in commercial buildings. The proposed MC-LSTM model, which integrates k-means clustering with LSTM networks, effectively classified power consumption data based on seasonal variations and work schedules. This clustering-based approach enabled tailored predictions for each group, significantly improving forecasting accuracy. The model achieved an average MAAPE-based accuracy of 97.93%, with individual cluster accuracies reaching up to 98.27%, particularly in structured environments such as commercial buildings where consumption patterns are stable and repeatable. These results underscore the effectiveness of our clustering-based approach in enabling robust AI-driven predictive modeling. Moreover, the ablation study confirmed that integrating multi-cluster techniques significantly enhances forecasting performance compared to the single neural network, demonstrating that our approach is versatile and adaptable to other neural network architectures beyond LSTM.
The proposed model was applied in a real-world case study at a commercial building on Jeju Island. The system’s real-time peak shaving strategy utilized a user-defined threshold. When predicted power consumption exceeded this threshold, the system autonomously discharged energy from externally distributed resources, including the R-ESS and V2G charger, to alleviate peak loads. During the validation period, the system consistently reduced peak power consumption and reliance on a centralized power supply. In a five-day supervised verification period (8–12 July 2024), the system reduced centralized power demand by 246 kW, achieving a 21.3% reduction in total energy usage. Additionally, the system incorporated a real-time feedback loop, continuously refining the MC-LSTM model by adjusting for discrepancies between predicted and actual consumption. This dynamic calibration process ensured high prediction accuracy and system reliability, even under fluctuating operational conditions. The model’s ability to adapt to variations in power consumption ensures its robustness over time, making it suitable for deployment in energy management applications requiring scalability and resilience. Through this case study, the system’s practical effectiveness in enhancing grid stability and reducing operational costs was demonstrated, confirming its applicability in real-world energy management scenarios.
While our forecasting model demonstrates excellent performance, it is important to note that the energy management system implemented in this study is relatively simple. In our case study, the energy management system served primarily as a tool to validate the forecasting model’s performance in a real-world environment rather than as a fully integrated energy scheduling or management system. Its control strategy relies solely on a user-defined peak threshold to trigger charging or discharging actions, without incorporating complex scheduling algorithms. We recognize that integrating more sophisticated energy management system techniques could further enhance system performance and robustness, particularly from a commercialization or business deployment perspective. Consequently, future research will focus on transitioning from fixed, rules-based thresholds to AI-driven adaptive strategies and incorporating weather prediction models along with renewable energy forecasting algorithms. This approach aims to develop more flexible, scalable, and autonomous energy management solutions that dynamically respond to fluctuations in supply and demand. In this way, beyond commercial buildings, the system will possess even greater potential in island regions and off-grid areas where distributed energy resources, such as photovoltaics and wind turbines, are essential for achieving energy self-sufficiency.
In conclusion, this study successfully demonstrated the effectiveness of an AI-powered energy management system for real-time power consumption forecasting and demand-side optimization. The system’s real-world implementation and validation at a company’s headquarters proved its practical feasibility in managing energy consumption and integrating external energy sources.
We believe these research findings will be actively leveraged in the development of corporate business models and will significantly support the planning of public funding and research projects at the national policy level. Furthermore, in order to secure the training data—one of the most critical elements in AI research—it is desirable that the data collected from government-supported public projects be provided as open data, enabling various research institutions and universities to use them for research purposes.
In addition, this study evaluated the performance of the power consumption forecasting algorithm using an energy management system implemented in an actual building. In this process, EV batteries were used as external energy sources via V2G bidirectional chargers. Although electric vehicles equipped with V2G functionality have already been commercialized overseas, in Korea they remain in the pre-commercialization stage. Consequently, only vehicles approved for demonstration are used, and the relevant regulations are still under discussion, meaning that such demonstrations can only proceed after obtaining special exemption approval from the appropriate government department. While these factors currently impose limitations on research and development, we anticipate that these research findings will pave the way for more positive advancements in energy policy as well as in the research, development, and application within the EV and ESS industries.

Author Contributions

Conceptualization, K.K.; Data Curation, K.K., D.K., J.J. and J.-O.R.; Formal Analysis, K.K.; Funding Acquisition, Y.-J.K. and K.-J.H.; Investigation, K.K., D.K., J.J. and J.-O.R.; Methodology, K.K.; Project Administration, Y.-J.K. and K.-J.H.; Resources, Y.-J.K. and K.-J.H.; Software, K.K.; Supervision, Y.-J.K. and K.-J.H.; Validation, K.K., D.K., J.J. and J.-O.R.; Visualization, K.K. and D.K.; Writing—Original Draft Preparation, K.K.; Writing—Review and Editing, K.K. and Y.-J.K. All authors have read and agreed to the published version of the manuscript.

Funding

Ministry of SMEs and Startups (S3269786).

Institutional Review Board Statement

Not applicable.

Informed Consent Statement

Not applicable.

Data Availability Statement

Dataset available on request from the authors.

Acknowledgments

This research was financially supported by the Ministry of Small and Medium-sized Enterprises (SMEs) and Startups (MSS), Korea, under the “Regional Specialized Industry Development Plus Program (R&D, NTIS 1425166569)” supervised by the Korea Technology and Information Promotion Agency for SMEs (TIPA).

Conflicts of Interest

Authors Jeng-Ok Ryu and Kyung-Ja Hur were employed by the company Daekyung Engineering Co., Ltd. The remaining authors declare that the research was conducted in the absence of any commercial or financial relationships that could be construed as a potential conflict of interest.

References

  1. Yang, Y.; Yang, S.; Moon, H.; Woo, J. Analyzing heterogeneous electric vehicle charging preferences for strategic time-of-use tariff design and infrastructure development: A latent class approach. Appl. Energy 2024, 374, 124074. [Google Scholar] [CrossRef]
  2. Park, E.; Kim, K.J.; Kwon, S.J.; Han, T.; Na, W.S.; Del Pobil, A.P. Economic Feasibility of Renewable Electricity Generation Systems for Local Government Office: Evaluation of the Jeju Special Self-Governing Province in South Korea. Sustainability 2017, 9, 82. [Google Scholar] [CrossRef]
  3. Son, H.; Jang, G. The operation strategy of the MIDC systems for optimizing renewable energy integration of Jeju power system. Energies 2023, 16, 5699. [Google Scholar] [CrossRef]
  4. Javaid, S.; Kurose, Y.; Kato, T.; Matsuyama, T. Cooperative distributed control implementation of the power flow coloring over a Nano-grid with fluctuating power loads. IEEE Trans. Smart Grid 2016, 8, 342–352. [Google Scholar] [CrossRef]
  5. Javaid, S.; Kaneko, M.; Tan, Y. Energy Balancing of Power System Considering Periodic Behavioral Pattern of Renewable Energy Sources and Demands. IEEE Access 2024, 12, 70245–70262. [Google Scholar] [CrossRef]
  6. Kakkar, R.; Agrawal, S.; Tanwar, S. A systematic survey on demand response management schemes for electric vehicles. Renew. Sustain. Energy Rev. 2024, 203, 114748. [Google Scholar] [CrossRef]
  7. Cortez, V.; Rabelo, R.; Carvalho, A.; Floris, A.; Pilloni, V. On the Impact of Flexibility on Demand-Side Management: Understanding the Need for Consumer-Oriented Demand Response Programs. Int. J. Energy Res. 2024, 2024, 8831617. [Google Scholar] [CrossRef]
  8. Rashid, S.M. Employing advanced control, energy storage, and renewable technologies to enhance power system stability. Energy Rep. 2024, 11, 3202–3223. [Google Scholar] [CrossRef]
  9. Huang, A.; Mao, Y.; Chen, X.; Xu, Y.; Wu, S. A multi-timescale energy scheduling model for microgrid embedded with differentiated electric vehicle charging management strategies. Sustain. Cities Soc. 2024, 101, 105123. [Google Scholar] [CrossRef]
  10. Ayub, M.A.; Hussan, U.; Rasheed, H.; Liu, Y.; Peng, J. Optimal energy management of MG for cost-effective operations and battery scheduling using BWO. Energy Rep. 2024, 12, 294–304. [Google Scholar] [CrossRef]
  11. Rubino, L.; Rubino, G.; Esempio, R. Linear Programming-Based Power Management for a Multi-Feeder Ultra-Fast DC Charging Station. Energies 2023, 16, 1213. [Google Scholar] [CrossRef]
  12. Alvarado-Barrios, L.; del Nozal, Á.R.; Valerino, J.B.; Vera, I.G.; Martínez-Ramos, J.L. Stochastic unit commitment in microgrids: Influence of the load forecasting error and the availability of energy storage. Renew. Energy 2020, 146, 2060–2069. [Google Scholar] [CrossRef]
  13. Yang, X.; Wang, X.; Leng, Z.; Deng, Y.; Deng, F.; Zhang, Z.; Yang, L.; Liu, X. An optimized scheduling strategy combining robust optimization and rolling optimization to solve the uncertainty of RES-CCHP MG. Renew. Energy 2023, 211, 307–325. [Google Scholar] [CrossRef]
  14. Sultana, N.; Hossain, S.Z.; Almuhaini, S.H.; Düştegör, D. Bayesian optimization algorithm-based statistical and machine learning approaches for forecasting short-term electricity demand. Energies 2022, 15, 3425. [Google Scholar] [CrossRef]
  15. Zhu, J.; Zhao, Z.; Zheng, X.; An, Z.; Guo, Q.; Li, Z.; Sun, J.; Guo, Y. Time-Series Power Forecasting for Wind and Solar Energy Based on the SL-Transformer. Energies 2023, 16, 7610. [Google Scholar] [CrossRef]
  16. Mahmud, K.; Sahoo, A. Multistage energy management system using autoregressive moving average and artificial neural network for day-ahead peak shaving. Electron. Lett. 2019, 55, 853–855. [Google Scholar] [CrossRef]
  17. Kazemzadeh, M.-R.; Amjadian, A.; Amraee, T. A hybrid data mining driven algorithm for long term electric peak load and energy demand forecasting. Energy 2020, 204, 117948. [Google Scholar] [CrossRef]
  18. Hussein, A.; Awad, M. Time series forecasting of electricity consumption using hybrid model of recurrent neural networks and genetic algorithms. Meas. Energy 2024, 2, 100004. [Google Scholar] [CrossRef]
  19. Aurangzeb, K.; Alhussein, M.; Javaid, K.; Haider, S.I. A pyramid-CNN based deep learning model for power load forecasting of similar-profile energy customers based on clustering. IEEE Access 2021, 9, 14992–15003. [Google Scholar] [CrossRef]
  20. Aslam, S.; Herodotou, H.; Mohsin, S.M.; Javaid, N.; Ashraf, N.; Aslam, S. A survey on deep learning methods for power load and renewable energy forecasting in smart microgrids. Renew. Sustain. Energy Rev. 2021, 144, 110992. [Google Scholar] [CrossRef]
  21. Ullah, K.; Ahsan, M.; Hasanat, S.M.; Haris, M.; Yousaf, H.; Raza, S.F.; Tandon, R.; Abid, S.; Ullah, Z. Short-Term Load Forecasting: A Comprehensive Review and Simulation Study with CNN-LSTM Hybrids Approach. IEEE Access 2024, 12, 111858–111881. [Google Scholar] [CrossRef]
  22. Kong, W.; Dong, Z.Y.; Jia, Y.; Hill, D.J.; Xu, Y.; Zhang, Y. Short-term residential load forecasting based on LSTM recurrent neural network. IEEE Trans. Smart Grid 2017, 10, 841–851. [Google Scholar] [CrossRef]
  23. Hartigan, J.A.; Wong, M.A. Algorithm AS 136: A k-means clustering algorithm. J. R. Stat. Soc. Ser. C 1979, 28, 100–108. [Google Scholar] [CrossRef]
  24. Likas, A.; Vlassis, N.; Verbeek, J.J. The global k-means clustering algorithm. Pattern Recognit. 2003, 36, 451–461. [Google Scholar] [CrossRef]
  25. Kanungo, T.; Mount, D.M.; Netanyahu, N.S.; Piatko, C.; Silverman, R.; Wu, A.Y. The analysis of a simple k-means clustering algorithm. In Proceedings of the Sixteenth Annual Symposium on Computational Geometry, Hong Kong, China, 12–14 June 2000; pp. 100–109. [Google Scholar]
  26. Ran, X.; Xi, Y.; Lu, Y.; Wang, X.; Lu, Z. Comprehensive survey on hierarchical clustering algorithms and the recent developments. Artif. Intell. Rev. 2023, 56, 8219–8264. [Google Scholar] [CrossRef]
  27. Singh, H.V.; Girdhar, A.; Dahiya, S. A Literature survey based on DBSCAN algorithms. In Proceedings of the 2022 6th International Conference on Intelligent Computing and Control Systems (ICICCS), Madurai, India, 25–27 May 2022; pp. 751–758. [Google Scholar]
  28. Gogebakan, M. A novel approach for Gaussian mixture model clustering based on soft computing method. IEEE Access 2021, 9, 159987–160003. [Google Scholar] [CrossRef]
  29. Kodinariya, T.M.; Makwana, P.R. Review on determining number of Cluster in K-Means Clustering. Int. J. 2013, 1, 90–95. [Google Scholar]
  30. Kuraria, A.; Jharbade, N.; Soni, M. Centroid selection process using WCSS and elbow method for K-mean clustering algorithm in data mining. Int. J. Sci. Res. Sci. Eng. Technol. 2018, 12, 190–195. [Google Scholar] [CrossRef]
  31. Cui, M. Introduction to the k-means clustering algorithm based on the elbow method. Account. Audit. Financ. 2020, 1, 5–8. [Google Scholar]
  32. Yu, Y.; Si, X.; Hu, C.; Zhang, J. A review of recurrent neural networks: LSTM cells and network architectures. Neural Comput. 2019, 31, 1235–1270. [Google Scholar] [CrossRef]
  33. Sherstinsky, A. Fundamentals of recurrent neural network (RNN) and long short-term memory (LSTM) network. Phys. D Nonlinear Phenom. 2020, 404, 132306. [Google Scholar] [CrossRef]
  34. Graves, A.; Graves, A. Long short-term memory. In Supervised Sequence Labelling with Recurrent Neural Networks; Springer: Berlin/Heidelberg, Germany, 2012; pp. 37–45. [Google Scholar]
  35. Gers, F.A.; Schmidhuber, J.; Cummins, F. Learning to forget: Continual prediction with LSTM. Neural Comput. 2000, 12, 2451–2471. [Google Scholar] [CrossRef] [PubMed]
  36. DiPietro, R.; Hager, G.D. Deep learning: RNNs and LSTM. In Handbook of Medical Image Computing and Computer Assisted Intervention; Elsevier: Amsterdam, The Netherlands, 2020; pp. 503–519. [Google Scholar]
  37. Zhao, Z.; Chen, W.; Wu, X.; Chen, P.C.; Liu, J. LSTM network: A deep learning approach for short-term traffic forecast. IET Intell. Transp. Syst. 2017, 11, 68–75. [Google Scholar] [CrossRef]
  38. Ahmadi, L.; Young, S.B.; Fowler, M.; Fraser, R.A.; Achachlouei, M.A. A cascaded life cycle: Reuse of electric vehicle lithium-ion battery packs in energy storage systems. Int. J. Life Cycle Assess. 2017, 22, 111–124. [Google Scholar] [CrossRef]
  39. Heymans, C.; Walker, S.B.; Young, S.B.; Fowler, M. Economic analysis of second use electric vehicle batteries for residential energy storage and load-levelling. Energy Policy 2014, 71, 22–30. [Google Scholar] [CrossRef]
  40. Faessler, B. Stationary, second use battery energy storage systems and their applications: A research review. Energies 2021, 14, 2335. [Google Scholar] [CrossRef]
  41. Tan, K.M.; Ramachandaramurthy, V.K.; Yong, J.Y. Integration of electric vehicles in smart grid: A review on vehicle to grid technologies and optimization techniques. Renew. Sustain. Energy Rev. 2016, 53, 720–732. [Google Scholar] [CrossRef]
  42. Ravi, S.S.; Aziz, M. Utilization of electric vehicles for vehicle-to-grid services: Progress and perspectives. Energies 2022, 15, 589. [Google Scholar] [CrossRef]
  43. Liu, C.; Chau, K.; Wu, D.; Gao, S. Opportunities and challenges of vehicle-to-home, vehicle-to-vehicle, and vehicle-to-grid technologies. Proc. IEEE 2013, 101, 2409–2427. [Google Scholar] [CrossRef]
  44. Kim, S.; Kim, H. A new metric of absolute percentage error for intermittent demand forecasts. Int. J. Forecast. 2016, 32, 669–679. [Google Scholar] [CrossRef]
  45. Yang, W.; Shi, J.; Li, S.; Song, Z.; Zhang, Z.; Chen, Z. A combined deep learning load forecasting model of single household resident user considering multi-time scale electricity consumption behavior. Appl. Energy 2022, 307, 118197. [Google Scholar] [CrossRef]
  46. Guo, Y.; Qin, Z.; Tao, X.; Dobre, O.A. Federated Generative-Adversarial-Network-Enabled Channel Estimation. Intell. Comput. 2024, 3, 0066. [Google Scholar] [CrossRef]
  47. Kim, K.; Kim, Y.; Kim, Y.-J. Hybrid Frequency–Spatial Domain Learning for Image Restoration in Under-Display Camera Systems Using Augmented Virtual Big Data Generated by the Angular Spectrum Method. Appl. Sci. 2024, 15, 30. [Google Scholar] [CrossRef]
Figure 1. Structure of the LSTM network, illustrating the three primary gates: input gate, forget gate, and output gate ( σ : sigmoid activation function, tanh: hyperbolic tangent function, x t : input at time step, i t : output of the input gate, f t : output of the forget gate, C t ~ : candidate cell state, C t : cell state, o t : output of the output gate, and h t : hidden state).
Applsci 15 03050 g001
Figure 2. Architecture of the multi-cluster LSTM model. The figure illustrates the integration of k-means clustering with LSTM networks, where independent LSTM models are trained on segmented data clusters to improve power consumption forecasting accuracy.
Applsci 15 03050 g002
Figure 3. Hardware implementation of the experimental setup in the Daekyung Engineering building, with power lines and communication lines indicated between each component (AMI: advanced metering infrastructure, KEPCO: Korea Electric Power Corporation, PCS: power conversion system, PV: photovoltaic, and V2G: vehicle-to-grid).
Applsci 15 03050 g003
Figure 4. WCSS-based elbow method for determining the optimal number of clusters.
Applsci 15 03050 g004
Figure 5. Clustered power consumption data from the target building, categorized into four seasonal and work condition-based clusters.
Applsci 15 03050 g005
Figure 6. Comparison of actual and predicted power consumption data for the target building from 1 June 2023 to 31 May 2024.
Applsci 15 03050 g006
Figure 7. Comparison of actual and optimized power consumption during peak shaving validation (8–12 July 2024).
Applsci 15 03050 g007
Table 1. Comparison of prediction accuracy and computational complexity between the single LSTM and MC-LSTM.
MetricLSTMMC-LSTM
AccuracyAverage91.20%97.93%
Maximum92.42%99.24%
Minimum82.03%84.51%
Computational Complexity10.56 kFLOPs10.56 kFLOPs
Disclaimer/Publisher’s Note: The statements, opinions and data contained in all publications are solely those of the individual author(s) and contributor(s) and not of MDPI and/or the editor(s). MDPI and/or the editor(s) disclaim responsibility for any injury to people or property resulting from any ideas, methods, instructions or products referred to in the content.

