1. Introduction
The mechanical properties of tendons can be expressed in different ways, such as through strain, stiffness, and stress, as well as in combination, as seen in Young’s modulus [
1]. Strain represents the elongation relative to the resting length, while stiffness represents elongation in relation to the force applied to the tendon [
2]. Stress is represented in relation to the cross-sectional area of the tendon, which is a morphological parameter [
2]. The mechanical properties of tendons appear to be determined by the internal structural arrangement of their collagen fibers [
3]. For example, if more collagen fibers are arranged parallel to each other, this will increase the thickness (i.e., the cross-sectional area) of the tendon [
3,
4]. A larger cross-sectional area will reduce the stress on the tendon when a given force is applied, potentially decreasing the risk of strain injuries [
5]. This idea has been proposed in earlier studies, suggesting that there is an optimal range for the tendon cross-sectional area (CSA) relative to the muscle (1:34) that could reduce injury risk [
6]. Habitual loading may result in an increased patellar tendon CSA [
1], indicating that collagen synthesis in the patellar tendon can be facilitated by regular exercise [
4]. Since tendon morphological adaptation is slower than that experienced in the muscle, intervention studies often fail to observe increments in tendon CSA; instead, evidence suggests substantial increases in tendon stiffness [
7,
8]. These inconsistent results could be explained by the insufficient duration of the intervention to produce a robust tendon hypertrophy response, or the region of the observed tendon may not be responsive to training-associated adaptation [
1].
As mentioned earlier, muscles can adapt more quickly to mechanical loading by increasing muscle mass (the cross-sectional area) [
9]. The size of a muscle is related to its tendon size [
10,
11], suggesting that the magnitude of loading may also influence tendon size. A larger muscle can produce greater force [
12,
13]; hence, the tendons of a larger muscle can be subjected to a greater load. Region-specific increases in the patellar tendon CSA can be achieved through 12 weeks of resistance training [
1,
14], indicating that the relationship between the muscle and tendon area might play a role in efficient movement execution.
In addition to the tendon CSA, the tendon length and the magnitude of length changes affects the amount of strain energy that can be stored and recoiled in the tendon, which consequently determines the efficiency of muscle and joint work. However, tendon stress, strain, and stiffness are interrelated [
1]; therefore, the tendon CSA relative to muscle size could influence mechanical work efficiency. The elastic properties of the tendon can be utilized most in the stretch–shortening cycle (SSC) contraction, where tendons can store elastic strain energy during lengthening and return a significant amount of the stored energy during the subsequent shortening phase [
15,
16].
The efficiency of this elastic energy use is known as mechanical efficiency (ME) [
17], and it can be estimated in the quadriceps femoris muscle–tendon unit (MTU) as the ratio between the positive work during knee extension and the total work of the contraction [
18]. This ratio indicates how effectively stored strain energy is utilized. Because the magnitude of the stored and reused strain energy depends on the force applied to the tendon and the magnitude of tendon elongation, the quadriceps femoris may perform differently under various conditions, resulting in different ME [
19,
20,
21]. For example, by increasing initial muscle tension, the muscles can resist more stretching, allowing for greater tendon elongation during contraction [
21]. This, in theory, could increase the magnitude of strain energy storage and reuse, thereby enhancing ME.
The mechanical load during knee flexion influences the degree of knee flexion and determines the lengthening magnitude of the quadriceps femoris MTU, which also affects tendon lengthening. In laboratory measurements, the amount of work during knee flexion can be pre-programmed to a given level; therefore, the degree of knee flexion will depend on the participant’s ability to stop knee flexion under given conditions, making the measurement more individual. In this case, ME can be assessed at an individual range of motion of the knee while maintaining the same stretch load for all participants [
18].
Currently, limited information is available on the influence of quadriceps femoris MTU’s morphological parameters on ME during SSC contractions across different modalities. Expanding this knowledge could improve our understanding of the relationship between the MTU’s structural–functional characteristics. This study aims to investigate the association between ME and the morphological parameters of the quadriceps femoris MTU during various SSC contractions, focusing on lower contraction velocities. As part of a larger project, this research assesses the quadriceps femoris MTU properties to understand their effects on elastic energy storage, utilization, and ME.
We hypothesize that a smaller muscle-to-tendon CSA ratio (AmAt), which indicates a closer match between the muscle CSA and the tendon CSA, is related to enhanced energy storage and thus an improvement in ME. A thinner and longer tendon may exhibit greater compliance, while a thicker and shorter tendon is likely to be stiffer. Therefore, under low stretch load conditions, ME is expected to be higher with a thinner and longer tendon, while under high stretch load conditions, ME should be greater with a thicker and shorter tendon.
2. Materials and Methods
2.1. Participants
Nine healthy females (age: 22 ± 0.9 years; height: 165.9 ± 4.5 cm; bodyweight: 57.9 ± 4.7 kg) volunteered to participate in this study. All of them were free from any musculoskeletal injury. Every individual was informed about the details of the experiment and they gave written informed consent to take part in this study. The experimental setup for this study is identical to that of a related study conducted by our group, which is currently under review. Both studies measured the same sample of participants, but the SSC was performed at a high contraction velocity, and the previous work reports the corresponding results. This research followed the ethical recommendation of the latest Declaration of Helsinki, and the ethics committee of the university provided approval for the experiments (TE-KEB/No39/2019).
2.2. Experimental Procedure
One week prior to the first dynamometric measurement, participants were introduced to the testing protocol on the dynamometer. The familiarization session included a warm-up consisting of five minutes of pedaling on a stationary cycle ergometer at a self-selected pace and stretching exercises for the lower extremity muscles. During the second session, participants performed a series of SSC contractions with varying stretch loads and pretension levels. The mechanical properties of the quadriceps femoris MTU were assessed using a motorized dynamometer (Multicont II, Mediagnost, Budapest and Mechatronic Ltd., Szeged, Hungary).
Participants were seated on the dynamometer’s padded seat with a knee flexion angle of 30° (0° = full extension) and performed a maximal voluntary isometric contraction (MVC). To ensure stability and maintain a consistent hip angle of 90°, the torso was secured with shoulder harnesses, and both thighs were fastened with Velcro straps to prevent any unwanted movement. The right shank was attached to the lever arm of the servo motor approximately 10 cm above the ankle, with the dynamometer’s rotational axis aligned to the knee joint center at the lateral femoral epicondyle. A torque correction was applied to account for the inertia of the lever arm and lower leg as well as motor friction, ensuring accurate torque measurement [
22]. Throughout the contractions, participants received verbal encouragement from researchers to maximize their effort, with instructions to generate torque as quickly and forcefully as possible. The peak torque measured during MVC established the pretension threshold for subsequent SSC contractions.
On a separate day, the morphological parameters of the quadriceps MTU were measured using MRI. Scans were taken with participants in a supine position, with the knee and hip fully extended.
2.3. Dynamometric Data Collection and Process
To evaluate mechanical efficiency (ME), the participants performed several SSC contractions using a preset energy level to stretch the quadriceps based on the protocol of Váczi et al. [
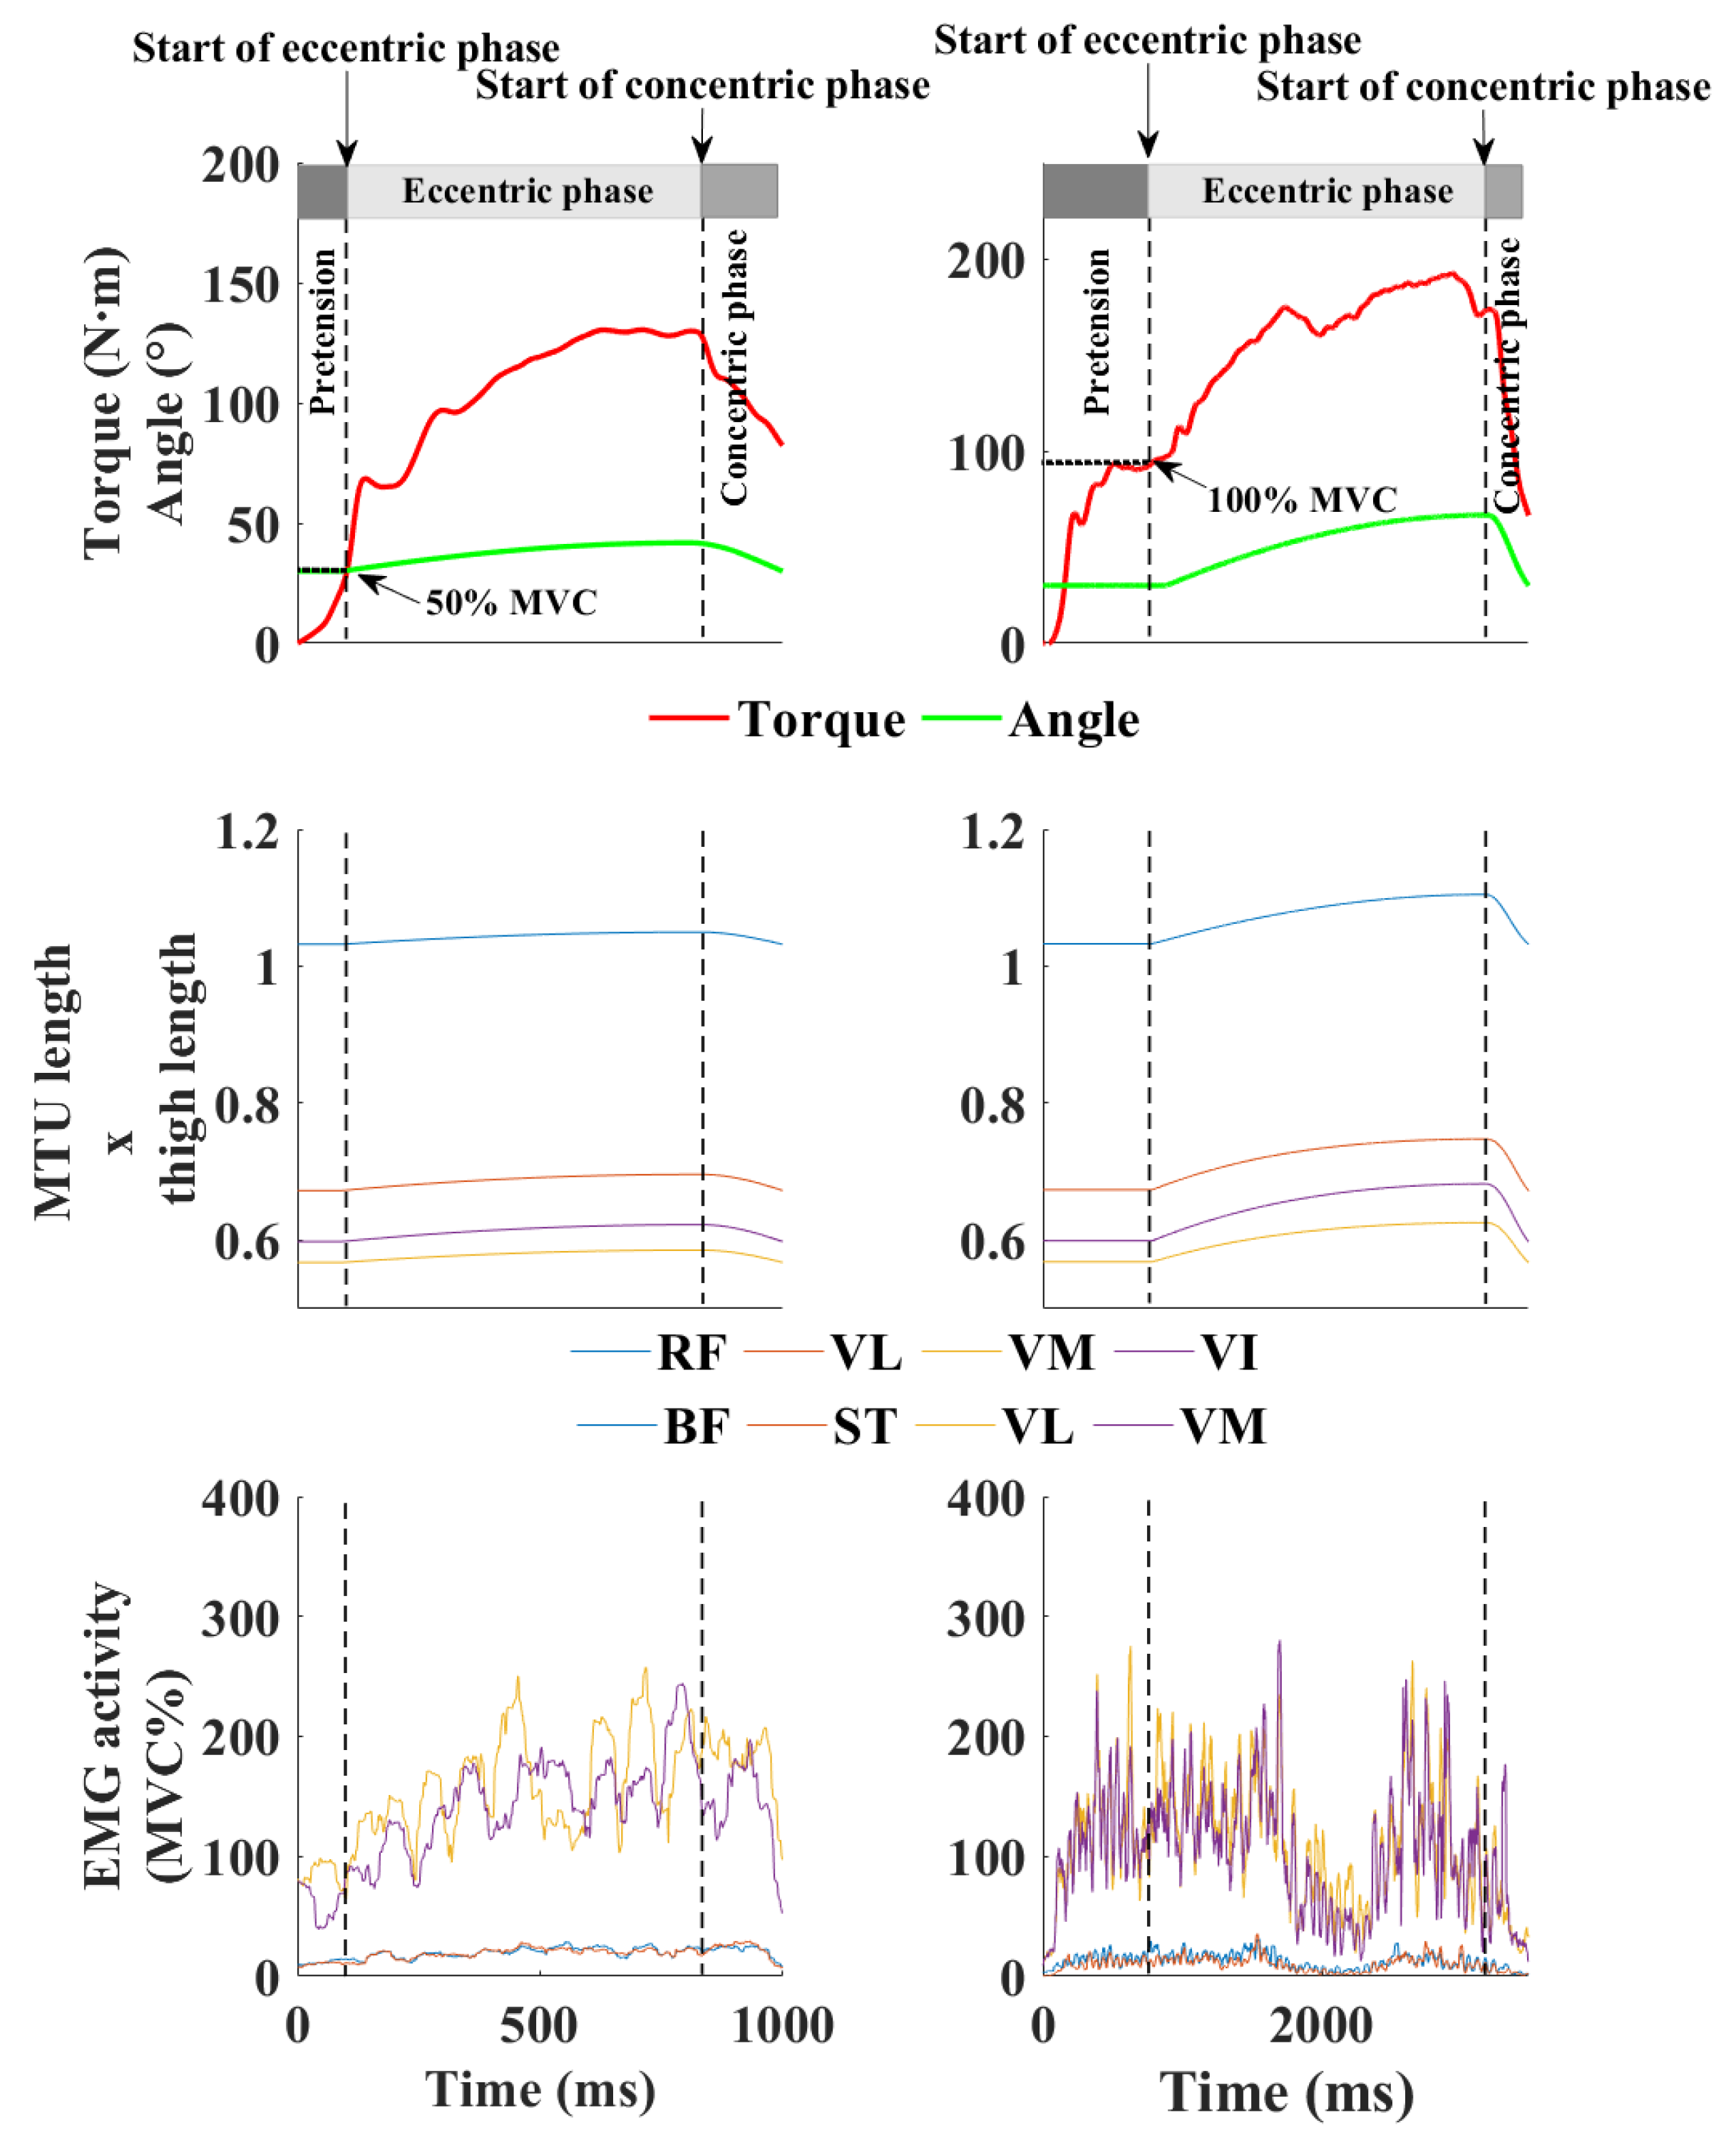
18]. This preset energy (20 J or 100 J) was applied by the dynamometer, which controlled the eccentric contraction. Specifically, the eccentric phase halted once the participants generated the determined amount of work (i.e., stretch load) during stretching, after which the knee immediately extended back to the starting joint position (
Figure 1).
Each SSC contraction began with the knee at a 30° flexion angle. The participants were instructed to exert force against the dynamometer’s lever arm as quickly and powerfully as possible, first stopping within a limited range of motion during the eccentric phase and then extending the knee through the concentric phase. When participants reached 50% or 100% of their previously measured MVC torque at 30° flexion, the dynamometer initiated the stretching of the quadriceps MTU. During the knee extension phase, the dynamometer motor was turned off, and resistance was generated solely from the lever arm’s friction and inertia along with that of the lower leg. Sufficient rest time (at least 5 min) was provided between each trial to minimize the effects of fatigue. Torque and knee angle data were sampled at a rate of 1000 Hz. Each contraction featured an incrementally increasing stretch velocity, ending at the terminal velocity of 30°∙s
−1. The mechanical work in each contraction phase was derived from the torque–angle data using a custom MATLAB script (v2022a, MathWorks, Natick, MA, USA) by integrating the torque–position curve over the range of motion limits [
23]. The work calculation followed Equation (1):
where
M = torque, dθ = angular displacement, and θ1 and θn represent the first and the last knee angle data points, respectively.
In this study, the mechanical work performed during the eccentric contraction (knee flexion phase) was considered as negative work, while the work during knee extension (concentric phase) was considered positive. The ME (η%) of the quadriceps femoris was calculated by dividing the positive work by the sum of the total and negative work. The formula used was as follows:
where Wp is the positive work calculated during the concentric phase and Wtot is the total work which was expressed as the energy stored in the motor when the active muscle stretch was initiated (20 and 100 J) and is represented the amount of mechanical work required to stop the lever of the dynamometer.
The tendon force was calculated by dividing the torque with the angle-specific moment arm length (see later). Then, the peak tendon force was extracted from each trial and was used to calculate the tendon stress as it was divided by the mean cross-sectional area of the tendon.
The model developed by Hawkins and Hull [
24] was applied to estimate changes in the MTU length of the quadriceps femoris muscle heads during contraction. This estimation utilized the recorded hip and knee angles, where knee movement was represented by the angular displacement of the motor’s lever arm, while the hip angle was kept constant at 90°. The estimated MTU lengths, derived from this model, are presented in relation to the thigh length.
2.4. EMG Data Collection and Process
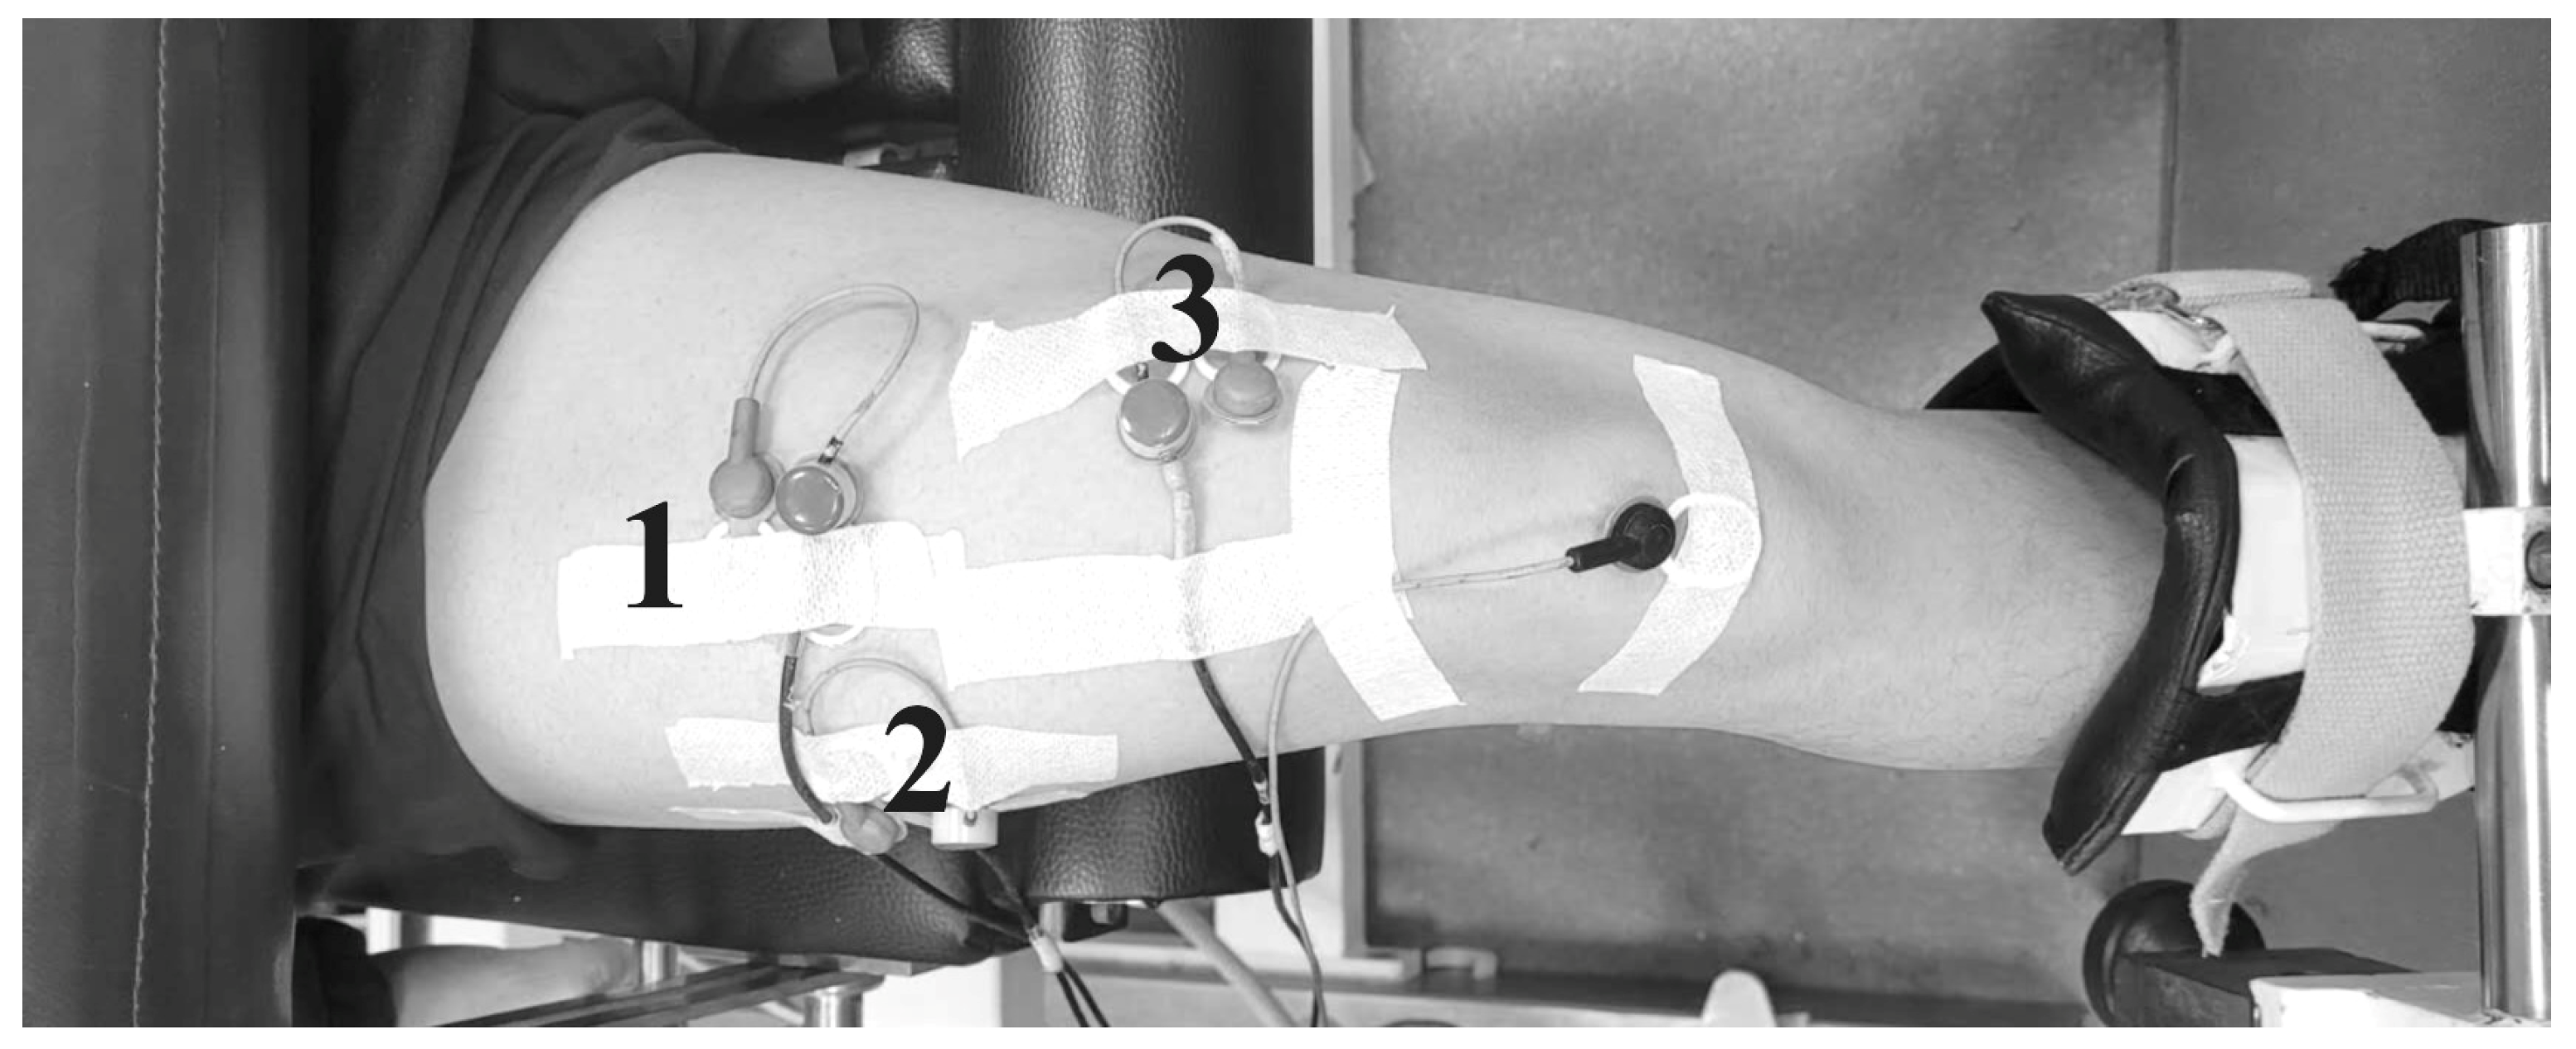
Four pairs of surface EMG sensors (Blue Sensor M-00-S/25, Ambu, Ballerup, Denmark), each with a 20 mm inter-electrode distance and a 10 mm diameter, were positioned on the vastus lateralis, vastus medialis, biceps femoris long head, and semitendinosus muscles (
Figure 2). Before electrode placement, the skin was shaved, abraded with sandpaper, and cleaned with alcohol to reduce skin impedance. The EMG activity was recorded using a TeleMyo telemetric hardware system (Noraxon U.S. Inc., Scottsdale, AZ, USA) at a 1000 Hz sampling frequency. The electrode placement adhered to SENIAM guidelines [
25], and ultrasonography was used to ensure proper electrode alignment with the fascicle orientation while minimizing crosstalk from adjacent muscles. A reference electrode was placed on the ipsilateral patella, and sensor cables were securely taped to the skin to prevent motion-related signal artifacts. The raw EMG amplitude data were exported to MATLAB (v. 2019b), where a custom script was used for processing. The data were filtered with a 4th order zero-lag Butterworth filter, band-passed from 20 to 450 Hz, to remove movement artifacts and noise. The EMG signals were then smoothed using a root mean square method with a 50 ms window. Each contraction was divided into eccentric (knee flexion) and concentric (knee extension) phases based on the knee joint angle, and the average EMG activity during each phase was calculated for further analysis. Synchronization of the EMG and dynamometer data (torque and angle) was achieved by feeding the dynamometer output signals directly into the EMG system.
2.5. Magnetic Resonance Data Collection and Process
MRI images were acquired using a 3T Philips scanner (Ingenia 3.0T MRI system, Amsterdam, The Netherlands) with a T1-weighted turbo spin echo sequence (slice thickness = 10 mm, interslice gap = 0 mm, TR = 680 ms, TE = 20 ms) to scan the leg in the axial plane. Muscle and tendon segmentation was performed in the ImageJ software (v. 1.44b, National Institutes of Health, Bethesda, MD, USA). Each single muscle and tendon was manually outlined along its borders, and the area of each segmented region was then calculated.
Muscle volume was determined by summing the volumes of each axial slice (cross-sectional area × slice thickness) [
26]. The physiological cross-sectional area (PCSA) of the quadriceps femoris was estimated by dividing the muscle volume by the length of the vastus lateralis which can be considered to be a good representative proxy for the mean fascicle length of the four heads of the quadriceps femoris muscle [
27]. The AmAt ratio, representing the muscle-to-tendon structural proportions, was defined as the PCSA divided by the maximum tendon cross-sectional area. The tendon length was measured in sagittal plane images where the knee joint was in a neutral position from the apex of the patella and the tuberosities tibiae.
The center of rotation of the knee was determined through Reuleaux graphical analysis [
28] from sagittal MRI images taken at knee flexion angles of 180°, 160°, and 140°. Images at different joint angles were superimposed with transparency in order to determine the center of rotation; then, the moment arms for the patella tendon at different joint angles were determined. The patellar tendon action line was considered as a straight line between the apex of the patella and the tuberosities tibiae. The shortest perpendicular distance from the center of rotation to the tendon action line was considered to be the patellar tendon moment arm length. A second-order polynomic curve was fitted over the three calculated moment arm length data at the three different knee joint angles to estimate dynamic moment arm length changes with the angular displacement in the knee during the trials.
2.6. Ultrasound Data Collection and Process
The fascicle length of the vastus lateralis was measured via ultrasound using a linear B-mode array probe (6.5 cm field of view, 7.5 MHz scanning frequency, Hitachi-Aloka EUB 405 plus, Tokyo, Japan). To optimize visualization, the probe was positioned over the mid-region of the right vastus lateralis muscle, where the longest fascicles are typically observed [
29]. Image analysis was performed in ImageJ software (v. 1.44b, National Institutes of Health, Bethesda, MD, USA), where the visible fascicles were manually outlined. When a fascicle extended beyond the ultrasound’s field of view, its length was estimated using trigonometric calculations based on the visible fascicle orientation [
30].
2.7. Statistical Analysis
All data are presented as means ± standard deviations (SDs). The normality of the data was assessed using the Shapiro–Wilk test. Correlation analysis was conducted to examine the relationship between the AmAt ratio and ME, with correlation strength interpreted as follows based on Hopkins [
31]: 0–0.1 (small), 0.1–0.3 (moderate), 0.3–0.5 (large), 0.5–0.7 (very large), and 0.9–1 (extremely large). The corresponding 95% confidence interval was calculated as well. A one-way repeated-measures ANOVA was used to evaluate the effect of different SSC conditions on mechanical and EMG parameters, followed by Bonferroni post-hoc tests when significant effects were detected. The alpha level was set at 0.05. All statistical analyses were conducted using the GraphPad software (GraphPad Software, Inc., Boston, MA, USA, v. 8).
3. Results
The morphological parameters of the quadriceps femoris muscle–tendon unit are presented in
Table 1.
The mean MVC was 95.6 ± 17.7 N∙m in 30° knee flexion. The SSC condition significantly impacted ME (F = 31.03,
p = 0.0003, η² = 0.37), with the highest ME recorded at a 50% pretension level with a 20 J stretch load SSC (54.14 ± 2.24%), while the lowest ME was observed at a 100% pretension level with a 100 J stretch load SSC (39.71 ± 6.58%) (
Table 2). Peak torque also reached its maximum value (207.58 ± 27.02 N∙m) at a 50% pretension level with a 100 J stretch load SSC. Interestingly, greater ME was observed with a lower degree of knee joint flexion (
Table 2). At 100 J stretch load, the knee flexion was nearly three times greater than that observed with a 20 J stretch load, irrespective of pretension level. The ANOVA results confirm a significant effect of stretch load on knee flexion (F = 214.2,
p < 0.001, η² = 0.40), indicating that stretch load influences knee flexion more strongly than pretension level. This effect appears consistent, as similar knee flexion angles were observed across different pretension levels for the same stretch load. Additionally, mechanical work during the concentric phase and peak torque remained comparable when applying the same stretch load, regardless of the pretension level (
Table 1). The peak tendon force was affected by SSC conditions as well (F = 42.3,
p = 0.0001, η² = 0.43) (
Table 2). The estimated tendon stress was similar between matched stretch conditions and was almost twofold higher in high stretch load SSC contraction.
In line with these results, an increase in both the stretch load and pretension level corresponded with a decrease in ME and an increase in EMG activity during both the eccentric and concentric phases of contraction. Namely, the mean EMG activity was the lowest at a 50% pretension level with a 20 J stretching load across all muscles during the concentric phase, although significant differences were only observed in the biceps femoris and vastus medialis muscles (
Figure 3). The EMG activity during the concentric phase gradually increased, reaching its peak with a 100% pretension level and a 100 J stretching load.
Additionally, the EMG activity was consistently higher during the eccentric phase compared to the concentric phase, suggesting that the stretch reflex may have been activated within the muscles. For the majority of the muscles, the EMG activity was greater with a 100 J load than with a 20 J load in both phases; however, this was not the case for the vastus medialis muscle. Specifically, during the eccentric phase with a 100% pretension level, the mean EMG activity of the vastus medialis muscle was higher with a 20 J load than with a 100 J load. Similarly, the vastus lateralis muscle exhibited lower mean EMG activity under the same conditions but during the concentric phase of contraction.
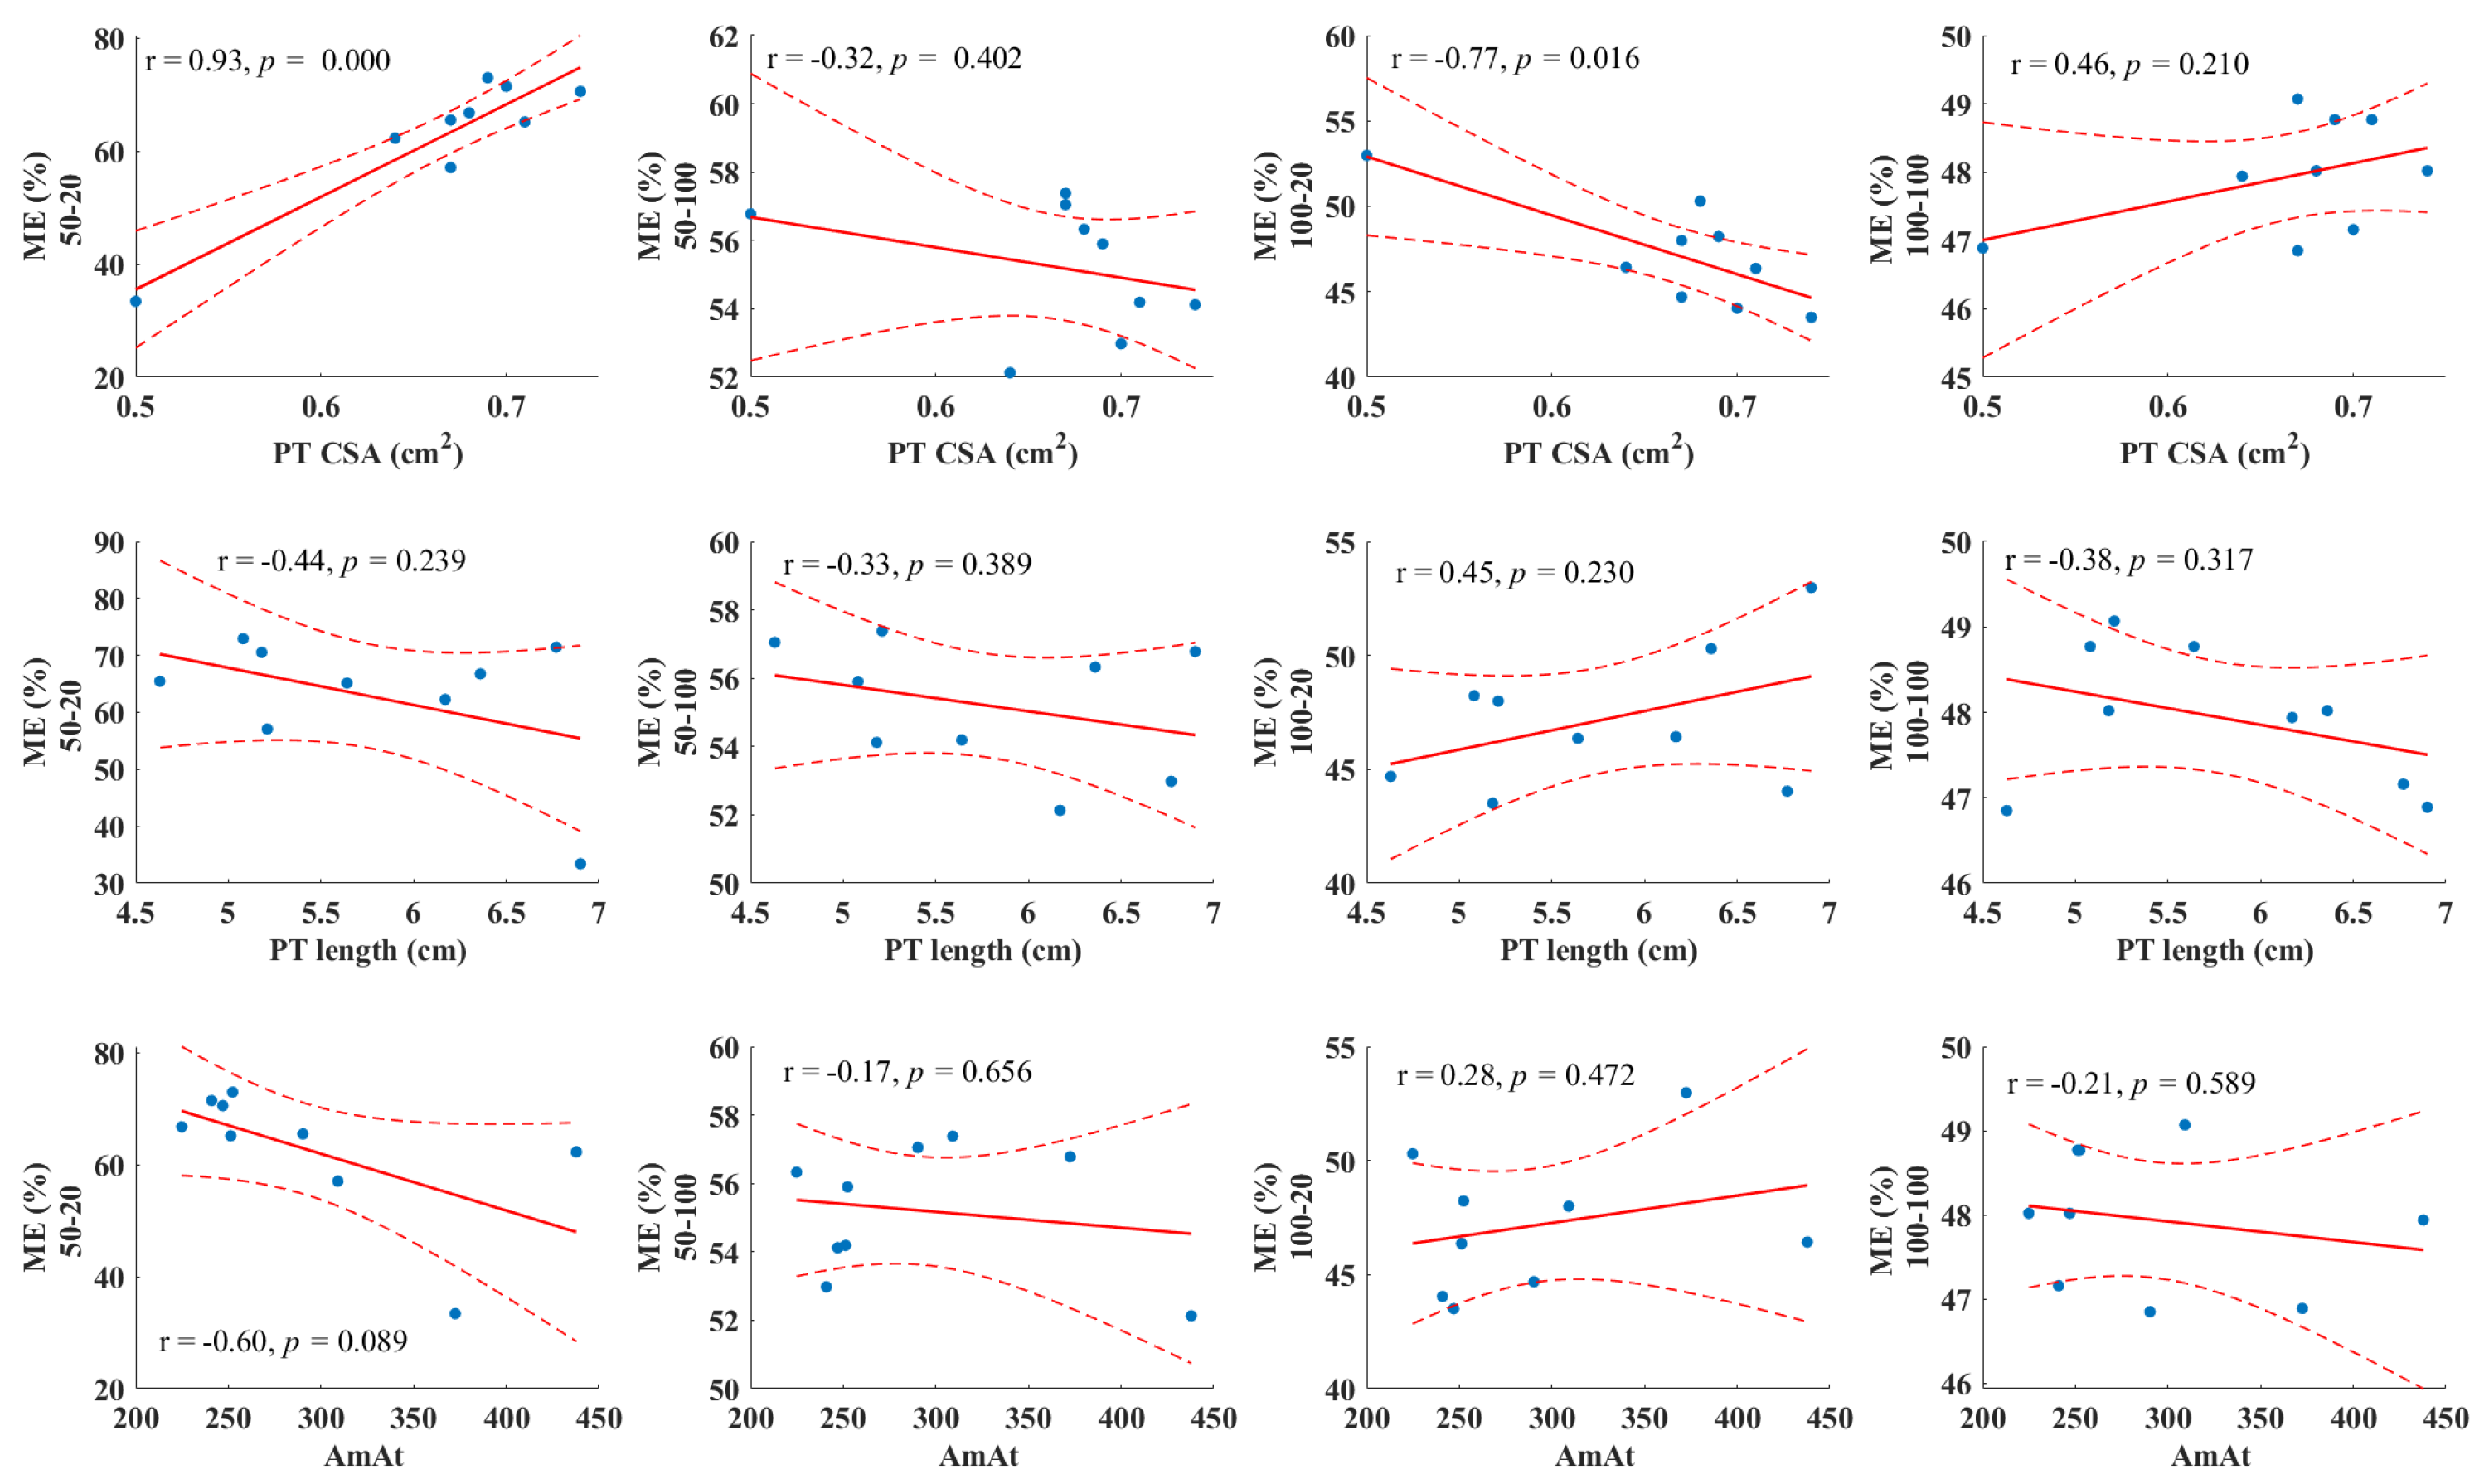
The correlation analysis indicated a significant relationship between the patellar tendon cross-sectional area and ME during SSC contractions with a 20 J stretch load at both 50% and 100% pretension levels (
Figure 4). In contrast, neither the resting length of the patellar tendon nor AmAt showed any association with ME (
Figure 4).
Peak tendon force showed no significant correlation with ME nor any of the morphological parameters of the quadriceps MTU. The estimated tendon stress during SSC contraction also showed no association with ME nor with the morphological parameters of the quadriceps MTU. The maximal force generation capacity (MVC 30°) showed no correlation with the muscle volume (r = 0.18, p = 0.65) and the PCSA (r = 0.01, p = 0.99) of the quadriceps femoris mean patella tendon CSA (r = 0.09, p = 0.81), but showed large association with knee flexion in all but one SSC condition (r = −0.88, p = 0.0018, r = 0.01, p = 0.98, r = −0.88, p = 0.0015, r = −0.92, p = 0.0004).
4. Discussion
This study explored the complex relationships between the morphological parameters of the quadriceps femoris MTU and ME during various SSC contractions considering that the mechanical properties of tendons are related to the structural arrangement of collagen fibers [
32]. We found a significant correlation between the patella tendon CSA and ME during SSC contractions at a lower stretch load, which highlights the importance of tendon morphology in ME. This observation aligns with previous research that suggests that a larger CSA can effectively reduce tendon stress under a given force, potentially mitigating the risk of strain injuries [
33]. However, the lack of association between the AmAt ratio and ME suggests that the mechanical properties of the MTU could be more determinant of ME.
The stretch load and pretension levels significantly influenced ME, with the highest ME observed at a 50% pretension level combined with a 20 J stretch load, suggesting an optimal condition for efficient joint work. Increasing the stretch load generally resulted in lower ME, likely due to lower tendon stress in these conditions. Under a low stretch load, the knee joint flexion remained lower compared with high stretch loads at corresponding pretension levels; hence, the total MTU elongation was lower, assuming a lower strain in the patella tendon as well. In this case, when tendon stress is lower with smaller tendon strain, the tendon stiffening of the patella tendon also decreases [
34]. Consequently, the tendon could be more compliant in this condition, which seems to be beneficial for achieving higher ME because reduced tendon stiffness is associated with greater elastic energy storage for a given force applied during SSC contractions [
35]. When the stretch load was set to 20 J, less mechanical work was required to stop the servomotor’s lever arm which resulted in smaller degree of knee flexion; however, participants with a higher MVC torque could stop the lever arm quicker, indicating that muscle force generation capacity plays an important role, despite the lack of association with muscle volume or PCSA. In low stretch load SSC contractions, the amount of positive work during knee extension was similar, resulting in higher ME at smaller stretch loads. This suggests that the stretch load could influence ME more than the pretension level, even though the pretension level affects the initial muscle length and tension, which should impact SSC performance [
20]. Given the smaller knee flexion and increased muscle tension after SSC initiation, it is plausible that the MTU stretch occurred mainly in the tendon, which contributed to higher ME at lower stretch loads [
18,
19,
21]. For example, at a 20 J stretch load, where MTU lengthening was less, it is likely that most elongation occurs in the patella tendon while the muscle operates quasi-isometrically. Since isometric contractions consume less metabolic energy while generating more force than shortening contractions [
36], this could enhance ME. Contraction near the optimal muscle length (for myofilament overlap) can increase the force output for a given activation level [
37], supporting our observation of higher ME under low stretch loads.
On the other hand, higher stretch loads require greater mechanical work to stop knee flexion, especially with low knee flexion velocity (i.e., 30°∙s
−1), which results in a higher knee flexion angle. Greater MTU elongation, however, does not necessarily pair with lower ME. In an optimal case, tendon elongation within the MTU would be greater, elevating the amount of stored strain energy. EMG data revealed higher quadriceps activation during knee flexion as opposed to during extension, implying sufficient muscle tension to stretch the patella tendon, specifically under a low stretch load. However, under slow knee flexion velocity lasting for 1.5 s, it is possible that the passive elastic elements store strain energy in a less effective manner. During a 2 s stretch, it is possible that cross-bridge bonds fail to maintain position across the entire lengthening phase. When these bonds disconnect and reattach, stored strain energy within the sarcomere’s elastic elements may decrease, possibly explaining lower ME under high stretch loads [
38,
39,
40]. Nevertheless, low stretch velocities have produced SSC effects in studies with isolated muscles [
40]. The tendon stress was nearly twice as high during higher stretch load SSC contraction than in low stretch load SSCs because the tendon force was substantially higher as well (
Table 1).
Although thicker tendons may store more elastic strain energy [
41], our results did not show a positive correlation between the patella tendon CSA and ME under high stretch loads with maximal pretension. In fact, a negative correlation was found between the patella tendon CSA and ME under moderate pretension with high stretch loads. Under maximal pretension, muscle tension is near maximal from the start of knee flexion, so most MTU elongation occurs in the tendon, with high initial tendon stiffness. Increased EMG activity during eccentric phases at higher loads indicates greater muscle recruitment, resulting in a higher peak tendon force and tendon stress. As tendon stiffness influences the muscle’s force–length and force–velocity profiles, it is reasonable to assume that under high stretch loads and maximal pretension, the fascicles do not operate at their optimal force–length–velocity potential because of the relatively high MTU elongation [
42,
43,
44]. In this case, a thinner, more compliant patella tendon could increase stored and reused strain energy [
2], and thus enhance ME. Our results could not support this idea since the patella tendon length and the CSA showed no association with ME in these SSC conditions.
Based on earlier reports, the AmAt ratio is most likely to be a relevant factor in order to perform efficient muscle work and to maintain the safety factor of the tendon [
6,
45,
46]. These conclusions were based on cadaver and animal studies that assumed an AmAt that could reduce the risk of injury by optimizing tendon structure to resist the tensile force during daily activities to be optimal. More specifically, they suggested that having a thinner tendon combined with longer muscle fascicles and a larger muscle mass with a 34:1 AmAt ratio could be an optimum area ratio [
6]. In contrast to this idea, our results showed no correlation between AmAt and ME at any SSC condition. The lack of association between the AmAt ratio and ME could indicate that the cross-sectional dimensions of muscle and tendon relative to each other do not influence muscle–tendon dynamics. It must be noted that the SSC conditions in this study do not represent SSC contractions during daily activities; therefore, ME of SSC conditions that can mimic these activities may result in different outcomes.
This study has some limitations. The low sample size limits the generalizability of our findings, so conclusions are specific only to this sample. Additionally, our approach for calculating the physiological cross-sectional area (PCSA) was based on the vastus lateralis fascicle length [
27]. Although this method has shown high reliability [
47,
48], individual quadriceps muscles may have different fascicle lengths, potentially affecting PCSA estimates. We also did not measure actual muscle and tendon length changes, which could provide further insights into ME mechanisms. Other mechanical parameters of the tendon such as strain and stiffness probably would help to increase the understanding of the interaction between MTU behavior and ME, which should be investigated further in future studies. The rotational axis of the knee joint and motor are in misalignment, and the magnitude of this error is influenced by the knee angle and soft-tissue deformation during knee flexion [
49,
50]. In this study, we could not apply correction for this error since no 3D motion capture system was available to quantify the misalignment between the rotational axis of the knee and the motor, and this must be taken into account when interpreting the results of this study. While our study did not analyze fatigue based on the EMG data, we could not confirm that fatigue did not affect our results. However, we provided sufficient rest time to minimize the effects of fatigue.


 ,
, 


