
The Impact of Terrain on the Planar Spatial Morphology of Mountain Settlements Studied Using Fractal Dimensions

Abstract
1. Introduction
Abbreviations
2. Materials and Methods
2.1. Study Area and Sample
2.2. Research Methods
2.2.1. Fractal Dimension
2.2.2. Multiscale Geographically Weighted Regression
2.2.3. Data Preprocessing
3. Results
3.1. Calculation Results of Fractal Dimension for Urban Settlements
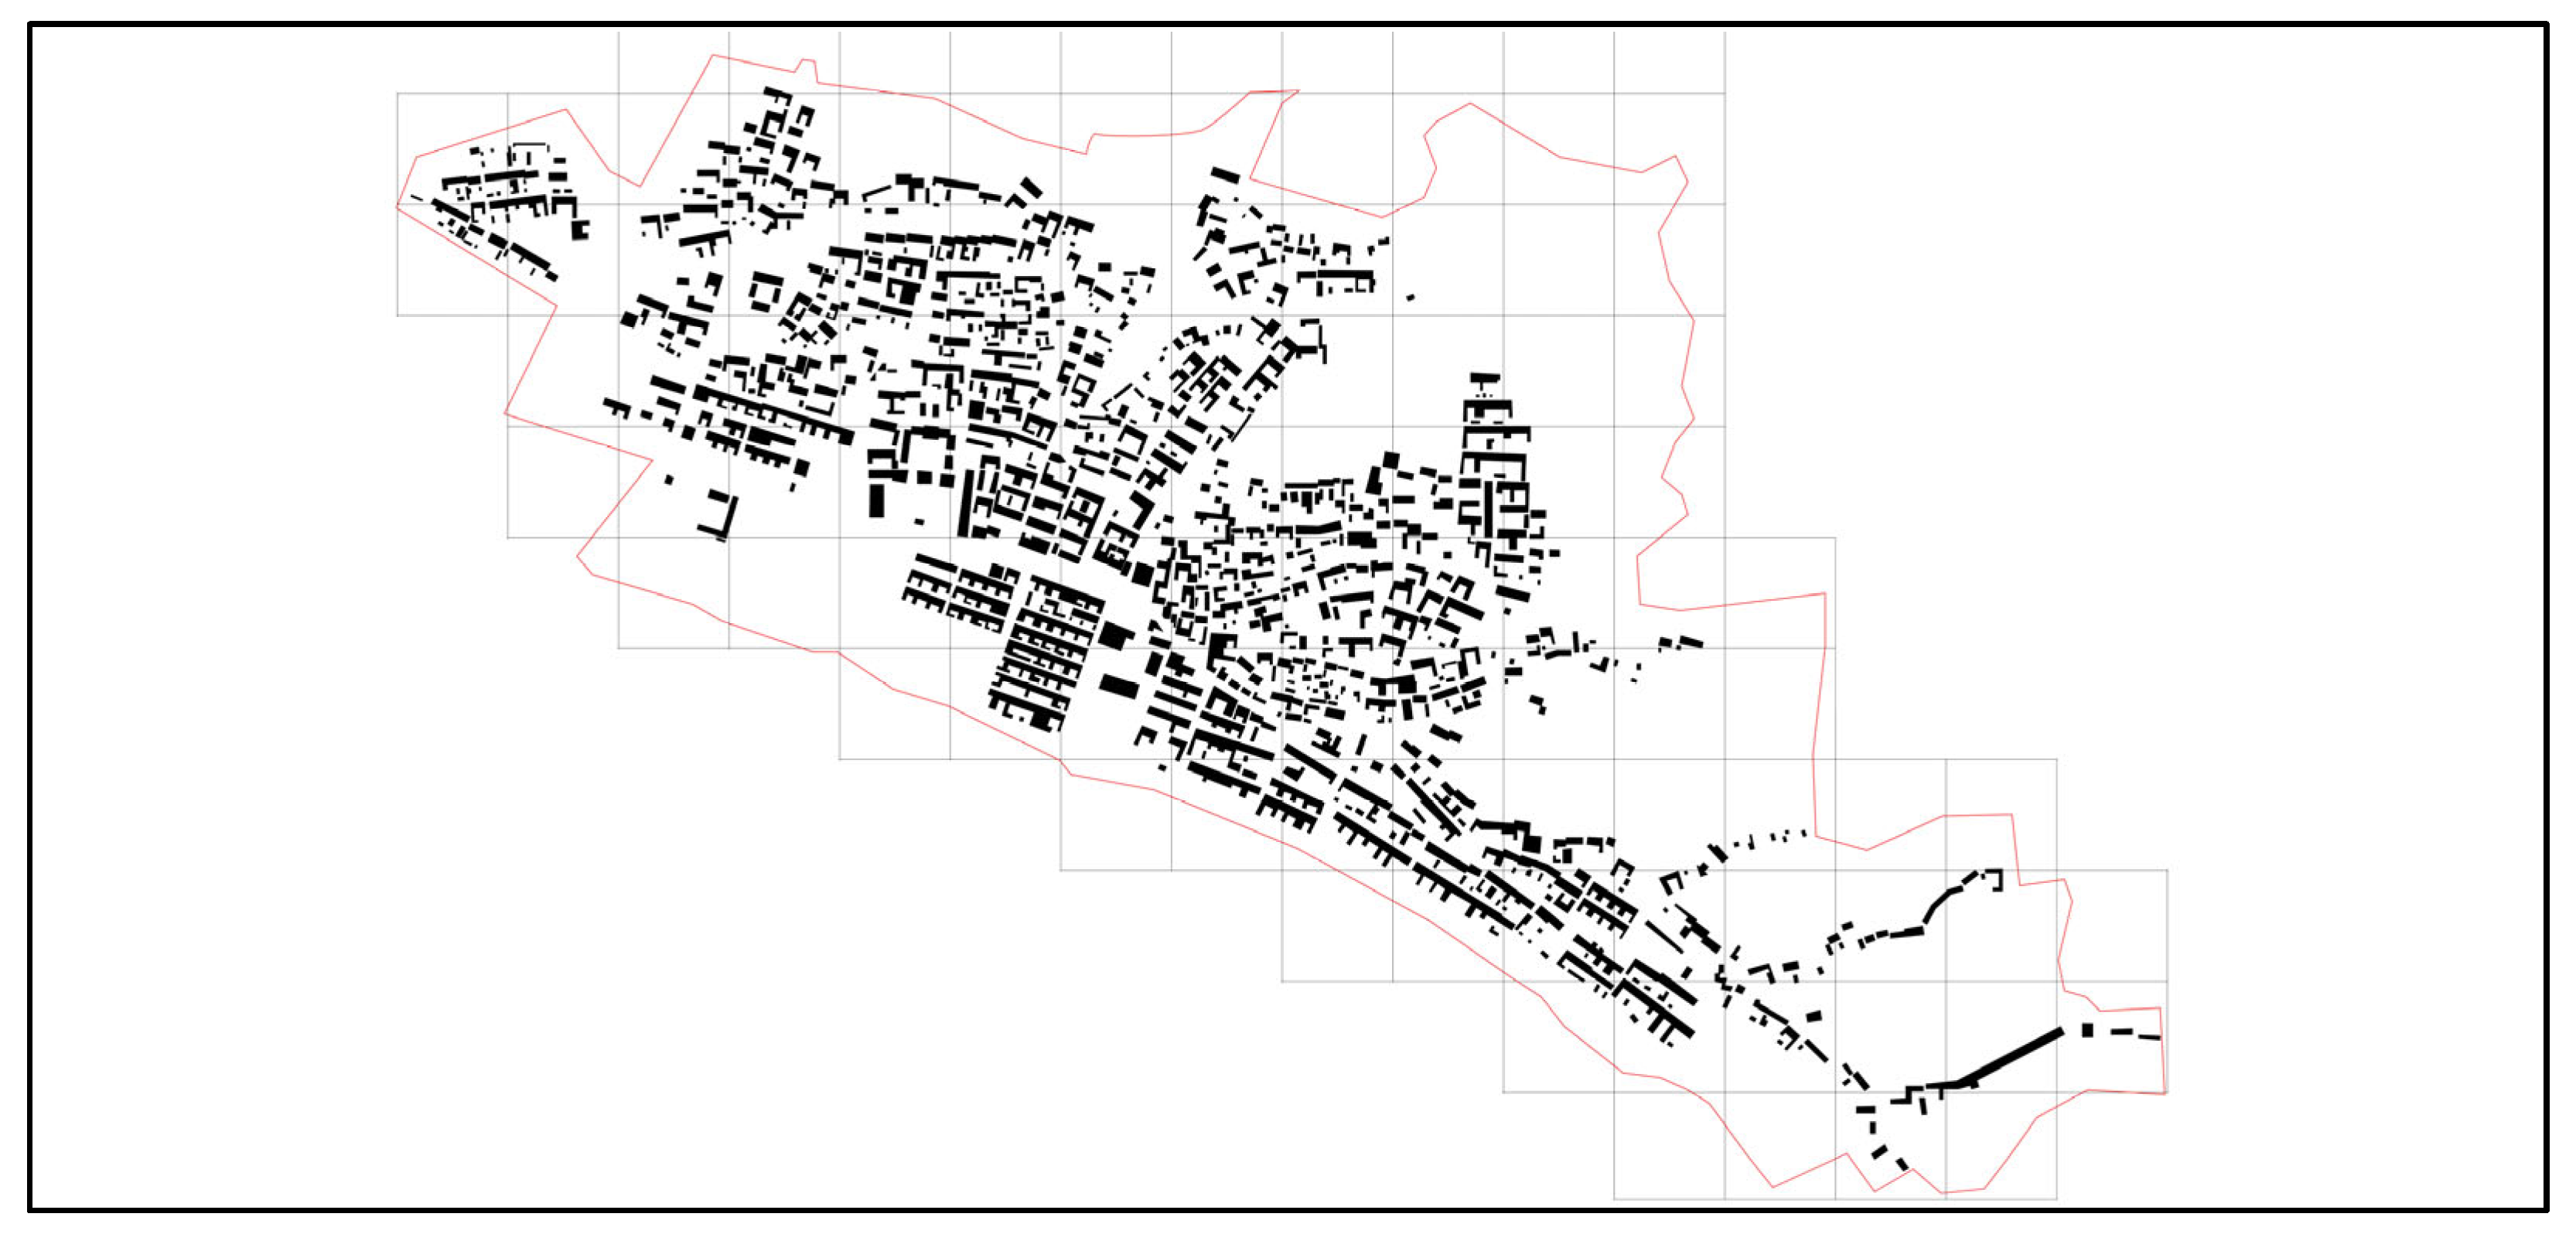
3.2. Distribution Results of Spatial Fractal Dimension in Xingdi Village
- Overall, the subspace fractal dimensions of the settlement are predominantly concentrated in its central area, which serves as the core of the settlement. This region retains a diverse array of traditional architecture and fortifications while also representing a transitional zone between old and new structures within the settlement. As one moves toward the periphery of the settlement, there is a noticeable decrease in subspace fractal dimensions. The lowest fractal dimensions can be observed at both the easternmost and northernmost edges of the settlement. Analyzing topographical features reveals that to the southwest, there is a trend towards flatter terrain, whereas to the northeast, it gradually approaches the Mianshan Mountain range. Consequently, subspace fractal dimensions exhibit a radial decline towards this northeastern direction.
- The settlement comprises two distinct parts: new villages and old villages. The boundary between these two areas is located along a main road situated to the south of the settlement, with old villages lying to its north and new villages to its south. Analysis indicates that on average, the subspace fractal dimensions in new village areas exceed those found in old village regions.
- Focusing on specific notable zones within the settlement—such as well-preserved courtyards, fortress walls, and temples—reveals that these locations possess higher covering subregion fractal dimensions compared to their surrounding areas; for instance, regions like Huiluan Temple and East Fort exhibit significantly elevated fractal dimensions relative to nearby locales.
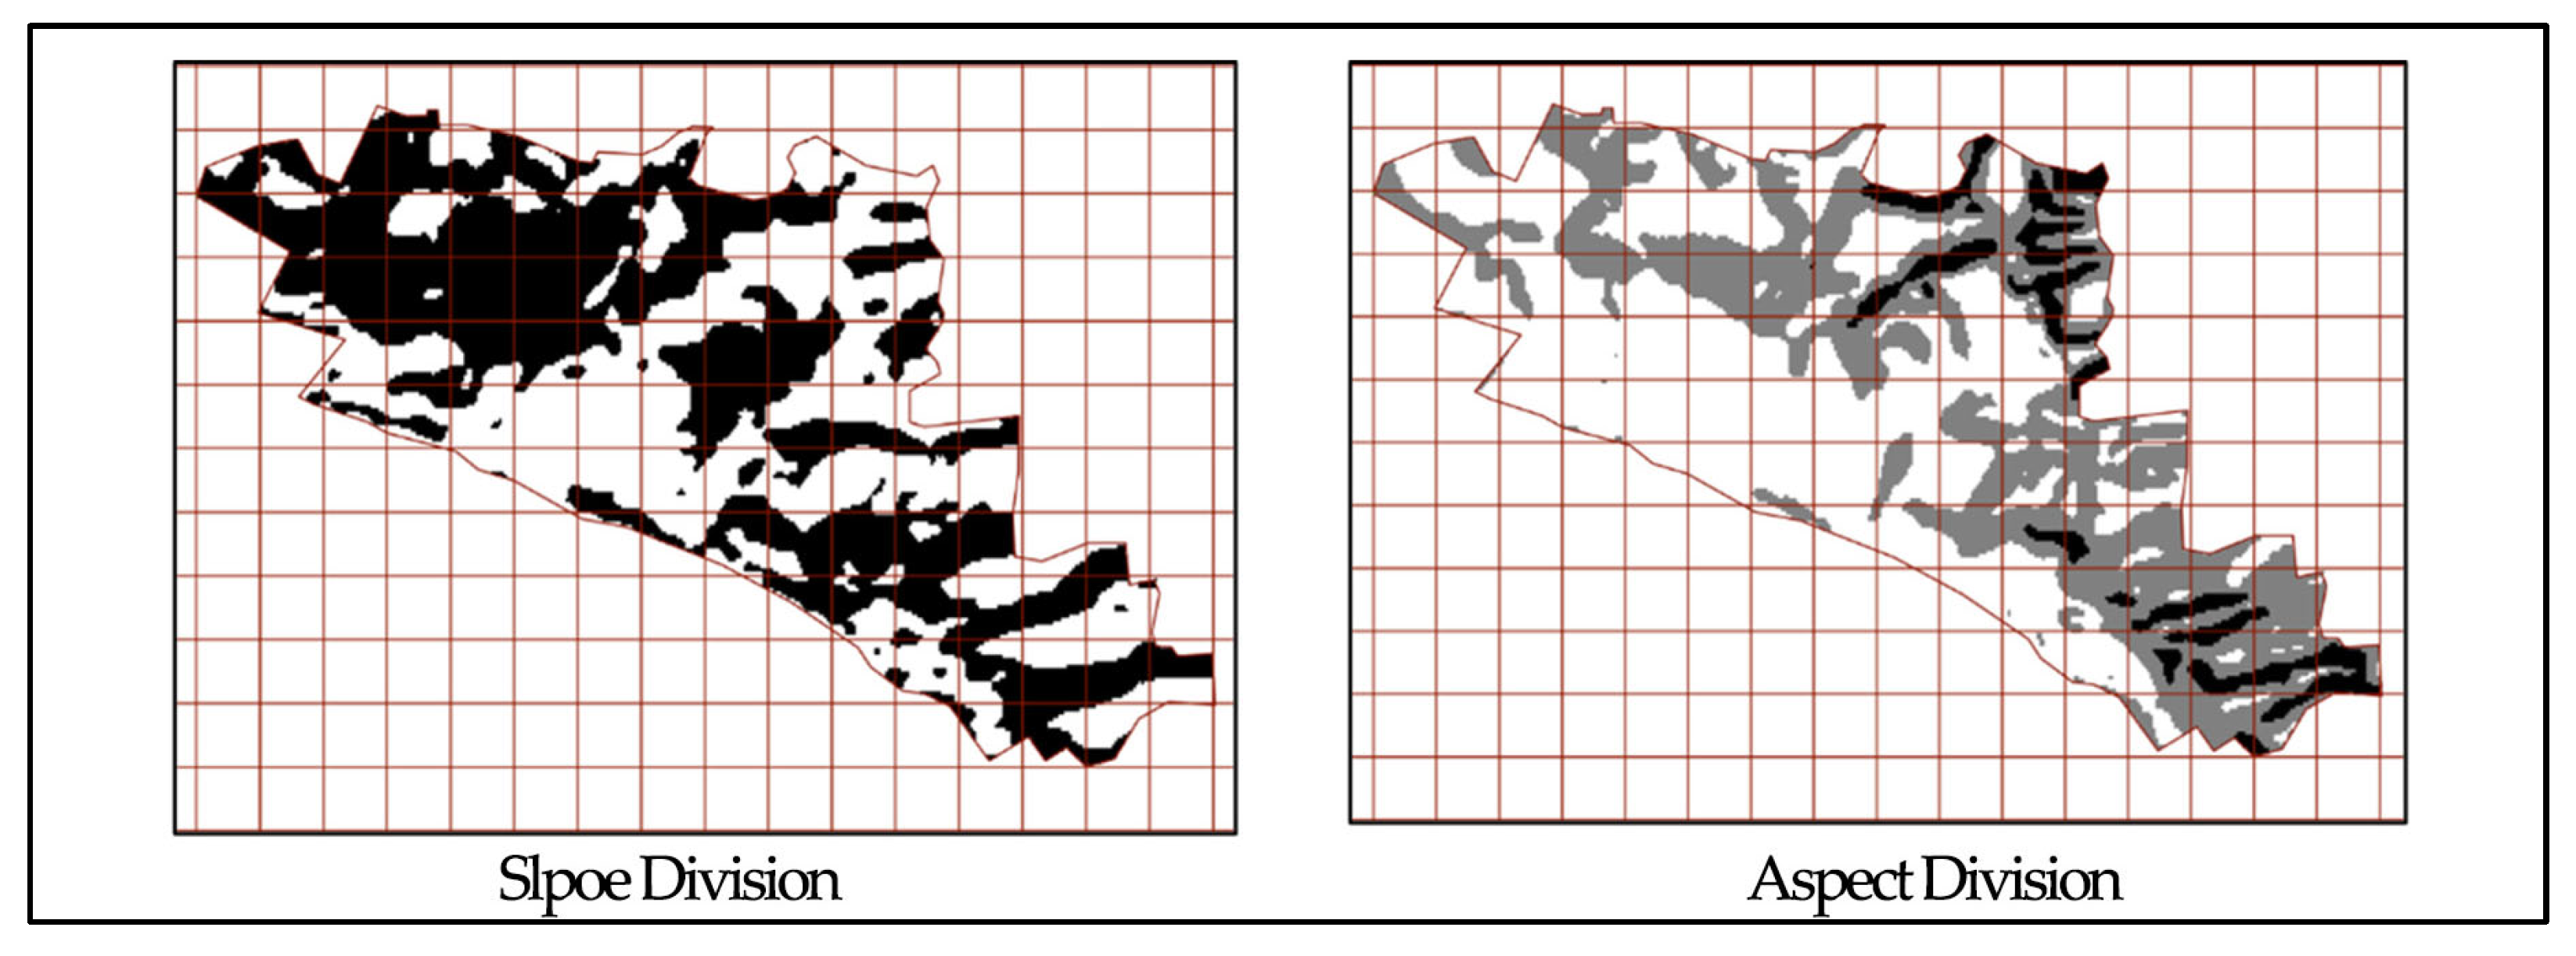
- By overlaying these data with slope maps of the settlement’s terrain (Figure 7), we can derive insights into potential correlations between fractal dimension values and topography. It becomes apparent that in areas characterized by relatively gentle slopes, subspace fractal dimensions tend to be larger; conversely, steeper terrains correspond with lower dimensional values. This observation suggests a possible relationship between topographic features and subspace fractal dimensions—a hypothesis warranting further investigation in subsequent studies.
3.3. MGWR Regression Results
3.3.1. General Effect of MGWR Regression
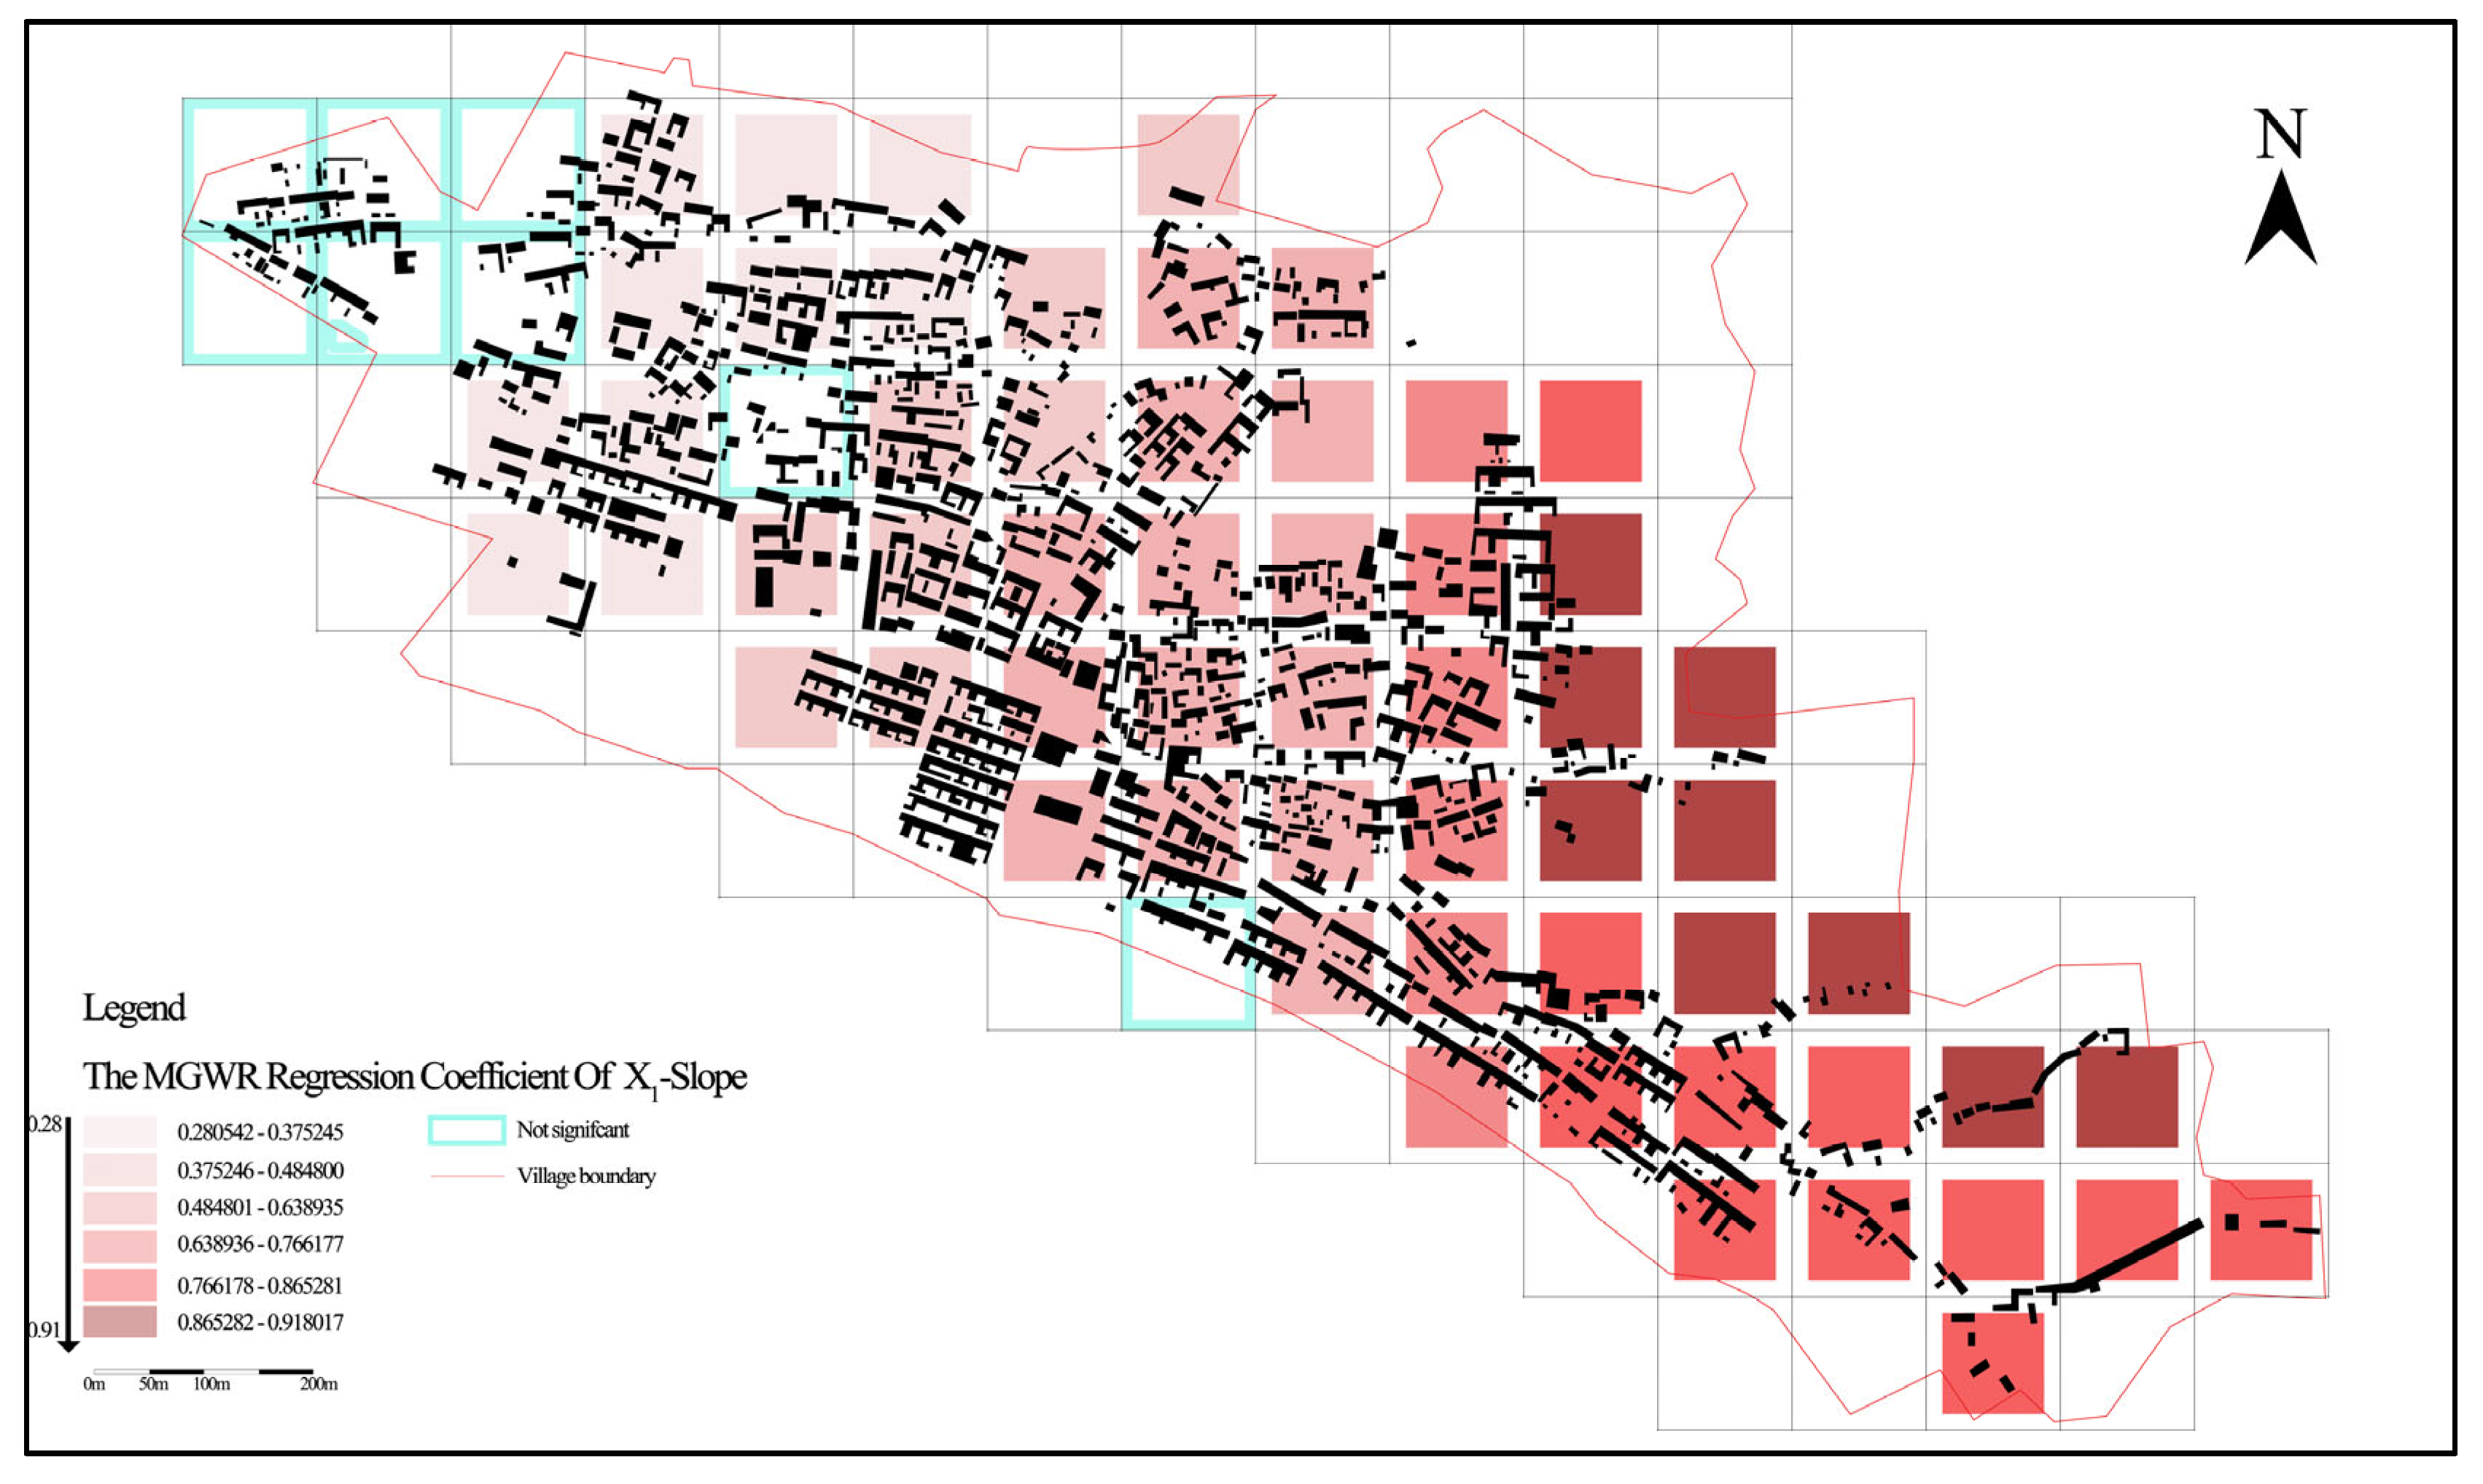
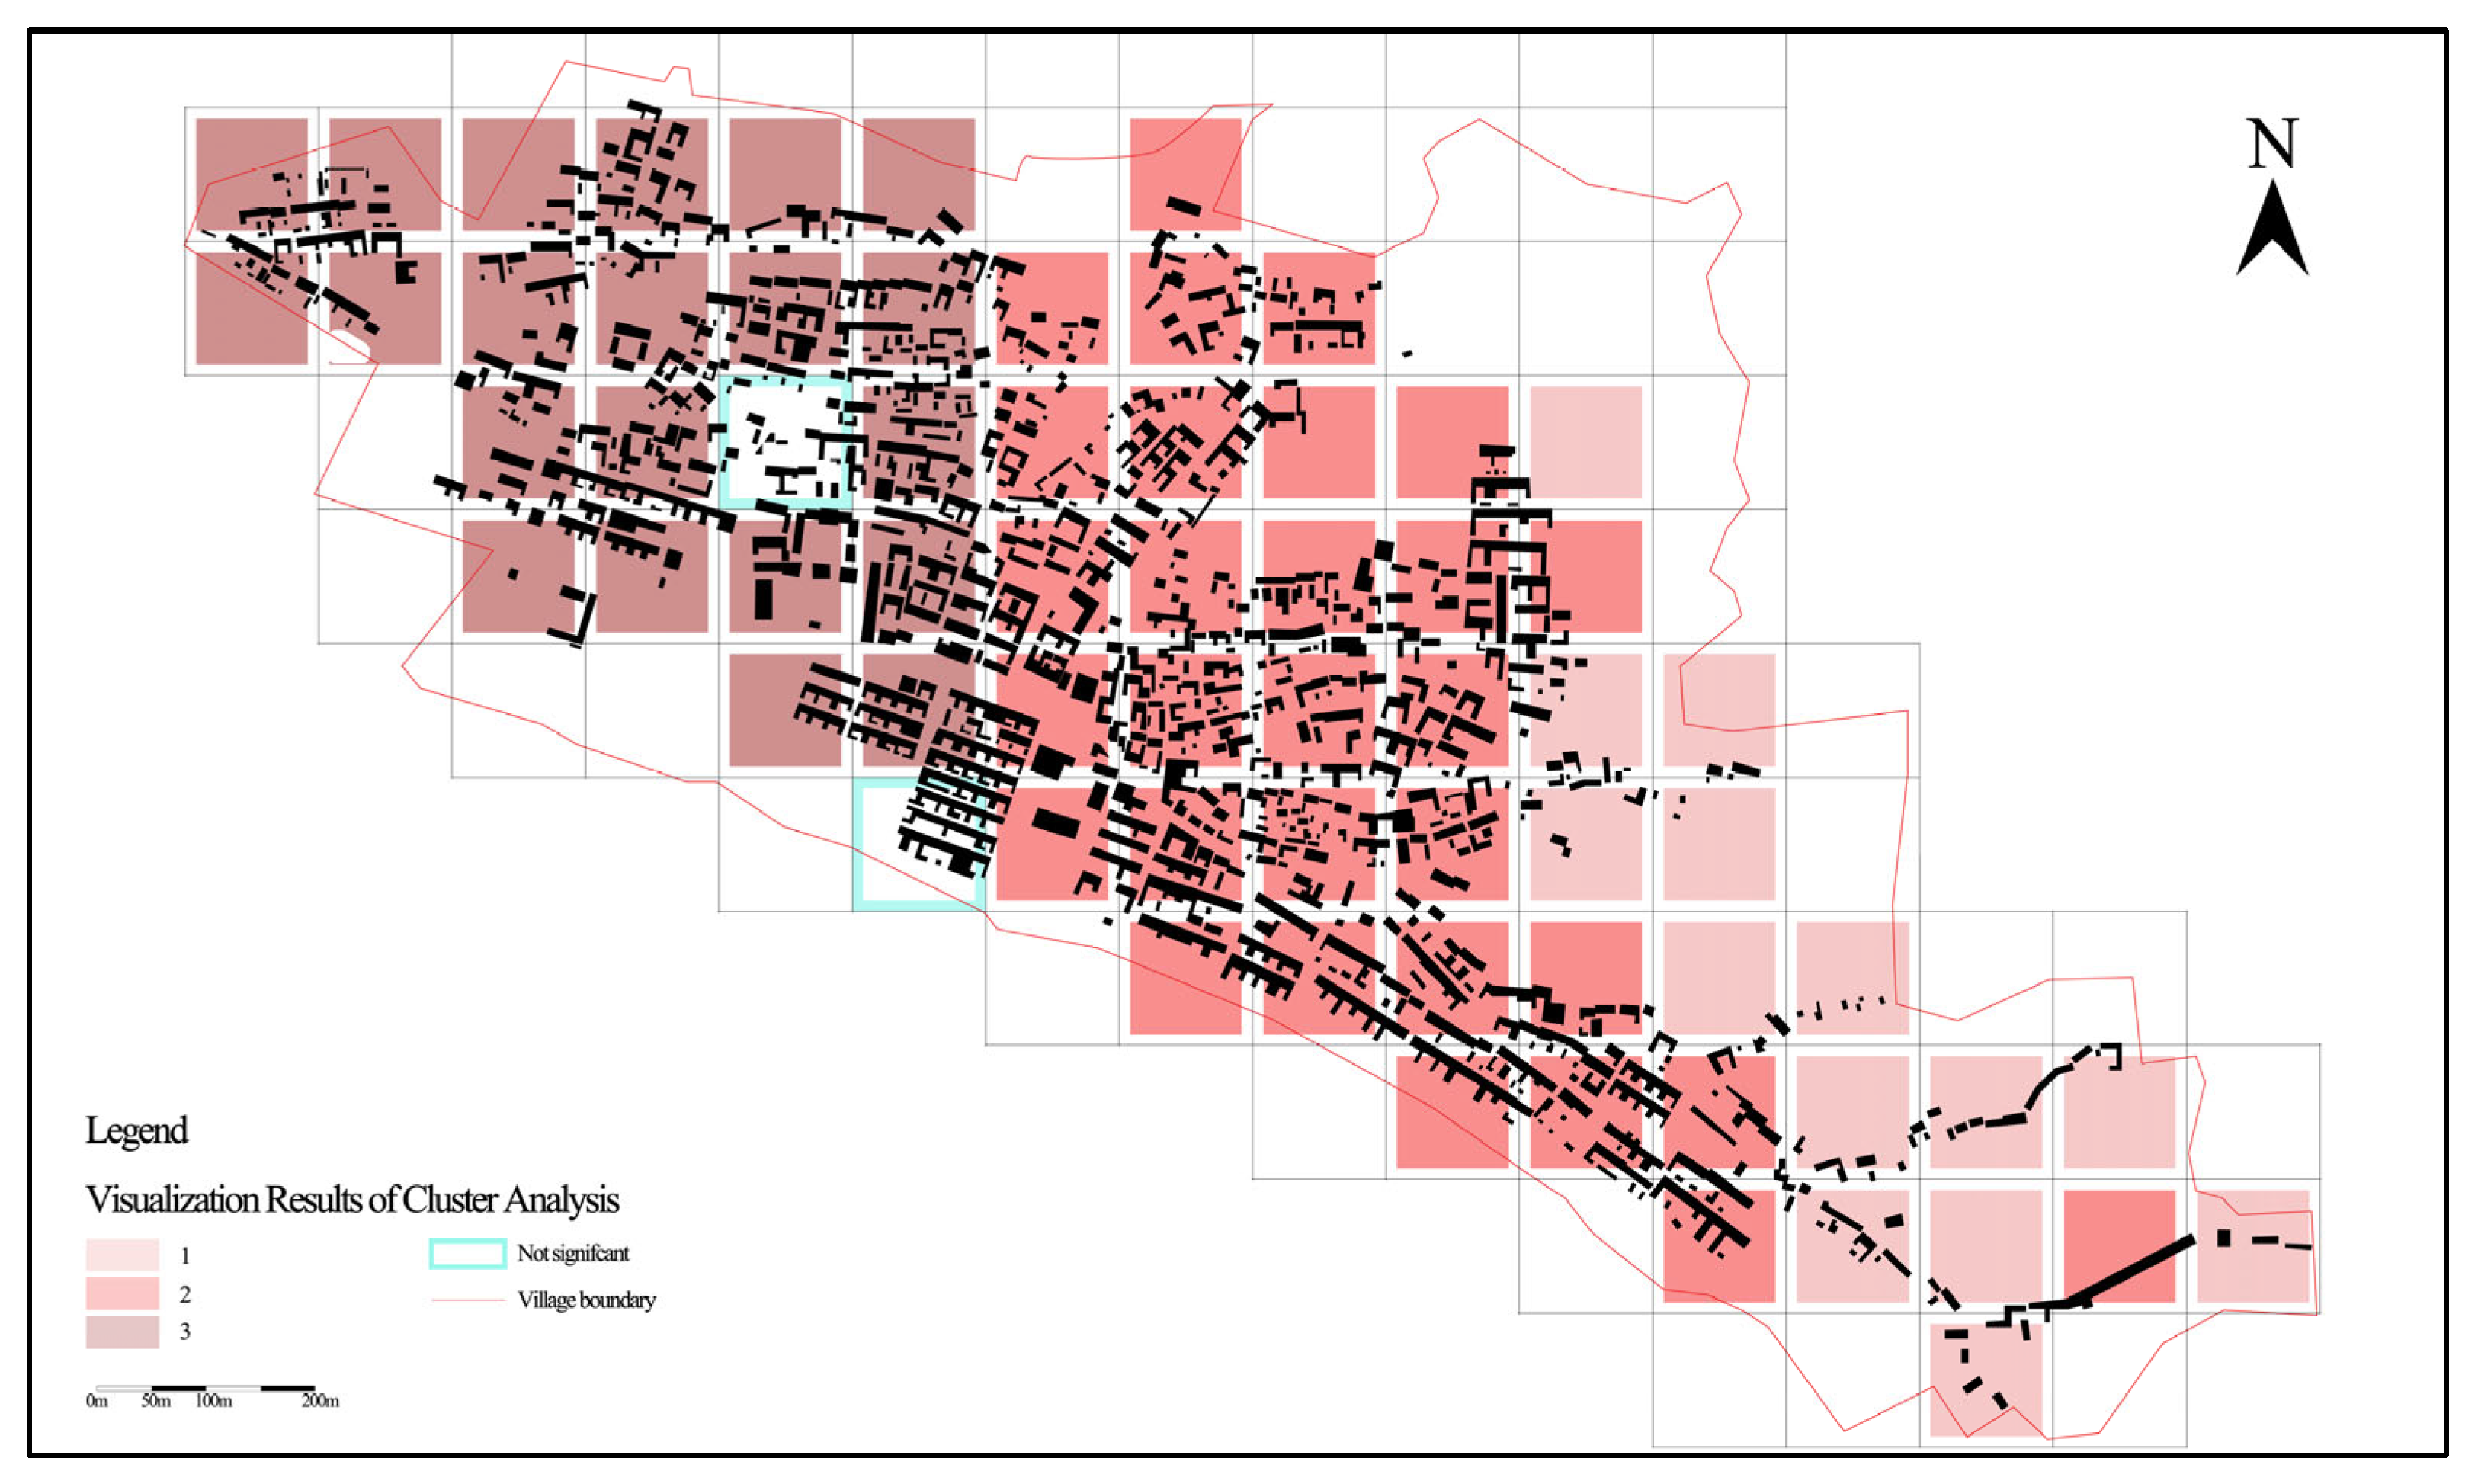
3.3.2. MGWR Visualization Results
- The regression coefficients are relatively lower in the northwestern part of the settlement and higher in the northeastern part.
- The average value of regression coefficients is higher in steep mountainous regions.
- From the village center to the periphery, the positive impact of elevation on the subspace fractal dimension becomes progressively stronger.
- Both higher and lower elevations exert a stronger positive impact on the subspace fractal dimension of the settlement.
4. Discussion
4.1. Discussion on the Fractal Dimension of Settlements and the Fractal Dimension of Suitable Construction Areas
4.2. Discussion on the Spatial Morphology of Xingdi Village Settlement
4.3. Discussion on Influencing Factors of Subspace Morphology
4.4. Discussion on Development Planning Recommendations
4.4.1. Protection Zoning Based on Fractal Characteristics
4.4.2. Core Construction of Genetic Conservation Systems
5. Conclusions
Limitations
Author Contributions
Funding
Institutional Review Board Statement
Informed Consent Statement
Data Availability Statement
Conflicts of Interest
References
- Nan, T. Discovering the spatial codes on vernacular courtyard of North China. Shanxi Archit. 2017, 43, 14–16. [Google Scholar] [CrossRef]
- He, F. A study on spatial morphology of Tunpu in Anshun. Shanxi Archit. 2020, 46, 15–17. [Google Scholar] [CrossRef]
- Putra, I.N.G.M. Transformation of Traditional Settlements and Disaster Vulnerability. J. Archit. Res. Educ. 2020, 2, 100. [Google Scholar] [CrossRef]
- Wu, Y.; Zhang, Z. Survey on Settlement Forms of Ethnic Groups in Mountainous Regions. J. Anhui Agric. Sci. 2013, 41, 9657–9659, 9666. [Google Scholar] [CrossRef]
- Yang, X. Advances in Quantitative Research Methodologies for the Spatial Layout of Rural Settlement in Recent 20 Years. Urban Plan. Int. 2020, 35, 72–80. [Google Scholar] [CrossRef]
- Takayasu, H. Fractals in the Physical Sciences; Manchester University Press: Manchester, UK, 1990; ISBN 0-7190-3434-5. [Google Scholar]
- Chen, Y. Fractal Modeling and Fractal Dimension Description of Urban Morphology. Entropy 2020, 22, 961. [Google Scholar] [CrossRef]
- Batty, M.; Longley, P.A. The Fractal Simulation of Urban Structure. Environ. Plan. A 1986, 18, 1143–1179. [Google Scholar] [CrossRef]
- Longley, P.A.; Batty, M. On the Fractal Measurement of Geographical Boundaries. Geogr. Anal. 1989, 21, 47–67. [Google Scholar] [CrossRef]
- Zhang, Z.; Xiao, R.; Yu, W.; Liu, Y.; Lin, M.; Wang, M. Characterizing Factors Associated with Built-Up Land Expansion in Urban and Non-Urban Areas from a Morphological Perspective. Sustainability 2017, 9, 1411. [Google Scholar] [CrossRef]
- Pu, X. Quantitative Research on the Integrated Form of the Two-Dimensional Plan to Traditional Rural Settlement. Ph.D.Thesis, Zhejiang University, Zhejiang, China, 2013. [Google Scholar]
- Zhang, J. Fractal Characteristics of Urban-Rural Settlement Spatial Distribution in Mountain Hills and Plains Areas. Sci. Surv. Mapp. 2013, 38. [Google Scholar]
- Fan, Q.; Du, F.; Li, H. A Study of the Spatial Form of Maling Village, Henan, China. Sustainability 2020, 12, 7350. [Google Scholar] [CrossRef]
- Wang, Y.; Bi, G.; Yang, Q.; Wang, Z. Analyzing Land Use Characteristics of Rural Settlements on the Urban Fringe of Liangjiang New Area, Chongqing, China. J. Mt. Sci. 2016, 13, 1855–1866. [Google Scholar] [CrossRef]
- Torbick, N.M.; Qi, J.; Roloff, G.J.; Stevenson, R.J. Investigating Impacts of Land-Use Land Cover Change on Wetlands in the Muskegon River Watershed, Michigan, USA. Wetlands 2006, 26, 1103–1113. [Google Scholar] [CrossRef]
- Zhang, C.; Ping, X.; Fan, Q.; Li, C. Measurement of 2D and 3D Fractal Features of Urban Morphology from an Architectural View and Its Influencing Factors. Fractal Fract. 2024, 8, 138. [Google Scholar] [CrossRef]
- Guo, J.; Han, G.; Xie, Y.; Cai, Z.; Zhao, Y. Exploring the Relationships between Urban Spatial Form Factors and Land Surface Temperature in Mountainous Area: A Case Study in Chongqing City, China. Sustain. Cities Soc. 2020, 61, 102286. [Google Scholar] [CrossRef]
- Wu, C.; Ye, Y.; Gao, F.; Ye, X. Using Street View Images to Examine the Association between Human Perceptions of Locale and Urban Vitality in Shenzhen, China. Sustain. Cities Soc. 2023, 88, 104291. [Google Scholar] [CrossRef]
- Ma, X.; Zhang, J.; Ding, C.; Wang, Y. A Geographically and Temporally Weighted Regression Model to Explore the Spatiotemporal Influence of Built Environment on Transit Ridership. Comput. Environ. Urban Syst. 2018, 70, 113–124. [Google Scholar] [CrossRef]
- Wang, J. Spatial Analysis of Mountainous Settlements Based on Fractal Theory. Master’s Thesis, Chongqing University, Chongqing, China, 2018. [Google Scholar]
- He, P. Studies on Mountainous Urban Morphologyon the Basis of Fractal Idea. Master’s Thesis, Chongqing University, Chongqing, China, 2012. [Google Scholar]
- Xie, J. Study on the Spatial Characteristics of Traditional Villages and Streets in Handan Mountain Area Based on Space Syntax. Master’s Thesis, Hebei University of Engineering, Hebei, China, 2019. [Google Scholar]
- Cheng, L.; Feng, R.; Wang, L. Fractal Characteristic Analysis of Urban Land-Cover Spatial Patterns with Spatiotemporal Remote Sensing Images in Shenzhen City (1988–2015). Remote Sens. 2021, 13, 4640. [Google Scholar] [CrossRef]
- Yang, X.; Chen, X.; Qiao, F.; Che, L.; Pu, L. Layout Optimization and Multi-Scenarios for Land Use: An Empirical Study of Production-Living-Ecological Space in the Lanzhou-Xining City Cluster, China. Ecol. Indic. 2022, 145, 109577. [Google Scholar] [CrossRef]
- Wang, W.; Shi, Q.; Wang, G. Analysis of Performance and Genetic Characteristics of Cultural Landscapes in Traditional Villages along the Jinzhong Section of the Wanli Tea Road from a Landscape Gene Information Chain Perspective: A Case Study of Xiamen Village. Sustainability 2024, 16, 8131. [Google Scholar] [CrossRef]
- Wang, W.; Shi, Q.; Wang, G. Exploration of the Landscape Gene Characteristics of Traditional Villages along the Jinzhong Section of the Wanli Tea Road from the Perspective of the Village Temple System. Land 2024, 13, 1602. [Google Scholar] [CrossRef]
- Sun, B. Fractal Dimension and Its Metrical Methods. J. Northeast. For. Univ. 2004, 032, 116–119. [Google Scholar] [CrossRef]
- Ge, M.; Lin, Q. Realizing the Box-Counting Method for Calculating Fractal Dimension of Urban Form Based on Remote Sensing Image. Geo-Spat. Inf. Sci. 2009, 12, 265–270. [Google Scholar] [CrossRef]
- Chen, Y.; Chen, L. Fractal Geometry, 2nd ed.; Earthquake Press: Beijing, China, 2018; ISBN 978-7-5028-4898-9. [Google Scholar]
- Sun, X. The Fractal Principle and Its Applications; Press of USTC: Hefei, China, 2003; ISBN 7-312-01606-5. [Google Scholar]
- Hu, K. Analysis of the Evolution of Urban Form in Xi’an Based on Fractal Theory and Spatial Syntax; Urban Planning Society of China: Beijing, China, 2023; p. 11. [Google Scholar]
- Wu, J.; Tu, Y.; Chen, Z.; Yu, B. Analyzing the Spatially Heterogeneous Relationships between Nighttime Light Intensity and Human Activities across Chongqing, China. Remote Sens. 2022, 14, 5695. [Google Scholar] [CrossRef]
- Yin, S.; Liu, J.; Han, Z. Relationship between Urban Morphology and Land Surface Temperature—A Case Study of Nanjing City. PLoS ONE 2022, 17, e0260205. [Google Scholar] [CrossRef]
- Zhang, K.; Wang, S.; Song, C.; Zhang, S.; Liu, X. Spatiotemporal Heterogeneity Analysis of Provincial Road Traffic Accidents and Its Influencing Factors in China. Sustainability 2024, 16, 7348. [Google Scholar] [CrossRef]
- Yang, Z. Analysis on the Slope Factor for Evaluating Mountainous Urban Construction Land Suitability in Yunnan Province. In Proceedings of the 2015 National Symposium on Land Resources Development and Consolidation and New Urbanization, Sofia, Bulgaria, 17–21 May 2015; pp. 16–25. [Google Scholar]
- Arseniou, G.; MacFarlane, D.W.; Seidel, D. Woody Surface Area Measurements with Terrestrial Laser Scanning Relate to the Anatomical and Structural Complexity of Urban Trees. Remote Sens. 2021, 13, 3153. [Google Scholar] [CrossRef]
- El-Darwish, I.I. Fractal Design in Streetscape: Rethinking the Visual Aesthetics of Building Elevation Composition. Alex. Eng. J. 2019, 58, 957–966. [Google Scholar] [CrossRef]
- Feng, X.; Hu, M.; Somenahalli, S.; Bian, X.; Li, M.; Zhou, Z.; Li, F.; Wang, Y. A Study of Spatio-Temporal Differentiation Characteristics and Driving Factors of Shaanxi Province’s Traditional Heritage Villages. Sustainability 2023, 15, 7797. [Google Scholar] [CrossRef]
- Feng, L.; Fan, L.; Wang, N.; Li, L.; Zhang, R.; Deng, G. A Comparative Study on the Spatial Structure Characteristics of National-Level Traditional Villages in Liaoning, China. Sustainability 2024, 16, 7730. [Google Scholar] [CrossRef]
- Mandelbrot, B. How Long Is the Coast of Britain? Statistical Self-Similarity and Fractional Dimension. Science 1967, 156, 636–638. [Google Scholar] [CrossRef] [PubMed]
- Pan, Y.; Dang, J.; Shi, Y. Comparative Analysis of Traditional Settlement Landscape of Leizhou Peninsula under the Difference of Topography and Landform. In Proceedings of the IOP Conference Series: Earth and Environmental Science, Virtual, 7 November 2020; IOP Publishing: Beijing, China, 2020; Volume 580, p. 012083. [Google Scholar]
- Song, Z.; Jin, W.; Jiang, G.; Li, S.; Ma, W. Typical and Atypical Multifractal Systems of Urban Spaces—Using Construction Land in Zhengzhou from 1988 to 2015 as an Example. Chaos Solit. Fractals 2021, 145, 110732. [Google Scholar] [CrossRef]
- Lorenz, W.E.; Andres, J.; Franck, G. Fractal Aesthetics in Architecture. Appl. Math. Inf. Sci 2017, 11, 971–981. [Google Scholar] [CrossRef]
- Zhao, M.; Wang, H.; Sun, J.; Tang, R.; Cai, B.; Song, X.; Huang, X.; Huang, J.; Fan, Z. Spatio-Temporal Characteristics of Soil Cd Pollution and Its Influencing Factors: A Geographically and Temporally Weighted Regression (GTWR) Method. J. Hazard. Mater. 2023, 446, 130613. [Google Scholar] [CrossRef]
- Wang, J.; Lu, F.; Liu, S. A Classification-Based Multifractal Analysis Method for Identifying Urban Multifractal Structures Considering Geographic Mapping. Comput. Environ. Urban Syst. 2023, 101, 101952. [Google Scholar] [CrossRef]


| Village | Architectural Fractal Dimension | Suitable Construction Area Fractal Dimension | Difference |
|---|---|---|---|
| Dajin | 1.630 | 1.920 | 0.290 |
| Xingdi | 1.650 | 1.930 | 0.280 |
| Nanzhuang | 1.583 | 1.860 | 0.277 |
| Jiaojiabao | 1.585 | 1.850 | 0.265 |
| Xiaojin | 1.620 | 1.880 | 0.260 |
| Zhangbi | 1.660 | 1.918 | 0.258 |
| Xialihou | 1.690 | 1.930 | 0.240 |
| Zhang | 1.720 | 1.950 | 0.230 |
| Banyu | 1.470 | 1.690 | 0.220 |
| Tian | 1.584 | 1.880 | 0.216 |
| Liujiashan | 1.590 | 1.790 | 0.200 |
| Hongshan | 1.710 | 1.900 | 0.190 |
| Architectural Fractal Dimension | Suitable Construction Area Fractal Dimension | |
|---|---|---|
| Architectural fractal dimension | 1 (0.000 ***) | 0.841 (0.001 ***) |
| Suitable construction area fractal dimension | 0.841 (0.001 ***) | 1 (0.000 ***) |
| Model Parameter | MGWR |
|---|---|
| Residual sum of squares | 33.239 |
| AIC | 161.880 |
| AICc | 165.299 |
| R2 | 0.504 |
| Adjusted R2 | 0.432 |
| p-Value | Mean | STD | Min | Median | Max | |
|---|---|---|---|---|---|---|
| X1 (Slope) | <0.001 | 0.592 | 0.221 | 0.263 | 0.554 | 0.918 |
| X2 (Elevation) | 0.077 | 0.318 | 0.032 | 0.271 | 0.312 | 0.384 |
| X3 (Aspect) | 0.335 | 0.051 | 0.010 | 0.034 | 0.051 | 0.067 |
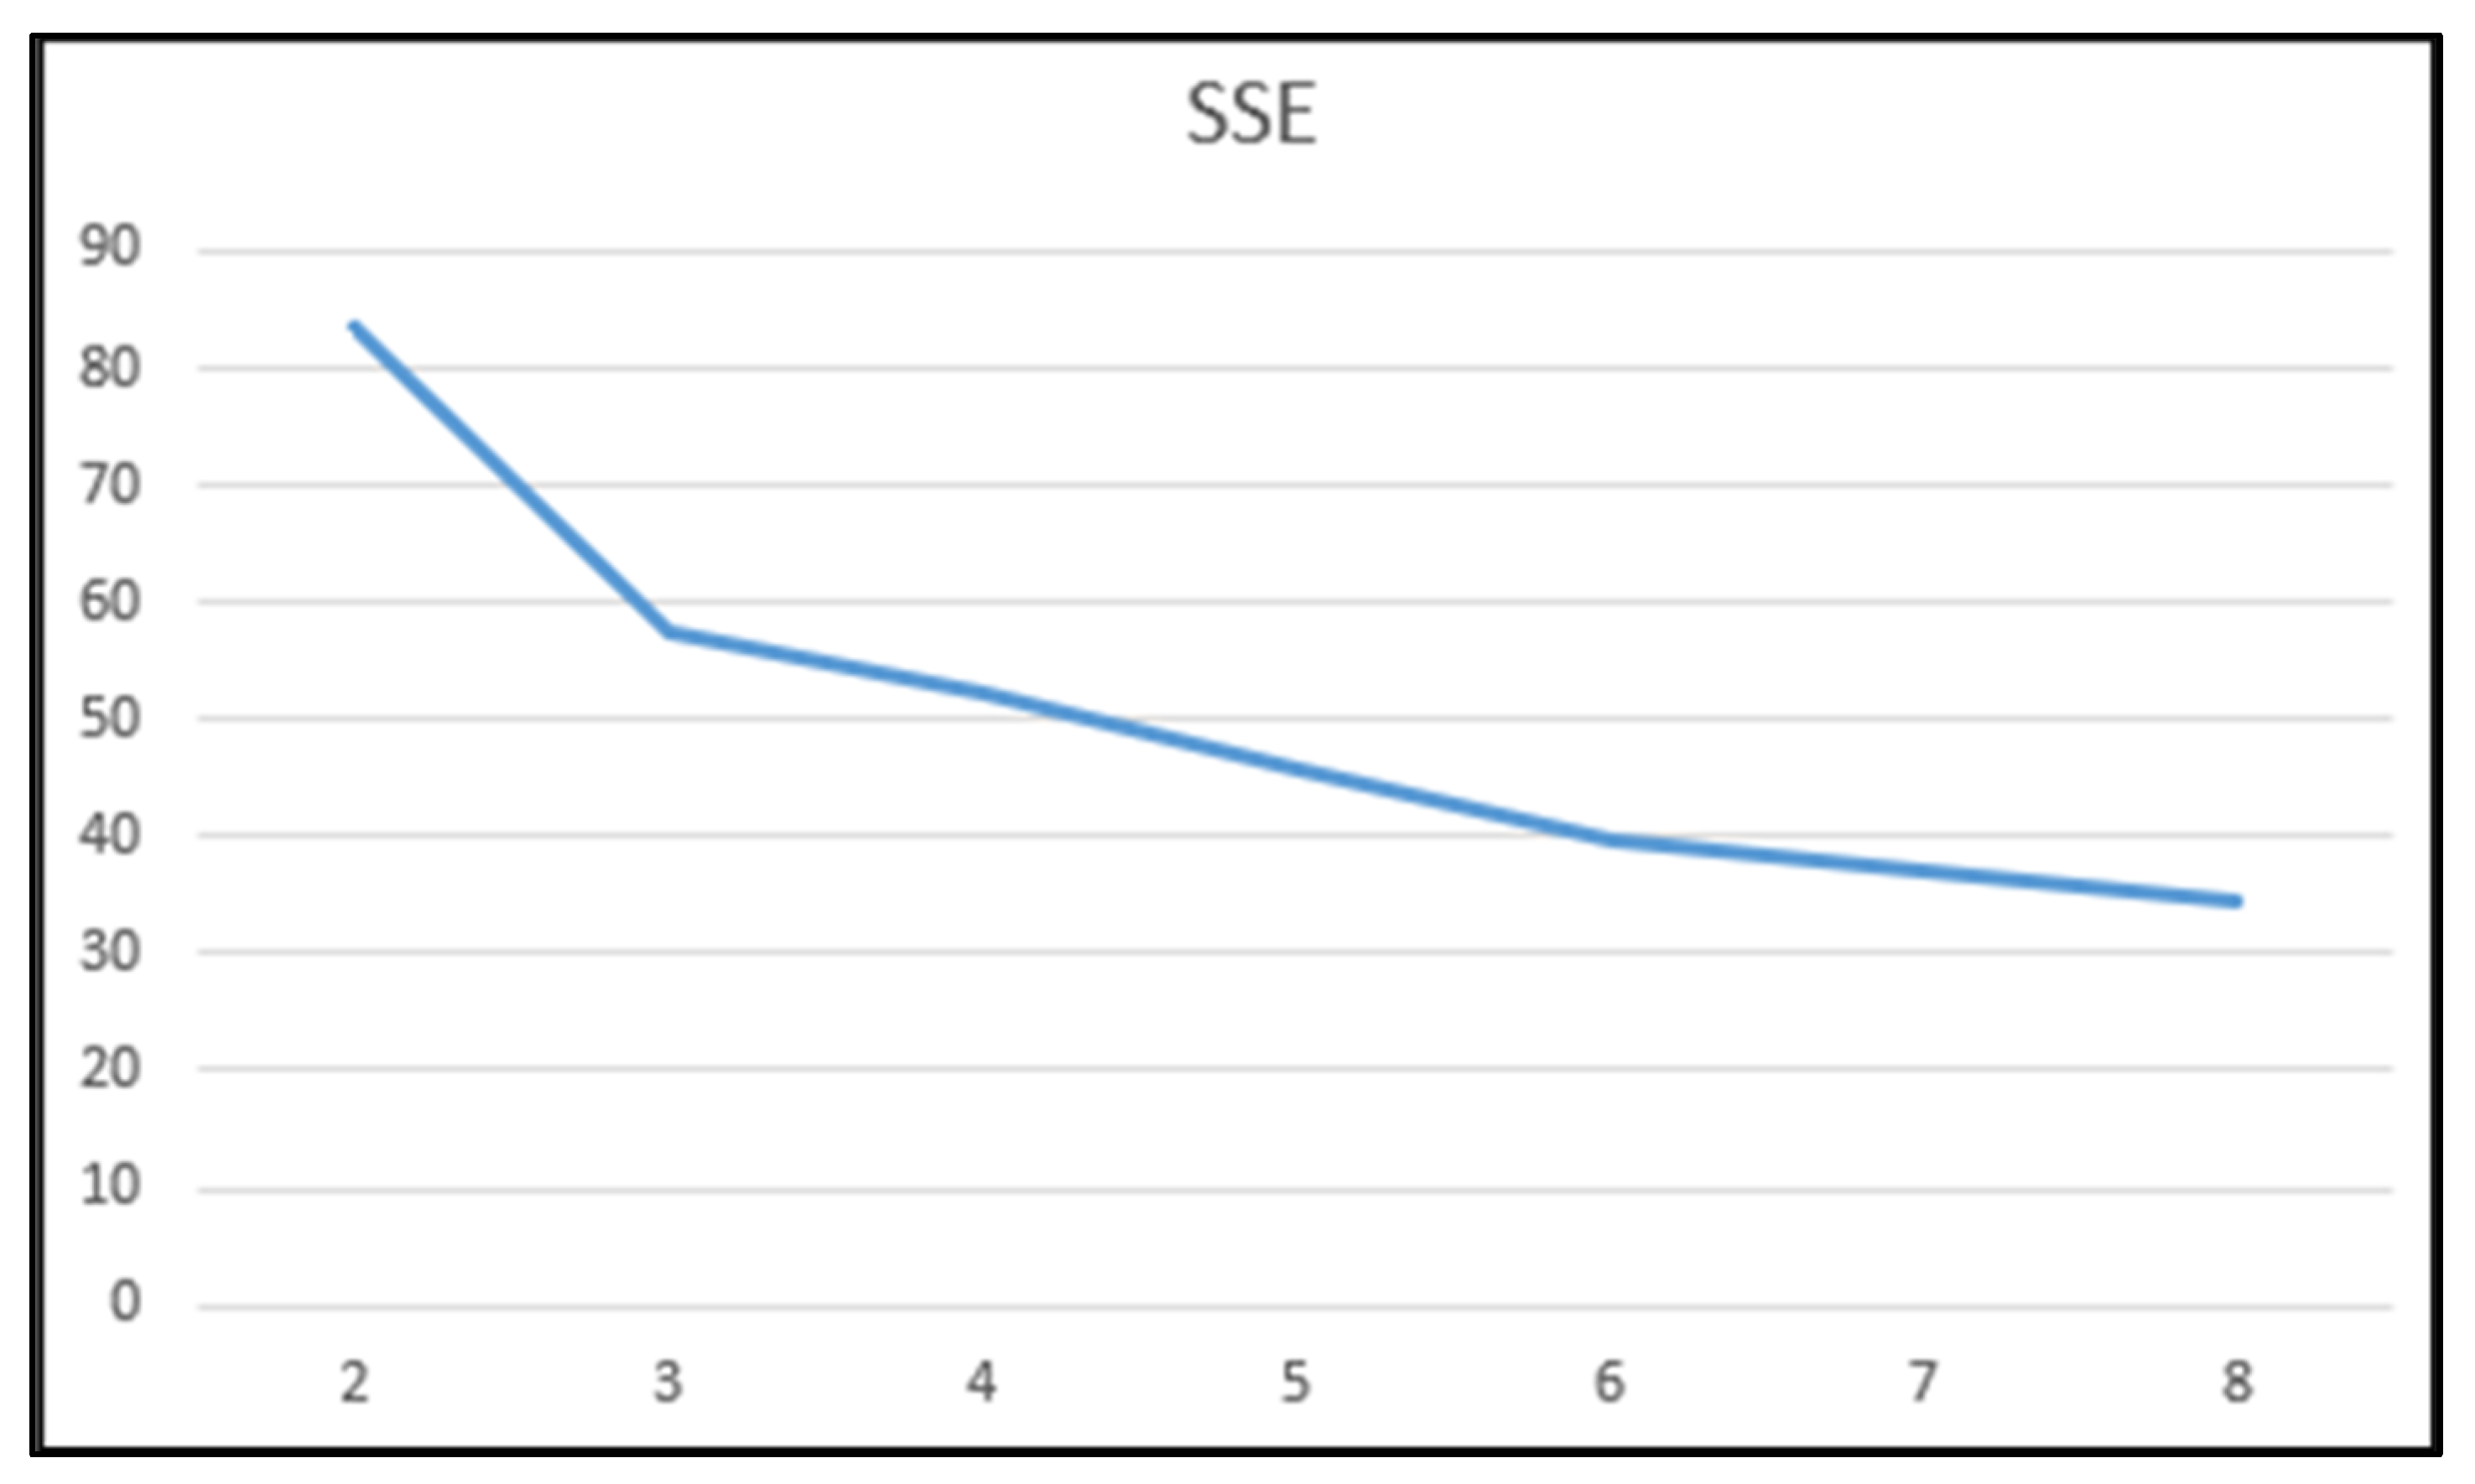
| K | 2 | 3 | 4 | 5 | 6 | 7 | 8 |
|---|---|---|---|---|---|---|---|
| SSE | 83.275802 | 57.619362 | 52.125689 | 45.686388 | 39.778818 | 36.945142 | 34.558358 |
| Clustering | |||
|---|---|---|---|
| 1 | 2 | 3 | |
| Z-score: fractal dimension | −1.35942 | 0.43210 | 0.25622 |
| Z-score: slope | 1.26056 | 0.24549 | −1.14809 |
| Z-score: altitude | −0.24554 | −0.76269 | 1.23095 |
| Effective | 14 | 31 | 22 |
| Invalid | 0 | 0 | 0 |
| Clustering | Error | F | Significance | |||
|---|---|---|---|---|---|---|
| MS | DF | MS | DF | |||
| Z-score: fractal dimension | 16.552 | 2 | 0.514 | 64 | 32.204 | <0.001 |
| Z-score: slope | 26.557 | 2 | 0.201 | 64 | 131.887 | <0.001 |
| Z-score: altitude | 26.106 | 2 | 0.215 | 64 | 121.179 | <0.001 |
| Abbreviation | Full Term or Meaning | Unit/Description |
|---|---|---|
| MGWR | Multiscale Geographically Weighted Regression | A regression model for multiscale analysis |
| GIS | Geographic Information System | A system for geographic data analysis |
| SPSS | Statistical Package for the Social Sciences | Statistical analysis software |
| SSE | Sum of Squared Errors | Used in clustering and regression |
| AIC | Akaike Information Criterion | A model selection criterion |
| GTWR | Geographically and Temporally Weighted Regression | A regression model considering spatial and temporal effects |
| D | Fractal dimension | Indicates spatial filling and complexity |
| N(r) | Number of non-empty boxes | A variable in fractal dimension calculations |
| r | Box side length | Unit length |
| X1 | Ratio of flat terrain | Proportion of areas with 0–5° slope |
| X2 | Average elevation | Unit: meters |
| X3 | Ratio of south-facing slopes | Proportion of south-facing slope areas |
| β0 | Constant term in regression equation | - |
| βk | Regression coefficient for the k-th factor | - |
Disclaimer/Publisher’s Note: The statements, opinions and data contained in all publications are solely those of the individual author(s) and contributor(s) and not of MDPI and/or the editor(s). MDPI and/or the editor(s) disclaim responsibility for any injury to people or property resulting from any ideas, methods, instructions or products referred to in the content. |
© 2025 by the authors. Licensee MDPI, Basel, Switzerland. This article is an open access article distributed under the terms and conditions of the Creative Commons Attribution (CC BY) license (https://creativecommons.org/licenses/by/4.0/).
Share and Cite
Pei, S.; Wang, J.; Wang, W. The Impact of Terrain on the Planar Spatial Morphology of Mountain Settlements Studied Using Fractal Dimensions. Appl. Sci. 2025, 15, 3046. https://doi.org/10.3390/app15063046
Pei S, Wang J, Wang W. The Impact of Terrain on the Planar Spatial Morphology of Mountain Settlements Studied Using Fractal Dimensions. Applied Sciences. 2025; 15(6):3046. https://doi.org/10.3390/app15063046
Chicago/Turabian StylePei, Sihang, Jinping Wang, and Wei Wang. 2025. "The Impact of Terrain on the Planar Spatial Morphology of Mountain Settlements Studied Using Fractal Dimensions" Applied Sciences 15, no. 6: 3046. https://doi.org/10.3390/app15063046
APA StylePei, S., Wang, J., & Wang, W. (2025). The Impact of Terrain on the Planar Spatial Morphology of Mountain Settlements Studied Using Fractal Dimensions. Applied Sciences, 15(6), 3046. https://doi.org/10.3390/app15063046