Article

Sow and Piglet Behavior Characterization Using Visual Observation, Sensor Detection, and Video Recording

1
Department of Agricultural and Biological Engineering, Purdue University, West Lafayette, IN 47907, USA
2
Department of Animal Science, North Carolina A&T State University, Greensboro, NC 27411, USA
3
Department of Animal Sciences, Purdue University, West Lafayette, IN 47907, USA
4
USDA-ARS Livestock Behavior Research Unit, West Lafayette, IN 47907, USA
*
Author to whom correspondence should be addressed.
Current address: Division of Animal Sciences, University of Missouri, Columbia, MO 65201, USA.
Appl. Sci. 2025, 15(6), 3018; https://doi.org/10.3390/app15063018
Submission received: 12 February 2025 / Revised: 2 March 2025 / Accepted: 7 March 2025 / Published: 11 March 2025
(This article belongs to the Special Issue Engineering of Smart Agriculture—2nd Edition)

Abstract

:
Animal behaviors are key signs of animals’ stress, disease, and overall well-being. This study was conducted in an experimental farrowing building using eighteen sow pens: nine exposed to natural heat stress under summer indoor temperatures and nine receiving cooling treatments via innovative cooling pads. Sow and piglet behaviors were recorded in an ethogram through direct visual observation every 5 min for 48 h. Passive infrared detectors were used for continuous pig behavior monitoring every sec. Zmodo wireless cameras were used for video monitoring to validate sensor detection results. Visual observation revealed distinct pig behaviors between the treatments. The sows had peak times in eating, standing, and drinking approximately from 05:00 to 12:00 and from 16:00 to 22:00. The sows under heat stress spent 49.3% more time lying (p < 0.01). They spent 10.7% less time sleeping (p < 0.05). Piglets under heat stress spent more time sleeping but less time nursing. The sensor outputs and pig moving behaviors (i.e., sow eating + standing + drinking + sitting + piglet walking) had a strong positive correlation (ρ = 0.81 for heat stress and ρ = 0.74 for cooling). In contrast, there were strong-to-moderate negative correlations (ρ = −0.77 for heat stress and ρ = −0.56 for cooling) between the sensor outputs and sow on-body behaviors (i.e., sow lying + nursing + sleeping). Video recordings validated the response and sensitivity of the sensors, with them able to quickly capture changes in pig behaviors and provide behavioral information about the nuanced pig movements.

1. Introduction

The world population continues to grow and could reach around 8.5 billion by 2030 and 9.7 billion by 2050 [1]. The growing population increases food demand, which in turn boosts food animal production. A recent study [2] estimated that global meat production grew to 347 Mt in 2022. Worldwide poultry, pork, beef, and sheep meat consumption is projected to grow by 15%, 11%, 10%, and 15%, respectively, by 2032. Research on food animal welfare examines the safety, health, productivity, and behaviors of animals [3]. Heat stress conditions in summer reduce pig productivity [4], and in utero heat stress reduces piglet birth weight, body weight gain, and reproduction efficiency [5]. Animal activity is a direct indicator of animal welfare. Activity level and changes in certain behaviors are key signs of stress, disease, and overall welfare [6]. For example, under heat stress conditions, sows exhibit decreased nursing activity [7].
Traditionally, animal activity was predominantly assessed by visual observation. However, animal operations have expanded in scale, and relying solely on visual observation has become impractical due to constraints in labor, time, and resources. Therefore, in addition to visual observations [8], different methods such as video recording [9], wearable sensor accelerometers [10], digitized image analysis [11], and carpet-type force measurement [12] have been tested in either commercial or research pig facilities. Direct visual observation can provide explicit and descriptive information of animal activity, offering a detailed understanding of animal behaviors and welfare [8,13]. It is simple and easy to apply and does not require special equipment. However, direct visual observation is time-consuming and labor-intensive; therefore, it cannot be performed continuously as with electronic sensors and videos.
A passive infrared detector (PID) sensor (referred to as “sensor” below) can detect animal activity. It is a relatively low-cost and effective monitoring technology. The sensor was first reported for animal activity monitoring in 1994 [14]. Later, Pedersen and Pedersen [15] characterized the sensor by using a heated moving body to represent an animal. They found that the sensor output signal was proportional to the velocity and temperature of the moving body. Various studies have demonstrated the versatility of the sensor in animal production settings. In the National Air Emission Monitoring Study (NAEMS) project in the USA, the PID sensor was used in 38 commercial poultry, pig, and dairy buildings to continuously monitor animal activity for a period of two years [16]. This technology has also been studied in more recent applications. For example, it was characterized in 12 experimental growing–finishing pig rooms [17] and used to monitor piglets [18] and finishing pigs [19]. Previous studies on the sensor for animal activity monitoring have some limitations. Most of them focus on monitoring groups of animals rather than individual animal activities [15,19,20,21]. The only available study for individual sow activity monitoring was reported by Freson et al. [22], who used 58 sensors to detect sow estrus through increases in body movement. Additionally, only Besteiro et al. [18] has investigated the correlation between sensor signals and specific piglet activity, which were feeding (eating or drinking) and playing (walking, fighting, or playing) activities, captured by visual observation.
Video recording, when synchronized with sensor data, could help in analyzing sensor signals associated with specific pig activity. For example, Drexl et al. [21] used two sensors and a video camera to monitor the piglet rearing area and found strong correlations between the results from the sensors and the camera. However, visual observation, sensor detection, and video imaging have not been characterized concurrently to evaluate the characteristics of the three methods for pig behavior and welfare monitoring.
The objectives of this study are to (1) obtain insights into the different behaviors of sows and piglets in a farrowing building environment and (2) characterize three methods for monitoring sow and piglet behaviors in the building.

2. Materials and Methods

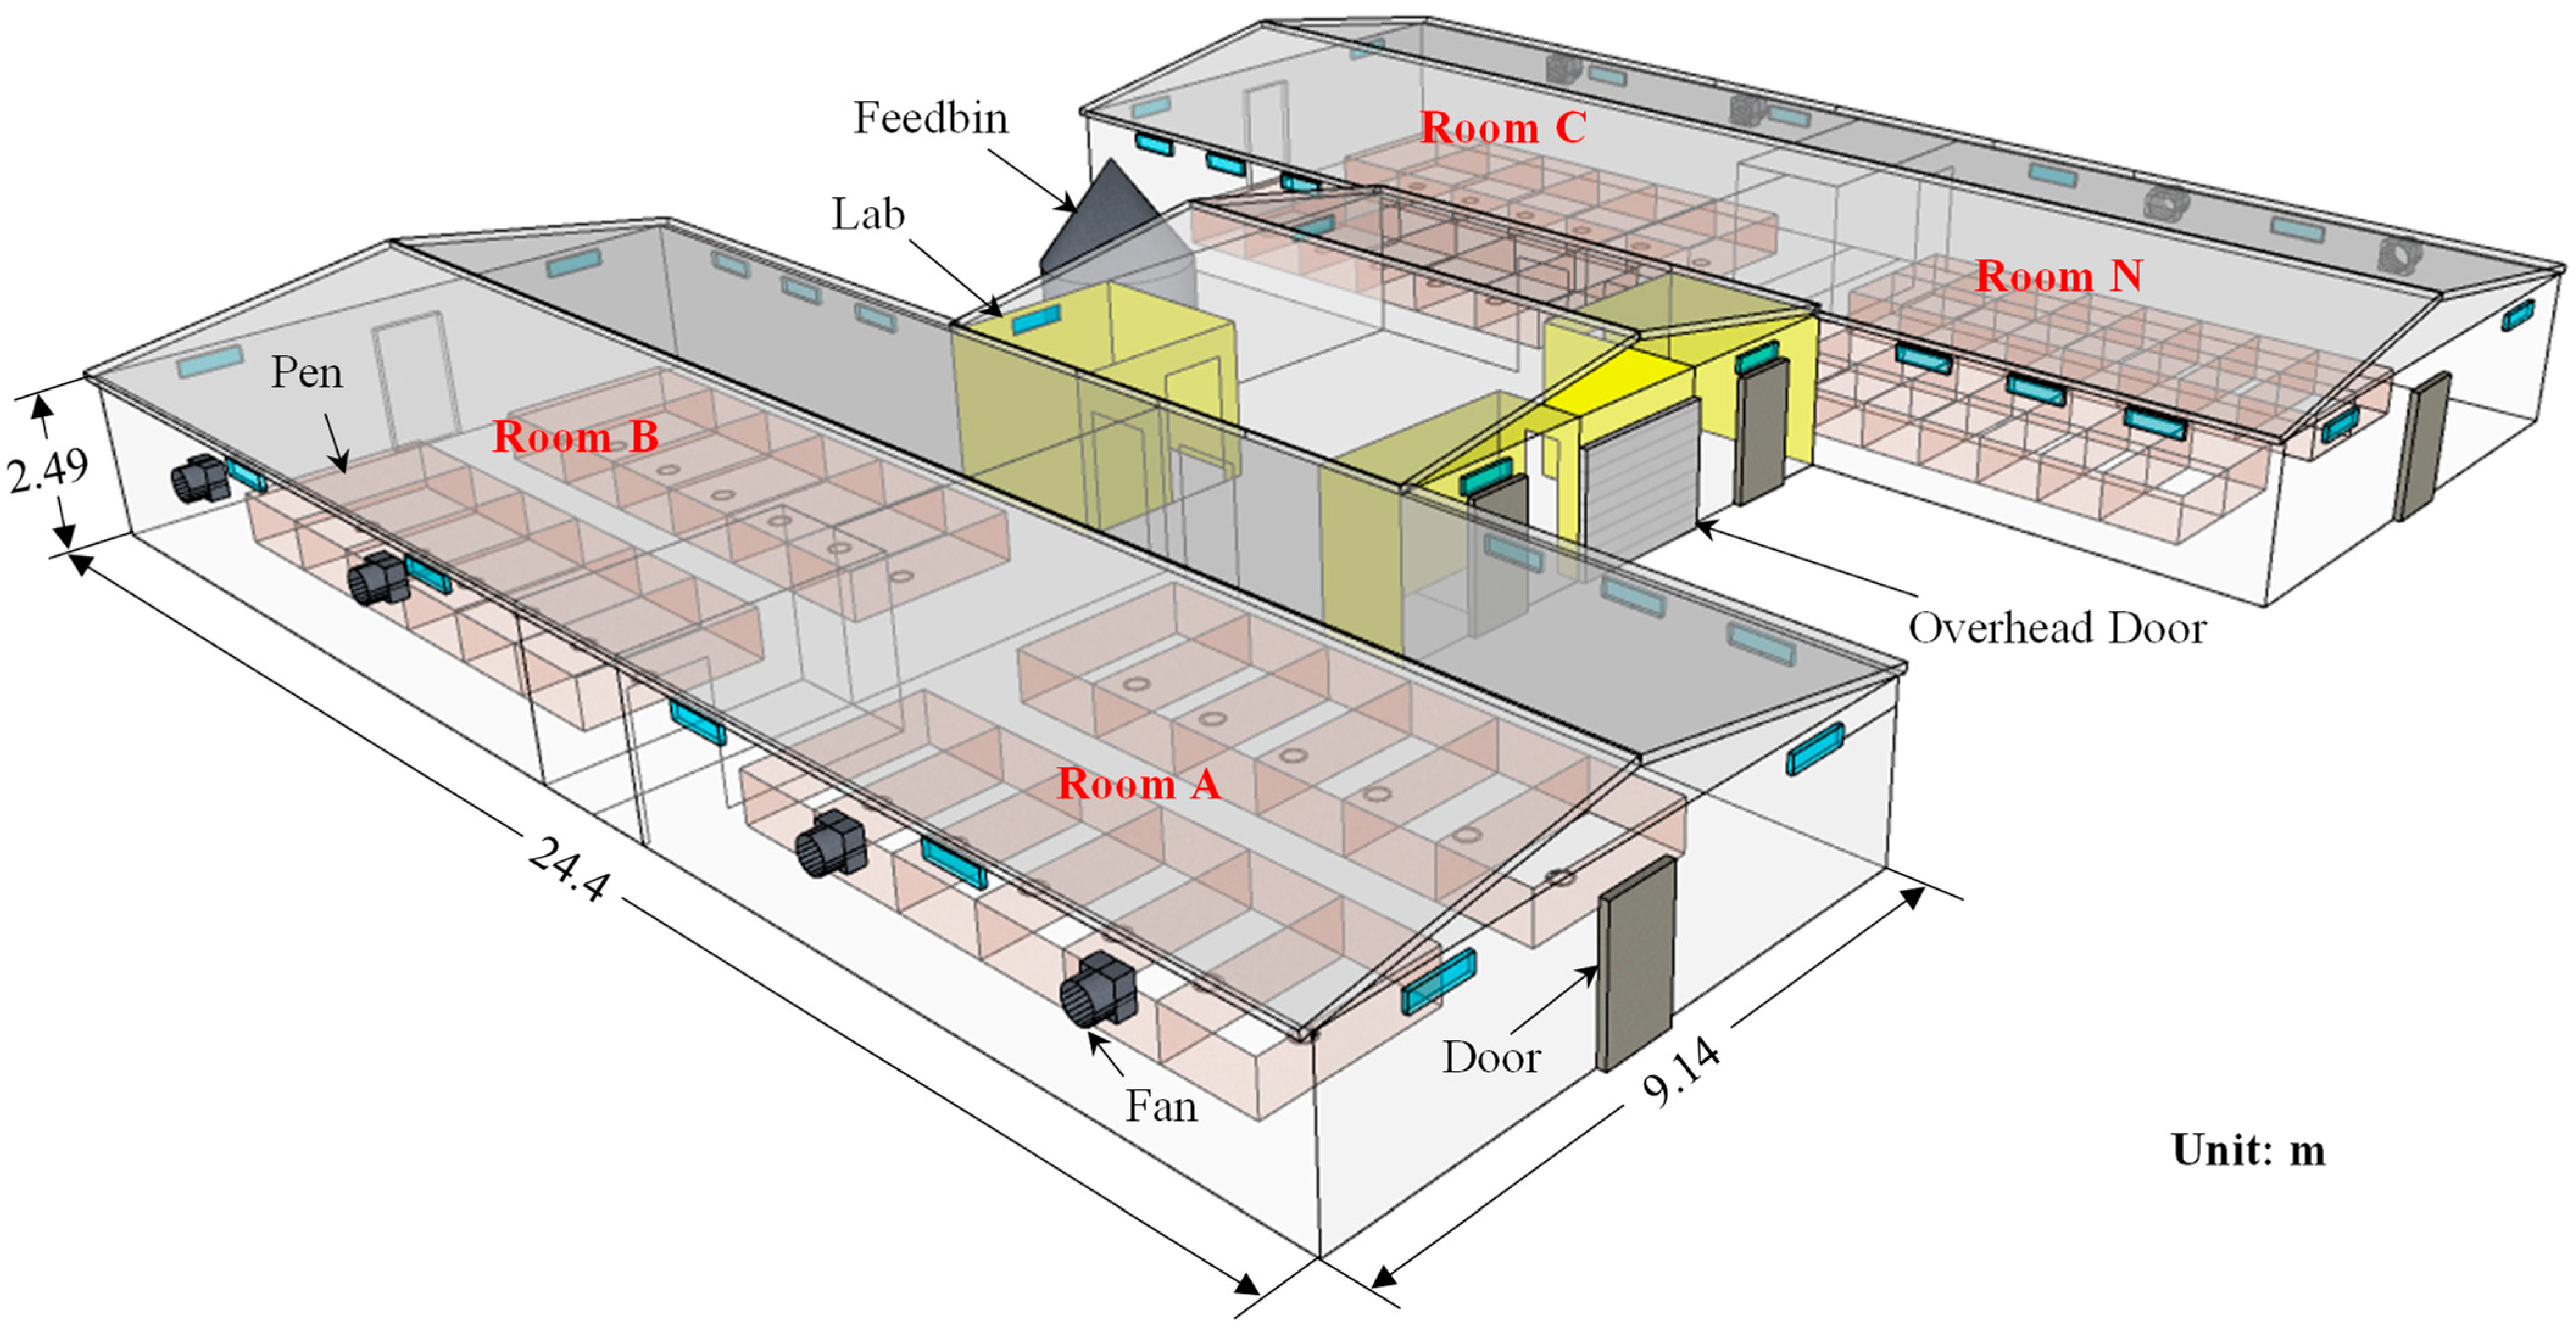
2.1. Pig Research Building

2.1.1. Layout and Ventilation of the Building

This study was conducted in a pig farrowing–nursery research building, situated at the Purdue University Animal Sciences Research and Education Center (ASREC), West Lafayette, Indiana, USA. This facility comprises three farrowing rooms (Rooms A, B, and C) and one nursery room (Figure 1). Each farrowing room is 12.2 m (L) × 9.1 m (W) × 2.5 m (H) and contains 12 farrowing pens, each measuring 2.6 m (L) × 1.5 m (W), with tribar metal flooring. Each room has one door leading outside and another connected to the center hallway. Rooms A and B are connected by a door and were used in this study.
Ventilation in each room is provided by two fans and controlled by a 4-stage ventilation controller (Model TC5-2V2SA, Automated Production, Duluth, GA, USA). One of the fans was a 41 cm diameter variable-speed fan (Model 5KCP39DGH, General Electric, Boston, MA, USA) for minimum ventilation and the other was a 56 cm diameter single-speed fan (Model 7-187960-01, GSI group Inc., Assumption, IL, USA) for additional ventilation. An air circulation fan was set up in both Room A and Room B, next to the door connecting the two rooms. The circulation fans were turned on during the summer.

2.1.2. Environment Monitoring

A comprehensive environment monitoring system for Rooms A, B, and C was installed in the building [23]. An on-site computer system (OSCS), consisting of data acquisition (DAQ) hardware, custom-developed software AirDAC (Version 4.5, Purdue University, West Lafayette, IN, USA), and a computer [16], was located in the laboratory (Figure 1). The DAQ setup included two modules for analog and digital input/output (Model USB-2416, Measurement Computing Co., Norton, MA, USA) and two modules of thermocouple input (Model USB-TC, Measurement Computing Co.).
The OSCS system was connected to more than 100 online sensors, including room relative humidity and temperature transmitters (Model IP65, Focket, Shenzhen, China) that were wall-mounted close to the variable-speed fan. Signals from all sensors were acquired at 1 Hz, converted to engineering units, and averaged over 15 s and 1 min intervals. The data were then saved in two separate files with respective timestamps. For quality assurance, real-time 2 h data histories of all measurement variables from AirDAC were displayed graphically on the computer monitor at 1 Hz resolution. These features were specifically designed for animal housing environment monitoring. Remote access by the researchers for real-time monitoring and system control was enabled through the installation of commercial software, namely RemotePC software (Version 7.6, IDrive, Calabasas, CA, USA).

2.2. Heat Stress and Floor Cooling Study

Prior to beginning the heat stress and floor cooling experiment, research protocols using animals were reviewed and approved by Purdue University’s Institutional Animal Care and Use Committee (IACUC Protocol #2110002202). More details about the animal experiments are described in the study of Ogundare et al. [24].
This study on pig heat stress and cooling was conducted in June 2022 with first parity (n = 11) and second parity (n = 7) Large White–Landrace sows. All 18 sows and their piglets (13–14 per sow) were equally distributed between farrowing Rooms A and B. The room lights were turned on at 06:00 in the morning and turned off at 22:00 in the evening. During the dark phase from 22:00 to 06:00, a 250 W red light heat lamp (Savant Technologies LLC., Cleveland, OH, USA) in each pen remained on to maintain piglet temperatures.
The study was conducted over 48 h with predicted high temperatures and high relative humidity. During this period, all sows were exposed to natural room temperature and relative humidity conditions. The average room temperatures were 30.0 °C in Room A and 29.5 °C in Room B. They peaked at 33.7 °C in Room A and 33.3 °C in Room B during the daytime, and their minimum values were 26.1 °C in Room A and 25.5 °C in Room B during the nighttime. The average relative humidity was 68.8% in Room A (ranging from 54.7% to 81.4%) and 70.7% in Room B (ranging from 56.0% to 83.4%).
The sows were assigned to one of two treatments: natural heat stress under summer indoor temperatures (n = 9) and cooling with cooling pads (n = 9). The sows in five pens (# 3, 4, 8, 11, and 12) in Room A and four pens (#16, 19, 23, and 24) in Room B were assigned to the heat treatment. The sows under cooling treatment had electronic cooling pads (Innovative Heating Technologies; Oak Bluff, MB, Canada) installed on the pen floor. The pad facilitated conductive cooling by flushing cool water when one of the three internal temperature sensors reached 26 °C. More information about the cooling pad is provided in the study of Johnson et al. [25]. The sows in four pens (#1, 2, 5, and 9) in Room A and five pens (#13, 17, 18, 21, and 22) in Room B were on cooling treatment.

2.3. Pig Behavior Monitoring

2.3.1. Visual Behavior Observation

The sows and piglets were visually observed at 5 min intervals for a consecutive 48 h period in all 18 pens, starting from 06:00 on June 14 and ending at 05:55 on June 16, 2022. Seven sow behaviors and three piglet behaviors (Table 1) were recorded in an ethogram every 5 min by research assistants. A score of either “1” (positive) or “0” (negative) was assigned to each of the behaviors every 5 min. The research assistants minimized disturbance to the animals during the observations.
It is notable that sows were recorded as nursing when all-to-most piglets were actively on the teats (nutritive suckling) as opposed to non-nutritive suckling with only one or two piglet(s) suckling a sow. However, if any piglet was suckling (nutritive or non-nutritive), this was assigned as positive for the piglets’ nursing in the pen.
Among the seven sow behaviors, it was possible for two or three simultaneous behaviors to be recorded, e.g., standing and eating could both be recorded as positive during the same observation and so could sow lying, nursing, and sleeping (Table 1). For the three piglet behaviors, any two- or three-behavior combinations during the same observation period could be positive. The comprehensive 48 h visual observations period generated 576 records, with an average of 573.8 records per behavior due to a small number of missed observations (maximum of 4 missing records in one behavior), which were left as blanks during data analysis.

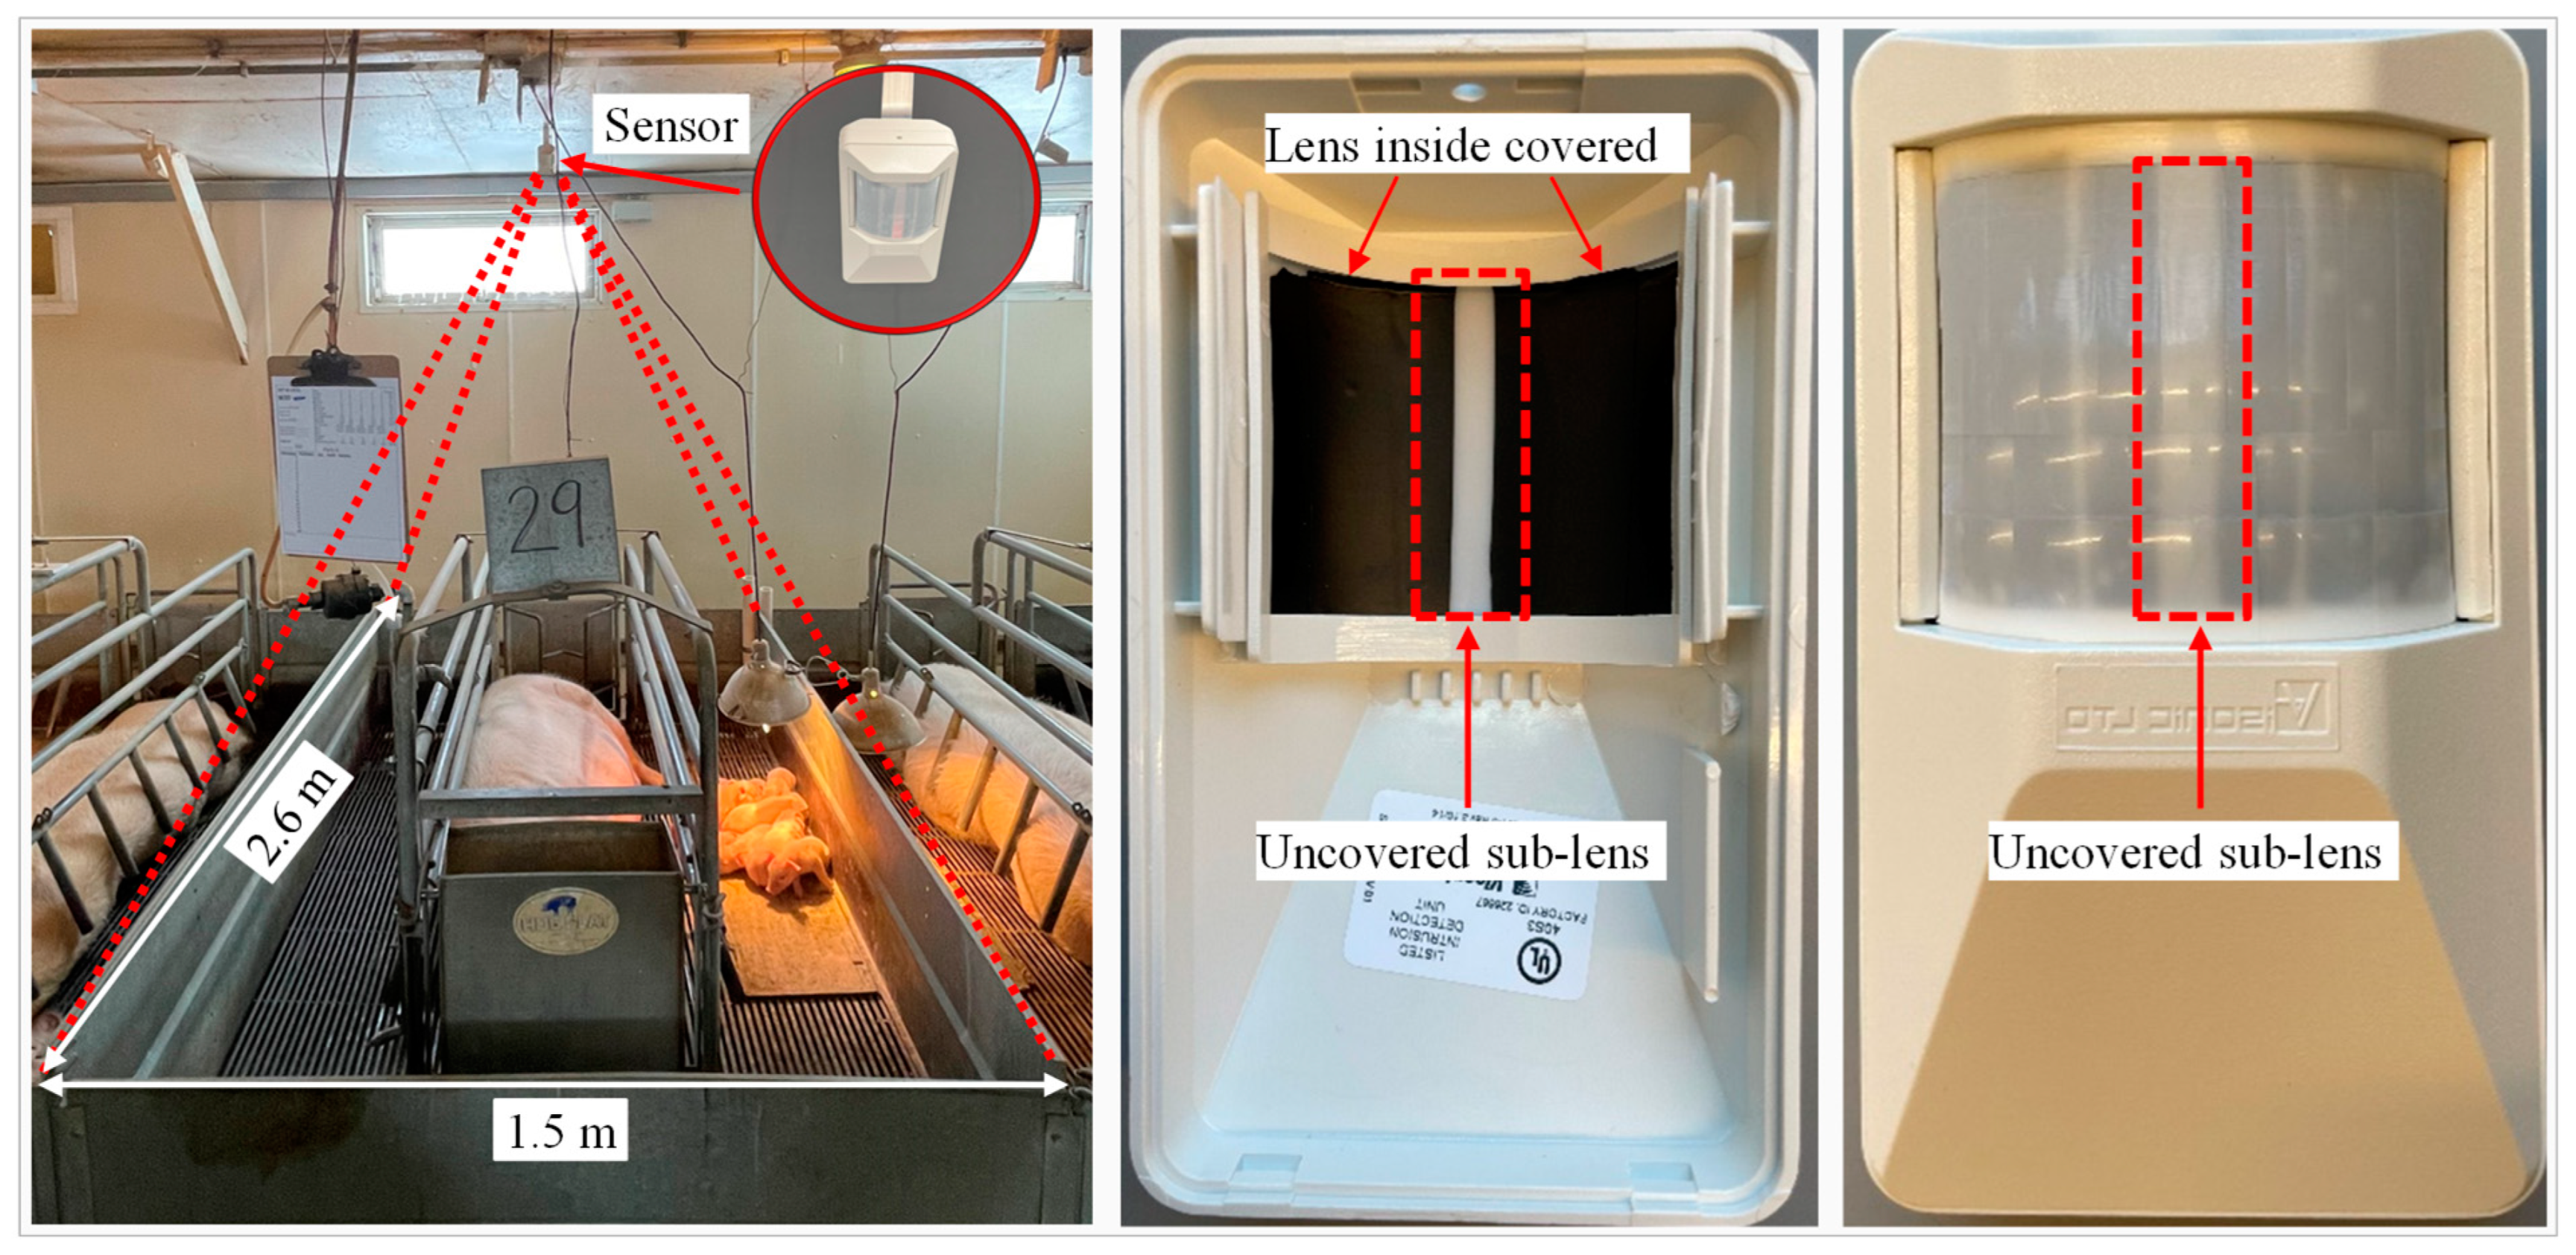
2.3.2. Sensor Activity Detection

Sow and piglet activities within each pen were monitored using an SRN-2000 PIR Detector (Visonic Inc., Bloomfield, CT, USA). The sensor has a maximum detection coverage of 18 m (L) × 18 m (W) at a 90° horizontal angle. It is the only commercially available PID sensor that provides analog output signals, which range from 0 to 4 VDC with an offset at 2 VDC. The sensor analog output signals were acquired and processed by the OSCS [17].
The sensor lens consists of 36 sub-lenses or beams and covers a 90 ° wide angle. To restrict the sensor detection range (length and width) to the dimension of a single pen of 2.6 m (L) × 1.5 m (W), the sensor was strategically mounted on the ceiling (2.2 m above the floor) at the sow’s tail-end in each pen and tilted downward at 50°. This setup constrained the sensor detection length to 2.6 m (Figure 2).
The mounting angle was calculated based on the specifications in the sensor manual. To further refine the detection width to match the pen width of 1.5 m, the sensor lens was partially obscured with black tape, leaving only a 0.6 cm wide center sub-lens exposed. This configuration was tested in a laboratory setting to ensure accuracy in matching the pen dimensions.

2.3.3. Video Monitoring

Following the heat stress and cooling experiment, wireless indoor video security cameras (Model ZM-SH75D001-WA, Zmodo Technology, Shenzhen, China) were installed in each farrowing room for another study. These cameras, integrated with Zviewer software (version 2.0.1.6) on the OSCS computer, facilitated real-time video surveillance and recording. The video data, timestamped in alignment with other online sensor data, provided an additional layer of observation for assessing sow and piglet behaviors in conjunction with sensor detection signals. This integrated and multifaceted approach enabled a comprehensive analysis of the monitored behaviors, enhancing the depth of the study’s findings.

2.4. Data Processing and Analysis

2.4.1. Processing and Analysis of Observational and Environmental Data

The observational data collected over 48 h were merged based on the time they were recorded, creating a consolidated “2-in-1” dataset. This approach involved combining observation results from the same time points (e.g., 07:00) on both days. Consequently, two observation scores were obtained for each behavior within each pen during the 5 min observations spanning a 24 h period. The highest score recorded for each behavior in the nine-pen treatment (either heat stress or cooling) at a specific time of observation (e.g., at 07:00) was then doubled, resulting in a maximum possible score of 18. This method of combining data increased the number of available samples during a 24 h period and enhanced the robustness of circadian rhythm analysis. The two days of temperature and relative humidity data were merged in the same way as the visual observation data. All subsequent data processing and statistical analyses were conducted using this “2-in-1” dataset.
For data analysis, seven new behaviors, which were combinations of selected sow and piglet individual behaviors within each pen, were defined and used. These combined behaviors included sow on-feet that aggregated the sow activities of eating, standing, drinking, and sitting [Equation (1)]. Sow on-body encompassed the lying, nursing, and sleeping behaviors of sows [Equation (2)]. Piglet moving combined the behaviors of nursing and walking of piglets [Equation (3)]. Pig moving represented a combination of sow on-feet and piglet walking [Equation (4)].
Sow on-feet = eating + standing + drinking + sitting
Sow on-body = lying + nursing + sleeping
Piglet moving = lying + nursing + sleeping
Pig moving = sow on-feet + piglet walking
Three other combined behaviors, i.e., “pig moving and lying”, “sow on-feet and lying”, and “sow and piglet sleeping”, were also defined and quantified as their descriptions suggest. The score for any combined behavior during a 5 min observation period is the sum of the scores for the individual behaviors it comprises. This allows for a score greater than 1 for each pen.
The 10 visually observed behaviors of sows and piglets (Table 1) were analyzed to determine their circadian rhythms and temporal distributions. Individual behaviors were also examined for the differences between the two treatment groups. Furthermore, analyses were conducted to investigate correlations between the combined behaviors and sensor detection data to enrich our understanding of behavioral patterns and their implications.

2.4.2. Processing and Analysis of Sensor Data

The sensor output data collected from 06:00 on June 14 to 06:00 on June 16, 2022, saved in the 15 s and 1 min data files, were normalized using the Min–Max normalization technique. This process, aimed at reducing sensitivity discrepancies among the sensors, applies a linear transformation to the original dataset. For every sensor, the 15 s and 1 min data were adjusted by subtracting the minimum signal value and dividing by the range of the maximum and minimum values [Equation (5)].
x n o r m = x x m i n x m a x x m i n
where xnorm is the normalized sensor output; xmin is the minimum output value of the sensor; and xmax is the maximum output value of the sensor.
Following normalization, the sensor data over the 48 h period were averaged at 5 min intervals, beginning at 06:00 on June 14. The initiation times for each 5 min observational dataset and the corresponding timestamps from the sensor data were aligned and recorded in an MS Excel spreadsheet. This facilitated a side-by-side comparison and analysis of sensor detection and visual observation data.
Further analysis of the sensor detection data was conducted to explore variations in sensor outputs. Real-time outputs at 1 Hz were examined to present sensor responses. In addition, the 15 s interval data were analyzed to reveal variations in pig activity at different pen locations within the room, such as those near the door, wall fans, and air circulation fans.

2.4.3. Comparison of Video Recording and Sensor Detection

The data analysis also included a comparison of video recordings with the 15 s sensor data to evaluate sensor responses to pig behaviors within the 5 min observational windows, most of which were not captured by the visual observation data. The video files, saved in “.264” format files with Zviewer, were reviewed using Zplayer. Video clips featuring transitions in sow behaviors (e.g., from lying to standing), totaling 240 min, were selected. The 15 s sensor data corresponding to the times and pens featured in these selected video clips were visualized through time-series graphs. This approach enabled a synchronized review of pig activities in the video recordings against the sensor outputs in the graphs, providing a comprehensive evaluation of the observed behaviors.

3. Results

3.1. Three Different Pig Behavior Monitoring Methods

Each of the three methods employed in this study presented its own set of advantages and limitations, as summarized in Table 2. Visual observation has immediate applicability and clarity in distinguishing between different behaviors. This method enables the accurate capture of specific behaviors from sows and piglets, without the need for complex equipment.
Sensor detection, on the other hand, brings the benefits of automation and high-resolution data collection. It provides a distinct advantage over visual observation by capturing nuanced data points continuously over time, thus allowing for a more detailed analysis of behavior patterns.
Video recording delivers comprehensive and dynamic visual data, capturing in-depth information. While the current study required manual interpretation of the video data, advancements in artificial intelligence, as suggested by some recent studies, e.g., [26], hold promising potential for automating the analysis of sow and piglet behaviors. This technological progress could substantially enhance the efficiency and accuracy of behavior monitoring in future studies.

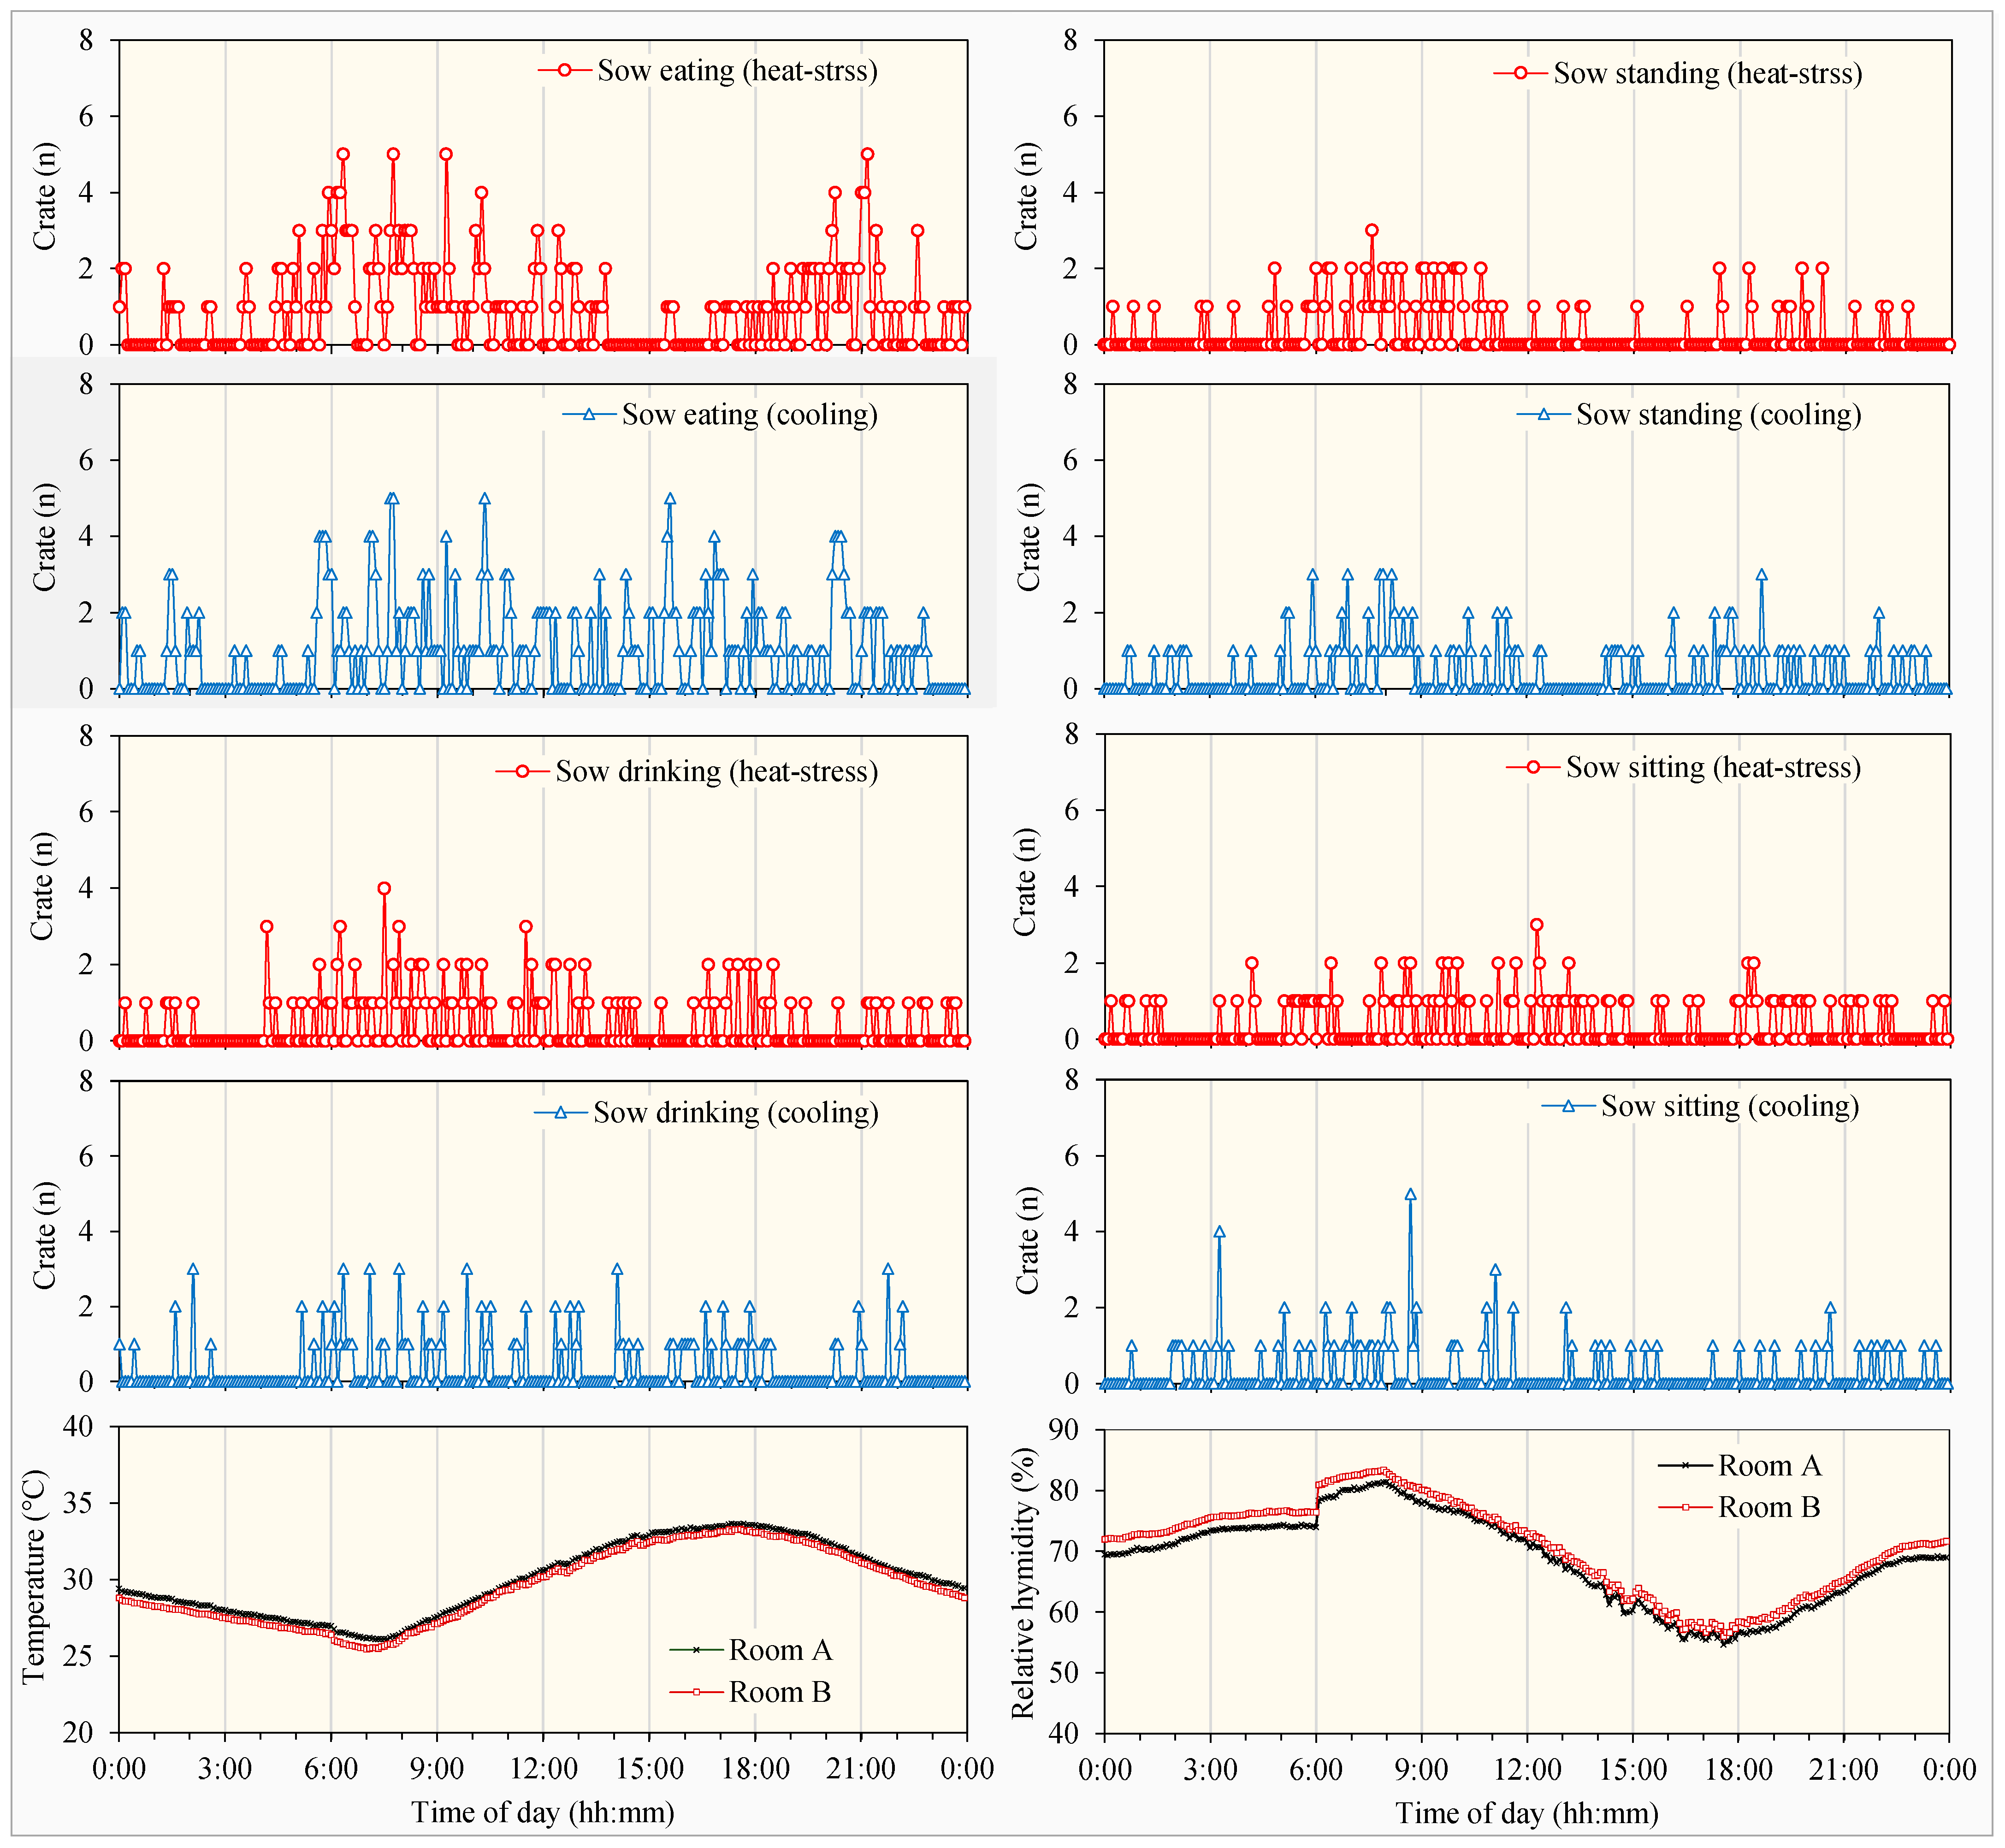
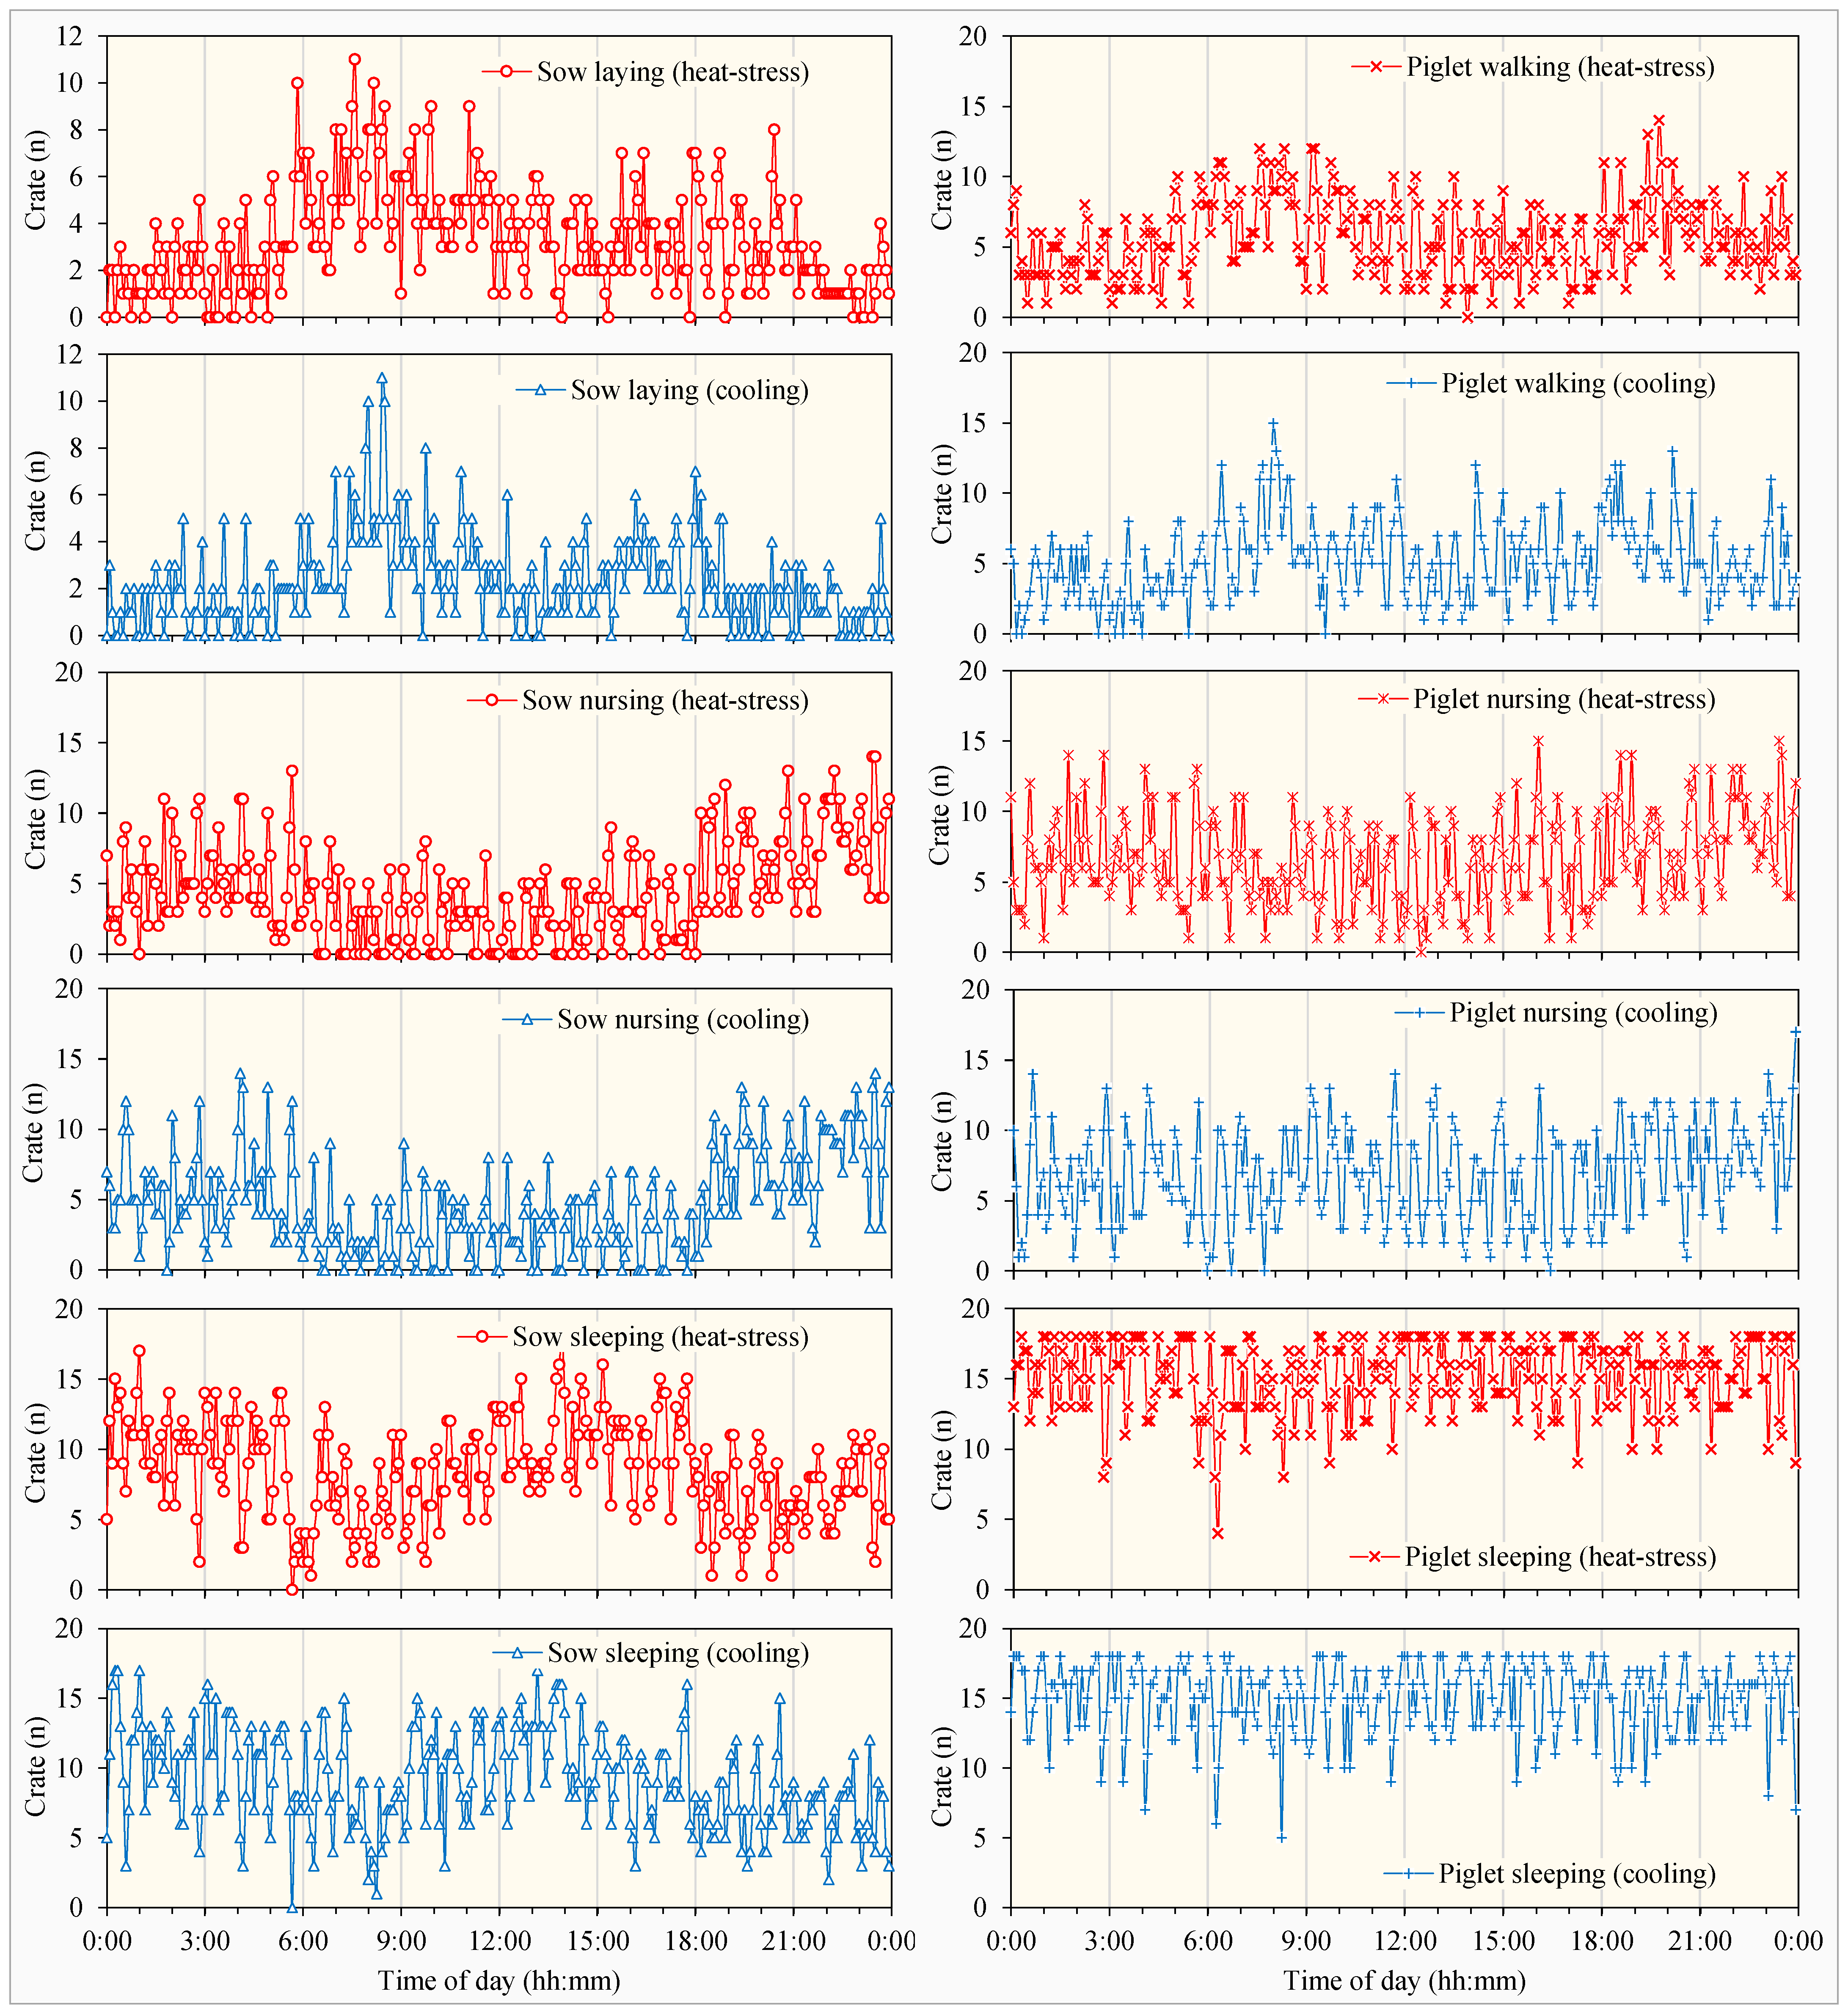
3.2. Pig Behaviors from Direct Visual Observation

3.2.1. Circadian Rhythms in Pig Behaviors

Sows and piglets showed more variation in their circadian rhythms in some behaviors compared with others. Additionally, their active times for different behaviors varied throughout the 24 h period (Figure 3 and Figure 4). The sows showed two distinct periods of activity during the day and night, specifically for eating, standing, and drinking. These active periods typically occurred from early morning (around 05:00) to noon and from late afternoon (approximately 16:00) to 22:00 at night. However, the eating behavior of sows under cooling conditions did not display as pronounced a pattern as that of the heat stress-treated sows. Sows under natural heat stress showed less eating behavior from 13:00 to 17:00 but had more eating behavior from 21:00 to 23:00 than those under cooling treatment. Among the four observed behaviors of sows on-feet, only the sitting times were distributed quite evenly over the 24 h period.
Regarding the sow on-body behaviors, lying times were predominantly in the morning from about 06:00 to noon and in the afternoon approximately from 15:00 to 21:00, with fewer sows lying in the afternoon. The sows tended to nurse more from around 18:00 in the evening to about 6:00 in the morning the next day. Sleeping times for the sows were mainly from late night around 21:00 to early morning around 05:00, with a peak number of sows sleeping in the afternoon between 13:00 and 14:00.
The study revealed interesting correlations between the piglet walking times and the sow lying time, evidenced by moderate correlation coefficients (ρ) of 0.425 and 0.416 for the heat stress and cooling treatments, respectively. A strong positive correlation was observed between piglet nursing times and sow nursing times, with ρ = 0.853 for the heat stress and ρ = 0.671 for the cooling treatments. These correlations likely reflect the close bond between sows and their piglets. It was also noted that piglet sleeping times were more uniformly distributed throughout the day, except for their walking periods.

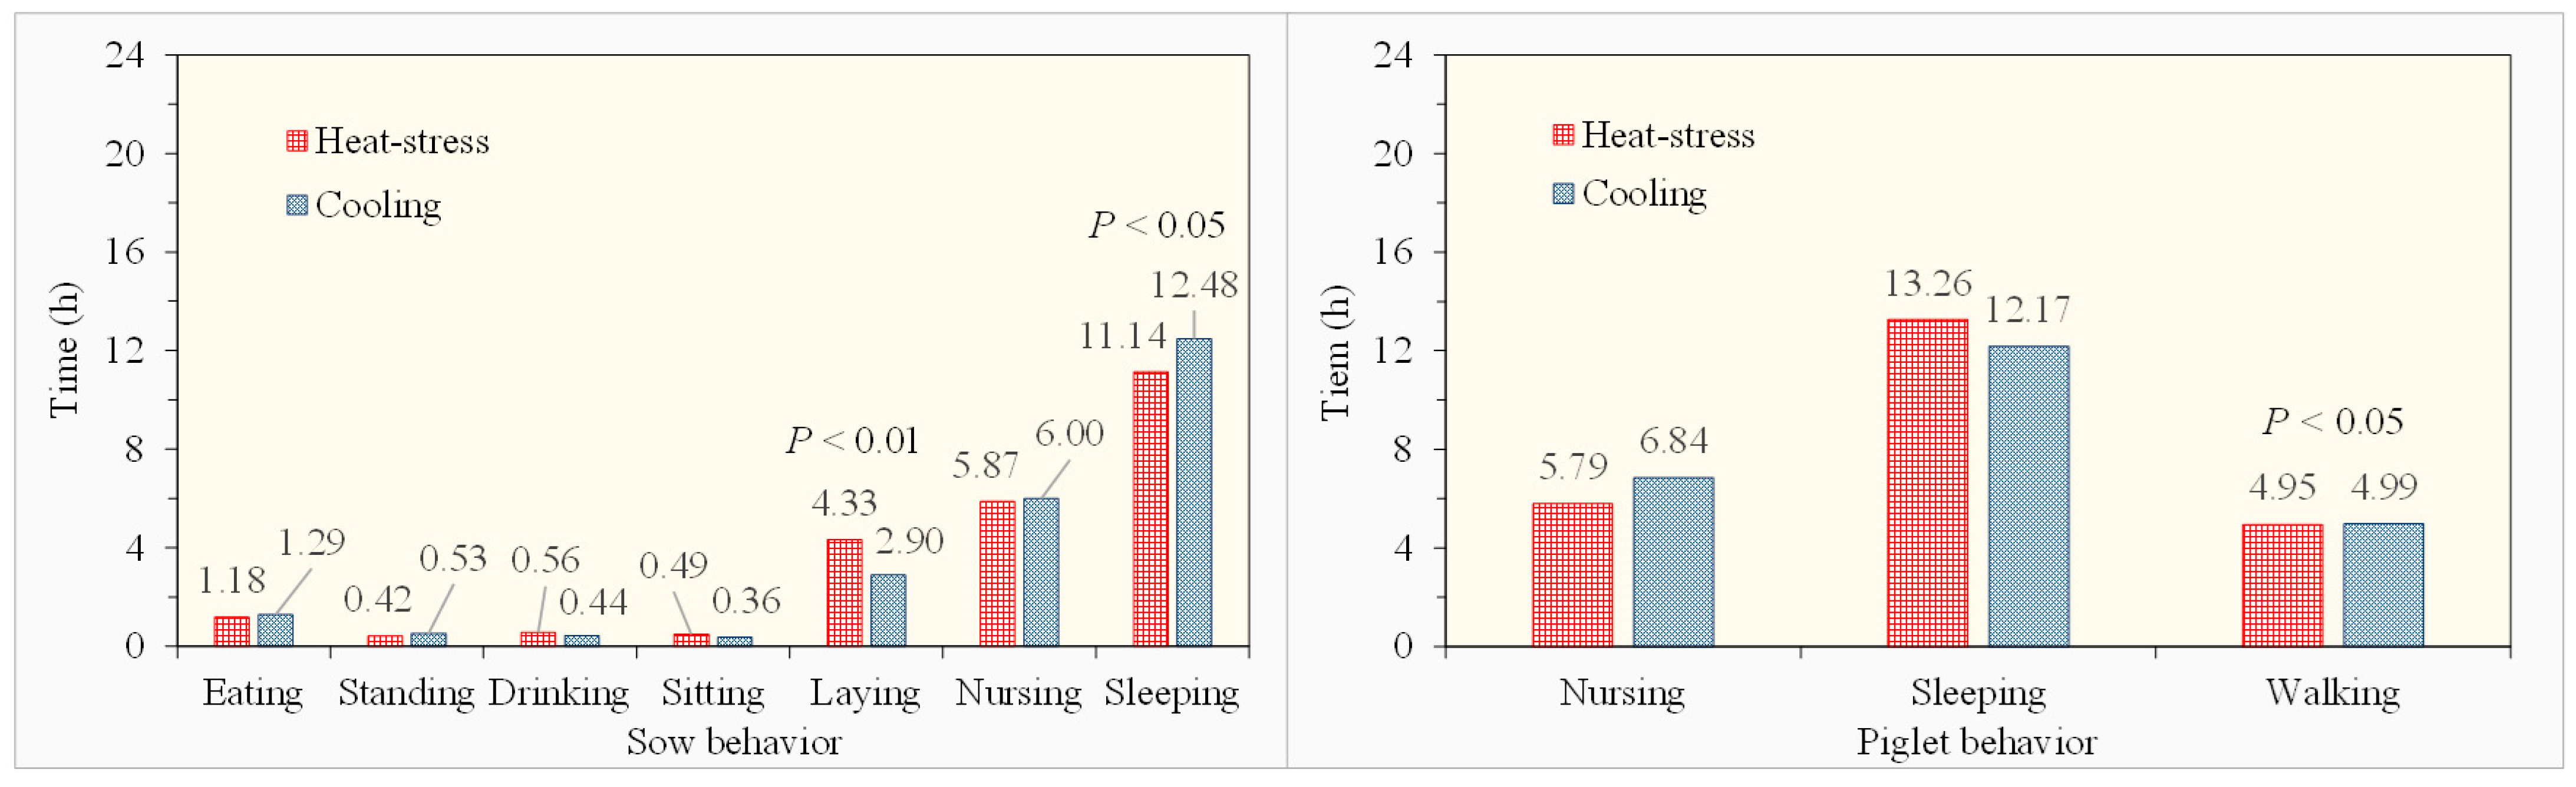
3.2.2. Behavioral Differences in Pigs Under Heat Stress and Cooling Treatments

Upon analyzing the observation data, distinct differences were observed in the behaviors of sows subjected to heat stress and cooling treatments. There were substantial variations in circadian activity patterns in sow and piglet behaviors.
The sows under heat stress spent significantly more time lying down (p < 0.01), with an additional 1.43 h or 49.3% time (Figure 5, left), predominantly from 06:00 to 18:00 (Figure 4). While not statistically significant (p > 0.05), these sows were observed to spend 0.12 h (27.4% time) more on drinking (Figure 5, left), especially during daylight hours from 06:00 to 18:00 (Figure 3). The frequency of sows sitting in the morning (6:00–12:00) was similar across treatments, yet heat-stressed sows sat for an additional 0.13 h (36.1% more) over the entire 24-h period (Figure 5, left).
Conversely, these sows slept 1.34 h less (a 10.7% decrease, p < 0.05, Figure 5, left), mainly before 09:00 (Figure 4), and spent 0.11 h less time (5.8%) eating than those under the cooling treatment (Figure 5, left), particularly during the afternoon hours of 13:00–18:00 (Figure 3). They also spent slightly less time on standing and nursing.
Piglets raised by sows under heat stress and cooling treatments also displayed distinct behaviors (Figure 5, right). Those with heat-stressed sows engaged in nursing for 1.05 h less (a decrease of 17.3%) and slept for 1.09 h more (an increase of 9.0%) compared with piglets of sows under cooling conditions. These differences in piglet nursing and sleeping, however, were not statistically significant (p > 0.05). Although both groups of piglets walked for approximately the same duration (~5 h), a t-test revealed a significant difference (p < 0.05) between them. This significance likely resulted from the varied distributions of walking times throughout the 24 h period observed in each group.

3.3. Pig Behaviors as Detected by Sensors

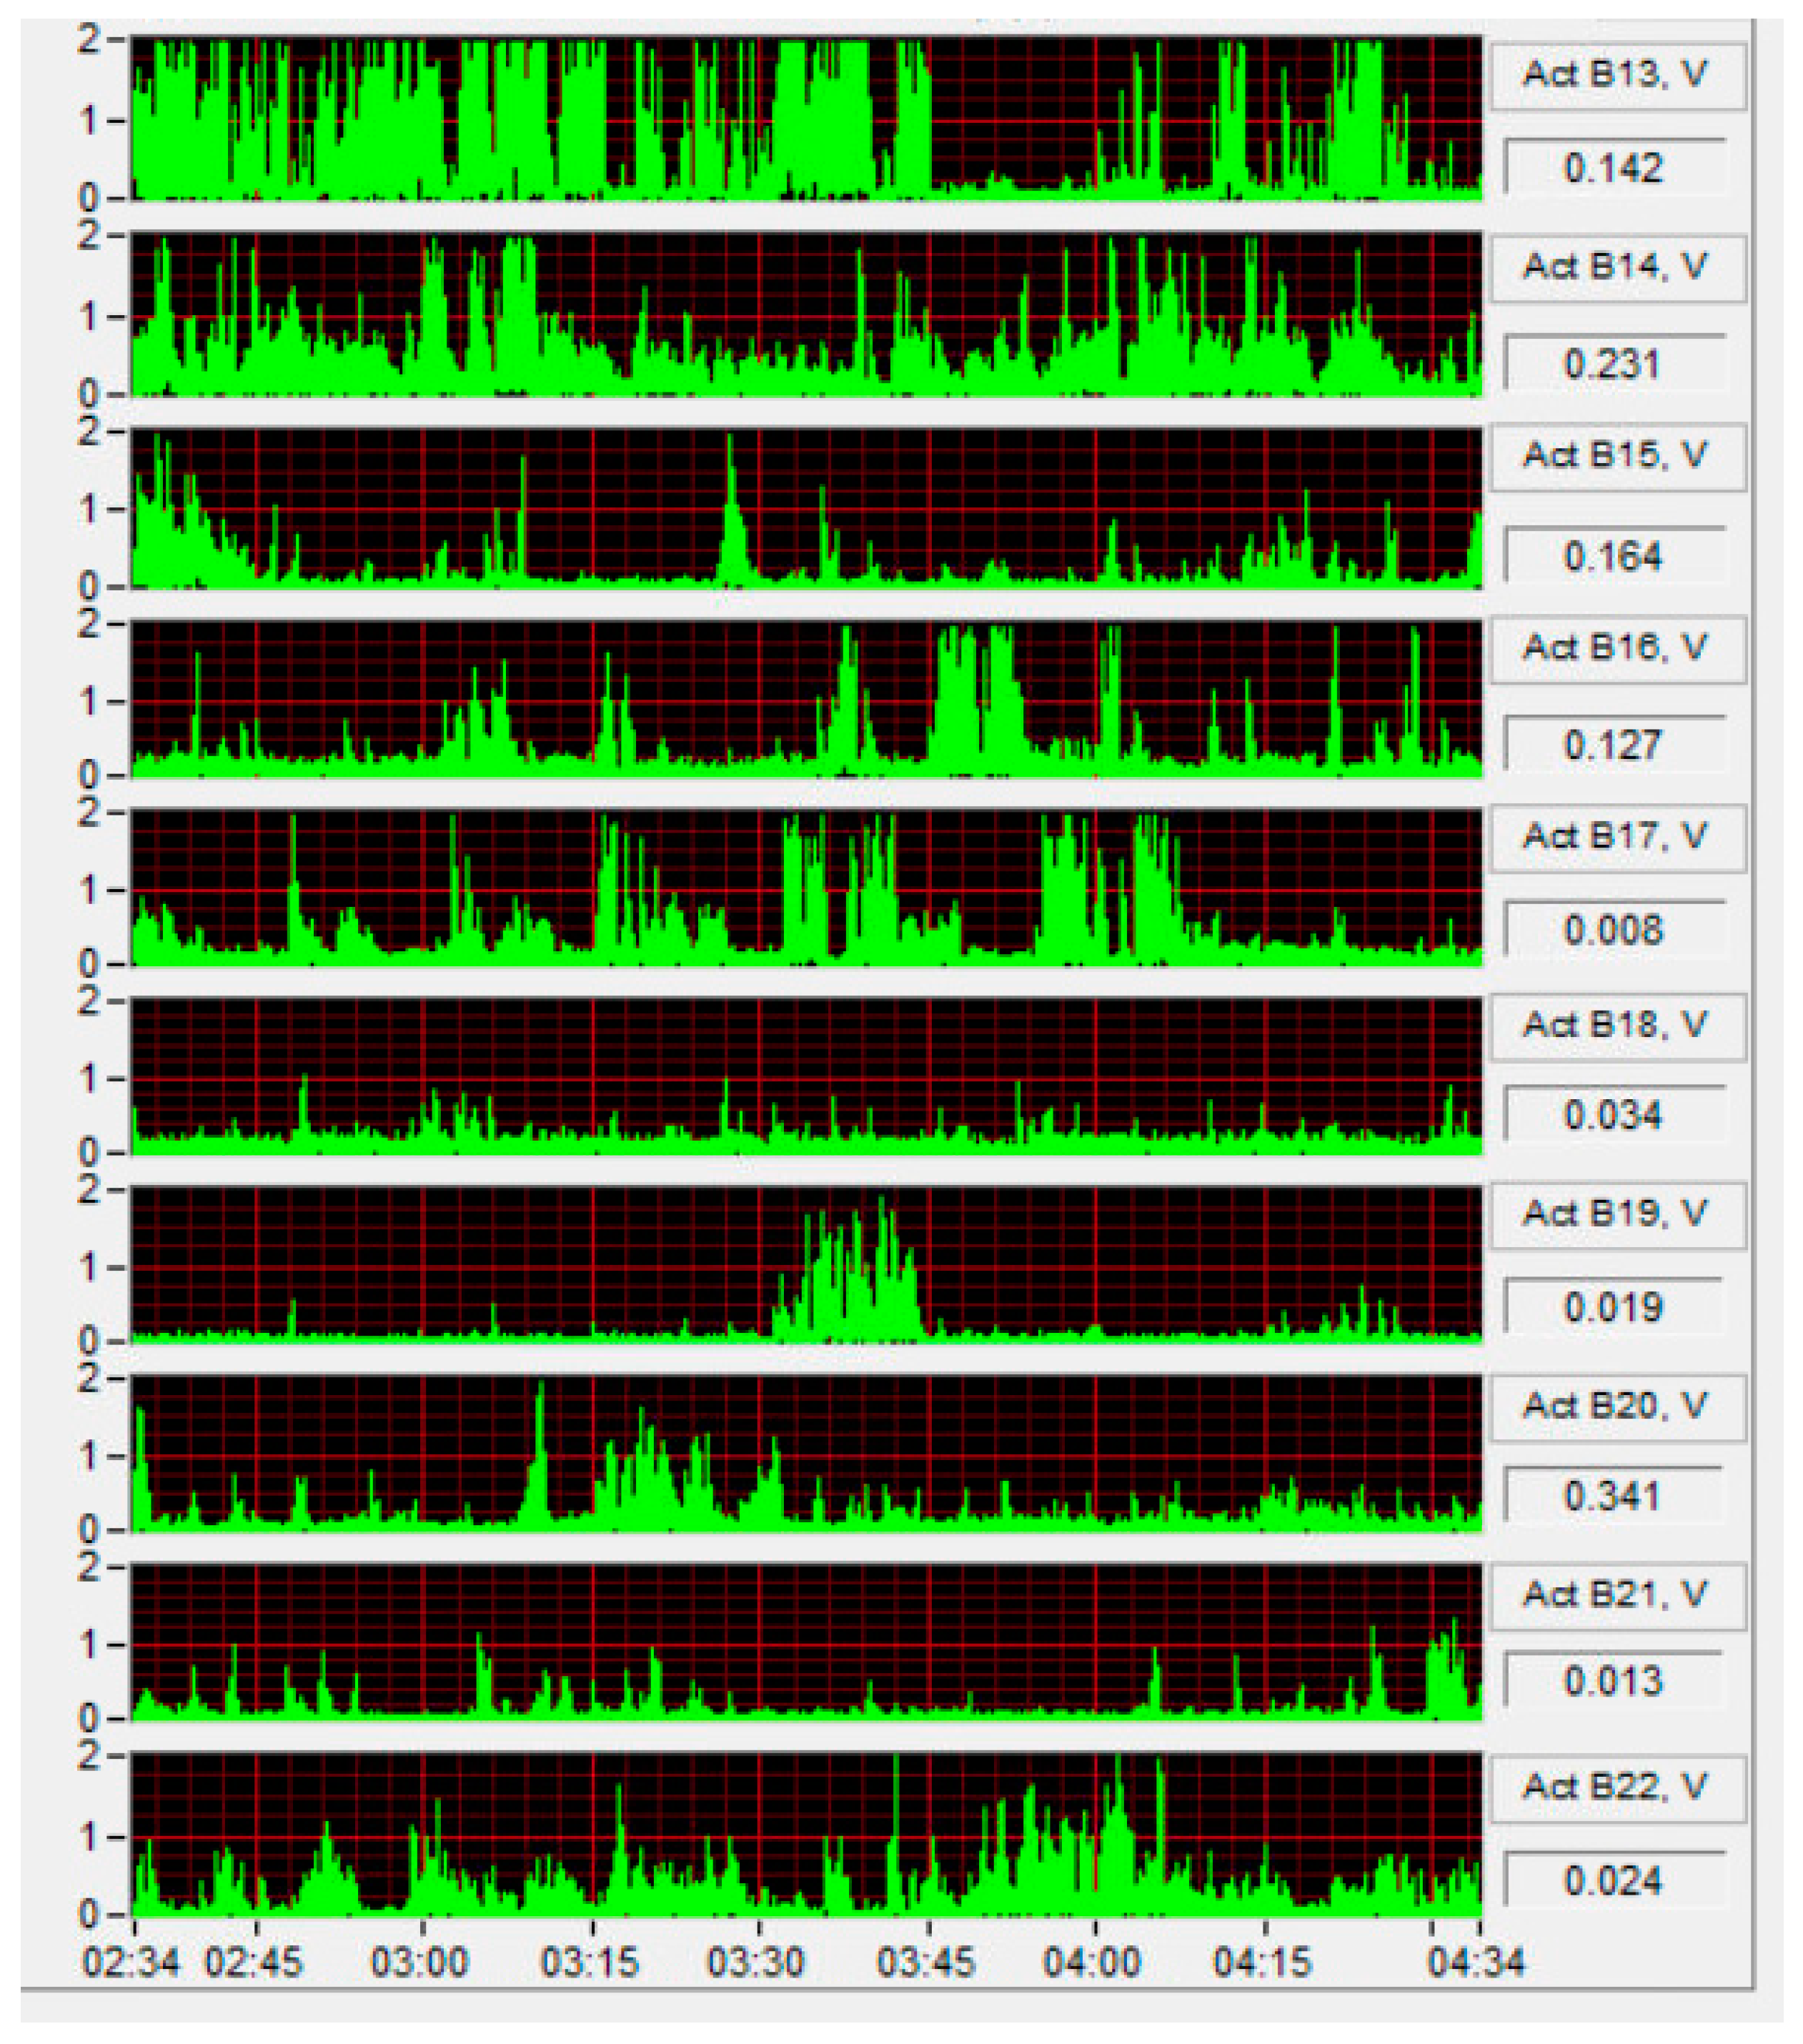
3.3.1. Sensor Detection Characteristics

The sensors demonstrated a rapid response time (approximately 1 s) to the activities of the sow and piglets within the pen, quickly generating a voltage signal upon detection of movement. The sensors were also able to immediately lower the signal when the pigs ceased moving. The sensor outputs enabled high-resolution and real-time visualization of pig activity patterns, accessible both on-site and remotely, as depicted in the screenshot of the 2 h measurement history at 1 Hz (Figure 6).
The analog output voltages from the sensors reflected the intensity of pig movements, with the higher voltages representing more vigorous activity. While Figure 6 shows some signal saturation at 2 VDC, processing these 1 Hz signals into 15 s averages clarifies the variations in activity intensity for behavioral studies [17]. This method of monitoring individual pens with a single sensor provided more accurate data on pig behaviors by addressing limitations observed in previous studies, such as the impact of the pig’s distance from the sensor on the sensor outputs.
The sensor-based data collection and initial processing were continuous, automated, and required minimal labor, with the system operating unattended. The daily time-series graphs and basic statistics for each pen generated by AirDAC software facilitated quick and direct inspections of the temporal distribution of building environment conditions and their correlation with pig activities.
One of the key advantages of sensor detection is its non-invasive nature, which assisted in revealing activity variations related to pen locations within the rooms. Pens positioned near the doors (i.e., pens #1, 2, 9, 12, 16, 17, and 19) produced higher sensor outputs than average, with a 21% increase in sensor outputs compared with the average of all pens. This was supported by the pig-moving scores, where pens near the doors had an average score higher than the overall average. However, pens near wall fans and the air circulation fan did not show considerable differences in sensor outputs or pig-moving scores. This suggests that sows located near doors may experience disturbances from researchers and workers entering and exiting the rooms. This interpretation aligns with findings from a previous microenvironment study [27], indicating that variations in thermal, lighting, and acoustic environments within a farrowing room can influence the welfare and behavior of sows and piglets.

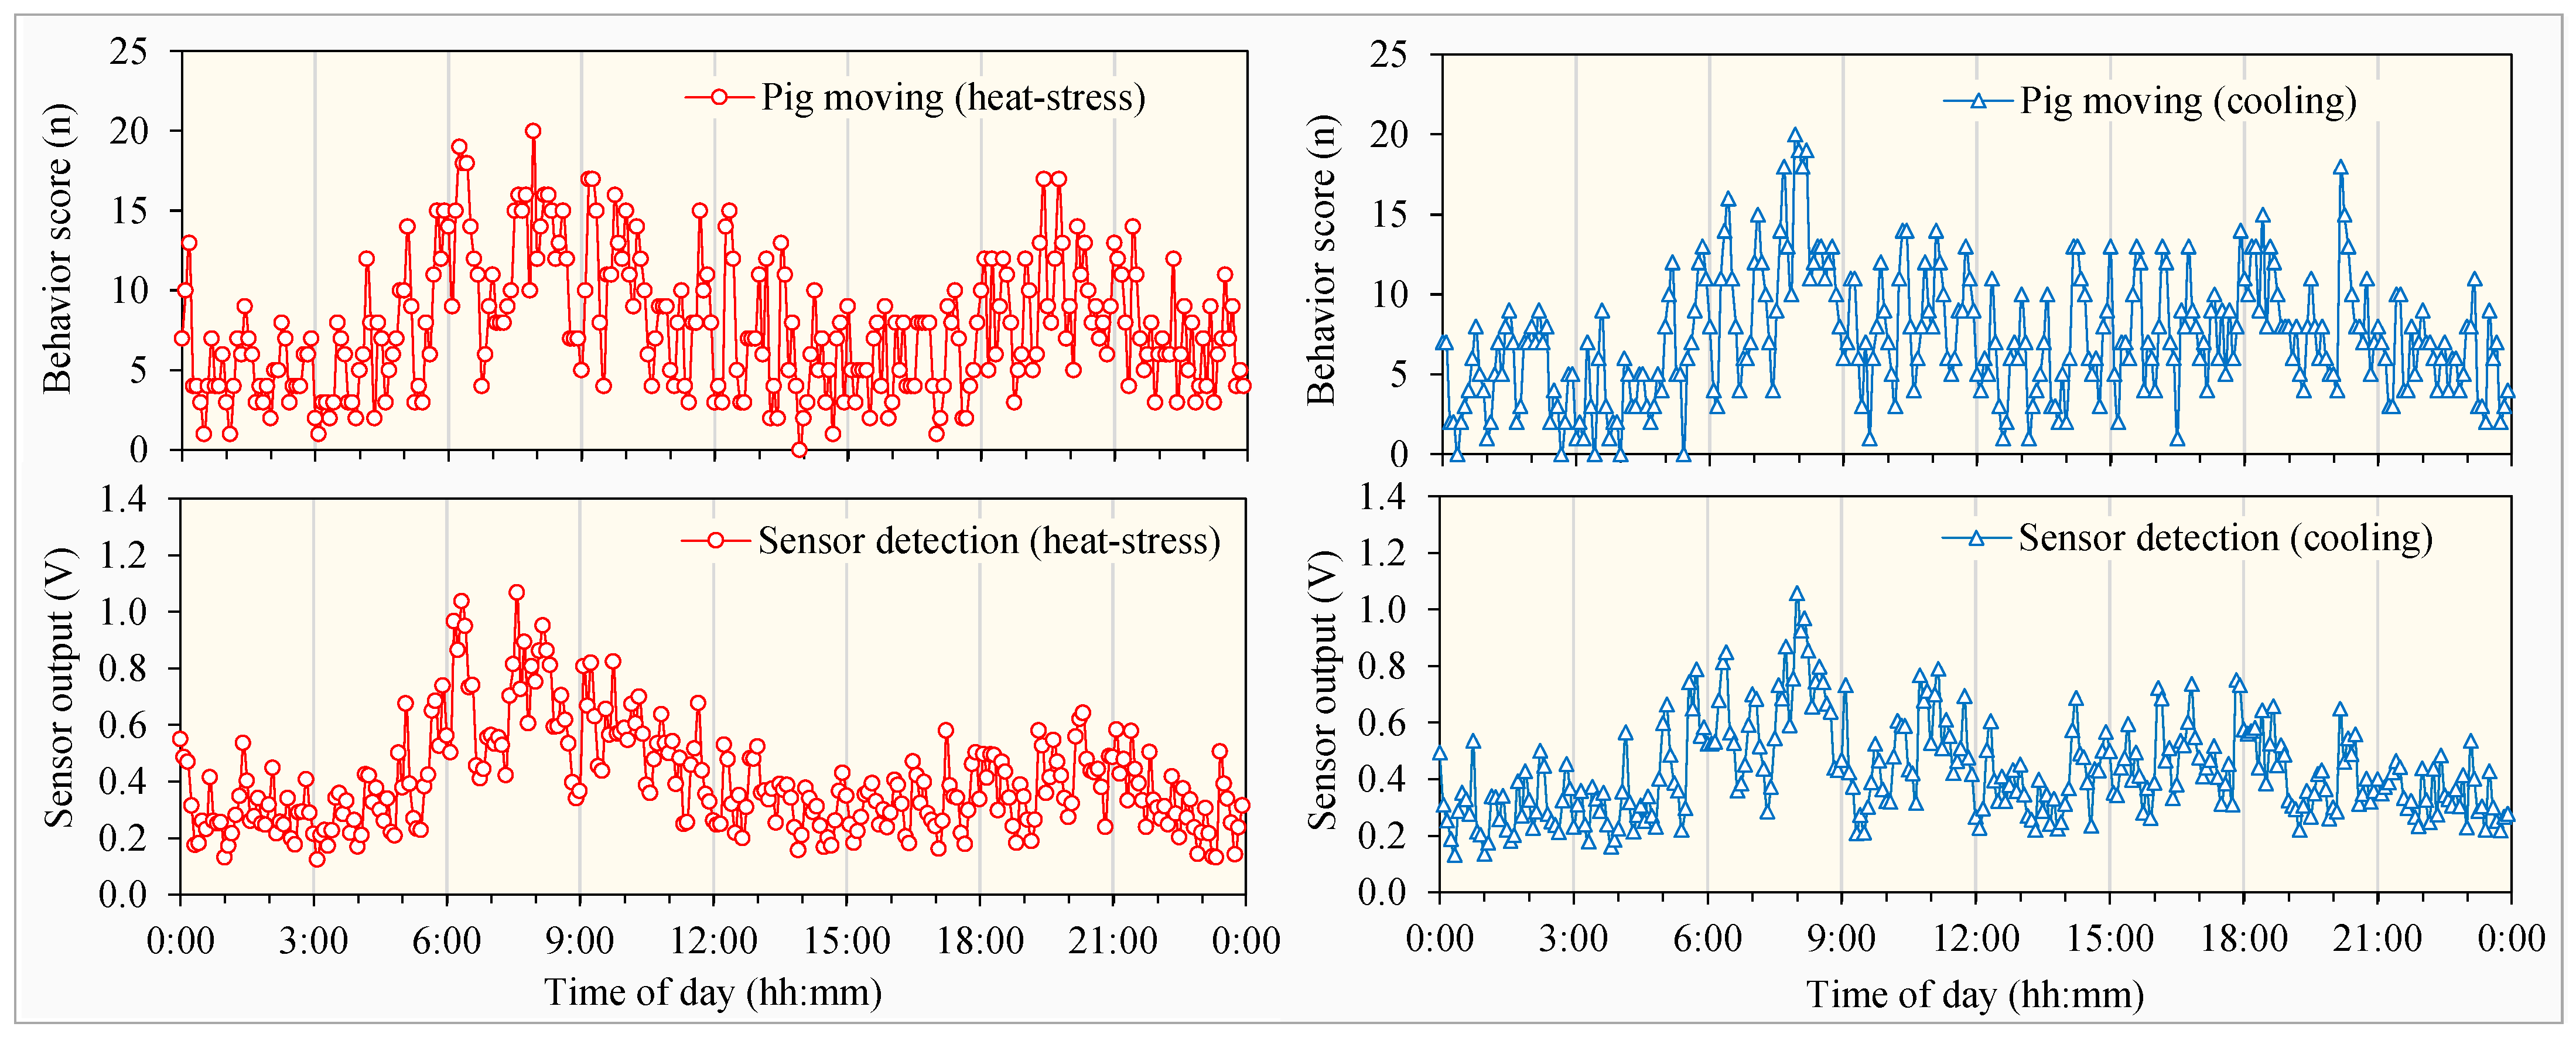
3.3.2. Correlation Between Sensor Outputs and Pig Behaviors

Although the sensor was not designed to distinctly identify different pig behaviors, correlation coefficient analysis demonstrated a clear relationship between sensor outputs and specific as well as combined pig behaviors (Table 3). Positive correlation coefficients (ρ) were observed for sensor outputs with behaviors such as sow eating, standing, drinking, and sitting across both heat stress and cooling treatment groups. These findings are logical because these activities involved substantial sow body movements, which the sensors were capable of detecting. In contrast, behaviors where sows remained more stationary, such as nursing and sleeping, showed negative correlations with sensor outputs. Interestingly, sow lying behavior, despite the sows being mostly stationary, still resulted in some sensor detection due to minor body movements.
For piglets, while nursing behavior showed negligible correlation with sensor outputs, walking behavior displayed positive correlations. Piglet sleeping behavior, on the other hand, resulted in negative correlation coefficients.
When examining the combined behaviors of sows and piglets (Table 3), pig-moving showed the highest positive correlation with sensor signals for both heat stress (ρ = 0.81) and cooling treatments (ρ = 0.74). Conversely, negative correlations indicated minimal pig movement. Sow on-body, which involves minimal pig movement, showed the most pronounced negative correlation coefficients (ρ = −0.77 for heat stress and ρ = −0.56 for cooling). The analysis of 24 h time-series graphs, which compared pig moving scores with sensor outputs, further highlighted these correlations (Figure 7). Linear regression analysis yielded R2 values of 0.652 for heat stress pens and 0.553 for pens under cooling treatment, illustrating that the sensors were effective in detecting pig movement associated with different behaviors. These findings verify the sensor’s ability to capture behavior-induced movements, demonstrating its potential as a valuable tool for monitoring pig behaviors, although it does so indirectly through movement detection.

3.4. Insights from the Video Monitoring of Pig Behaviors

3.4.1. Dynamic Behaviors of Sows and Piglets

Video analysis provided a deeper understanding of the sow and piglet behaviors, revealing their dynamic nature. For instance, within a 5 min time window, a sow seamlessly switched between various behaviors: from standing to drinking, from drinking back to standing, and then from standing to lying. These transitions occurred rapidly, with the sow moving from lying to standing in just 3 s, from standing to drinking in 2 s, and from standing to lying in 5 s.
Moreover, the sow and its piglets often showed synchronized behaviors. When a sow was lying or sleeping, most of her piglets were doing the same. Similarly, when a sow was standing and drinking, most piglets were also on their feet, walking around. This suggests that more frequent monitoring of sow and piglet behaviors, such as every sec with sensor detection, could provide richer data on the complexity of pig behaviors.

3.4.2. Video Monitoring and Sensor Detection of Pig Behaviors

The comparison between the video recordings and sensor data confirmed that the sensor could detect changes in pig behaviors sensitively and rapidly. The comparison validated the sensor capacity to detect pig behaviors that were uncaptured by instantaneous visual observations within the 5 min time windows as shown in the 15 min example in Figure 8.
The sensor clearly distinguishes between the pig lying and standing. It produces low output below 0.1 V when the sow and piglets are lying between 07:40 and 07:45 in Figure 8. As the sow starts to stand at 07:45:10, the sensor output soars, peaking at 0.28 V within one minute. Then, the output soars even further to 0.57 V when the sow starts drinking at 07:46:55.
The sensor produces a distinct signal pattern for the sow’s standing and drinking in Figure 8. The sow standing produces a smaller spike of about 0.3 V, sustained for just 1 min, while drinking produces bigger spikes above 0.5 V, lasting for 6 min from 07:46 to 07:52. During this period, there are times when the sow is actively sucking on the water nipple (i.e., drinking) or when the sow is just standing. The sow actively drinks three times at 07:47:10, 07:48:55, and 07:51:40. These drinking events are promptly recorded by the three different sensor output spikes.
The sensor successfully detects transitions from standing to lying in Figure 8. At 07:52:25, when the sow transitions from standing to lying, the signals gradually drop below 0.1 V. Although the sow changes to a lying position within 10 s, the signals do not return to a low output until in about 2 min from 07:53 to 07:55. This delayed signal drop can be attributed to the sow subsequently moving to find a comfortable posture and the piglets walking inside the pen.
Furthermore, the video analysis confirmed that the sensor can capture the very subtle movements of the pigs. The sensor can even detect the sow’s small body part movements, such as its lifting ears, moving its tail, shaking its head, and sniffing. Therefore, the sensor can provide valuable information about the pig’s small movements.

4. Conclusions

The following conclusions were drawn in this study:
(1)
Sows and piglets showed more circadian rhythm variations in some behaviors than the others. Their active time distributions for different behaviors also varied between natural heat stress and floor cooling treatments.
(2)
The sensor outputs correlated positively with certain pig behaviors and negatively with others. The highest correlations were with the pig moving behaviors, showing correlation coefficients of 0.81 and 0.74 with heat stress and cooling treatments, respectively.
(3)
Video recording analysis confirmed that the sensor could quickly and sensitively detect changes in sow and piglet activities and even capture the movements of small body parts.
(4)
The pens near the room doors had a 21% higher sensor output and higher pig moving scores, demonstrating possible effects of the workers’ activities on the pigs’ behaviors.
(5)
Visual observation, sensor detection, and video recording methods for pig behavior monitoring each present their own set of advantages and limitations.

Author Contributions

Conceptualization: J.-Q.N., A.P.S., R.C.M., and T.M.C.; data curation: J.H.K., J.-Q.N., W.O., and T.M.C.; formal analysis: J.H.K. and J.-Q.N.; funding acquisition: A.P.S., R.C.M., J.S.J., and T.M.C.; investigation: J.H.K., J.-Q.N., W.O., and T.M.C.; methodology: J.H.K., J.-Q.N., W.O., A.P.S., R.C.M., J.S.J., and T.M.C.; project administration: T.M.C.; software: J.-Q.N.; supervision: J.-Q.N. and T.M.C.; validation: A.P.S., J.S.J., and T.M.C.; visualization: J.H.K. and J.-Q.N.; writing—original draft: J.H.K.; writing—review and editing: J.-Q.N., W.O., A.P.S., R.C.M., J.S.J., and T.M.C. All authors have read and agreed to the published version of the manuscript.

Funding

This study was partially supported by the USDA National Institute for Food and Agriculture Grants (#2021-67021-34198 and #2022-67016-36194) and the Hatch project (#7000907).

Institutional Review Board Statement

The research protocols involving the use of animals were reviewed and approved by Purdue University’s Institutional Animal Care and Use Committee (IACUC Protocol #2110002202, approved date: 2 November 2021).

Informed Consent Statement

Not applicable.

Data Availability Statement

The data that support the findings of this study are available from the corresponding author upon reasonable request.

Acknowledgments

The authors thank the Purdue University staff for assisting with this research.

Conflicts of Interest

The authors declare no conflicts of interest.

References

  1. United Nations. World Population Prospects 2022: Summary of Results; UN DESA/POP/2022/TR/NO. 3; United Nations, Department of Economic and Social Affairs, Population Division: New York, NY, USA, 2022; ISBN 978-92-1-148373-4.
  2. OECD-FAO. OECD-FAO Agricultural Outlook 2023–2032; OECD Publishing: Paris, France, 2023. [Google Scholar] [CrossRef]
  3. Ni, J.-Q.; Erasmus, M.A.; Croney, C.C.; Li, C.; Li, Y. A critical review of advancement in scientific research on food animal welfare-related air pollution. J. Hazard. Mater. 2021, 408, 124468. [Google Scholar] [CrossRef]
  4. Liu, F.; Zhao, W.; Le, H.H.; Cottrell, J.J.; Green, M.P.; Leury, B.J.; Dunshea, F.R.; Bell, A.W. Review: What have we learned about the effects of heat stress on the pig industry? Animal 2022, 16, 13. [Google Scholar] [CrossRef]
  5. Johnson, J.S.; Stewart, K.R.; Safranski, T.J.; Ross, J.W.; Baumgard, L.H. In utero heat stress alters postnatal phenotypes in swine. Theriogenology 2020, 154, 110–119. [Google Scholar] [CrossRef] [PubMed]
  6. Zhang, Z.T.; Zhang, H.; He, Y.X.; Liu, T.H. A review in the automatic detection of pigs behavior with sensors. J. Sens. 2022, 2022, 17. [Google Scholar] [CrossRef]
  7. Liu, L.S.; Tai, M.; Yao, W.; Zhao, R.Q.; Shen, M.X. Effects of heat stress on posture transitions and reproductive performance of primiparous sows during late gestation. J. Therm. Biol. 2021, 96, 8. [Google Scholar] [CrossRef]
  8. Botermans, J.; Andersson, M. Growing-finishing pigs in an uninsulated house. 2. Pen function and thermal comfort. Swed. J. Agric. Res. 1995, 25, 83–92. [Google Scholar]
  9. Yang, Q.M.; Xiao, D.Q. A review of video-based pig behavior recognition. Appl. Anim. Behav. Sci. 2020, 233, 8. [Google Scholar] [CrossRef]
  10. Oczak, M.; Maschat, K.; Baumgartner, J. Dynamics of sows’ activity housed in farrowing pens with possibility of temporary crating might indicate the time when sows should be confined in a crate before the onset of farrowing. Animals 2020, 10, 6. [Google Scholar] [CrossRef] [PubMed]
  11. Yang, A.Q.; Huang, H.S.; Zheng, B.; Li, S.M.; Gan, H.M.; Chen, C.X.; Yang, X.F.; Xue, Y.J. An automatic recognition framework for sow daily behaviours based on motion and image analyses. Biosyst. Eng. 2020, 192, 56–71. [Google Scholar] [CrossRef]
  12. Oliviero, C.; Pastell, M.; Heinonen, M.; Heikkonen, J.; Valros, A.; Ahokas, J.; Vainio, O.; Peltoniemi, O.A.T. Using movement sensors to detect the onset of farrowing. Biosyst. Eng. 2008, 100, 281–285. [Google Scholar] [CrossRef]
  13. Smulders, D.; Verbeke, G.; Mormède, P.; Geers, R. Validation of a behavioral observation tool to assess pig welfare. Physiol. Behav. 2006, 89, 438–447. [Google Scholar] [CrossRef]
  14. Pedersen, S.; Takai, H. Animal activity monitored by PID technique. In Proceedings of the AgEng '94 Conference on Agricultural Engineering, Milan, Italy, 29 August–1 September 1994. [Google Scholar]
  15. Pedersen, S.; Pedersen, C.B. Animal activity measured by infrared detectors. J. Agric. Eng. Res. 1995, 61, 239–246. [Google Scholar] [CrossRef]
  16. Ni, J.-Q.; Heber, A.J. An on-site computer system for comprehensive agricultural air quality research. Comput. Electron. Agr. 2010, 71, 38–49. [Google Scholar] [CrossRef]
  17. Ni, J.-Q.; Liu, S.; Radcliffe, J.S.; Vonderohe, C. Evaluation and characterization of passive infrared detectors to monitor pig activities in animal environmental research. Biosyst. Eng. 2017, 158, 86–94. [Google Scholar] [CrossRef]
  18. Besteiro, R.; Rodriguez, M.R.; Fernandez, M.D.; Ortega, J.A.; Velo, R. Agreement between passive infrared detector measurements and human observations of animal activity. Livest. Sci. 2018, 214, 219–224. [Google Scholar] [CrossRef]
  19. Von Jasmund, N.; Wellnitz, A.; Krommweh, M.S.; Büscher, W. Using passive infrared detectors to record group activity and activity in certain focus areas in fattening pigs. Animals 2020, 10, 792. [Google Scholar] [CrossRef]
  20. Besteiro, R.; Arango, T.; Ortega, J.; Fernandez, M.D.; Rodriguez, M.R. Long-term measurement of piglet activity using passive infrared detectors. Animals 2021, 11, 1607. [Google Scholar] [CrossRef]
  21. Drexl, V.; Siebler, D.; Dittrich, I.; Heins, R.; Diers, S.; Krieter, J. Use of a digital passive infrared motion detector in piglet rearing for the identification of animal activity. Smart Agric. Technol. 2023, 4, 100228. [Google Scholar] [CrossRef]
  22. Freson, L.; Godrie, S.; Bos, N.; Jourquin, J.; Geers, R. Validation of an infra-red sensor for oestrus detection of individually housed sows. Comput. Electron. Agr. 1998, 20, 21–29. [Google Scholar] [CrossRef]
  23. Kim, J.H.; Ni, J.-Q.; Stwalley, R.; Schinckel, A.P.; Marchant, J.N.; Johnson, J.S. A comprehensive microenvironment monitoring system for studying the productivity and welfare of sows and piglets. In Proceedings of the International Symposium on Animal Environment and Welfare, Chongqing, China, 20–23 October 2023; p. 8. [Google Scholar]
  24. Ogundare, W.; Teeple, K.; Fisher, E.; Davis, C.; Reis, L.G.; Jannasch, A.; Beckett, L.M.; Schinckel, A.; Minor, R.; Casey, T. Cooling lactating sows exposed to early summer heat wave alters circadian patterns of behavior and rhythms of respiration, rectal temperature, and saliva melatonin. PLoS ONE 2024, 19, e0310787. [Google Scholar] [CrossRef]
  25. Johnson, J.S.; Jansen, T.L.; Galvin, M.; Field, T.C.; Graham, J.R.; Stwalley, R.M.; Schinckel, A.P. Electronically controlled cooling pads can improve litter growth performance and indirect measures of milk production in heat-stressed lactating sows. J. Anim. Sci. 2022, 100, 10. [Google Scholar] [CrossRef] [PubMed]
  26. Liu, L.; Zhou, J.; Zhang, B.; Dai, S.; Shen, M. Visual detection on posture transformation characteristics of sows in late gestation based on Libra R-CNN. Biosyst. Eng. 2022, 223, 219–231. [Google Scholar] [CrossRef]
  27. Morello, G.M.; Lay, D.C.; Rodrigues, L.H.A.; Richert, B.T.; Marchant-Forde, J.N. Microenvironments in swine farrowing rooms: The thermal, lighting, and acoustic environments of sows and piglets. Scientia Agricola 2018, 75, 1–11. [Google Scholar] [CrossRef]
Figure 1. South–west side view of the farrowing–nursery research building at the Animal Sciences Research Education Center (ASREC), Purdue University. The study was conducted in farrowing Rooms A and B. The lab housed the data-acquisition and computer system.
Applsci 15 03018 g001
Figure 2. Sensor mounted on the ceiling at a 50° angle downward facing the single pen (left). Inside view of the sensor front cover (middle). Outside view of the sensor front cover (right).
Applsci 15 03018 g002
Figure 3. Visually observed numbers of pens where sows were eating, drinking, standing, and sitting at different times of the day under heat stress (charts with red curves) and cooling (charts with blue curves) compared with room temperature (bottom left) and relative humidity (bottom right) in the two rooms.
Applsci 15 03018 g003
Figure 4. Visually observed number of pens where sows were lying, nursing, and sleeping (left-hand charts) and the number of pens where piglets were walking, nursing, and sleeping (right-hand charts) at different times of the day under heat stress (charts with red curves) and cooling (charts with blue curves).
Applsci 15 03018 g004
Figure 5. Comparison of different behaviors of sows (left) and piglets (right) between heat stress and cooling treatments.
Applsci 15 03018 g005
Figure 6. An example of real-time sensor outputs at 1 Hz in an AirDAC 2 h data history, showing different early morning pig activity patterns in 10 pens (#13–22) in Room B.
Applsci 15 03018 g006
Figure 7. Comparison between the pig moving scores in visual observation data (top charts) and the corresponding sensor detection outputs (bottom charts) under heat stress (left-hand charts with red curves) and cooling (right-hand charts with blue curves).
Applsci 15 03018 g007
Figure 8. An example of video recording and sensor output comparison.
Applsci 15 03018 g008
Table 1. Ethogram of behavioral observation for sows and piglets.
BehaviorSow *Piglets **
EatingHead in the feeder and munching NA
StandingErect on all four limbs (drinking)NA
DrinkingActively gulping water with the mouth through the water nozzle (sitting)NA
SitingDog-sitting position with the hind limbs lateral to the floor (nursing)NA
LyingFlat on the floor, either on the side or the abdomen (nursing)NA
NursingAll-to-most piglets on the teats, actively suckling (sleeping)≥1 suckling
SleepingLying with the eyes closed (lying or nursing)≥1 lying with the eyes closed
WalkingNA≥1 moving on all four limbs
Note: * Parentheses in the sow columns show possible simultaneous behaviors recorded during the same observation for sows. ** NA = Not applicable. Observation for piglets could involve the recording of any combination of the three behaviors.
Table 2. Comparison of three methods for sow and piglet behavior study.
Visual ObservationSensor DetectionVideo Recording
Behavior distinctionYesNoYes
Equipment requirementNoYesYes
Data collection methodHuman observationSensor detectionVideo shooting
Data collection modeDiscreteContinuousContinuous
Data collection frequencyEvery 5 mins1 Hz20 frames per sec
Data recordingNotepadComputerComputer
Data typeBinary dataAnalog dataSequence of images
Response timeA couple of secs~1 s<1 s
Researcher involvementHighLowLow
InvasivenessPossibleNoNo
Data storage requirementLowMediumHigh
Data processing requirementHighLowHigh
Table 3. Correlation coefficient (ρ) between observed pig behaviors and sensor outputs.
Heat StressCooling
Individual behavior
Sow eating0.610.37
Sow standing0.470.41
Sow drinking0.380.27
Sow sitting0.310.23
Sow lying0.530.49
Sow nursing−0.10−0.14
Sow sleeping−0.61−0.50
Piglet nursing0.050.12
Piglet sleeping−0.42−0.34
Piglet walking0.690.64
Behavior combination
Sow on-feet0.770.59
Sow on-body−0.77−0.56
Piglet moving0.470.38
Pig moving0.810.74
Pig moving and lying0.750.70
Sow on-feet and lying0.770.61
Sow and piglet sleeping−0.59−0.47
Disclaimer/Publisher’s Note: The statements, opinions and data contained in all publications are solely those of the individual author(s) and contributor(s) and not of MDPI and/or the editor(s). MDPI and/or the editor(s) disclaim responsibility for any injury to people or property resulting from any ideas, methods, instructions or products referred to in the content.

