Article

Numerical Modeling of Bowel Sound Propagation: Impact of Abdominal Tissue Properties

College of Biomedical Engineering, Sichuan University, Chengdu 610065, China
*
Author to whom correspondence should be addressed.
Appl. Sci. 2025, 15(6), 2929; https://doi.org/10.3390/app15062929
Submission received: 25 January 2025 / Revised: 25 February 2025 / Accepted: 6 March 2025 / Published: 8 March 2025
(This article belongs to the Section Applied Physics General)

Abstract

:
Bowel sounds, produced by intestinal peristalsis, are essential for diagnosing gastrointestinal disorders. However, acquiring and analyzing bowel sounds is challenging due to their unpredictable nature and individual variability. Biological tissues can affect bowel sounds during propagation, resulting in varying degrees of signal attenuation between the sound source and the transducer. This study aims to develop a numerical model of bowel sound propagation in the abdominal cavity, focusing on the impact of different biological layers on signal attenuation. Validation of the model demonstrated strong consistency between simulated and actual bowel sound signals, confirming the model’s accuracy and reliability. The model accounted for adipose tissue thickness, ranging from 5 to 20 mm across individuals, while muscle and skin thicknesses remained constant. Results indicated that signal attenuation increases with both the propagation distance and adipose tissue thickness. These findings provide insights into how tissue layers influence bowel sound propagation, offering a theoretical foundation for developing personalized and precise monitoring devices.

1. Introduction

Bowel sounds, including rumbles, grunts, trebles, and growls, are typically produced by the movement of liquids, food, digestive juices, and air in the intestinal tract [1]. These sounds are primarily produced by the rhythmic contractions of the intestines, a process known as peristalsis. They are affected by the mechanical interactions between the digestive contents and the walls of the intestines [2]. Analyzing the presence, frequency, and intensity of these sounds provides valuable diagnostic insights into gastrointestinal diseases, particularly in their early detection. For instance, Liatsos et al. [3] demonstrated that bowel sound analysis accurately diagnoses small amounts of ascites. Craine et al. [4] utilized two-dimensional localization techniques to differentiate between irritable bowel syndrome (IBS) and Crohn’s disease, pioneering a new approach in the classification of functional bowel disorders. Moreover, Gu et al. [5] found that bowel sounds had a positive predictive value of 72.7% for diagnosing acute intestinal obstruction, highlighting their potential in rapid screening. These findings underscore the significant clinical applications of bowel sound analysis, particularly in the early identification of gastrointestinal conditions, though further efforts to standardize and objectify the method remain essential.
Bowel sound analysis has shown significant potential in diagnosing various gastrointestinal diseases and has made progress in theoretical research. However, its clinical application remains challenging. Currently, interpreting bowel sounds is heavily dependent on the clinician’s experience and is susceptible to interference from environmental noise and individual variability, limiting its standardized use in clinical settings. Furthermore, while conventional stethoscopes are commonly employed for bowel sound assessment, they remain subjective and fail to provide objective, standardized results [6]. The complex nature of bowel sounds, characterized by variations in frequency, intensity, and duration, presents challenges for automated detection [7] and analysis [8] techniques in achieving the accuracy needed for clinical applications. Existing automated methods often struggle to provide consistent and reliable diagnostic information when confronted with diverse disease states and individual differences. Moreover, the absence of large-scale, standardized bowel sound databases and uniform classification criteria further limits the widespread application and effectiveness of these techniques across various diseases.
Most existing studies have focused on methods and devices for acquiring bowel sounds [9,10,11], with relatively little attention given to bowel sound simulation. The development of bowel sound simulation devices is of significant importance, as they provide objective and controllable samples that can improve the accuracy and reliability of automated analysis techniques. This advancement may also support the establishment of standardized classification and diagnostic frameworks. Additionally, such devices can contribute to the creation of large-scale, standardized bowel sound databases, promoting the widespread application of bowel sound analysis across various clinical conditions. Du et al. [12] developed a mathematical model of bowel sound generation, simplifying the vibration of the intestinal wall into a spring-mass-damping system. Their study primarily focused on the mechanisms of sound generation within the intestine [13]. However, existing research has limited insight into the propagation of bowel sounds within the abdominal cavity [14]. The physical properties of various tissue layers, including thickness, density, elasticity, and impedance, heavily influence the propagation characteristics of bowel sounds [15]. Individual differences, particularly in fat layer thickness, can lead to significant attenuation and distortion of bowel sounds as they travel through the abdomen [16,17]. Therefore, developing a bowel sound simulation device that can accurately mimic the structure of the abdominal cavity of different individuals is of great significance for revealing the propagation law of sound waves, optimizing the signal acquisition and analysis, and providing key technical support for the clinical application of bowel sound analysis.
Accurate modeling and analysis of bowel sounds in clinical settings presents several challenges. To address these challenges, it is essential to develop a model that effectively captures the mechanisms of bowel sound generation and their propagation within the abdominal cavity. Numerical simulations approximate solutions through discretization and iterative solving, making them well suited for complex physical phenomena and boundary conditions. In contrast, analytical models simplify systems to provide exact solutions, but they can be limited in complex situations and computationally expensive. In the field of nanoelectronic device modeling, semi-analytical models have proven to be a helpful balance, reducing computational complexity while maintaining high accuracy [18]. Building on this approach, this study uses an analytical model to define the characteristics of the sound source and provide accurate initial conditions for numerical simulations. The sound wave propagation is then analyzed through numerical modeling in COMSOL Multiphysics® (version 6.2.) [19]. This combined approach improves both the accuracy of the results and computational efficiency, offering a practical solution for modeling the dynamics of bowel sound generation and propagation.
This study aims to develop a comprehensive numerical model to simulate intestinal sound generation and propagation, focusing on the acoustic properties of abdominal tissue layers, including adipose tissue, muscle, and skin. By integrating tissue-specific acoustic parameters into a finite element model, this research establishes a proof-of-concept framework for accurately simulating sound propagation. A key objective is to investigate how variations in fat layer thickness influence sound attenuation, accounting for individual anatomical and physiological differences. The model will be personalized based on individual-specific tissue composition, enabling precise simulation of real-world abdominal conditions. By correlating these variations with an expanded bowel sound database, the model has the potential to enhance diagnostic accuracy and support personalized medicine. Additionally, this research contributes to the development of non-invasive gastrointestinal health monitoring devices, offering significant clinical value for early disease detection and management.

2. Theory and Model

2.1. Generation of Bowel Sounds

Bowel sounds are generated by the rhythmic contraction and relaxation of smooth muscles in the intestinal walls. This process, known as peristalsis, involves wave-like movements that propel food, liquids, and digestive juices through the intestines. This process causes pressure changes within the intestinal lumen, compressing gases and liquids to produce sound. The characteristics of these sounds, including their intensity, frequency, and nature, depend on factors such as the speed of peristalsis, the type of materials in the intestines, and muscle contraction patterns. In order to accurately simulate bowel sound production, the mathematical model introduced in the literature [12] incorporates four key parameters: individual waveform components (IWC), pressure index (PI), component quantity (CQ), and component interval time (CIT).
The individual waveform component (IWC) is the basic unit of bowel sound, produced when the bowel contracts and compresses fluid (gas or liquid) through the intestinal lumen. The frequency of the IWC is linked to the intensity and rhythm of these oscillations. The pressure index (PI) measures pressure fluctuations in the bowel and directly impacts the volume and clarity of the sound. Higher PI values result in stronger and more pronounced bowel sounds. Component quantity (CQ) refers to the number of distinct waveform components within a given time frame, influencing the complexity and density of the sound. A higher CQ produces a richer, more complex sound. Component interval time (CIT) measures the time between successive waveform components and is crucial for controlling the rhythm of the sounds. By adjusting CIT, different types of bowel sounds, such as rumbling or growling, can be simulated. These four parameters determine the character and variability of the bowel sounds. By adjusting these four parameters, the model can effectively reproduce the various types of bowel sounds observed clinically, allowing for more accurate simulations that are useful for both medical diagnosis and educational purposes.
In modeling abdominal acoustic wave propagation, the individual waveform component (IWC) is used as the source signal. It simulates bowel sound responses as they pass through different tissue layers, including fat, muscle, and skin. The propagation model incorporates tissue-specific interactions, accounting for sound attenuation as it travels from the intestine to the skin surface. The mathematical representation of the IWC is described by the following equation:
P i w c = A i w c sin 2 π f i w c t
where t is time, f i w c is the resonant frequency, and A i w c is the envelope of the IWC, given by:
A i w c = p e E / t t b
Here, p is the pressure index,   E is the envelope exponent influenced by pressure, and b controls the bandwidth of the IWC related to damping.
Based on the mathematical model of bowel sound generation, Equation (2) is substituted into Equation (1), and the generated IWC is shown in Figure 1. The IWC is defined by the resonance frequency f i w c and is strictly constrained by the envelope function A i w c . In this simulation, the parameters were set to f i w c = 400 Hz, with envelope parameters E = 0.0495 and b = 11.0. As shown in Figure 1, the red solid line represents + A i w c , the green solid line represents − A i w c , and the blue solid line illustrates the simulated IWC. The IWC curve peaks at 4.5 ms, indicating that the pressure induced by the intestinal wall contraction is most pronounced at this time. The subsequent decrease in amplitude reflects the gradual attenuation of pressure changes over time, approaching zero at 15.0 ms. The parameter p, acting as a scaling factor, was fixed at p = 1 for this analysis. This choice simplifies the analysis and allows us to focus on the relative relationships between the parameters, rather than on the absolute magnitude levels. By adjusting other parameters, different forms of the IWC can be generated.

2.2. Transmission of Bowel Sounds

2.2.1. Principle of Sound Propagation

This study adopts the assumption that the bowel sound source is not significantly influenced by complex fluid dynamics in the abdominal cavity, such as the movement or interaction of gases, liquids, or other substances. By modeling the IWC as an ideal point source, the approach bypasses the need to incorporate these fluid behaviors, allowing the focus to remain on fundamental acoustic phenomena. This assumption provides a practical framework for simulating intestinal sound propagation while maintaining both computational efficiency and analytical accuracy.
Additionally, other components of the abdominal cavity, such as gaseous or liquid substances present in the peritoneal cavity, do not significantly impact the propagation or attenuation of sound waves generated by the IWC, and their effect on sound wave propagation is considered negligible. This study primarily focuses on the acoustic properties of the various tissue layers in the abdominal cavity, such as density ρ 0 and sound speed c [20]. These tissue properties determine the propagation, reflection, refraction, and attenuation of sound as it passes through the complex anatomical structures of the abdomen, enabling a more accurate simulation of intestinal sound within the human body. By concentrating on these acoustic properties, the model provides a simplified but effective representation of sound wave propagation.
To simulate the propagation of bowel sounds within the complex environment of the abdominal cavity, this study employs the pressure acoustics-elasticity model available in COMSOL, a widely recognized software platform for solving complex physics-based simulations. Specifically, the study focuses on time-domain simulations, which facilitate the analysis of sound wave behavior over time as it propagates through various tissue layers within the abdominal cavity [21]. The simulation is based on the classical wave equation, a fundamental principle in acoustics that describes the propagation of sound waves as they travel through different media. This wave equation captures the dynamic relationship between sound pressure and the physical properties of the medium [22]. The equation is mathematically represented as
                                                      1 ρ 0 c 2 2 p t 2 + ( 1 ρ 0 p ) = 0    
where p is the sound pressure, ρ 0 is the density of the medium, c is the speed of sound, and represents the gradient operator.
The first term 1 ρ 0 c 2 2 p t 2 in the equation describes the temporal variation of sound pressure. It provides insights into how sound waves evolve over time as they travel through the medium. This term captures the relationship between sound pressure and wave acceleration, influencing the velocity of sound wave propagation over time. Essentially, it models the inertial effects of the medium, reflecting the time-dependent behavior of sound waves. The second term, ( 1 ρ 0 p ) , describes the propagation and diffusion of sound waves through space. Specifically, the gradient operator p quantifies the variation of sound pressure at each spatial location, while the divergence operator describes the spatial spreading or focusing of the sound waves as they propagate through the medium. The negative sign in this term reflects the physical principle that pressure gradients drive the movement of the sound waves. As a result, this term captures how sound waves expand or contract as they travel through different tissue layers, potentially experiencing attenuation or changes in direction, depending on the properties of the surrounding medium.
To solve the wave equation numerically, COMSOL discretizes both space and time, transforming the continuous wave equation into a set of algebraic equations that can be solved iteratively. The spatial discretization divides the abdominal cavity into a mesh of smaller elements, each representing an approximation of the sound pressure and its gradient. The temporal discretization divides the simulation time into small time steps, allowing the tracking of dynamic changes in sound pressure over time. By discretizing both space and time, COMSOL enables a detailed simulation of the sound wave’s propagation and its interaction with the heterogeneous tissues in the abdominal cavity.

2.2.2. Sound Propagation Models

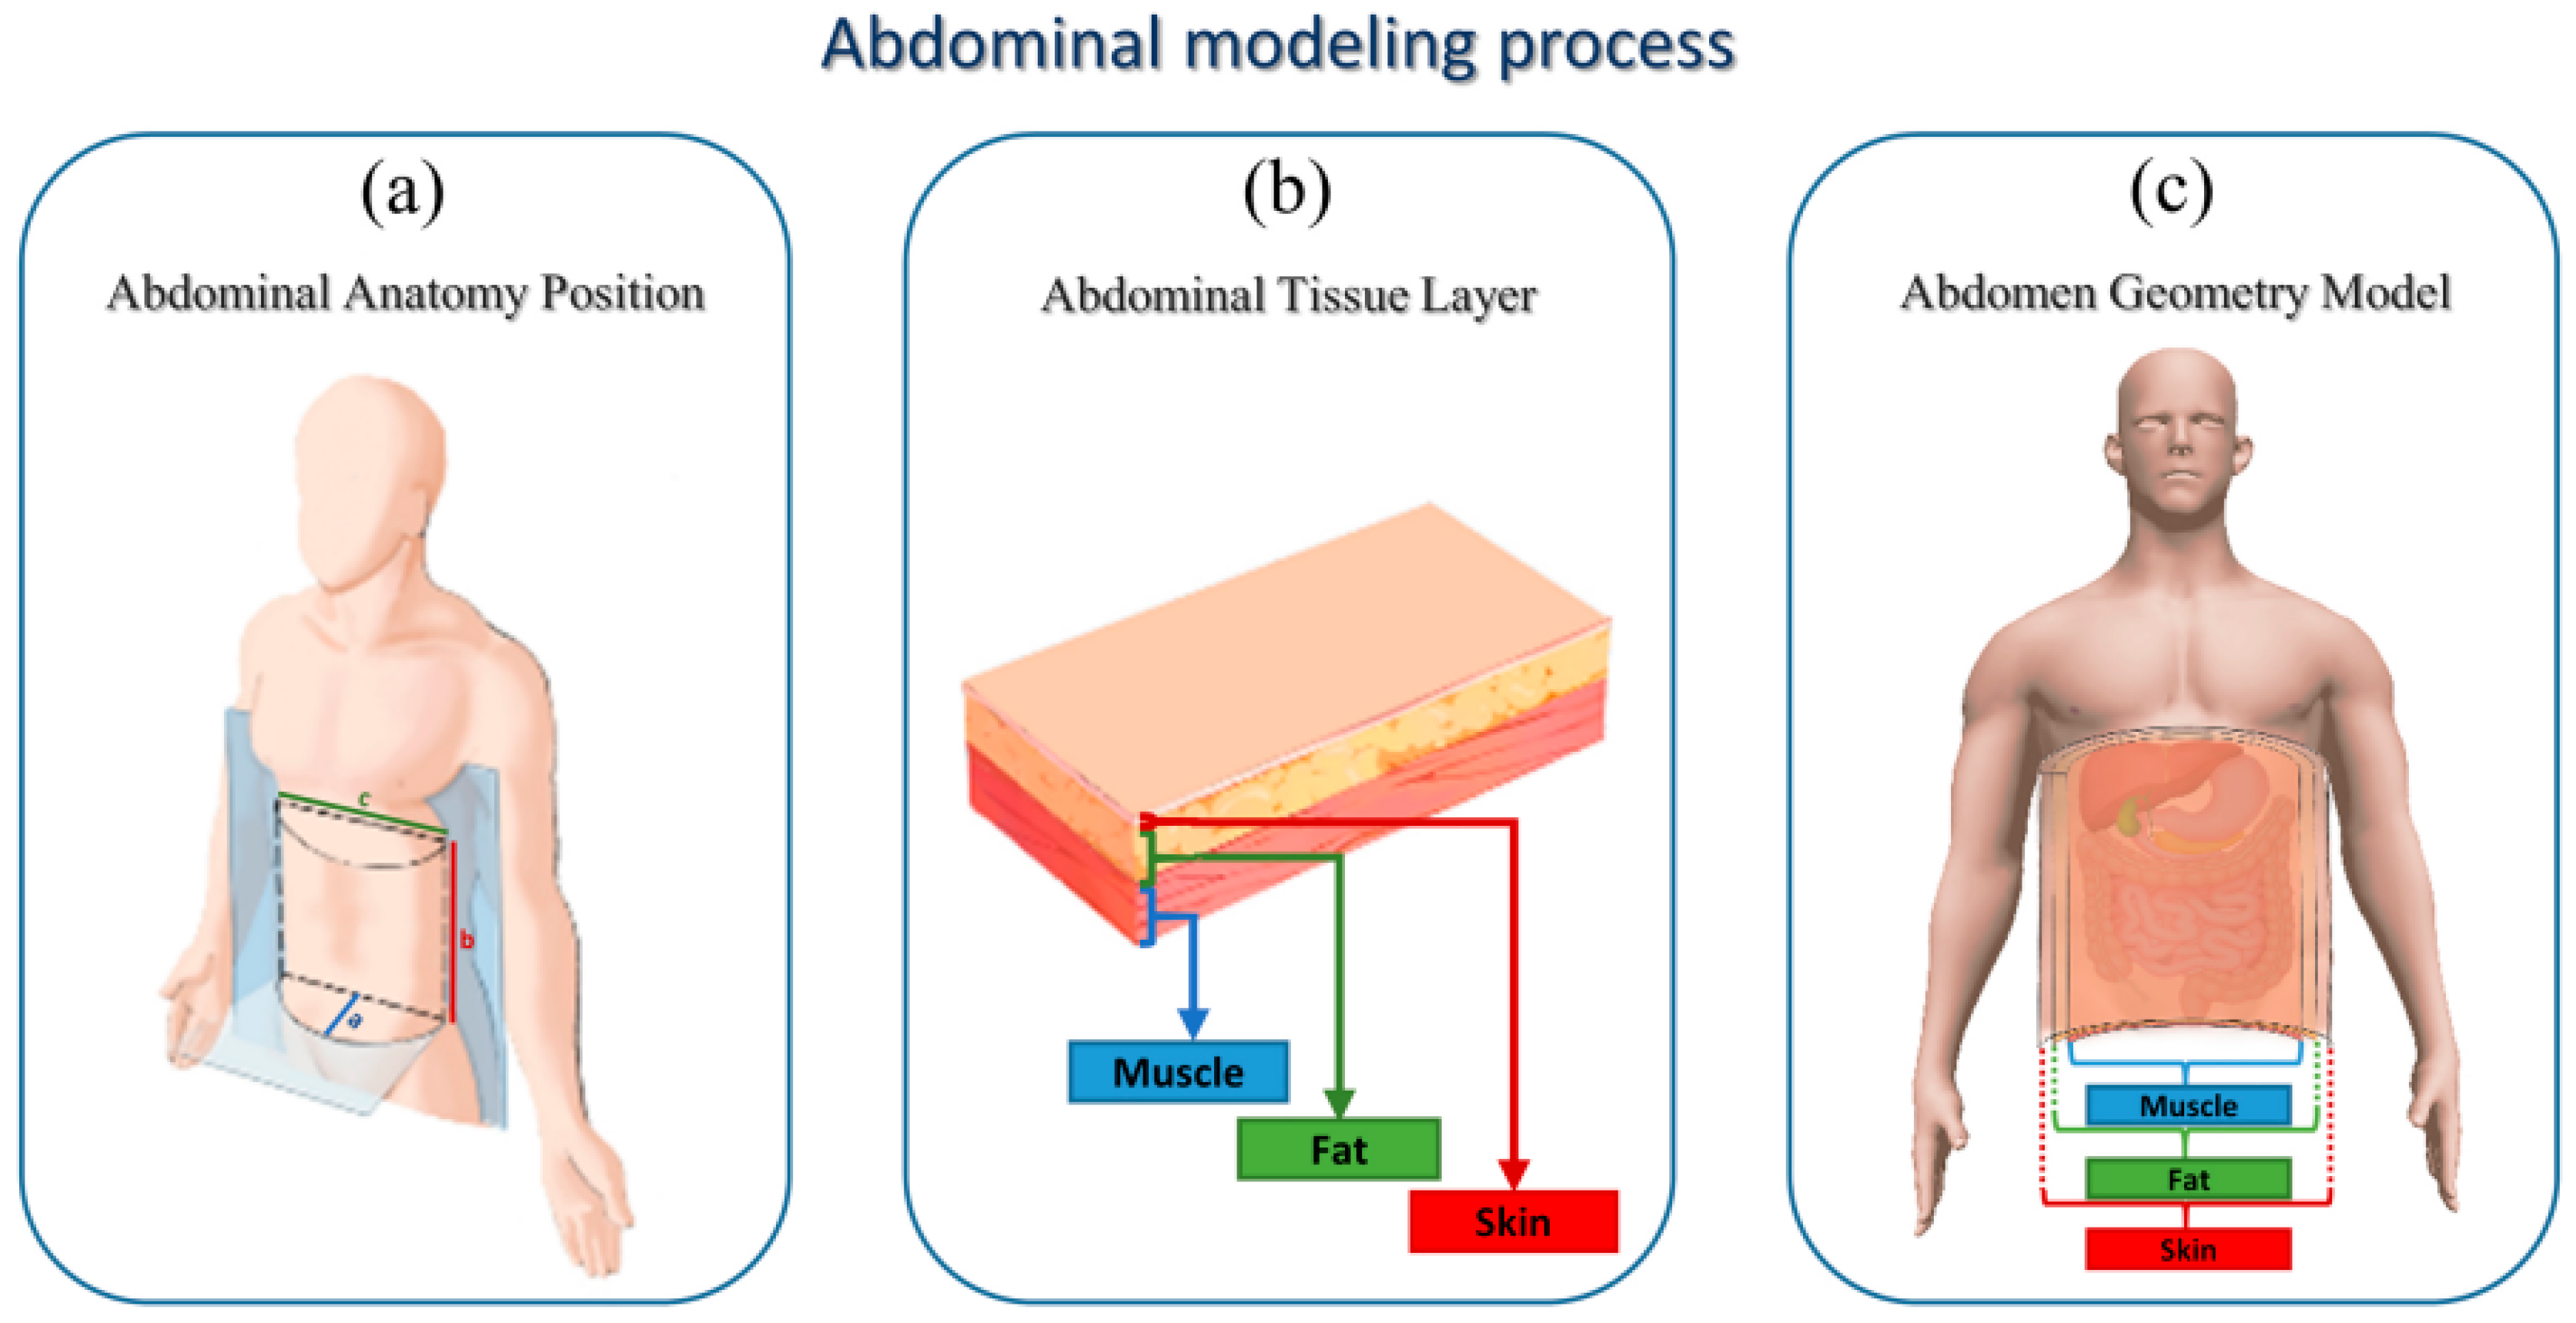
To simulate the propagation of bowel sounds within the abdominal cavity, obtaining anatomical data of the human abdomen is essential for determining its shape and size [23]. Given the clinical significance of the upper abdomen and its concentration of vital organs, we chose to focus our study on this region. However, we believe that the principles and methods employed in this study are equally applicable to other regions of the abdomen, providing a solid foundation for a more comprehensive understanding of bowel sound propagation. In order to model the propagation of bowel sounds within the abdominal cavity, we approximated the cavity as a semi-cylindrical structure in the coronal plane. This geometric representation not only streamlines the computational process but also maintains essential anatomical features, thereby aiding in the accurate simulation of sound wave propagation. The key dimensions of the abdominal cavity were determined based on average measurements of human anatomy, as shown in Figure 2a. The parameters “a”, “b”, and “c” denote the depth, length, and width of the peritoneal cavity, with respective measurements of 12.5 cm, 23 cm, and 25 cm [24]. Using this anatomical data, the thickness of each tissue layer within the abdominal cavity, including muscle, fat, and skin, was determined. For a typical human body, the muscle layer thickness is set at 12.50 mm, the fat layer thickness at 10.25 mm, and the skin layer thickness at 2.25 mm [25], as shown in Figure 2b. Additionally, as our model is a simulation, the values of parameters “a”, “b”, and “c”, as well as the thickness of each tissue layer, can be adjusted to reflect individual anatomical variations. This customization allows the model to more accurately represent the specific characteristics of each person’s abdominal cavity. By incorporating such flexibility, our model can be adapted to accommodate the anatomical differences among individuals, thereby enhancing its applicability and improving the precision of the simulations.
In this model, the peritoneum’s effect on sound propagation is assumed to be negligible, and the primary focus is on the influence of the fat and muscle layers, which significantly impact sound wave reflection, refraction, and attenuation. The composition and properties of these layers, such as their density, elasticity, and acoustic impedance, are essential for accurately predicting how sound waves behave as they travel through the abdominal cavity. This approach leads to a simplified yet effective representation of the abdominal cavity, as shown in Figure 2c, which incorporates the semi-cylindrical shape and multilayered structure of the tissue [26]. This modeling process establishes the geometric model of the abdominal cavity, which provides the necessary geometric foundation for the subsequent acoustic wave propagation simulation.
Bowel sounds have low frequencies, relatively long wavelengths, and short propagation distances in the abdominal cavity. As a result, the effects of absorption and frequency-dependent attenuation are negligible within the simulated frequency range. Based on this assumption, sound propagation can be regarded as a linear process mainly affected by the density and elasticity of the medium, and the speed of sound is a key indicator of the elasticity of the medium [27]. Accurately modeling the propagation of bowel sounds within the abdominal cavity requires defining the sound speed and density for each tissue layer [28]. Acoustic impedance, defined as the product of the density ( ρ ) and the speed of sound ( c ) of a medium ( Ζ = ρ c ), is a physical quantity that describes the resistance encountered by sound waves as they pass through a medium. As shown in Table 1, which lists the acoustic properties of different tissues, fat has the lowest acoustic impedance, implying that sound passes through it with the least resistance. Consequently, the fat layer allows sound to propagate with less reflection and greater transmission when coupled with other tissue layers, thereby facilitating the overall propagation of sound waves. These settings enable the software to automatically calculate the propagation, reflection, and refraction of bowel sounds as they interact with different tissue layers. This approach effectively captures the propagation characteristics of bowel sound waves in complex biological media, ensuring that the simulation results are both physically accurate and reasonable.

3. Results and Discussion

3.1. Model Validation

Computational modeling helps to overcome the limitations of analytical methods such as simple geometries or non-realistic hypothetical problems. In this study, a finite element model (FEM) [31] is used to calculate the sound pressure field at each interface point. The accuracy of the FEM depends on a computationally feasible and sufficiently fine mesh selection. In COMSOL, the number of degrees of freedom (DOF) per wavelength must meet specific guidelines in order to ensure model accuracy and convergence. For second-order Lagrangian elements, a minimum of six cells per wavelength is required to accurately capture the wave properties. In this study, the following formula was used to calculate the cell size for meshing:
h λ n = c n f m a x
h represents the element size, n denotes the number of elements, and λ denotes the wavelength, f m a x is the maximum frequency of bowel sounds and c is the speed of sound in different tissues. COMSOL automatically calculates the number of degrees of freedom required based on the element size.
Δ t 1 20 f m a x
Δ t denotes the time-step requirement, and f m a x denotes the maximum frequency.
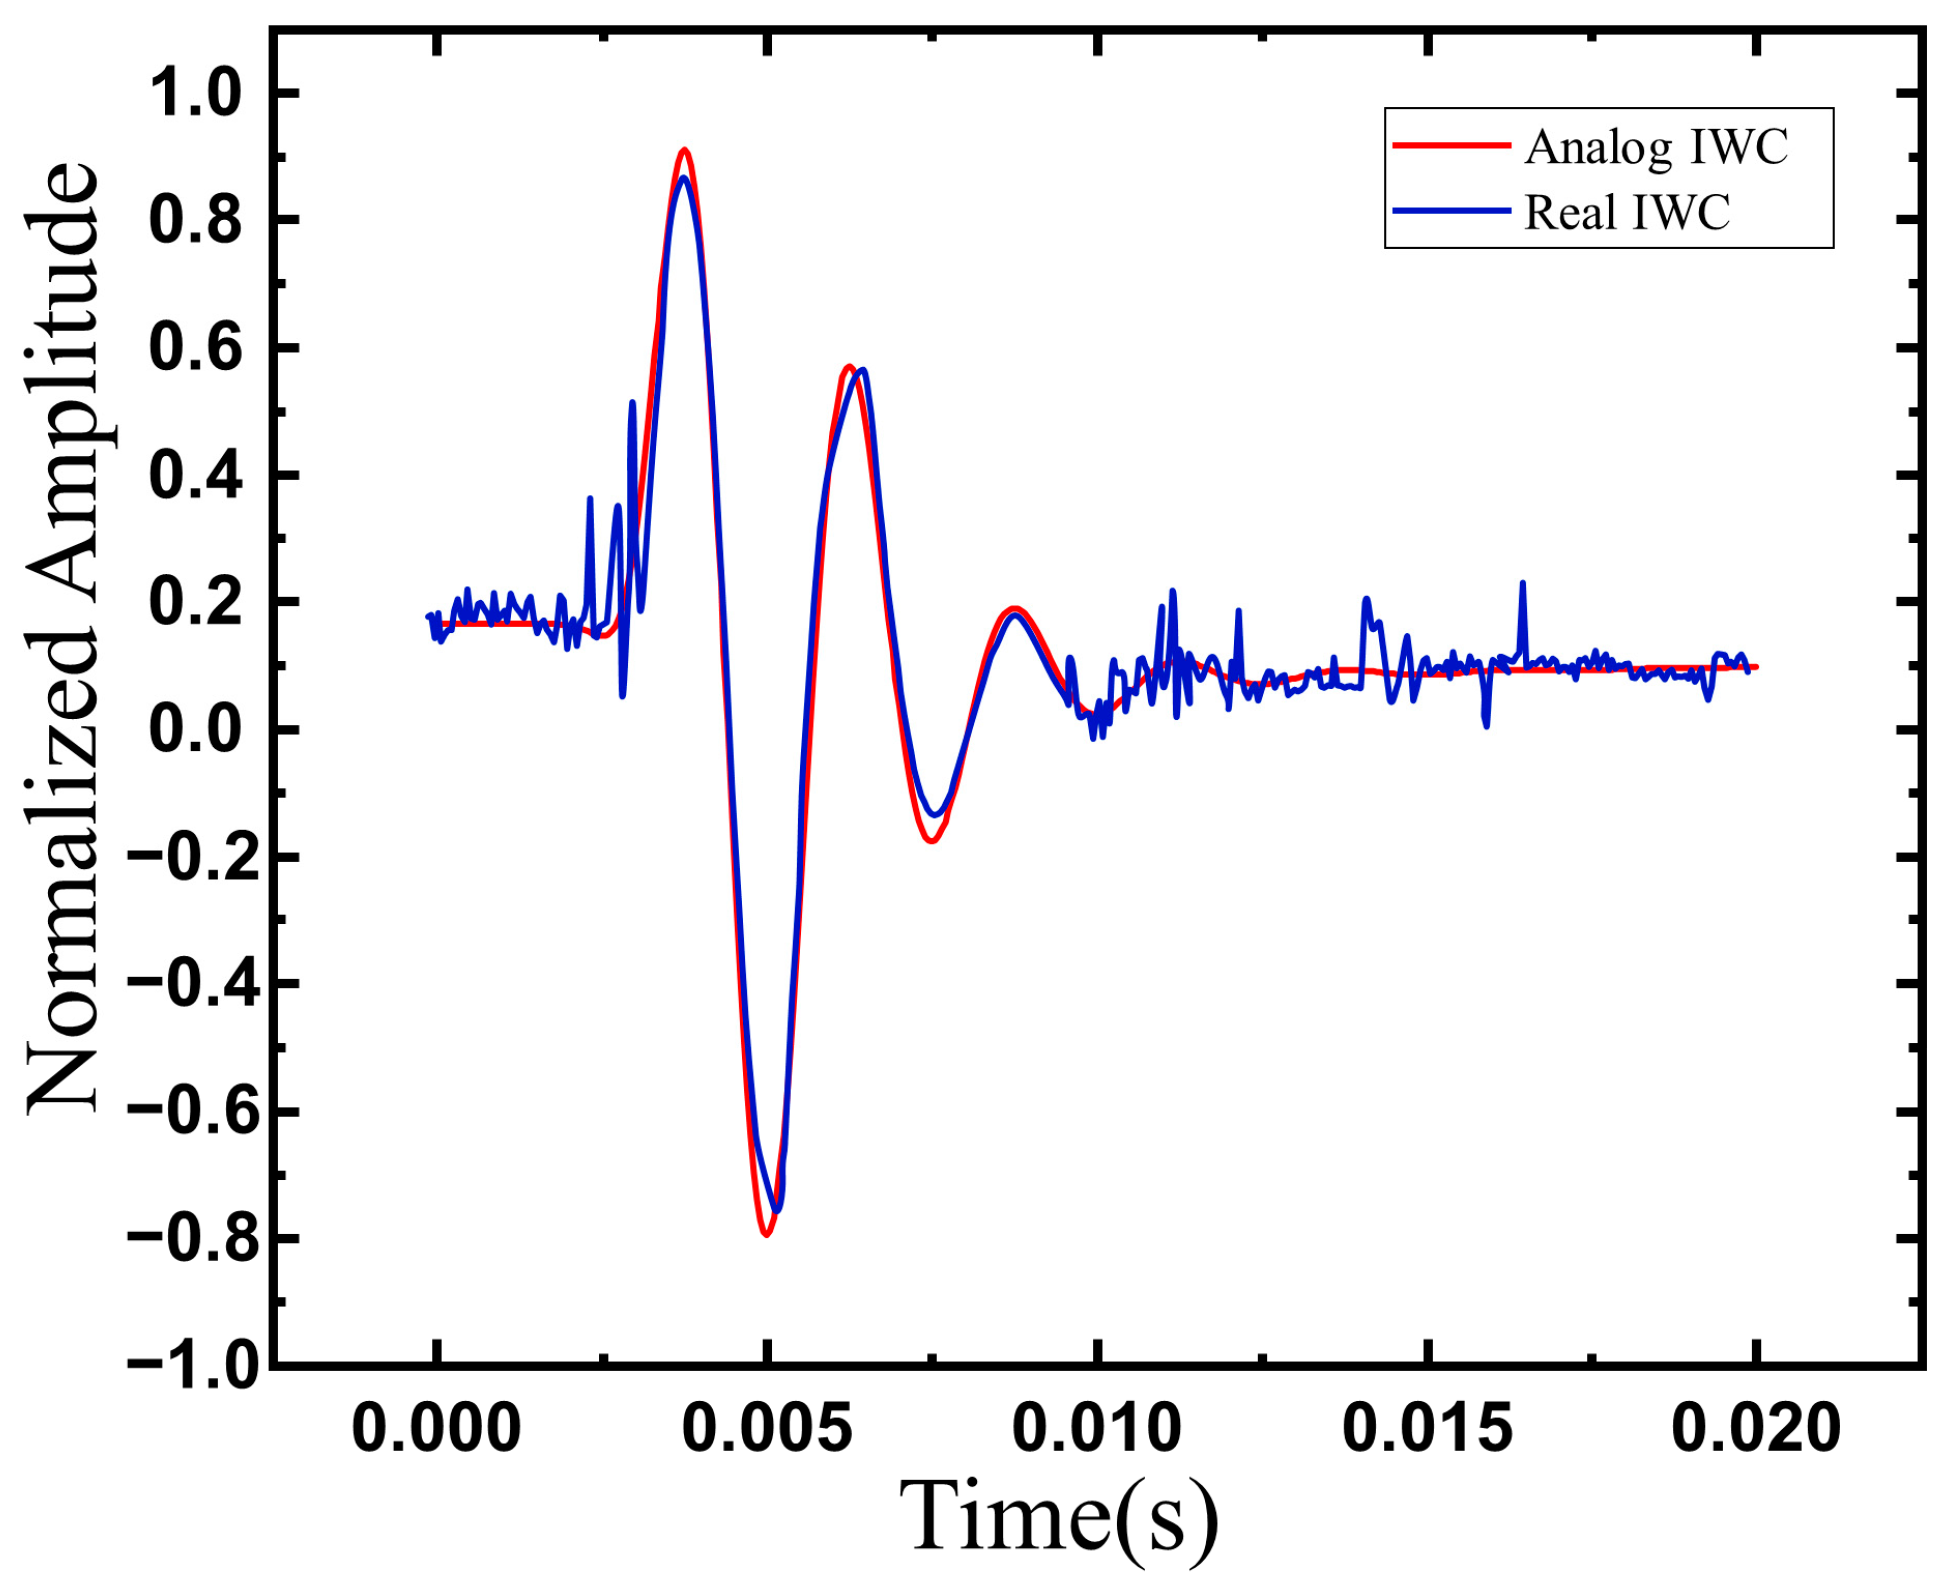
In this study, we validated the accuracy of the proposed model by comparing the IWC values obtained from simulating bowel sound propagation with actual IWC data collected from clinical measurements [32]. The comparison results shown in Figure 3 indicate that the amplitude values of the two waveforms are nearly identical at most time points, especially at the peaks and valleys. The real IWC signals may exhibit minor noise-induced variations. This high degree of overlap indicates that the two waveforms are very similar in the time domain, i.e., the signals are strongly coherent. This comparison reinforces the validity of the mathematical model proposed in the literature for the generation of bowel sounds and confirms the robustness and accuracy of our propagation model in simulating the propagation of sounds in the abdominal cavity.

3.2. Tissue Attenuation

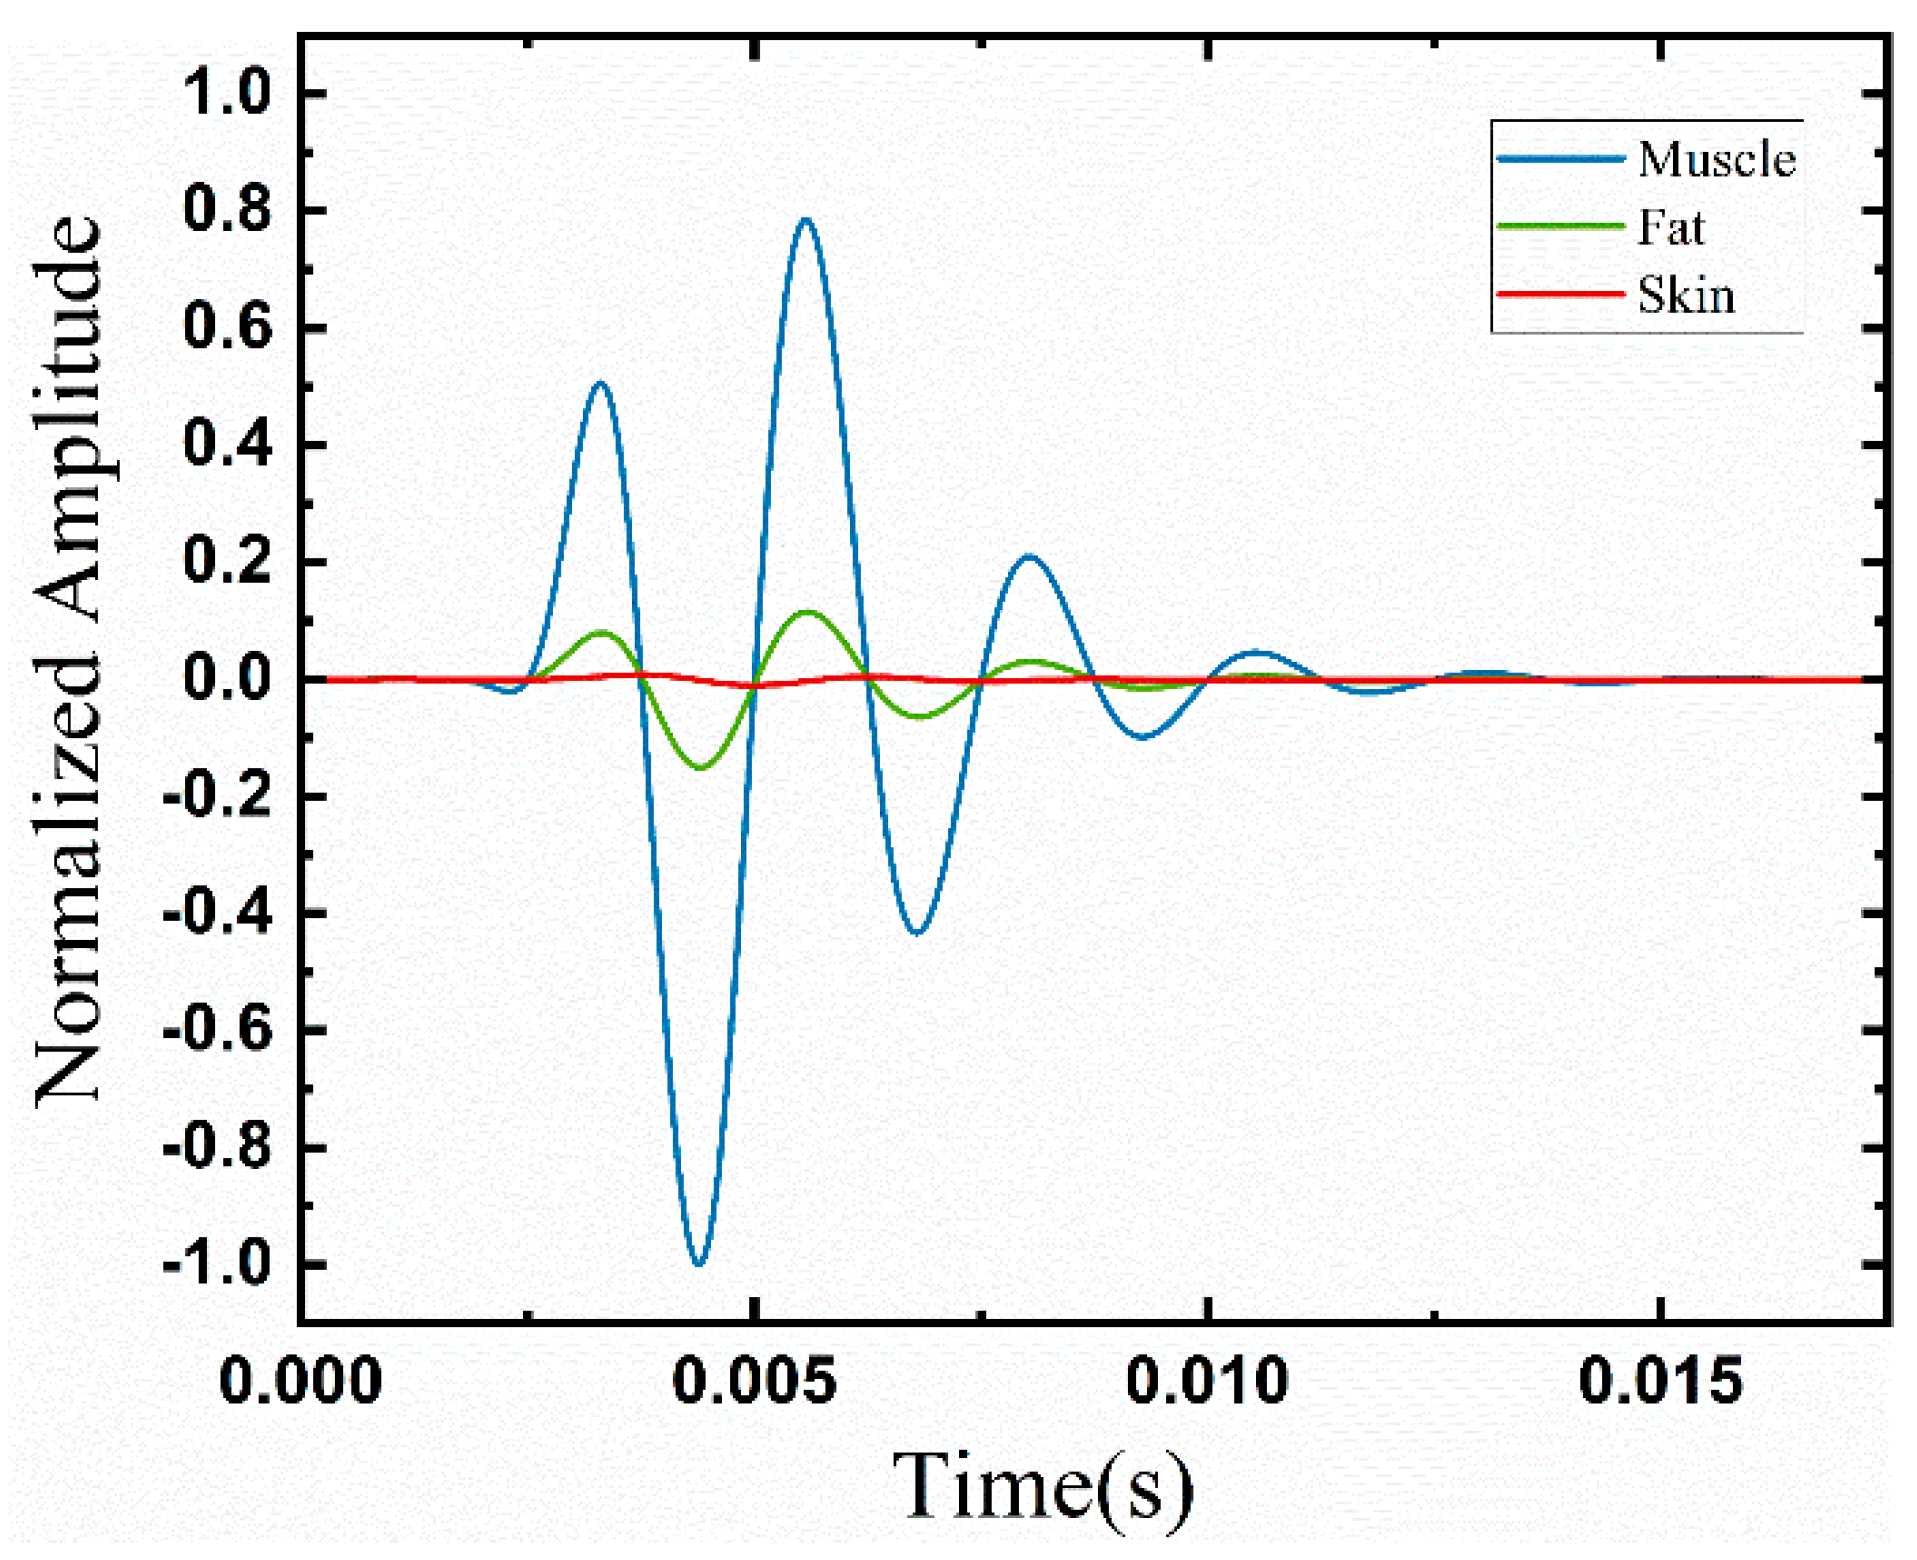
This study investigates how bowel sound signals propagate within the human abdominal cavity, emphasizing the attenuation of sound waves by the muscle, fat, and skin layers, influenced by the density and sound velocity of each tissue [33]. The propagation of sound waves in different tissues is significantly affected by the density and speed of sound of each tissue, with denser or lower speed sound tissues usually leading to stronger signal attenuation. To analyze this phenomenon in depth, this study quantitatively assessed the signal attenuation by collecting bowel sound waveform data from different tissue surfaces.
As shown in Figure 4, the amplitude strength of the signals gradually weakened as the propagation distance of the bowel sound signals increased and as they passed through different tissue layers. This attenuation trend indicates that the absorption and scattering of sound waves by various tissue layers during propagation cannot be ignored. The results showed that muscle had the highest attenuation at −29.35 dB, followed by skin at −22.77 dB, and fat, which exhibited the least attenuation at −16.48 dB. These findings are consistent with those reported in the literature [34] and provide further evidence of the differential impact of various tissues on sound wave propagation. This pattern of attenuation underscores the varying degrees to which different tissues influence signal transmission, with muscle presenting the most significant impact, followed by skin, and fat having the least effect.

3.3. Fat Thickness Effects

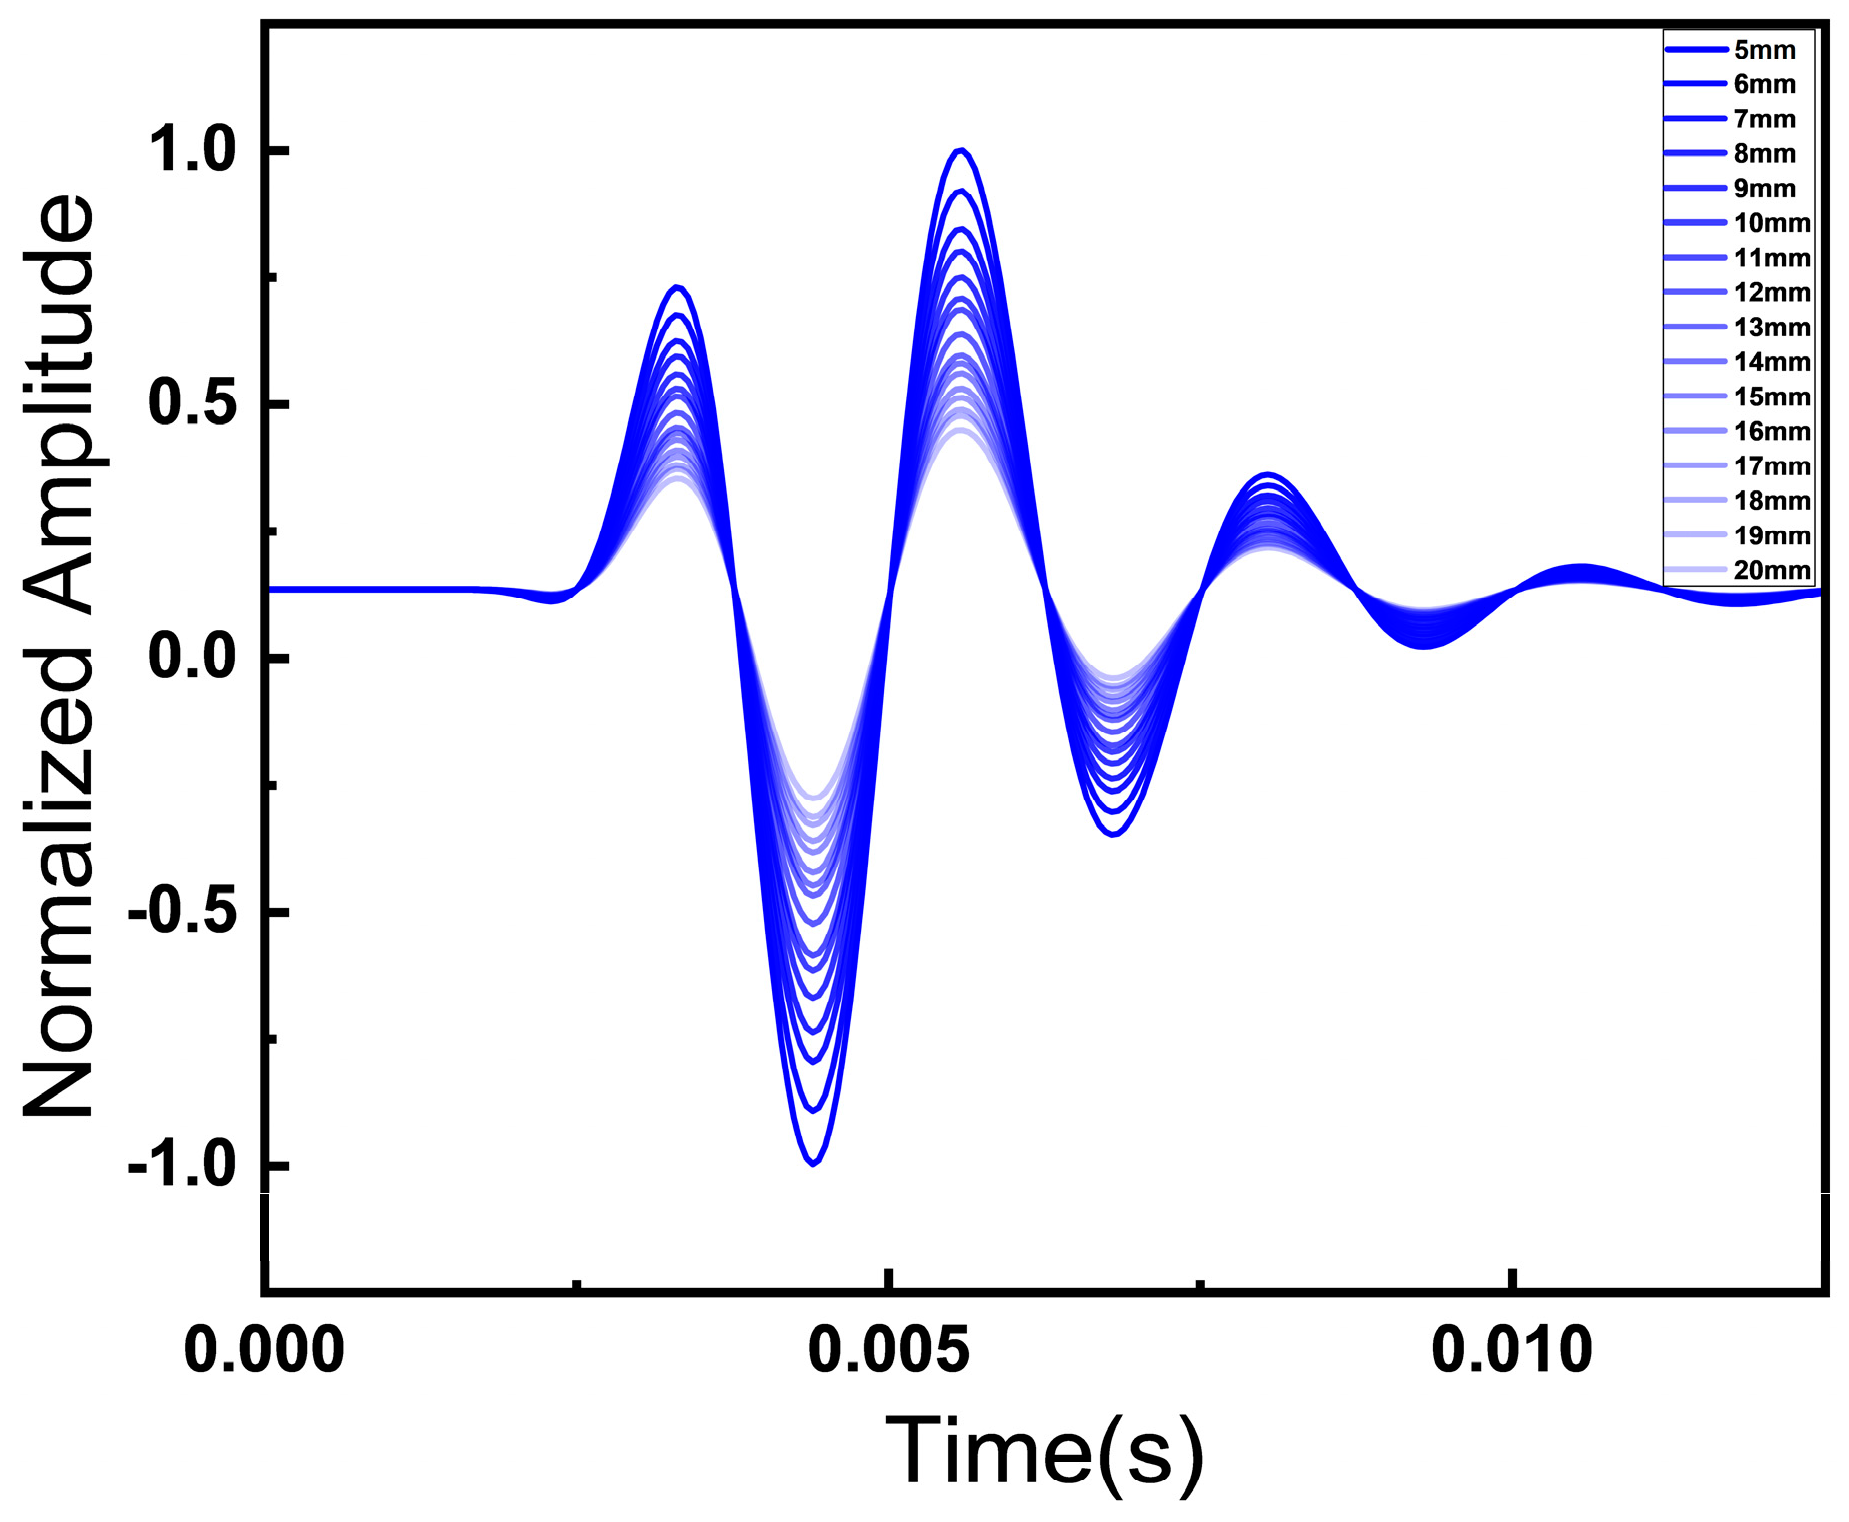
The thickness of the fat layer significantly affects medical imaging and physiological monitoring, especially in simulating abdominal signal propagation [35,36]. Fat layer thickness can influence the propagation characteristics of bowel sound signals. To investigate its specific effects, we varied the fat layer thickness in the propagation model. This approach enabled a detailed analysis of how different thicknesses affect signal transmission, providing deeper insights into the factors influencing bowel sound acquisition and analysis. Figure 5 illustrates the changes in the IWC waveform on the surface of the fat layer when the thickness ranges from 5 to 20 mm. The waveform exhibits a clear trend: as the thickness of the fat layer increases, the amplitude of the IWC waveform decreases. This reduction in amplitude indicates a positive correlation between fat layer thickness and signal attenuation. These findings underscore the importance of considering fat layer thickness in simulations of bowel sound propagation.
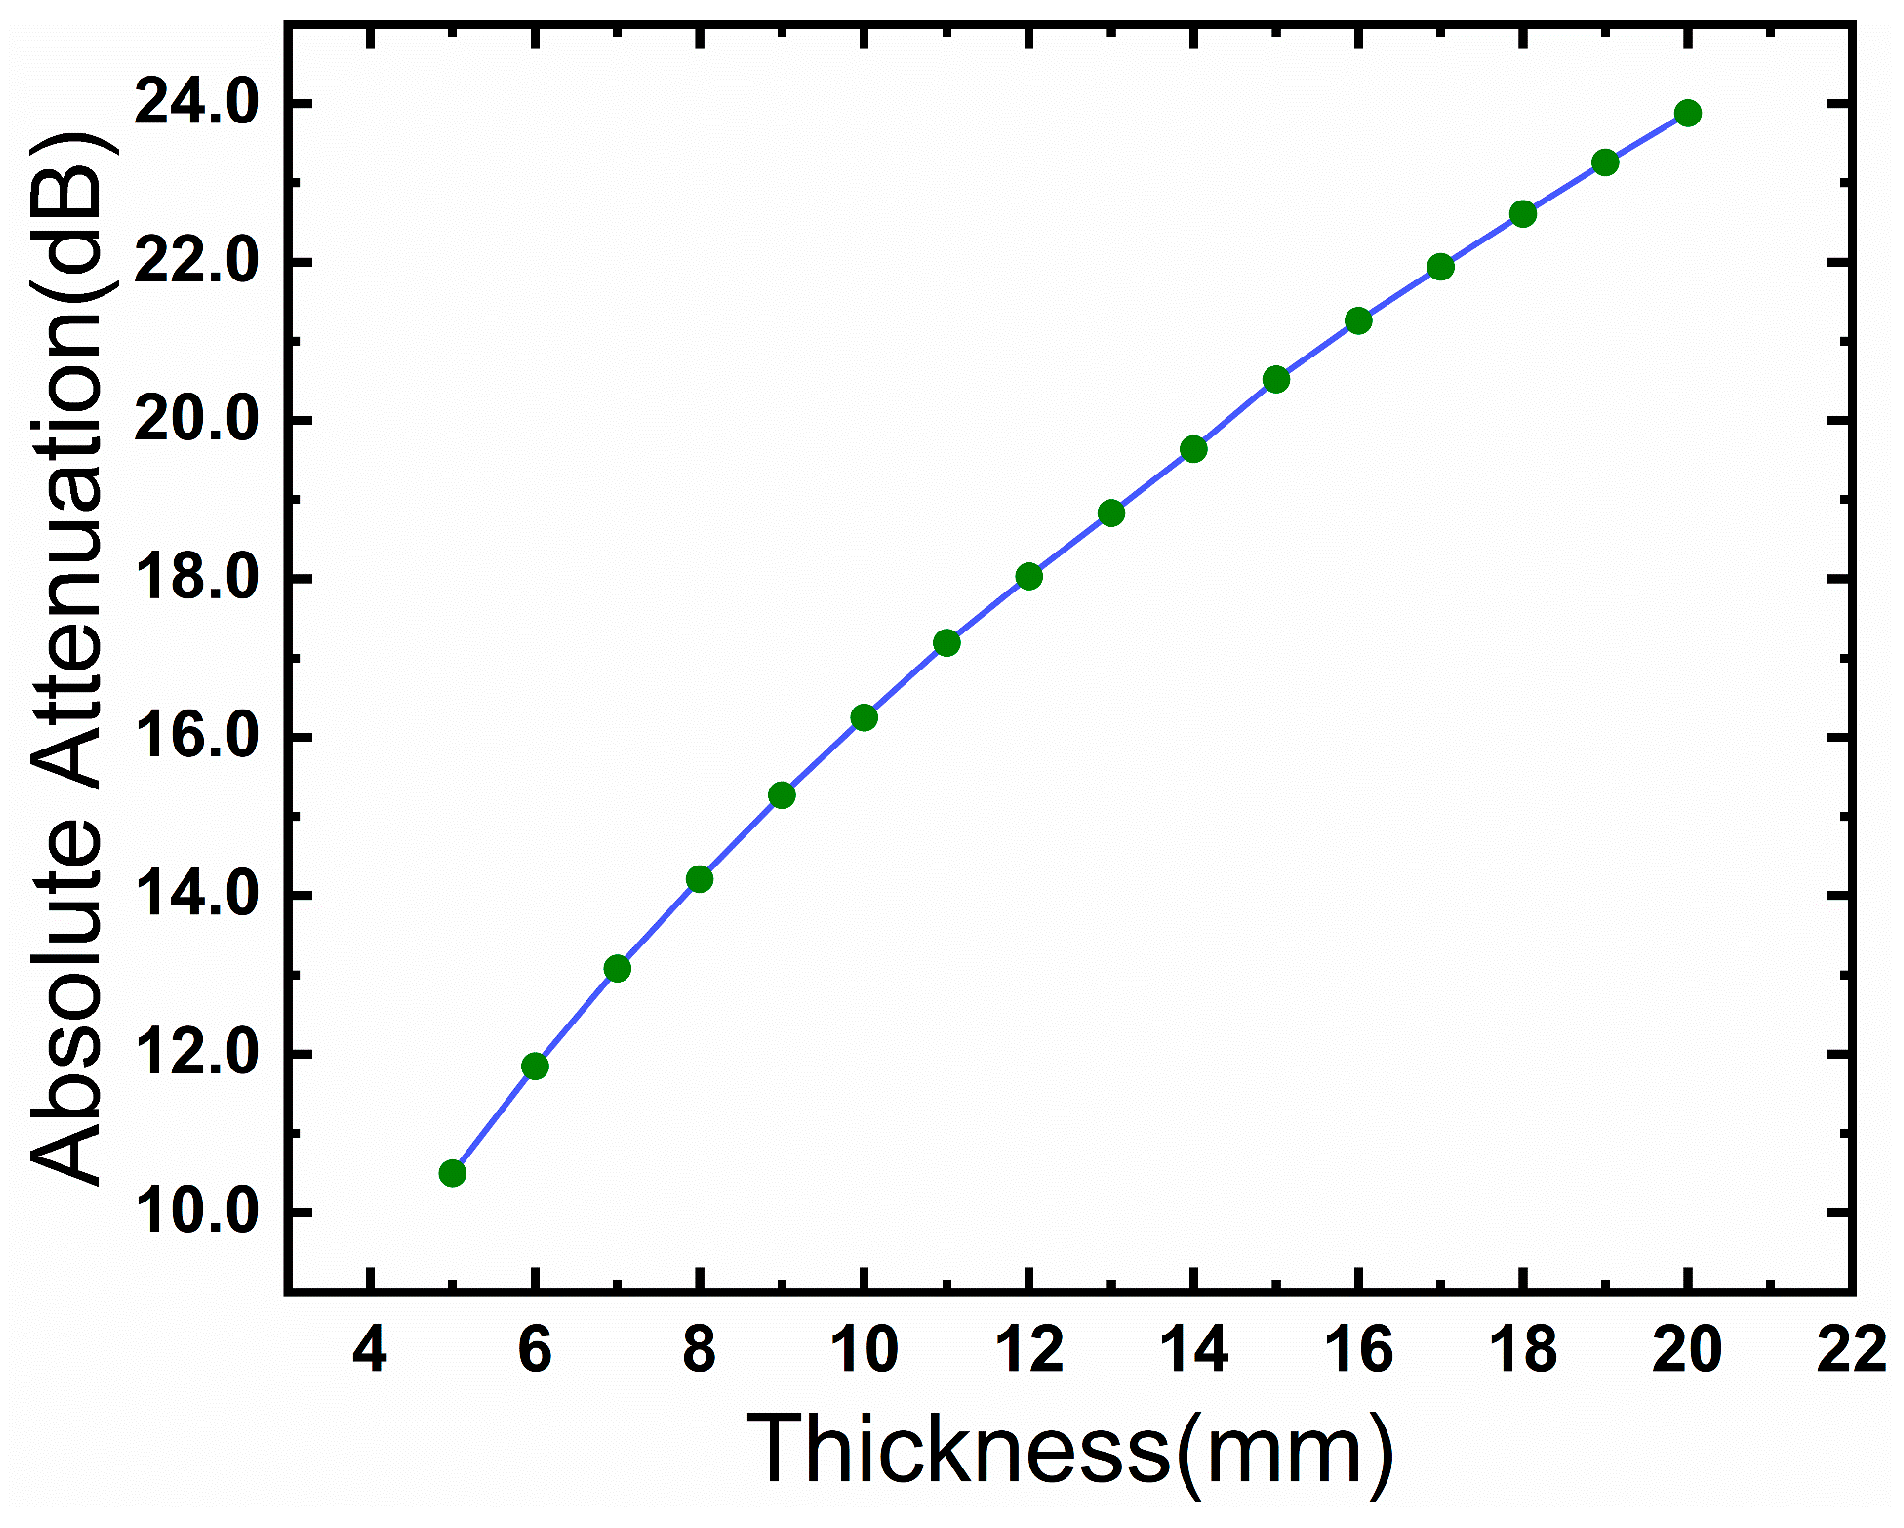
Figure 6 illustrates the relationship between attenuation values and fat layer thickness. Signal attenuation was calculated using the root-mean-square (RMS) ratios of the initial and final signals, with the results expressed in decibels (dB), which represent the logarithmic change in signal intensity [37]. As the thickness of the fat layer increases, the signal attenuation also increases, but the relationship is non-linear. Initially, the attenuation grows rapidly with small increases in thickness, especially between 4 mm and 10 mm, due to stronger scattering and absorption interactions. However, as the thickness continues to increase, from 10 mm to 20 mm, the rate of attenuation growth slows down, eventually reaching a saturation point where further increases in thickness have minimal additional effect on signal attenuation. This non-linear trend suggests that the primary contributors to attenuation, such as scattering and absorption within the fat, have diminishing returns at higher thicknesses [38].
Comprehending the impact of fat layer thickness on signal attenuation is essential for the clinical interpretation of bowel sounds and for accounting for individual differences during diagnostic assessments. The fat layer’s thickness directly influences the amplitude of the detected signal, as shown in the observed decrease in waveform amplitude with increasing thickness. Beyond a critical thickness, further increases in fat layer thickness result in smaller changes in attenuation, which highlights the need to account for individual variations in fat distribution during diagnostic assessments. Understanding this relationship helps to refine non-invasive diagnostic techniques and enhances the interpretation of bowel sounds.

4. Conclusions

Bowel sounds are critical physiological signals with significant diagnostic value, often used in the early detection of gastrointestinal diseases. In this study, we investigated the impact of different tissue layers on the propagation of bowel sounds, with a particular focus on the effect of fat layer thickness on signal attenuation. The results show that the simulated IWC captured on the surface of the propagation model has a strong similarity with the clinically captured IWC signal, proving the validity of our proposed propagation model. The fat layer has a relatively small effect on signal propagation, but its thickness is a key factor contributing to interindividual differences in sound attenuation. As the thickness of the fat layer and the propagation distance increased, the attenuation of bowel sounds during propagation also increased.
To enhance the model’s relevance to real-world clinical circumstances, future research should investigate the relationship between bowel sounds recorded from the abdominal surface and disease characteristics across individuals, with a particular focus on the impact of chronic diseases on bowel function. For example, conditions like diabetes and right heart failure can affect the blood supply and function of the gastrointestinal tract, potentially altering bowel activity [39]. Future model optimization should focus not only on combining various types of bowel sound signals to create a rich sound source, but also on the generation of pathology-related bowel sound signals. This will contribute to a more comprehensive understanding of intestinal activity and enhance the model’s ability to analyze different pathological states. In addition, it is particularly important to improve the computational efficiency and runtime of the model, especially when performing large-scale clinical data analysis. Optimizing these aspects will enhance the real-time performance and adaptability of the model, making it more valuable for clinical applications. With these improvements, the model will support the customization of more personalized bowel sound simulations to help provide clinical treatment options, implement early interventions, and facilitate accurate disease management in clinical practice. Based on this foundation, it will be possible to develop more reliable, efficient, and tailored diagnostic tools. Ultimately, this will lead to more effective treatments for patients and promote the development of individualized medicine.

Author Contributions

Conceptualization, X.D. and Y.Z.; methodology, X.D.; validation, X.D.; formal analysis, X.D.; investigation, X.D. and Y.X.; data curation, X.D.; writing—original draft preparation, X.D.; writing—review and editing, X.D. and Y.Z.; visualization, X.D.; supervision, Y.X. and Y.Z. All authors have read and agreed to the published version of the manuscript.

Funding

This research received no external funding.

Institutional Review Board Statement

Not applicable.

Informed Consent Statement

Not applicable.

Data Availability Statement

The original contributions presented in the study are included in the article; further inquiries can be directed to the corresponding author.

Conflicts of Interest

The authors declare no conflicts of interest.

References

  1. Dey, N.; Ashour, A.S.; Mohamed, W.S.; Nguyen, N.G. Acoustic Wave Technology. In Acoustic Sensors for Biomedical Applications; Dey, N., Ashour, A.S., Mohamed, W.S., Nguyen, N.G., Eds.; Springer International Publishing: Cham, Switzerland, 2019; pp. 21–31. ISBN 978-3-319-92225-6. [Google Scholar]
  2. Inderjeeth, A.-J.; Webberley, K.M.; Muir, J.; Marshall, B.J. The potential of computerised analysis of bowel sounds for diagnosis of gastrointestinal conditions: A systematic review. Syst. Rev. 2018, 7, 124. [Google Scholar] [CrossRef] [PubMed]
  3. Liatsos, C.; Hadjileontiadis, L.J.; Mavrogiannis, C.; Patch, D.; Panas, S.M.; Burroughs, A.K. Bowel Sounds Analysis: A Novel Noninvasive Method for Diagnosis of Small-Volume Ascites. Dig. Dis. Sci. 2003, 48, 1630–1636. [Google Scholar] [CrossRef]
  4. Craine, B.L.; Silpa, M.L.; O’Toole, C.J. Two-Dimensional Positional Mapping of Gastrointestinal Sounds in Control and Functional Bowel Syndrome Patients. Dig. Dis. Sci. 2002, 47, 1290–1296. [Google Scholar] [CrossRef]
  5. Gu, Y.; Lim, H.J.; Moser, M.A.J. How Useful Are Bowel Sounds in Assessing the Abdomen? Dig. Surg. 2010, 27, 422–426. [Google Scholar] [CrossRef] [PubMed]
  6. Elhardello, O.; Macfie, J. Bowel Sounds: Is it Time for Surgeons to Hang-up their Stethoscopes? World J. Surg. Surg. Res. Gen. Surg. 2018, 1, 1066. [Google Scholar]
  7. Namikawa, T.; Yamaguchi, S.; Fujisawa, K.; Ogawa, M.; Iwabu, J.; Munekage, M.; Uemura, S.; Maeda, H.; Kitagawa, H.; Kobayashi, M.; et al. Real-time bowel sound analysis using newly developed device in patients undergoing gastric surgery for gastric tumor. JGH Open 2021, 5, 454–458. [Google Scholar] [CrossRef]
  8. Li, B.; Wang, J.-R.; Ma, Y.-L. Bowel Sounds and Monitoring Gastrointestinal Motility in Critically Ill Patients. Clin. Nurse Spec. 2012, 26, 29–34. [Google Scholar] [CrossRef]
  9. Ding, X.; Wu, Z.; Gao, M.; Chen, M.; Li, J.; Wu, T.; Lou, L. A High-Sensitivity Bowel Sound Electronic Monitor Based on Piezoelectric Micromachined Ultrasonic Transducers. Micromachines 2022, 13, 2221. [Google Scholar] [CrossRef]
  10. Wang, N.; Testa, A.; Marshall, B.J. Development of a bowel sound detector adapted to demonstrate the effect of food intake. Biomed. Eng. OnLine 2022, 21, 1. [Google Scholar] [CrossRef]
  11. Mansour, Z.; Uslar, V.; Weyhe, D.; Hollosi, D.; Strodthoff, N. SonicGuard Sensor—A Multichannel Acoustic Sensor for Long-Term Monitoring of Abdominal Sounds Examined through a Qualification Study. Sensors 2024, 24, 1843. [Google Scholar] [CrossRef]
  12. Du, X.; Allwood, G.; Webberley, K.M.; Osseiran, A.; Wan, W.; Volikova, A.; Marshall, B.J. A mathematical model of bowel sound generation. J. Acoust. Soc. Am. 2018, 144, EL485–EL491. [Google Scholar] [CrossRef]
  13. Ranta, R.; Louis-Dorr, V.; Heinrich, C.; Wolf, D.; Guillemin, F. Towards an acoustic map of abdominal activity. In Proceedings of the 25th Annual International Conference of the IEEE Engineering in Medicine and Biology Society (IEEE Cat. No.03CH37439), Copenhagen, Denmark, 14–17 July 2025; IEEE: Cancun, Mexico, 2003; pp. 2769–2772. [Google Scholar]
  14. Williams, C.J.B. Physical Examination of the Abdomen in Health and Disease:—Acoustic Signs. BMJ 1852, s2–4, 1–7. [Google Scholar] [CrossRef] [PubMed]
  15. Praticò, F.G.; Fedele, R.; Briante, P.G. On the Dependence of Acoustic Pore Shape Factors on Porous Asphalt Volumetrics. Sustainability 2021, 13, 11541. [Google Scholar] [CrossRef]
  16. Mast, T.D.; Hinkelman, L.M.; Orr, M.J.; Waag, R.C. The effect of abdominal wall morphology on ultrasonic pulse distortion. Part II. Simulations. J. Acoust. Soc. Am. 1998, 104, 3651–3664. [Google Scholar] [CrossRef]
  17. Awal, R.; Jusoh, M.; Yahya, M.S.; Latiff, N.A.A.; Rahman, S.A.; Nazri, A.; Zakaria, H.A.; Saat, S. ACOUSTIC Wave Propagation in High Scale Impedance Mismatch Mediums. Chem. Biotechnol. Eng. 2021, 22, 1–9. [Google Scholar] [CrossRef]
  18. Qaleh Jooq, M.K.; Mir, A.; Mirzakuchaki, S.; Farmani, A. Semi-analytical modeling of high performance nano-scale complementary logic gates utilizing ballistic carbon nanotube transistors. Phys. E Low-Dimens. Syst. Nanostruct. 2018, 104, 286–296. [Google Scholar] [CrossRef]
  19. COMSOL Multiphysics®; Version 6.2.; COMSOL AB: Stockholm, Sweden, 2023; Available online: www.comsol.com (accessed on 1 January 2024).
  20. Kim, D.-M.; Park, S.-K.; Park, S.-G. A Study on the Performance Evaluation Criteria and Methods of Abdominal Ultrasound Devices Based on International Standards. Safety 2021, 7, 31. [Google Scholar] [CrossRef]
  21. Tran, Q.D.; Jang, G.-W.; Kwon, H.-S.; Cho, W.-H.; Cho, S.-H.; Cho, Y.-H.; Seo, H.-S. Shape optimization of acoustic lenses for underwater imaging. J. Mech. Sci. Technol. 2016, 30, 4633–4644. [Google Scholar] [CrossRef]
  22. Čertík, O. Theoretical Physics Reference. Available online: https://ondrejcertik.com/projects/contributions/tfr/ (accessed on 5 March 2025).
  23. Lancerotto, L.; Stecco, C.; Macchi, V.; Porzionato, A.; Stecco, A.; De Caro, R. Layers of the abdominal wall: Anatomical investigation of subcutaneous tissue and superficial fascia. Surg. Radiol. Anat. 2011, 33, 835–842. [Google Scholar] [CrossRef]
  24. Lawson, T.L.; Berland, L.L.; Foley, W.D. Coronal upper abdominal anatomy: Technique and gastrointestinal applications. Gastrointest. Radiol. 1981, 6, 115–128. [Google Scholar] [CrossRef]
  25. Arpaia, P.; Cuneo, D.; Grassini, S.; Mancino, F.; Minucci, S.; Moccaldi, N.; Sannino, I. A finite element model of abdominal human tissue for improving the accuracy in insulin absorption assessment: A feasibility study. Meas. Sens. 2021, 18, 100218. [Google Scholar] [CrossRef]
  26. Nadimi, E.S.; Blanes-Vidal, V.; Harslund, J.L.F.; Ramezani, M.H.; Kjeldsen, J.; Johansen, P.M.; Thiel, D.; Tarokh, V. In vivo and in situ measurement and modelling of intra-body effective complex permittivity. Healthc. Technol. Lett. 2015, 2, 135–140. [Google Scholar] [CrossRef]
  27. Ahmed, H.M. Ultrasonic Estimation of Soft Tissue Visco Elastic Properties. arXiv 2022, arXiv:2210.02446. [Google Scholar]
  28. Mast, T.D.; Hinkelman, L.M.; Orr, M.J.; Sparrow, V.W.; Waag, R.C. Simulation of ultrasonic pulse propagation through the abdominal wall. J. Acoust. Soc. Am. 1997, 102, 1177–1190. [Google Scholar] [CrossRef] [PubMed]
  29. Goss, S.A.; Johnston, R.L.; Dunn, F. Comprehensive compilation of empirical ultrasonic properties of mammalian tissues. J. Acoust. Soc. Am. 1978, 64, 423–457. [Google Scholar] [CrossRef]
  30. Woodard, H.Q. The composition of body tissues. Br. J. Radiol. 1986, 59, 1209–1218. [Google Scholar] [CrossRef] [PubMed]
  31. Thompson, L.L. A review of finite-element methods for time-harmonic acoustics. J. Acoust. Soc. Am. 2006, 119, 1315–1330. [Google Scholar] [CrossRef]
  32. Chen, Z.; Montlouis, W. Bowel Movement Signal Modeling and Parameters Extraction. In Proceedings of the 2020 Asia-Pacific Signal and Information Processing Association Annual Summit and Conference (APSIPA ASC), Auckland, New Zealand, 7–10 December 2020. [Google Scholar]
  33. Koch, T. Predicting the Intramuscular Fat Content in Porcine M. longissimus via Ultrasound Spectral Analysis with Consideration of Structural and Compositional Traits. Ph.D. Thesis, Georg-August-University Göttingen, Göttingen, Germany, 2011. [Google Scholar]
  34. Vasisht, D.; Zhang, G.; Abari, O.; Lu, H.-M.; Flanz, J.; Katabi, D. In-body backscatter communication and localization. In Proceedings of the 2018 Conference of the ACM Special Interest Group on Data Communication, Budapest, Hungary, 20–25 August 2018; ACM: Budapest Hungary, 2018; pp. 132–146. [Google Scholar]
  35. Lewandowski, Z.; Dychała, E.; Pisula-Lewandowska, A.; Danel, D.P. Comparison of Skinfold Thickness Measured by Caliper and Ultrasound Scanner in Normative Weight Women. Int J Env. Res Public Health 2022, 19, 16230. [Google Scholar] [CrossRef]
  36. Pérez-Chirinos Buxadé, C.; Solà-Perez, T.; Castizo-Olier, J.; Carrasco-Marginet, M.; Roy, A.; Marfell-Jones, M.; Irurtia, A. Assessing subcutaneous adipose tissue by simple and portable field instruments: Skinfolds versus A-mode ultrasound measurements. PLoS ONE 2018, 13, e0205226. [Google Scholar] [CrossRef]
  37. Masui, A.; Tsuji, H.; Tamura, K.; Tarumi, N.; Sugiura, T.; Iwasaka, T.; Inada, M. Effect of Body Characteristics on the Variables of Signal-averaged Electrocardiograms in Healthy Subjects. Chest 1994, 105, 1357–1359. [Google Scholar] [CrossRef]
  38. Liao, Y.-Y.; Yang, K.-C.; Lee, M.-J.; Huang, K.-C.; Chen, J.-D.; Yeh, C.-K. Multifeature analysis of an ultrasound quantitative diagnostic index for classifying nonalcoholic fatty liver disease. Sci. Rep. 2016, 6, 35083. [Google Scholar] [CrossRef]
  39. Duchnowski, P.; Śmigielski, W. Usefulness of myocardial damage biomarkers in predicting cardiogenic shock in patients undergoing heart valve surgery. Pol. Heart J. 2024, 82, 423–426. [Google Scholar] [CrossRef] [PubMed]
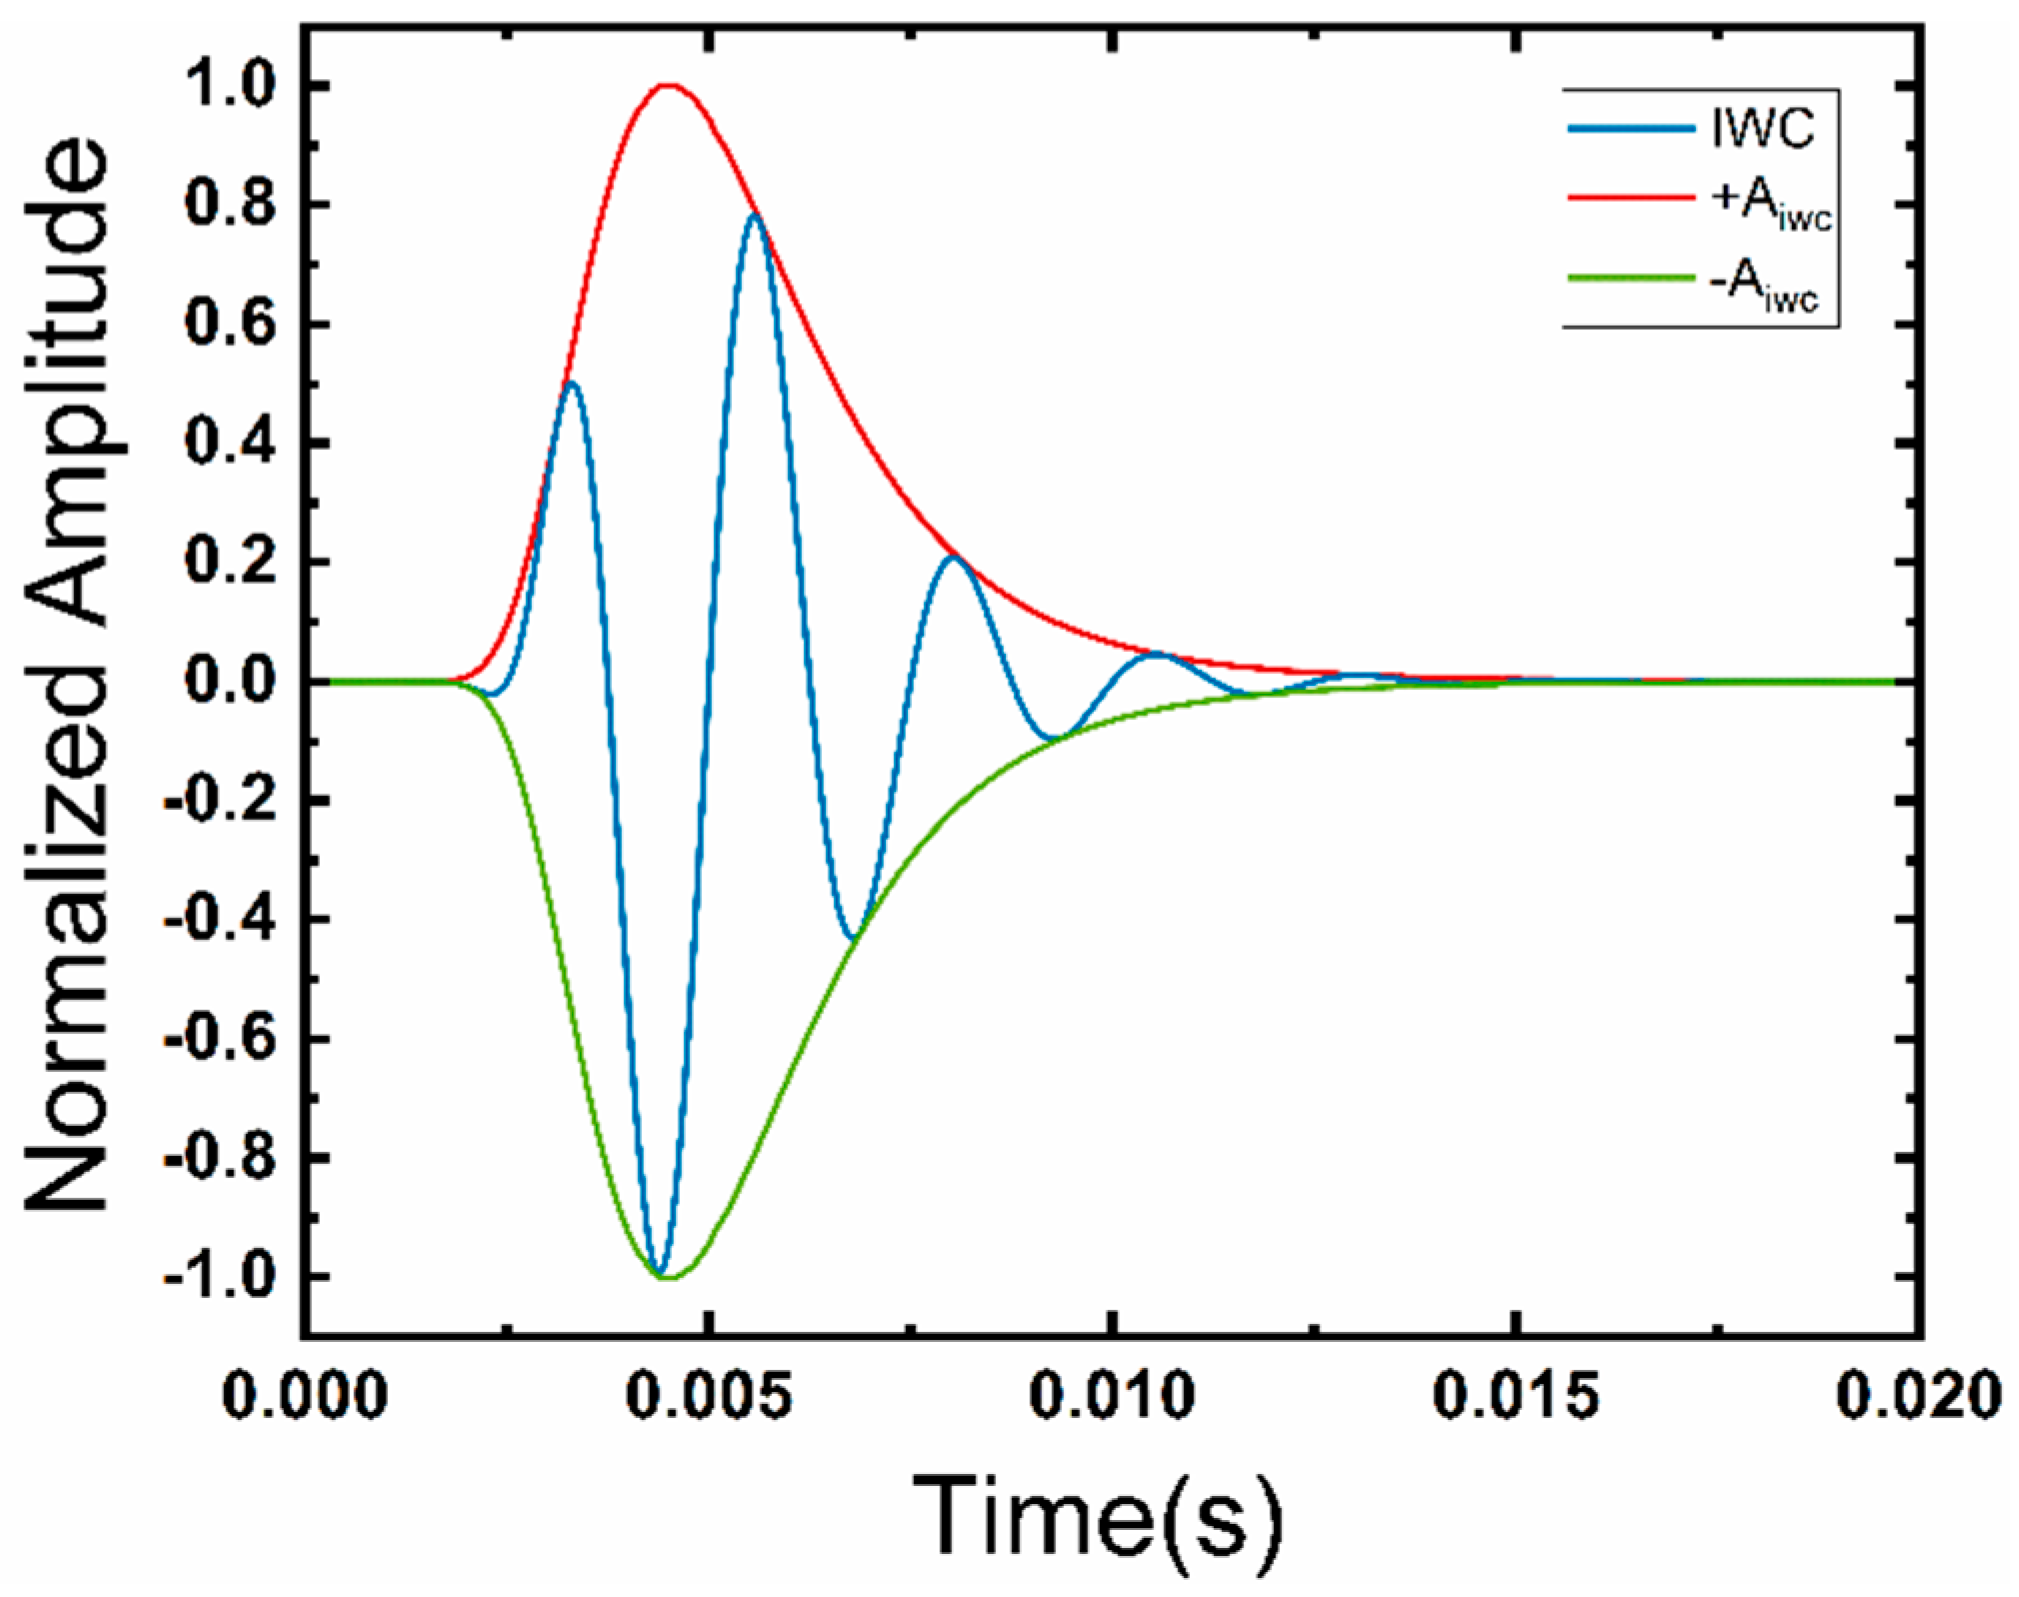
Figure 1. An IWC with its bounding envelope.
Applsci 15 02929 g001
Figure 2. Abdominal modeling process. (a) Abdominal anatomy in the standard anatomical position. (b) Tissue layers of the human abdomen. (c) Overall geometric model of the abdomen.
Applsci 15 02929 g002
Figure 3. Analog IWC vs. real IWC.
Applsci 15 02929 g003
Figure 4. IWC on tissues surfaces.
Applsci 15 02929 g004
Figure 5. IWC on fat layer surface at varying thickness.
Applsci 15 02929 g005
Figure 6. Absolute attenuation as a function of fat thickness.
Applsci 15 02929 g006
Table 1. The acoustic properties of different tissues.
Tissue TypeSpeed of Sound [29]
(m/s)
Density [30]
(kg/m³)
Acoustic Impedance
(kg/m²/s)
Skin161311201,804,560
Fat14789501,404,100
Muscle154710501,624,350
Disclaimer/Publisher’s Note: The statements, opinions and data contained in all publications are solely those of the individual author(s) and contributor(s) and not of MDPI and/or the editor(s). MDPI and/or the editor(s) disclaim responsibility for any injury to people or property resulting from any ideas, methods, instructions or products referred to in the content.