Abstract
Introduction: In orthodontics, determining the parameters of tooth size and dental arch and conducting Bolton analysis is crucial for diagnosis, treatment planning, and patient outcomes. This study evaluates the accuracy and reliability of measuring dental-arch dimensions on digital models created using the CEREC Primescan intraoral scanner, compared to measurements taken from plaster models. Methods: The study included two types of dental models (plaster and intraoral scan) from sixty-three subjects. Impressions were taken to create plaster models, and the subjects’ mouths were scanned with the CEREC Primescan system (Dentsply Sirona, Charlotte, NC) to create digital models. Intra-arch measurements included tooth heights and widths, overjet, and overbite. The arch width and depth were examined at the first permanent upper or lower molar. The paired t-test and Bland–Altman plot were used to determine the accuracy, while intra-rater and inter-rater correlation coefficient values were calculated to assess the reliability of measurements from the intraoral scan compared to those from the plaster model. Results: For tooth heights, there was a statistically significant difference in only one measurement (tooth 34) between the plaster and digital models, with an average difference of 0.01 mm. For tooth widths, there was a statistically significant difference in only one measurement (tooth 15) with an average difference of 0.03 mm. The Bland–Altman plots of almost all of measurements of tooth heights and widths showed that differences between the two models were within the limits of agreement. The inter- and intra-rater correlation coefficient values for measurements on the digital model were found to be statistically insignificant. Conclusion: Measuring dental dimensions on digital models obtained through the Primescan intraoral digital system yielded similar results to those obtained from plaster models and showed excellent reliability, indicating its potential application in clinical practice.
1. Introduction
In orthodontics, obtaining a precise full-arch intraoral scan is essential for accurate diagnosis, treatment planning, and determining treatment outcomes. Traditionally, indirect impression techniques, such as plaster or digital models, have been preferred over direct intraoral scans due to concerns about time efficiency and the necessity of patient presence. However, the current gold standard for measurements remains the electronic caliper on plaster models, which is widely used due to its accuracy, practicality, portability, and cost effectiveness. Despite these advantages, plaster models pose several limitations, including the need for extensive storage space, susceptibility to damage, and the accumulation of errors from multiple processing stages, ultimately affecting measurement accuracy [1,2,3,4,5,6].
Advancements in digital technology have introduced intraoral scanners (IOSs) as an alternative to conventional impression methods, offering enhanced accuracy and efficiency in capturing digital impressions of patients’ teeth and oral structures. This process involves three main steps: (1) the direct or indirect digitalization of the oral cavity, (2) data processing, and (3) fabrication using computer-aided design and computer-aided manufacturing (CAD/CAM). By enabling direct in-mouth scanning, IOSs improve data storage and retrieval while minimizing inaccuracies caused by material deformation and multiple handling stages [7,8,9].
Among the latest intraoral scanners, the CEREC Primescan system (Dentsply Sirona, Charlotte, NC, USA) stands out as a cutting-edge device designed for various digital procedures. Utilizing high-resolution sensors and short-wave light, this system captures detailed digital impressions of tooth surfaces, allowing for seamless data transfer to the lab via Connect software version 5.2. Integrated with CEREC 5 software version 5.2, the Primescan system supports both single-tooth and full-arch restorations, enhancing workflow automation and precision. Compared to other IOSs on the market, such as the iTero Element (Align Technology, San Jose, CA, USA) and the TRIOS series (3Shape, Copenhagen, Denmark), the CEREC Primescan offers superior scanning speed, enhanced accuracy, and optimized software integration. However, comprehensive studies comparing its performance with existing alternatives are still limited, necessitating further validation of its clinical effectiveness [10].
This study aimed to assess the validity of digital measurements using the CEREC Primescan system compared to conventional plaster model measurements in terms of accuracy and reliability. We hypothesized that direct intraoral scanning with Primescan would provide comparable measurement accuracy to conventional methods while offering greater efficiency and convenience in clinical practice.
2. Materials and Methods
This was a prospective study with the recruitment period from October 2022 to October 2023. Sixty-three participants were included in this study, and all subjects provided their written informed consent to participate. The study received approval from the Medical Ethics Committee of Can Tho University of Medicine and Pharmacy (No. 22.335. HV/PCT) and was conducted following approved institutional guidelines. The inclusion and exclusion criteria are shown in Table 1.

Table 1.
Inclusion and exclusion criteria.
2.1. Measurement Procedures
Alginate impressions (Tropical Zhermack, Badia Polesine, Italy) were taken and immediately poured with dental stone (Elite Rock-Zhermack). Intra-arch dimensional dental measurements were recorded using a digital caliper (Mitutoyo, Tokyo, Japan) on the plaster models and 3D reverse engineering software (Geomagic Design X version 2022, Oqton, Los Angeles, CA, USA) on the intraoral scans.
The intra-arch measurements included tooth heights (H) and widths (W), overjet (OJ), and overbite (OB). Additionally, the arch width was examined at the first permanent upper molar (AWU6) and the first permanent lower molar (AWL6). The arch depth was measured at the first permanent upper molar (ADU6) and the first permanent lower molar (ADL6).
Tooth heights were measured from the incisal edge or cusp tip to the zenith point. Tooth widths, which are mesiodistal dimensions, were the largest dimensions from the mesial contact point to the distal contact point, parallel to the occlusal plane. Overjet was the distance from the middle of the incisal edge of the right maxillary incisor to the labial surface of the opposing mandibular incisor, parallel to the occlusal plane. Overbite was the vertical distance from the marked incisal edge of the right maxillary central incisor overlapping the labial surface of the right mandibular central incisor to the incisal edge of the mandibular incisor. The arch width was the distance from the mesiobuccally cusp tip of the right maxillary molar to the mesiobuccally cusp tip of the left maxillary molar. The arch depth was examined by drawing a line from the outermost plane of the two central incisors to the distal plane of the two first molars and measuring the distance from this line to the midline.
Regarding blinding, three individuals measured dimensions of teeth in plaster and digital models and another examiner compared results. Bland–Altman analysis was employed to examine the agreement between plaster models and intraoral scans. The plot featured a scatter diagram of the differences against the averages of the two measurements. Horizontal lines indicated the mean difference and the limits of agreement, defined as the mean difference ± 1.96 times the standard deviation of the differences. Calculations were carried out for the mean difference, the standard deviations of the differences, and the limits of agreement between the plaster models and intraoral scans.
Each examiner re-measured tooth heights and widths after 14 days to assess intra-rater correlation coefficient (n = 10 patients). The values of tooth heights and widths measured by each examiner were evaluated for inter-rater correlation coefficient (n = 10 patients). The intraclass correlation coefficient (ICC) ranges from 0 to 1, based on the 95% confidence interval of the estimate. Values less than 0.5, from 0.5 to 0.75, from 0.75 to 0.9, and greater than 0.9, respectively, indicate poor, moderate, good, and excellent reliability [10].
2.2. Sample Size Calculation
Using the formula for calculating the sample size for paired two means:
where
- N: the minimum sample size;
- = 0.05;
- β = 0.2;
- σ: the standard deviation of the difference between the two methods: conventional impression-taking and digital impression-taking with the CEREC Primescan system;
- M: the mean difference between the two methods: conventional impression-taking and digital impression-taking with the CEREC Primescan system.
To ensure an adequate sample size for the study, the largest estimated minimum sample size selected was forty-eight and the research team decided on a sample size of sixty-three.
2.3. Statistical Analysis
Data were tested for normal distribution using the Kolmogorov–Smirnov test. As all data followed a normal distribution, they were presented as mean ± standard deviation. The data were analyzed using paired t-tests and Bland–Altman analysis to assess accuracy, and ICC tests to assess reliability. SPSS Version 26.0 (SPSS, Inc., Chicago, IL, USA) was used for statistical analyses, and p-values < 0.05 were considered statistically significant.
3. Results
The ratio of males to females in the study is nearly equal, with 49% being male and 51% being female. The study recorded an average age of 20.75 ± 2.36 years (19–31 years old).
Regarding tooth heights, there was a statistically significant difference in one measurement (tooth 34) between the plaster and digital models, with an average difference of 0.01 mm (8.40 ± 0.75 mm and 8.39 ± 0.75 mm, respectively; p = 0.025, n = 63) (Table 2).
Table 2.
A comparison of the tooth height measurements between the plaster models and intraoral scans.
Regarding tooth widths, there was a statistically significant difference in one measurement (tooth 15) between the plaster and digital models, with an average difference of 0.03 mm (7.23 ± 0.39 mm and 7.20 ± 0.39 mm, respectively; p = 0.033, n = 63) (Table 3).
Table 3.
A comparison of the tooth-width measurements between the plaster models and intraoral scans.
The Bland–Altman plots showed that almost all of measurements of the tooth heights and widths between the plaster models and intraoral scans were within the limits of agreement (Figure 1). There was no statistically significant difference in measurements of overjet, overbite, arch width, and depth between both models (Table 4).
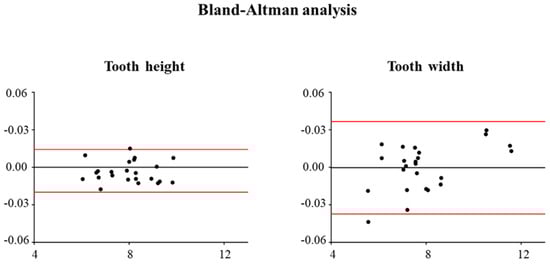
Figure 1.
Bland–Altman analysis of the measurements of tooth heights and widths between the plaster and digital models.
Table 4.
A comparison of measurements of the overjet, overbite, and arch width and depth between the plaster models and intraoral scans.
The inter-examiner error was found to be statistically insignificant, demonstrating excellent reliability with a mean ICC of 0.948 (ICC = 0.842–0.998) (Table 5).
Table 5.
Inter-rater correlation coefficient based on measurements of tooth widths and heights.
Similarly, intra-examiner errors were found to be statistically insignificant, showing excellent reliability among the three examiners. The mean ICCs for examiners one, two, and three were 0.917 (range: 0.648–0.999), 0.927 (range: 0.655–0.998), and 0.968 (range: 0.661–0.999), respectively (Table 6).
Table 6.
Intra-rater correlation coefficient based on measurements of tooth widths and heights.
4. Discussion
We compared various dental measurements by using plaster and digital models scanned by the Primescan system. Measurements on both the upper and lower jaws were taken by three blind examiners. Statistically significant differences were observed in measurements in tooth 15 (widths) and tooth 34 (heights), with tiny discrepancies of 0.03 and 0.01 mm. The Bland–Altman plots of almost all of measurements of tooth heights and widths showed that differences between the two models were within the limits of agreement. Measurements of overjet, overbite, arch width, and depth between both models showed no significant difference. The inter-examiner and intra-examiner errors were statistically insignificant, showing excellent reliability.
In the research, the age ranges were 19–30 years old, in which the permanent teeth from the first molars on both the right and left sides are fully erupted. Adolescent age groups are likely chosen because teeth at this age are less likely to be damaged and worn, allowing for more accurate tooth size measurements.
Factors affecting the accuracy of intraoral scanners can include the length of the missing teeth, the digital procedure, and the characteristics of the scanned surface [11]. Intraoral scanner systems operate by projecting light onto the scanned surface and capturing the reflected images. Therefore, excessive light reflection, such as from metallic restoration surfaces, excessive saliva, or hard-to-reach areas, can affect the quality and clarity of the captured images. Intraoral scanners cannot capture the entire image of the area to be scanned in a single pass; instead, they perform multiple overlapping image captures and stitch the images together using algorithms. Each time the images are stitched together, there is a risk of creating certain deviations. Hence, when the digital area is large, especially in the case of long lengths of missing teeth, the resulting deviations will be greater. Surfaces with many anatomical structures provide numerous reliable reference points for overlapping scanned images, increasing accuracy. When performing a digital scan of the entire dental arch, starting the scan at the palate, where there are more anatomical structures, results in higher accuracy [12].
The only discrepancies in measurements of tooth 15 (widths) and tooth 34 (heights) between plaster and digital models were observed potentially due to the teeth location. The difficulty in accessing the posterior areas of the dental arch when maneuvering the scanner head due to tongue movement and limited mouth opening can cause distortion during digital modeling [13].
The results showed no difference in the measurements of overjet and overbite. Similarly, Sjögren et al. recorded no significant differences in the average discrepancies of overbite and overjet values between the two methods for both measurers [14]. Similar deviations were also confirmed in the study by Bootvong et al. [15]. In contrast, Czarnota et al. reported that the discrepancies in overbite values measured using digital models and plaster models were 0.31 mm and 0.2 mm, respectively, with only the overbite showing a significant difference (p < 0.05) [16]. Stevens et al. reported that the average difference in overjet was not statistically significant; however, there was a difference in overbite, with an average discrepancy of 0.30 mm (p = 0.001) [17].
Alrasheed et al. reported that there was no difference in measurements of tooth heights and widths between plaster and digital models (p = 0.852 and an average discrepancy of 0.1 mm) [18]. Liang et al. compared the accuracy of clinical measurements using plaster models and digital models with 3Shape. They found that the anterior ratio and overall ratio showed statistically significant differences (anterior ratio, p = 0.021; overall ratio, p = 0.001) [19]. Wiranto et al. reported this error, showing that the anterior ratio and overall ratio in Bolton analysis measured by intraoral digital evaluation were smaller than with conventional plaster methods (p < 0.05). However, the authors believed this was not clinically significant [20].
The results showed excellent reliability among different examiners and for repeated measurements by each examiner. Similarly, Czarnota et al. reported an ICC value of 0.9 ± 0.07 for digital models. Only the mesio-distal dimension of the lower-right central incisor had an ICC value at the moderate level, while the reliability of the remaining mesio-distal measurements ranged from good to excellent [16]. Naidu et al. demonstrated that the ICC values for digital methods were excellent (ICC values > 0.95) [21]. The reliability of mesio-distal tooth measurements can be affected by various variables, including inclination, rotation, contact between teeth, and anatomical differences. However, since the measurers had expertise in digital manipulation, computer mouse operation, and working with images on a screen, the results were predictable.
Most of the results did not show statistically significant differences in dental measurements of two models due to several reasons. This may be because three examiners had experience and received standardized training in measuring tooth and dental-arch dimensions. Training time with new software and experience significantly affect measurement results. Quimby et al. compared the accuracy and reliability of measurements on computer-based digital models from ten examiners. The results showed significant differences for all measured indices across ten pairs of models for the data from ten examiners. The average difference between the two measurement methods for the ten measurers ranged from 0.19 to 1.9 mm [22]. Plaster models were constructed by standardized high-quality materials and used immediately after making. Coleman et al. reported that, when taking impressions and measurements on plaster models, data discrepancies can occur due to the shrinkage or expansion of the models during storage and transportation. Depending on the storage environment after plaster removal, the impression material may undergo synthesis or absorption. Generally, material shrinkage due to water loss or synthesis means that measurement points will be farther apart, while water absorption or swelling will cause the material to expand [23]. Additionally, the CEREC Primescan system is the latest updated system, featuring ease of use and new algorithms that produce relatively accurate results by overcoming the drawbacks of previous versions.
One of the key strengths of this study is its methodological rigor, including the use of standardized measurement procedures and a well-established statistical analysis framework. The inclusion of both plaster and digital models for comparison enhances the reliability of the findings. Additionally, the study demonstrated intra- and inter-examiner reliability, reinforcing the robustness of digital measurement techniques. The use of the latest-generation intraoral scanner, CEREC Primescan, ensures that the results reflect the current advancements in digital dentistry, making them relevant for contemporary clinical applications.
The study had some limitations. The study was conducted on a relatively small and homogeneous sample, primarily consisting of young adults with fully erupted permanent dentition. This limits the generalizability of the findings to populations with mixed dentition or those with dental anomalies. The accuracy of intraoral scanning may be affected by factors such as patient cooperation, intraoral lighting conditions, operator expertise, saliva, and soft-tissue dynamics. Posterior teeth and areas with metal restorations may introduce distortions due to scanning challenges. Lastly, while measurements were performed by experienced examiners, the potential for inter- and intra-examiner variability remains a consideration. Future studies should compare different intraoral scanner systems across various clinical scenarios, as this would also be valuable. Lastly, the integration of intraoral scanning with emerging technologies such as augmented reality (AR) and virtual treatment planning could enhance its role in digital dentistry, further improving treatment outcomes and patient experiences.
5. Conclusions
This study demonstrated that digital models obtained using the CEREC Primescan intraoral scanner provide highly accurate and reliable measurements comparable to those obtained from conventional plaster models.
Author Contributions
Conceptualization, T.H.L. and V.H.B.T.; methodology, T.H.L.; software, H.V.; validation, T.N.K., T.N.Q.P. and H.V.; formal analysis, V.H.B.T.; investigation, T.H.L.; resources, H.V.; data curation, V.H.B.T.; writing—original draft preparation, V.H.B.T.; writing—review and editing, T.H.L.; visualization, V.H.B.T.; supervision, T.H.L.; project administration, H.V.; funding acquisition, T.N.K. and T.N.Q.P. All authors have read and agreed to the published version of the manuscript.
Funding
This research received no external funding.
Institutional Review Board Statement
The study received approval from the Medical Ethics Committee of Can Tho University of Medicine and Pharmacy on 11 August 2022 (No. 22.335. HV/PCT) and was conducted following ap-proved institutional guidelines.
Informed Consent Statement
Informed consent was obtained from all subjects involved in this study.
Data Availability Statement
Corresponding authors take full responsibility for the data, analyses, and interpretation of the data, and for providing accurate data availability policies.
Conflicts of Interest
The authors declare that no competing interests exist.
References
- Omar, H.; Alhajrasi, M.; Felemban, N.; Hassan, A. Dental Arch Dimensions, Form and Tooth Size Ratio among a Saudi Sample. Saudi Med. J. 2018, 39, 86–91. [Google Scholar] [CrossRef] [PubMed]
- Abd Rahman, A.N.A.; Othman, S.A.; Marya, A. Measuring Tooth Size Discrepancies Using Bolton Analysis: A Comparative Cross-Sectional Study among Major Ethnicity in Malaysia. BMC Oral Health 2023, 23, 534. [Google Scholar] [CrossRef]
- Viet, H.; Thi Nhu Thao, D.; Phuoc, T.H.; Quang Tien, N. A Multidisciplinary Approach to Managing Severe Gummy Smile Using 3D Simulation and Digital Surgical Guide: A Case Report. J. Surg. Case Rep. 2024, 2024, rjae483. [Google Scholar] [CrossRef]
- Nguyen, V.A.; Nguyen, T.A.; Doan, H.L.; Pham, T.H.; Doan, B.N.; Pham, T.T.T.; Hoang, V. Transfer Accuracy of Partially Enclosed Single Hard Vacuum-Formed Trays with 3D-Printed Models for Lingual Bracket Indirect Bonding: A Prospective in-Vivo Study. PLoS ONE 2025, 20, e0316208. [Google Scholar] [CrossRef]
- Nguyen, P.N.; Tran, L.H.; Hoang, V. Full-Arch Implant-Supported Rehabilitation Using Reverse Scan Technique: A Case Report. J. Oral Implant. 2025. [Google Scholar] [CrossRef]
- Viet, H.; Marya, A.; d’Apuzzo, F.; Nucci, L. The Clinical Applications and Outcomes of Digital MARPE in Orthodontics: A Scoping Review. Semin. Orthod. 2024, 31, 299–309. [Google Scholar] [CrossRef]
- Alkadi, L. A Comprehensive Review of Factors That Influence the Accuracy of Intraoral Scanners. Diagnostics 2023, 13, 3291. [Google Scholar] [CrossRef]
- Goracci, C.; Franchi, L.; Vichi, A.; Ferrari, M. Accuracy, Reliability, and Efficiency of Intraoral Scanners for Full-Arch Impressions: A Systematic Review of the Clinical Evidence. Eur. J. Orthod. 2016, 38, 422–428. [Google Scholar] [CrossRef]
- Angelone, F.; Ponsiglione, A.M.; Ricciardi, C.; Cesarelli, G.; Sansone, M.; Amato, F. Diagnostic Applications of Intraoral Scanners: A Systematic Review. J. Imaging 2023, 9, 134. [Google Scholar] [CrossRef]
- Jurado, C.A.; Sayed Ahmed, A.; Lawson, N.C.; Azpiazu-Flores, F.X.; Green, C.; Cho, S.-H. Fracture Resistance of Zirconia Surveyed Crowns with Four Different Occlusal Rest Seat Designs. J. Prosthodont. 2024, 33, 484–489. [Google Scholar] [CrossRef]
- Koo, T.K.; Li, M.Y. A Guideline of Selecting and Reporting Intraclass Correlation Coefficients for Reliability Research. J. Chiropr. Med. 2016, 15, 155–163. [Google Scholar] [CrossRef]
- Su, T.; Sun, J. Comparison of Repeatability between Intraoral Digital Scanner and Extraoral Digital Scanner: An In-Vitro Study. J. Prosthodont. Res. 2015, 59, 236–242. [Google Scholar] [CrossRef] [PubMed]
- Richert, R.; Goujat, A.; Venet, L.; Viguie, G.; Viennot, S.; Robinson, P.; Farges, J.-C.; Fages, M.; Ducret, M. Intraoral Scanner Technologies: A Review to Make a Successful Impression. J. Healthc. Eng. 2017, 2017, 8427595. [Google Scholar] [CrossRef] [PubMed]
- Aragón, M.L.C.; Pontes, L.F.; Bichara, L.M.; Flores-Mir, C.; Normando, D. Validity and Reliability of Intraoral Scanners Compared to Conventional Gypsum Models Measurements: A Systematic Review. Eur. J. Orthod. 2016, 38, 429–434. [Google Scholar] [CrossRef]
- Sjögren, A.P.G.; Lindgren, J.E.; Huggare, J.A.V. Orthodontic Study Cast Analysis-Reproducibility of Recordings and Agreement between Conventional and 3D Virtual Measurements. J. Digit. Imaging 2010, 23, 482–492. [Google Scholar] [CrossRef]
- Bootvong, K.; Liu, Z.; McGrath, C.; Hägg, U.; Wong, R.W.K.; Bendeus, M.; Yeung, S. Virtual Model Analysis as an Alternative Approach to Plaster Model Analysis: Reliability and Validity. Eur. J. Orthod. 2010, 32, 589–595. [Google Scholar] [CrossRef] [PubMed]
- Czarnota, J.; Hey, J.; Fuhrmann, R. Measurements Using Orthodontic Analysis Software on Digital Models Obtained by 3D Scans of Plaster Casts: Intrarater Reliability and Validity. J. Orofac. Orthop. 2016, 77, 22–30. [Google Scholar] [CrossRef]
- Stevens, D.R.; Flores-Mir, C.; Nebbe, B.; Raboud, D.W.; Heo, G.; Major, P.W. Validity, Reliability, and Reproducibility of Plaster vs Digital Study Models: Comparison of Peer Assessment Rating and Bolton Analysis and Their Constituent Measurements. Am. J. Orthod. Dentofac. Orthop. 2006, 129, 794–803. [Google Scholar] [CrossRef]
- Alrasheed, W.A.; Owayda, A.M.; Hajeer, M.Y.; Khattab, T.Z.; Almahdi, W.H. Validity and Reliability of Intraoral and Plaster Models’ Photographs in the Assessment of Little’s Irregularity Index, Tooth Size-Arch Length Discrepancy, and Bolton’s Analysis. Cureus 2022, 14, e23067. [Google Scholar] [CrossRef]
- Liang, Y.-M.; Rutchakitprakarn, L.; Kuang, S.-H.; Wu, T.-Y. Comparing the Reliability and Accuracy of Clinical Measurements Using Plaster Model and the Digital Model System Based on Crowding Severity. J. Chin. Med. Assoc. 2018, 81, 842–847. [Google Scholar] [CrossRef]
- Wiranto, M.G.; Engelbrecht, W.P.; Tutein Nolthenius, H.E.; van der Meer, W.J.; Ren, Y. Validity, Reliability, and Reproducibility of Linear Measurements on Digital Models Obtained from Intraoral and Cone-Beam Computed Tomography Scans of Alginate Impressions. Am. J. Orthod. Dentofac. Orthop. 2013, 143, 140–147. [Google Scholar] [CrossRef] [PubMed]
- Naidu, D.; Freer, T.J. Validity, Reliability, and Reproducibility of the IOC Intraoral Scanner: A Comparison of Tooth Widths and Bolton Ratios. Am. J. Orthod. Dentofac. Orthop. 2013, 144, 304–310. [Google Scholar] [CrossRef] [PubMed]
- Quimby, M.L.; Vig, K.W.L.; Rashid, R.G.; Firestone, A.R. The Accuracy and Reliability of Measurements Made on Computer-Based Digital Models. Angle Orthod. 2004, 74, 298–303. [Google Scholar] [CrossRef] [PubMed]
Disclaimer/Publisher’s Note: The statements, opinions and data contained in all publications are solely those of the individual author(s) and contributor(s) and not of MDPI and/or the editor(s). MDPI and/or the editor(s) disclaim responsibility for any injury to people or property resulting from any ideas, methods, instructions or products referred to in the content. |
© 2025 by the authors. Licensee MDPI, Basel, Switzerland. This article is an open access article distributed under the terms and conditions of the Creative Commons Attribution (CC BY) license (https://creativecommons.org/licenses/by/4.0/).