Abstract
Augmented reality and mobile pedestrian navigation are trends in mobile devices that, as a whole, are what mobile augmented reality is. This technology has great potential for the visualisation of content about heritage. Considering the above and the quality of the heritage elements, it is possible to characterise these aspects territorially, allowing for the analysis of location sensors. These new spatial aspects complement the presentation of information on these resources. In this way, by incorporating territorial indicators of different kinds, it is possible to classify and determine areas with specific characteristics and relate them to particular heritage values. In this research, we worked with a specific sector of the city of Santiago de Chile and its heritage buildings. Through the analysis of its qualities and the incorporation of the location of the devices, it was possible to characterise and territorially classify the behaviour of users in consideration of their displacement and heritage quality.
1. Introduction
The integration of augmented reality (AR) and mobile pedestrian navigation (MPN) in heritage exploration has transformed the way individuals engage with historical and cultural sites. By leveraging AR’s interactive and immersive features, these technologies create a layered digital experience, allowing users to visualise historical narratives and spatial data in real-time. This innovation has significant implications for heritage education, shifting it from traditional passive learning to dynamic, location-based interactions that enhance user engagement.
Advancements in geospatial technology, satellite navigation systems, and collaborative digital mapping platforms have played a critical role in this transformation. Historically, humans have developed diverse tools—ranging from cartographic representations and compass-based navigation to modern geographic coordinate systems—to make sense of spatial environments. Today, digital mapping has evolved with the advent of Web 2.0 and Web 3.0, enabling real-time user interaction, spatial data processing, and the crowdsourcing of geoinformation, significantly improving navigation and territorial analysis [1,2].
One of the key aspects of mobile technology is its ability to process spatially referenced data, effectively converting digital devices into interactive geographic tools. The concept of localisation plays a pivotal role in this transformation. Technically, localisation represents an object’s position within a three-dimensional coordinate system (X, Y, Z). Beyond simple positional data, modern geospatial frameworks allow multidimensional representations, capturing interrelationships between objects, territories, and user movements.
Representing complex territorial data—particularly in heritage contexts—on two-dimensional screens introduces challenges in their synthesis, visualisation, and interpretation. However, the proliferation of mobile applications with geospatial intelligence has revolutionised how users access, interpret, and interact with spatial information. Unlike traditional cartographic methods that rely on static paper maps, modern devices enable real-time, adaptive mapping, providing customized territorial insights based on the user’s location, movement patterns, and digital overlays.
As we transition into an era where intelligent mapping is seamlessly integrated into social and technological ecosystems, new methodologies are emerging to study the interaction between users, technology, and the environment. In the social sciences, researchers have explored how digital tools influence territorial perception, movement behaviour, and spatial decision-making [2,3,4].
Since the 1980s, studies on the use of situated technology have provided insights into location-based applications’ cognitive and behavioural implications [4,5]. One significant outcome of this shift is the emergence of pedestrian navigation as a large-scale digital phenomenon. Much like vehicular or maritime navigation, pedestrian movement within urban spaces is increasingly supported by computational tools that enhance wayfinding, augment historical context, and optimise user interaction with the surrounding environment. By embedding spatial analytics, real-time tracking, and AR overlays into mobile devices, they can be made to function as immersive guides, allowing users to experience urban heritage landscapes with unprecedented accuracy and interactivity.
Elucidating how these new forms of spatial data representation are understood and incorporated into learning processes, particularly about heritage, is a task that has been carried out for some time, initially involving defining competencies and developing examples for use in teaching different disciplines related to the territorial area.
In a previous research stage [6], progress was made in developing a survey of the study area and its heritage landmarks, and an initial quantification of the spatial projections of their value was performed. Now, from this stage onwards, the spatial behaviour of the subjects is incorporated through the use, time, and location measured by the app of the study area, and how this correlates with the heritage quality found in the analysed area is studied, revealing spatial patterns that establish a correlation between heritage quality and user interest.
1.1. Educational Effectiveness for Heritage
AR in MPN within mobile devices such as smartphones or tablets allows users to interact with their environment, providing a contextual learning experience. This is particularly effective in teaching subjects related to heritage and urban history [7]. On the other hand, there is an improved user experience: AR-based navigation systems improve the user experience by providing real-time information about the user’s environment, which is especially beneficial in unfamiliar environments. This is achieved through features such as landmark recognition, which helps users identify nearby buildings and streets. The interactive nature of AR encourages active participation, making learning more engaging. Thus, users report higher satisfaction levels when using AR tools than when using traditional methods, as they can visualise and interact with educational content more meaningfully.
1.2. Mobile Augmented Reality (MAR)
A key advantage of augmented reality (AR) is its seamless integration with portable devices, such as tablets and smartphones, which now offer computational power comparable to traditional desktop systems. This mobility factor enhances AR’s adaptability, enabling interactive experiences in diverse settings without being confined to stationary workstations or specialised infrastructure. Unlike conventional AR setups that require controlled environments, mobile AR applications provide ubiquitous access, allowing users to engage with digital overlays in real-world contexts, regardless of their location [8,9].
The concept of mobile augmented reality (MAR), also referred to as location-based AR, enables users to engage with augmented digital content in real-world environments without spatial constraints. Unlike traditional AR systems that require controlled settings, MAR enhances mobility and interaction, making it a versatile tool for immersive experiences.
While not classified as wearable technology, modern smartphones and tablets possess the necessary capabilities to support MAR environments. Their integration of high-resolution displays, real-time processing, and sensor-based tracking enables interactive AR experiences that are comparable to those of dedicated AR systems.
One of the key advantages of MAR is its ability to enhance spatial awareness by providing a dynamic, immersive navigation experience. Instead of relying solely on static, two-dimensional maps, MAR facilitates first-person exploration, where digital overlays respond in real-time to user movement and positioning. This approach transforms geospatial data from simple coordinate-based references into contextualised, location-driven insights, allowing for a richer and more intuitive understanding of territorial information [10].
MAR has demonstrated high effectiveness in presenting geospatial content and digital overlays over extended distances. However, its accuracy can be compromised when applied to close-range positioning, often exhibiting deviations of up to 50 m, particularly in environments with GPS signal interference or limited sensor calibration [11]. Nevertheless, this adaptation of AR enables users to visualise content outside the classroom and formal teaching settings, thereby allowing the exploration of topics with real information about real phenomena [12]. Furthermore, by utilising mobile device interfaces and harnessing their portability, educational activities can be designed around consultations, providing students with a personalized experience in the context of their real environment [13]. Situated learning is also regarded as a suitable educational context for implementing MAR, placing students in authentic scientific research scenarios [13,14].
1.3. Heritage and Mobile Augmented Reality
As emerging technologies continue to transform educational settings, augmented reality (AR) has become a powerful tool for enhancing learning experiences [15,16,17]. Its ability to create immersive, interactive environments makes it particularly valuable for engaging students, enabling them to interact with digital content in real-world contexts.
The immersive nature of augmented reality (AR) plays a crucial role in digital heritage applications, significantly enhancing user engagement and spatial understanding [17].
1.4. Technological and Implementation Challenges
Despite the great benefits of interactivity, connectivity, and information transfer, some limitations must be considered when using these tools, such as the limitations of GNSS systems. One of the main challenges when implementing navigation with AR is its dependence on GPSs (MAR), which may be inaccurate or unavailable in specific environments. Solutions such as step-count-based localisation and data fusion techniques have been proposed to mitigate these issues and improve the accuracy and reliability of MAR.
Device compatibility and accessibility: While modern smartphones have augmented reality capabilities, ensuring compatibility between devices and platforms remains challenging. In addition, the cost and availability of the proper devices may limit access for some users.
In contrast to the positive implications, there are considerations regarding integrating AR and MPN for heritage education. While these technologies offer enhanced learning experiences, they also require significant resources to develop and implement. In addition, the effectiveness of these tools can vary depending on the topic and context in which they are used. For example, while AR is highly effective in teaching spatial and contextual issues, its benefits may be less pronounced in more abstract disciplines. In addition, reliance on technology raises concerns about digital literacy and the potential for technological distractions in learning environments. Despite these challenges, the potential benefits of augmented reality and mobile pedestrian navigation in education are substantial, offering new avenues for interactive and immersive learning experiences.
1.5. Modelling and Analysis of Heritage Through Different Techniques of Representation and Abstraction
Trying to represent a three-dimensional or even multidimensional phenomenon, which has a structure beyond simple human perception, is a complex task requiring techniques and representations appropriate to this type of phenomenon. In addition, synthesising these structures in a model with only two dimensions—those that can be represented on paper (plans and maps) or screens (computers, tablets, and smartphones)—makes it more challenging to faithfully reproduce the Earth’s surface and its elements. However, a series of techniques and conventions have been created that have made it possible to overcome these drawbacks, generating what is known as the cartographic discipline, which involves constantly perfecting these tools, their elements, and their implementations. In addition, with the advent of computers, thanks to their enormous processing and storage capacities, cartography has been favoured with the improvement of its techniques and the massification of its contents, allowing the mobility, ubiquity, and personalisation of information for a given location.
1.6. Maps in a Context of Mobility
The expansion of internet connectivity since the mid-1990s, combined with the rise of portable computing in the early 21st century, has revolutionised access to digital information. Unlike earlier systems that required dedicated spaces for data consultation, modern technologies enable ubiquitous access to geospatial content from any location [3,18,19].
Mobile maps have emerged as a core component of spatial communication in this evolving landscape, and have been seamlessly integrated with location-based services (LBSs). These tools are now widely incorporated into various applications, including social media platforms, real-time navigation, and digital documentation systems [20]. The availability of mobile devices with geospatial capabilities and wireless internet access allows users to instantly explore localised information, ranging from nearby events to predictive spatial analytics [21]. The widespread use of mobile cartography has driven innovations in data visualisation, emphasising usability and performance optimisation. Given the constraints of device size and interface design, cartographic solutions for portable applications must be adapted to meet hardware capabilities and user cognitive processes, ensuring accessibility and seamless interaction in on-the-go environments.
Traditional cartographic methods rely on structured learning, standardised conventions, and specialised terminology to interpret geospatial data accurately. However, directly applying these principles to mobile mapping applications presents challenges due to digital platforms’ dynamic and interactive nature. Instead of replicating static cartographic models, mobile maps must simulate real-world spatial contexts effectively, prioritising concise, user-friendly representations that enhance on-the-go accessibility.
Mobile mapping solutions often rely on simplified visual elements, such as points of interest (POIs) and topological schematics, to achieve optimal usability rather than intricate traditional map designs. These streamlined approaches improve information retrieval while ensuring that users can quickly interpret and interact with spatial data in real time. Another crucial aspect is the situational nature of mobile maps, which are typically accessed for immediate reference rather than prolonged analysis. Given this ephemeral usage pattern, mobile cartographic tools must present precise, context-specific data, ensuring that users can obtain relevant insights quickly and efficiently. The computing environment [22,23,24] also plays a crucial role in distinguishing mobile cartography from standard cartography, facilitating the emergence of new contexts in the consultation and deployment of territorial information.
1.7. Objectives and Hypotheses
This study explores the educational potential of mobile pedestrian navigation (MPN) and mobile augmented reality (MAR) in heritage-based learning environments, particularly emphasising their role in spatial mobility through tablet-based applications. By integrating theoretical perspectives and empirical analysis, the research assesses how mobile tools enhance the understanding of territorial and cultural heritage in educational settings.
The primary goal is to develop a spatial interpretation framework for a heritage circuit, utilising a custom-designed mobile application. This system combines MAR-MPN technology with location, navigation, and augmented reality models, enabling users to dynamically interact with historical and territorial data. Furthermore, this study examines how these tools correlate with key heritage attributes, helping to establish a systematic approach to digital heritage representation. From this general context, the following specific objectives have been derived, which will be developed using the proposed methodology: (I) establish the construction process of the MAR-MPN application within the technological context of architecture and adaptable programming suitable for environments characterised by mobility and the portability typical of mobile devices; (II) determine, through a multi-criteria analysis based on heritage properties, the delineation and influence of the territory using territorial evaluation tools; and (III) spatially correlate the data obtained from user interactions with the app and heritage properties, determining the spatial distribution of the inquiries.
2. Materials and Methods
Due to the diversity of objectives, different methodological procedures have been developed to address them correctly. Thus, the empirical section of this thesis proposes three major specific methodological phases, which attempt to address and fulfil each objective that is proposed. In the first phase, an app is constructed that allows the deployment of heritage data in predefined milestones and data collection through the GPS sensor. During the second phase, territorial heritage data are compiled through the creation of a heritage cadastre and diagnostic tool utilising secondary information sources. This process establishes a structured thematic framework that guides the digital implementation of the system. As part of this approach, key landmarks, historical events, spatial units, and heritage routes are identified, categorised, and adapted for integration into a mobile and portable platform, ensuring accessibility and contextual relevance [25]. Finally, in the third stage, spatial analyses of the data are obtained from the app’s interaction with heritage properties.
2.1. Construction of an App for Deploying Heritage Data and Data Capture
In this first phase, the scope of the application was defined according to the proposed research objectives. From the initial ideas about implementation within the context of MAR-MPN, the general requirements necessary to obtain, from the computer field, the required tool to verify the research objectives were determined. The primary goal was to design a mobile application that enables the display of and interaction with heritage and territorial data in a dynamic, portable environment. Additionally, this application is intended to be adaptable across various disciplines, to involve spatially referenced content, and to be applicable at multiple geographic scales, from local to continental.
Key aspects of the system include:
- Input data—the application integrates heritage, spatial, and educational datasets derived from previous analytical stages. This includes structured data definitions, covering valid formats, storage methods, interoperability standards, and additional multimedia components such as AR models, imagery, textual descriptions, and spatial metadata;
- Output data—information is presented through a graphical user interface (GUI) optimised for mobile and location-aware contexts, ensuring that heritage content is delivered in a way that aligns with the specific site or scenario. Furthermore, the system utilises mobile device sensors to capture usage patterns, spatial positioning, and temporal interactions, allowing for a contextually relevant digital experience.
Figure 1 represents the app, which is divided into five components, and their interaction. A sixth component is established outside the app and where spatial analyses are performed:
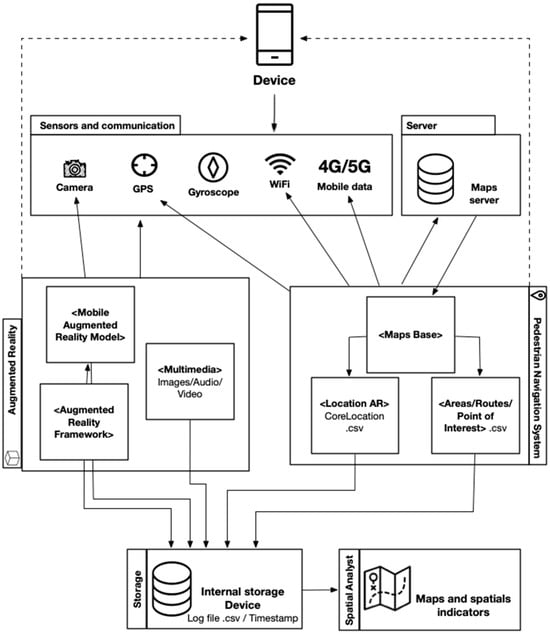
Figure 1.
MAR and MPN app structure.
- Sensors and communication: this component includes the camera, GPS, gyroscope, WiFi, and mobile data (4G/5G), which collect information about the user’s environment and location, allowing the MAR and MPN to function correctly;
- Map server: component that stores the geospatial database;
- Augmented reality (AR): the app processes and displays information about heritage buildings and their location on the device;
- Location database: contains the location data and spatial references of the data of the heritage buildings;
- Internal storage: the device stores the time and location data in a comma-separated values (CSV) format;
- Spatial analysis: the complementary software GIS (ArcGIS Pro 3.4) generates spatial indicators and maps, which allow the interpretation of the data in order to analyse and understand the relationships between the heritage resources, the time of consultation, and their location.
In this way, the app collects data from the environment through its sensors, contextualizing the information with multimedia, AR, and MAR resources. In addition, the map server is accessed to obtain location and time data, which are stored internally within the device for later analysis through GIS.
2.2. Survey of Thematic Data on Territorial Heritage
For the territorial and heritage context, secondary information from official georeferenced spatial databases (Table 1) was used, which was complemented with specialised references that allowed the general definition of the heritage thematic content of the app.

Table 1.
Territorial data for Santiago de Chile.
Given the extensive dataset available for the study area, a selective approach was required to identify key heritage sites for thematic analysis. Compiling territorial information involved a structured data evaluation process and incorporating insights from experts across multiple disciplines, including educators, historians, anthropologists, geographers, and architects. Their expertise ensured the data collection framework was contextually relevant, facilitating its educational application and seamless integration into the digital system.
Regarding the instrument developed for the elaboration of heritage and educational content, three general dimensions were measured in its digital implementation (Table 2):
Table 2.
Elements used for the selection of heritage elements.
- I.
- General identification: elements of location and description of the property chosen in the application (8 items);
- II.
- Historical and heritage background: description of the historical and heritage context of the property (9 items);
- III.
- Educational dimension of the property: elements and characteristics that derive from the patrimonial aspects of the property (6 items).
For the thematic unit on heritage, a sector of the historic centre of Santiago de Chile was used. Its historical-general antecedents established its origin around the year 800 by installing the first pre-Hispanic sedentary settlements. On 12 February 1541, it was founded, and the city acquired the name by which it is known to this day [30]. For the application, 57 heritage monuments have been established [31] in an area that covers approximately 25.16 hectares (Figure 2):
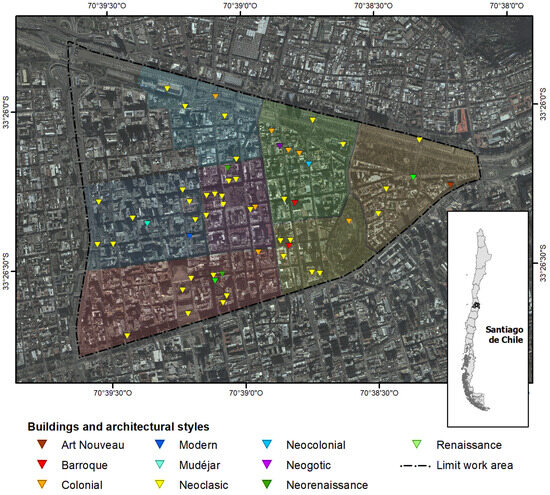
Figure 2.
Santiago de Chile and heritage buildings considered.
2.3. Spatial Analysis Methodology
An integrated multi-criteria evaluation (MCE) approach was applied to analyse territorial data. This method consolidates multiple spatial characteristics by assigning positive values to favourable factors and subtracting the influence of elements negatively impacting the evaluated activity. The MCE technique aligns with the weighted linear summation model proposed by Gómez and Barredo [25], which is mathematically expressed as:
where:
ri represents the suitability score of alternative i,
Wj denotes the weight assigned to criterion or factor j,
Vij corresponds to the evaluated value of alternative i under criterion j.
This approach enables the weighted assessment of spatial elements, offering a structured visualisation that aligns with the research objectives. Various geographic information systems (GISs) have been utilised [25,32,33] to process territorial variables from heritage perspectives, ensuring their functional relevance for mobile augmented reality (MAR) and mobile pedestrian navigation (MPN) applications [34,35,36]. The selected variables are summarised in Table 3:
Table 3.
Variables used in the EMC assessment.
With the identification of key sectors offering the highest potential for pedestrian movement and heritage visualisation, a refined spatial delineation of the study area was established. This process involved the creation of Thiessen polygons using spatial gravity centres derived from the multi-criteria evaluation (MCE) values to define optimal territorial subdivisions. Thiessen polygons provide a geometric approach to partitioning a Euclidean plane, where reference points serve as the basis for defining boundaries through interpolation based on Euclidean distance [37,38,39,40]. After obtaining a Euclidean distance, we have:
where p and q are distinct points within the spatial domain and the region V(pi) is determined by the intersection of semi-planes, derived from the bisectors between points pi and pj:
Thus, V(pi) represents the convex region formed by the intersection of n − 1 semi-planes, establishing the territorial limits for each spatial unit.
2.4. Spatial Analysis of the Data Obtained from the Interaction of the App with Heritage Properties
Through the tablets used with the created app (n = 54) and by incorporating several programming lines in which GNSS geolocation sensors were used, the X, Y, and TimeStamp coordinates of the participants were recorded in intervals of 1 min to determine, through the optimised analysis of hot spots in a GIS (ArcGIS Pro 3.4), the heritage elements that generated the most significant interest based on the time of permanence and consultation of the established information. In this case, given the incidence points, a statistically significant hot and cold spot map was created using the Getis–Ord Gi* statistic to evaluate the characteristics of the points to produce the chosen type of representation [41,42], which is defined as follows:
Here, wij(d) represents a binary symmetric spatial weight matrix, where a value of one is assigned to all connections within a defined distance d from a given point i, while all other connections (j)—including self-links—are set to zero.
This approach identified statistically significant spatial clusters of high-value concentrations (hot spots) and non-significant areas. Additionally, heritage building data were automatically aggregated, an optimal scale of analysis was determined, and multiple tests were conducted to account for spatial dependencies and statistical adjustments. Specifically, a network grid determined by the location points within a grid of hexagons was established. Then, using the software GIS, we calculated a polygon cell size appropriate to the extent of the study area, which was used to create a mesh of hexagons that overlap the location points and are counted within each polygon cell.
3. Results and Discussion
3.1. Use of Tablets in Fieldwork
The creation of the app that was used on tablets had the following application context:
- Duration: each intervention (fieldwork) lasted around four hours, and the duration was dependant on the users’ movement between the heritage landmarks of each heritage experience;
- Modality: the fieldwork corresponding to the E zones of Santiago de Chile was carried out;
- Objectives of the activity: the objectives of the educational intervention pertained to three main areas:
- ○
- To spatially identify the relationship between legacy and material heritage based on a tour of the city’s historic centre;
- ○
- To relate the concept of historical legacy to the architectural and functional legacy of buildings, churches, and neighbourhoods, considering each work’s social and design aspects;
- ○
- To understand how tangible heritage is associated with the idea of national monuments as symbols of identity and historical legacy.
In a complementary way, fieldwork was proposed as a teaching resource and a unique learning space for understanding the historic city’s environment and its heritage elements. Concrete knowledge of the environment and its elements, where the user visualises and knows their surrounding reality, is possible.
- Contents: the contents of the activities are related to the heritage elements of the city and are established as an area in the next stage (Table 4);
Table 4. Contents for each heritage intervention.
- Activities: the users (n = 54) used tablets to explore the study areas, visualising the digital resources of the heritage elements to be studied. The teacher served as a general guide for the activity and supplemented the device information. At the same time, the users were urged to reflect on and exchange ideas about the phenomena visualised on the devices in the context of the actual scenario in which the activity took place;
- Resources: the educational resource used corresponds to the AR-MPN application implemented on the tablets for visualisation during the fieldwork.
To determine the heritage quality values of each building, a scale from 1 (low) to 10 (high) was established using the criteria presented in Table 3 and spatialized in Figure 3. In this way, this heritage assessment allowed the definition of the route zones according to common characteristics within the scope of their heritage value.
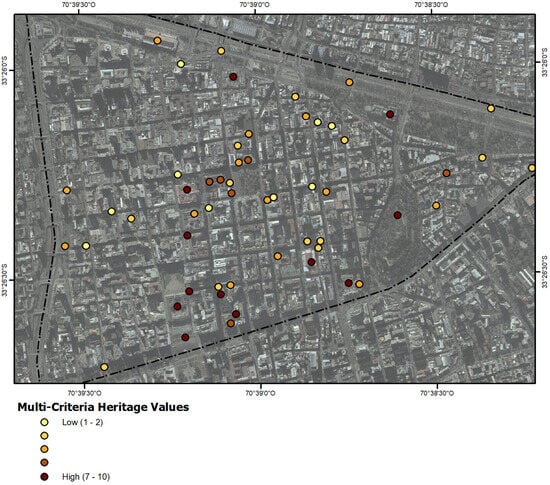
Figure 3.
Spatialization of the multi-criteria heritage values of buildings in the study area.
3.2. Analysis of Thematic Data on Territorial Heritage
Integrating multi-criteria heritage values facilitated the development of a spatial model for pedestrian navigation where heritage landmarks serve as primary reference points. Figure 4 visually represents these evaluated multi-criteria (EMC) values using heatmaps with isolines indicating heritage-pedestrian suitability scores. This representation constitutes a preliminary phase in the data synthesis process, guiding the delineation of heritage routes to be incorporated into the mobile navigation system.
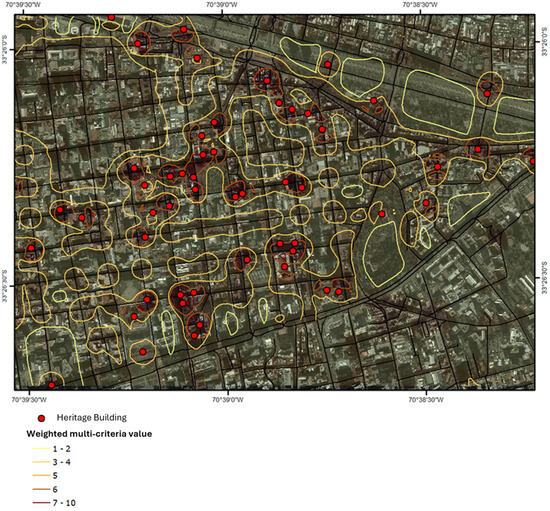
Figure 4.
Multi-criteria value of heritage-pedestrian suitability. Santiago de Chile.
Based on the values obtained by the MCE isolines, the areas were preliminarily established through zoning, which led to the implementation of the Thiessen polygons. These reference isolines allowed the preliminary generation of the route areas, which were delimited from the centroids of the spatial units within the study area, incorporating their territorial distribution and MCE-derived values (Figure 5). The initial boundaries were subsequently refined by aligning them with street axes to ensure greater territorial accuracy, resulting in a finalised spatial delineation for further analysis and implementation (Figure 6).

Figure 5.
Thiessen polygons as a function of MCE without axis adjustment. Santiago de Chile.
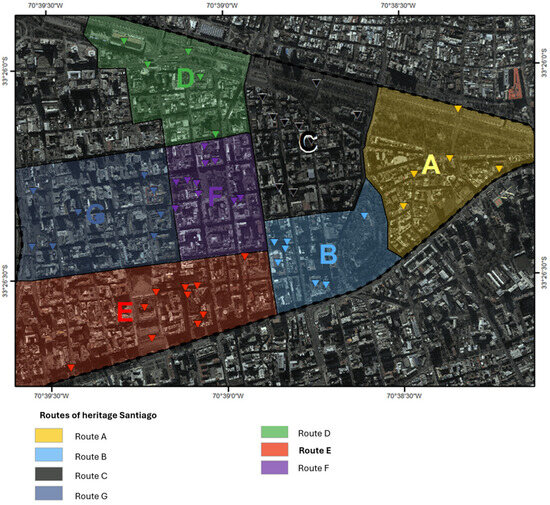
Figure 6.
Heritage routes for Santiago de Chile.
A spatial analysis based on networks was used to seek the development of efficient displacement models in which the universe of variables described above could be conjugated [43,44]. By setting up a pedestrian displacement model based on the street axes and the defined heritage points, a model was created that represents the travel requirements for each chosen city, in addition to the possible service areas for each property depending on the time of travel [45], which were represented in delimited areas along with their heritage elements. These areas have given rise to “routes” that contain the corresponding heritage elements (Figure 6):
This synthesis of weighted values is presented in Table 5, through which it can be established that the magnitude values are dispersed in the selected territorial area. In this way, route E, Southern sector of the city—Civic Quarter, was selected for the implementation of geolocation in detail with the use of the MAR-MPN app.
Table 5.
Summary of MCE values by route. Santiago de Chile.
The heritage component was integrated by incorporating iconic landmarks of Santiago de Chile and enriched with multimedia elements such as 3D CAD models, spatial reconstructions, photographs, textual descriptions, audio narrations, and video content. These thematic and interactive enhancements serve as key knowledge assets, facilitating heritage dissemination through the digital platform. In this way, route E was used to collect data for the next stage, which has heritage buildings with better accessibility and quality.
3.3. Results of the Spatial Analyses of the Data Obtained from the Interaction of the App with Heritage Properties
Using the MAR-MPN app within the fieldwork from 54 devices, 1171 location points were obtained; this allowed an understanding of the relationship between building heritage, time, and interest in a given point. These data were stored in a CSV file for export to and subsequent analysis in GIS. In a first step, all the CSV files were joined into a single database. In a second step, the database was implemented using the GIS application. The records were spatialized using latitude and longitude coordinates, allowing the generation of a spatial model of the app, the user’s activities, and their dynamics with the heritage buildings (Figure 7).
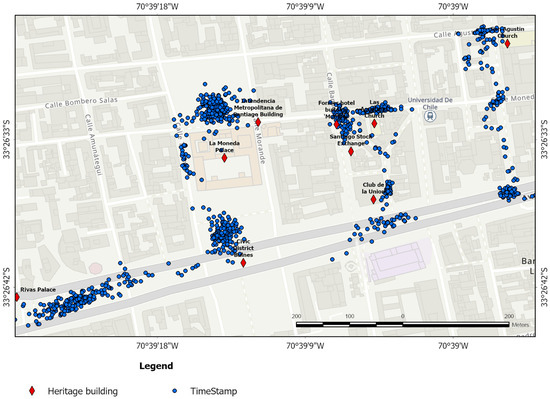
Figure 7.
TimeStamp obtained from the MAR-MPN app.
Thus, each location value is grouped into specific areas which indicate density patterns that correlate with the heritage values (heritage quality) of the buildings represented by the MAR-MPN app. In addition, it is essential to establish that the conditions established by the territory (presence of green areas, street width, pedestrian situation) determine the grouping of each location record.
The model was analysed using the ArcGIS Pro 3.4 hotspot analysis tool to determine spatial patterns and their correlation with the heritage quality buildings. Using the Gi* statistic, the values represented by the model in the dataset were made to correspond to a z-score. In this spatial model, positive z-scores are statistically significant: the higher the z-score obtained, the more intense the clustering of high values. For negative z-scores that are statistically significant, the smaller the z-score, the more intense the clustering of low values. The coefficient was applied from the measurement points, and the number of 492 hexagons demonstrated some level of optimisation achieved by the indicator (Figure 8). In this way, 52 hot spots are established, with 99% confidence in their grouping, which are correlated with buildings with a high heritage level, such as La Moneda Palace, Intendencia Metropolitana de Santiago Building, Las Agustinas Church, and to a lesser extent, the San Agustin Church. On the other hand, some buildings obtain polygons that are not significant due to elements such as their extension or heritage quality (Rivas Palace, Civic District Bulnes, Santiago Stock Exchange, and former hotel building Mundial).
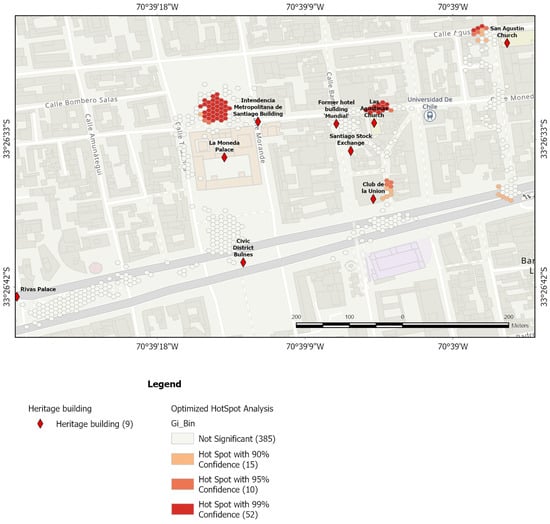
Figure 8.
Optimised hot spot analysis from spatial model.
4. Conclusions
The MPN-MAR app was built considering a technological approach based on encapsulated and adaptable architecture, allowing its optimal operation on mobile devices, particularly on tablets, but with comparable operation on smartphones. Thus, it was possible to implement a solution that guarantees the portability and mobility of the system, making it ubiquitous in both its location content and interactive resources, such as AR. In addition, this app is adaptable to other territorial conditions, not only to heritage content but also to present other content located in space (environment, natural resources, infrastructure, to mention a few topics).
The delimitation and influence of heritage buildings on the territory were determined through a multi-criteria analysis that included territorial evaluation tools, allowing us to achieve a comprehensive characterisation of the areas of influence and thus a better deployment regarding the territorial ordering and classification of the contents. This served as the basis for the app’s implementation, the development of the sampling activity, and the collection of timestamp data for subsequent analysis. Thus, from the data that were obtained, a spatial correlation of the data derived from the interaction with the application was obtained to identify patterns of the spatial distribution of the consultations, providing valuable information on the behaviour of users regarding heritage properties. The more significant the heritage richness of the building, the longer it was located in the territory.
In this way, the future actions to be taken involve the intervention’s replicability in other established heritage routes or areas and establishing the specific heritage parameters that condition territorial concentration.
Author Contributions
Conceptualization, J.J.-N. and J.R.-B.; methodology, J.J.-N.; software, J.J.-N.; validation, J.J.-N. and J.R.-B.; formal analysis, J.J.-N.; investigation, J.J.-N.; resources, J.R.-B.; data curation, J.J.-N.; writing—original draft preparation, J.J.-N.; writing—review and editing, J.R.-B.; visualization, J.J.-N.; supervision, J.J.-N.; project administration, J.J.-N.; funding acquisition, J.R.-B. All authors have read and agreed to the published version of the manuscript.
Funding
This research was funded by Regular FONDECYT “Scientific computing in the initial training of science teachers: development of computational thinking within the framework of technological pedagogical knowledge of science”; Project number 1221942 ANID, Chile.
Institutional Review Board Statement
Not applicable.
Informed Consent Statement
Not applicable.
Data Availability Statement
The data presented in this study are available on request from the corresponding author due to the type of file used.
Conflicts of Interest
The authors declare no conflicts of interest. The funders had no role in the design of the study; in the collection, analysis, or interpretation of data; in the writing of the manuscript; or in the decision to publish the results.
Abbreviations
The following abbreviations are used in this manuscript:
| AR | Augmented Reality |
| MAR | Mobile Augmented Reality |
| GIS | Geographical Information System |
| MPN | Mobile Pedestrian Navigation |
| MCE | Multi-Criterion Evaluation |
| CAD | Computer-Aided Design |
| CSV | Comma-Separated Values File |
| GPS | Global Position System |
| GNSS | Global Navigation Satellite System |
| Gi* | Getis-Ord indicator |
References
- Berners-Lee, T.; Hendler, J.; Lassila, O. The Semantic Web. Available online: http://www.scientificamerican.com/article/the-semantic-web/ (accessed on 6 December 2024).
- Joo-Nagata, J. Gestión de la información, herramientas tecnológicas y formación docente: Aportes a la enseñanza de la Geografía. Rev. Signos Geográficos 2024, 6, 1–15. [Google Scholar] [CrossRef]
- Joo Nagata, J.; García-Bermejo Giner, J.R.; Muñoz Rodríguez, J. Herramientas Geomáticas Utilizadas En Educación: Situación Actual y Su Relación Con Procesos Educativos. Enseñ. Teach. Rev. Interuniv. Didáctica 2015, 33, 25–56. [Google Scholar] [CrossRef][Green Version]
- Sdravopoulou, K.; Muñoz González, J.M.; Hidalgo-Ariza, M.D. Educating Adults with a Location-Based Augmented Reality Game: A Content Analysis Approach. Mathematics 2021, 9, 2071. [Google Scholar] [CrossRef]
- Suchman, L. Human-Machine Reconfigurations: Plans and Situated Actions, 2nd ed.; Cambridge University Press: Cambridge, UK; New York, NY, USA, 2006; ISBN 978-0-521-67588-8. [Google Scholar]
- Joo-Nagata, J.; García-Bermejo Giner, J.R.G.-B.; Martínez-Abad, F. Mobile Pedestrian Navigation and Augmented Reality in the Virtualization of the Territory: Cities of Salamanca and Santiago de Chile. In Information Technology Trends for a Global and Interdisciplinary Research Community; Peñalvo García, F., Ed.; IGI Global: Hershey, PA, USA, 2021; pp. 268–301. ISBN 978-1-79984-156-2. [Google Scholar]
- Hanchard, M. Engaging with Digital Maps: Our Knowledgeable Deferral to Rough Guides, 1st ed.; Geographies of Media; Palgrave Macmillan: Singapore, 2024; ISBN 978-981-9989-71-3. [Google Scholar]
- Aydin, B.; Gensel, J.; Genoud, P.; Calabretto, S.; Tellez, B. Extending Augmented Reality Mobile Application with Structured Knowledge from the LOD Cloud. In Proceedings of the Proceedings of the 3rd International Workshop on Information Management for Mobile Applications, Riva del Garda, Italy, 26 August 2013; Delot, T., Geisler, S., Ilarri, S., Quix, C., Eds.; RWTH Aachen University: Aachen, Germany, 2013; Volume 1075, pp. 21–27. [Google Scholar]
- Jamali, S.S.; Shiratuddin, M.F.; Wong, K.W. A Review of Augmented Reality (AR) and Mobile-Augmented Reality (mAR) Technology: Learning in Tertiary Education. Int. J. Learn. High. Educ. 2014, 20, 37–54. [Google Scholar]
- Hofmann, S.; Mosemghvdlishvili, L. Perceiving Spaces through Digital Augmentation: An Exploratory Study of Navigational Augmented Reality Apps. Mob. Media Commun. 2014, 2, 265–280. [Google Scholar] [CrossRef]
- Aurelia, S.; Raj, M.D.; Saleh, O. Mobile Augmented Reality and Location Based Service. Adv. Inf. Sci. Appl. 2014, 2, 551–558. [Google Scholar]
- Cheng, K.-H.; Tsai, C.-C. Affordances of Augmented Reality in Science Learning: Suggestions for Future Research. J. Sci. Educ. Technol. 2012, 22, 449–462. [Google Scholar] [CrossRef]
- Jan, M.; Squire, K. Mad City Mystery: Developing Scientific Argumentation Skills with a Place-Based Augmented Reality Game on Handheld Computers. J. Sci. Educ. Technol. 2007, 16, 5–29. [Google Scholar] [CrossRef]
- FitzGerald, E.; Adams, A.; Ferguson, R.; Gaved, M.; Mor, Y.; Thomas, R. Augmented Reality and Mobile Learning: The State of the Art. In Proceedings of the CEUR Workshop Proceedings, Helsinki, Finland, 16 October 2012; Volume 955, pp. 62–69. [Google Scholar]
- Adams, M. The 10 Most Important Emerging Technologies for Humanity. Available online: http://www.naturalnews.com/SpecialReports/EmergingTechnologies.pdf (accessed on 22 July 2024).
- Johnson, L.; Smith, R.; Willis, H.; Levine, A.; Haywood, K. The Horizon Report 2011 Edition; The New Media Consortium; EDUCAUSE Learning Initiative: Austin, TX, USA, 2011; ISBN 978-0-9828290-5-9. [Google Scholar]
- Martínez Landa, H. Problems Analysis and Solutions for the Establishment of Augmented Reality Technology in Maintenance and Education. Ph.D. Thesis, Tampere University of Technology, Tampere, Finlandia, 2015. [Google Scholar]
- Martí, C.; Feliu, J.; Varga, D. Geographic Information Technology and Innovative Teaching: Keys to Geography Degree Curriculum Reform. J. Geogr. 2014, 113, 118–128. [Google Scholar] [CrossRef]
- Riera, A.S.; Redondo, E.; Fonseca, D. Geo-Located Teaching Using Handheld Augmented Reality: Good Practices to Improve the Motivation and Qualifications of Architecture Students. Univers. Access Inf. Soc. 2014, 14, 363–374. [Google Scholar] [CrossRef]
- Abbas, R.; Michael, K.; Michael, M. The Regulatory Considerations and Ethical Dilemmas of Location-Based Services (LBS). Inf. Technol. People 2014, 27, 2–20. [Google Scholar] [CrossRef]
- Meng, L.; Reichenbacher, T.; Zipf, A. (Eds.) Map-Based Mobile Services; Springer: Berlin/Heidelberg, Germany, 2005; ISBN 3-540-23055-6. [Google Scholar]
- Chen, G.; Kotz, D. A Survey of Context-Aware Mobile Computing Research; Department of Computer Science, Dartmouth College: Hanover, NH, USA, 2000; p. 16. [Google Scholar]
- Dey, A.K. Understanding and Using Context. Pers. Ubiquitous Comput. 2001, 5, 4–7. [Google Scholar] [CrossRef]
- Perera, C.; Zaslavsky, A.; Christen, P.; Georgakopoulos, D. Context Aware Computing for The Internet of Things: A Survey. IEEE Commun. Surv. Tutor. 2014, 16, 414–454. [Google Scholar] [CrossRef]
- Gómez Delgado, M.; Barredo Cano, J.I. Sistemas de Información Geográfica y Evaluación Multicriterio: En la Ordenación del Territorio; Ra-Ma: Madrid, Spain, 2005; ISBN 978-84-7897-673-7. [Google Scholar]
- Consejo de Monumentos Nacionales de Chile Monumentos en Google Earth (Archivo KMZ). Available online: https://www.monumentos.gob.cl/sites/default/files/consejo_de_monumentos_nacionales-1_0.kmz (accessed on 3 March 2025).
- Secretaría de Planificación de Transporte Ortofotomosaico Gran Santiago. Available online: https://www.sectra.gob.cl/datos_informacion_espacial/metropolitana/santiago01.htm (accessed on 3 March 2025).
- Gobierno Regional Metropolitano Datos Planta Urbana de Santiago. Available online: http://www.gobiernosantiago.cl/servidor-de-mapas# (accessed on 3 March 2025).
- Earth Resources Observation and Science (EROS) Center Región Metropolitana, Santiago de Chile. Shuttle Radar Topography Mission. Available online: https://www.usgs.gov/centers/eros/science/usgs-eros-archive-digital-elevation-global-30-arc-second-elevation-gtopo30?qt-science_center_objects=0#qt-science_center_objects (accessed on 3 March 2025).
- De Ramón, A. Santiago de Chile (1541–1991): Historia de una Sociedad Urbana; Editorial MAPFRE: Madrid, Spain, 1992; ISBN 84-7100-427-5. [Google Scholar]
- Consejo de Monumentos Nacionales de Chile Nómina Oficial de Monumentos Nacionales Declarados Por Decreto. Available online: https://www.monumentos.gob.cl/monumentos/monumentos-monumentos#:~:text=07_nomina_mn_declarados_por_decreto_web.xlsx-,DESCARGAR,-Monumentos%20en%20Google (accessed on 3 March 2025).
- Henríquez, C.; Quense, J. Evaluación Multicriterio/Multiobjetivo aplicada a los usos y coberturas de suelo en la cuenca de Chillán. Tiempo Espac. Univ. Bio-Bío 2009, 25, 21–39. [Google Scholar]
- Palma Herrera, J.L. Sistemas de Información Geográfica (SIG) y Metodologías de Evaluación Multicriterio (EMC) En La Búsqueda de Escenarios Alternativos Para El Mejoramiento Socioespacial de Las Áreas Urbanas Populares de La Ciudad de Comayagua. Geogr. Sist. Inf. Geográfica GESIG-UNLU Luján 2013, 5, 180–193. [Google Scholar] [CrossRef]
- Colls, C.S.; Colls, K. Reconstructing a Painful Past: A Non-Invasive Approach to Reconstructing Lager Norderney in Alderney, the Channel Islands. In Visual Heritage in the Digital Age; Ch’ng, E., Gaffney, V., Chapman, H., Eds.; Springer Series on Cultural Computing; Springer: London, UK, 2013; pp. 119–146. ISBN 978-1-4471-5534-8. [Google Scholar]
- Galani, A.; Mazel, A.; Maxwell, D.; Sharpe, K. Situating Cultural Technologies Outdoors: Empathy in the Design of Mobile Interpretation of Rock Art in Rural Britain. In Visual Heritage in the Digital Age; Ch’ng, E., Gaffney, V., Chapman, H., Eds.; Springer Series on Cultural Computing; Springer: London, UK, 2013; pp. 183–204. ISBN 978-1-4471-5534-8. [Google Scholar]
- Kokalj, Ž.; Pehani, P.; Goodchild, H.; Gaffney, V.; Oštir, K. Crossing Borders: A Multi-Layer GIS Mapping Framework for the Cultural Management of the Mundo Maya Region. In Visual Heritage in the Digital Age; Ch’ng, E., Gaffney, V., Chapman, H., Eds.; Springer Series on Cultural Computing; Springer: London, UK, 2013; pp. 169–182. ISBN 978-1-4471-5534-8. [Google Scholar]
- Ramsey, E. Urban Scrawl: Reconstructing Urban Landscapes Using Documentary Sources. In Visual Heritage in the Digital Age; Ch’ng, E., Gaffney, V., Chapman, H., Eds.; Springer Series on Cultural Computing; Springer: London, UK, 2013; pp. 147–167. ISBN 978-1-4471-5534-8. [Google Scholar]
- Garnica Berrocal, R.; Galvis Causil, S. Análisis geográfico del turismo desde la perspectiva espacial de los equipamientos y sitios de interés turísticos en Montería, una ciudad ribereña al norte de Colombia. Rev. Geográfica América Cent. 2014, 1, 117–138. [Google Scholar]
- Rahimi, M.; Malek, M.R. Context-Aware Abstraction and Generalization of Street Networks: Two Cognitively Engineered User-Oriented Approaches Using Network Voronoi Diagrams. Geocarto Int. 2015, 30, 560–579. [Google Scholar] [CrossRef]
- She, B.; Zhu, X.; Ye, X.; Guo, W.; Su, K.; Lee, J. Weighted Network Voronoi Diagrams for Local Spatial Analysis. Comput. Environ. Urban Syst. 2015, 52, 70–80. [Google Scholar] [CrossRef]
- Enviroment Research System Investigation Optimized Hot Spot Analysis (Spatial Statistics)—ArcGIS Pro|Documentation. Available online: https://pro.arcgis.com/en/pro-app/latest/tool-reference/spatial-statistics/optimized-hot-spot-analysis.htm (accessed on 13 January 2025).
- Ord, J.K.; Getis, A. Local Spatial Autocorrelation Statistics: Distributional Issues and an Application. Geogr. Anal. 1995, 27, 286–306. [Google Scholar] [CrossRef]
- Law, M.; Collins, A.K. Getting to Know ArcGIS, 4th ed.; Esri Press: Redlands, CA, USA, 2015; ISBN 978-1-58948-382-8. [Google Scholar]
- Sevtsuk, A.; Mekonnen, M. Urban Network Analysis. A New Toolbox for ArcGIS. Rev. Int. Géomat. 2012, 222, 287–305. [Google Scholar] [CrossRef]
- Enviroment Research System Investigation ArcGIS Network Analyst. Available online: http://www.esri.com/software/arcgis/extensions/networkanalyst/key-features (accessed on 3 March 2025).


Disclaimer/Publisher’s Note: The statements, opinions and data contained in all publications are solely those of the individual author(s) and contributor(s) and not of MDPI and/or the editor(s). MDPI and/or the editor(s) disclaim responsibility for any injury to people or property resulting from any ideas, methods, instructions or products referred to in the content. |
© 2025 by the authors. Licensee MDPI, Basel, Switzerland. This article is an open access article distributed under the terms and conditions of the Creative Commons Attribution (CC BY) license (https://creativecommons.org/licenses/by/4.0/).