
Automatic Identification and Segmentation of Overlapping Fog Droplets Using XGBoost and Image Segmentation

 ,
,  ,
,
Abstract
1. Introduction
- (1)
- An overlapping fog droplet image preprocessing method is designed to effectively reduce interfering information through high-pass filtering, grey-scale transformation, binarisation, automatic thresholding and diffuse water filling.
- (2)
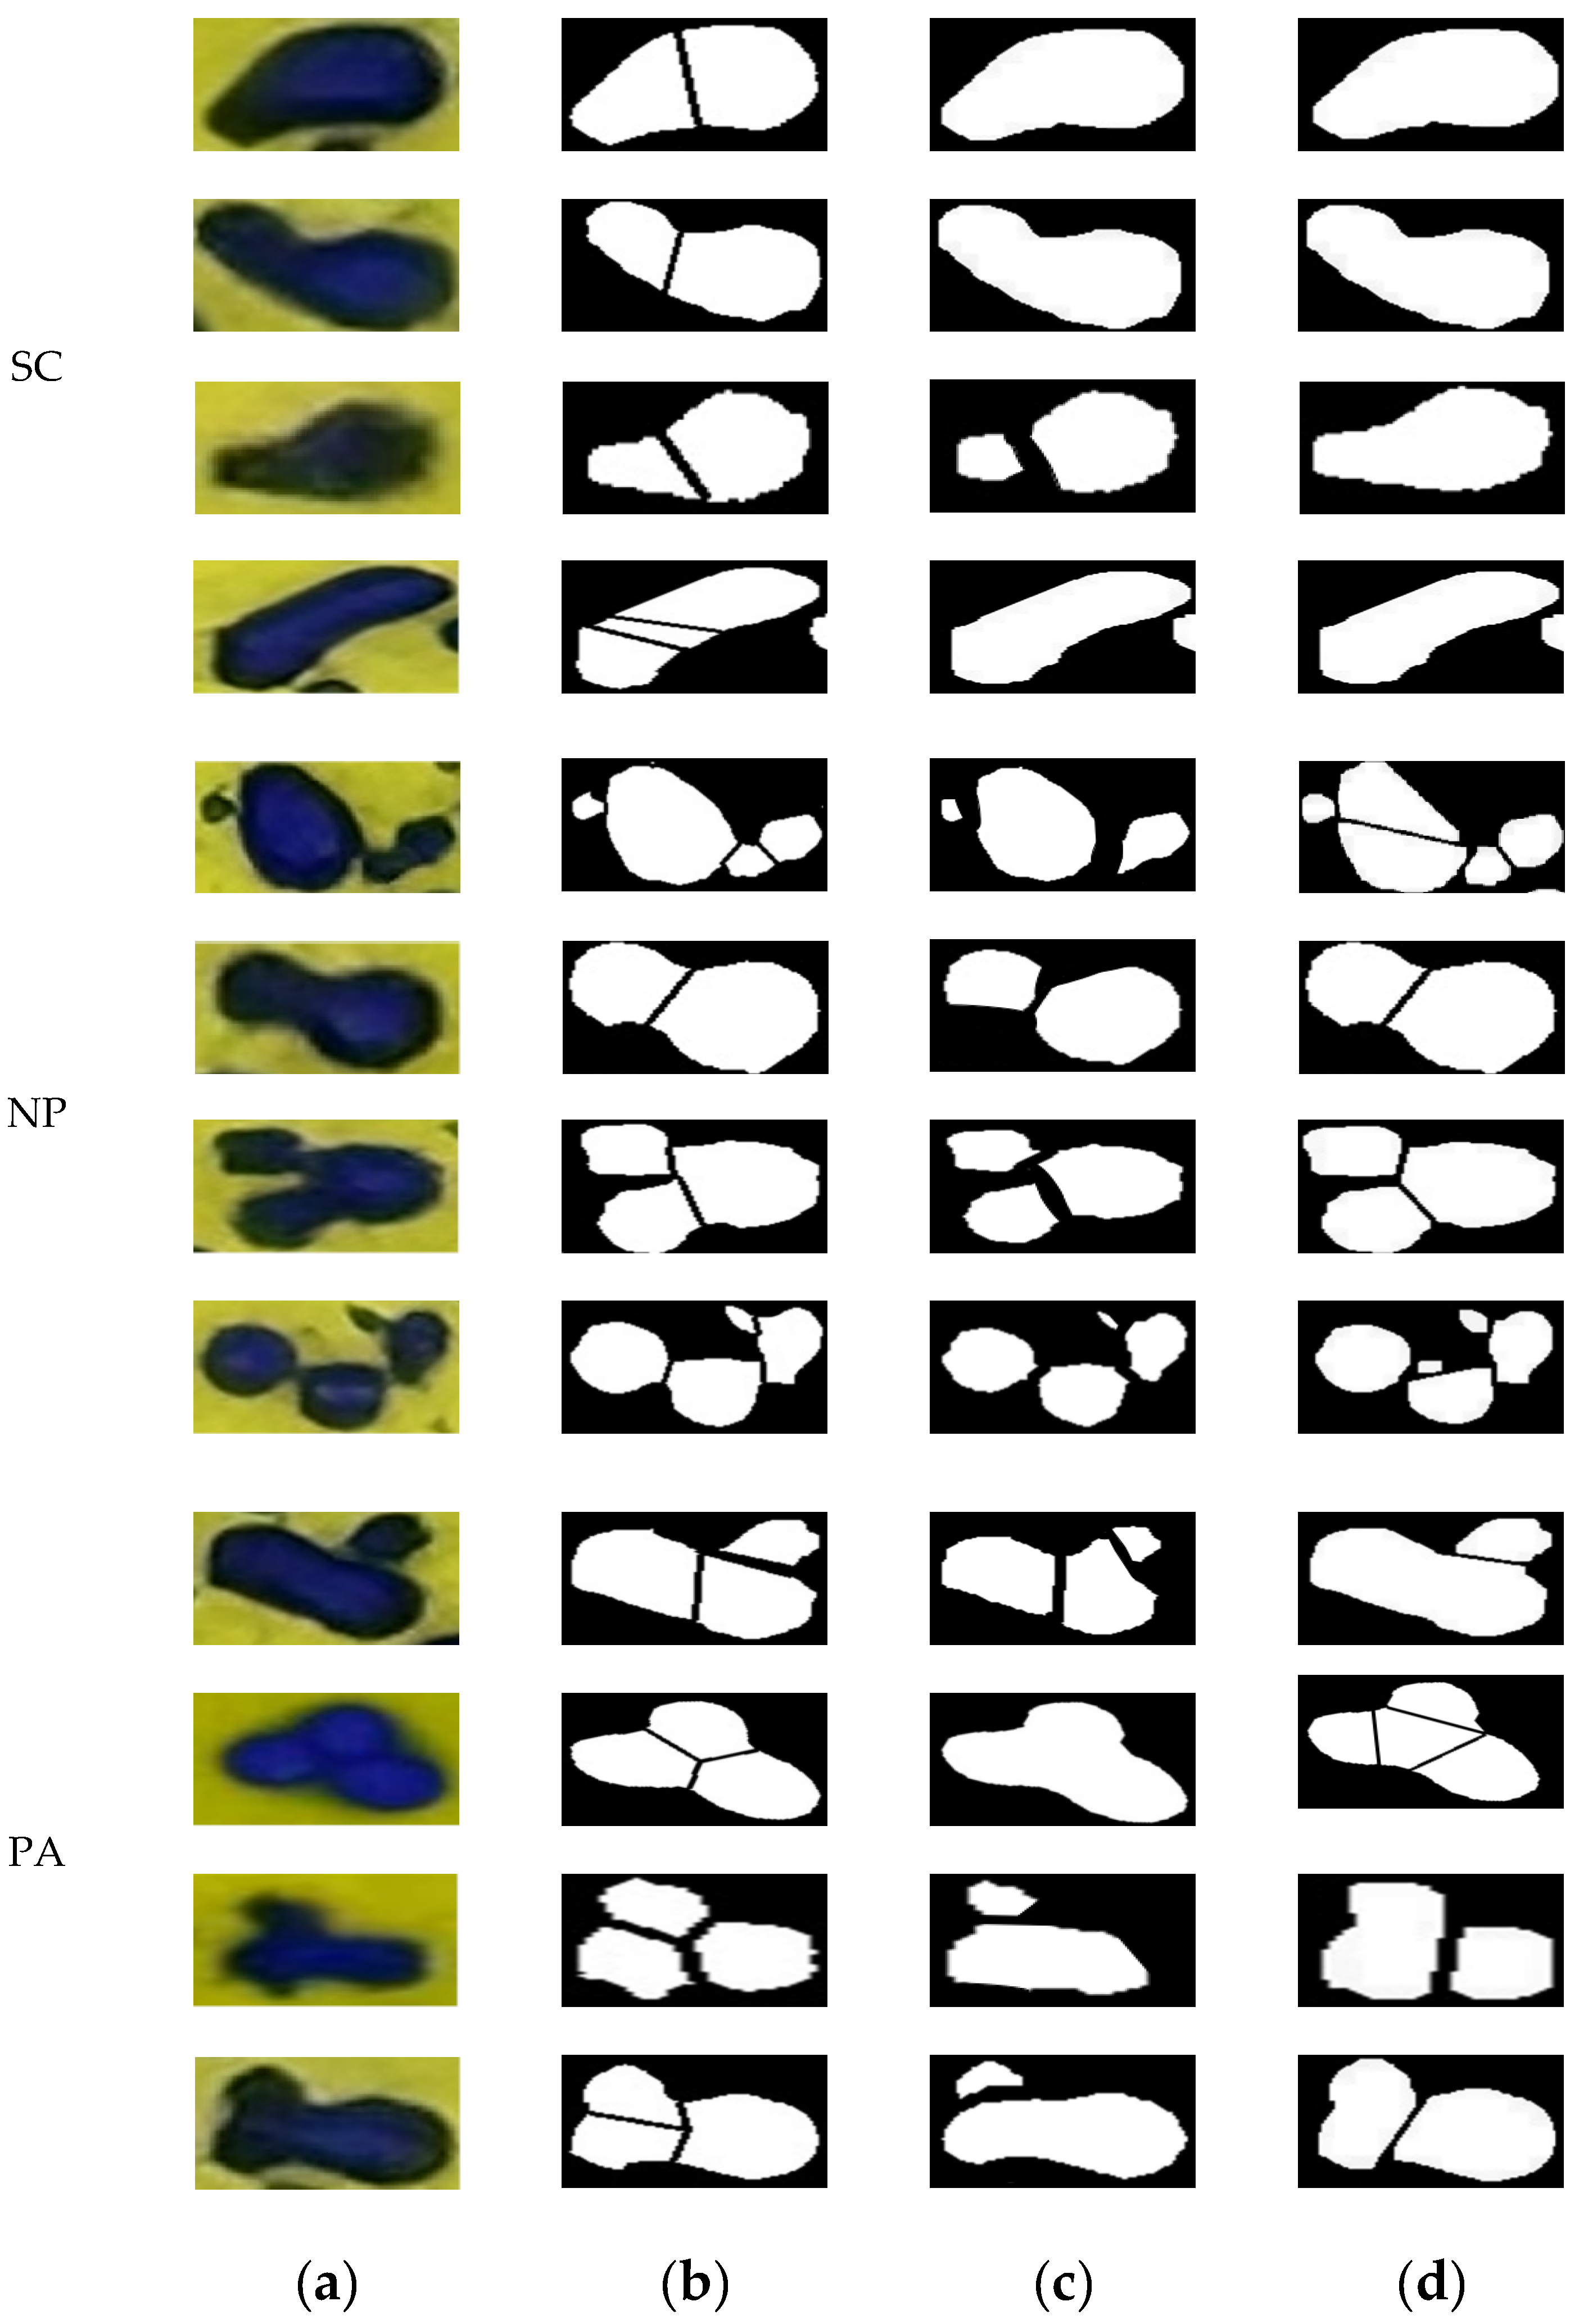
- Determination of overlapping fog-droplet categories, based on the number of depressions and morphological features detected in overlapping fog droplets, the types of overlapping fog droplets can be classified into three main categories: strong overlapping of single depressions, parallel overlapping, and non-parallel overlapping. This classification provides a clear guiding framework for subsequent segmentation and identification.
- (3)
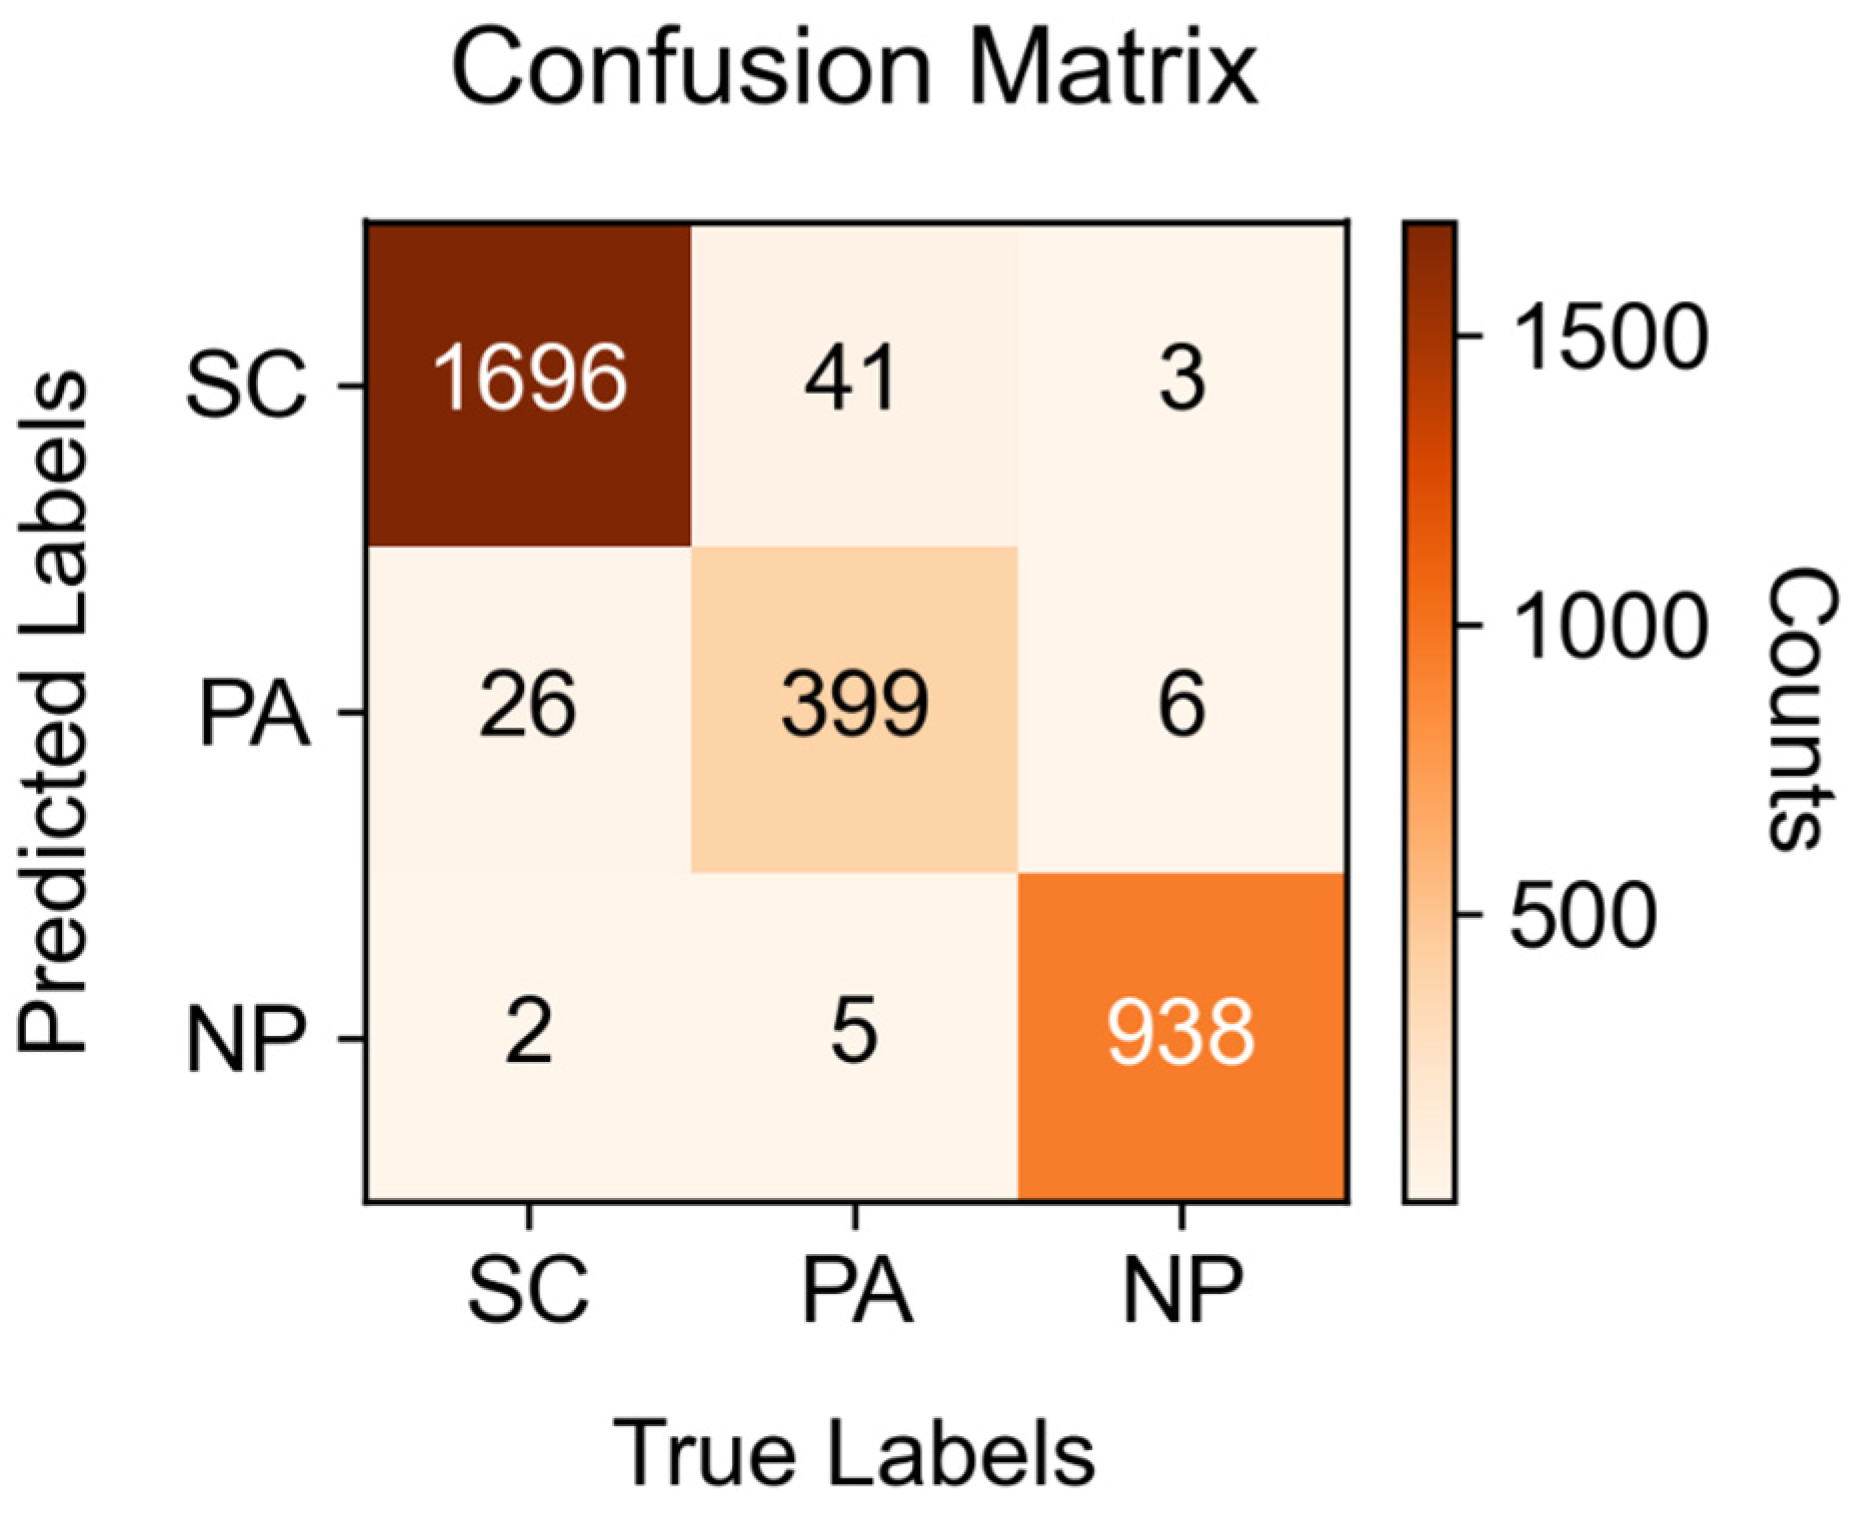
- XGBoost-based type-recognition model. A Bayesian-optimised XGBoost-based triple-classification model is constructed, which takes the fog droplet’s contour parameters as the feature input, and significantly improves the classification accuracy and robustness through hyperparameter tuning. Experimental results show that the model achieves 98% classification accuracy for more than 3000 overlapping fog drops, which effectively meets the subsequent classification requirements.
- (4)
- Differentiated segmentation strategy and iterative segmentation for overlapping droplets of different overlapping types. This study innovatively proposes a differentiated segmentation strategy and an iterative segmentation mechanism that significantly improve segmentation accuracy and efficiency. This targeted segmentation strategy effectively solves the segmentation problem in complex overlapping scenarios. In order to further optimise the segmentation effect, this study introduces a cyclic iterative segmentation mechanism: the initial segmentation results are analysed twice, and the residual overlapping regions are identified and segmented iteratively until independent droplets are obtained or an inseparable state is reached.
- (5)
- Conduct overlapping-droplet segmentation tests for verification and analysis. The experimental results show that the method can efficiently extract overlapped and contacted droplets from a single WSP image in an average of 2.66 s, which is a significant advantage over existing segmentation methods. The method not only solves the problem of low segmentation accuracy when dealing with overlapping or large overlapping droplets, but also improves the unseparation phenomenon generated when segmenting strongly overlapping droplets, and effectively restores the edges of the droplets in the overlapping region. The rest of the article is organised as follows. Section 2 of the paper describes the materials and methods, detailing the system environment and hardware configuration, image acquisition and processing, dataset production, development of a multi-classification model for overlapping droplets using XGBoost, and segmentation of overlapping-droplet images. Section 3 describes the experimental results and analyses, and tests are conducted to verify and analyse the classification and segmentation of overlapping droplets, respectively. Section 4 provides a comprehensive discussion of the experimental results. Finally, Section 5 summarises the main findings of this study and the direction of subsequent research.
2. Materials and Methods
2.1. System Environment and Hardware Configuration
2.2. Image Acquisition and Processing
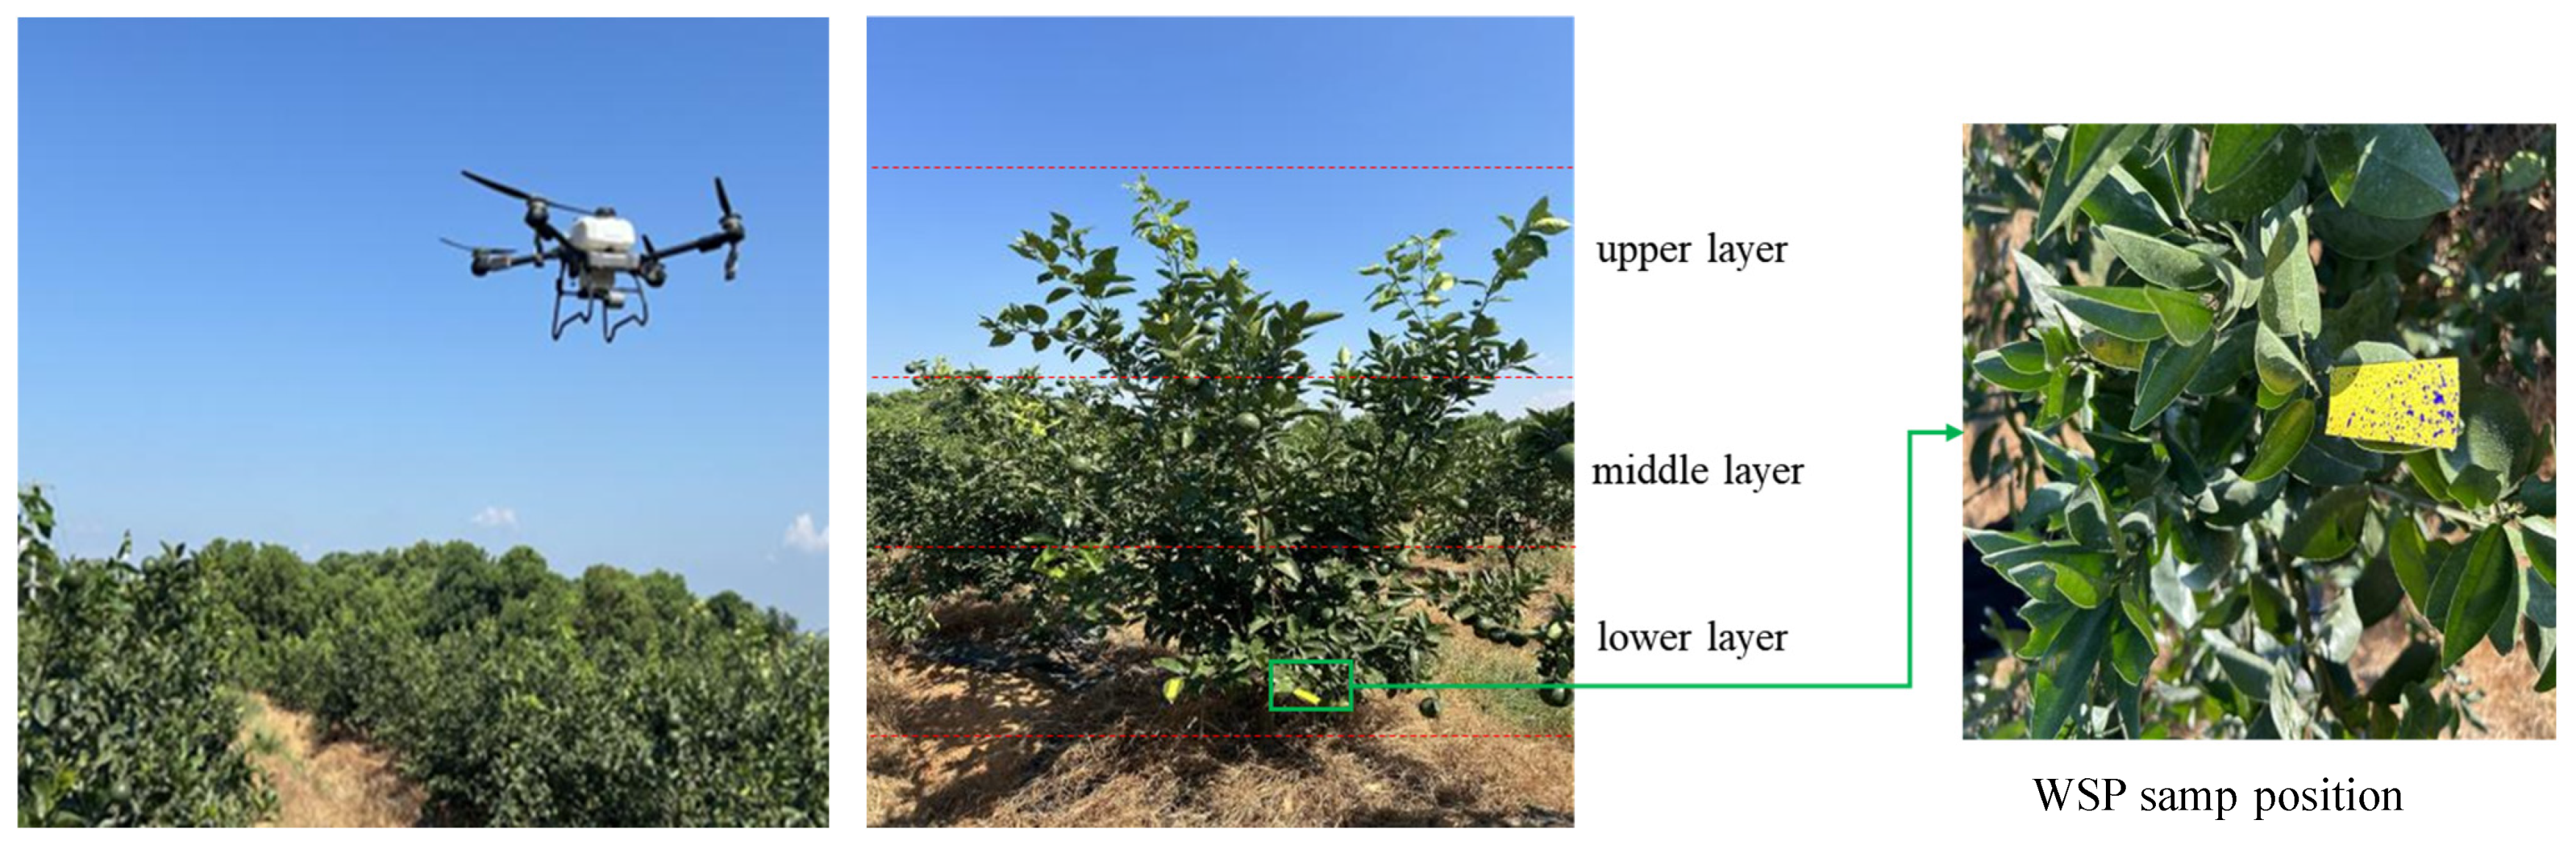
2.2.1. Image Acquisition
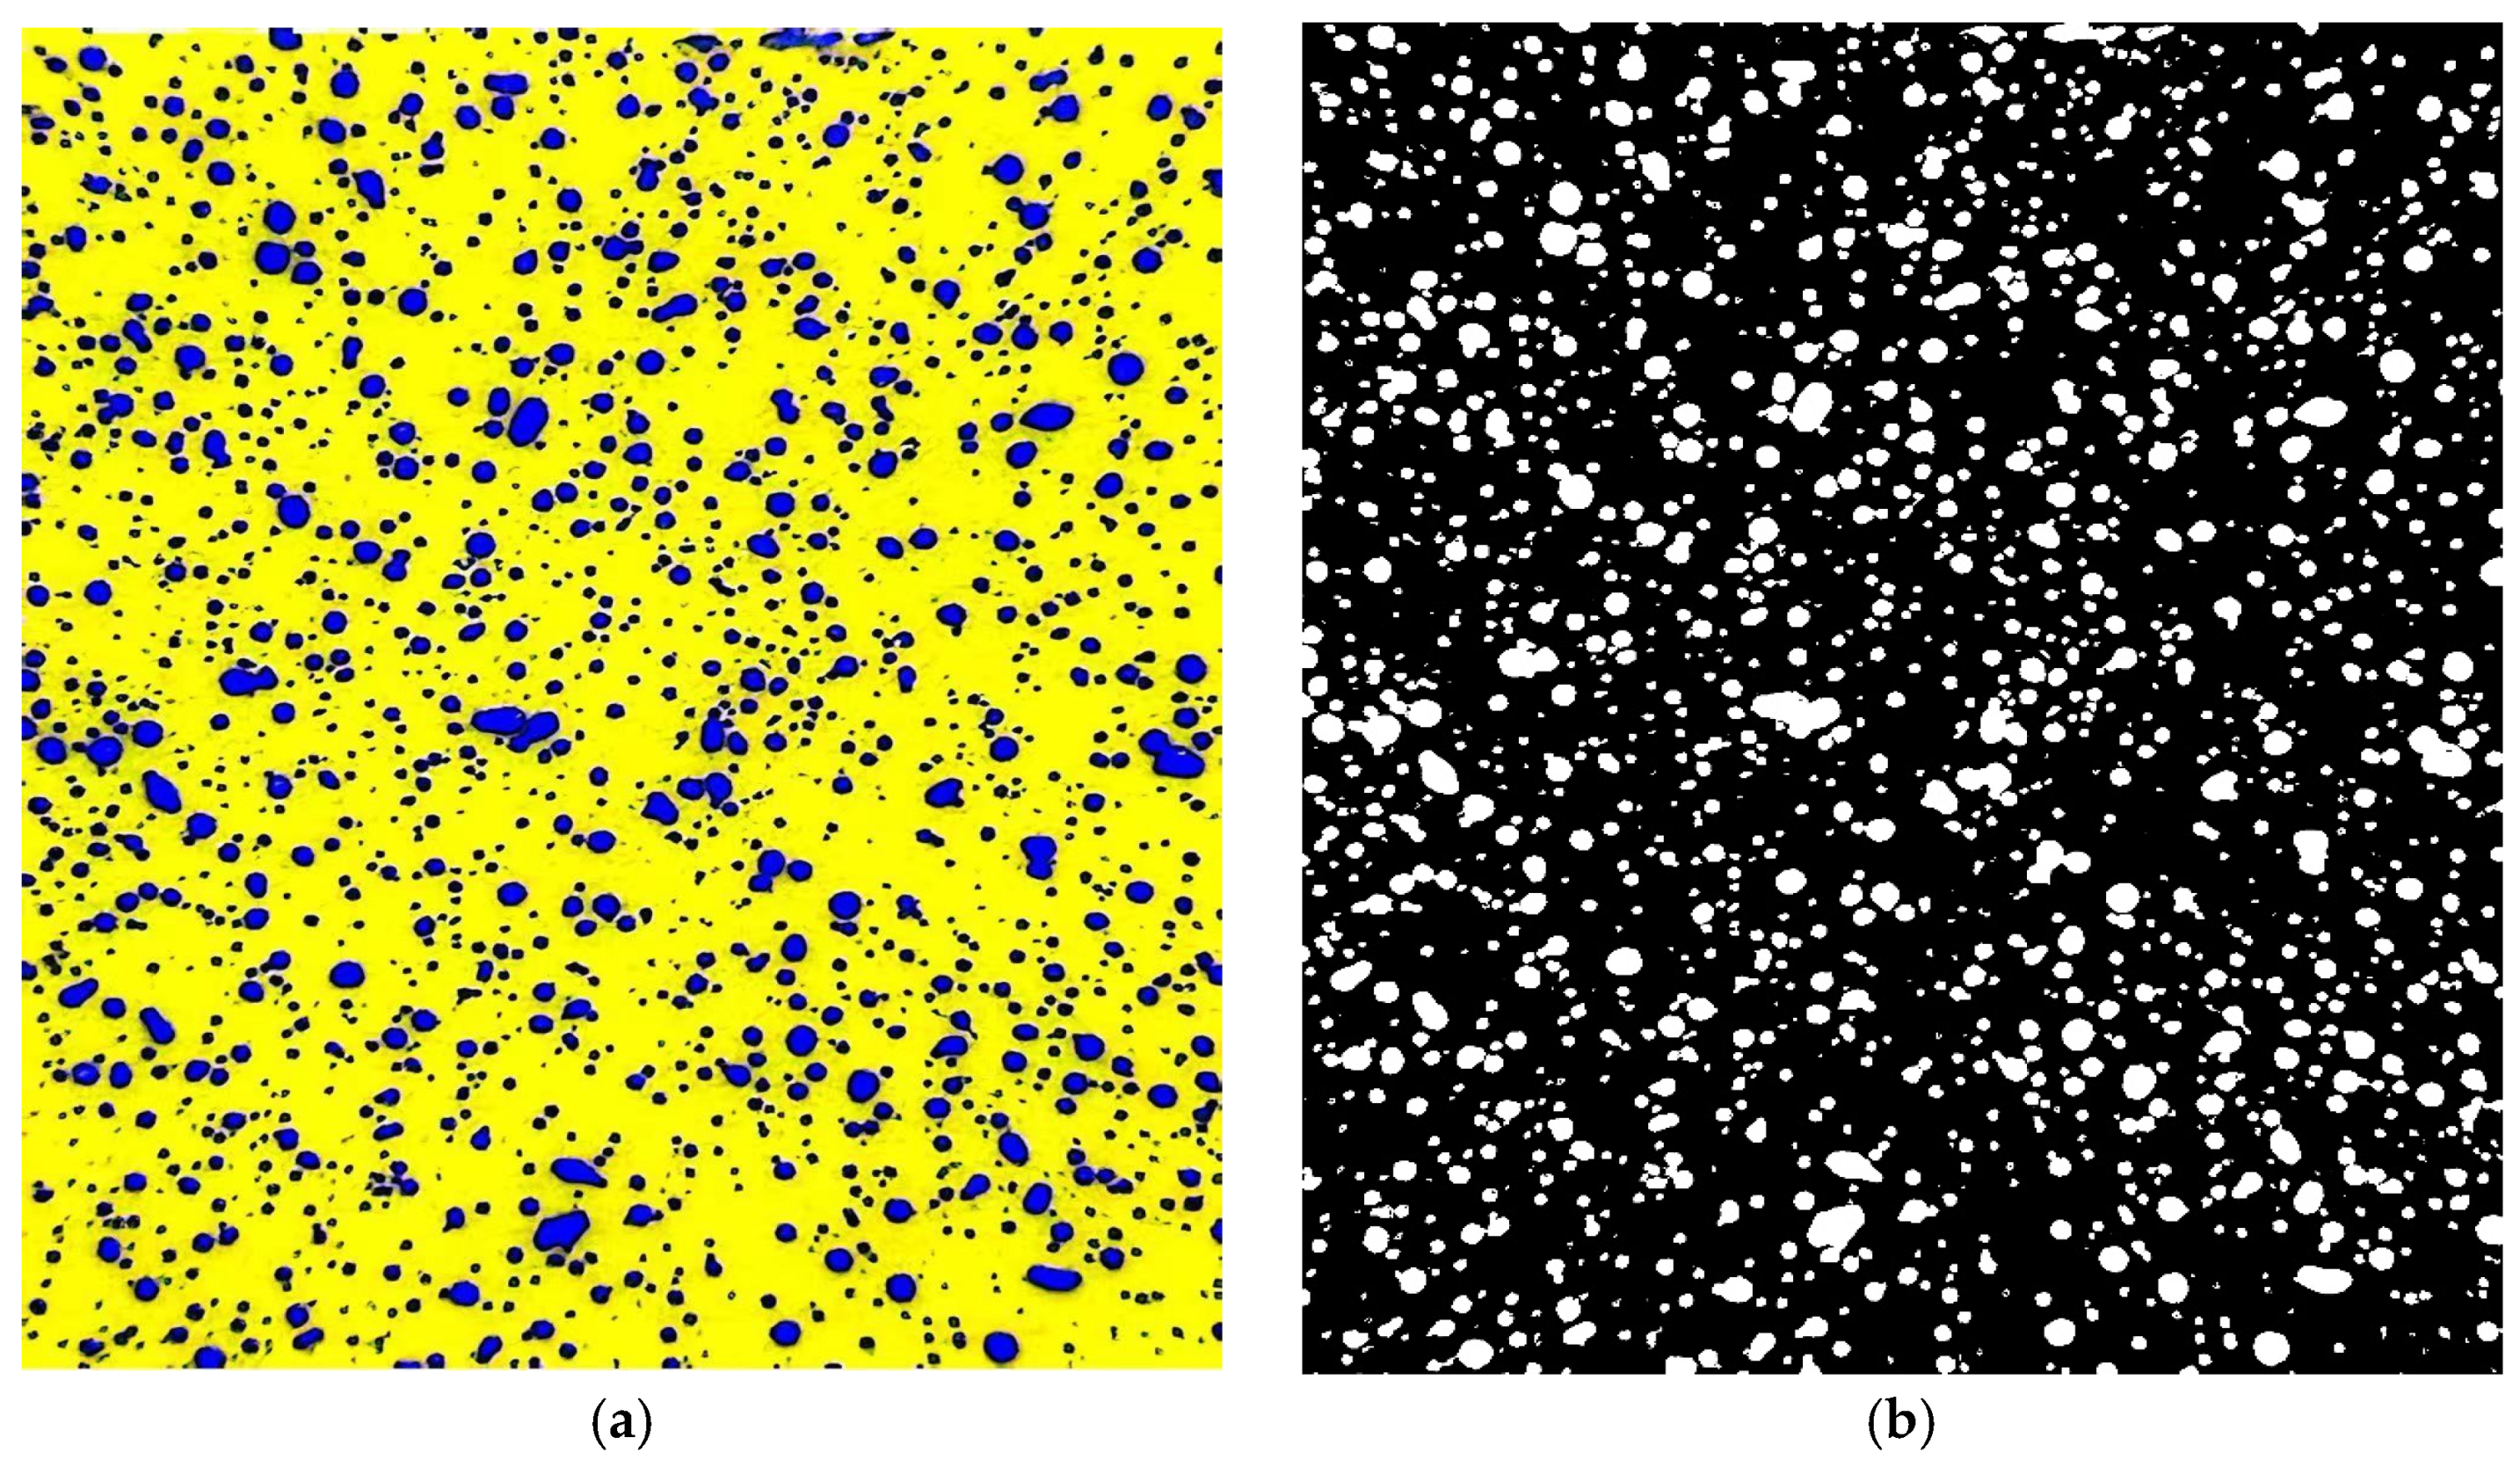
2.2.2. Image Preprocessing
2.3. The Production of the Dataset
2.4. Multi-Classification Model for Overlapping Fog Droplets Based on XGBoost
2.4.1. XGBoost Model
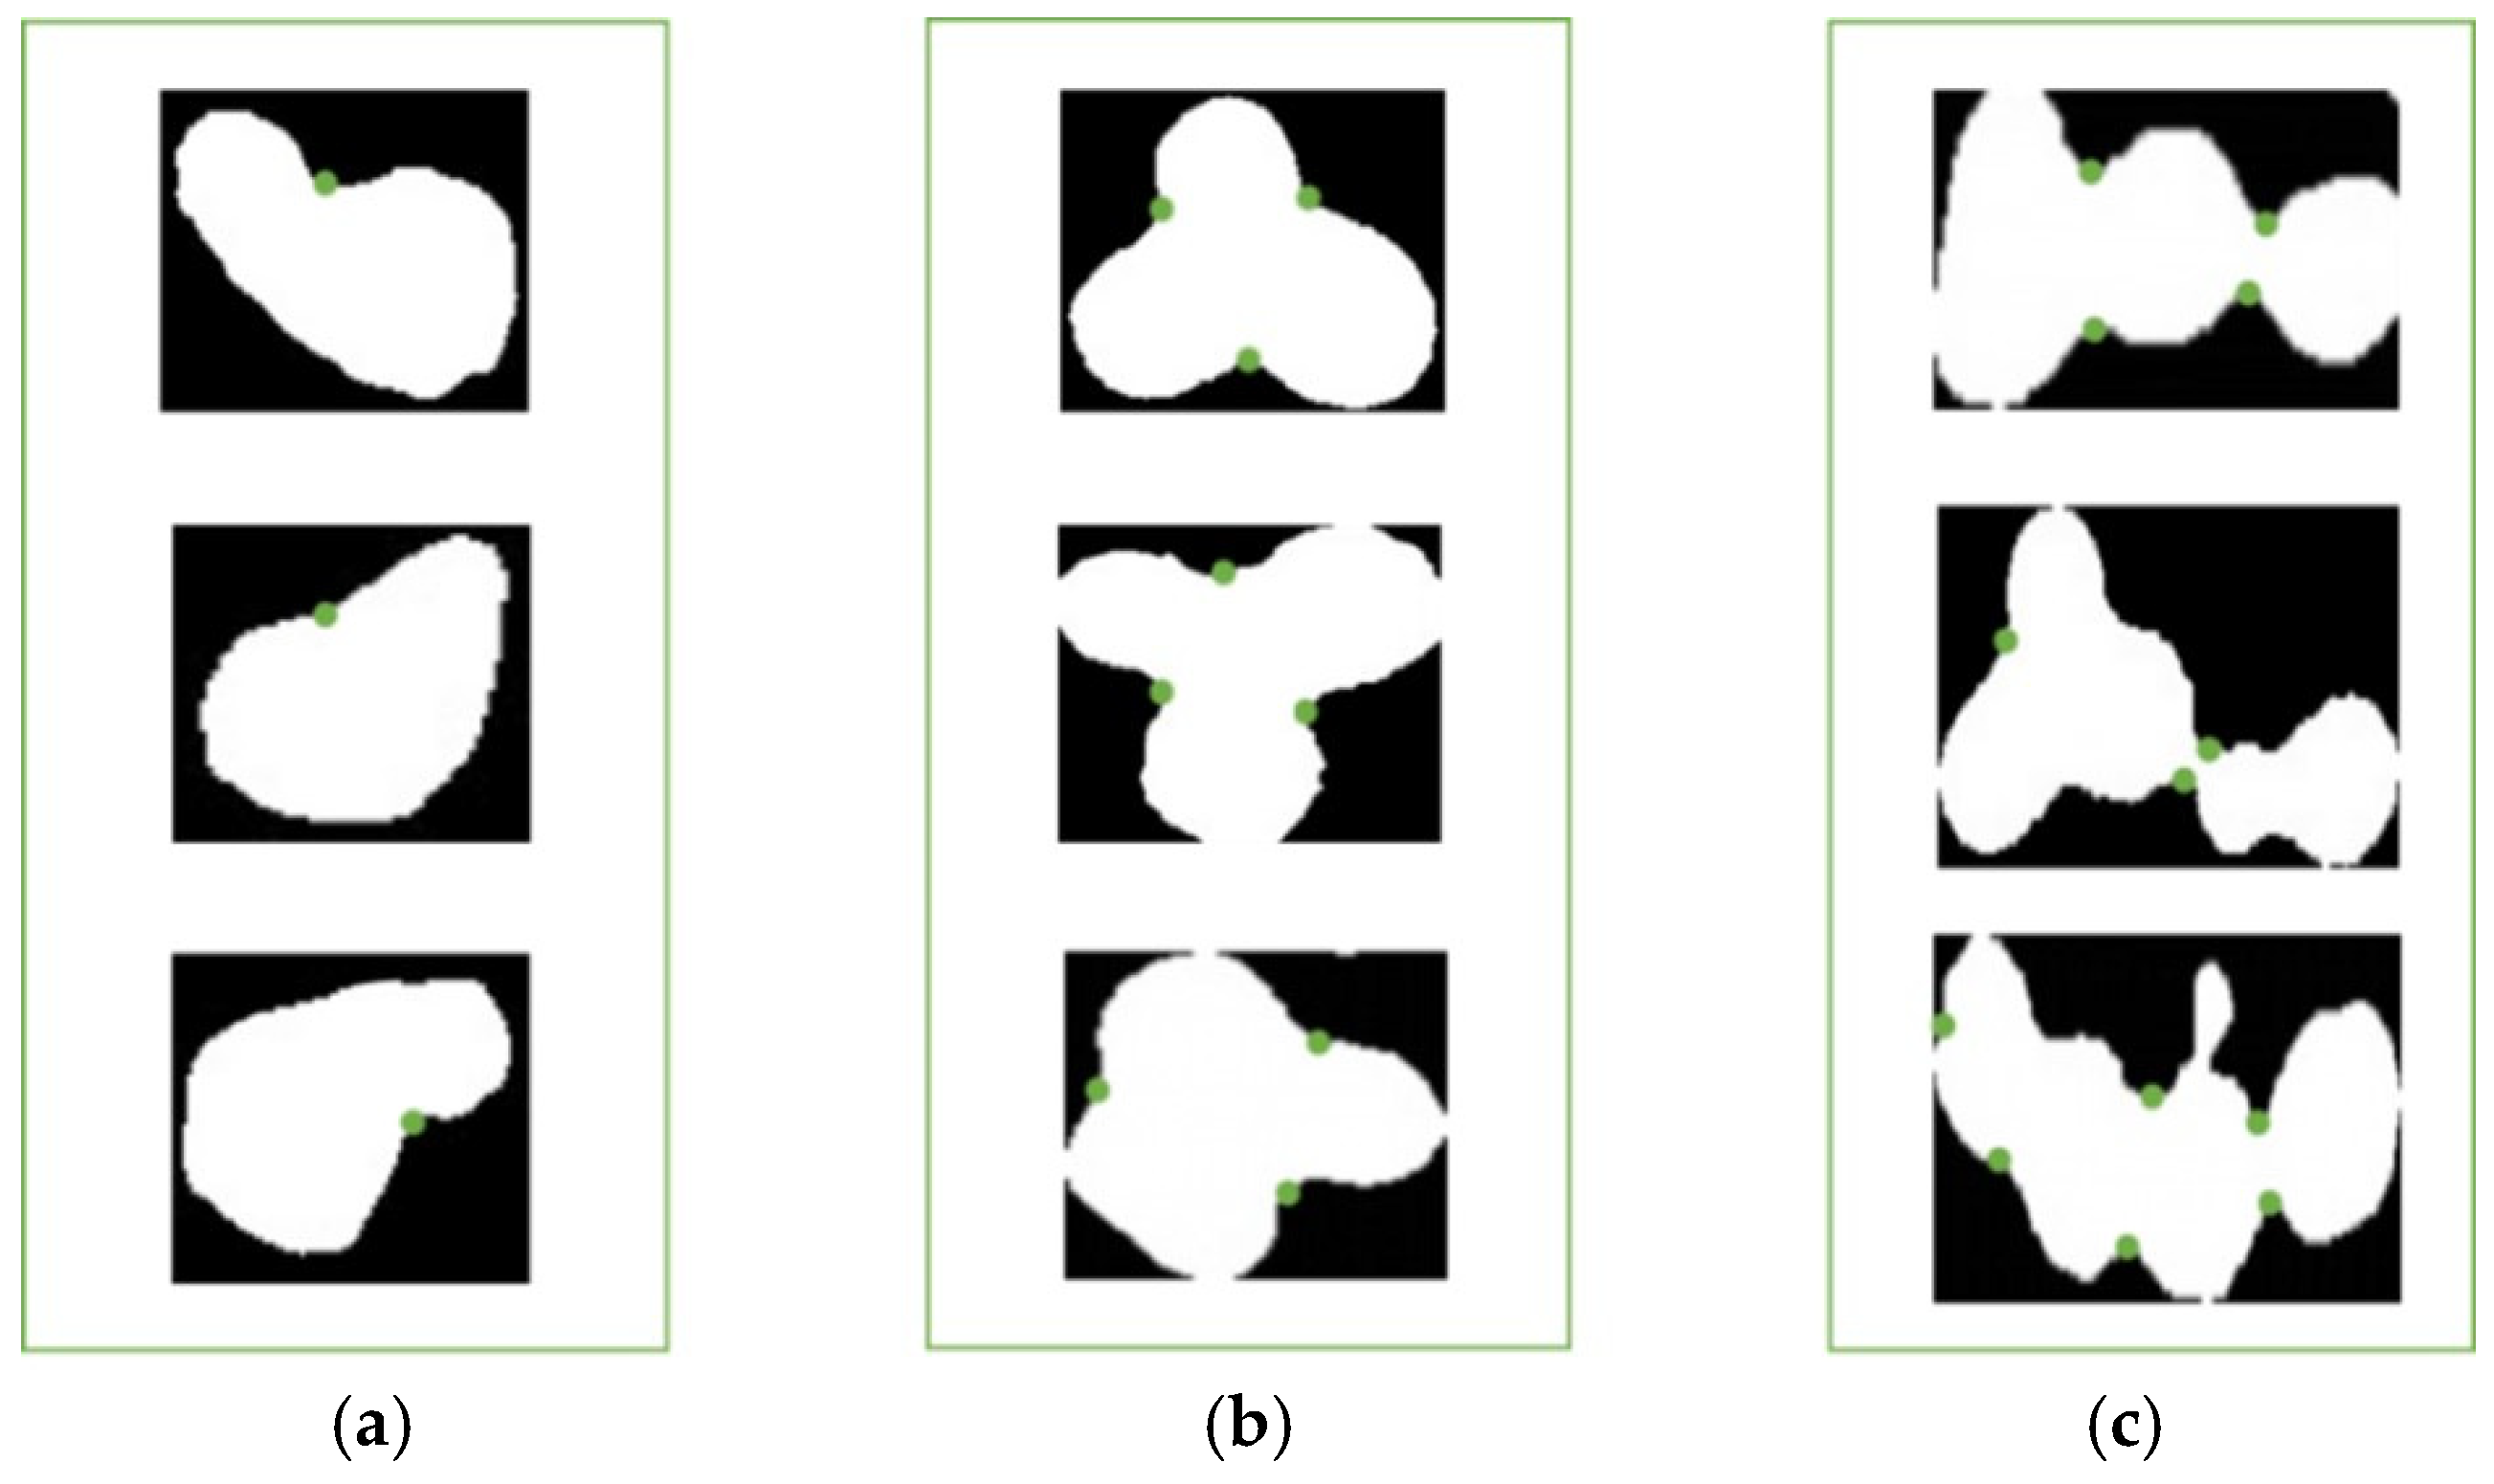
2.4.2. Determination of Overlapping-Droplet Categories
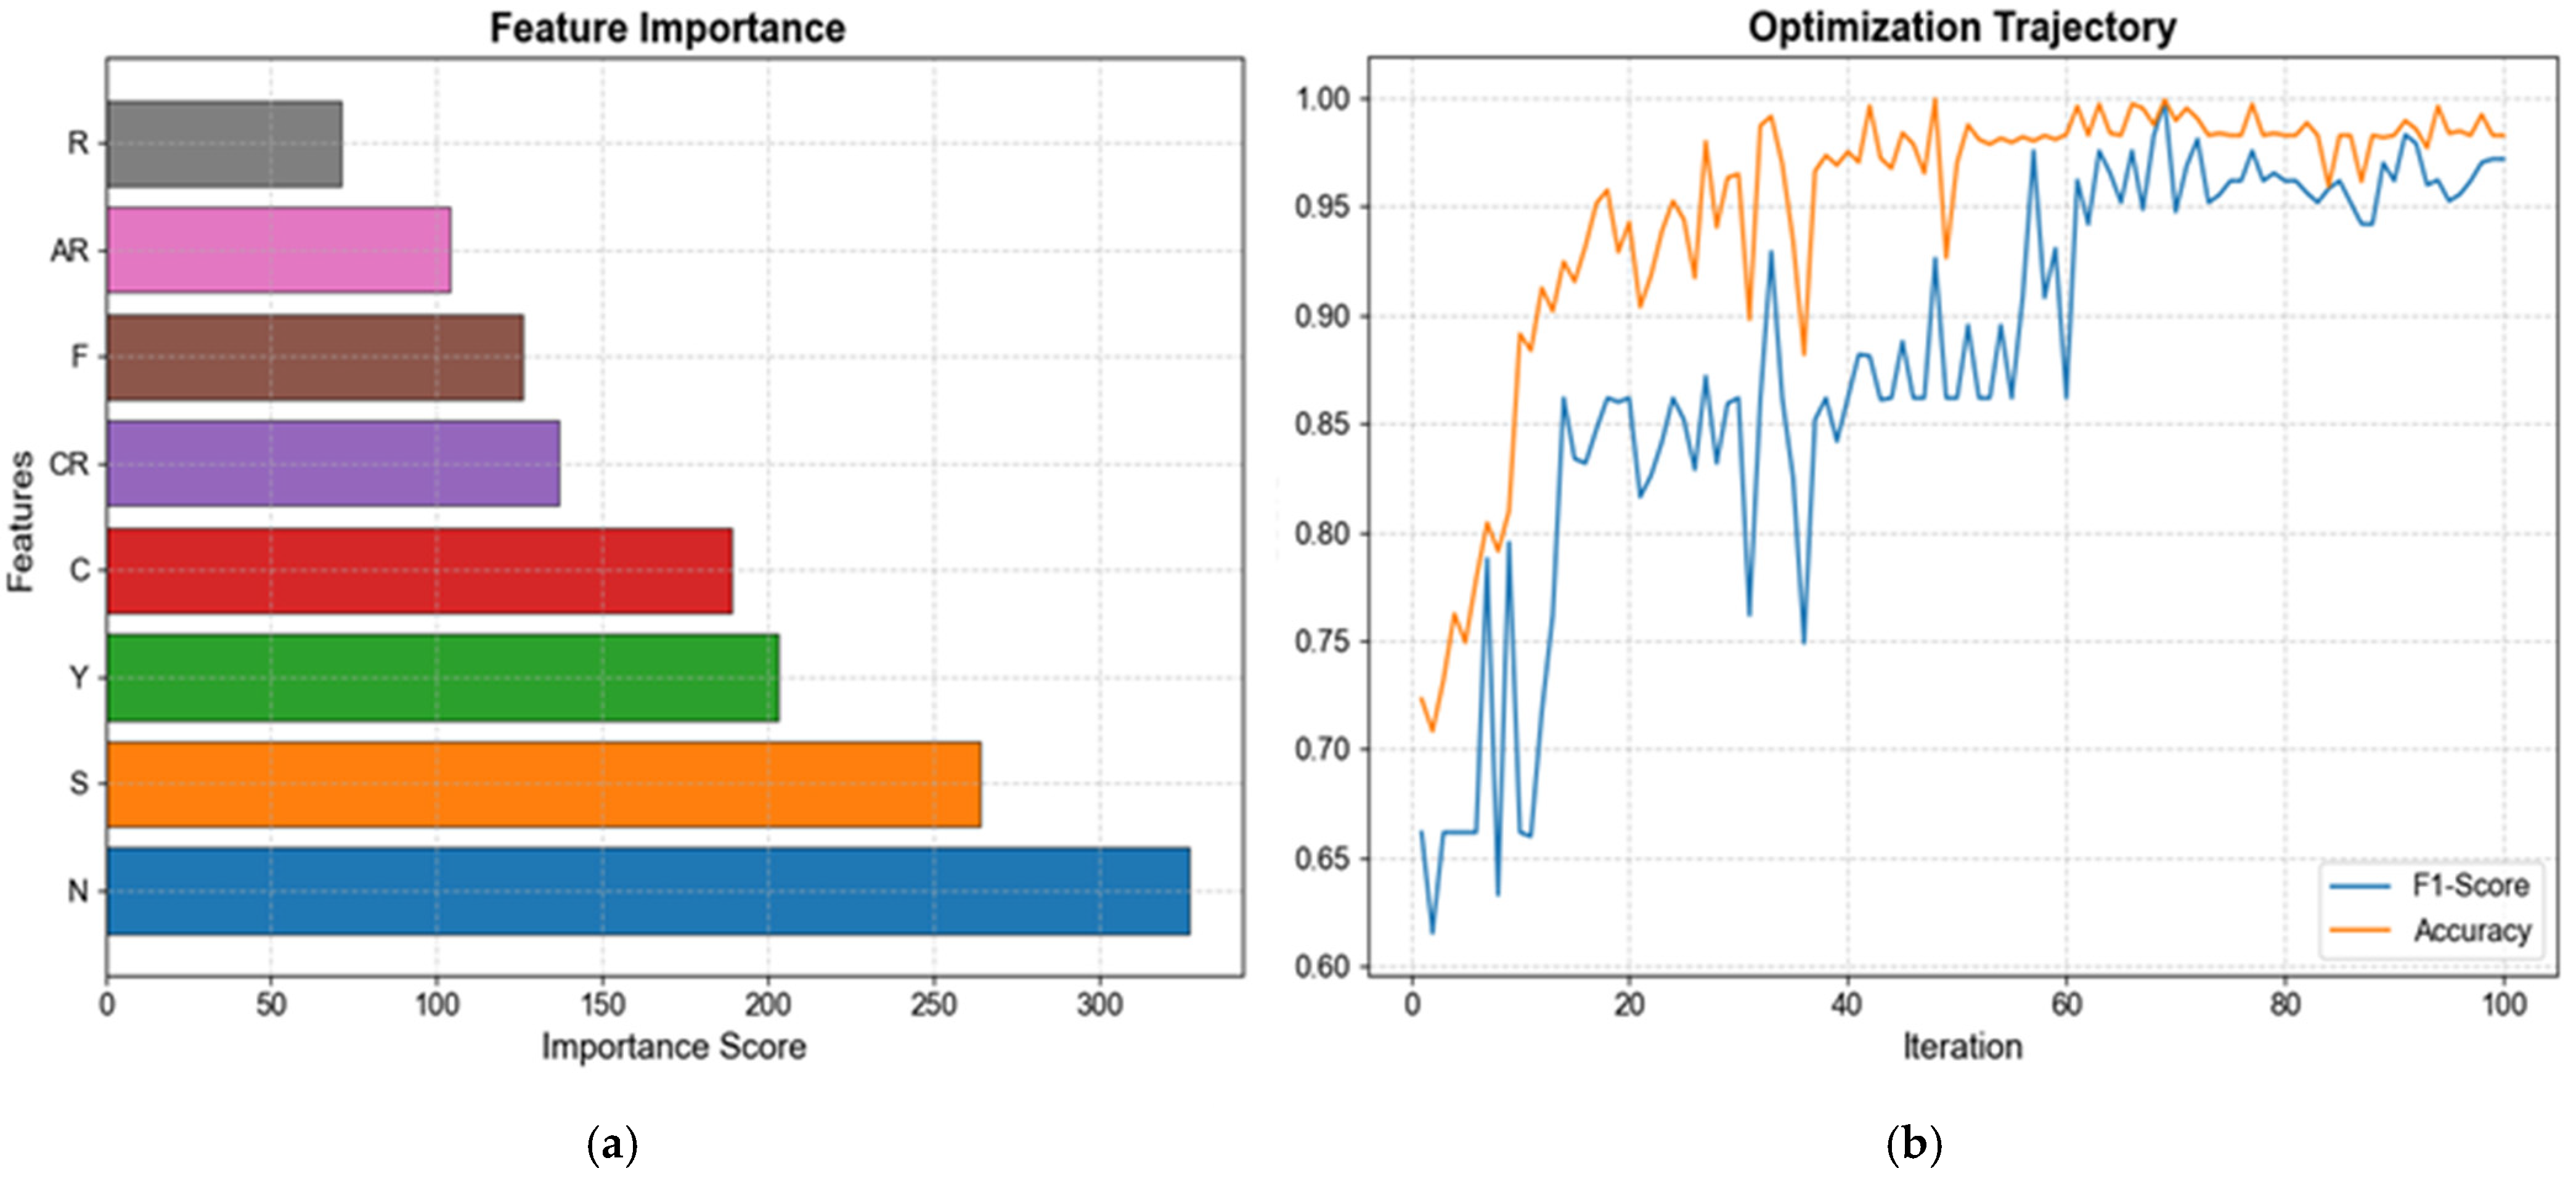
2.4.3. Selection of Morphological Characteristics of Droplets
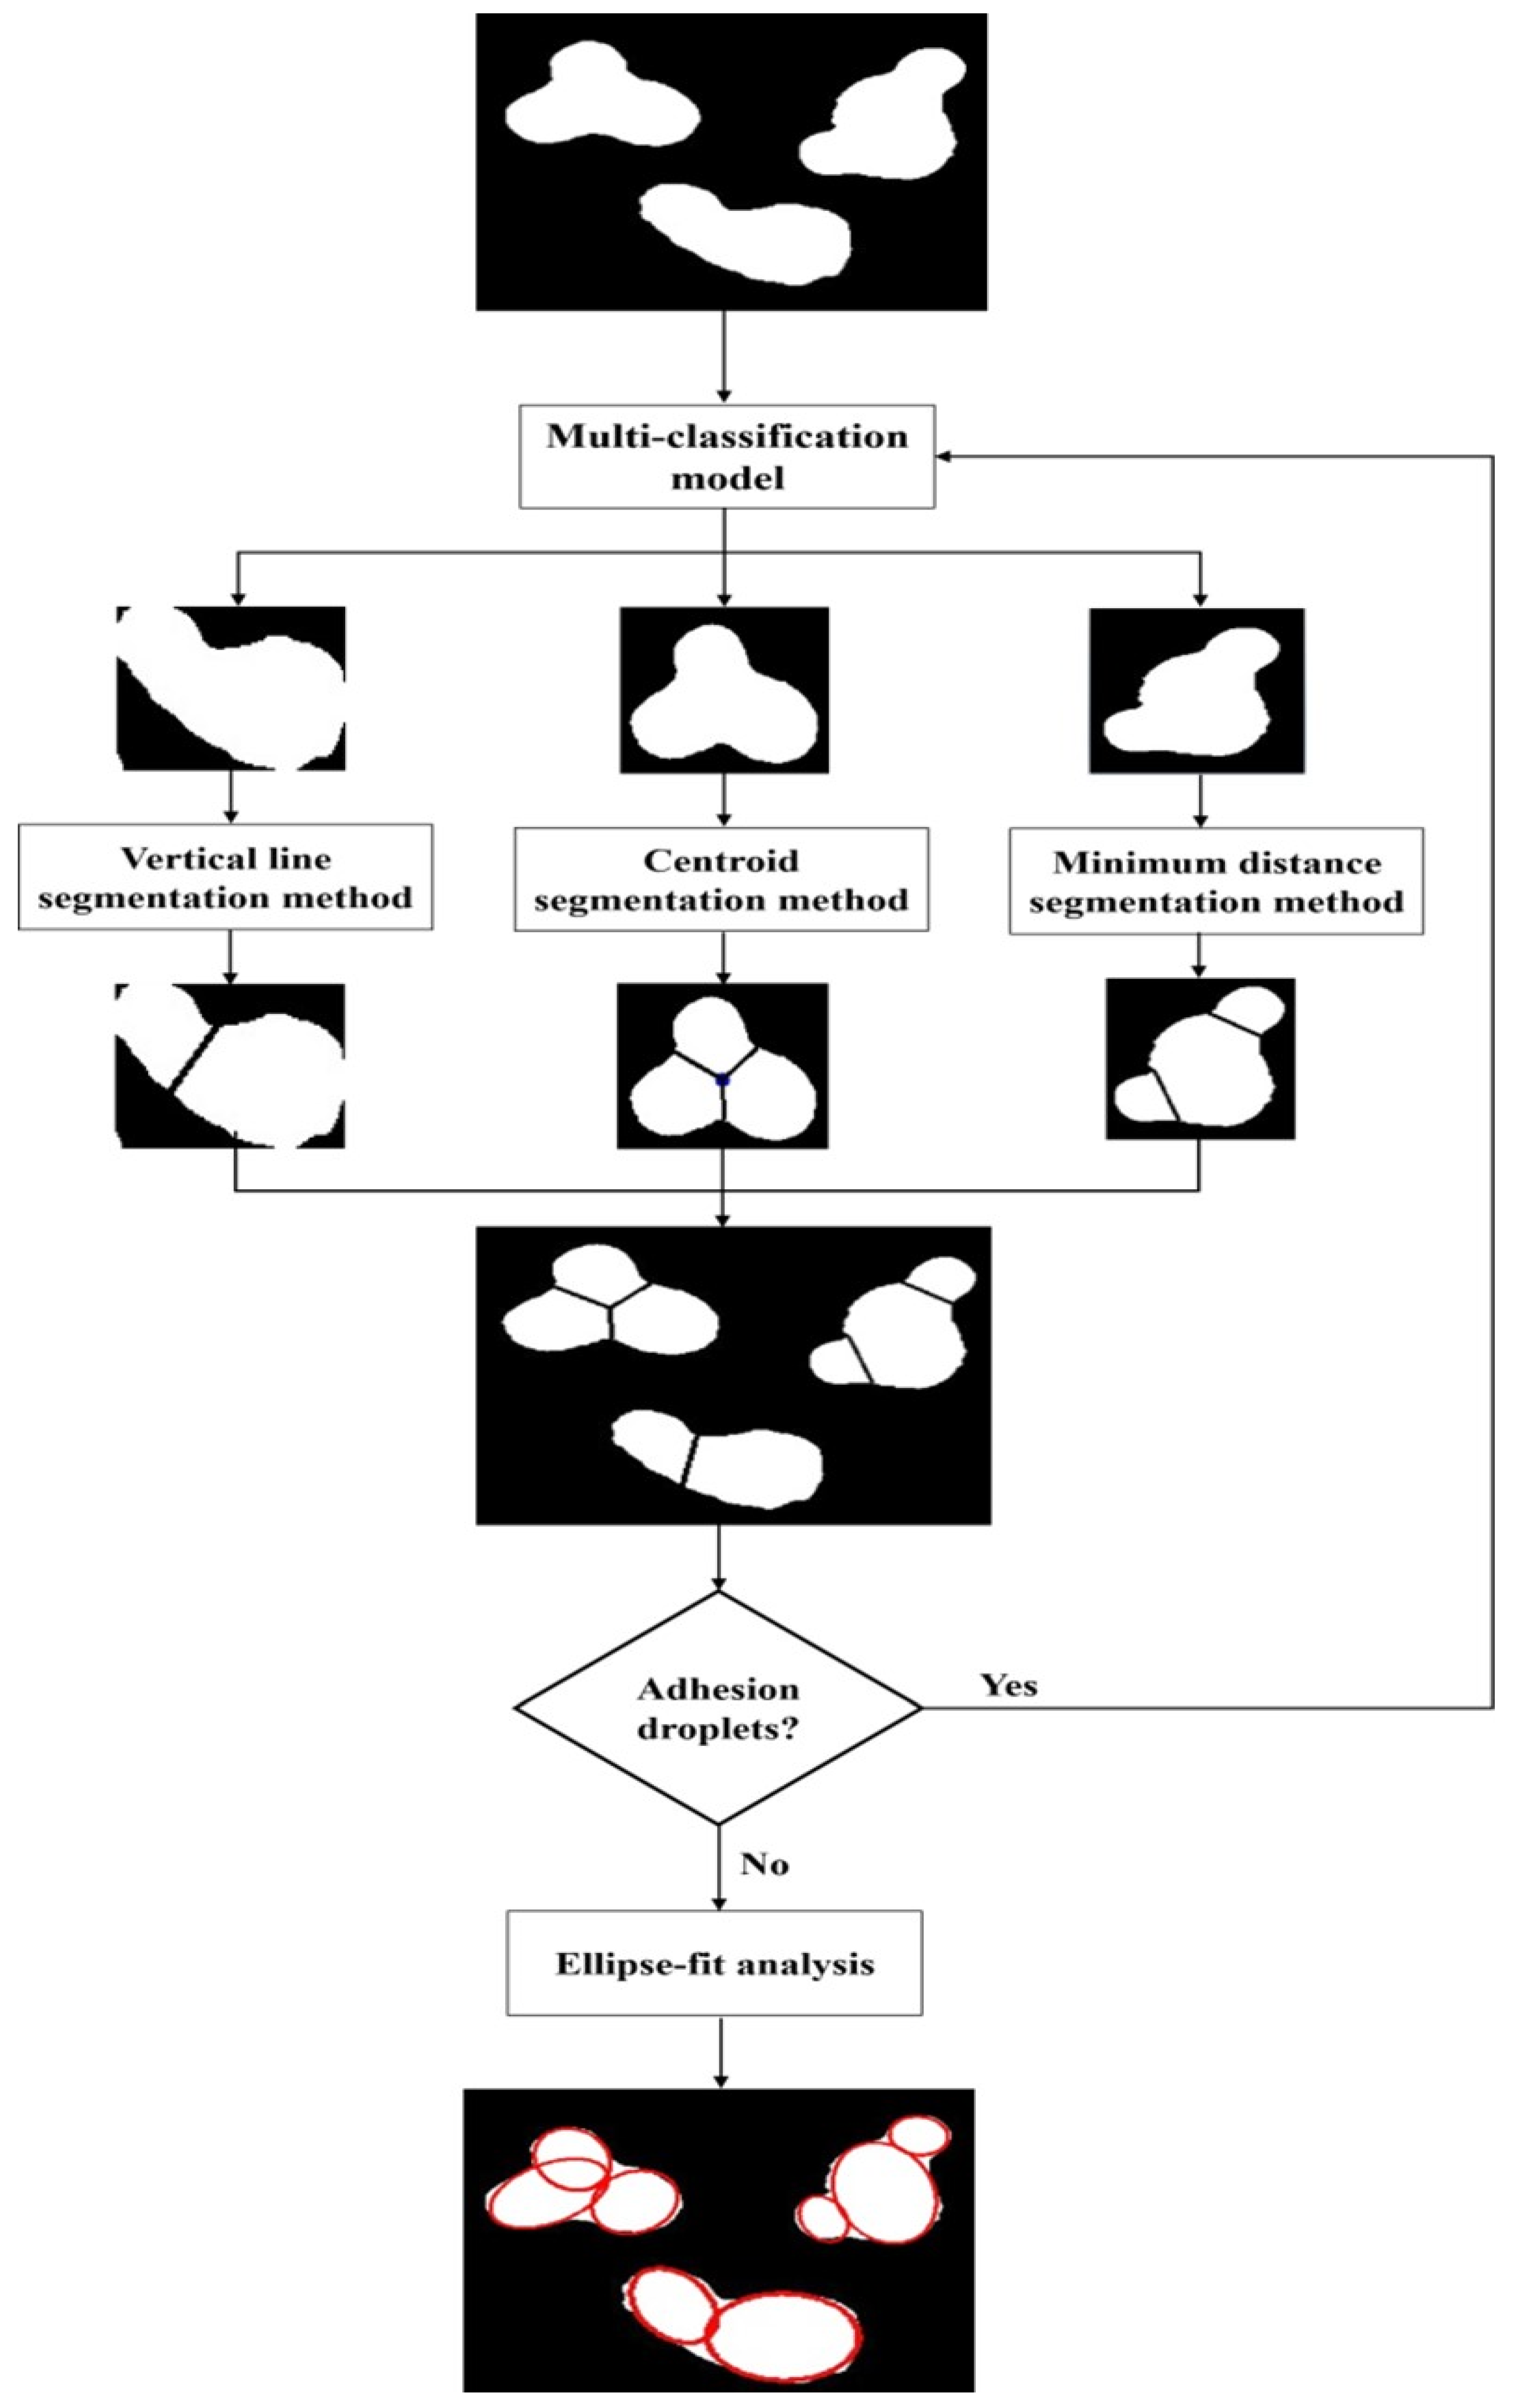
2.5. Segmentation of Overlapping-Droplet-Image-Processing Method
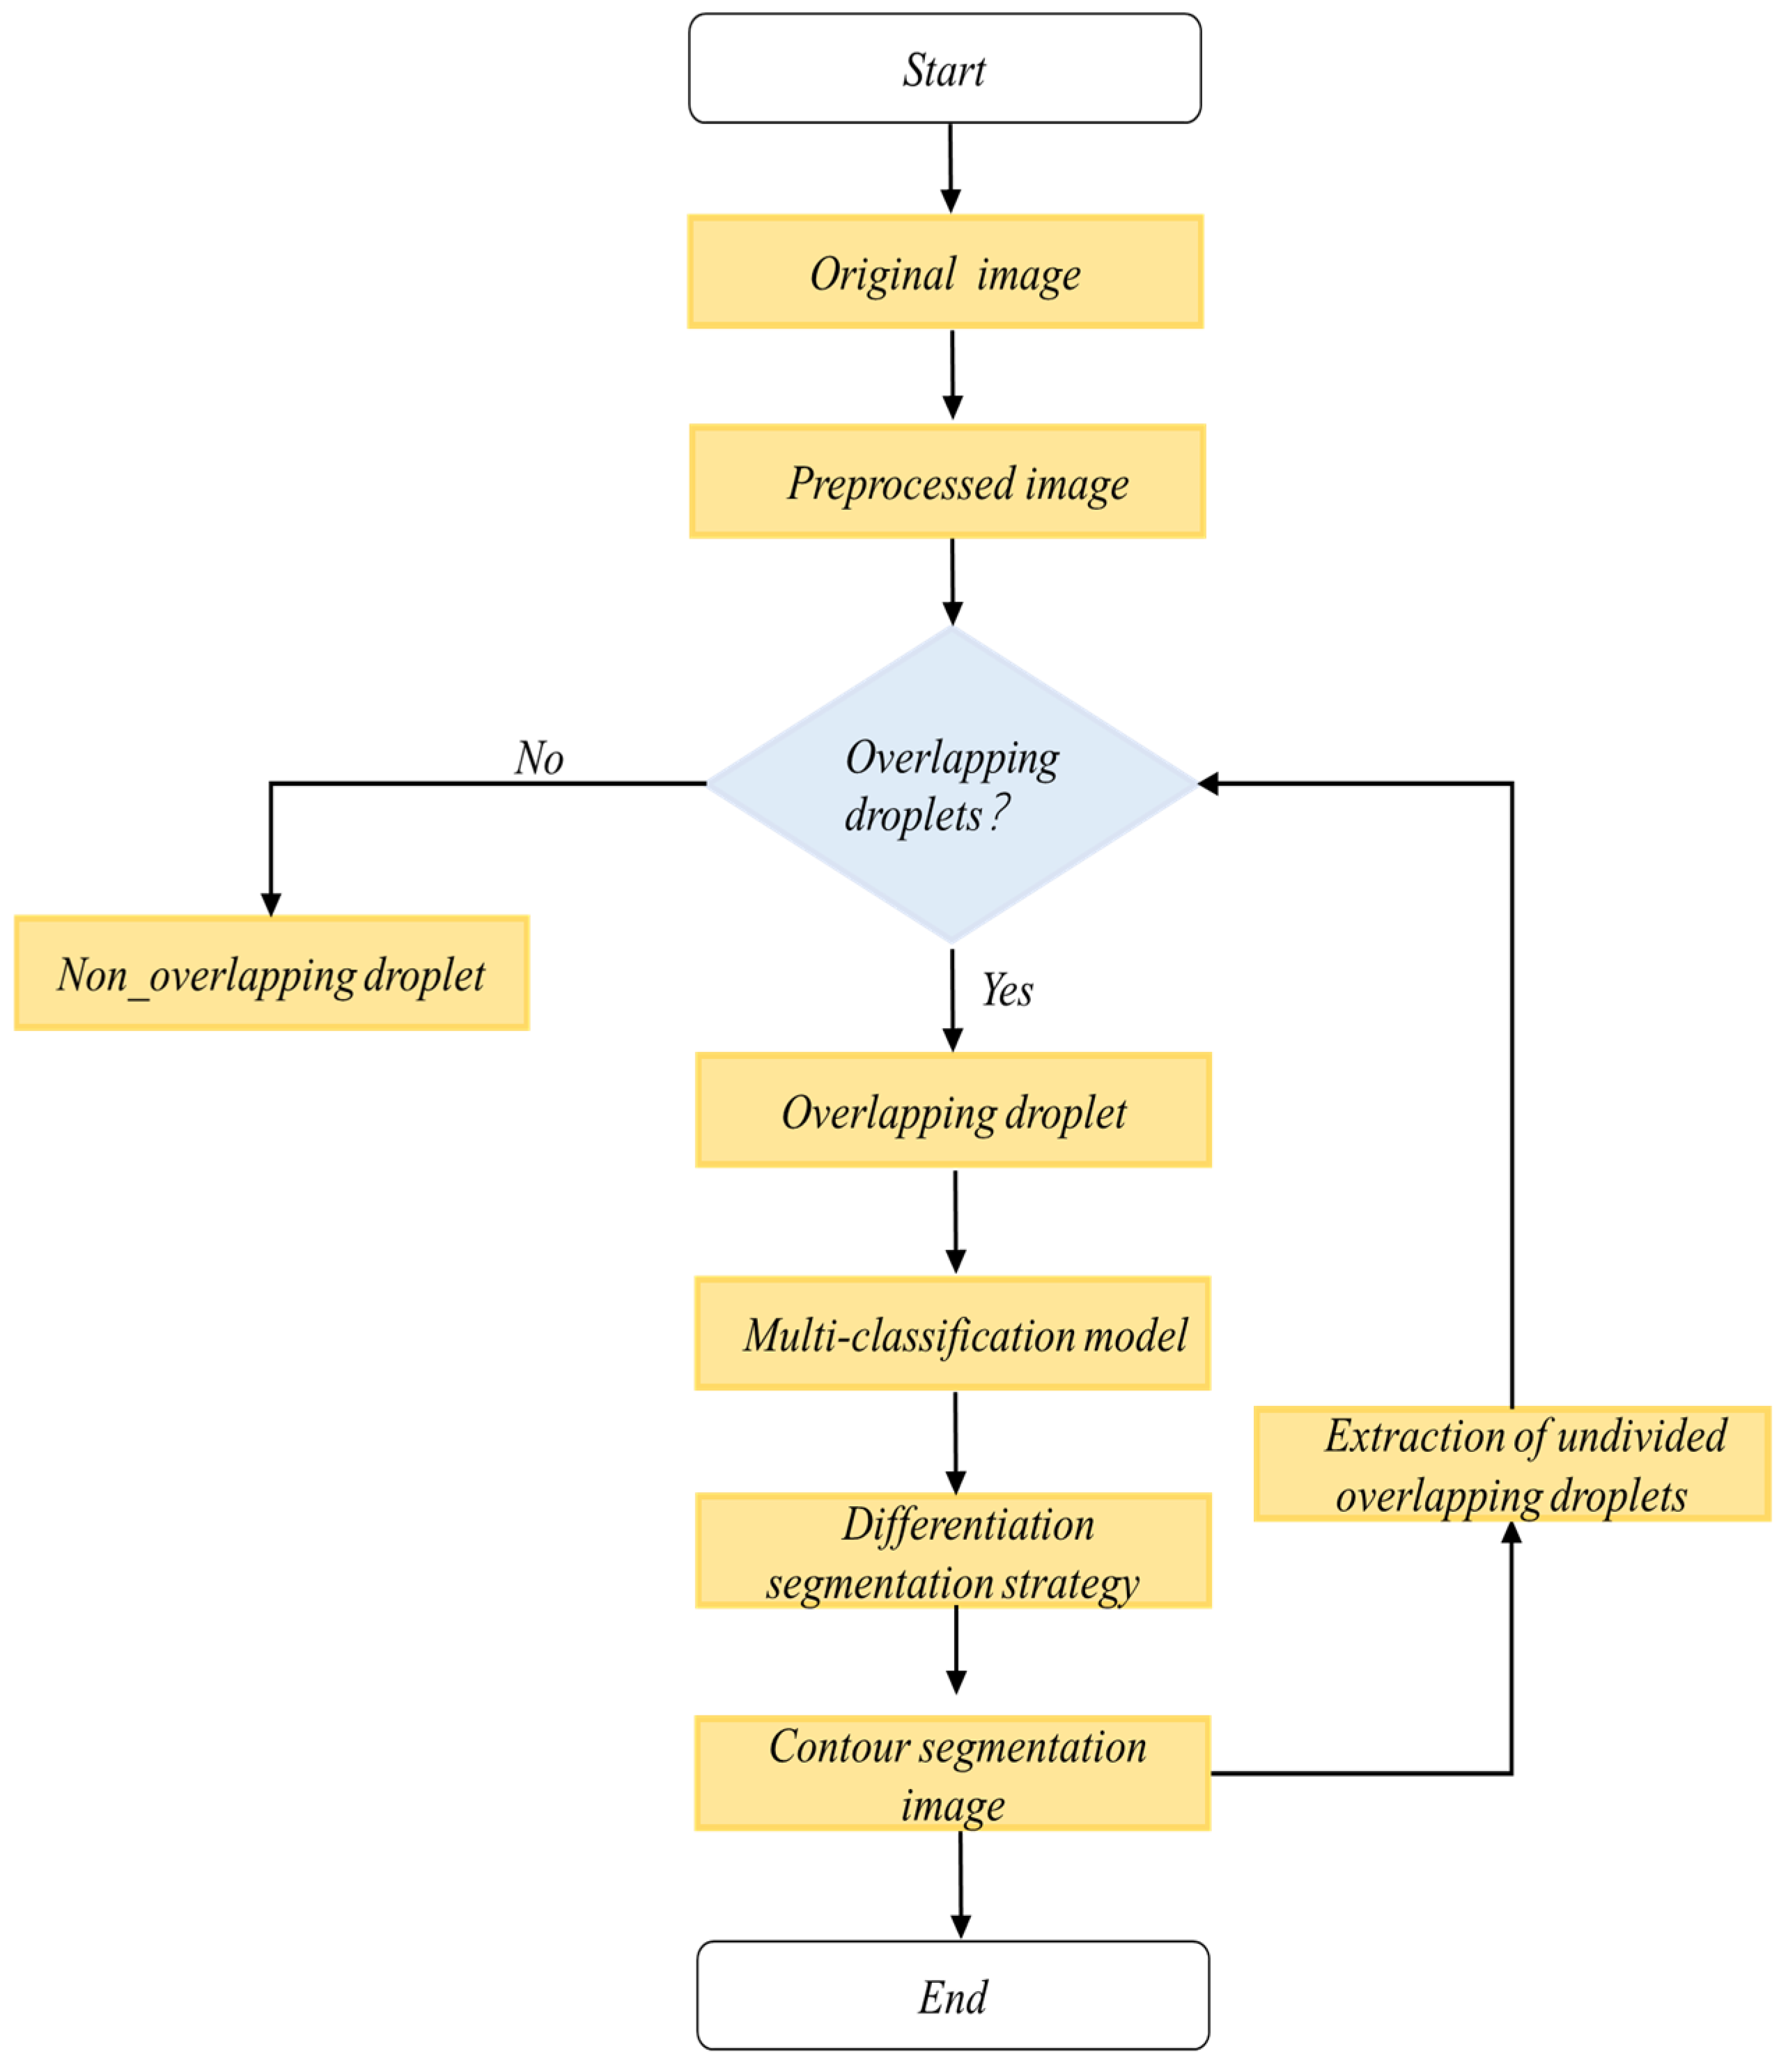
2.5.1. Process Overview
2.5.2. Overlapping-Droplet-Splitting Method
- (1)
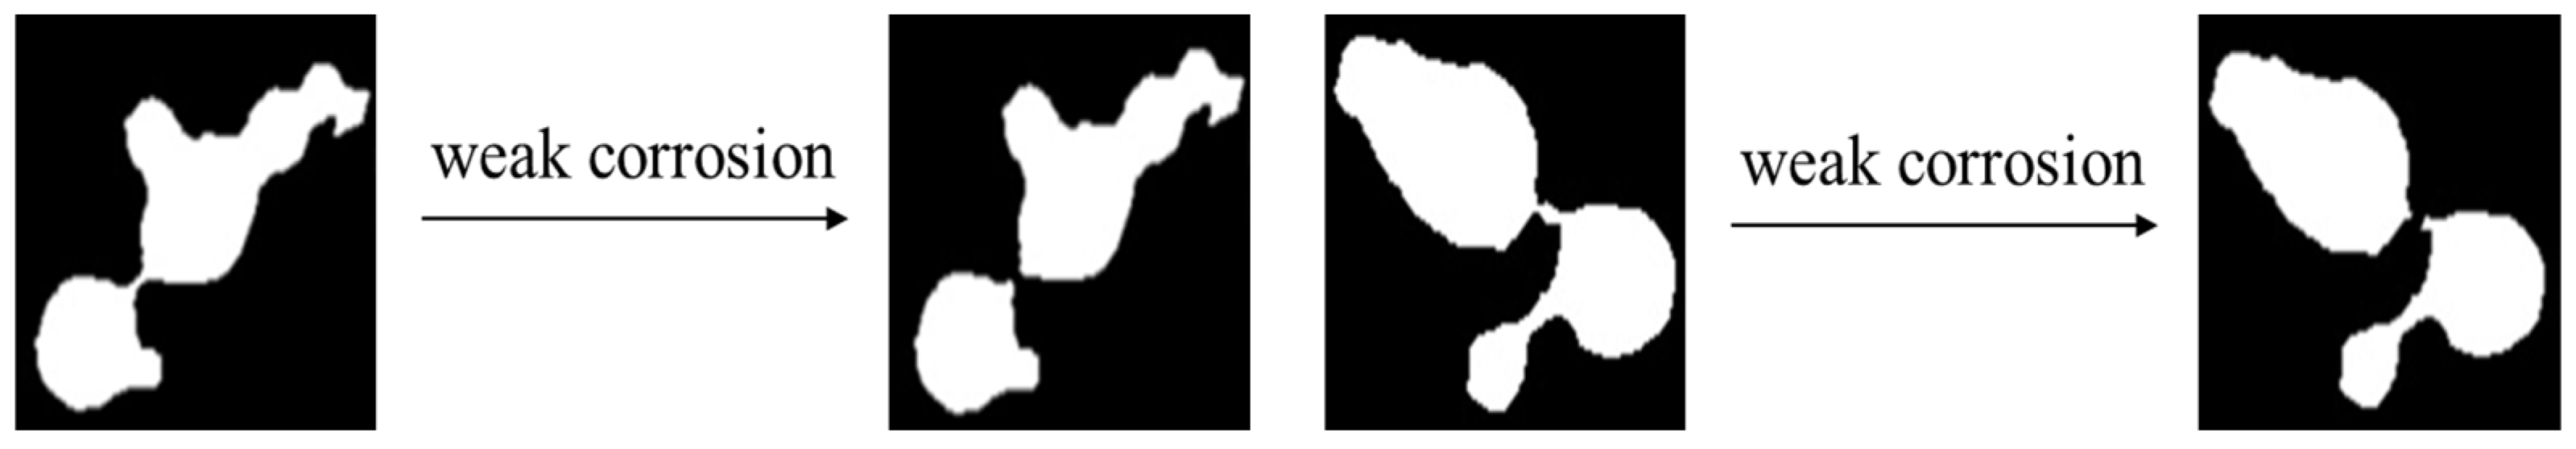
- Pre-segmentation
- (2)
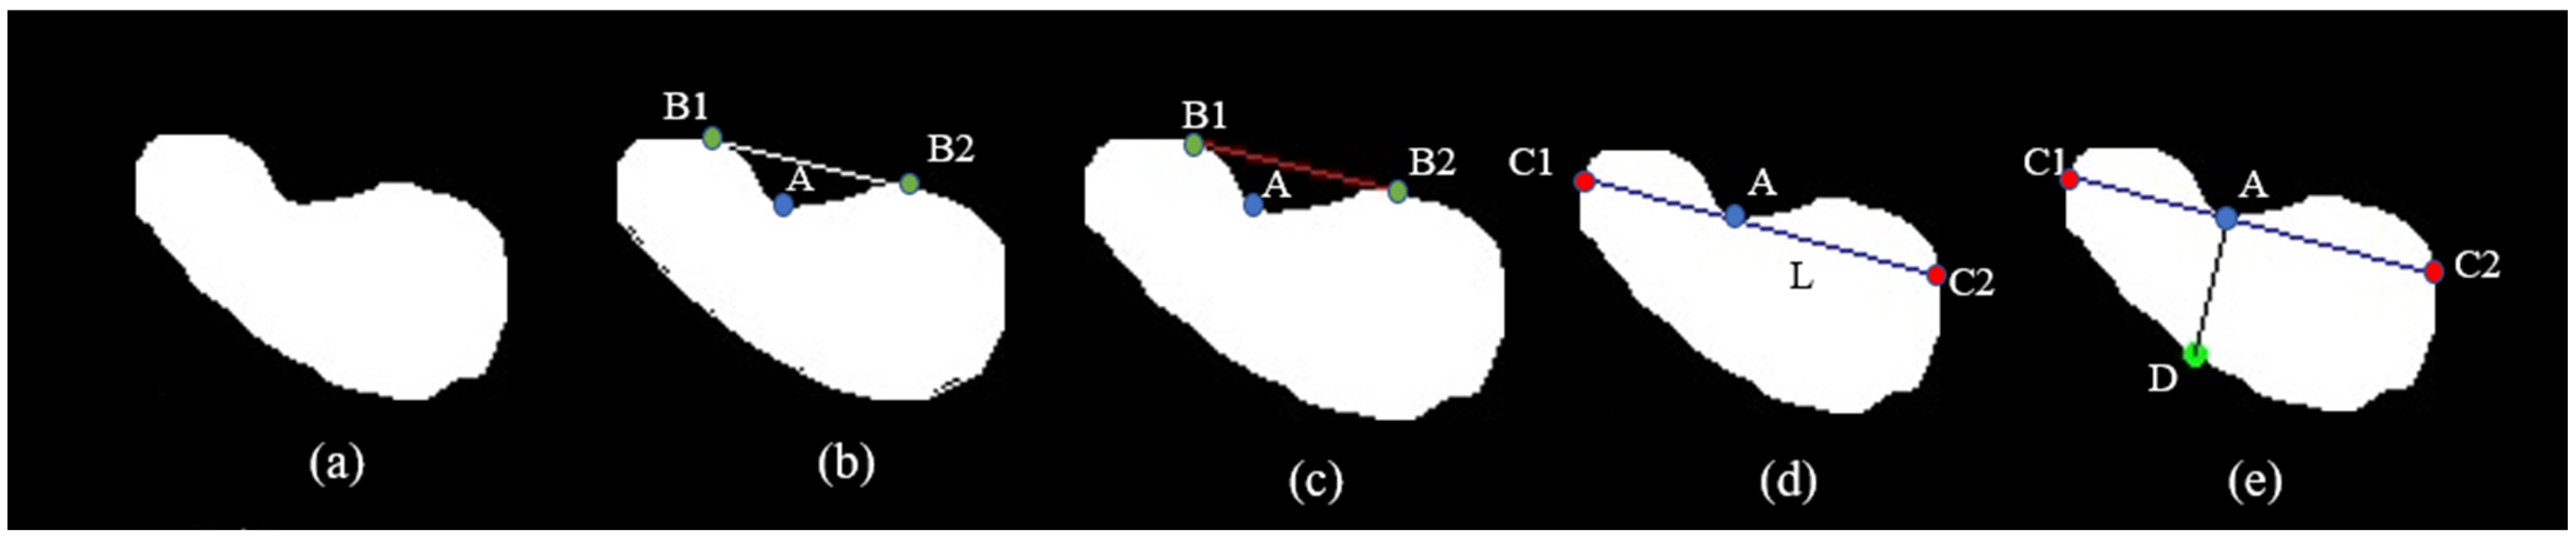
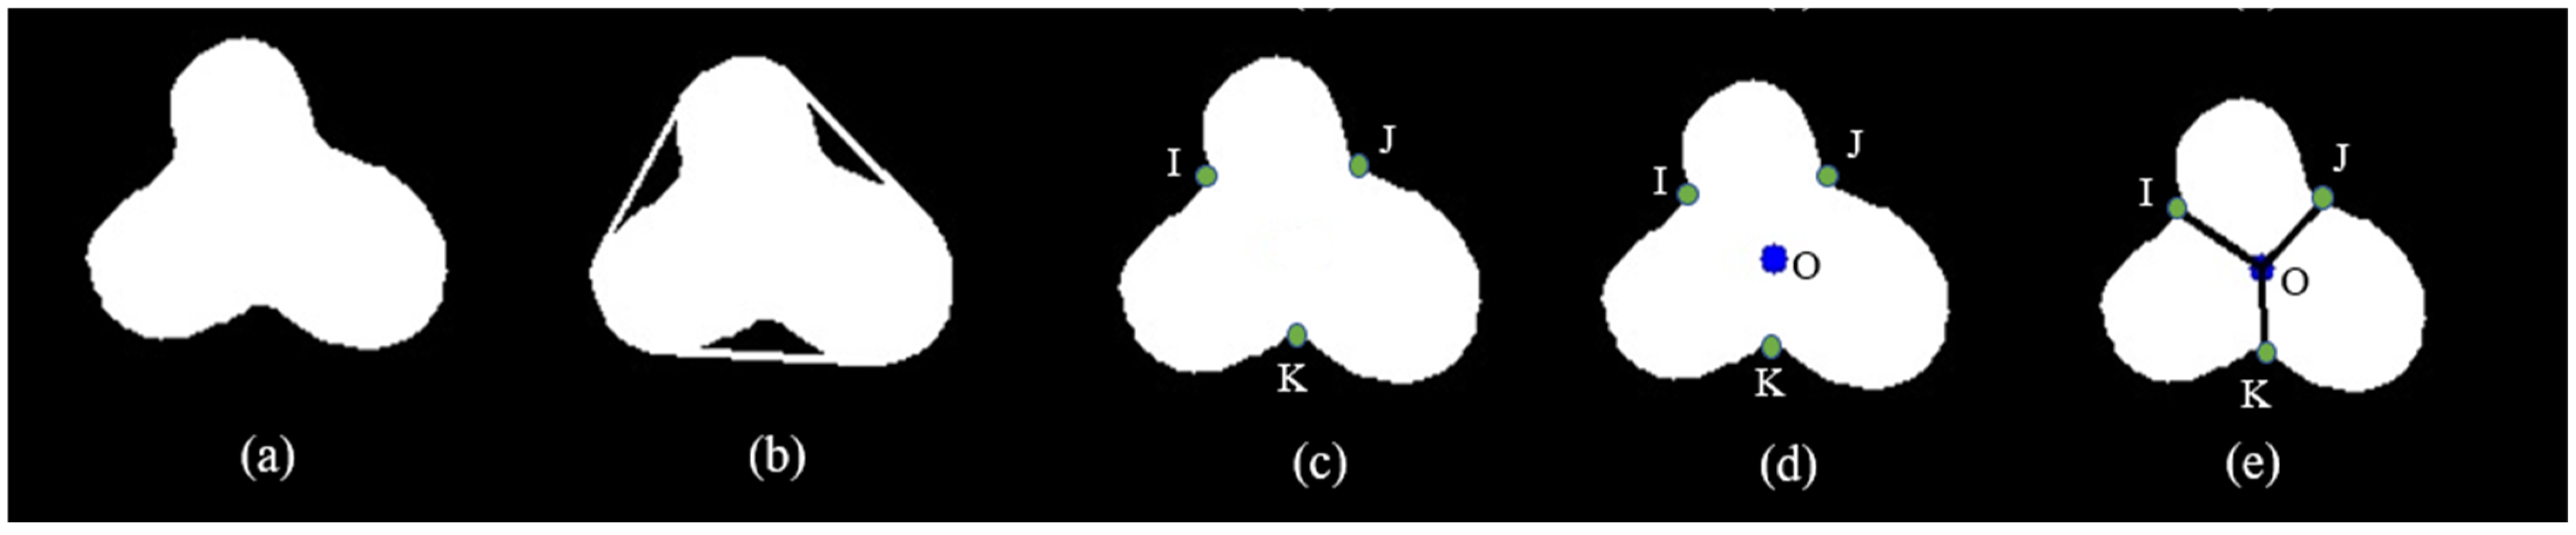
- Concave-point detection and segmentation
- (3)
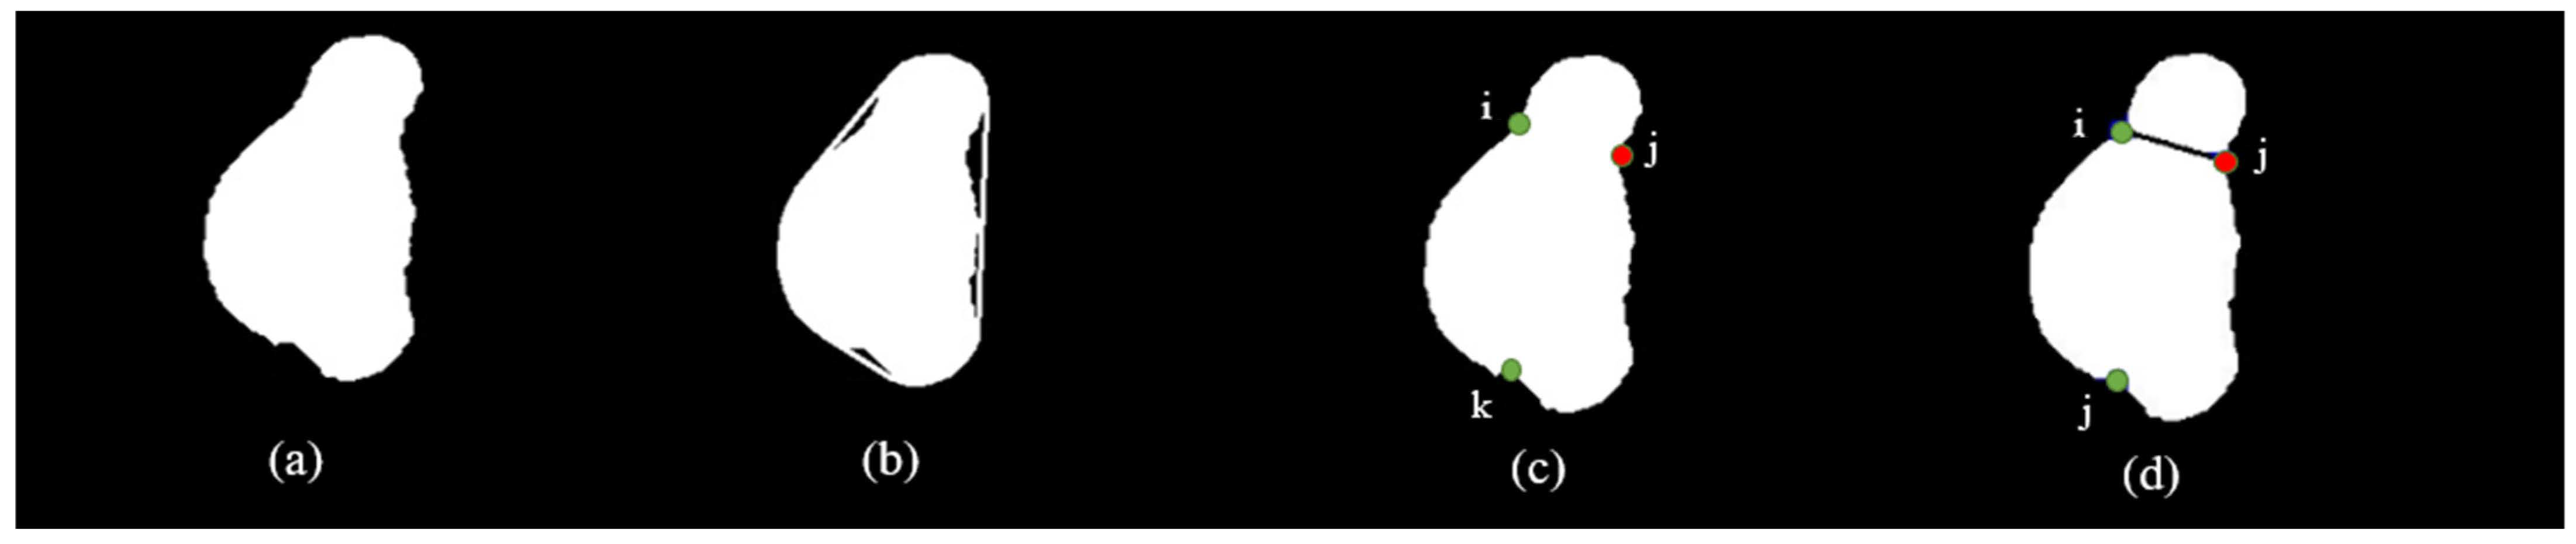
- Further separation of complex overlapping droplets.
- (4)
- Ellipse fitting.
3. Results and Analysis
3.1. Overlapping-Droplet-Classification-Test Validation and Analysis
3.1.1. Bayesian Optimisation-Based Hyperparameter Optimisation
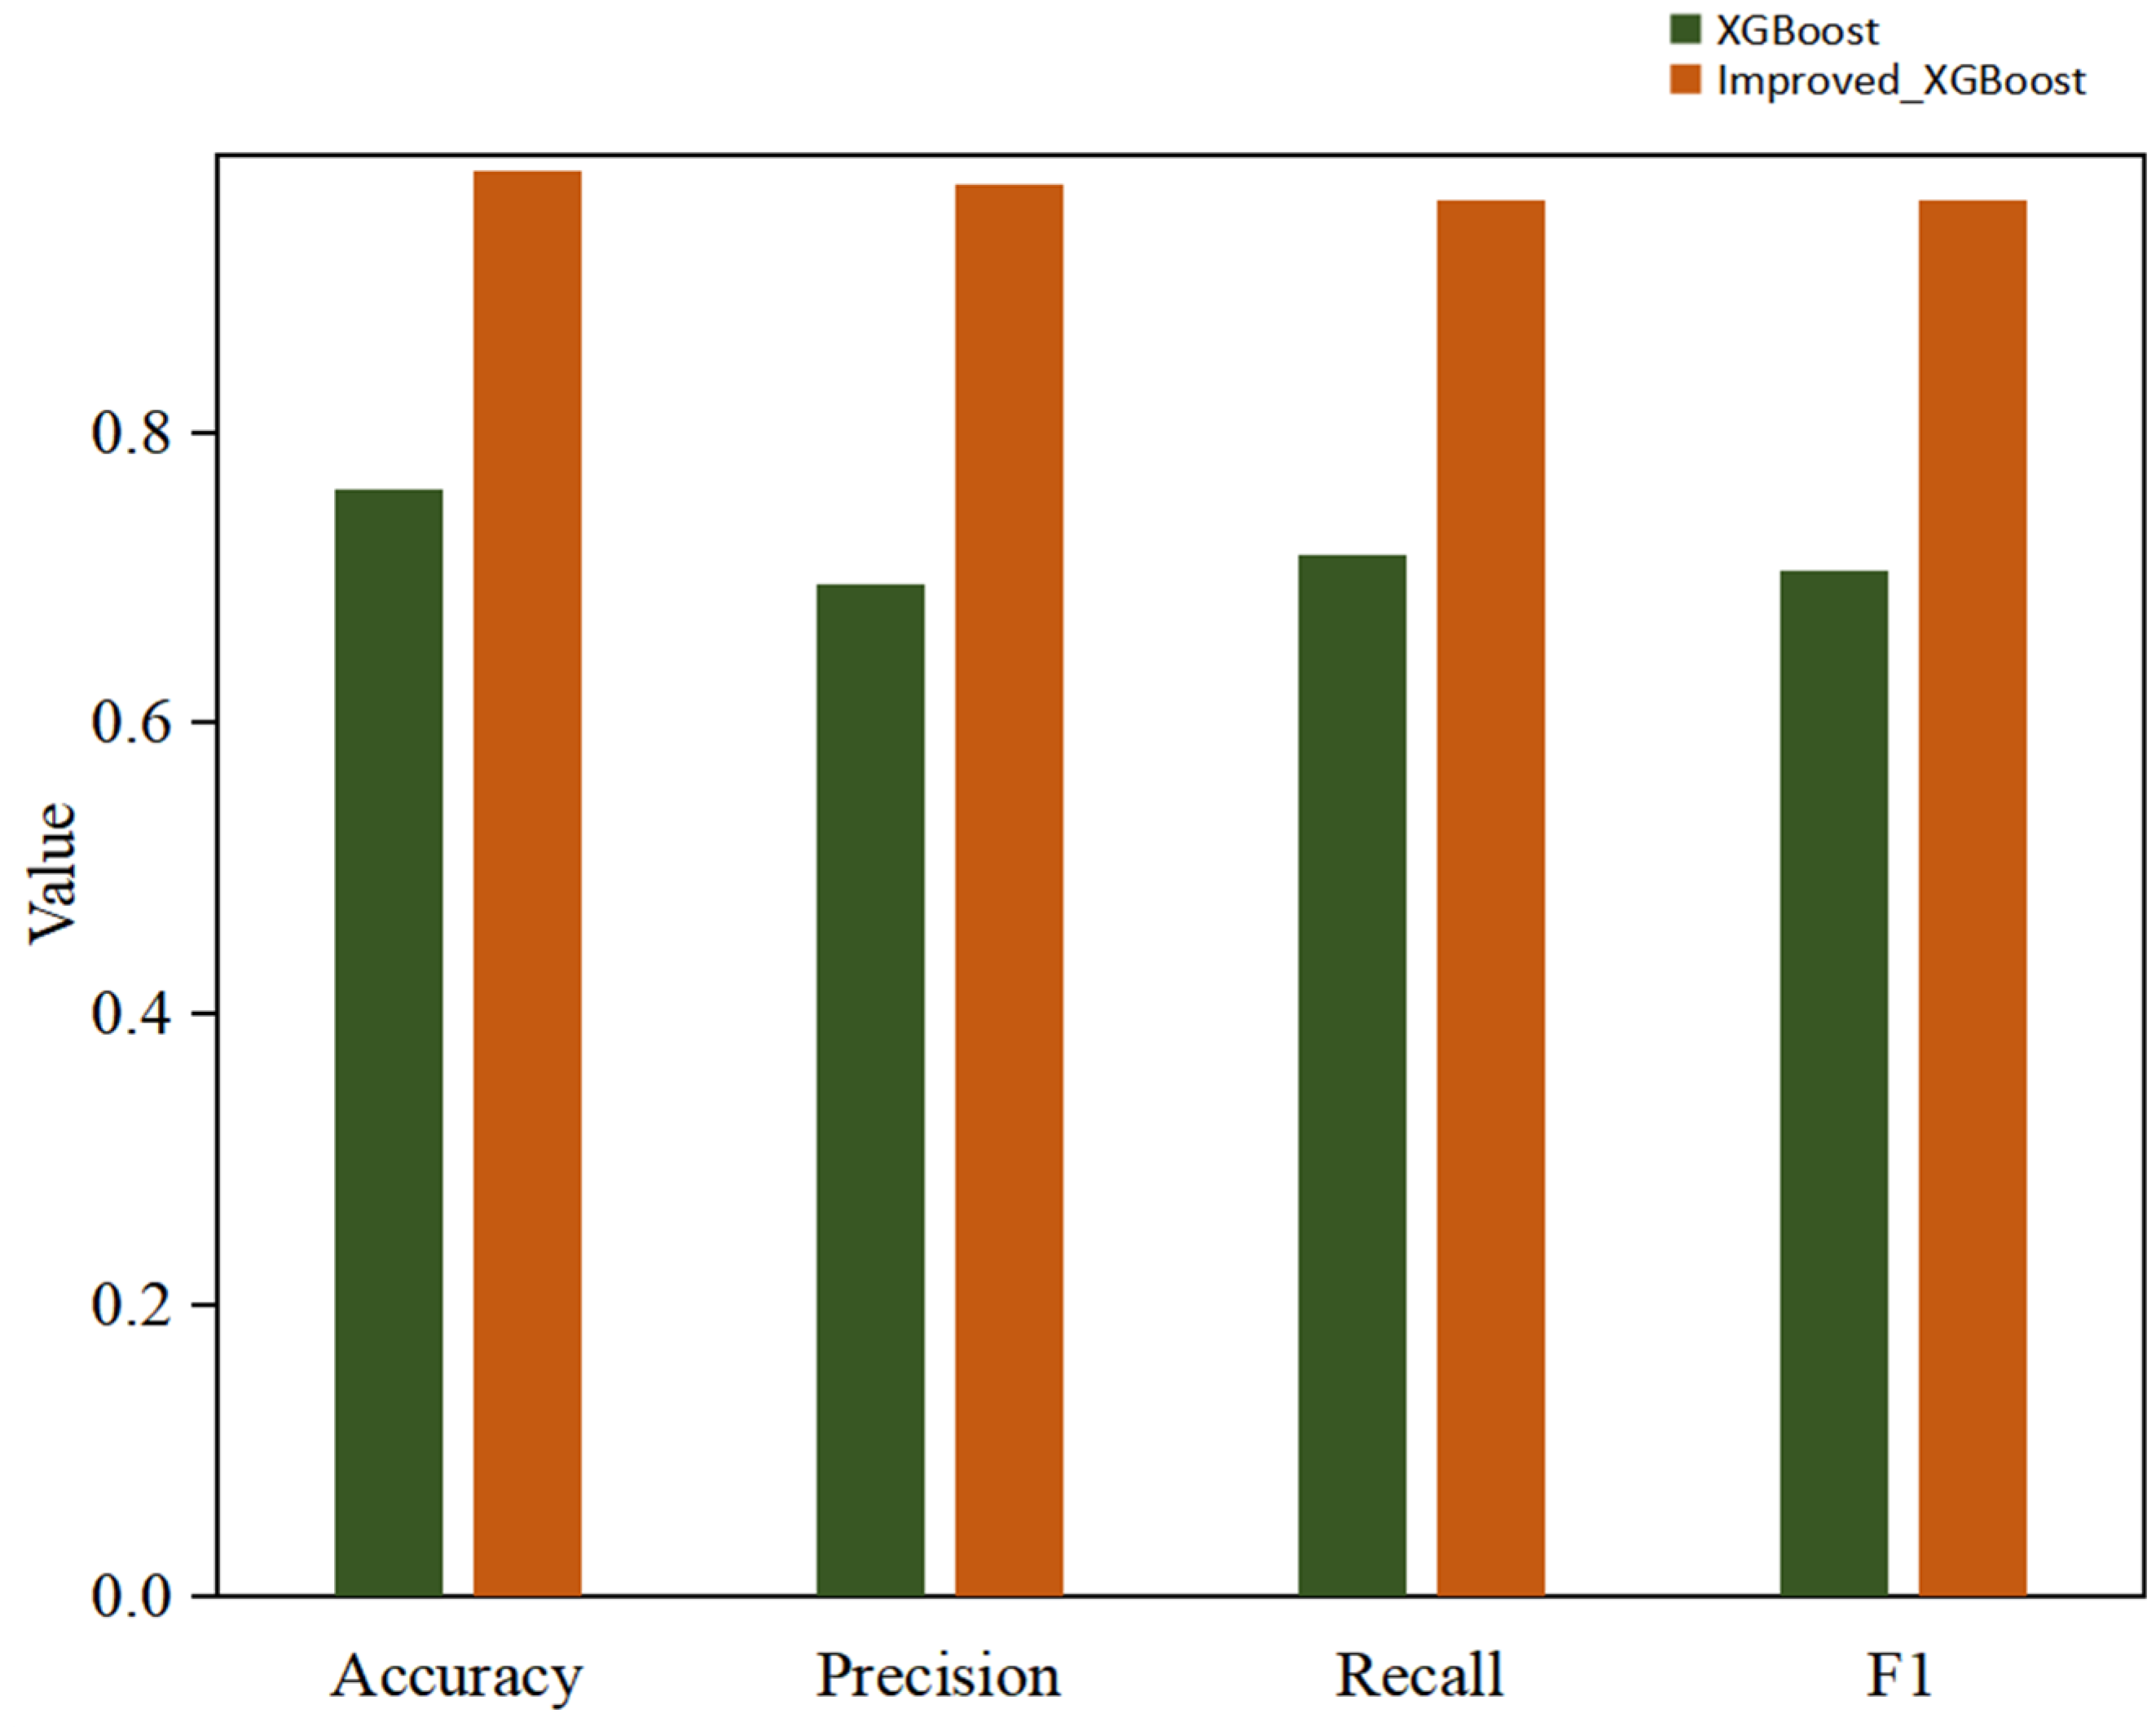
3.1.2. Comparative Study of Ablation Before and After Model Optimization
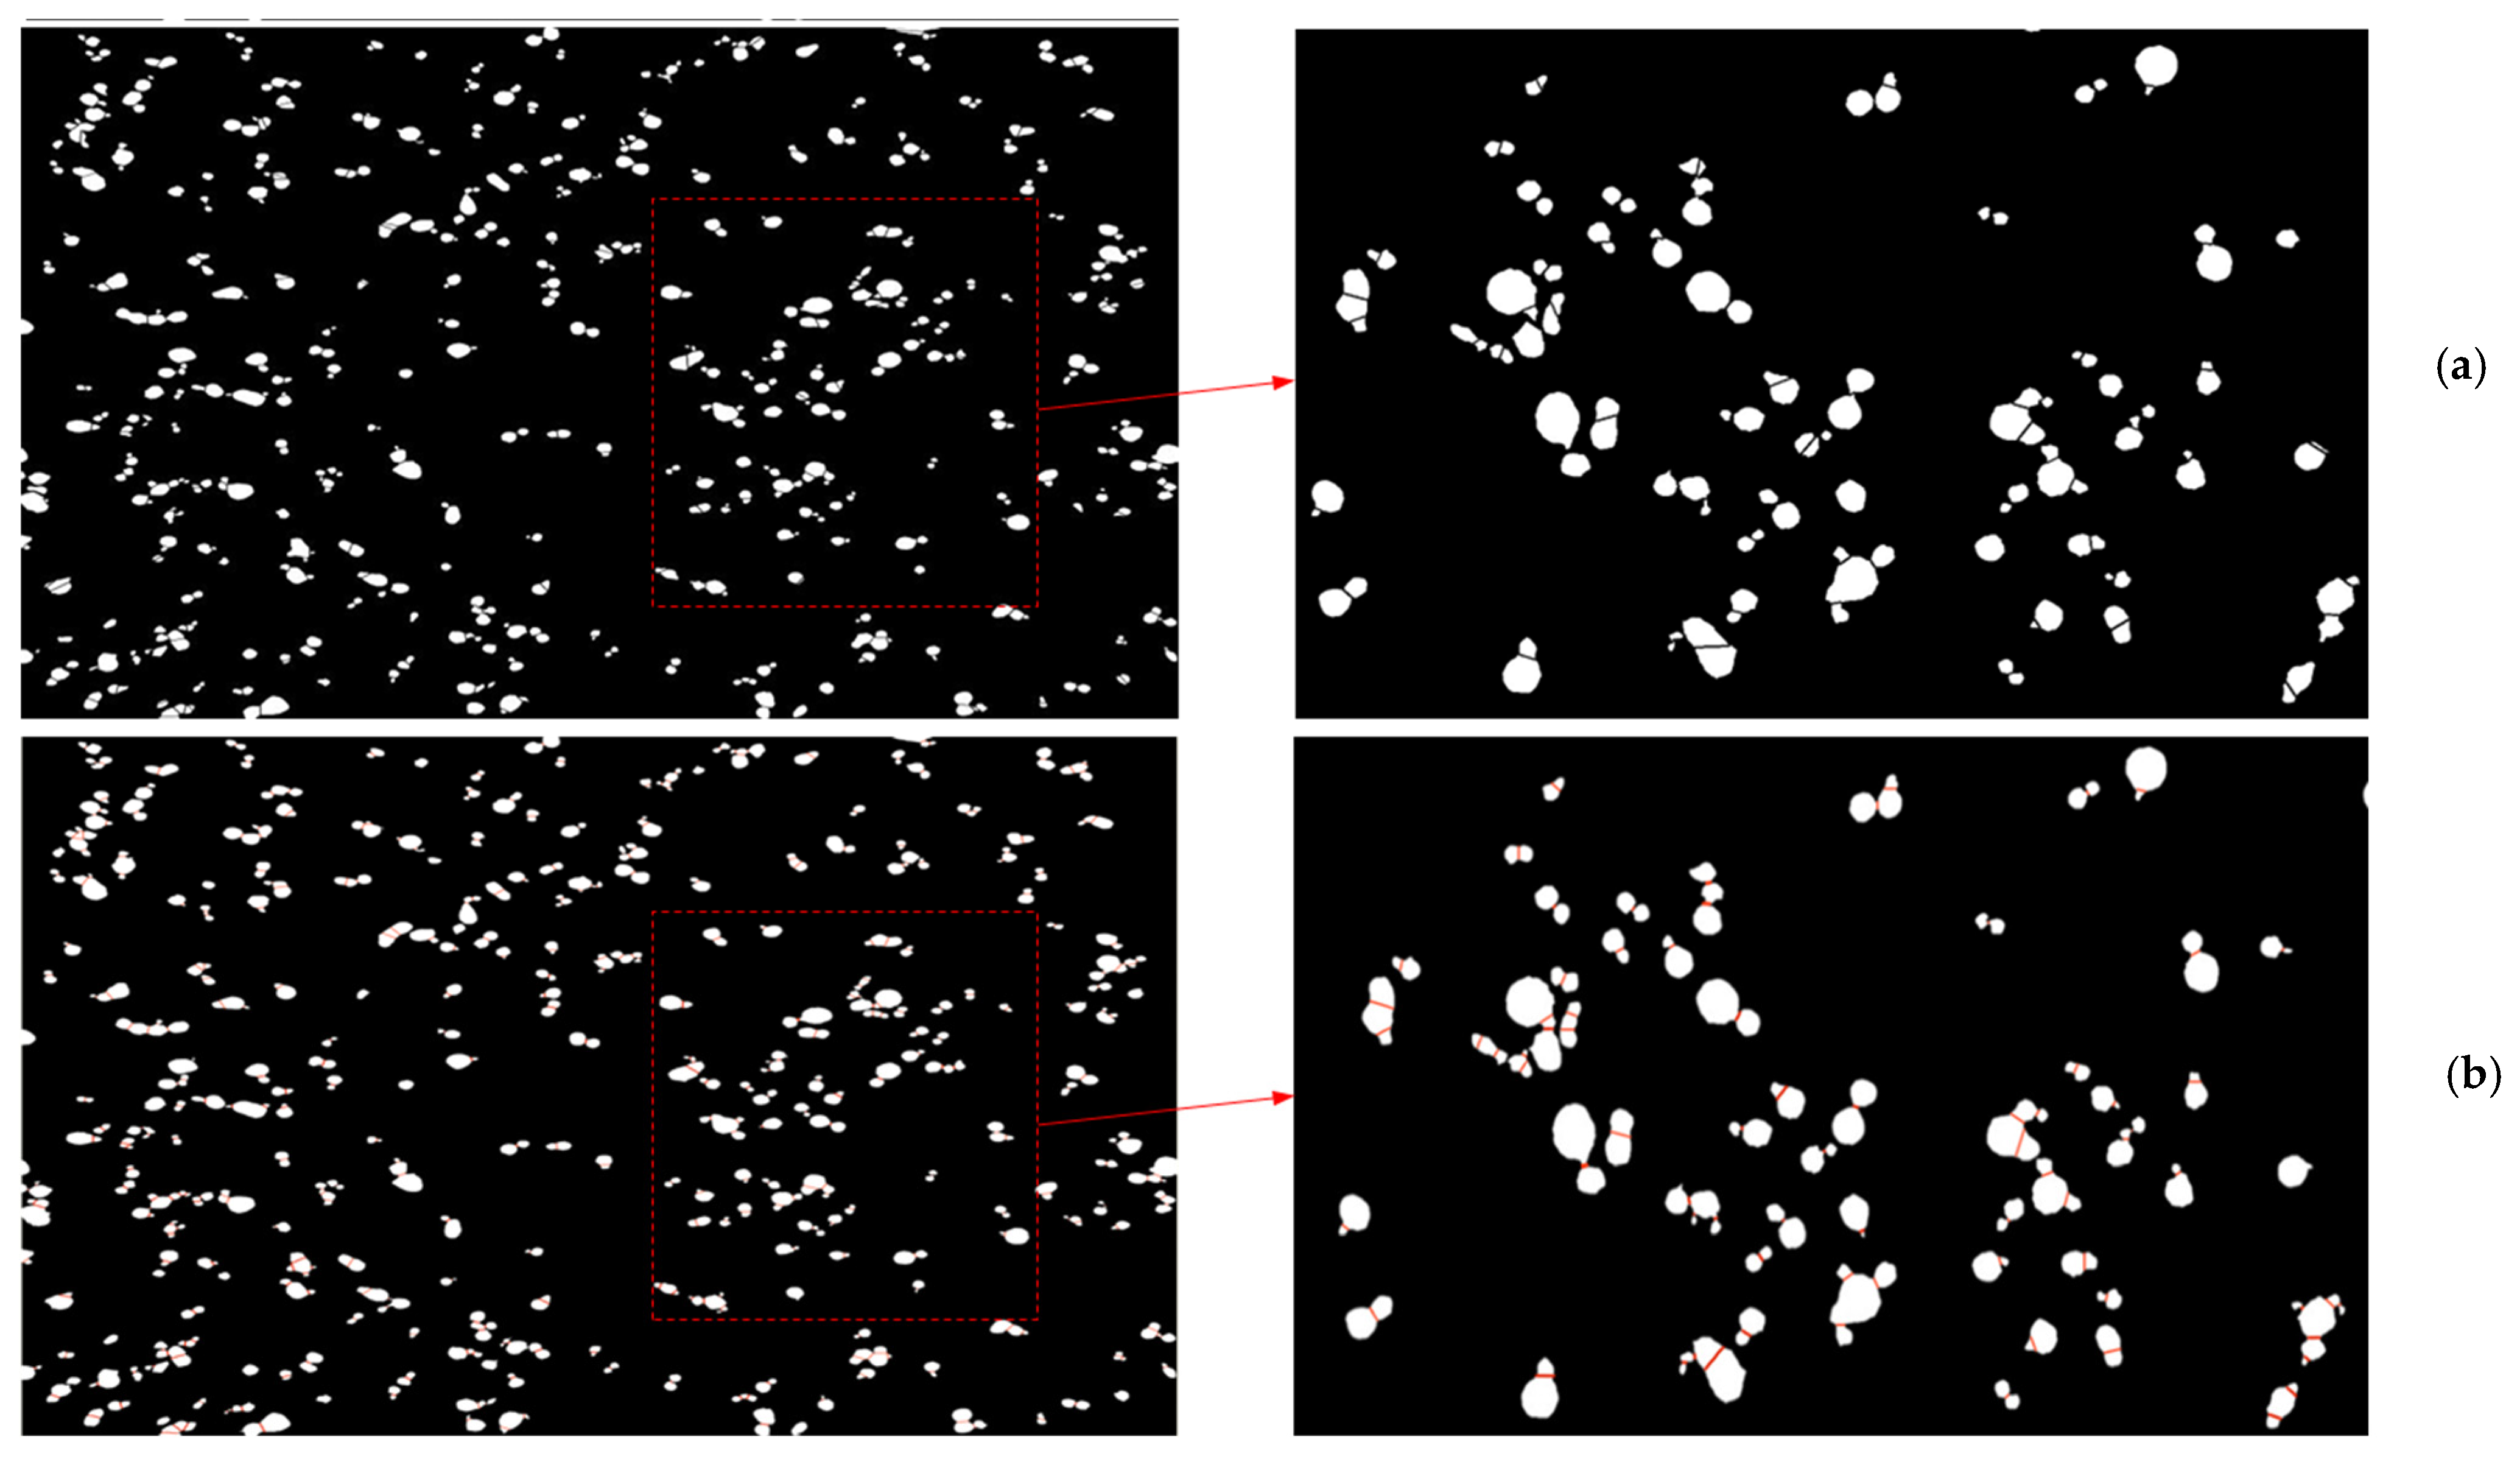
3.2. Overlapping-Droplet-Segmentation-Test Validation and Analysis
- (1)
- it ignores multiple forms of overlap and is only applicable to the case of mild overlapping;
- (2)
- it is easy to make a mistake in the selection of candidate concave points for multiple overlapping droplets, which leads to segmentation errors.
4. Discussion
5. Conclusions
Author Contributions
Funding
Institutional Review Board Statement
Informed Consent Statement
Data Availability Statement
Acknowledgments
Conflicts of Interest
References
- Romano, E.; Brambilla, M.; Chianucci, F.; Tattoni, C.; Puletti, N.; Chirici, G.; Travaglini, D.; Giannetti, F. Estimation of canopy and stand structure in hybrid poplar plantations from multispectral UAV images. Ann. For. Res. 2024, 67, 143–154. [Google Scholar] [CrossRef]
- Liao, J.; Zang, Y.; Zhou, Z.; Luo, X. Quality Evaluation Method and Optimization of Operating Parameters in Crop Aerial Spraying Technology. J. Agric. Eng. 2015, 31, 38–46. [Google Scholar] [CrossRef]
- Lan, Y.; Shan, C.; Wang, Q.; Liu, Q.; Yang, C.; Xie, Y.; Wang, G. Effects of Different Spray Additives on Droplet Deposition Characteristics during Plant Protection UAV Spraying Operations. J. Agric. Eng. 2021, 37, 31–38. [Google Scholar] [CrossRef]
- Cerruto, E.; Manetto, G.; Privitera, S.; Papa, R.; Longo, D. Effect of Image Segmentation Thresholding on Droplet Size Measurement. Agronomy 2022, 12, 1677. [Google Scholar] [CrossRef]
- Guo, N.; Liu, S.; Xu, H.; Tian, S.; Li, T. Improvement on Image Detection Algorithm of Droplets Deposition Characteristics. J. Agric. Eng. 2018, 34, 176–182. [Google Scholar] [CrossRef]
- Nahiyoon, S.; Ren, Z.; Wei, P.; Li, X.; Li, X.; Xu, J.; Yan, X.; Yuan, H. Recent Development Trends in Plant Protection UAVs: A Journey from Conventional Practices to Cutting-Edge Technologies—A Comprehensive Review. Drones 2024, 8, 457. [Google Scholar] [CrossRef]
- Tadić, V.; Radočaj, D.; Jurišić, M. Machine Learning Methods for Evaluation of Technical Factors of Spraying in Permanent Plantations. Agronomy 2024, 14, 1977. [Google Scholar] [CrossRef]
- Zheng, Q.; Wu, J. Humidity Resistance Test System for Spray Droplet Density and Size Based on NO2 Color Reaction. J. Agric. Eng. 2015, 31, 107–112. [Google Scholar] [CrossRef]
- Emanuele, C.; Giuseppe, M.; Domenico, L.; Sabina, F.; Rita, P. A model to Estimate the Spray Deposit by Simulated Water Sensitive Papers. Crop Prot. 2019, 124, 104861. [Google Scholar] [CrossRef]
- He, L.; Wang, S.; Guo, Y. DE-XRT Coal Preparation Image Overlapping and Overlapping Particle Segmentation Method. Physicochem. Probl. Miner. Process. 2022, 58, 155840. [Google Scholar] [CrossRef]
- Rahman, T.; Islam, M.S. Image Segmentation Based on Fuzzy C Means Clustering Algorithm and Morphological Reconstruction. In Proceedings of the International Conference on Information and Communication Technology for Sustainable Development (ICICT4SD), Dhaka, Bangladesh, 27–28 February 2021; pp. 259–263. [Google Scholar]
- Zhang, F.; Wu, Y.; Xu, M.; Liu, S.; Peng, C.; Gao, Z. A Morphological Image Segmentation Algorithm forCircular Overlapping Cells. Intell. Autom. Soft Comput. 2022, 32, 301–321. [Google Scholar] [CrossRef]
- Miao, H.; Xiao, C. Simultaneous Segmentation of Leukocyte and Erythrocyte in Microscopic Images Using a Marker-Controlled Watershed Algorithm. Comput. Math. Methods Med. 2018, 2018, 7235795. [Google Scholar] [CrossRef] [PubMed]
- Ge, X.; Lu, J.; Cao, D.; Jin, T. Image segmentation of adhesive droplets based on contour solidness and watershed algorithm on leaves. J. Chin. Agric. Mech. 2023, 44, 182–191. [Google Scholar] [CrossRef]
- Gao, S.; Wang, G.; Zhou, Y.; Wang, M.; Yang, D.; Yuan, H.; Yan, X. Water-Soluble Food Dye of Allura Red as a Tracer to Determine the Spray Deposition of Pesticide on Target Crops. Pest Manag. Sci. 2019, 75, 2592–2597. [Google Scholar] [CrossRef]
- Wang, X.; Yao, L.; Wen, H.; Zhao, J. Wolfberry Image Segmentation Based on Morphological Multi-scale Reconstruction and Concave Points Matching. J. Agric. Eng. 2018, 34, 212–218. [Google Scholar] [CrossRef]
- Liu, X.; Jin, S.; Yang, Z.; Krolczyk, G.; Li, Z. Measuring Shape Parameters of Pearls in Batches Using Machine Vision: A Case Study. Micromachines 2022, 13, 546. [Google Scholar] [CrossRef]
- Memos, V.; Psannis, K. UAV-Based Smart Surveillance System over a Wireless Sensor Network. IEEE Commun. Stand. Mag. 2022, 5, 68–73. [Google Scholar] [CrossRef]
- Liu, Q.; Qi, Q.; Li, N. Federated Opposite Learning Based Arithmetic Optimization Algorithm for Image Segmentation Using Multilevel Thresholding. In Proceedings of the 2023 26th International Conference on Computer Supported Cooperative Work in Design (CSCWD), Rio de Janeiro, Brazil, 24–26 May 2023; pp. 1257–1262. [Google Scholar]
- Ogunleye, A.; Wang, Q. XGBoost Model for Chronic Kidney Disease Diagnosis. IEEE/ACM Trans. Oncomputational Biol. Bioinform. 2020, 17, 2131–2140. [Google Scholar] [CrossRef]
- Maideen, A.K.; Basha, S.M.N.; Basha, V.A. Effective Utilisation of AI to Improve Global Warming Mitigation Strategies through Predictive Climate Modelling. Int. J. Data Inform. Intell. Comput. 2024, 3, 43–52. [Google Scholar] [CrossRef]
- Liu, T.; Chen, W.; Wang, Y.; Wu, W.; Sun, C.; Ding, J.; Guo, W. Rice and Wheat Grain Counting Method and Software Development Based on Android System. Comput. Electron. Agric. 2017, 141, 302–309. [Google Scholar] [CrossRef]
- Lu, M.; Xiong, Y.; Li, K.; Liu, L.; Yan, L.; Ding, Y.; Lin, X.; Yang, X.; Shen, M. An Automatic Splitting Method for the Adhesive Piglets’ Gray Scale Image Based on the Ellipse Shape Feature. Comput. Electron. Agric. 2016, 120, 53–62. [Google Scholar] [CrossRef]
- Xun, L.; Gil, E. A Novel Methodology for Water-Sensitive Papers Analysis Focusing on the Segmentationof Overlapping Droplets to Better Characterize Deposition Pattern. Crop Prot. 2024, 176, 106492. [Google Scholar] [CrossRef]
- Bai, X.; Sun, C.; Zhou, F. Splitting Touching Cells Based on Concave Points and Ellipse Fitting. Pattern Recognit. 2009, 42, 2434–2446. [Google Scholar] [CrossRef]
- Yue, S.; Lu, J.; Cao, D.; Zhou, J. Detection of Plant Leaf Deposition Parameters Based on Watershed Algorithm. Jiangsu Agric. Sci. 2024, 52, 217–224. [Google Scholar] [CrossRef]
- Zhang, Z. Concave Point Segmentation Algorithm Based on Convex Defect for Adhesive Raindrops. Adv. Int. Comput. Sci. 2022, 2, 9–16. [Google Scholar] [CrossRef]
- He, L.; Wang, S.; Guo, Y.; Cheng, G.; Hu, K.; Zhao, Y.; Wang, X. Multi-Scale Coal and Gangue Dual-Energy X-ray Image Concave Point Detection and Segmentation Algorithm. Measuremen 2022, 196, 111041. [Google Scholar] [CrossRef]
- Zafari, S.; Murashkina, M.; Eerola, T.; Sampo, J.; Kälviäinen, H.; Haario, H. Resolving Overlapping Convex Objects in Silhouette Images by Concavity Analysis and Gaussian Process. J. Vis. Commun. Image Represent. 2020, 73, 102962. [Google Scholar] [CrossRef]
- Wu, Y.; Qi, L.; Zhang, Y.; Cheng, Z.; Cheng, Y.; Yang, Z. Optimized Method of Improved Characteristics Judgment and Separation Counting for Adhesive Droplets. J. Agric. Mach. 2017, 48, 220–227. [Google Scholar] [CrossRef]
- Zhu, D.; Liu, H.; Zhu, Y. Airspace Real-time Flow Monitoring Based on Improved Watershed Algorithm. Comput. Digit. Eng. 2022, 50, 1444–1448+1551. [Google Scholar] [CrossRef]
- Yang, L.; Qin, H. Research on Corn Ears Overlapping Image Segmentation Algorithm Based on Concave Point Detection. J. Hangzhou Dianzi Univ. (Nat. Sci.) 2022, 42, 42–48+63. [Google Scholar] [CrossRef]
- Xi, X.; Zhao, J.; Shi, Y.; Qu, J.; Gan, H.; Zhang, R. Online Detection Method for Wheat Seeding Distribution Based on Improved Concave Point Segmentation. J. Agric. Mach. 2015, 31, 38–46. [Google Scholar] [CrossRef]
- Thangarasu, N.; Network, G.A. Deep Learning Algorithms and Their Relevance: A Review. Int. J. Data Inform. Intell. Comput. 2023, 2, 1–10. [Google Scholar] [CrossRef]

| Methods | Key Instruments | Advantages | Limitations | Samples | Accuracy |
|---|---|---|---|---|---|
| Morphology | Morphological optimisation | Simple, quick and able to manage mild or moderate overlap | Unable to segment severely overlap | Cell images | 92.4% |
| morphological reconstruction, fuzzy C means algorithm | Split times have improved | Wide variation in segmentation across structures | Cluster Images | _ | |
| watershed | distance transformation, watershed algorithm | Accuracy, stability and resistance to interference | For large size differences and large target errors | Blood Cell Images | 94.80 |
| Contour solidity, watershed algorithm | Robust and better at overcoming over-segmentation | Vulnerable to changes in border saturation and brightness | overlapping fog droplets | 94.74 | |
| concave point matching | multi-scale opening and closing reconstruction, concave points matching | Better contour edge information, lower over-segmentation rate | For images with light overlap | Goji Berry Images | 96% |
| Item | Parameter |
|---|---|
| Total Weight | 40 KG |
| Overall Dimensions | 2800 × 3085 × 820 mm |
| Number of Nozzles | 4 |
| Spraying Width | 8 m |
| Maximum Chemical Capacity | 40 L |
| Operating Speed | 0–5 m/s |
| Operating Height | 1.5–3.5 m |
| Specifications | Parameter |
|---|---|
| Sensor | Sony IMX298 |
| Sensor Size | 1/2.8 inch |
| Pixel Size | 1.12 um |
| Image Area | 6.4 mm × 5.3 mm |
| Maximum Effective Pixels | 4656(H) × 3496(V) |
| Lens Parameters | 3.5 mm lens, 70° distortion-free |
| Output Image Forma | MJPEG/YUV2 (YUYV) |
| Feature | Symbol | Formula | Description |
|---|---|---|---|
| Area | S | Pixel count within droplet contour | |
| Aspect ratio | AR | MBR width-to-length ratio | |
| Rect. coverage | C | Area fraction relative to MBR | |
| Solidity | R | Convex hull area ratio | |
| Shape factor | F | Perimeter-normalized compactness | |
| Circularity | Y | Radial uniformity metric | |
| Concavity ratio | CR | Perimeter concavity metric | |
| Concave regions | N | Discrete concave contour segments |
| Hyperparameters | Initial Value | Search Space | Tuning Results |
|---|---|---|---|
| colsample_bytree | 0.9 | [0.4, 1.0] | 0.5353 |
| n_estimators | 100 | [1, 70, 150] | 123 |
| learning_rate | 0.1 | [0.005, 0.3] | 0.0896 |
| gamma | 3.8 | [0, 8] | 0.0776 |
| max_depth | 6 | [2, 15, 1] | 11 |
| alpha | 0 | [0, 5] | 0.3580 |
| lambda | 1 | [0, 5] | 3.8116 |
| subsample | 0.9 | [0.4, 1.0] | 0.6297 |
| Segmentation Method | Type of Overlap | S1/% | S2/% | /% | Average Time/s |
|---|---|---|---|---|---|
| Method of this paper | SC | 7.32 | 92.68 | 91.35 | 2.66 |
| NP | 8.57 | 91.43 | |||
| PA | 13.33 | 86.67 | |||
| Based on contour solidity with watershed algorithm | SC | 37.45 | 62.55 | 76.19 | 3.92 |
| NP | 10.17 | 89.83 | |||
| PA | 49.83 | 50.17 | |||
| Improved concave point matching | SC | 95.12 | 4.88 | 68.82 | 2.33 |
| NP | 23.81 | 76.19 | |||
| PA | 38.77 | 61.23 |
Disclaimer/Publisher’s Note: The statements, opinions and data contained in all publications are solely those of the individual author(s) and contributor(s) and not of MDPI and/or the editor(s). MDPI and/or the editor(s) disclaim responsibility for any injury to people or property resulting from any ideas, methods, instructions or products referred to in the content. |
© 2025 by the authors. Licensee MDPI, Basel, Switzerland. This article is an open access article distributed under the terms and conditions of the Creative Commons Attribution (CC BY) license (https://creativecommons.org/licenses/by/4.0/).
Share and Cite
Liao, D.; Chen, X.; Liu, M.; Zhou, Y.; Fang, P.; Lin, J.; Liu, Z.; Wang, X. Automatic Identification and Segmentation of Overlapping Fog Droplets Using XGBoost and Image Segmentation. Appl. Sci. 2025, 15, 2847. https://doi.org/10.3390/app15052847
Liao D, Chen X, Liu M, Zhou Y, Fang P, Lin J, Liu Z, Wang X. Automatic Identification and Segmentation of Overlapping Fog Droplets Using XGBoost and Image Segmentation. Applied Sciences. 2025; 15(5):2847. https://doi.org/10.3390/app15052847
Chicago/Turabian StyleLiao, Dongde, Xiongfei Chen, Muhua Liu, Yihan Zhou, Peng Fang, Jinlong Lin, Zhaopeng Liu, and Xiao Wang. 2025. "Automatic Identification and Segmentation of Overlapping Fog Droplets Using XGBoost and Image Segmentation" Applied Sciences 15, no. 5: 2847. https://doi.org/10.3390/app15052847
APA StyleLiao, D., Chen, X., Liu, M., Zhou, Y., Fang, P., Lin, J., Liu, Z., & Wang, X. (2025). Automatic Identification and Segmentation of Overlapping Fog Droplets Using XGBoost and Image Segmentation. Applied Sciences, 15(5), 2847. https://doi.org/10.3390/app15052847