1. Introduction
Concrete has the advantages of good mechanical properties, durability and plasticity. As a typical engineering structure, annular concrete structures are widely used in urban infrastructure, tunnel linings, pipelines and protective facilities, and has remarkable performance in bearing radial stress and environmental loads. However, when it is applied to projects in cold areas with significant temperature fluctuations between day and night, as well as large seasonal temperature differences, under the combined influence of temperature changes and external stresses, the annular concrete structure is prone to degradation and cracking, leading to reduced structural stability and increased security risks [
1]. Therefore, studying the effects of stress and temperature on the mechanical properties of annular concrete structures can provide basis and method support for the reliability evaluation of concrete structures in cold environment.
In the analysis of mechanical properties of annular concrete structures, as early as 1965, Hobbs [
2] established an approximate solution for the stress state of the center-hole ring of cement materials under radial load, and provided analytical demonstration of the theory. On this basis, Tokovyy et al. [
3] studied the determination of in-plane stress and displacement of thin rings under radial external pressure by direct integration method, analyzed the main characteristics and rules of principal stress and maximum shear stress, and obtained the analytical expression of displacement in rings. Zhu Tantan et al. [
4] studied the effects of center hole diameter d and its position on the peak load, failure pattern and horizontal stress of disk samples through laboratory tests and finite element numerical simulation. Zhou Xiaoping et al. [
5] studied the fracture process and the peak load by phase field method. The numerical validity and accuracy of the phase field method were verified by numerical examples, and the effects of the aperture ratio and crack angle on the failure process and peak load of the annular Brazilian disk specimen are studied. These studies provide theoretical basis for the analysis of annular concrete structures.
Based on existing theory, to study the mechanical characteristics of annular concrete structures under radial compression, Cheng Bingqing et al. [
6] used different detection methods to study the mechanical properties of prestressed steel tube (PCCP) under external load through trilateral bearing capacity test (TEBT), and obtained that At the vault and invert of the pipe, the outer concrete core and prestressed steel wire are under pressure, and the inner concrete core and steel tube are under tension. The reverse is true at the arch line of the pipe. Dong Xiaonong et al. [
7] derived the thrust coefficient and moment coefficient of PCCP under the action of TEBT, and solved for the strain. The measured results are in good agreement with the experimental results. Frappa et al. [
8] explored the modeling of orthotropic ring reinforced concrete floor, and presented a finite element method that can reproduce the actual in-plane stiffness of the floor in the finite element model of the building for seismic load analysis. Zhang Zongyuan et al. [
9] established a three-dimensional numerical model of cracked concrete pipe and carried out practical experiments. The comparison and verification showed that the circumferential strain of the structure increased with the gradual increase of external load, and the bearing capacity of the concrete pipe decreased significantly under the influence of the length, depth and different positions of the crack. However, most experimental studies focus on the analysis of the mechanical behavior of annular concrete structures under load or under different damage conditions, and relatively few studies considering the complex thermodynamic response caused by various factors, especially the influence of temperature. Therefore, it is a feasible research topic to analyze the performance of annular concrete structures under the joint constraints of stress and temperature.
Given the need for accurate assessment of structural strain under the joint constraints of stress and temperature, FBG sensors are ideal measurement tools due to their wide measurement range, low transmission loss, high accuracy, and stable operation under different temperature conditions [
10,
11,
12,
13,
14]. In recent years, Jiang Zhengwu et al. [
15] used FBG sensors to characterize the thermal strain of cement-based materials at low temperatures in real time, and the results showed that higher water content and the addition of fine aggregates significantly increased the thermal strain of cement-based materials at low temperatures and their freeze-thaw cycles. Yang Lubing et al. [
16] used FBG strain sensors to measure the stress strain and total strain of concrete structures, extract the temperature strain of concrete structures, and calculate the thermal expansion coefficient of concrete structures under different working conditions. Pashaie et al. [
17] proposed an experiment consisting of a cantilever beam and a uniform fiber grating sensor that simultaneously measured non-uniform strain and temperature. The effect of FBG length on Bragg wavelength shift and FWHM change is discussed. The experimental results agree well with the simulation results, and the error is less than 6.5%. These studies show that the FBG sensor has a high application potential in the temperature and stress measurement of concrete structures, so the FBG strain sensor is used in this study for structural strain and temperature monitoring.
In this paper, according to the special environmental conditions in the cold area, a detection model was established to measure the structural strain by combining the structural mechanics model and FBG detection technology, and a numerical simulation model was established to reflect the mechanical response of annular concrete structures. Through the performance test of the structure, the bearing capacity range of the structure is determined. Gradient cooling experiments were then conducted under different stress constraints. The total strain of the structure under stress constraint was measured, and the thermal strain data is extracted and evaluated statistically. The nonlinear thermal strain response of the structure is discussed and analyzed. The novelty of this method lies in its focus on the annular shape of concrete, combines structural mechanics analysis with FBG detection technology to build a new detection model. By comparing and analyzing simulation and experimental data, this method accurately evaluates the complex thermodynamic response of the annular concrete structure under stress and temperature constraints.
2. Mechanical Model and Fiber Grating Detection Model of Annular Concrete Structure
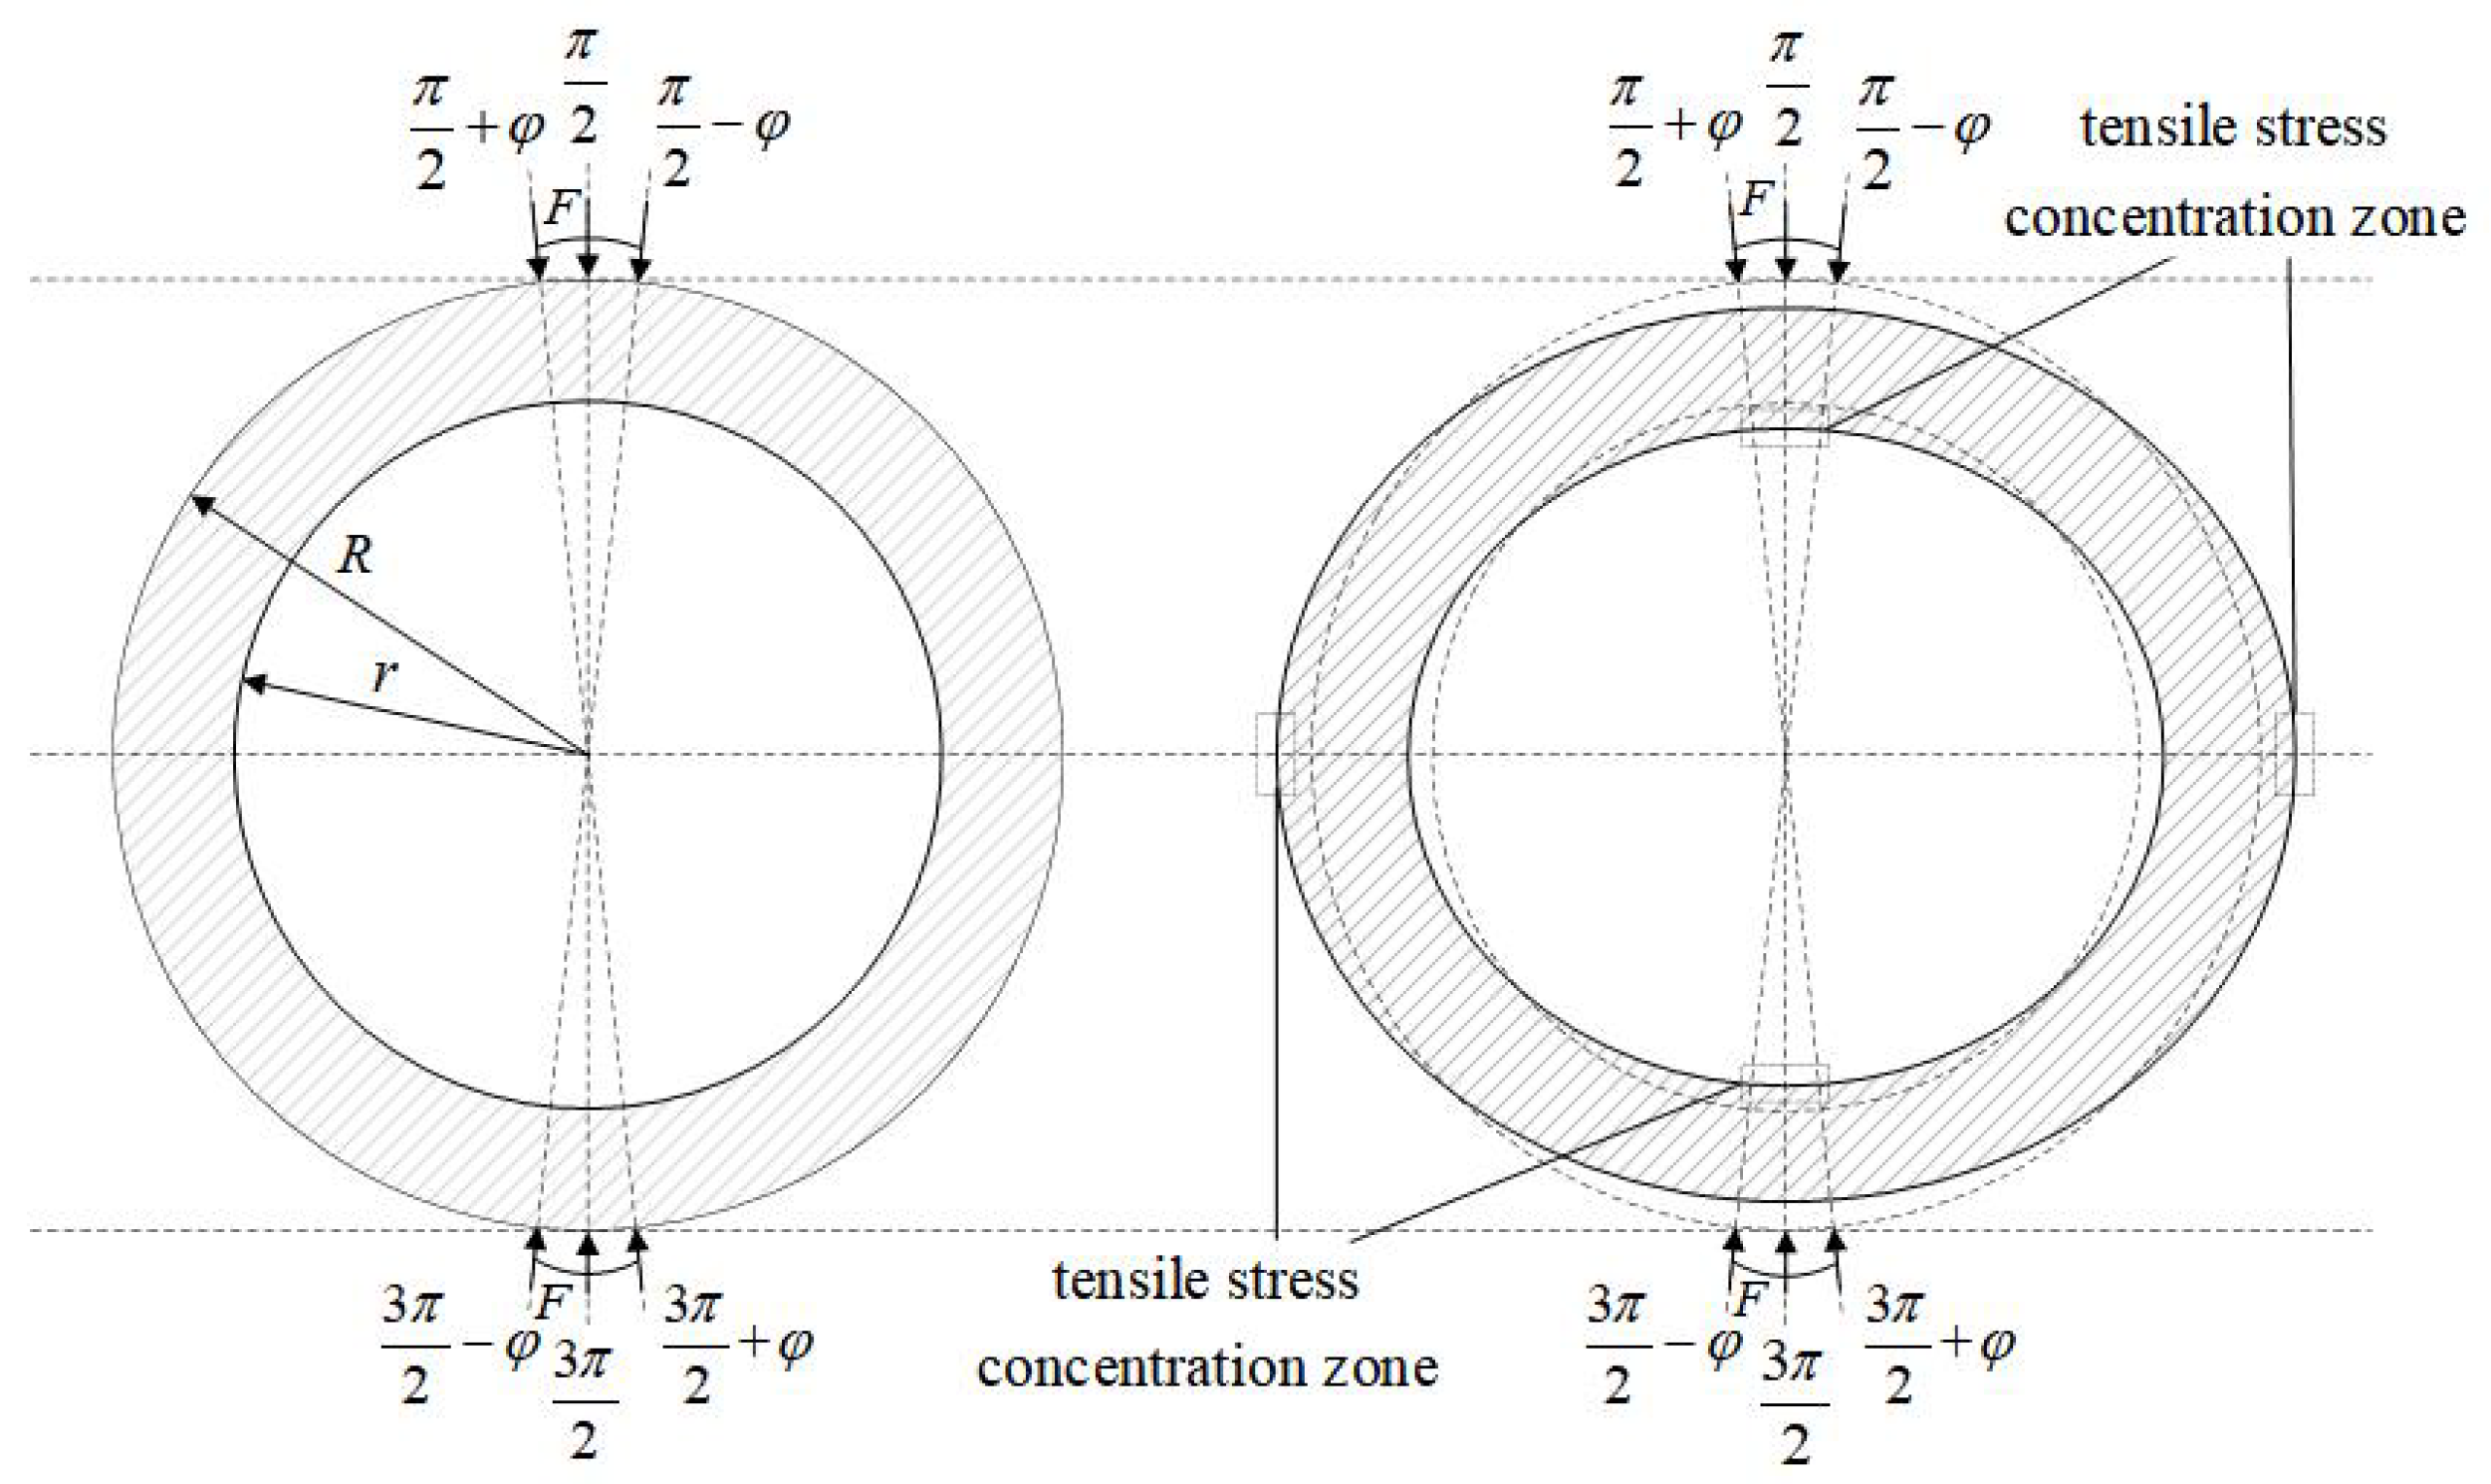
When vertical pressure is exerted to the outer wall at the top of the ring concrete structure, the inner wall at the top deforms, leading to bending tension, resulting in stress [
18,
19,
20], as shown in
Figure 1.
r,
R and
h are the inner radius, outer radius and thickness of the structure, respectively. Additionally, the outer wall of the structure also experiences significant tensile stresses at its waist.
The general solution formula of the total stress of the ring derived by Tokovyy [
3] is used as the theoretical formula as follows:
where
P is the pressure,
and
are constants related to
k,
. In Equation (
1),
, where
and
are the radial and angular coordinates of any point on the annular structure, respectively, with the center of the structure as the origin. In order to coincide with the actual situation,
= 5°. The first three terms of Fourier series are calculated to get the approximate solution.
According to
Figure 1, the tensile stress in the inner surface of the top and bottom is located at the position of
,
,
, and the lateral outer wall tensile stress concentration area is located at the locations of
,
,
.
The stress-strain resulting from the applied load
is caused by tensile stress
. Considering that the concrete structure is in elastic strain before cracking occurs,
can be approximated as:
when the structure is subjected to various temperature environments under pressure, the stress concentration zones experience the combined effects of stress and thermal loads. The total strain
resulting from the simultaneous application of uniaxial and thermal loads is expressed as:
where,
is the thermal strain,
is the sum of the thermal strain of FBG induced by temperature load and the additional strain caused by thermal expansion coefficient mismatch.
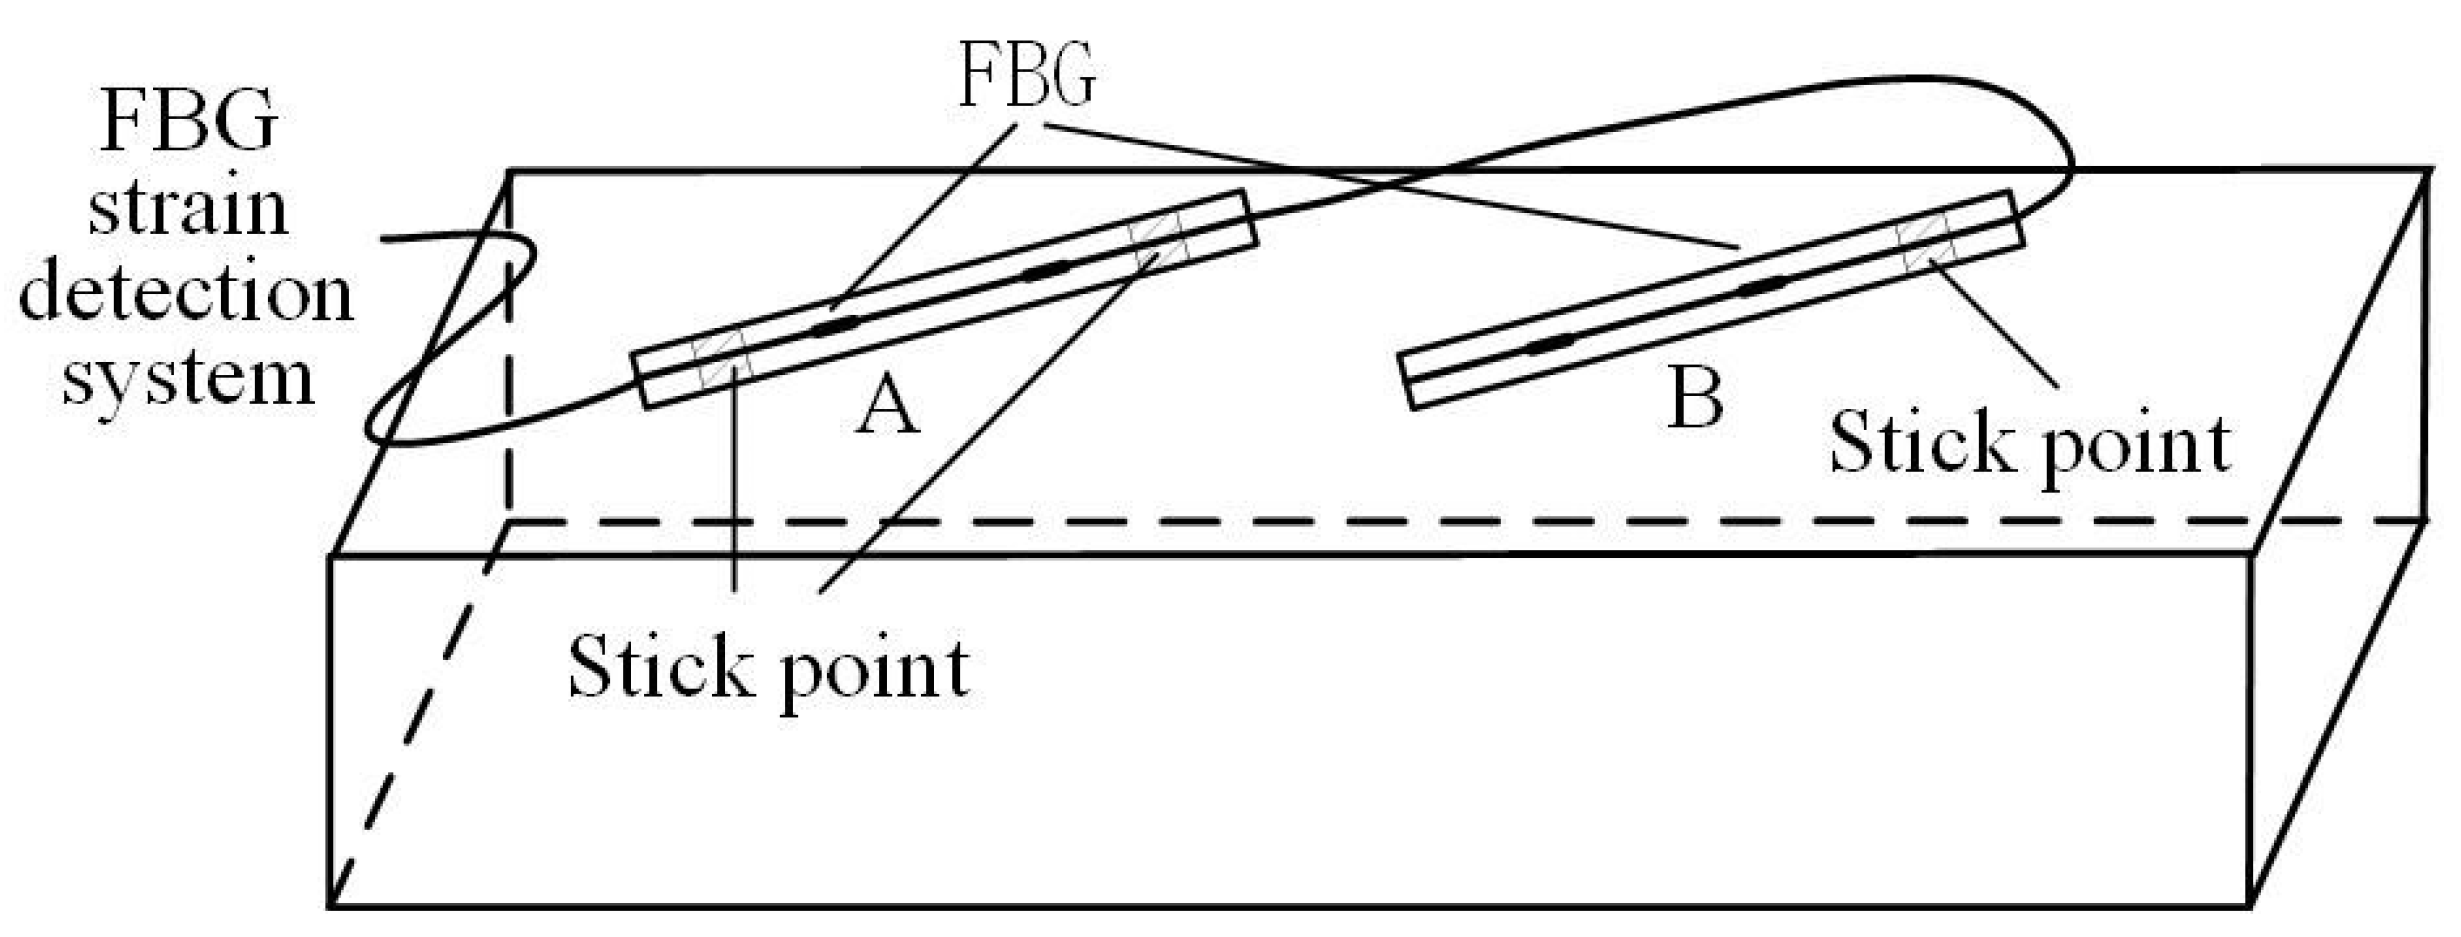
In this study, FBG strain sensors are used to measure structural strain, and the ambient temperature is measured by introducing a reference grating that only acquires temperature information [
21], as shown in
Figure 2. In the installation of FBG sensor, both ends of FBG sensor A are fixed to the structure’s surface to detect strain. When the structure under radial pressure is exposed to varying temperatures, its central wavelength is influenced by both the temperature and structural strain. The wavelength signal conveys information about the structural strain and the temperature. One end of FBG sensor B is fixed to the surface of the structure, while the other end is not fixed. Its central wavelength is only modulated by the temperature, and the wavelength signal carries information about temperature.
According to the principle that the central wavelength of FBG fixed on the surface of the structure is modulated by different external parameters, the fiber sensing equations for the Bragg grating central wavelength shifts
and
, used for strain detection and temperature information detection respectively, are as follows:
In the Equation (
4),
is the strain caused by stress,
c,
C
−1 is the structural thermal expansion coefficient,
C
−1 is the fiber thermal expansion coefficient,
and
are the strain and temperature sensitivity coefficient of FBG respectively, and
is the strain transfer coefficient between the structure and FBG.
Therefore, under stress constraint, the total strain
and thermal strain
can be expressed respectively as relations related to the relative central wavelength shift
and
of structural strain FBG and temperature compensation FBG:
3. Finite Element Simulation Model of Annular Concrete Structure
The finite element model of the annular concrete structure is established to simulate its performance test and cooling experiment under different stress constraints. The inner diameter, outer diameter and length of the ring concrete structure are 300 mm, 380 mm and 100mm respectively. The model parameters of concrete structure are shown in
Table 1 [
22].
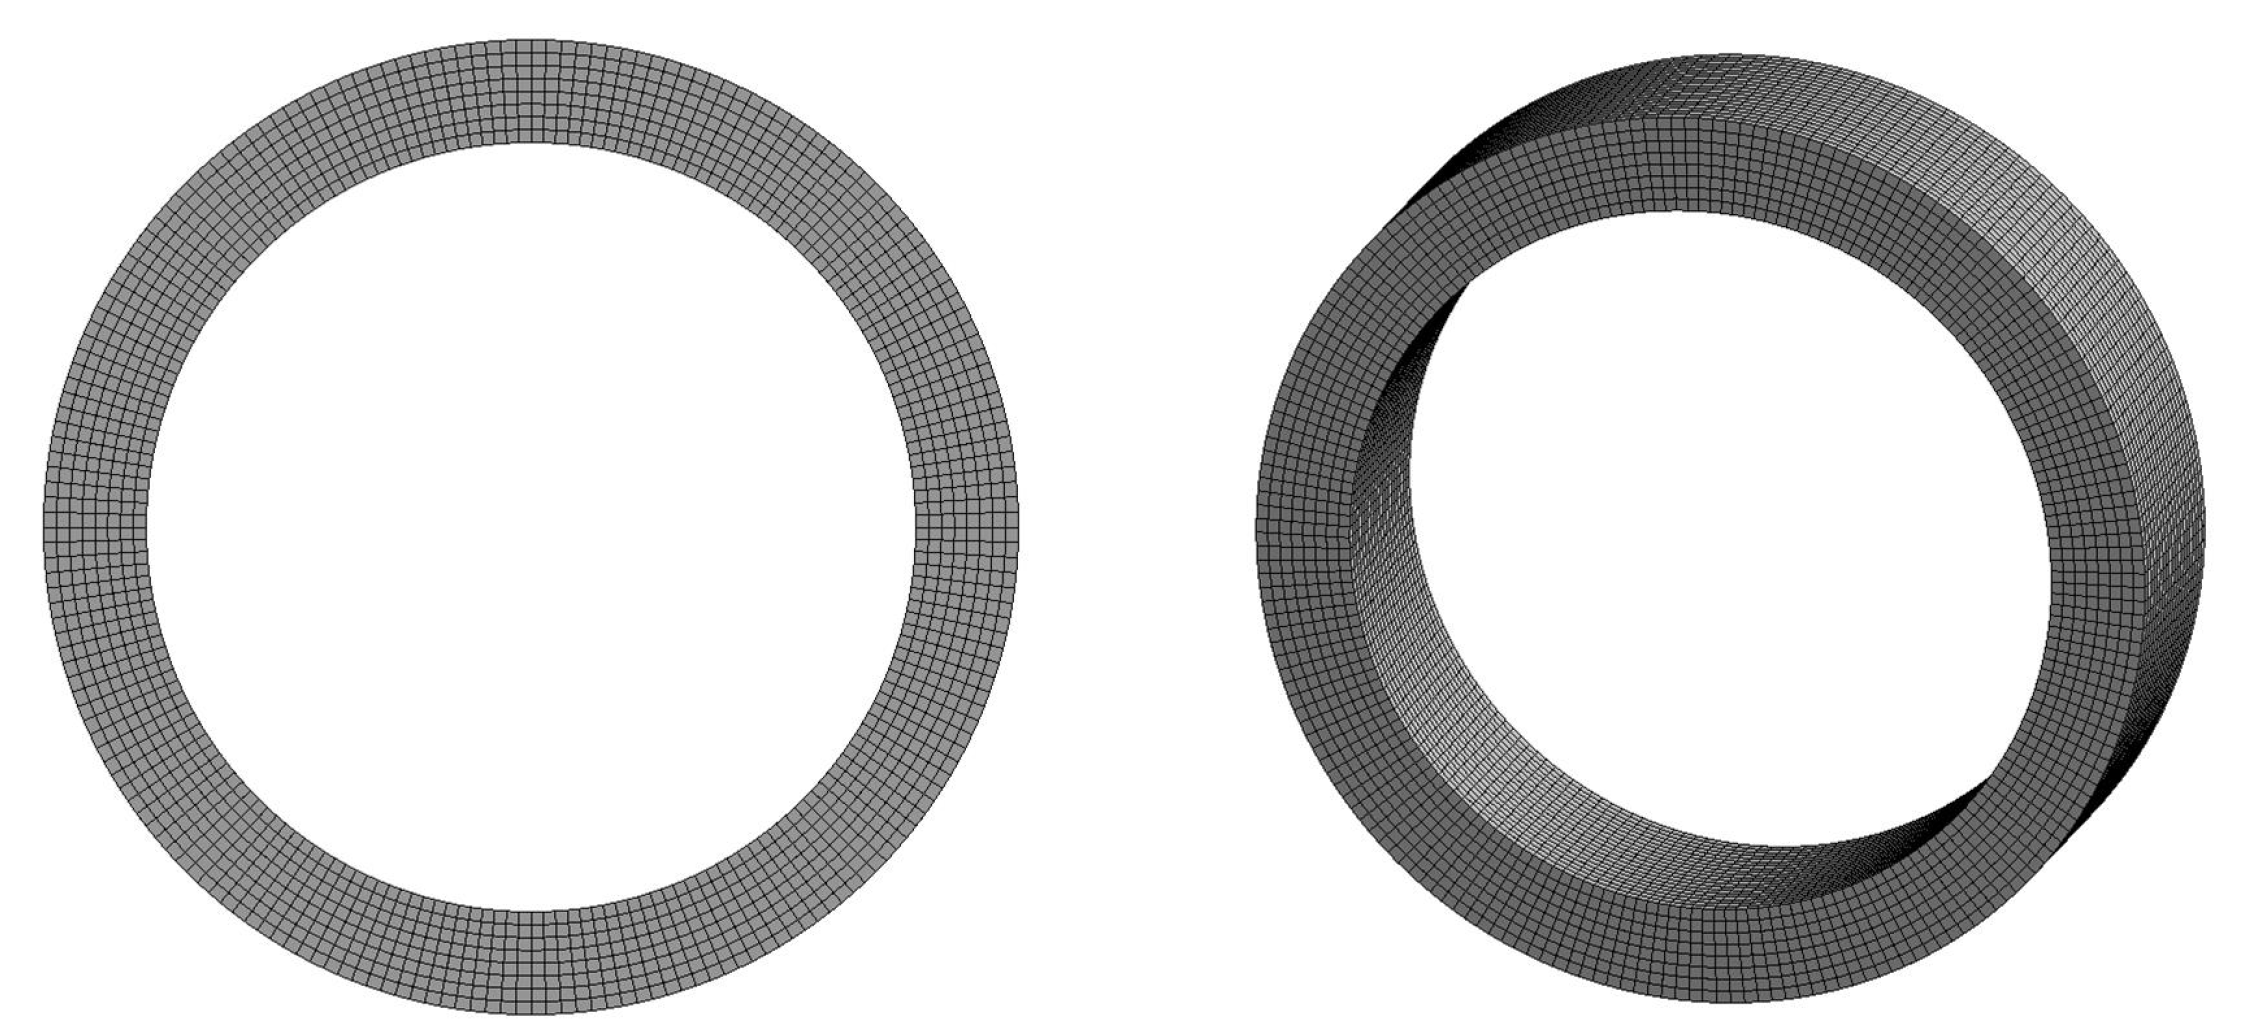
In order to explore the mechanical characteristics of the structure, a thermodynamic coupling model of the annular concrete structure under the double constraints of temperature and pressure was established, as shown in Figure
Figure 3. The grid model (solid186) uses a 20-node solid structure unit, the selected mesh size is 5mm, the number of model grid nodes is 145,200, and the number of cells is 32,000. The model uses the Menetrey-William Concrete (MWC) model to take into account the differences in the performance of concrete during tensile and compressive processes [
23]. HSD model is added to consider the strengthening and softening stages of concrete under tensile and compressive action. The model has strong convergence.
In this model, the pressure load is achieved by applying pressure to the upper contact surface in the vertical direction of the annular concrete structure. Remote displacement constraints are applied to lower contact surfaces to secure annular concrete structures, preventing rotation or translation degrees of freedom. The first strength theory is adopted as the failure criterion of concrete pipe, taking into account that the material fails when the maximum principal stress exceeds the ultimate tensile strength. At the same time, temperature load is applied to the ring concrete structure, and the cooling strain curve is obtained by step cooling method.
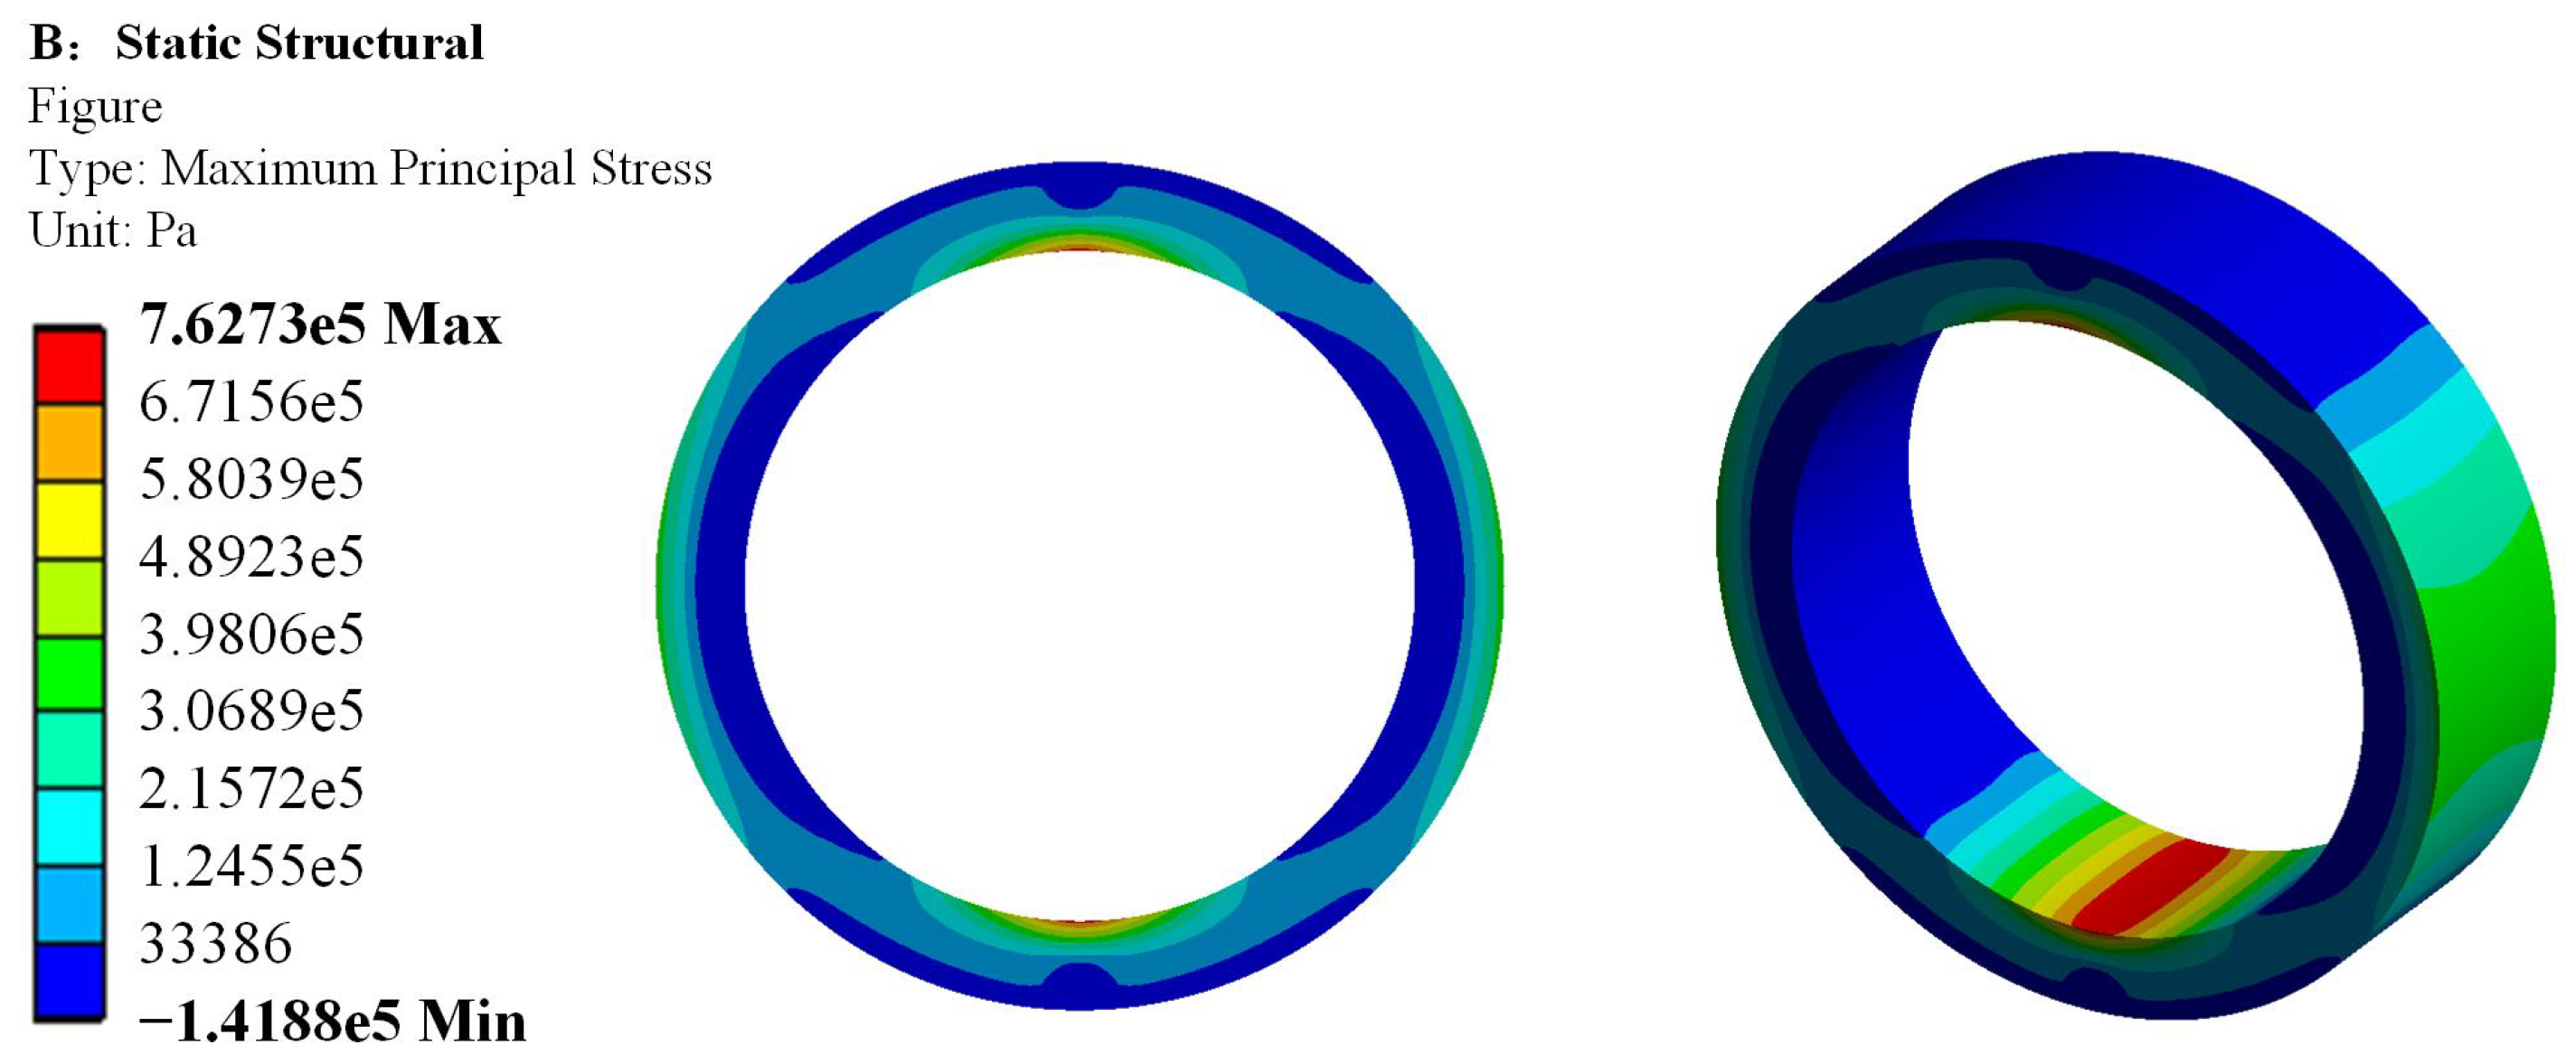
Figure 4 shows the simulated stress state of the complete ring concrete structure under the obtained external load. It can be seen that the maximum tensile stress is on the inner wall at the top and bottom, followed by the outer wall at the waist, which is consistent with the physical model.
4. Thermal Strain Performance Analysis of Annular Concrete Under Pressure Confinement
Conduct loading experiments on the annular concrete structure. The inner diameter, outer diameter and length of the test components are 300, 380 and 100 mm, respectively. The specific indices and parameters of the concrete structure are detailed in
Table 2.
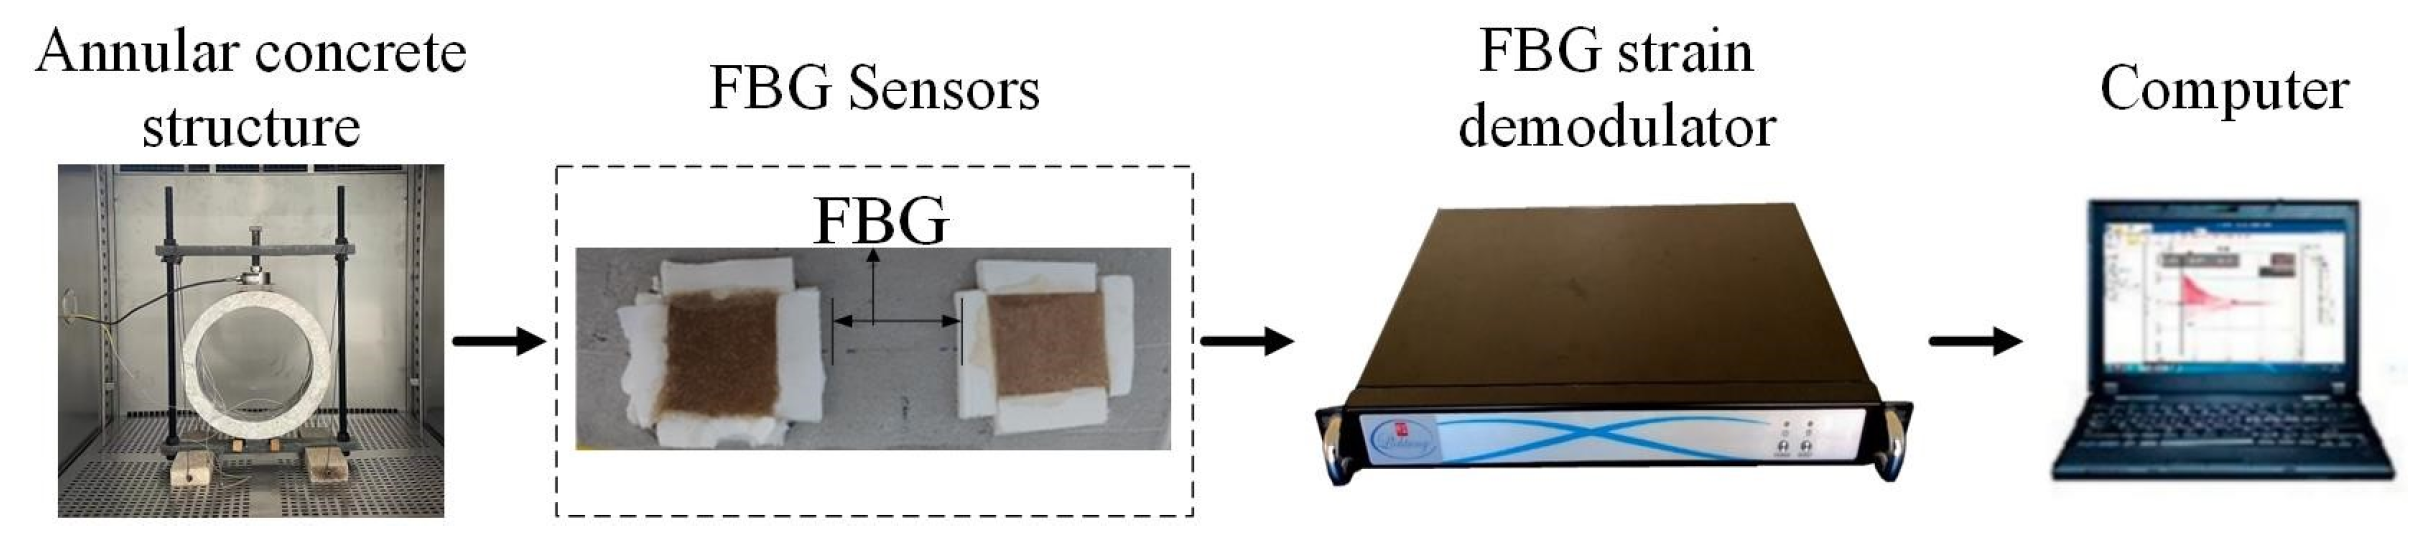
The selected detection system is composed of FBG strain demodulator and computer. The FBG strain measurement system is composed of ASE broadband light source, strain sensor, fiber grating demodulation instrument and host system, which can be used to collect wavelength information of fiber grating sensor in multiple channels. The computer can detect and analyze the dynamic strain signal synchronously.
Figure 5 shows the collection process of the detection system.
Before formal loading, the FBG strain sensor calibration experiment is carried out. Different loads are applied to the sensor to verify that and C−1.
Since it is necessary to keep the structure undamaged when detecting the strain change under different pressure conditions in the process of gradient cooling, the performance test of the concrete must be carried out in the room temperature environment first to determine the stress range that the concrete structure can bear before cracking.
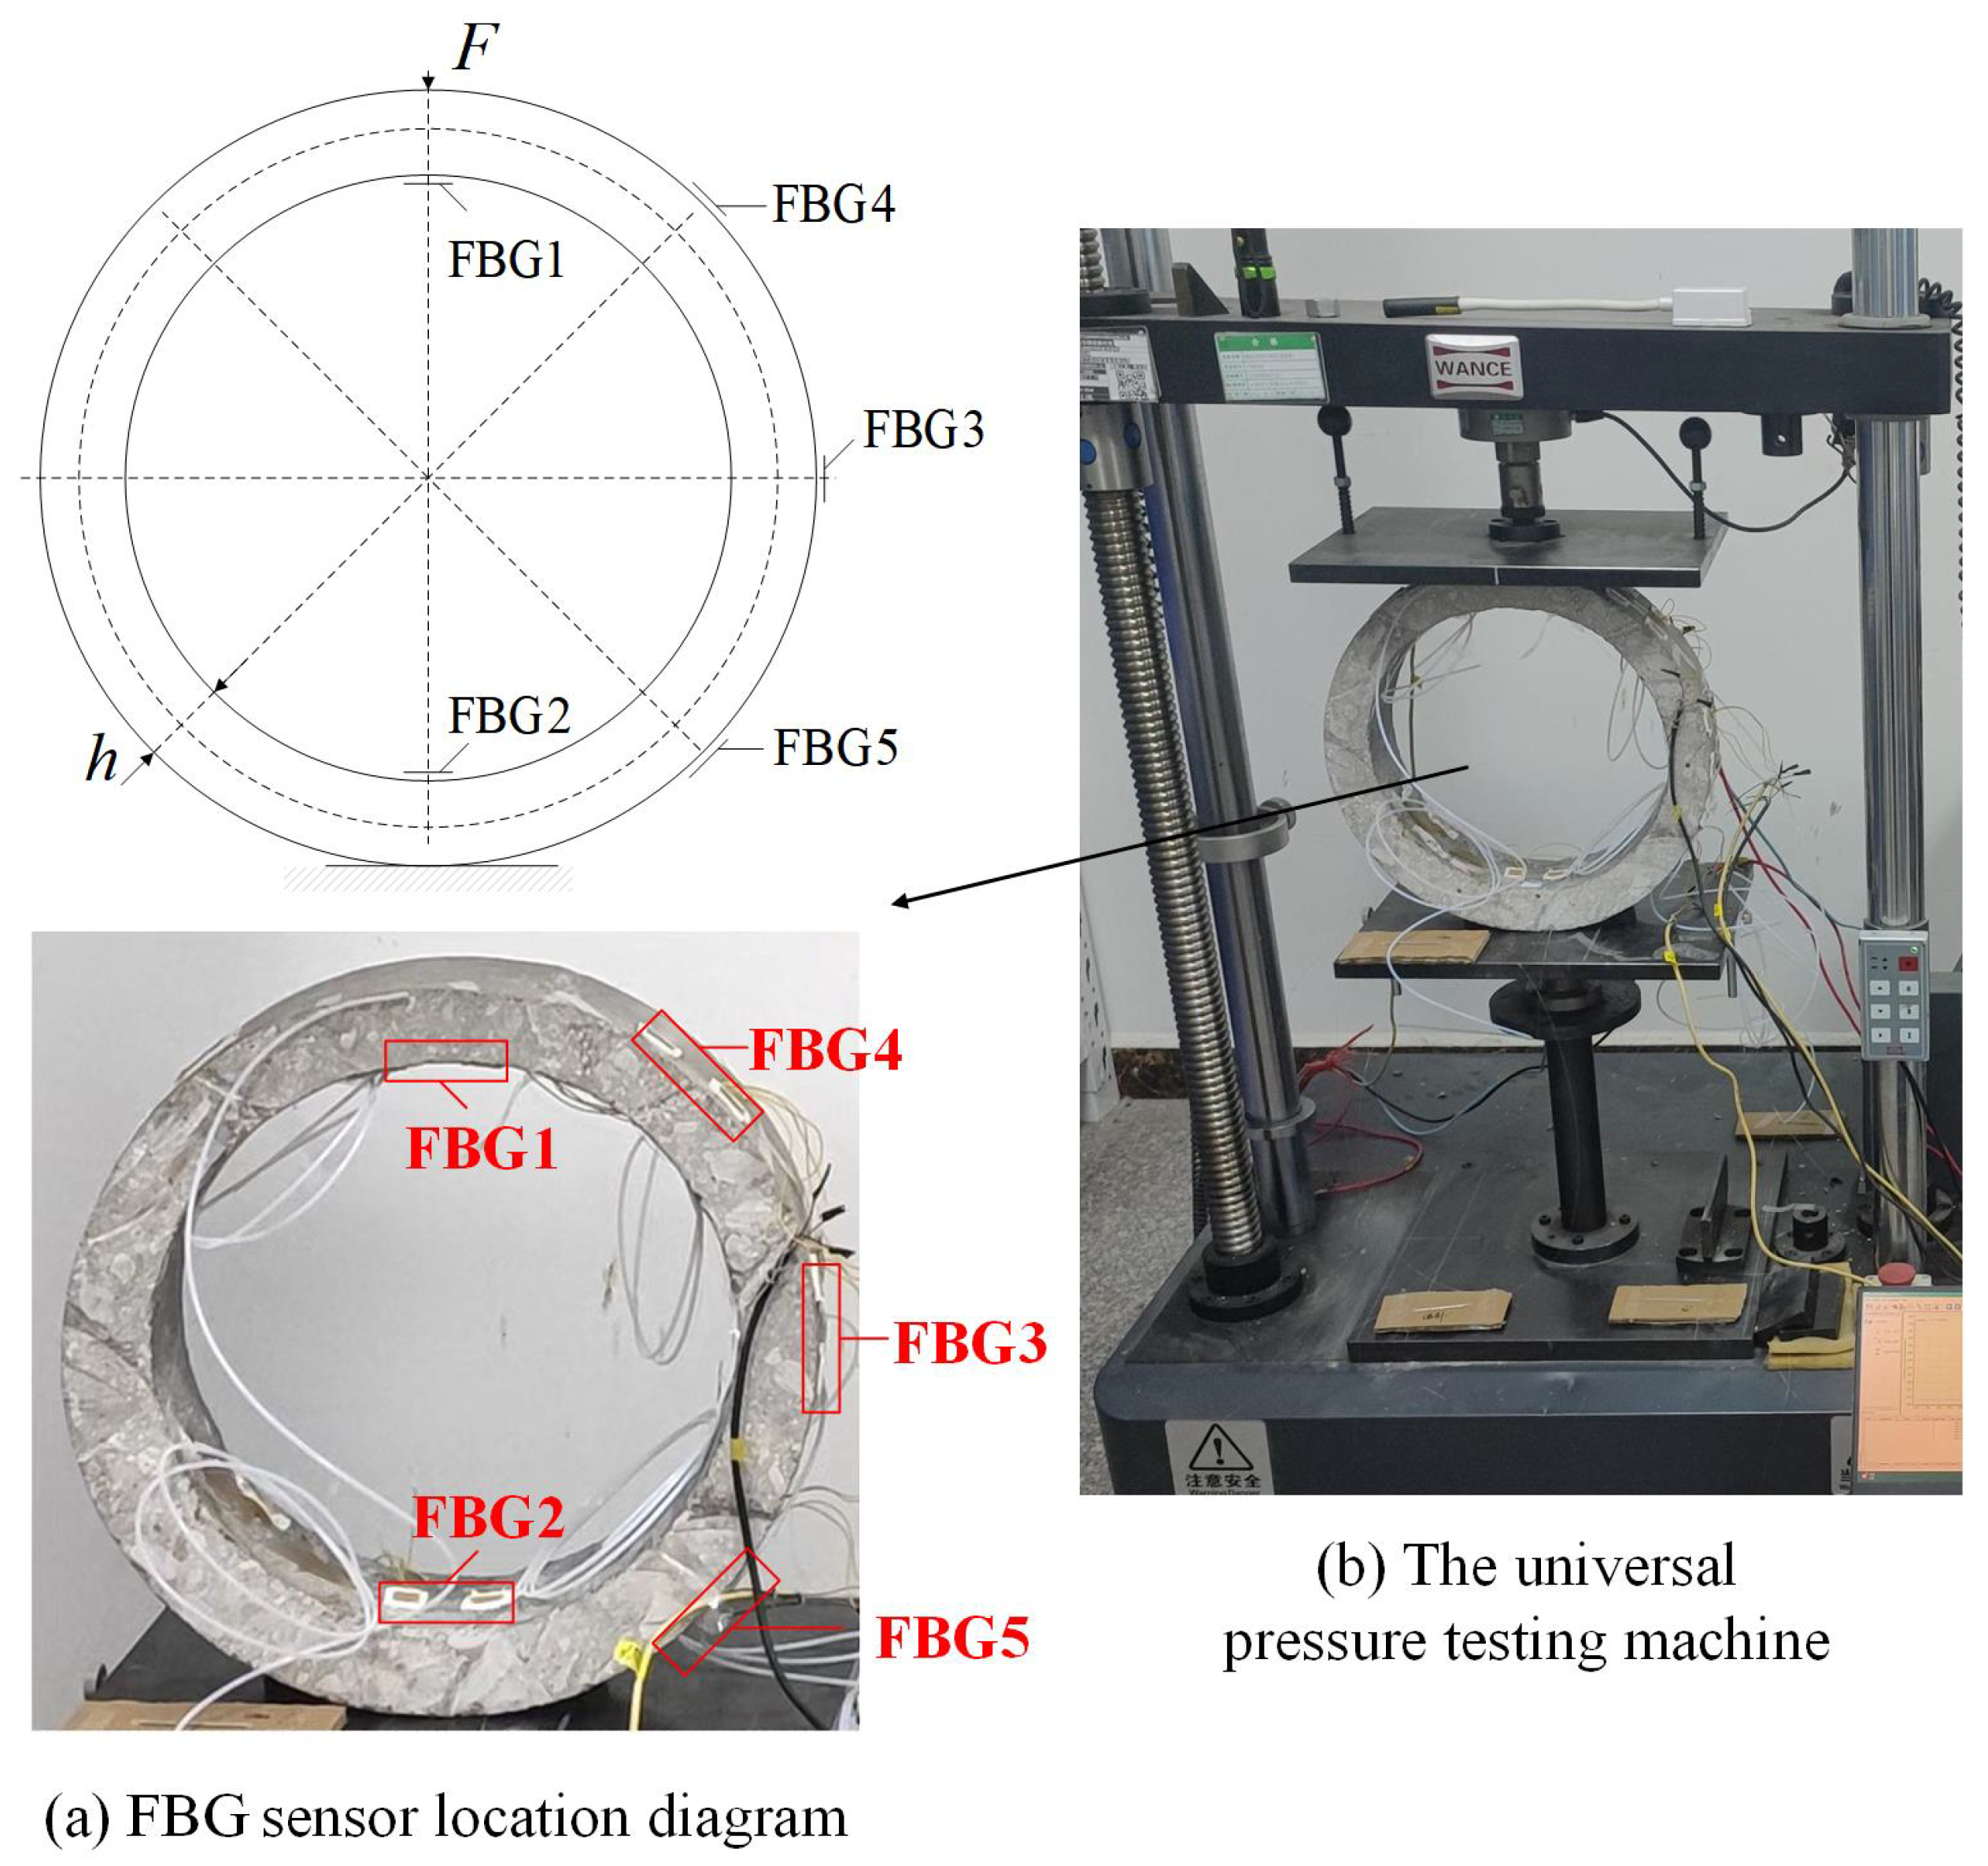
Considering the symmetry of structural loads, the FBG sensors are placed between 0° and 180° of the annular concrete structure, arranged semi-circularly as shown in the
Figure 6a. FBG1 and FBG2 are positioned at 0° and 180° on the inner wall, while FBG3, FBG4, and FBG5 are positioned at 90°, 45°, and 135° on the outer wall, respectively. The universal pressure testing machine, shown in
Figure 6b, is used for the experimental performance test. The load is applied along the vertical and radial direction of the concrete pipe, and the axis of the specimen is parallel to the upper and lower clamping surface.
Loading is carried out in force control mode, with a step size of 250 N. The loading continues from the start until the structure fails and fractures. At each interval of 250 N load, the loading is stopped, and the FBG wavelength data is monitored for 2 min. When the structure fails in the process of load increase, The failure load of the structure is determined by calculating the average load value between the current and previous states.
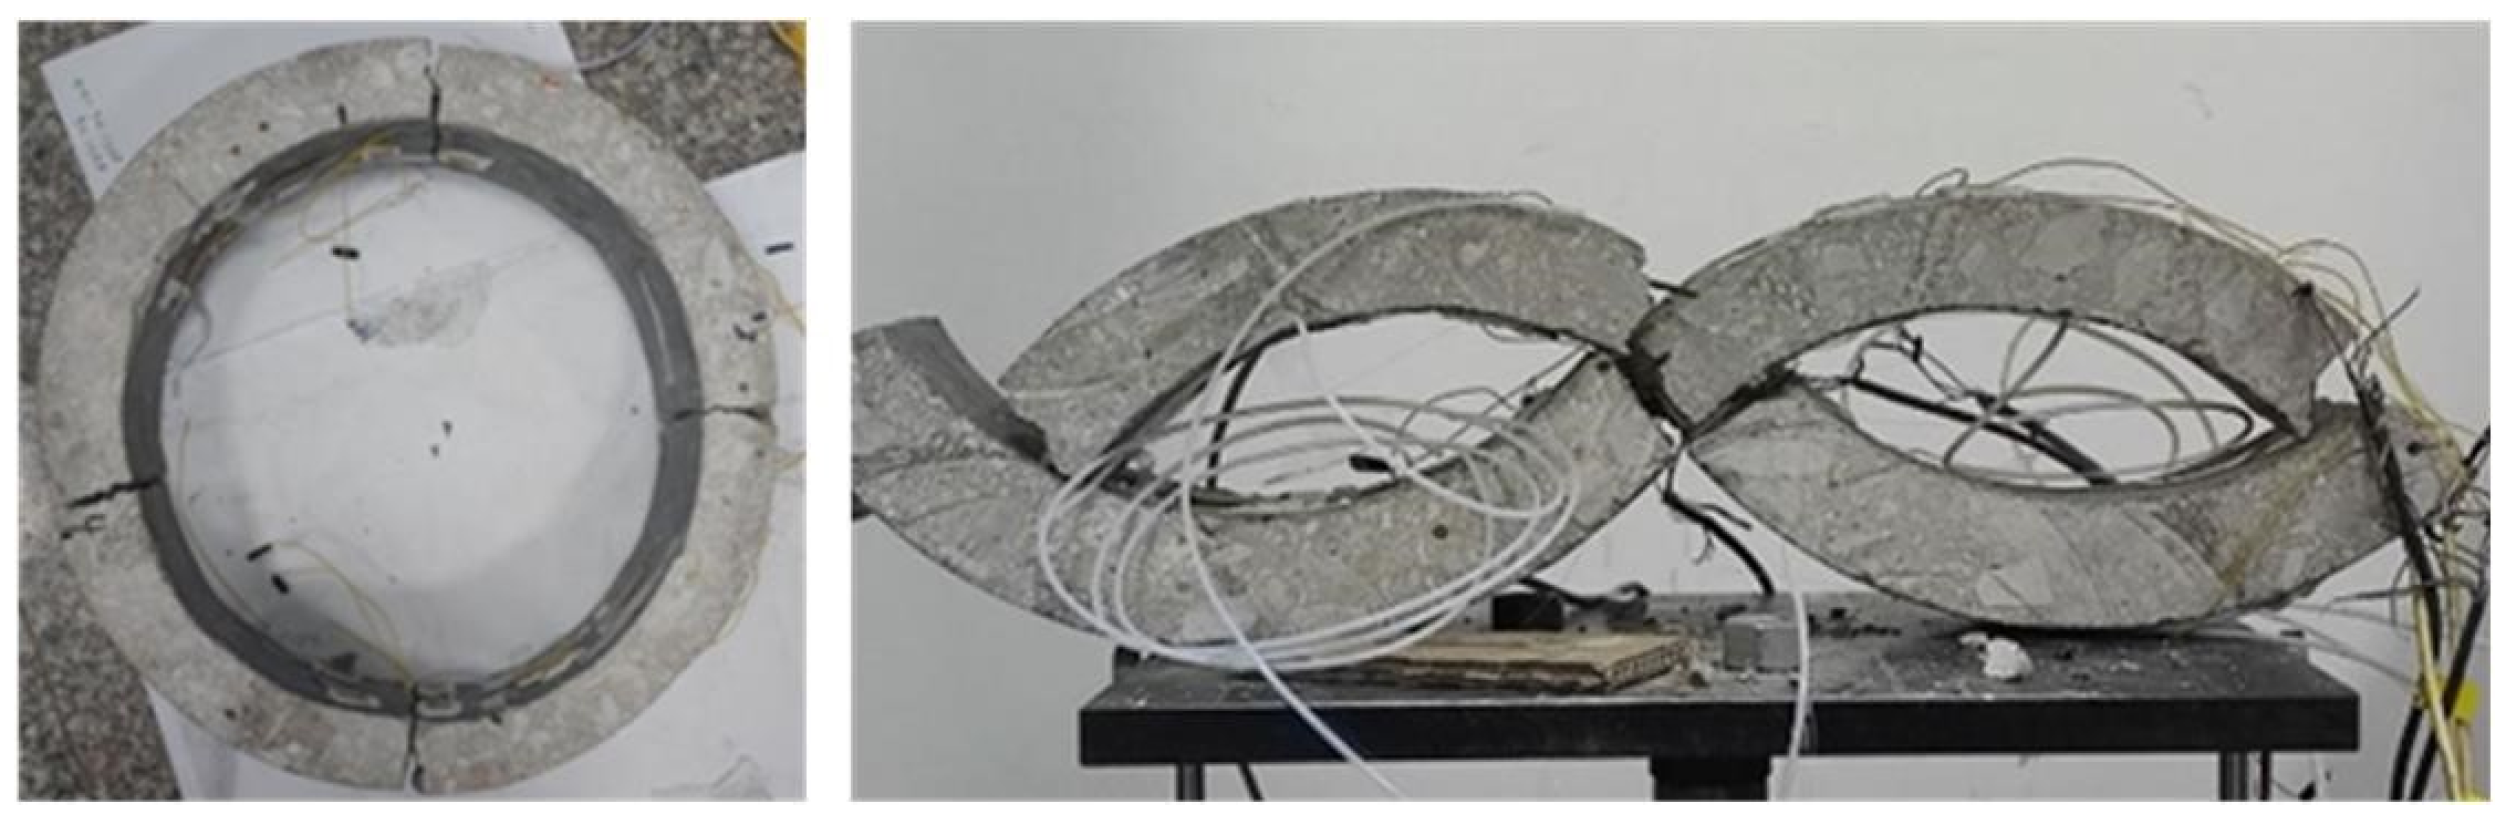
Through observation, it can be seen that when the maximum pressure that concrete can bear is exceeded, the structure suddenly breaks from the top and bottom. As the annular concrete structure continued to be squeezed by external pressure loads, due to the failure of the top and bottom, the stress on the structure along the 90° direction rapidly increased until fracture occurred. The failure state is shown in
Figure 7.
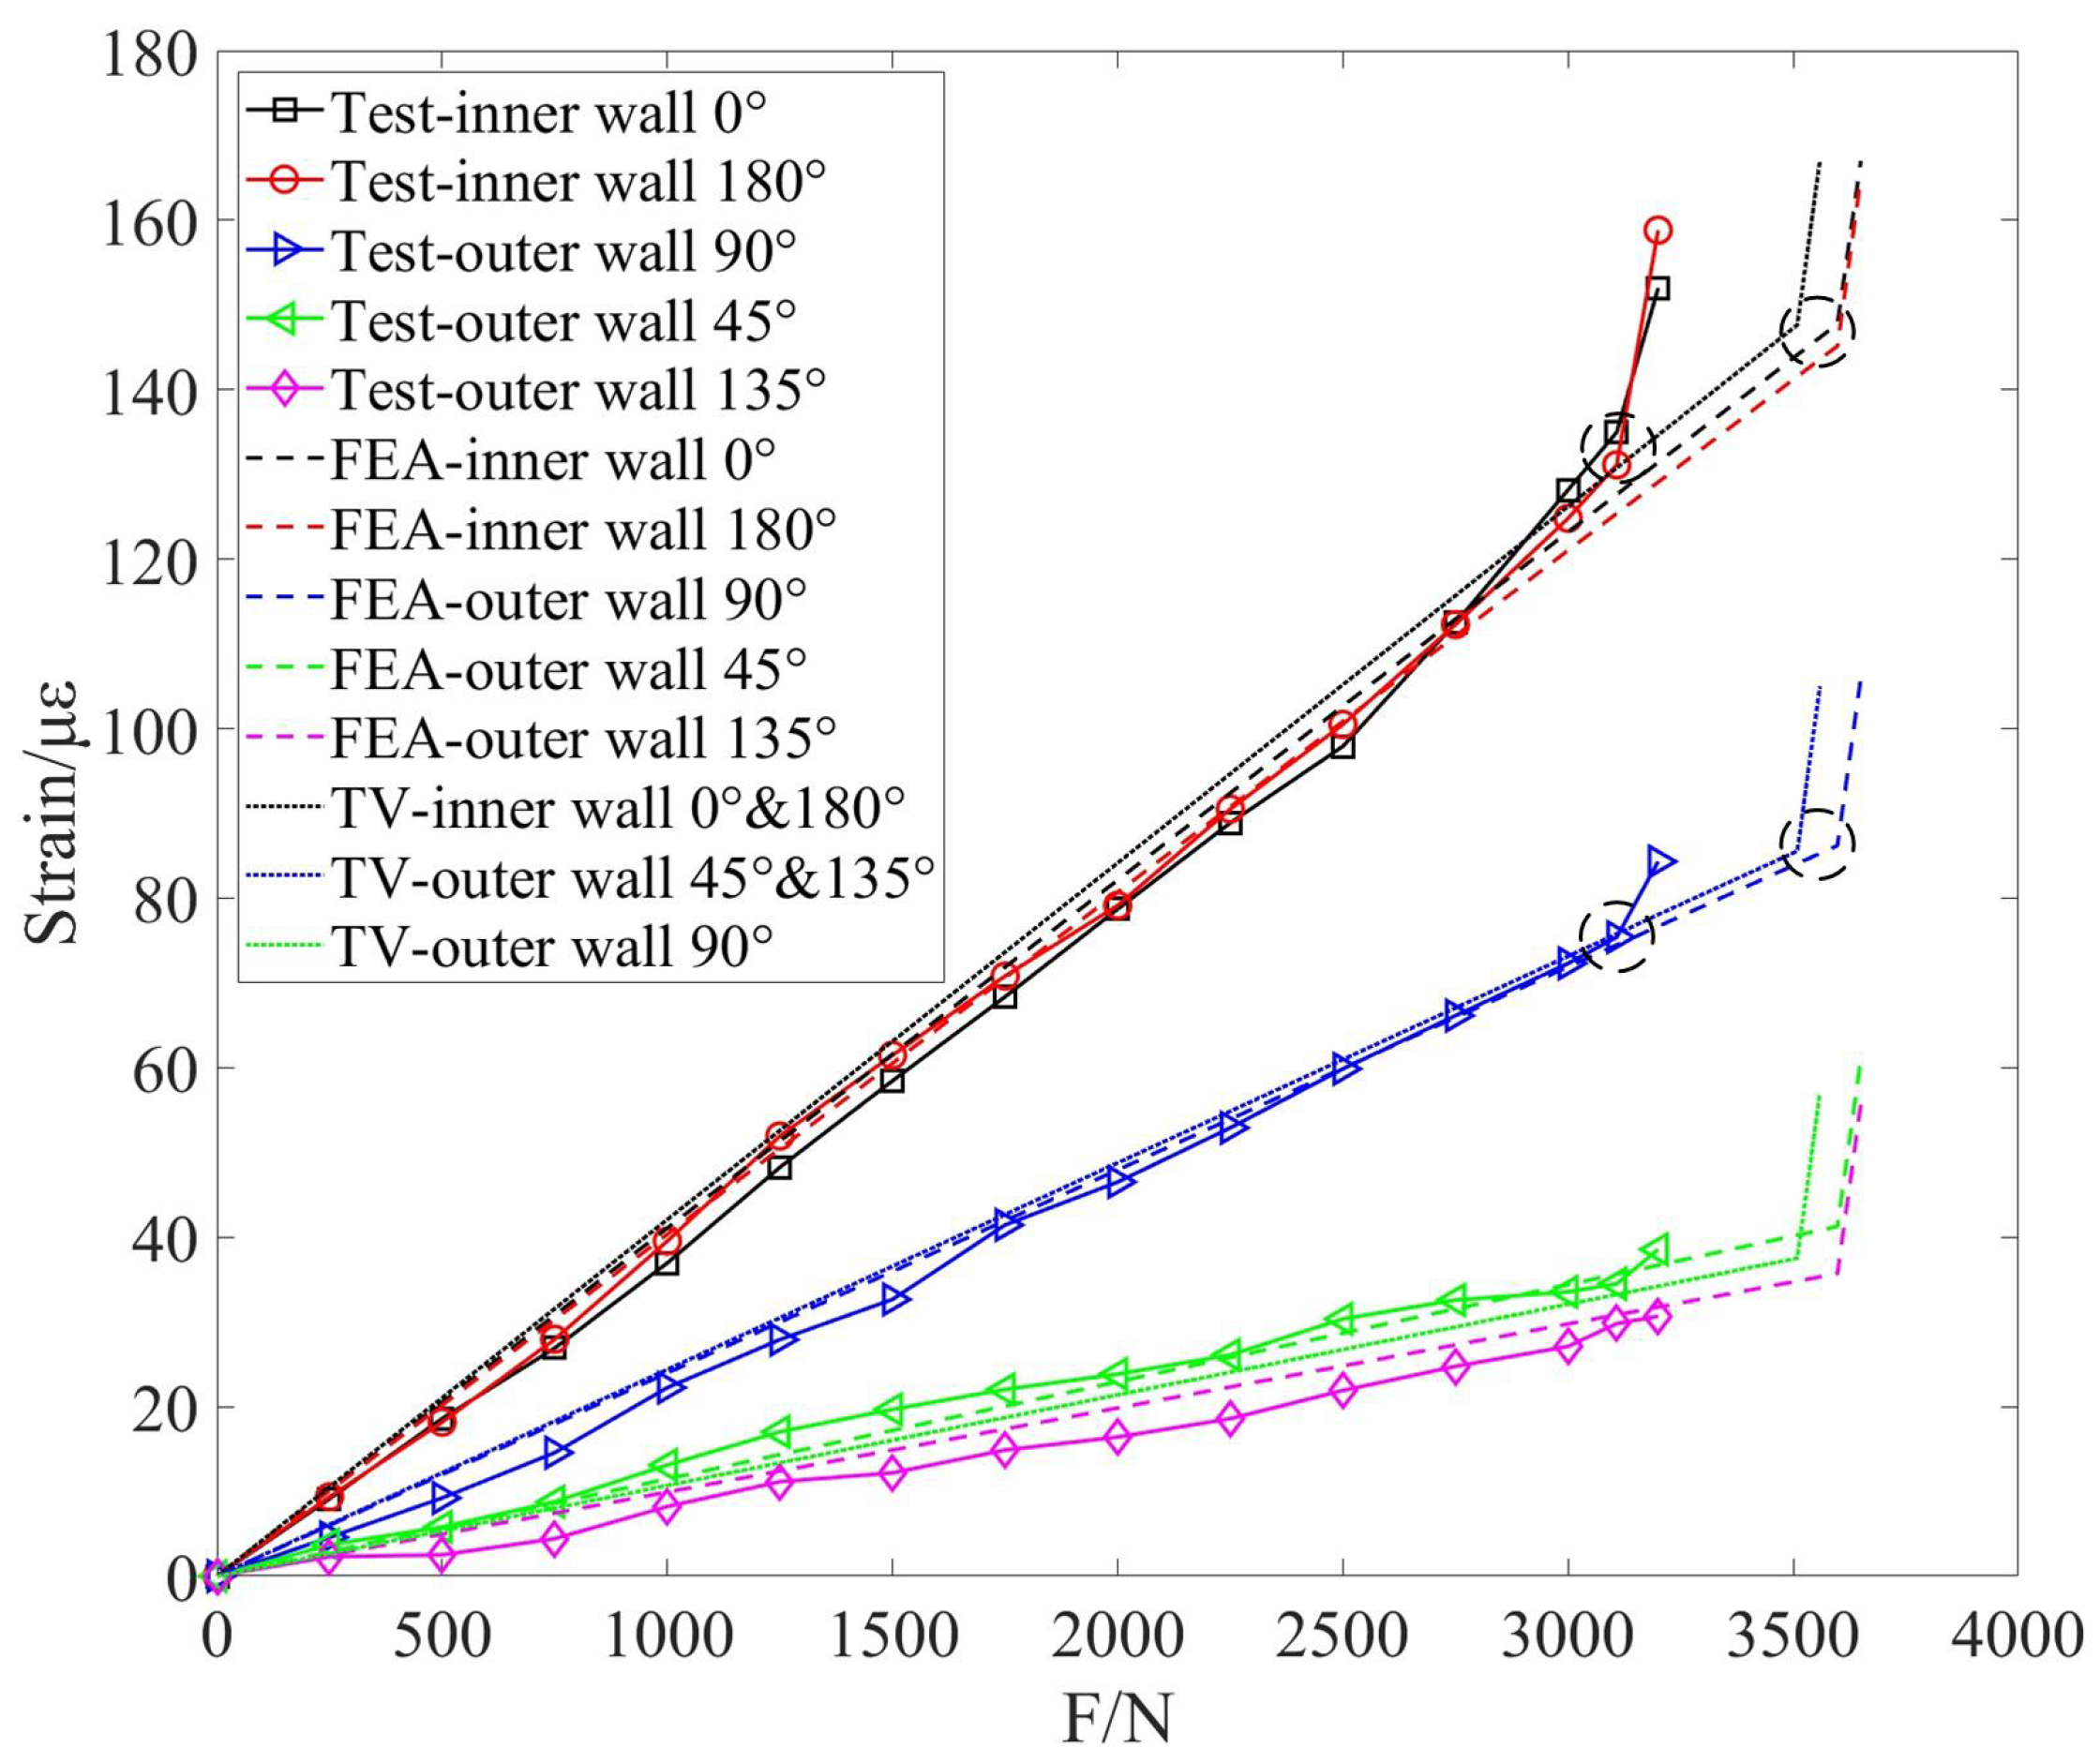
The structural strains at 0°and 180° on the inner wall and 90°, 45° and 135° on the outer wall were extracted by FBG sensor, and the load-strain curve is plotted, as shown in
Figure 8. From the figure, it can be seen that with the gradual increase of pressure load, the strain measured at each measuring point has a linear relationship with the applied load. When the pressure load reaches the limit the structure can withstand, due to the brittleness of the concrete material, the stress concentration areas crack under tensile stress, and the sensor fails [
24].
By inserting the pertinent parameters of the structure into Equation (
2) reveals that the ultimate pressure the structure can withstand is 3509 N, and the theoretical value(CV)-strain curve of the structure is shown in the figure below. The simulated load-strain curve of the structure shows that when the load reaches 3598 N, the strain values at the top and bottom of the inner wall undergo a sudden change, with an error of 2.54%. The measured load-strain curve indicates that a sudden change in strain values at the top and bottom of the inner wall occurs when the load reaches 3108 N; additionally, at a load of 3140 N, the strain values at the 90 ° outer wall also show a sudden change. The results indicate that under external load, the annular structure first fails at the inner wall of the top and bottom, with a failure load of approximately 3200 N and an 8.8% error, which is within an acceptable range considering the actual test conditions. As the load on the annular structure increases, the FBG sensor has a maximum offset at 2500 N with a value of 4.75
and an error of 4.6%.
According to the ultimate bearing capacity of the actual test of the annular concrete member is 3108 N, three different pressure conditions of 0 N, 1500 N, 2000 N and 3000 N are selected for cooling experiment, and 0N is used as the control group.
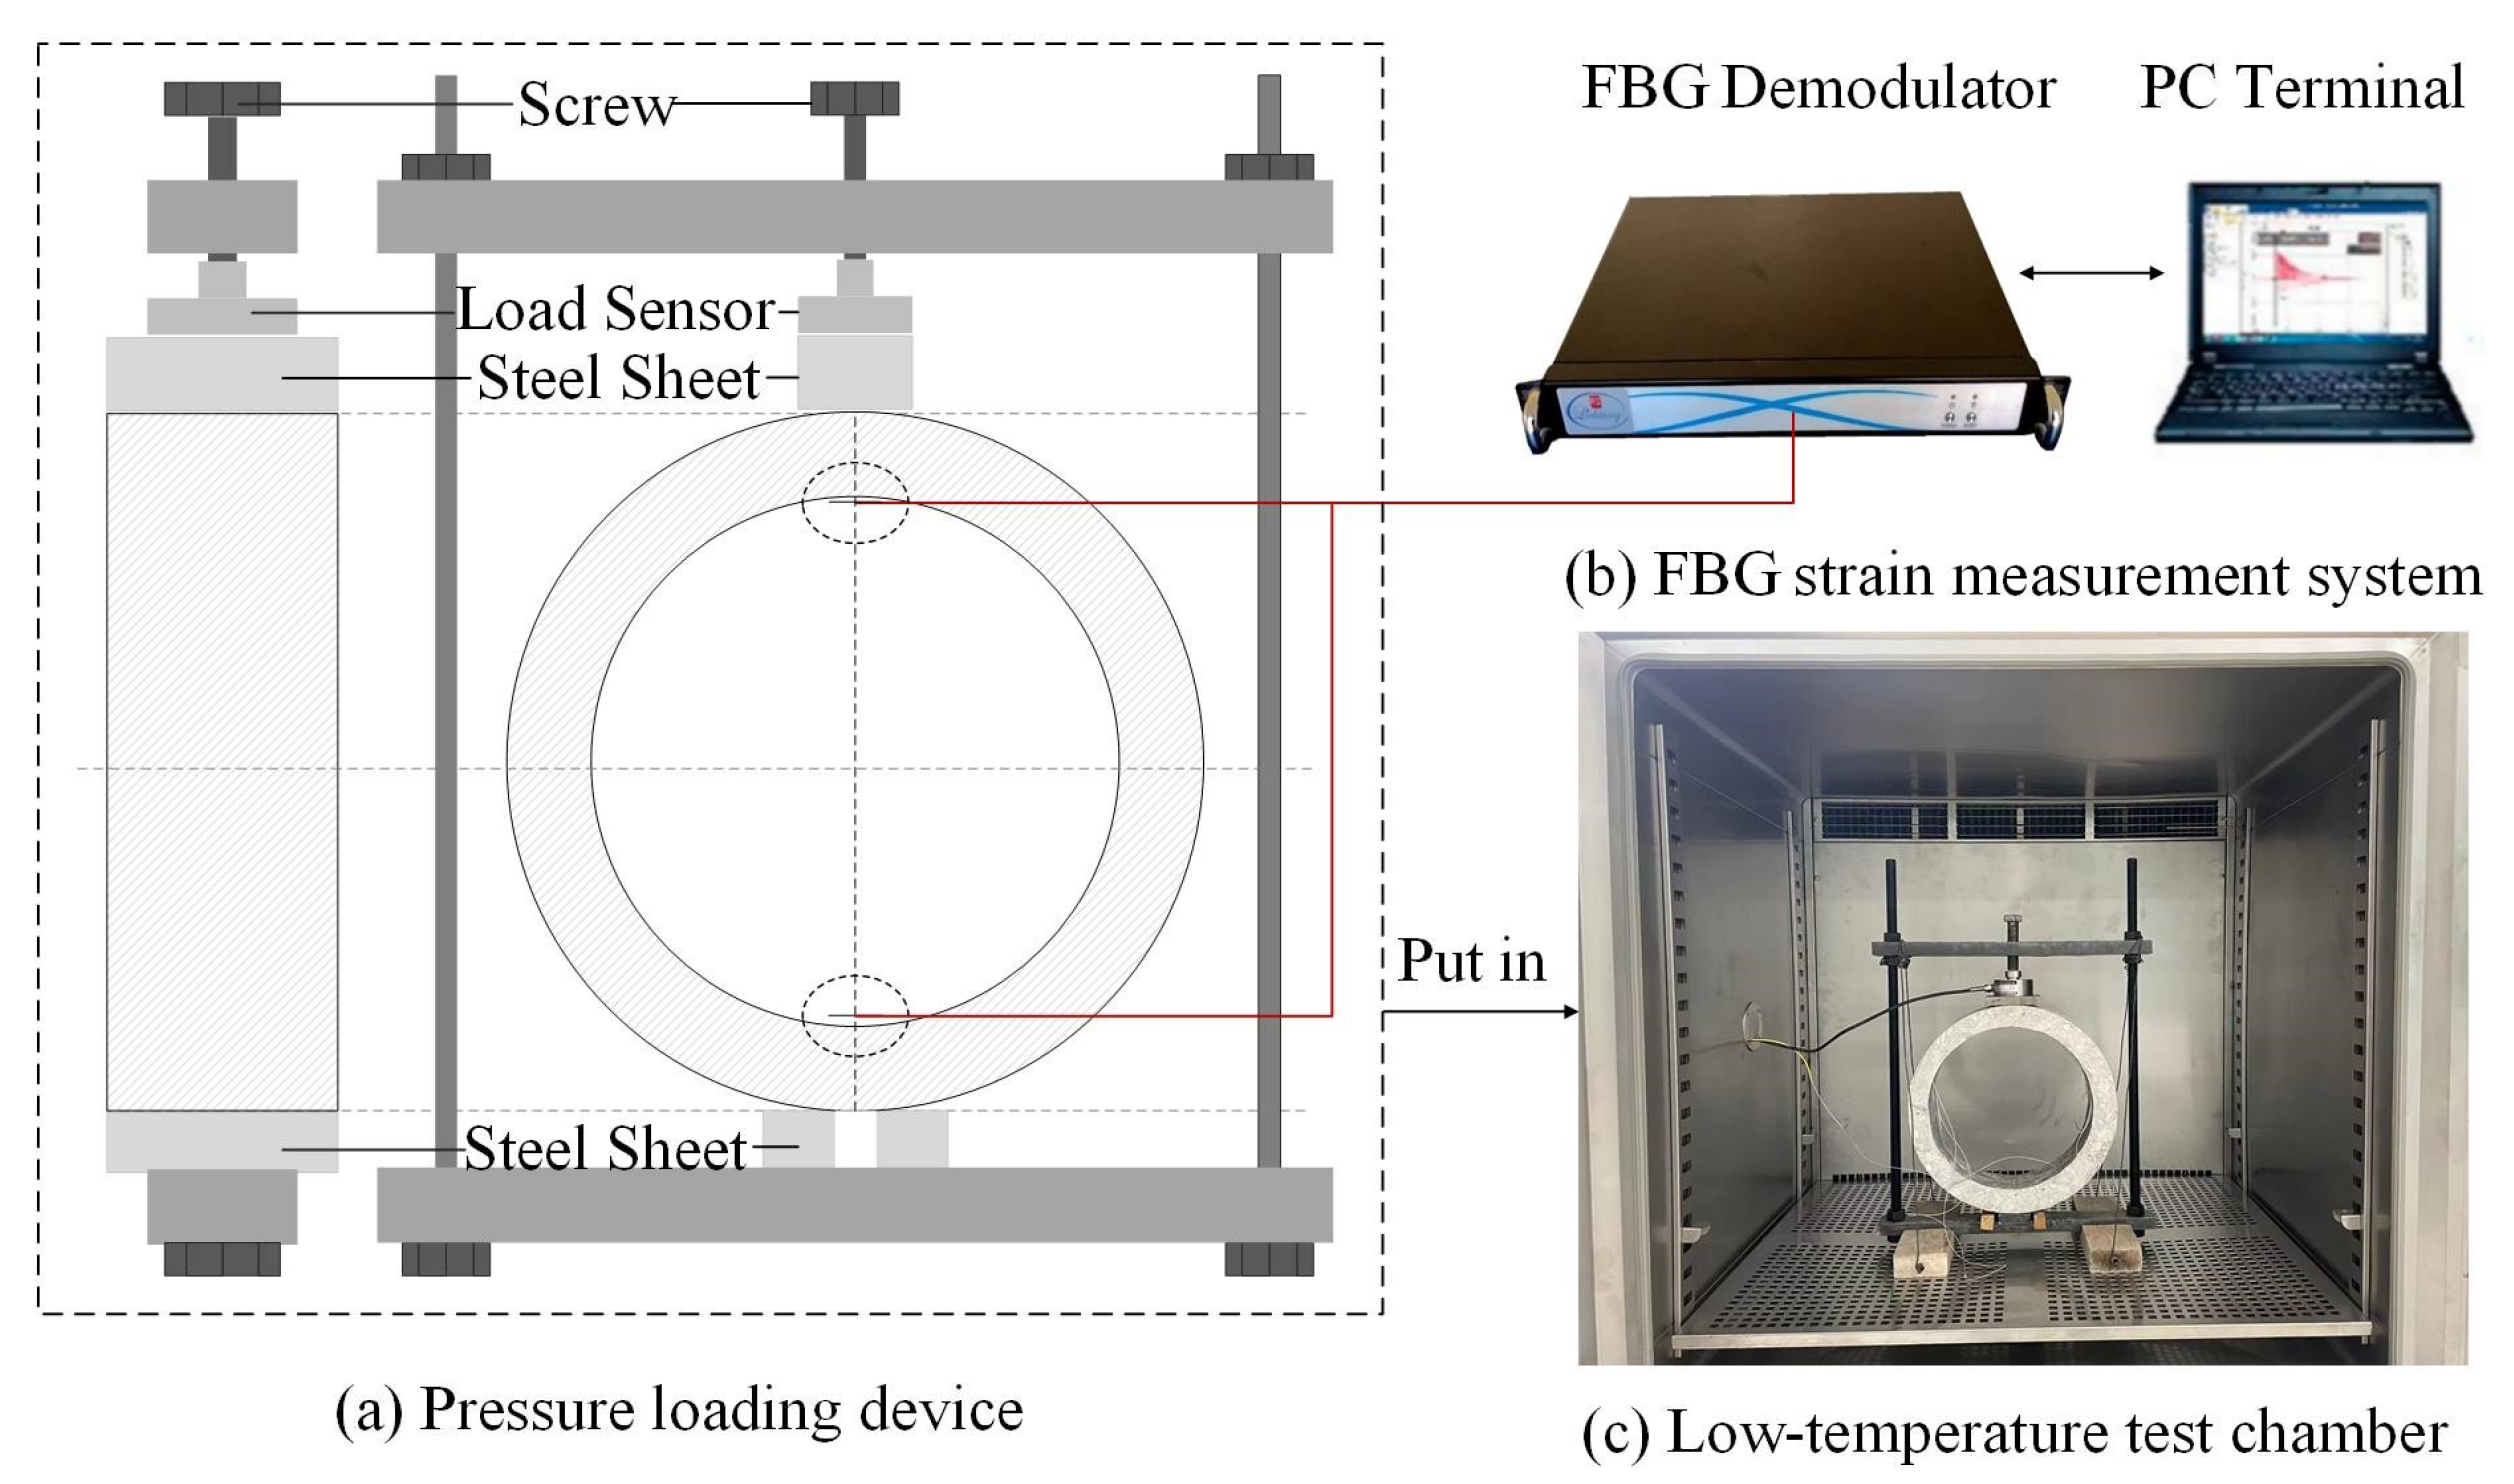
The cooling experimental setup is composed of FBG strain measuring system, displacement loading device and low temperature test chamber, as shown in
Figure 9. The FBG strain sensors are arranged in the inner wall of the arch and the arch bottom, that is, the stress concentration zone of the pressure-constrained annular concrete structure.
The loading device is assembled by combining the load sensor with the reaction device, as shown in
Figure 9a. The pressure load is applied using a screw, which is first transmitted to the load sensor, then to the steel plate and finally to the structure. The load sensor displays the pressure load in real time. Due to the mismatch in thermal expansion coefficient between steel and concrete during gradient cooling, it is necessary to adjust the pressure to keep its value constant. In this case, since the amount of change is small, the applied stress strain in the loading test is taken as the strain generated by the pressure during the cooling experiments. The measurement range of the load sensor is 0 to 5000 N, which is suitable for the experimental temperature, and the accuracy meets the measurement requirements.
Figure 9b shows the FBG strain measurement system. As shown in
Figure 9c, the low temperature test chamber can create 160~−60 °C temperature environment, with an error of ±2 °C. It can perform gradient cooling on the structure, meeting the basic experimental requirements.
After the radial load is applied, the annular concrete structure is gradually cooled in the low temperature test chamber, and the strain changes of the FBG sensor attached to the structure were recorded and analyzed. The design temperature range of the experiment is 20 °C to −40 °C. The temperature started from 20 °C and the gradient cooling amplitude is 10 °C. To cool the concrete completely, it is necessary to stay at each temperature gradient for a period of time, and the recorded FBG wavelength is considered to be valid when it becomes stable at each temperature gradient [
25]. By substituting the wavelength offset value into Equation (
5), the total strain at the test point of the structure can be obtained. Set the tensile strain to positive.
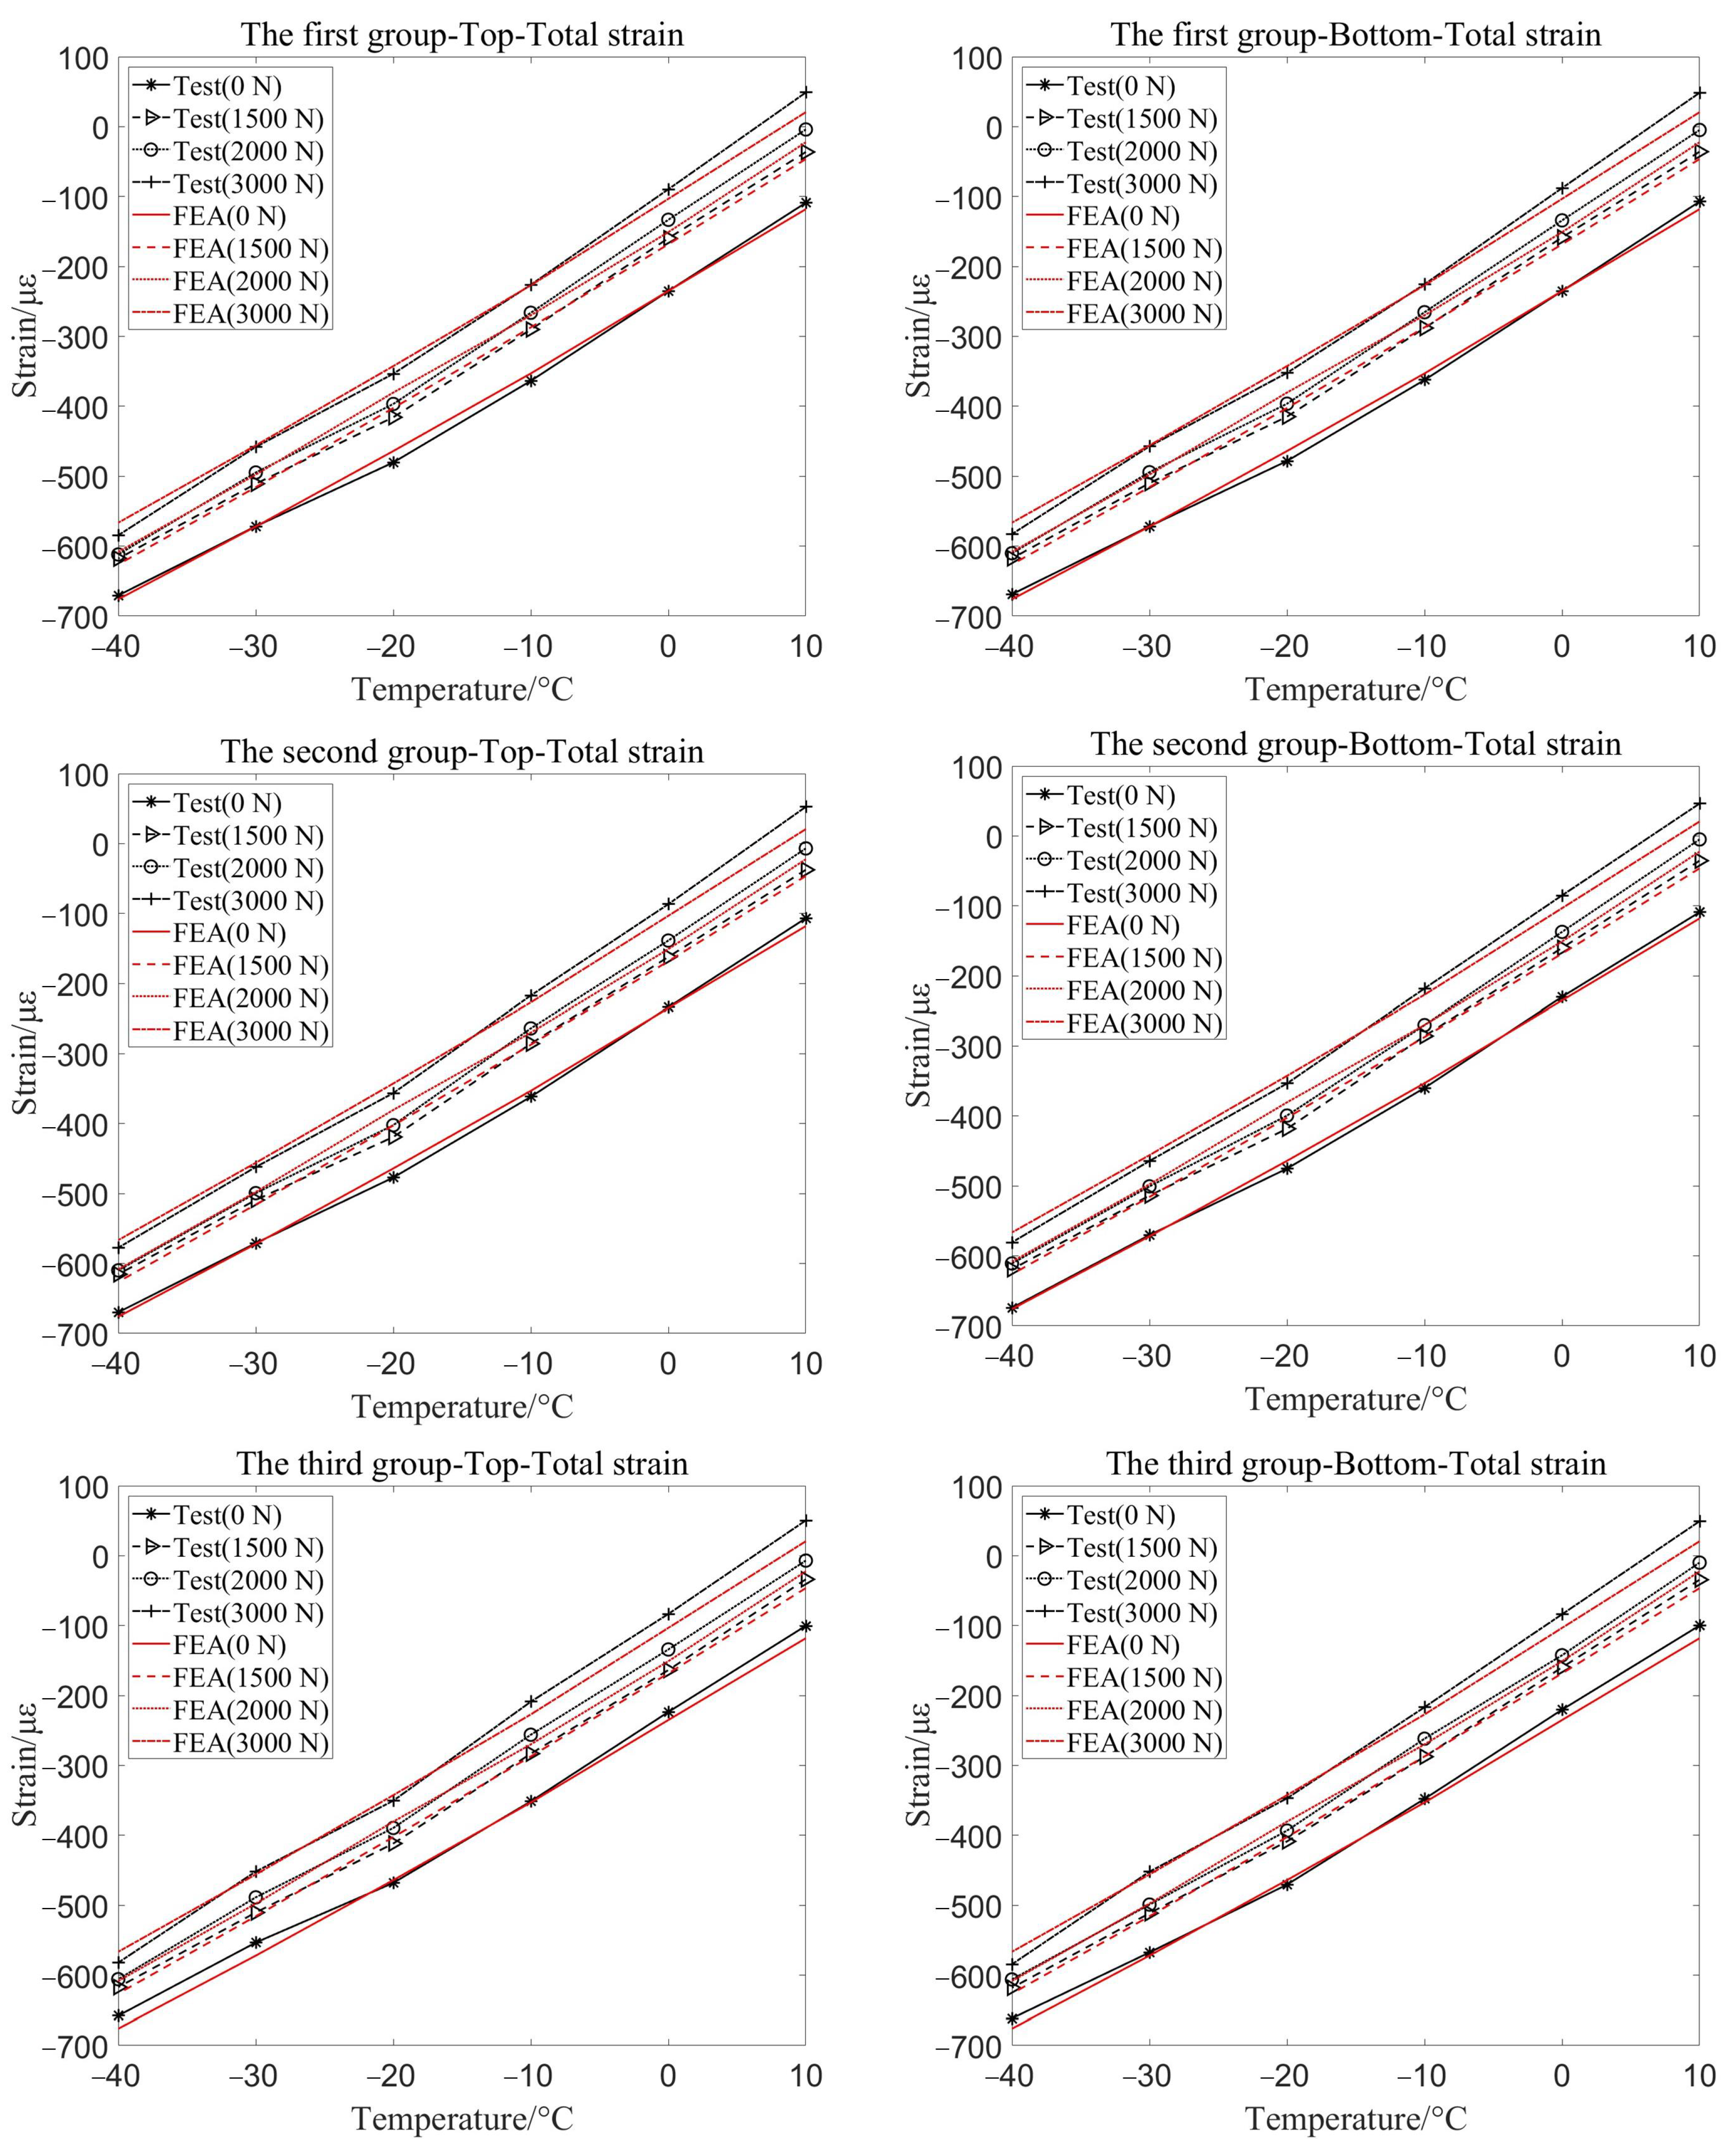
Figure 10 shows the total strain curves of two test points at the top and bottom of the three groups of ring concrete members under different pressure conditions. The red curve is the total strain simulation curve of the two measurement points under different pressure constraints. It can be seen that in the range of 10 °C to −40 °C, the total strain of the component gradually increases with the decrease of temperature. The trend of simulation results is consistent with the measured results.
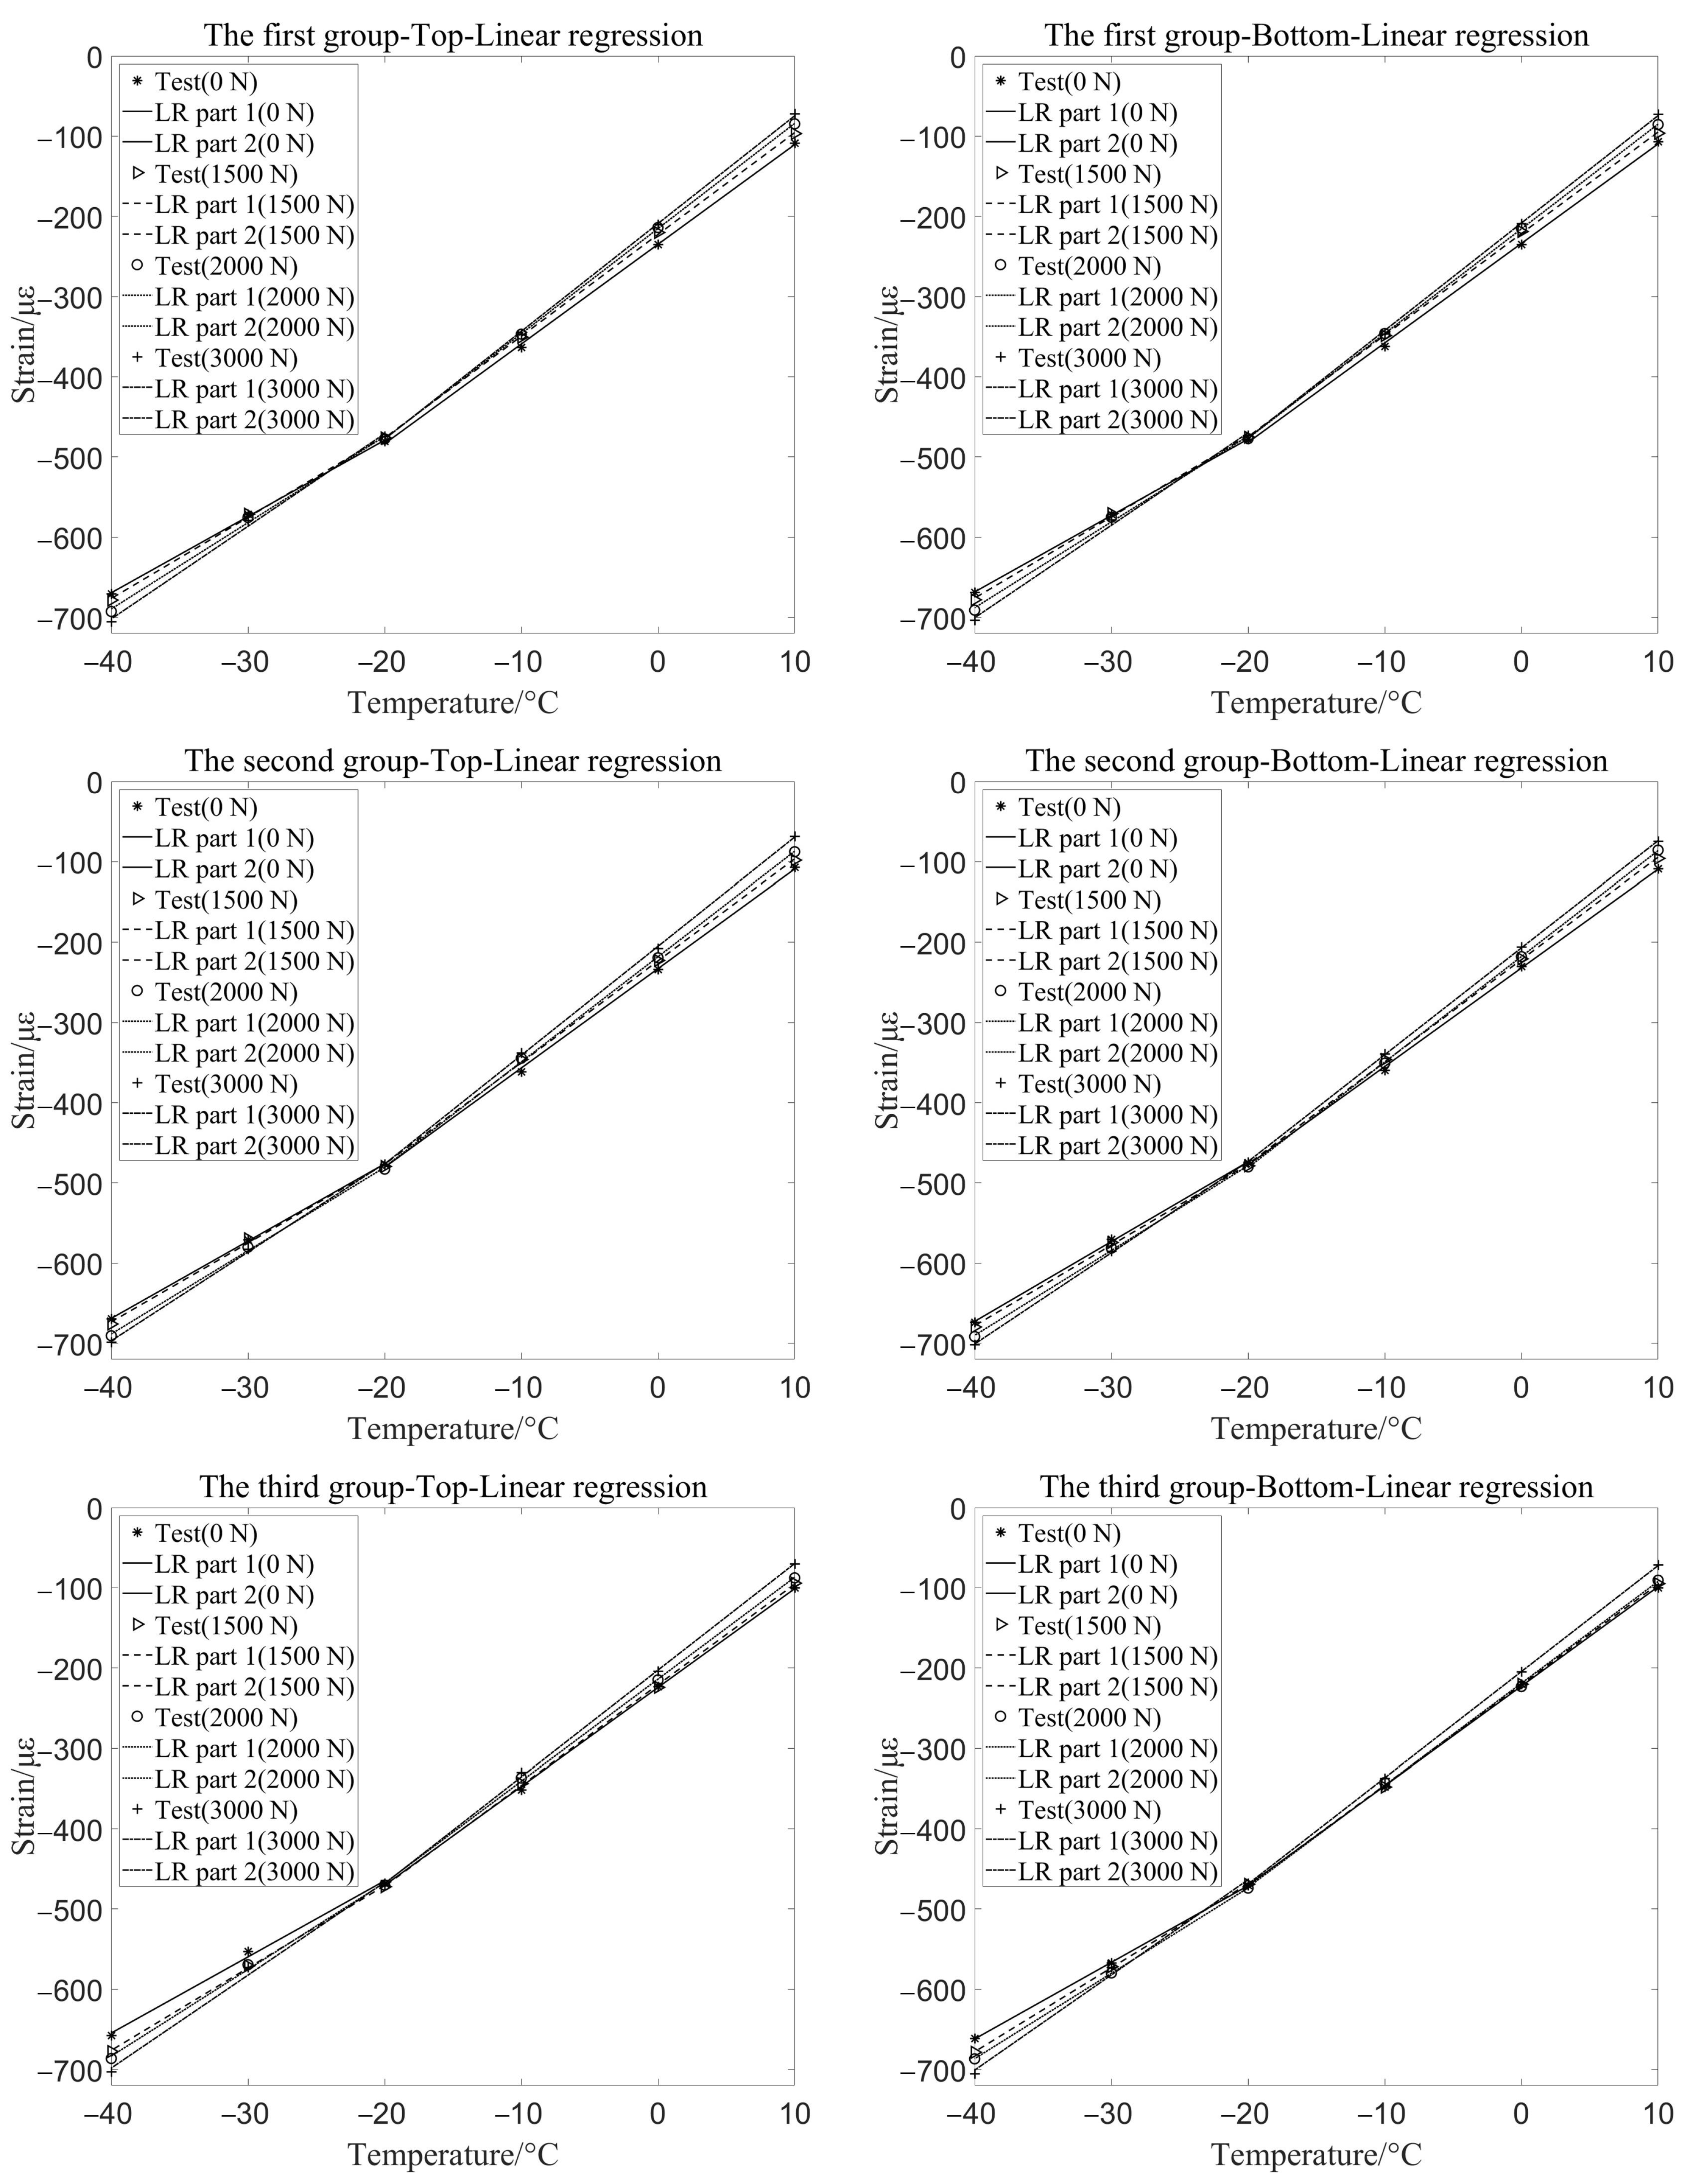
The thermal strain value of the structure under different pressure conditions is obtained by Equation (
5), and the thermal strain of the structure is categorized into two sections for linear sensitivity analysis, as shown in
Figure 11. When the temperature is cooled from 20 °C to −20 °C, the change in thermal strain of the stress constrained structure increases. However, when the temperature is cooled from −20 °C to −40 °C, the change in thermal strain of the stress-constrained structure decreases. This is because as the concrete cools to −20 °C, the water in large pores gradually freezes, and some water enters the fine pores under the action of crystallization pressure, causing the concrete to shrink. When the temperature continues to decrease from −20 °C, the water in the fine pores freezes and expands, leading to slow expansion of the concrete [
26,
27,
28].
The variation of thermal strain sensitivity of the three groups of components is shown in
Table 3.
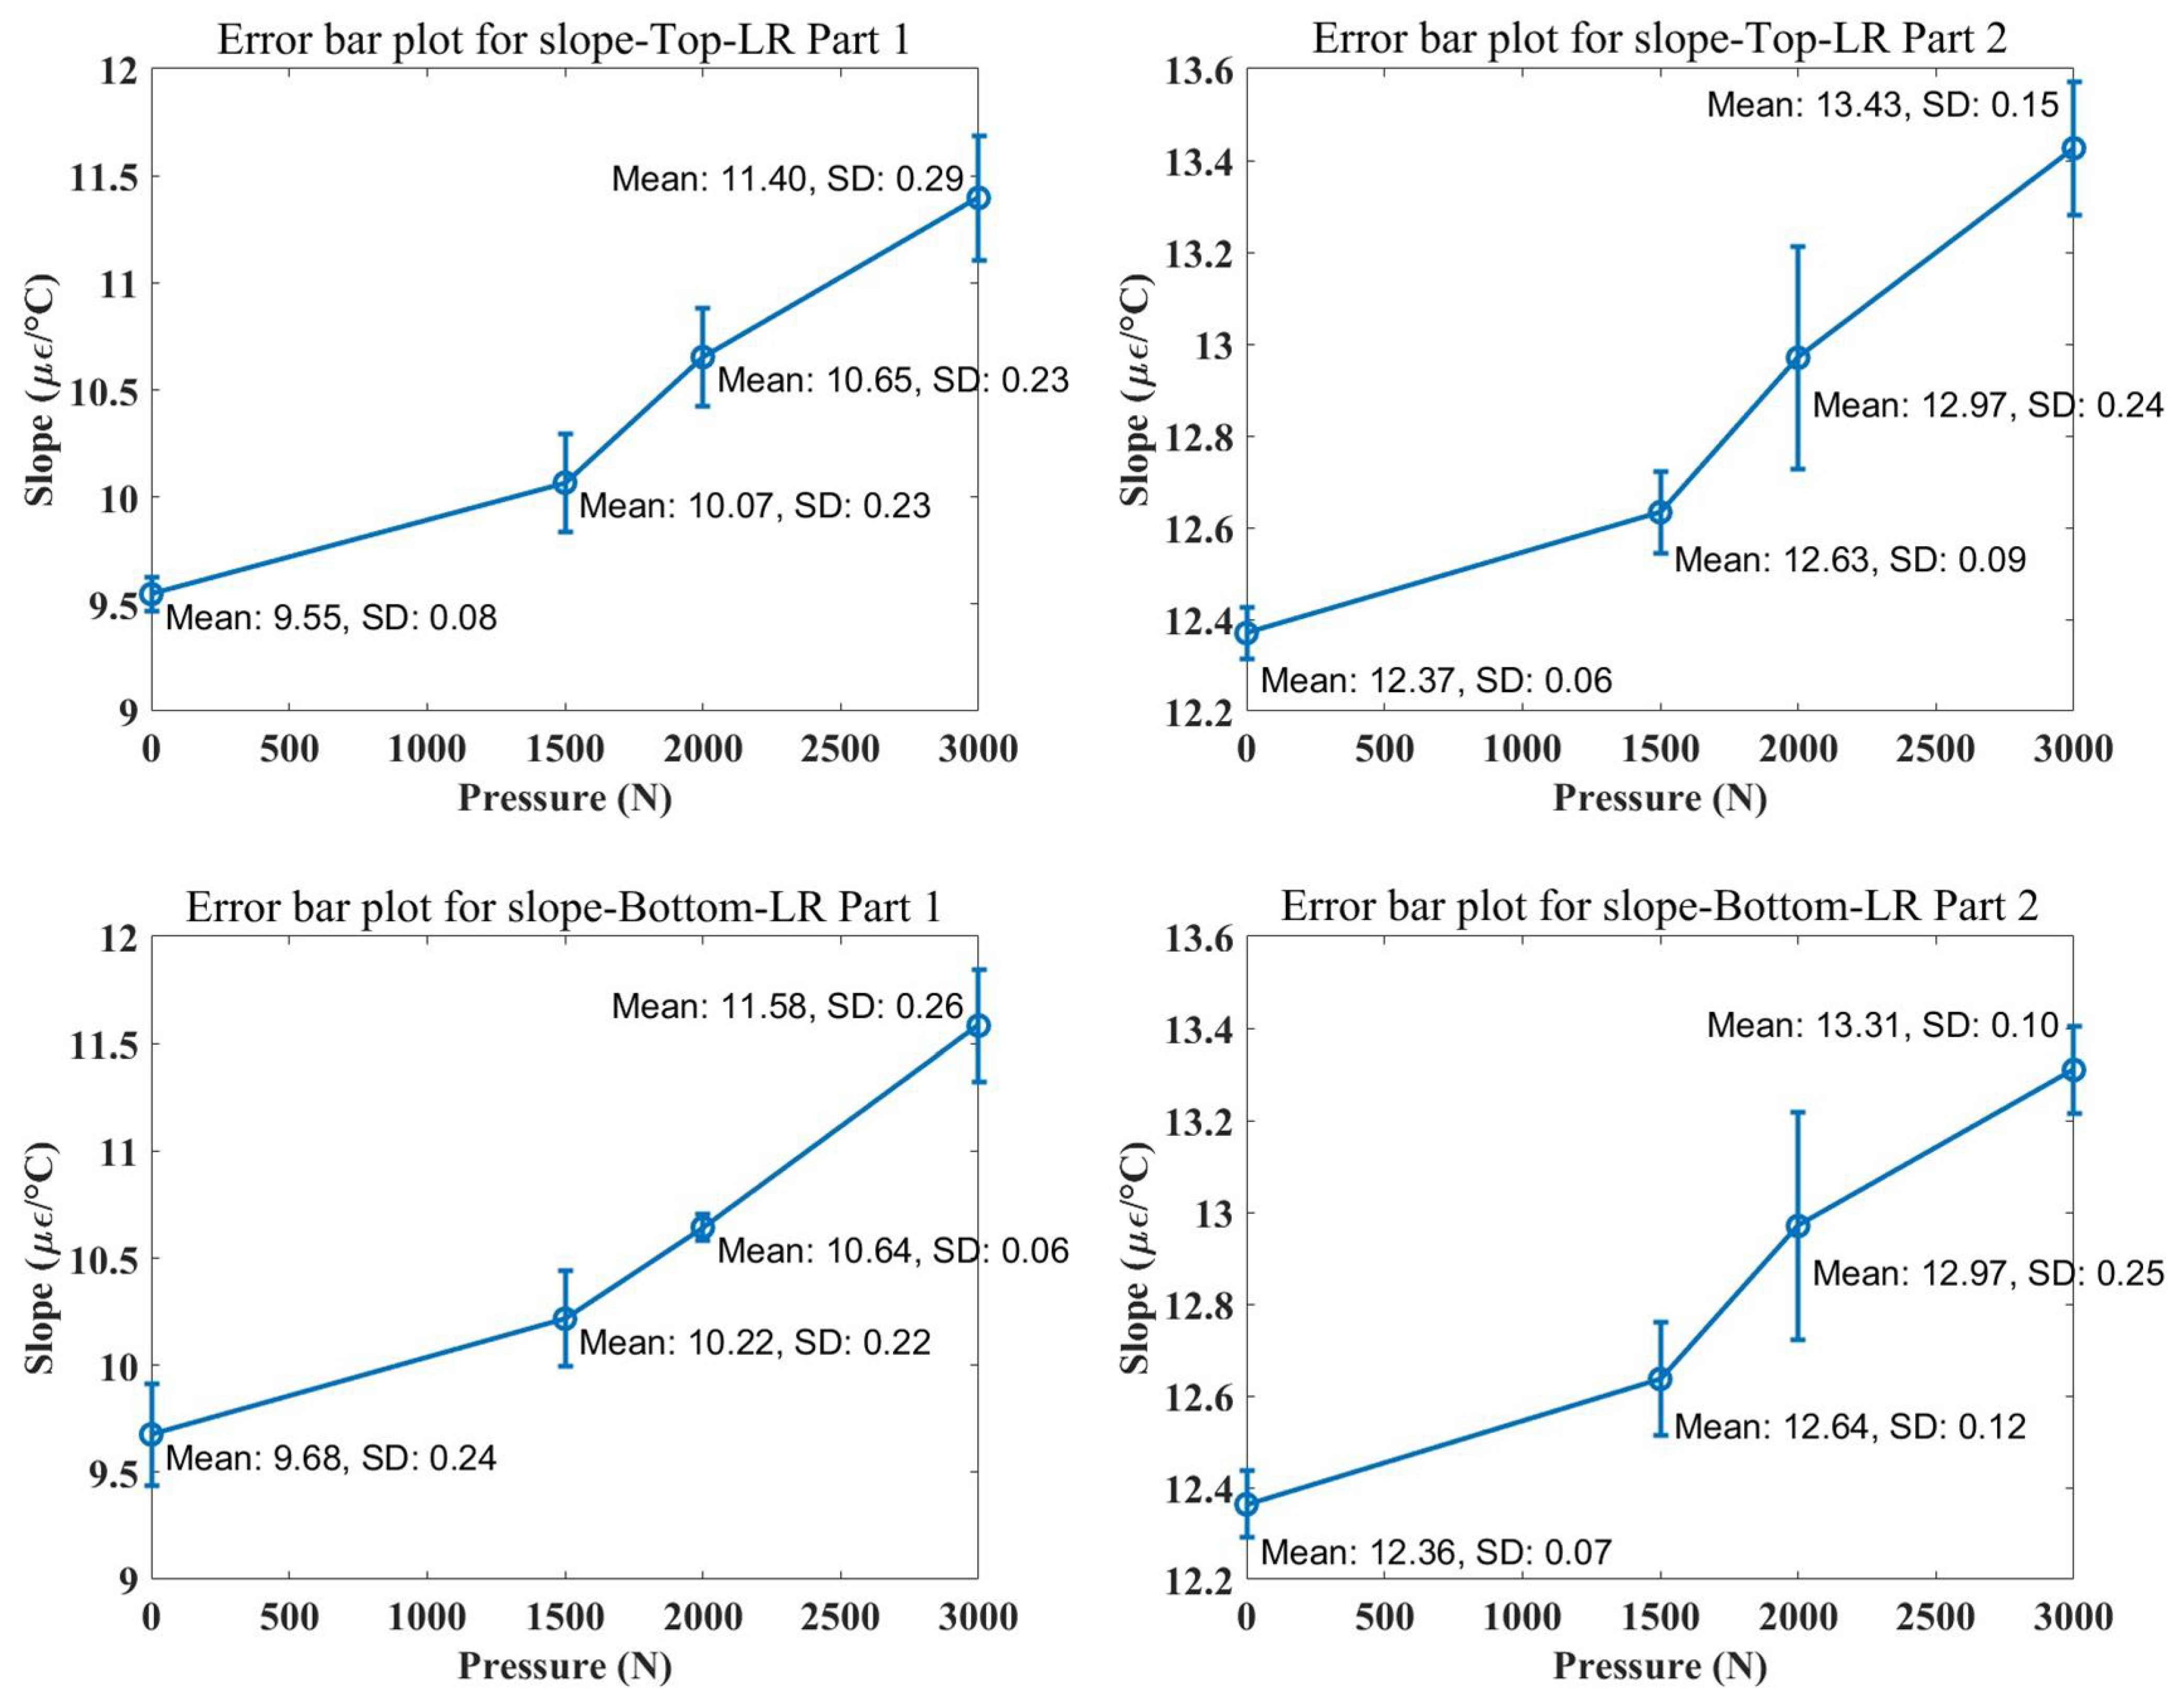
Figure 12 shows the mean and standard deviation of the measured slopes under different pressure conditions (0 N, 1500 N, 2000 N, and 3000 N). Each data point represents the average value from three experimental groups, and the error bars indicate the standard deviation(SD) of the experimental data under each pressure condition. By observing the data in the figure, it can be seen that the slope slightly increases as the pressure increases. The results show that under different pressure conditions, the thermal strain sensitivity of concrete increases with the gradual increase of pressure confinement. It indicates that the greater the pressure, the greater the influence on the cooling process of concrete.
5. Conclutions
In this paper, a detection model was established to measure the structural strain by combining the structural mechanics model and FBG detection technology. The load range before cracking is determined by the performance test. Then, the gradient cooling experiments were conducted under different stress constraints, further revealing the strain patterns of the annular concrete structure under the dual constraints of stress and temperature. By verifying numerical simulations and field experiments, a comprehensive analysis of the annular concrete structure was conducted. The primary conclusions are as follows.
(1) Using the finite element software, the MWC model is selected to establish the thermal coupling model of the annular concrete structure under the constraints of temperature and stress, and the three-dimensional numerical simulation analysis of the annular concrete structure is carried out. The simulation results are analyzed and verified by field experiments, and the established model can effectively predict the test results.
(2) An FBG strain sensor was used to measure the strain of the structure under pressure. When the load reached 3108 N, the ring structure first experienced failure at the top and bottom of the inner wall, followed by the outer wall at the waist of the structure, with a failure load of approximately 3200 N, representing an 8.8% error. As the load on the structure increased, the FBG sensor showed a maximum offset at 2500 N with a value of 4.75 and an error of 4.6%.
(3) In the temperature range from 20 °C to −40 °C, the total strain of the concrete structure increases as the temperature decreases. When the temperature is cooled from 20 °C to −20 °C, the change in thermal strain of the stress constrained structure increases. When the temperature is cooled from −20 °C to −40 °C, the change in thermal strain of the stress-constrained structure decreases. The thermal strain amplitude of the concrete shows a significant turning point under the temperature gradient.
(4) under different pressure conditions, the thermal strain sensitivity of concrete increases with the gradual increase of pressure confinement, that is, the greater the pressure, the greater the influence on the cooling process of concrete.
This method provides a comprehensive evaluation of the thermodynamic behavior of annular concrete structures under different stress and temperature conditions, that is, with the decrease of temperature, the strain of annular concrete structures gradually increases, and the thermal strain amplitude shows an obvious inflection point. The thermal strain sensitivity of the structure increases with the gradual increase of pressure constraint, and the cooling process is significantly affected by pressure. The findings provide basis and methodological support for the reliability assessment of concrete structures in cold environments.
However, there are limitations to the study. The method used in this study is suitable for the analysis of mechanical properties of radially compressed annular concrete structures under low temperature conditions, such as secondary tunnel linings and pipelines. It is not applicable to the case that the structure is subjected to external pressure and internal force compression at the same time, or the stretching or compression perpendicular to the direction of the ring structure. Further studies can focus on more complex loading conditions, including simultaneous external pressures and internal forces, as well as studying the long-term effects of repeated thermal cycling on annular concrete.


