Article

Experimental Investigation on the Tensile Mechanical Behavior of Layered Shale Using Direct and Indirect Test Methods

1
State Key Laboratory of Oil and Gas Reservoir Geology and Exploitation, Southwest Petroleum University, Chengdu 610500, China
2
School of Earth and Space Sciences, University of Science and Technology of China, Hefei 230026, China
*
Author to whom correspondence should be addressed.
Appl. Sci. 2025, 15(5), 2669; https://doi.org/10.3390/app15052669
Submission received: 31 January 2025 / Revised: 27 February 2025 / Accepted: 28 February 2025 / Published: 1 March 2025

Abstract

:
An accurate understanding of the tensile mechanical behavior of shale rock is essential for optimizing shale gas drilling and hydraulic fracturing operations. However, the mechanical behavior of shale is significantly influenced by its anisotropy. Therefore, this study investigated the tensile mechanical behavior of layered shale by combining acoustic emission (AE) monitoring with two testing methods: the Brazilian splitting test (BST) and a novel direct tensile test (DTT). The impact of anisotropy on the tensile mechanical behavior and failure modes of layered shale under different test methods was evaluated. Additionally, seven anisotropic tensile strength criteria were compared and validated using the experimental results. The results show that: (1) As the loading angle (β) increased, the tensile strength measured by both BST and DTT increased. Both methods exhibited maximum tensile strength at β = 90° and minimum tensile strength at β = 0°. The anisotropy ratios for BST and DTT were 1.52 and 2.36, respectively, indicating the significant influence of the loading angle on tensile strength. (2) The AE results indicated that both DTT and BST specimens exhibited brittle failure characteristics. However, the DTT specimens demonstrated more pronounced progressive failure behavior, with failure modes categorized into four types: tensile failure across the bedding plane, shear failure along the bedding plane, and two types of tensile–shear mixed failure. In contrast, the BST specimens primarily exhibited tensile–shear mixed failure, except for tensile failure along the bedding plane at β = 0° and tensile failure across the bedding plane at β = 90°. (3) Neither of the two test methods could fully eliminate the influence of anisotropy, but three anisotropic tensile criteria, the Lee–Pietruszczak criterion, the critical plane approach criterion, and the anisotropic mode I fracture toughness criterion based on the stress–strain transformation rule demonstrated high accuracy in predicting tensile strength. Furthermore, in alignment with previous studies, the indirect tensile strength of various rock types was found to range between one and three times the direct tensile strength, and a linear correlation between the two variables was established, with a coefficient of approximately 1.11.

1. Introduction

Due to the growing energy demand, unconventional oil and gas resources, such as shale gas, have become pivotal in the energy supply landscape [1,2]. The combination of horizontal well technology and hydraulic fracturing represents a significant advancement in the efficient development of shale gas [3]. However, due to their unique sedimentary environment and geological processes, shales exhibit significant anisotropic characteristics [4,5,6,7]. Among these, the anisotropic tensile mechanical behavior of shale has a significant impact on fracture pressure analysis during drilling and is closely related to fracture initiation and propagation during the reconstruction of reservoirs [8,9,10,11,12]. The bedding strength is obviously smaller than that of matrix. On the one hand, it affects the initiation and propagation behavior of induced fractures near wellbore wall, resulting in induced fracture lost circulation, which seriously affects drilling safety and cost. On the other hand, the bedding plane may capture hydraulic fractures and influence their direction of fracture propagation. Consequently, a comprehensive understanding of the anisotropic tensile mechanical behavior of shale is crucial for the exploration and development of underground shale oil and gas.
Tensile strength is a crucial mechanical property of layered rocks. Currently, two primary methodologies are employed to test rock tensile strength: the direct tensile test (DTT) and the indirect tensile test [13]. Among these methods, the Brazilian splitting test (BST) has gained widespread popularity for indirect tensile strength testing due to its simplicity in specimen preparation and cost-effectiveness [14]. However, discrepancies often arise between the tensile strengths of the same rock measured by these two methods [15]. These variations become even more pronounced when anisotropy is considered. For instance, Tan et al. [16] conducted BST on Mosel slate, investigating the influence of anisotropy on tensile mechanical behavior. They combined the discrete element method to analyze the effects of microparameters on the bearing capacity and failure modes of Brazilian disk specimens. Similarly, Zhong et al. [17] conducted BST on layered limestone at various loading angles, incorporating acoustic emission (AE) to study the relationship between tensile strength, tensile modulus, and loading angle. Based on their findings, they classified failure modes into three categories: “perpendicular splitting” in a roughly straight shape, “shear splitting” in an arc shape, and “parallel splitting” in a smoothly straight shape.
Anisotropy also plays a significant role in direct tensile tests. Li et al. [18] conducted DTT on marine shale to investigate the impact of anisotropy. Their results showed that tensile strengths varied between 1.5 and 9.5 MPa across different loading angles, demonstrating strong anisotropic behavior of marine shale. Additionally, the failure modes varied significantly with anisotropy and were categorized into four types: tapered head failure, planar tensile failure, layer activation failure, and mixed-mode failure across bedding planes. Similarly, Liu et al. [19] performed DTT on Kangding slate at five loading angles, integrating AE and the finite–discrete element method to reveal an S-shaped relationship between direct tensile strength and loading angle, and the observed failure modes were classified into three categories: layer activation failure, mixed failure, and rock matrix failure.
While both direct and indirect tensile tests can provide insights into the anisotropic tensile behavior of rocks, a notable discrepancy exists between the tensile strengths measured by these two methods [20,21]. Generally, the indirect tensile strength obtained from Brazilian disk specimens is higher than the direct tensile strength due to factors such as stress concentration [22]. Moreover, anisotropy significantly influences both indirect and direct tensile tests, as well as the tensile mechanical behavior of rocks. Currently, the effect of anisotropy on the indirect tensile behavior of rocks has been extensively studied, but the direct tensile behavior remains incompletely understood. Furthermore, the influence of anisotropy on rock tensile behavior is not consistent, and the differences between direct and indirect tensile strengths have seldom been systematically examined. To address these research gaps, we conducted the Brazilian splitting test (BST) and a novel direct tensile test (DTT) proposed by Liu et al. [23] on Longmaxi layered shale under various loading angles, combined with acoustic emission (AE) monitoring. This study aimed to clarify the impact of anisotropy on the direct and indirect tensile strengths and failure modes of layered shale, while also examining the discrepancies between direct and indirect tensile strengths across different rock types. The findings of this research are intended to establish a theoretical foundation and provide practical insights for addressing engineering challenges, such as wellbore stability and hydraulic fracturing in anisotropic formations.

2. Experimental Methodology

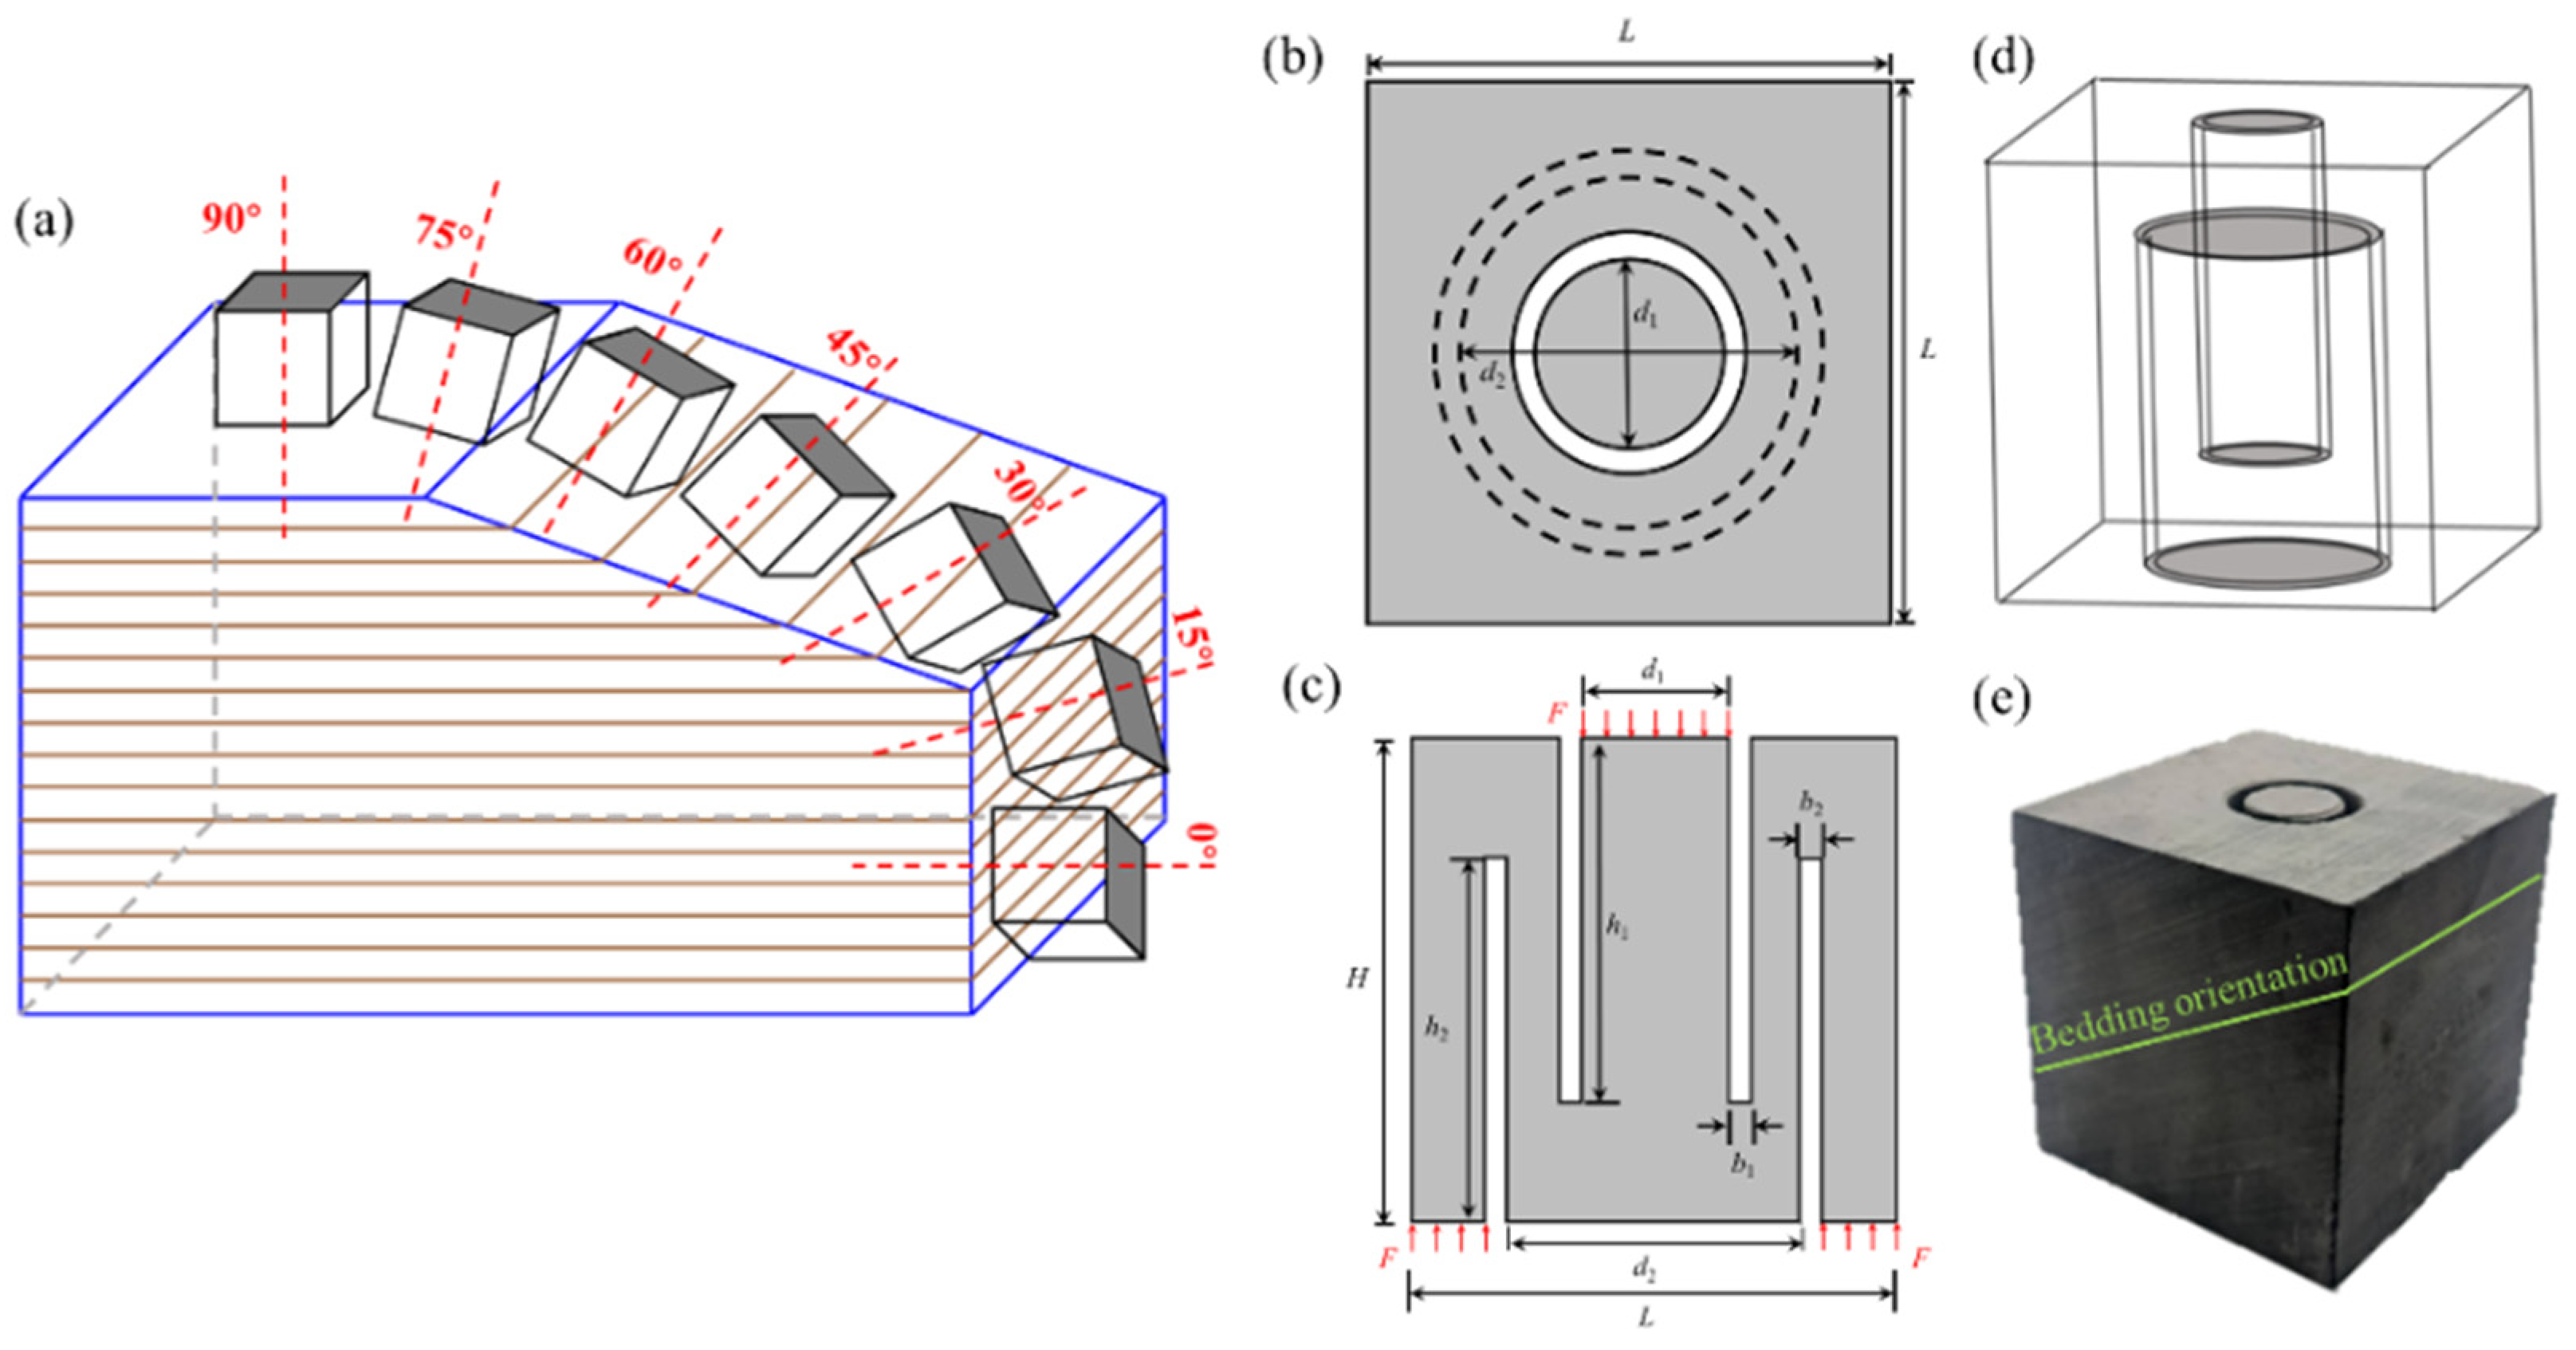
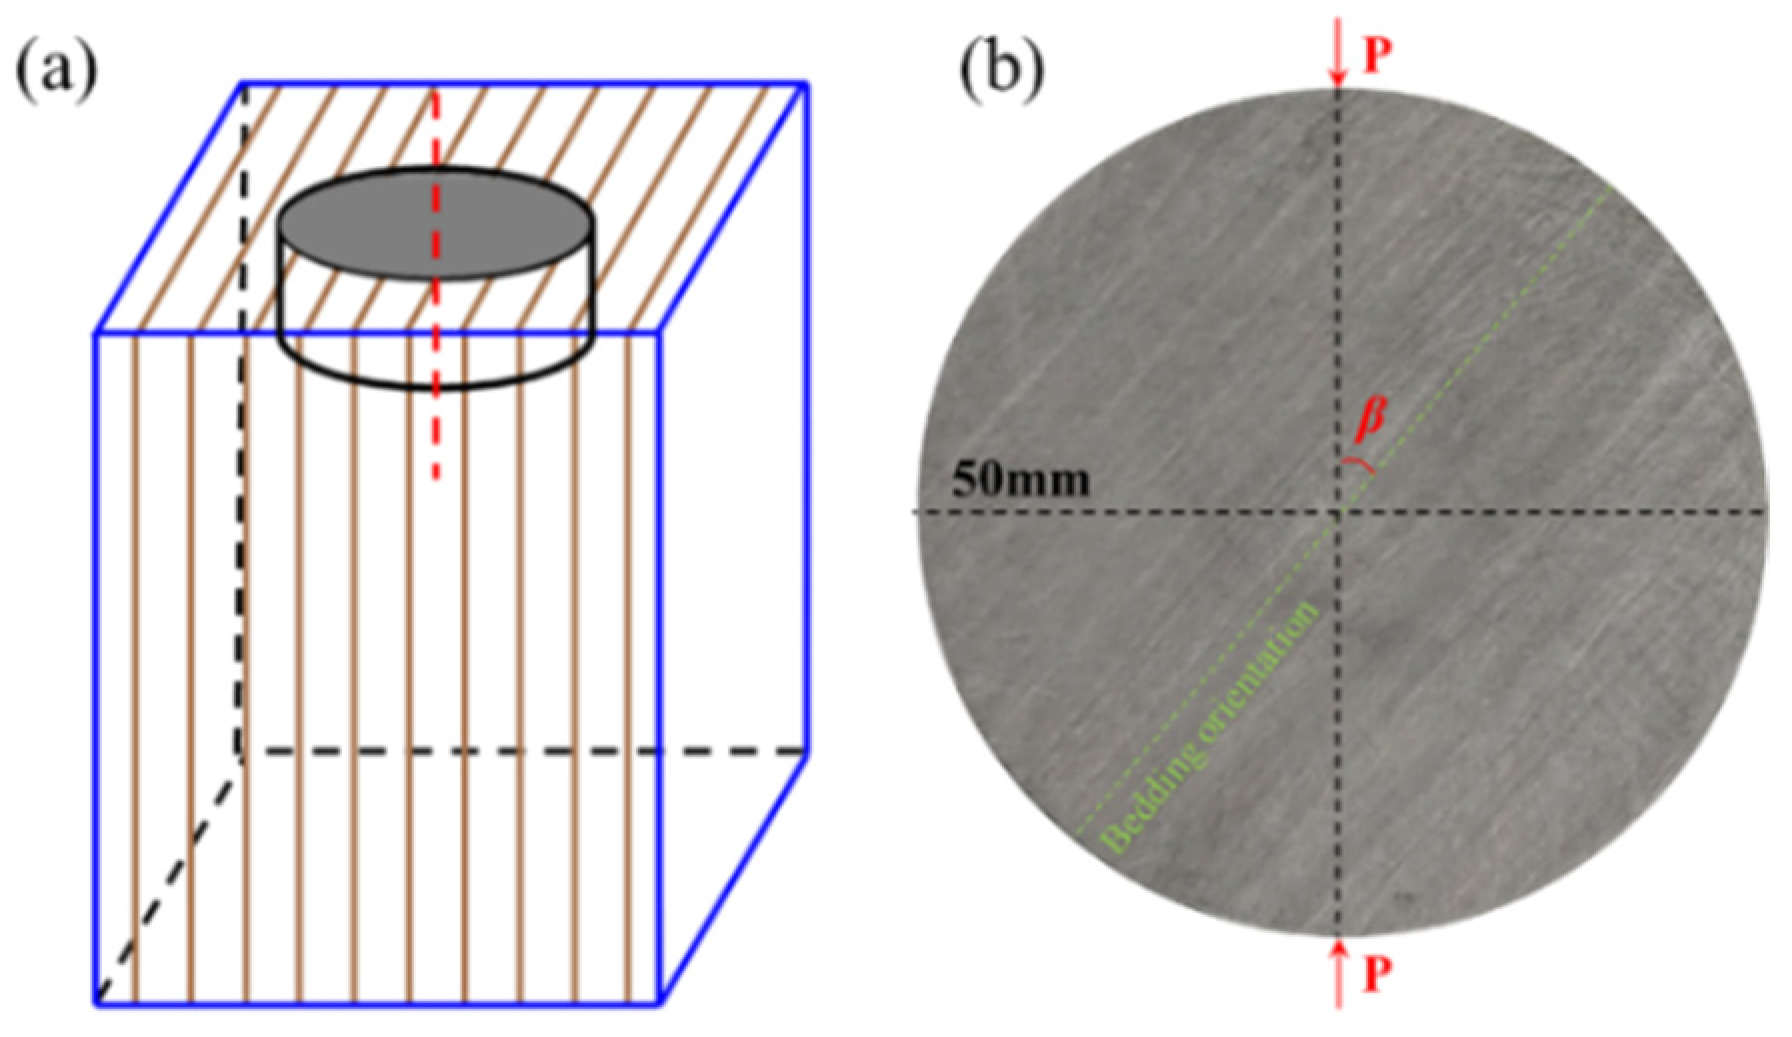
2.1. Specimen Preparation

Test specimens were all collected from the Longmaxi shale in Lujiao Town, Pengshui County, Chongqing, China and from the same depth. This black carbonaceous shale is characterized by well-defined bedding planes and has a density of approximately 2300 kg/m3. The results of the X-ray diffraction and scanning electron microscopy analyses indicated a high quartz content (52.68%) and the presence of clay minerals (29.53%) [6].
For the DTT specimens, 100 mm cube samples were drilled at angles of 0°, 15°, 30°, 45°, 60°, 75°, and 90° relative to the bedding orientation, as shown in Figure 1a. Two coaxial annular slots were then carefully drilled at the top and bottom ends of each specimen. The diameter and depth of the inner annular slot at the upper end were designated as d1 and h1, respectively, while the diameter and depth of the outer annular slot at the lower end were designated as d2 and h2, respectively. The distance between the two coaxial annular slots was denoted as b1 and b2, as shown in Figure 1b,c. The final prepared specimen is illustrated in Figure 1e. The above geometric parameters were as follows: H = L= 100 mm, d1 = 25 mm, d2 = 50 mm, b1 = b2 = 5 mm, and h1 = h2 = 70 mm. For the BST specimen, Brazilian disks with a diameter (B) of 50 mm and a thickness (t) of 25 mm were drilled parallel to the bedding orientation, adhering strictly to the recommendations of the International Society of Rock Mechanics, as shown in Figure 2a. A typical BST specimen was illustrated in Figure 2b. For DTT and BST, to mitigate hydration-induced damage in shale, the dry-air suction coring technique was implemented for core specimen retrieval. The loading angles for both tests were set at 0°, 15°, 30°, 45°, 60°, 75°, and 90°, respectively. The DTT specimens were prepared in one group (total 7 specimens), while the BST specimens were prepared in two groups (total 14 specimens), with each group consisting of seven specimens.

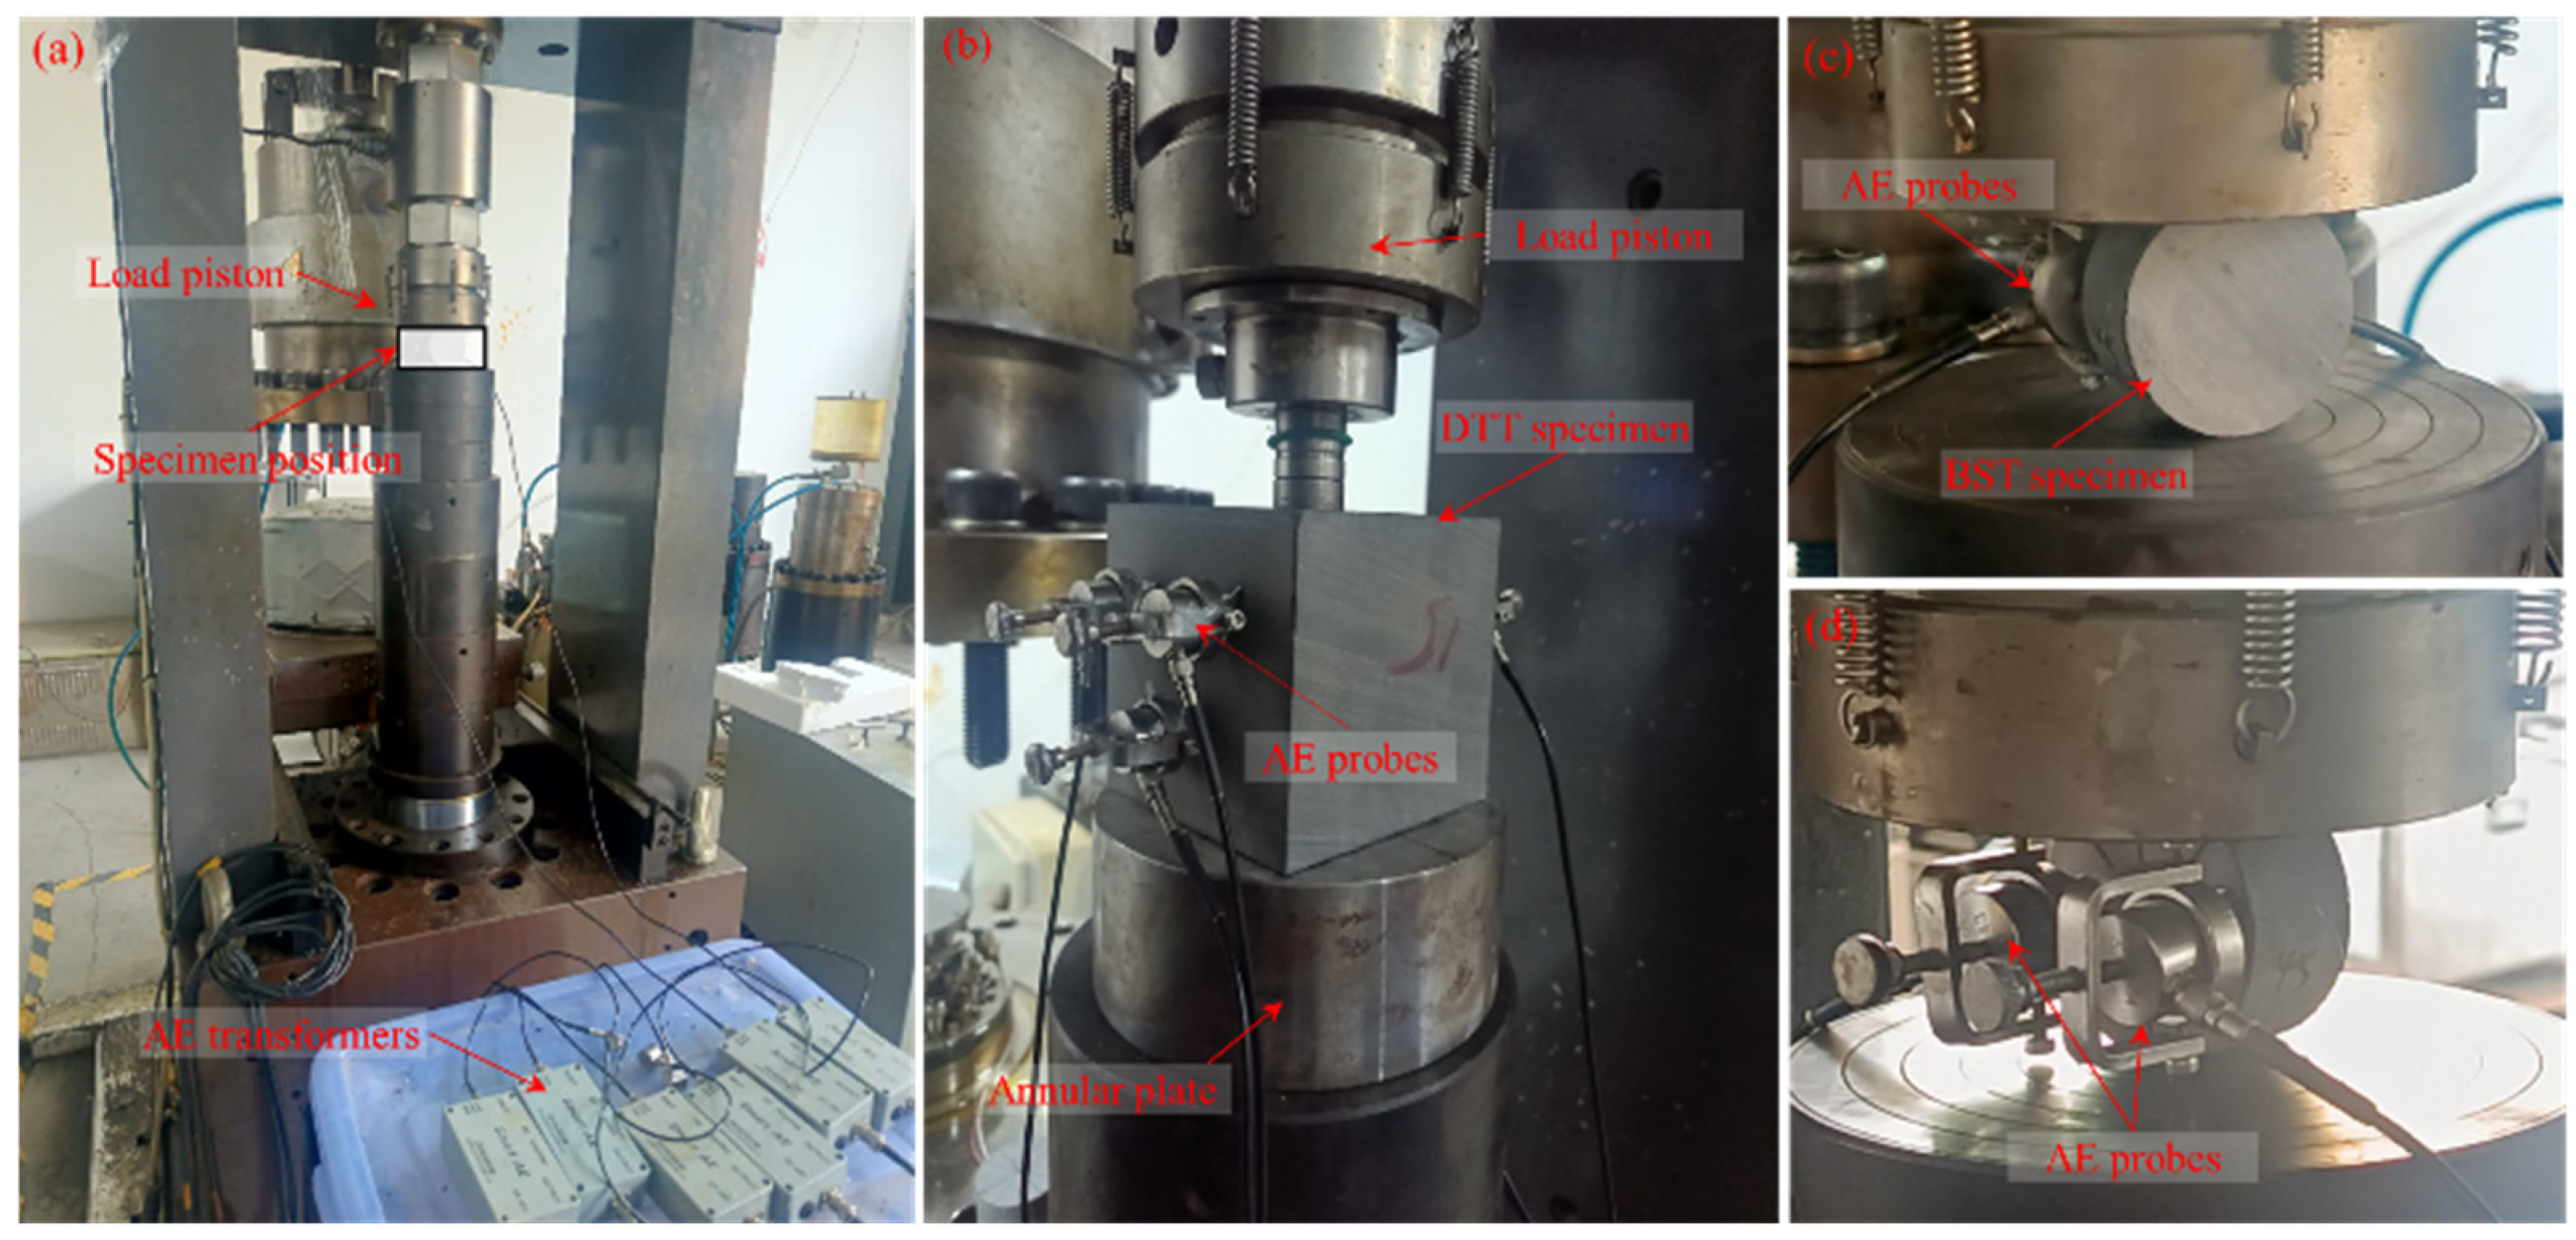
2.2. Testing Procedure

A triaxial rock mechanics test system was used to conduct both the DTT and BST, as shown in Figure 3a. The test set-up for DTT is shown in Figure 3b. A loading cylinder with a diameter of 25 mm was positioned at the upper end of the specimen, while an annular plate with a diameter of 120 mm and a high friction coefficient was placed at the lower end. To prevent specimen slippage during initial loading, a pre-loading force of 0.5 kN was applied. The test was then conducted in displacement control mode at a loading speed of 0.05 mm/min. To monitor damage in the DTT specimens during loading, a DS5 series full-information acoustic emission (AE) signal analyzer with a transmission speed of 10 M per channel was utilized. Three AE probes were attached to either side of the specimen and secured with fixers. Vaseline was applied to the fixers to minimize noise interference. The test set-up for BST were shown in Figure 3c,d. Flat loading platens were positioned at the upper and lower ends of the specimen. A pre-loading force of 0.5 kN was applied before the test began, and the test was conducted in displacement control mode at a loading speed of 0.1 mm/min. Due to the smaller size of the BST specimens and the relative simplicity of monitoring internal damage, only two AE probes were installed on the back of the specimen using fixers.
The direct tensile strength can be determined by the following equation [23]:
σ td = F A = F π d 2 2 2 d 1 + 2 b 1 2 2
where σtd is the tensile determined by the DTT, MPa; F is the peak load, kN; d1 and b1 are the inner diameter and thickness of the annular slot drilled from the upper end of the specimen, mm; d2 is the inner diameter of the annular slot drilled from the lower end of the specimen, mm.
The indirect tensile strength can be determined by the following equation:
σ ti - iso = 2 P π D t
where σti-iso is the isotropic tensile strength determined by the BST, MPa; P is the peak load, kN; D is the diameter of the Brazilian disk, mm; t is the thickness of the Brazilian disk, mm.
It is important to note that although Equation (2) is commonly used to calculate the indirect tensile strength of rocks, it only considers the functional relationship between indirect tensile strength, peak load, specimen thickness, and diameter. It does not account for the influence of rock anisotropy. To address this limitation, Claesson and Bohloli [24] proposed a new equation for calculating indirect tensile strength, which incorporates the effects of rock elastic anisotropy:
σ ti - ani = 2 P π D t E / E 1 4 cos ( 2 β ) ( b 1 ) cos 4 β 4 b = E E 2 1 G 2 v E
where σti-ani is the anisotropic tensile strength determined by the BST, MPa; E is the elastic modulus parallel to the bedding plane, GPa; E′ is the elastic modulus perpendicular to the bedding plane, GPa; G′ is the shear modulus perpendicular to the bedding plane, GPa; v′ is the Poisson’s ratio perpendicular to the bedding plane; β is the loading angle, (°). According to Ma et al. [25], we set E = 20.53 GPa, E′ = 15.21 GPa, v = 0.17, v′ = 0.19, and G′ = 7.17 GPa.

3. Results

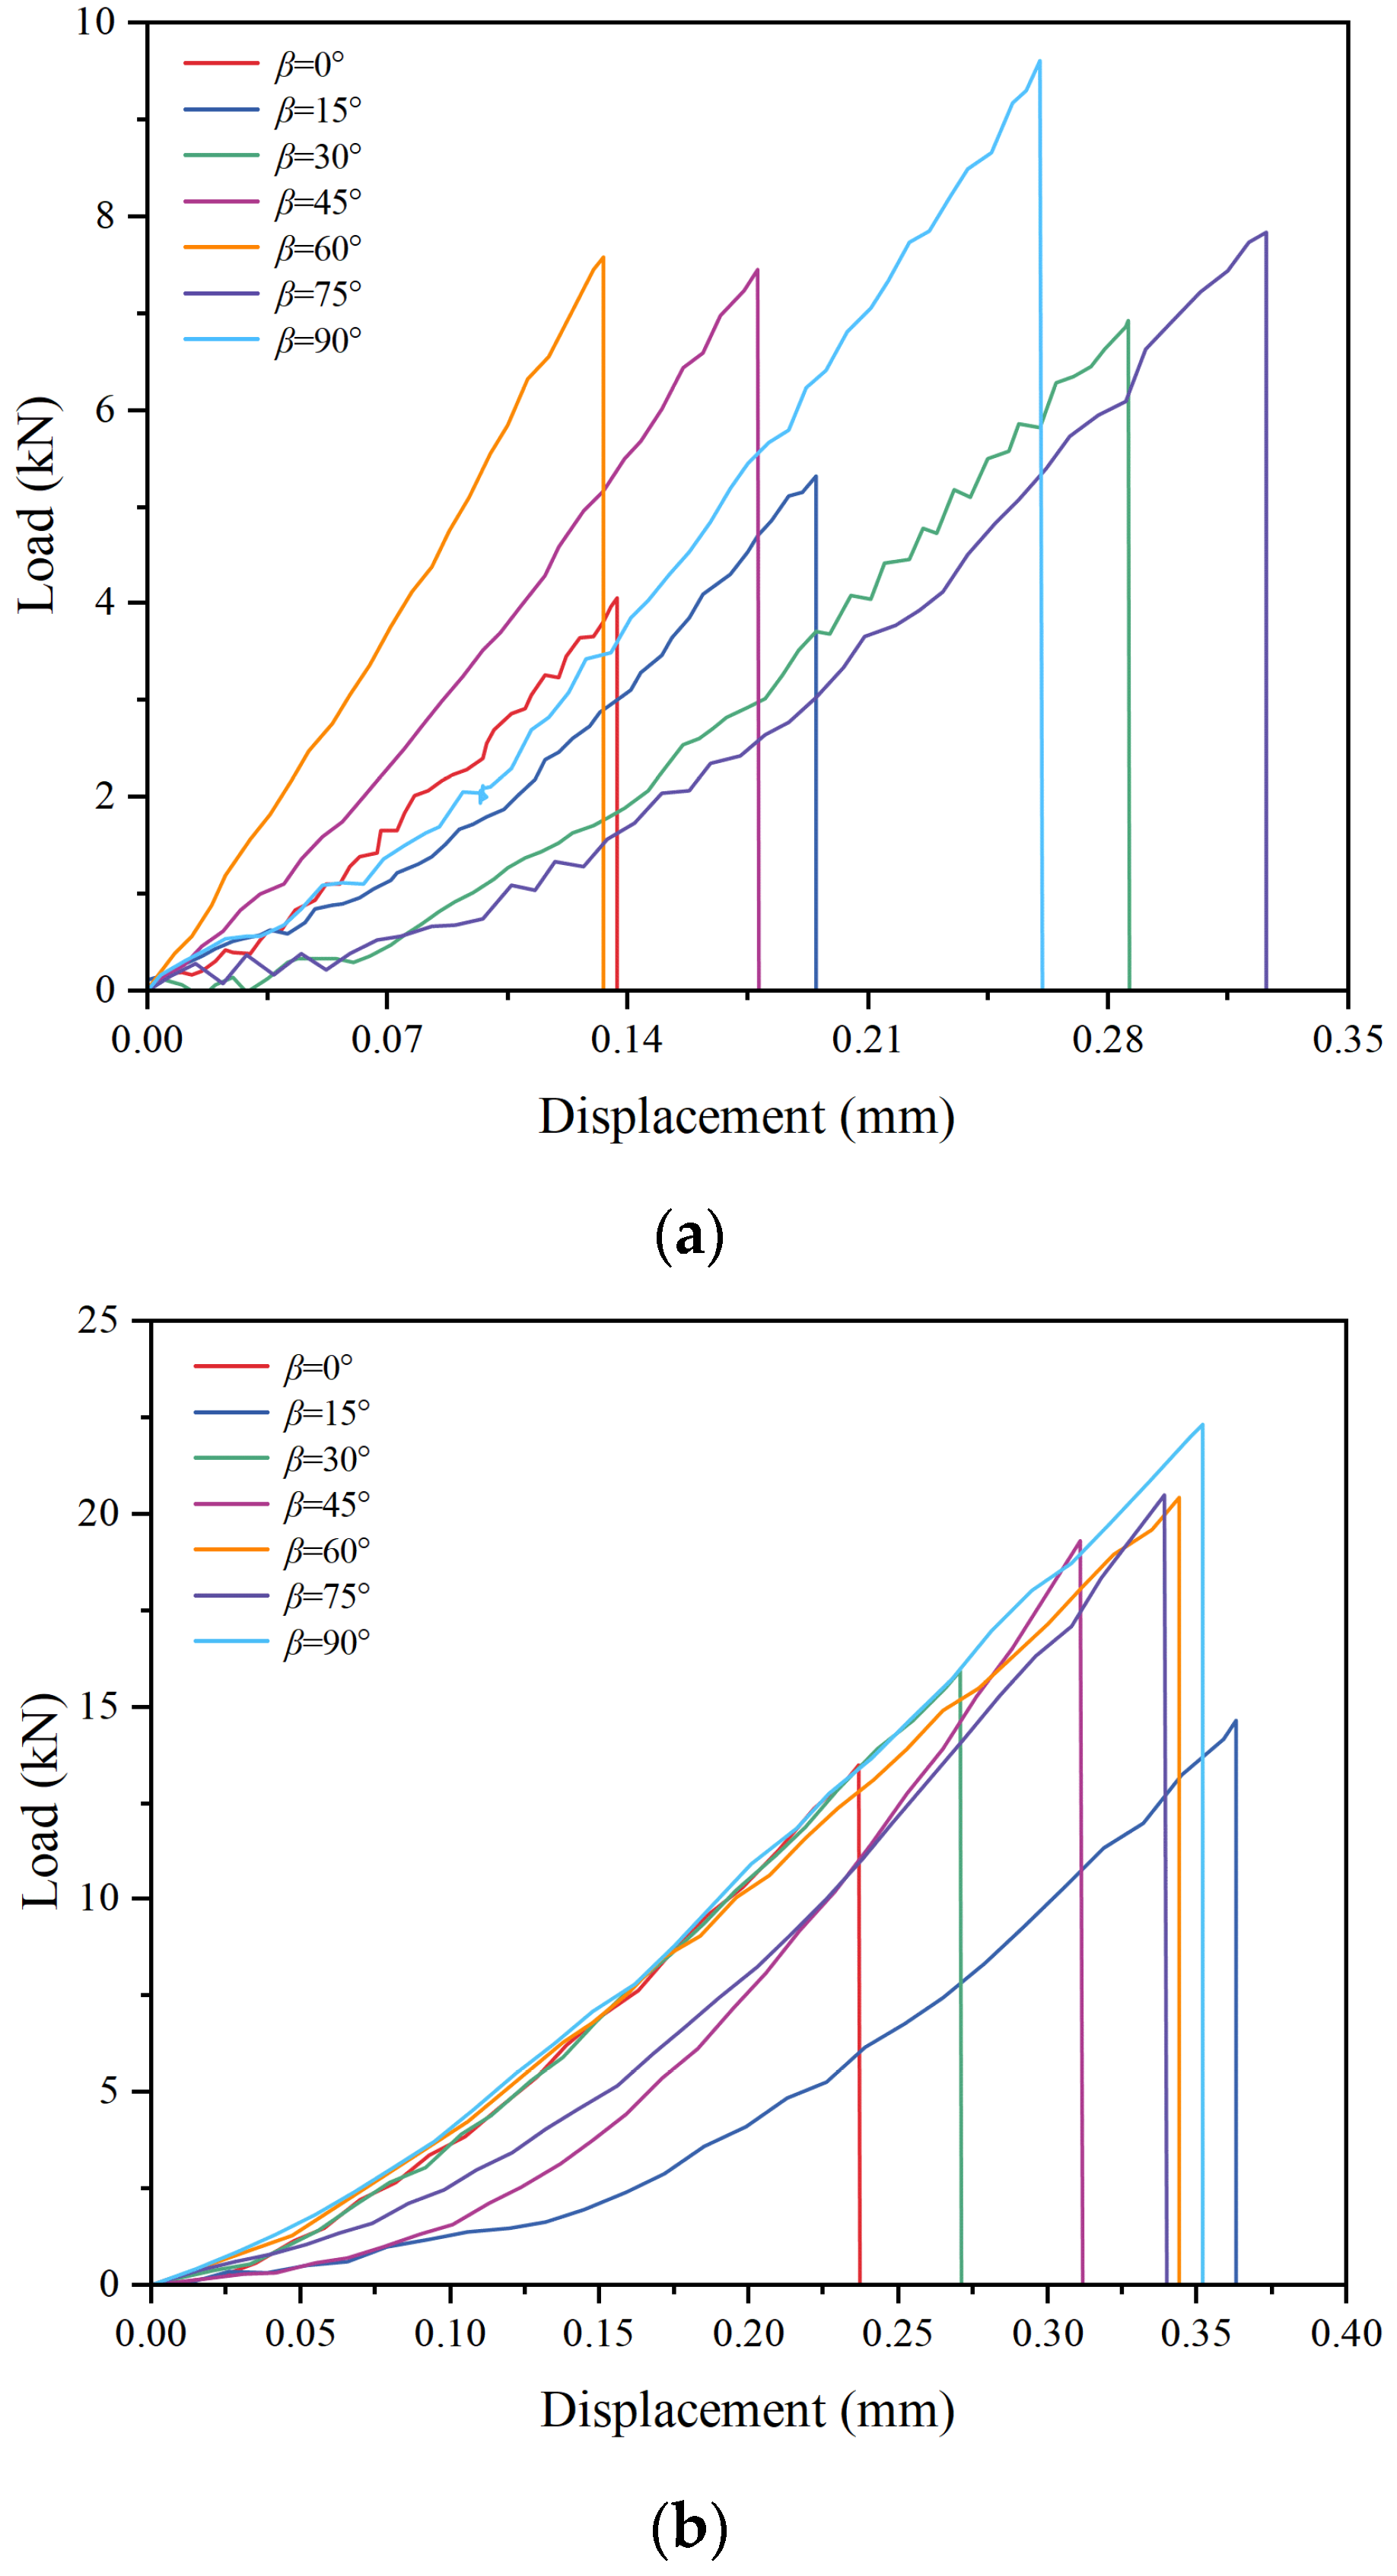
3.1. Load–Displacement Curve

Figure 4 shows the load–displacement curves for DTT and BST at different loading angles. The load–displacement curves for the DTT and BST specimens could be divided into four distinct stages: compaction, elastic deformation, critical failure, and post-peak stages. The maximum peak loads for the DTT and BST specimens were 9.60 kN and 22.31 kN, respectively, at β = 90°. At β = 0°, the corresponding peak loads were 4.06 kN and 13.49 kN, respectively. Notably, the BST specimens exhibited significantly higher peak loads compared to the DTT specimens. At the same loading angle, the maximum difference in peak load between DTT and BST specimens reached 12.83 kN.

3.2. Tensile Strength

To analyze the influence of anisotropy on tensile strength and the differences between direct and indirect tensile strength, the tensile strengths at various loading angles were calculated using Equations (1)–(3), and the results are presented in Figure 5. It is evident that the indirect tensile strength was significantly higher than the direct tensile strength across all loading angles. As the loading angle increased, both the direct tensile strength and the indirect tensile strength calculated using Equation (3) showed a corresponding increase. The maximum tensile strengths were observed at β = 90°, with values of 9.6 MPa and 10.45 MPa, respectively, while the lowest tensile strengths were observed at β = 0°, with values of 4.06 MPa and 6.89 MPa, respectively. In contrast, the indirect tensile strength calculated using Equation (2) initially increased, then decreased, and subsequently rose again as the loading angle increased. The maximum tensile strength was 10.38 MPa at β = 90°, while the lowest tensile strength was 7.00 MPa at β = 0°.
The anisotropy index, defined as the ratio of maximum to minimum tensile strength, yielded values of 2.36, 1.52, and 1.48, respectively, indicating a significant degree of anisotropy. The direct tensile strength was most strongly influenced by anisotropy, whereas the indirect tensile strength calculated using Equation (3) showed a reduced effect of anisotropy due to the incorporation of elastic anisotropy. Nevertheless, the influence of anisotropy remained notable. The maximum discrepancy in tensile strength between BST and DTT reached 2.82 MPa, indicating a substantial divergence between these two testing methods.

3.3. Anisotropy of Acoustic Emission

Acoustic emission (AE) can be used to monitor the internal damage of rocks under loading. Among the AE parameters, ringing count and AE energy are particularly significant and widely utilized. Based on the AE monitoring results from DTT and BST, the variation in accumulated AE energy and ringing count with stress level under different loading angles was compared and analyzed. The results are presented in Figure 6. It is evident that the accumulated AE energy and ringing counts of DTT and BST specimens showed notable differences across various loading angles. Except for loading angles of β = 60° and β = 90°, the accumulated AE energy and ringing counts of DTT specimens were higher than those of BST specimens at all other loading angles. No clear trend was observed in the accumulated AE energy and ringing counts as the loading angle increased. For BST specimens, the maximum and minimum accumulated AE energy and ringing count occurred at β = 60° and β = 0°, respectively, while for DTT specimens, they occurred at β = 30° and β = 0°. During the loading process, when the stress level reached 100%, the corresponding parameters for specimens with continuously increasing accumulated AE energy and ringing counts were smaller. This is attributed to energy dissipation caused by micro-cracks in the matrix or along the bedding plane of the specimen during loading. For anisotropic rocks, a continuous increase in accumulated AE energy and ringing counts during loading typically corresponds to failure along the bedding plane.

3.4. Failure Mode

Figure 7 shows the failure modes of DTT specimens under different loading angles. Most specimens were significantly influenced by anisotropy, exhibiting tensile–shear mixed failure. For specimens at β = 0° and β = 75°, an approximately vertical fracture along the bedding plane was observed. For specimens at β = 15° and β = 30°, the fractures deviated under the influence of the bedding plane. For specimen at β = 45°, the fracture occurred primarily along the bedding plane. For specimens at β = 60° and β = 90°, the failure modes demonstrated more pronounced tensile failure within the rock matrix. Combined with the AE monitoring results, it is evident that specimens at β = 60° and β = 90° did not generate significant AE energy or ringing counts during the loading process, with energy accumulating continuously until the stress level reached 100%. In contrast, under other loading conditions, the AE energy and ringing counts increased progressively during loading due to the influence of bedding plane failure, exhibiting varying degrees of progressive failure characteristics.
Figure 8 shows the failure modes of BST specimens under different loading angles. It is evident that the failure modes varied significantly with the loading angle. For specimens at β = 0°, the failure mode was tensile failure along the bedding plane. For specimens at β = 15–45°, the failure mode was tensile–shear mixed failure, with shear failure along the bedding plane being dominant. For specimens at β = 60–75°, the failure mode remained tensile–shear mixed failure, but tensile failure across the bedding plane became dominant. For specimens at β = 90°, the failure mode was tensile failure across the bedding plane. Thus, anisotropy significantly influenced the BST specimens, affecting both their tensile strength and failure modes.
Overall, the failure modes of BST specimens can be categorized into three types: tensile failure along the bedding plane, tensile–shear mixed failure, and tensile failure across the bedding plane. In contrast, the failure modes of DTT specimens are limited to tensile failure across the bedding plane and tensile–shear mixed failure.

4. Discussion

4.1. Anisotropic Tensile Strength Criterion for Layered Shale

Since many rocks exhibit varying anisotropic characteristics, the traditional isotropic tensile strength criterion cannot meet practical requirements. For this reason, several scholars have proposed various anisotropic tensile strength criteria, including the Hobbs–Barron (H–B) criterion [26,27], Nova–Zaninetti (N–Z) criterion [28], single plane of weakness (SPW) criterion [29], Lee–Pietruszczak (L–P) criterion [29], critical plane approach (CPA) criterion [29], and a phenomenological anisotropic tensile strength criterion (referred to as the phenomenological criterion) [30]. In addition, Nejati et al. [31] developed an anisotropic mode I fracture toughness criterion based on the stress–strain transformation rule (referred to as the SS criterion). Ma et al. [25] found that this criterion seems to be equally applicable to predicting tensile strength through the Brazilian splitting tests of layered shale. To verify the accuracy and applicability of different anisotropic tensile strength criteria, the experimental results of this study were compared and validated.
(1)
H-B criterion
σ β = = 2 σ b cos β ( 1 + cos β ) 0 ° β β * σ m β * β 90 °
cos β * 1 + cos β * = 2 σ b σ m
where σ(β) is the tensile strength with different loading angles, MPa; σb is the tensile strength of bedding plane at β = 0°, MPa; σm is the tensile strength of matrix at β = 90°, MPa.
(2)
N-Z criterion
σ β = σ m σ b σ b sin 2 β + σ m cos 2 β
(3)
SPW criterion
σ β = σ b cos 2 β 0 ° β β * σ m β * β 90 °
β * = cos 1 σ b σ m
(4)
L-P criterion
σ β = σ m + σ b 2 σ m σ b 2 cos 2 β
(5)
CPA criterion
σ β = σ b exp Ω 0 σ m exp 2 Ω 0 exp Ω 0 exp 2 Ω 0 + σ m σ b exp Ω 0 exp 2 Ω 0 exp Ω 0 3 cos 2 β 1
where Ω0 is the spatial distribution parameter of the tensile strength, dimensionless.
(6)
Phenomenological criterion
σ β = σ m σ b σ b + σ m σ b cos λ β
where λ is the anisotropy ratio, defined by the ratio of σb to σm, dimensionless.
(7)
SS criterion
σ β = σ b cos 2 β + σ m sin 2 β
Figure 9 shows a comparison of the theoretical results based on different anisotropic tensile strength criteria with the experimental results. For DTT and BST, the spatial distribution parameters of the tensile strength for the CPA criterion are 0.15 and −0.35, respectively. As shown in Figure 9, the theoretical results based on different strength criteria exhibit significantly different distributions. Based on the results of BST and DTT, we calculated the error and standard deviation (SD) of the prediction results of seven anisotropic tensile strength criterion, and the results are shown in Table 1. Among them, the L-P criterion, CPA criterion, and SS criterion show a high degree of alignment with the experimental results, particularly for indirect tensile strength. However, due to the limited number of DTT results, there is some deviation between the experimental data and the theoretical predictions based on these three criteria. In summary, the L-P criterion and SS criterion yield identical predicted values and align well with the experimental results. The CPA criterion also demonstrates strong predictive accuracy and appears to be more versatile for different rock types, as it allows adjustment of Ω₀, which influences the trend of the theoretical data.

4.2. The Comparison Between Direct and Indirect Tensile Strength

In this study, DTT and BST were conducted on anisotropic shales to investigate the effects of anisotropy on the peak load, direct and indirect tensile strength, and failure modes of Longmaxi layered shales, as well as to compare the differences between these two testing methods. The results reveal that anisotropy significantly influences both direct and indirect tensile strength, with a particularly pronounced effect on direct tensile strength. Additionally, the indirect tensile strengths calculated using Equations (2) and (3) are significantly higher than the direct tensile strength. One contributing factor is the stress concentration caused by the linear loading at both ends of the BST specimen. Generally, both the direct and indirect tensile strengths calculated in this study represent apparent tensile strengths and may not accurately reflect the true tensile strength of the rock.
To further analyze the relationship between direct and indirect tensile strengths, in addition to the test data from this study, direct and indirect tensile strengths of seven additional rock types were identified from the literature [13,15,22,23,32,33,34,35,36,37,38]. As shown in Figure 10, the results indicated that the indirect tensile strength is higher than the direct tensile strength, typically ranging from one to three times the direct tensile strength. The difference between direct and indirect tensile strength does not appear to be directly related to lithology but rather to the testing method or specimen geometry. Read and Richard [39] suggest that the indirect tensile strength can be approximated as 1.11 times the direct tensile strength. As shown in the figure, the strength data for most rocks align well with this relationship.
In summary, the indirect tensile strength is higher than the direct tensile strength due to various factors, including anisotropy, testing methods, and specimen geometry. For isotropic rocks, simple statistical methods such as linear regression can be used to establish the relationship between direct and indirect tensile strength. However, for anisotropic rocks, when rock failure is influenced by bedding or foliation structures and fractures deflect, the peak load can vary significantly. As a result, the direct and indirect tensile strengths of anisotropic rocks cannot be accurately quantified using linear regression. Instead, a more precise tensile strength should be determined by either establishing a calculation equation that accounts for anisotropy [24,29] or developing a testing method that minimizes or eliminates the influence of anisotropy.

4.3. The Typical Failure Mode of DTT and BST Specimens

In theory, the failure patterns of isotropic rocks are consistent. However, the failure modes of anisotropic rocks are influenced by bedding and foliation structures, resulting in more complex failure behaviors. Based on the test results presented in this study, the typical failure modes of BST and DTT specimens for layered Longmaxi shale are summarized, as illustrated in Figure 11, Figure 12 and Figure 13. Figure 12 depicts five representative failure modes observed in layered shales, as summarized by Ma et al. [14].
For BST specimens, three typical failure modes are identified based on the experimental results: “Type A” denotes tensile failure along the bedding plane, “Type B” denotes arc-shaped tensile–shear mixed failure, and “Type C” denotes tensile failure across the bedding plane. “Type A” and “Type C” are primarily observed in specimens with loading angles of β = 0° and β = 90°, respectively, while the failure mode at other loading angles can generally be approximated as “Type B”. These three representative failure modes align with a subset of the failure modes summarized by Ma et al. [14], demonstrating the precision and applicability of the five typical failure modes for layered shales.
For DTT specimens, four typical failure modes are identified based on the experimental results: “Type A” denotes tensile failure within the rock matrix, as observed in specimens with β = 60° and β = 90°. “Type B” denotes slipping failure along the bedding plane, exemplified by β = 45°. “Type C” denotes tensile–slipping mixed failure, as seen in specimens with β = 15° and β = 30°. “Type D” describes a more complex tensile–shear failure, observed in specimens with β = 0° and β = 75°. Although the geometry of the DTT specimens used in this study differs from that of conventional DTT specimens, a review of traditional failure modes for DTT specimens of layered rocks [18,19] reveals that the fundamental characteristics of the failure modes are consistent with those summarized in this study.
In conclusion, this study summarizes the failure modes for both DTT and BST specimens. Compared to previous studies, it is evident that the influence of bedding structure on failure modes is particularly significant. This effect is a primary reason for the discrepancy between the measured tensile strength and the actual tensile strength of the rock.

5. Conclusions

(1)
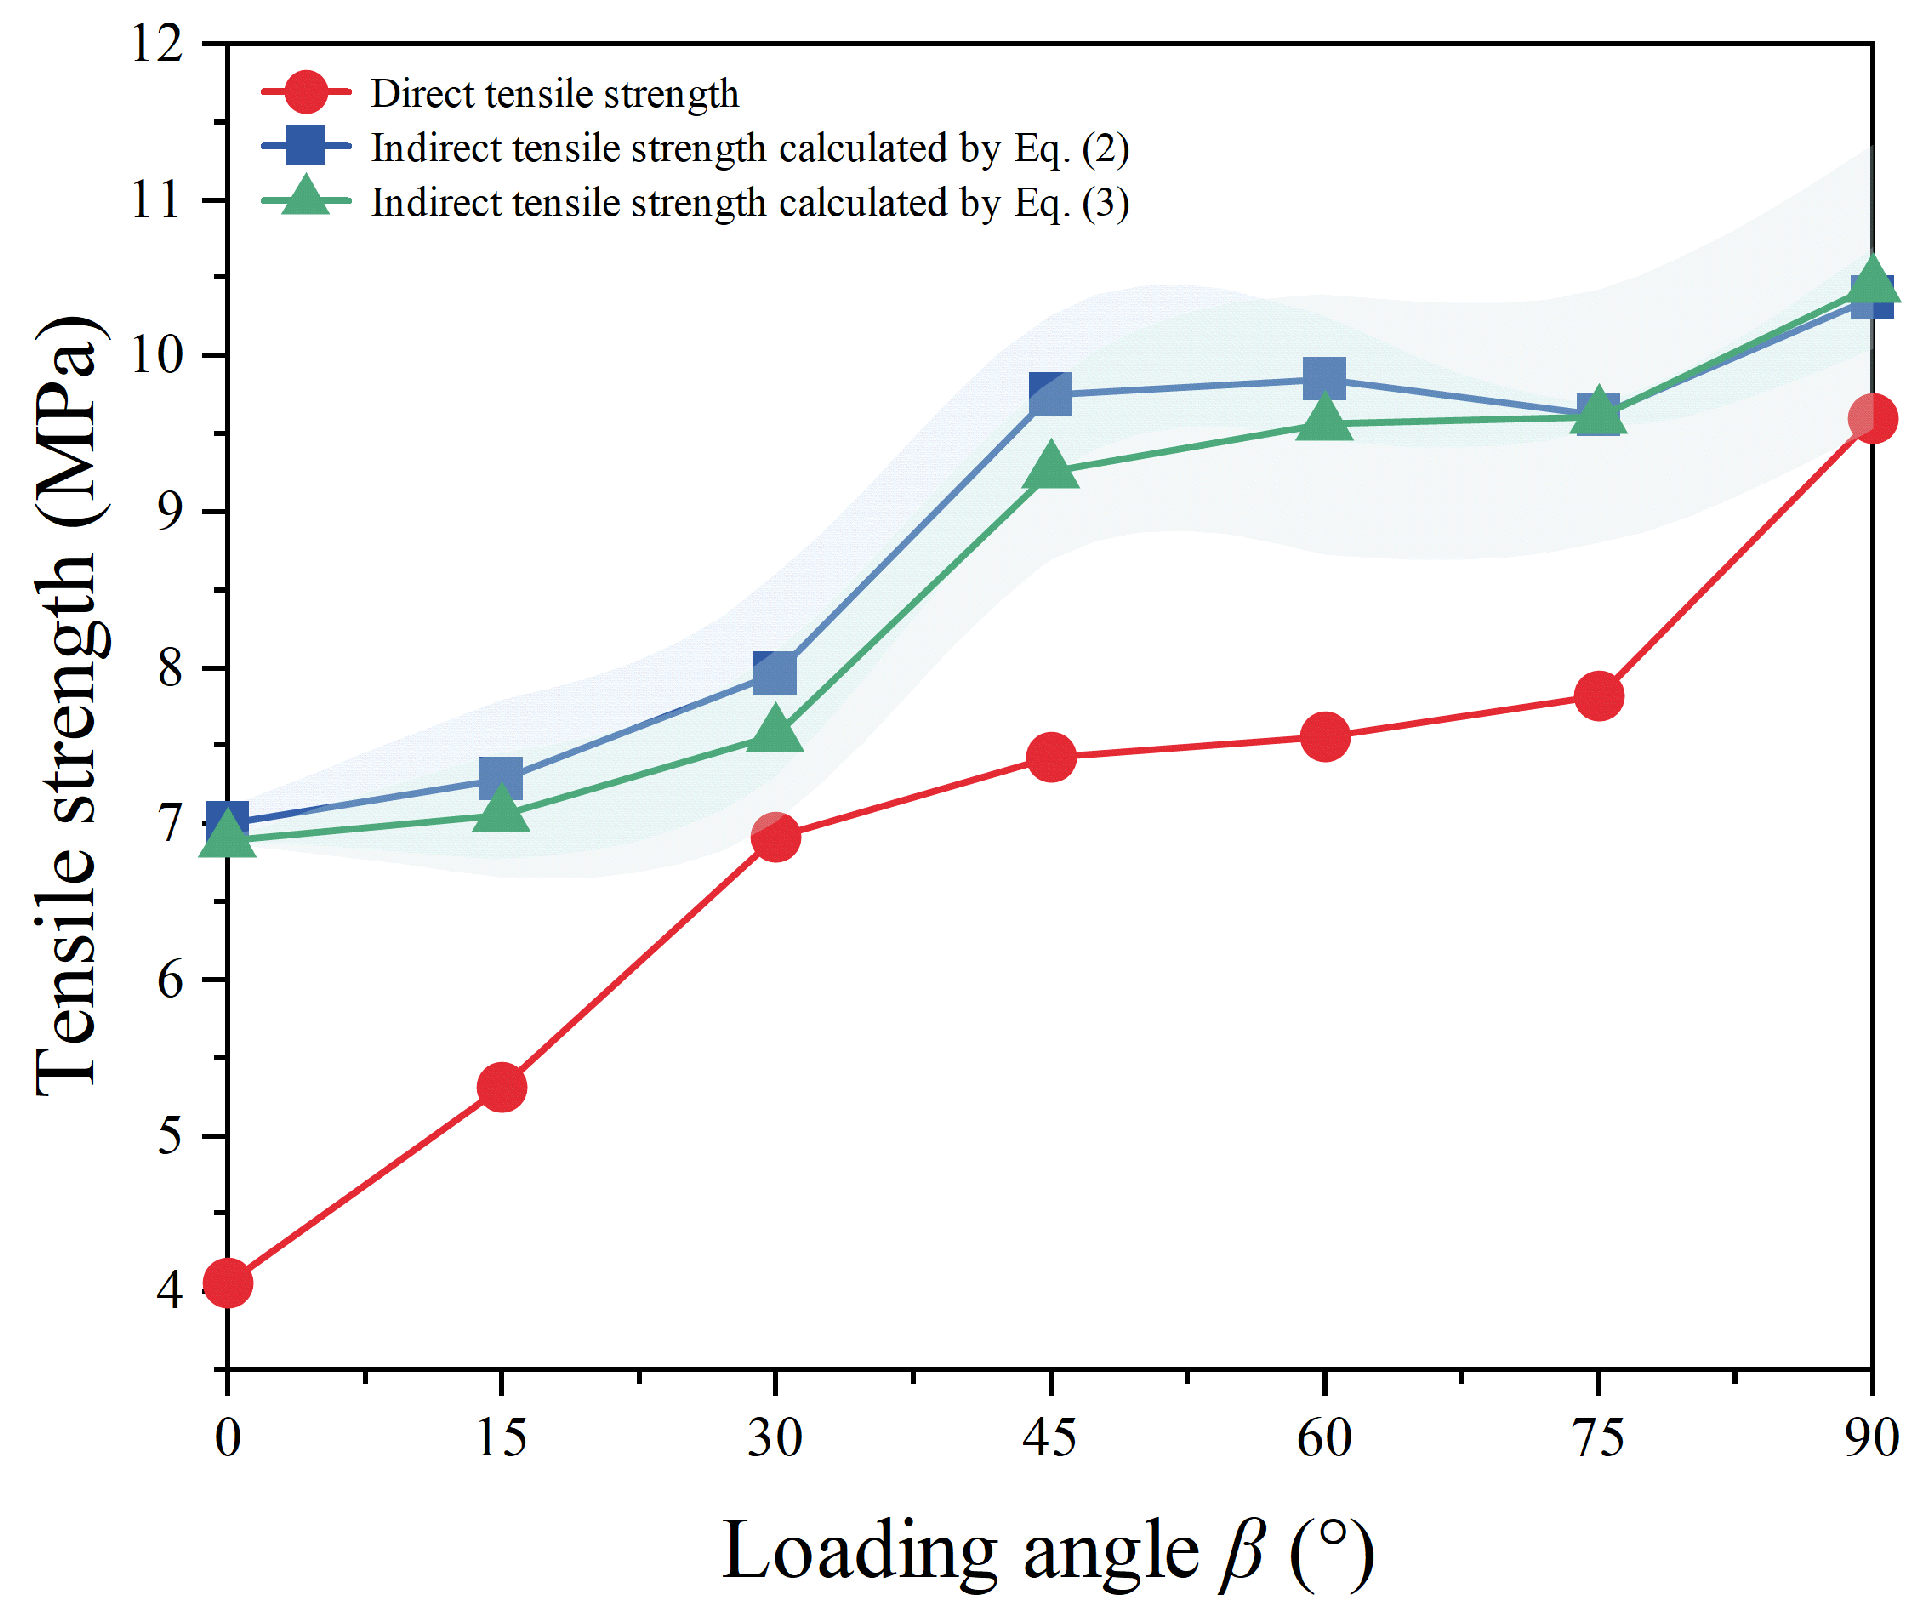
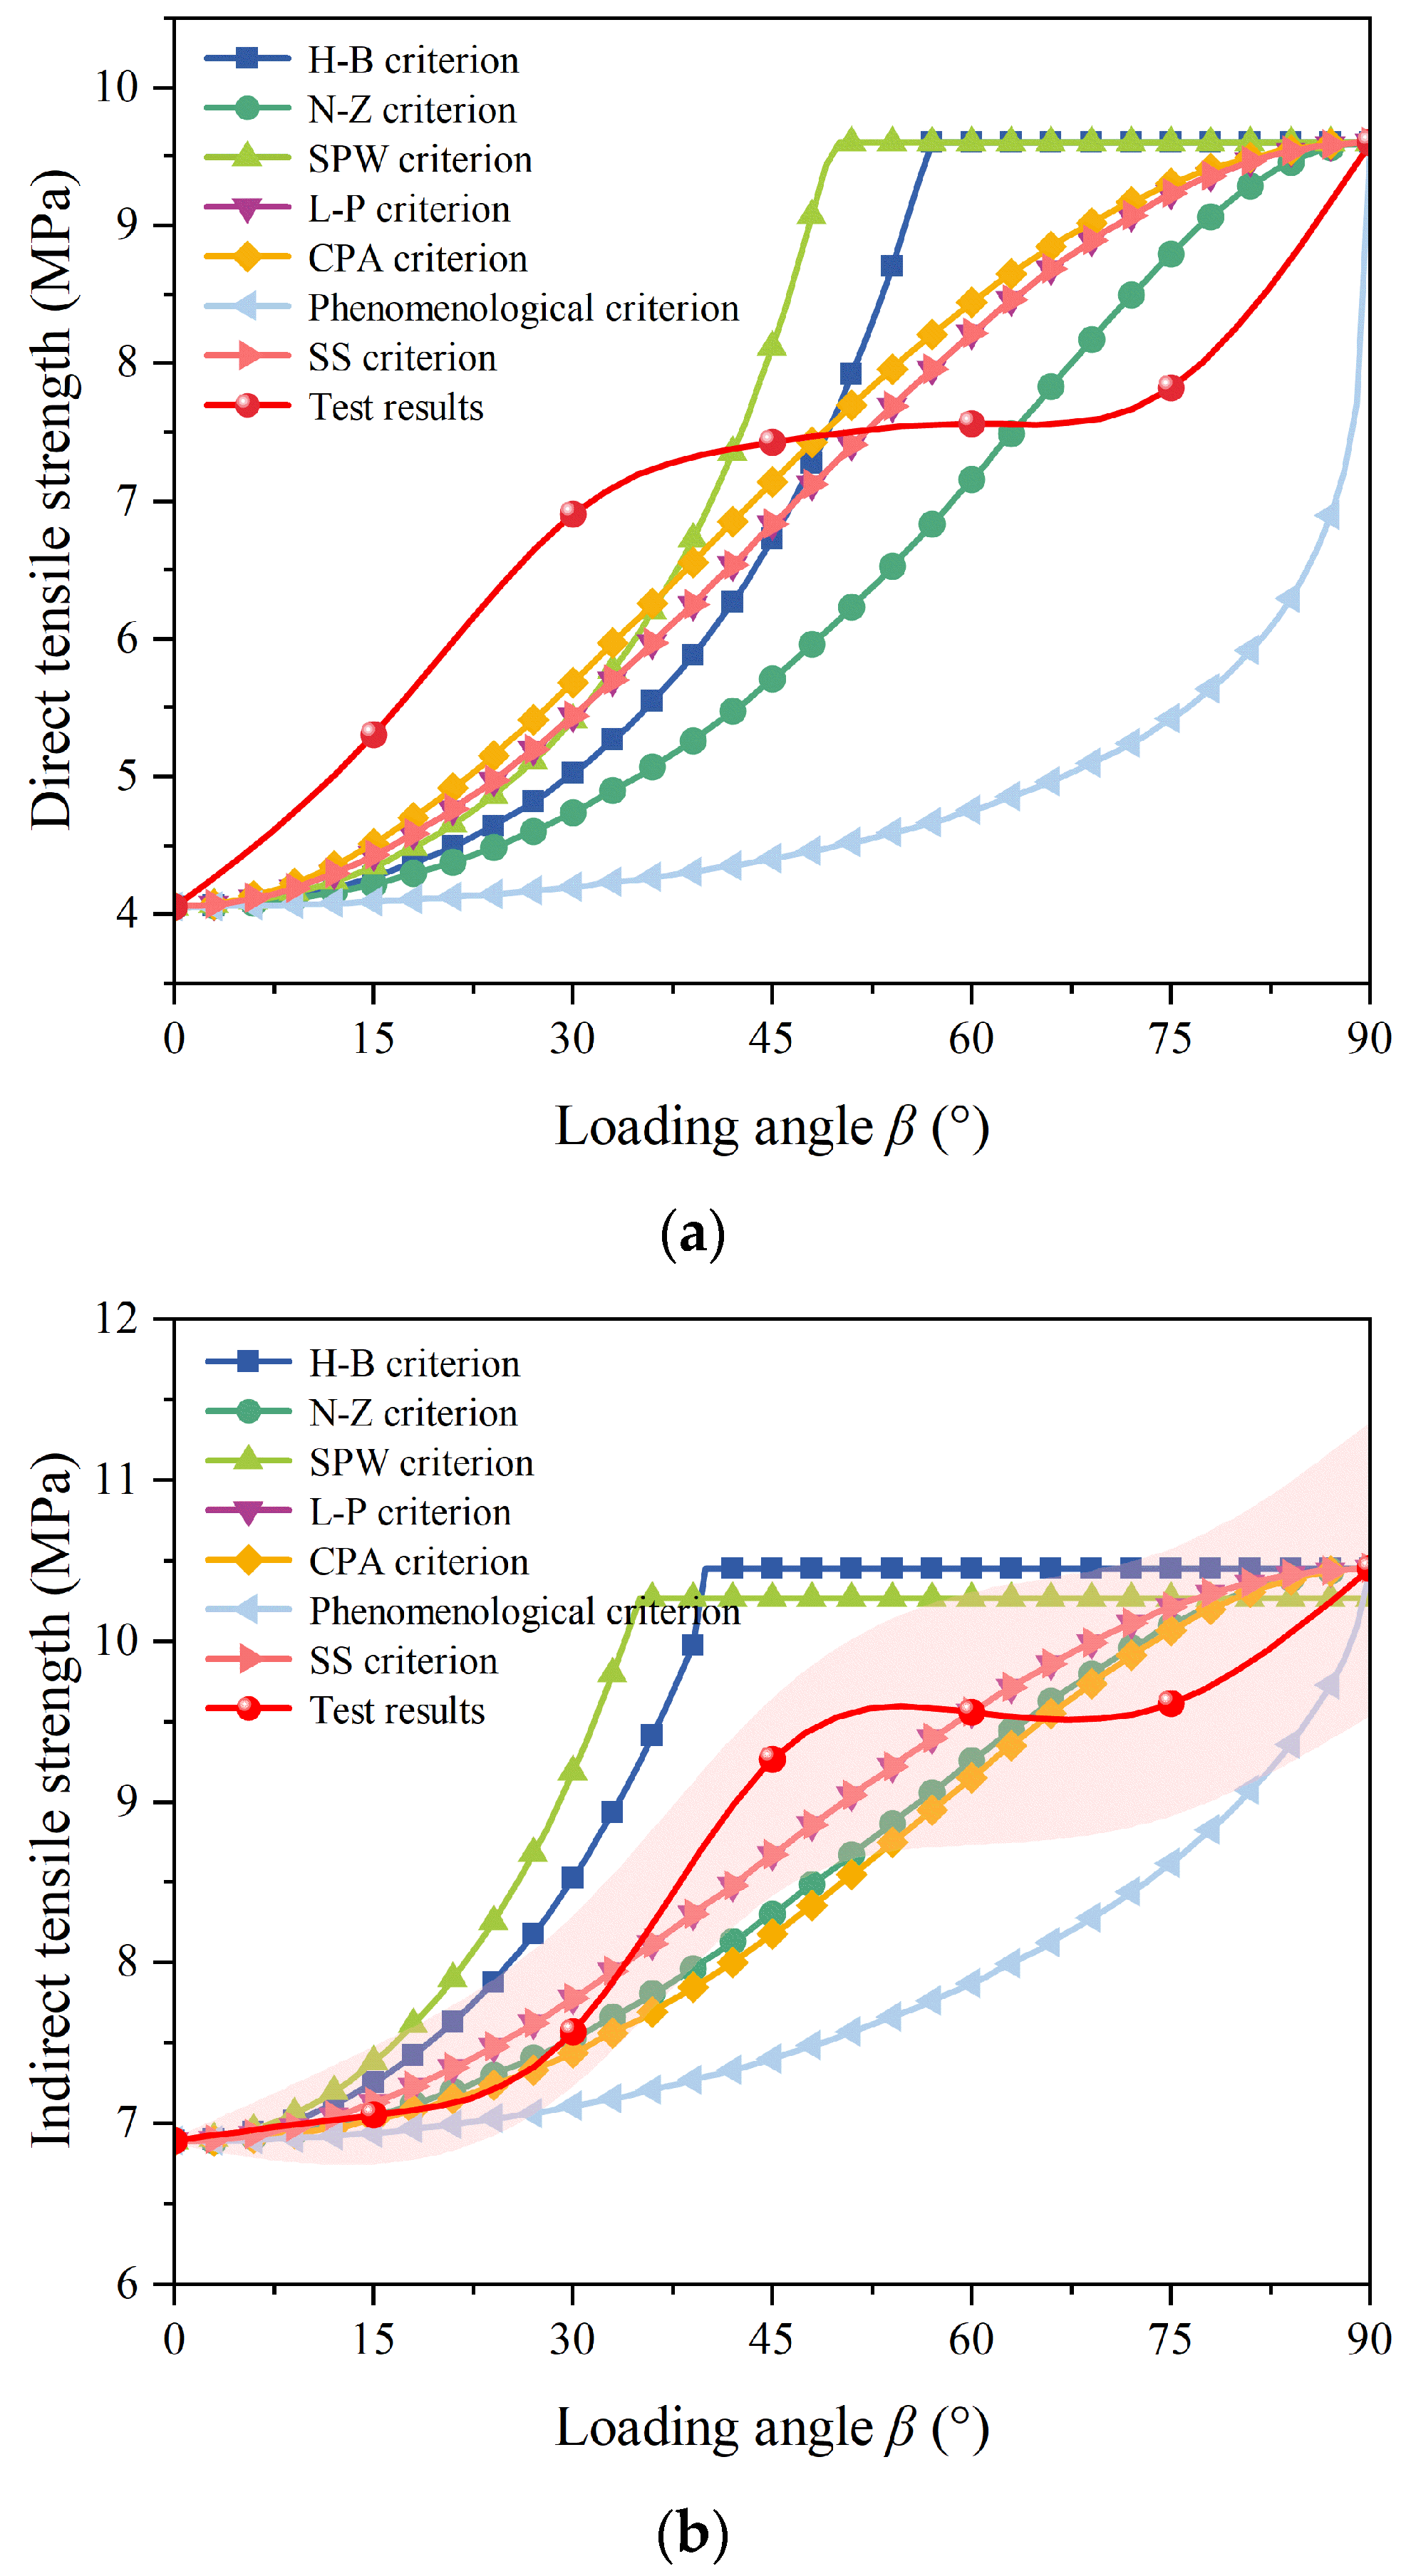
Anisotropy significantly impacts the tensile strength of layered shale. Both the BST and DTT demonstrated that tensile strength increases with the loading angle (β). At β = 90°, the maximum tensile strengths for BST and DTT are 10.45 MPa and 9.60 MPa, respectively. Conversely, at β = 0°, the minimum tensile strengths for BST and DTT are 6.89 MPa and 4.06 MPa, respectively. The anisotropy ratios for BST and DTT are 1.52 and 2.36, respectively, indicating the significant impact of the loading angle on tensile strength.
(2)
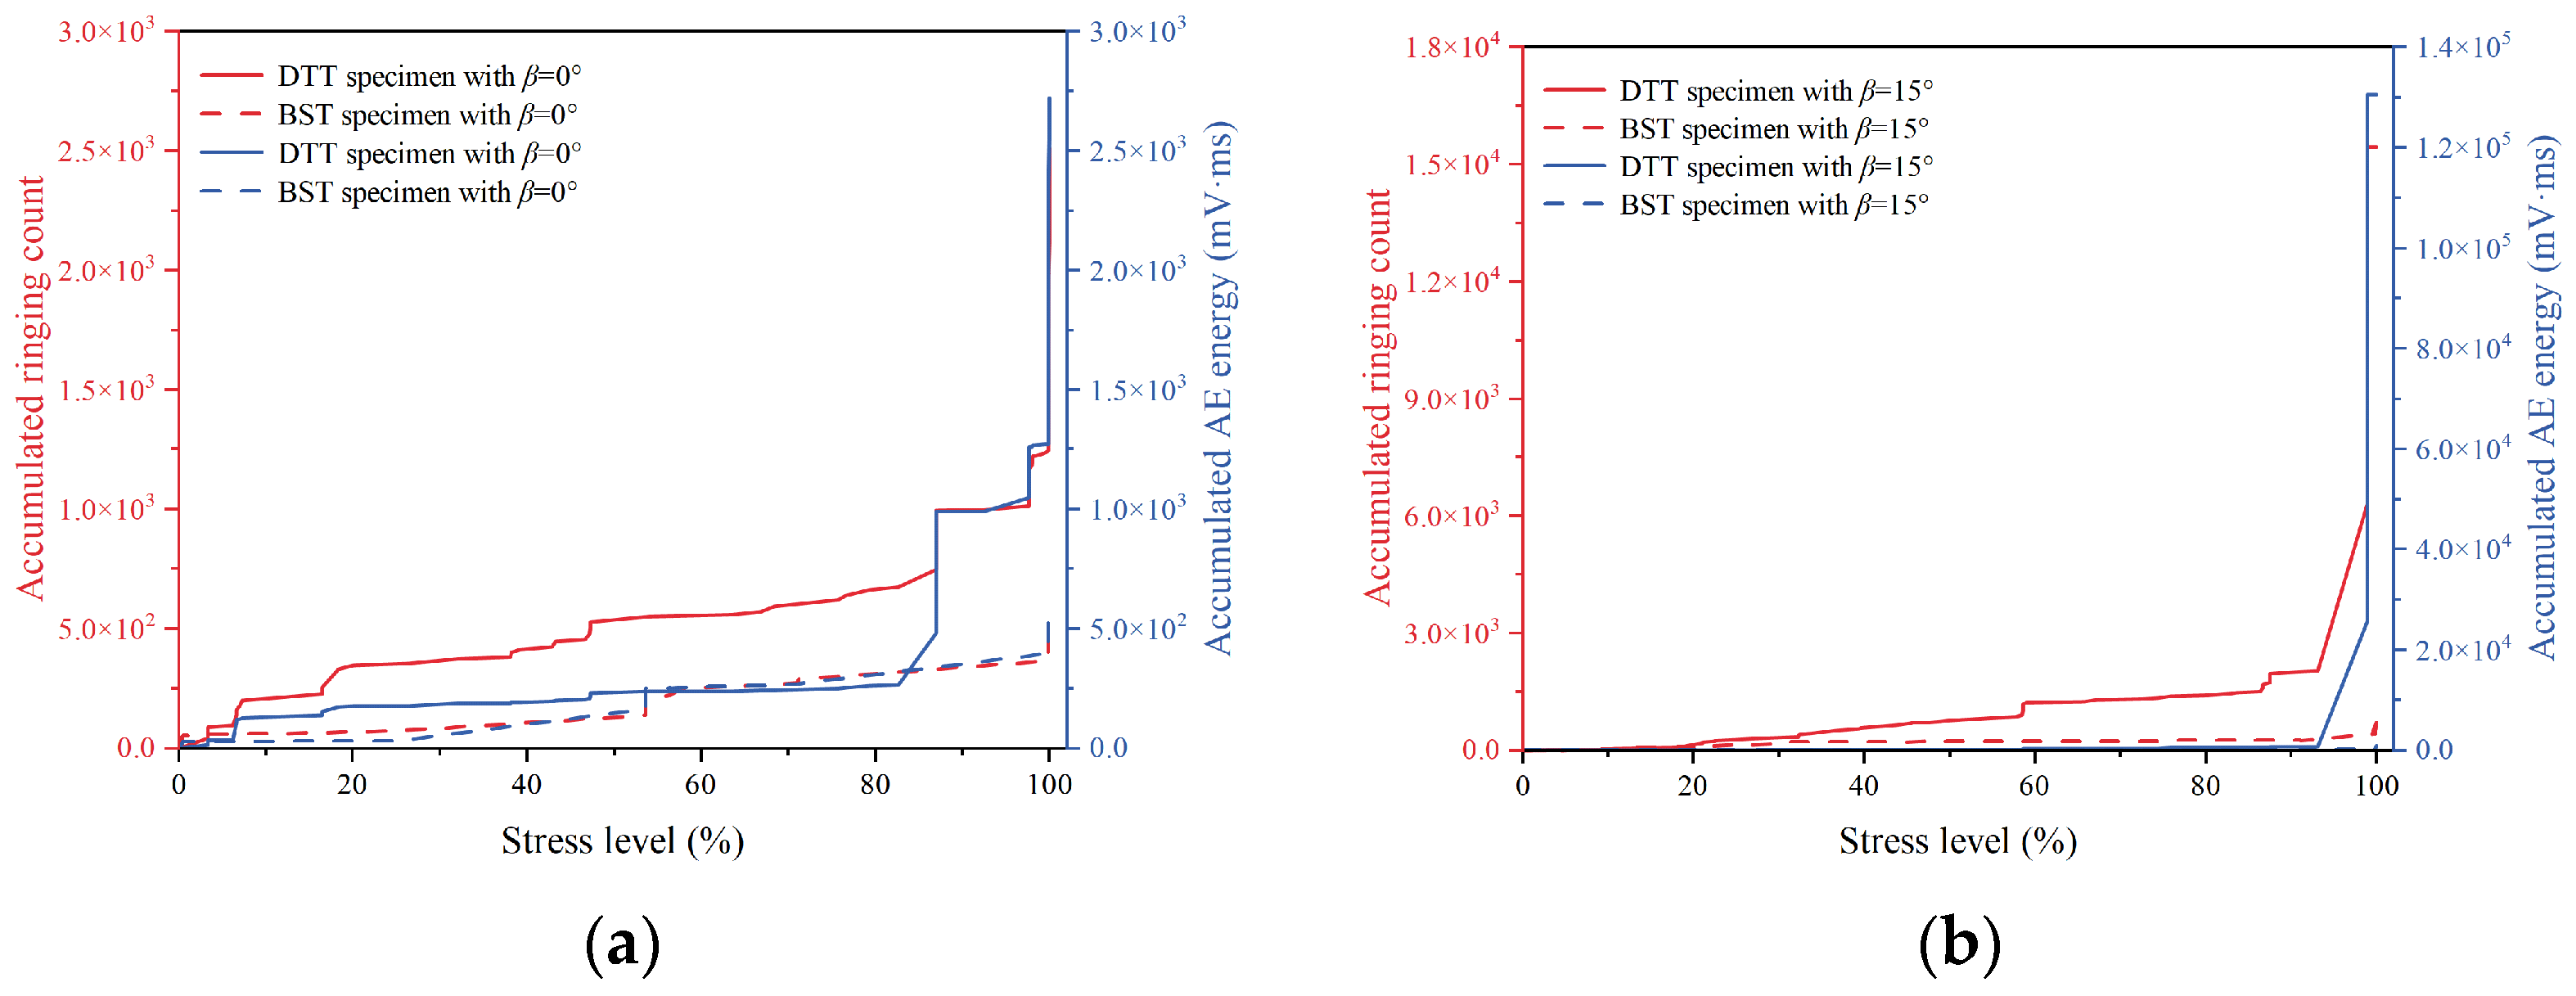
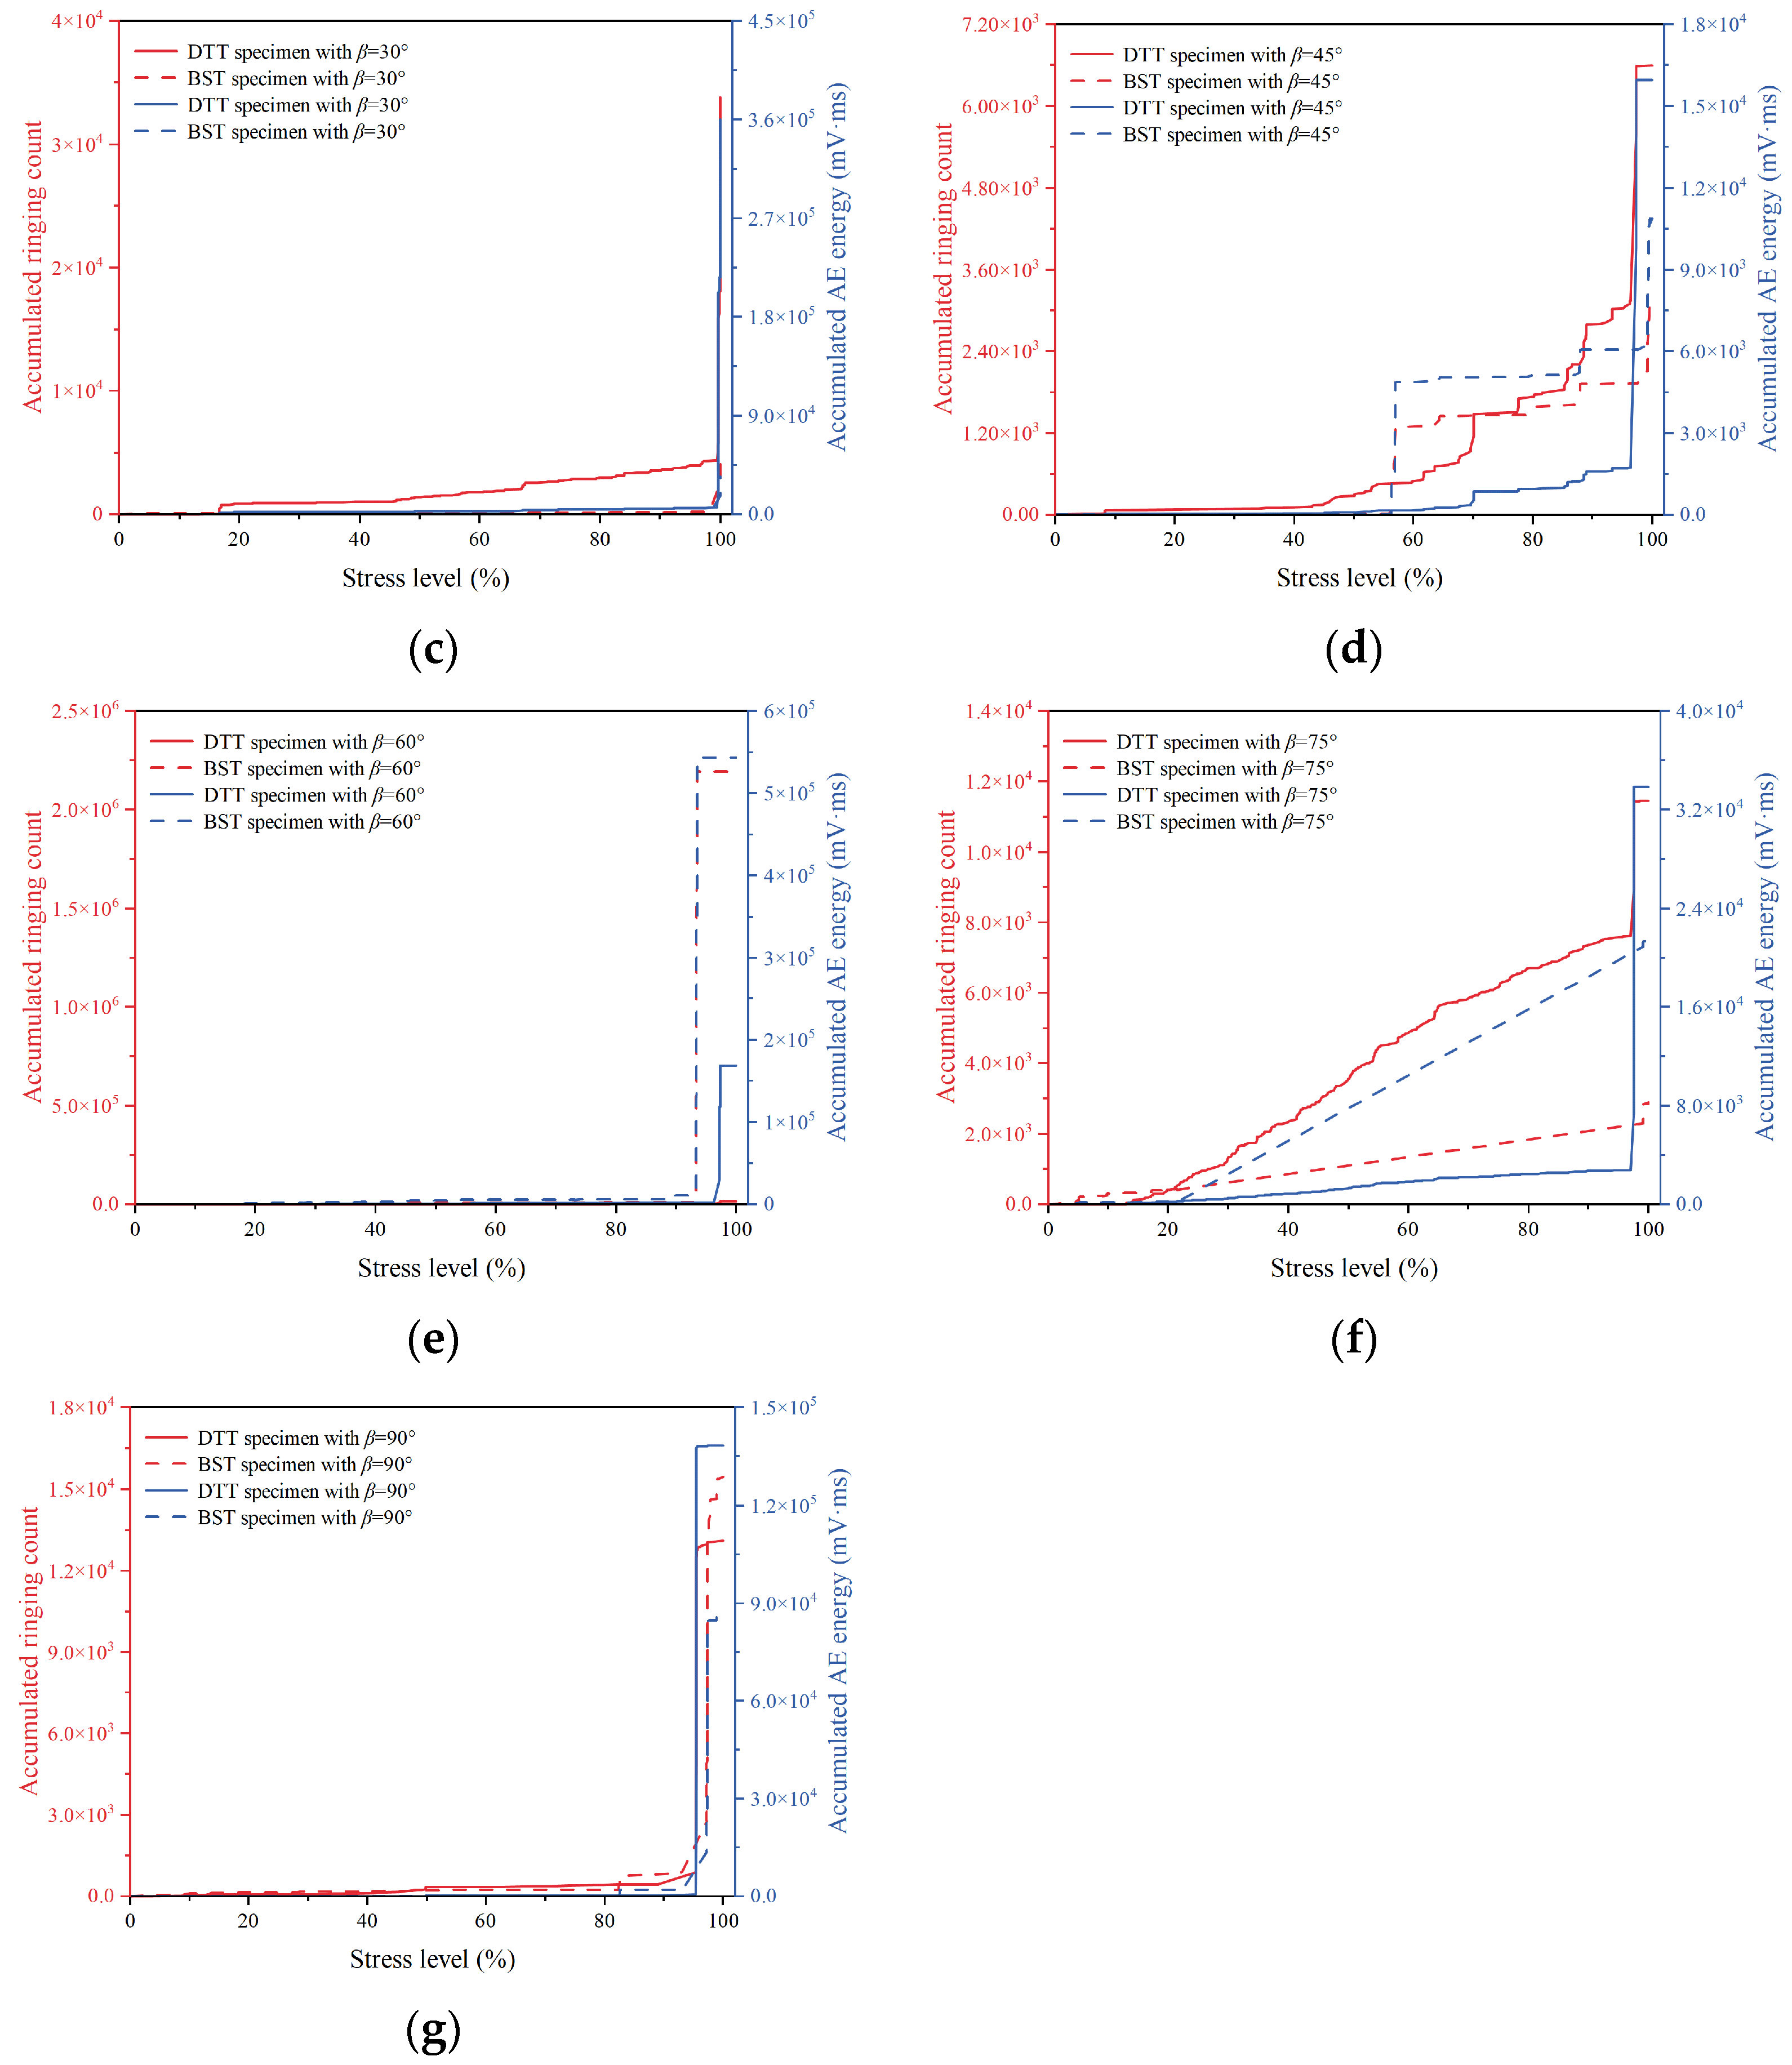
The accumulated AE energy and ringing counts for DTT and BST specimens exhibit distinct trends under different loading angles. For DTT specimens, the accumulated AE energy and ringing counts are generally higher than those of BST specimens. Most DTT specimens display varying degrees of progressive failure characteristics. In contrast, BST specimens typically do not generate significant AE energy or ringing counts during the loading process, with a sharp increase observed only during the final failure stage.
(3)
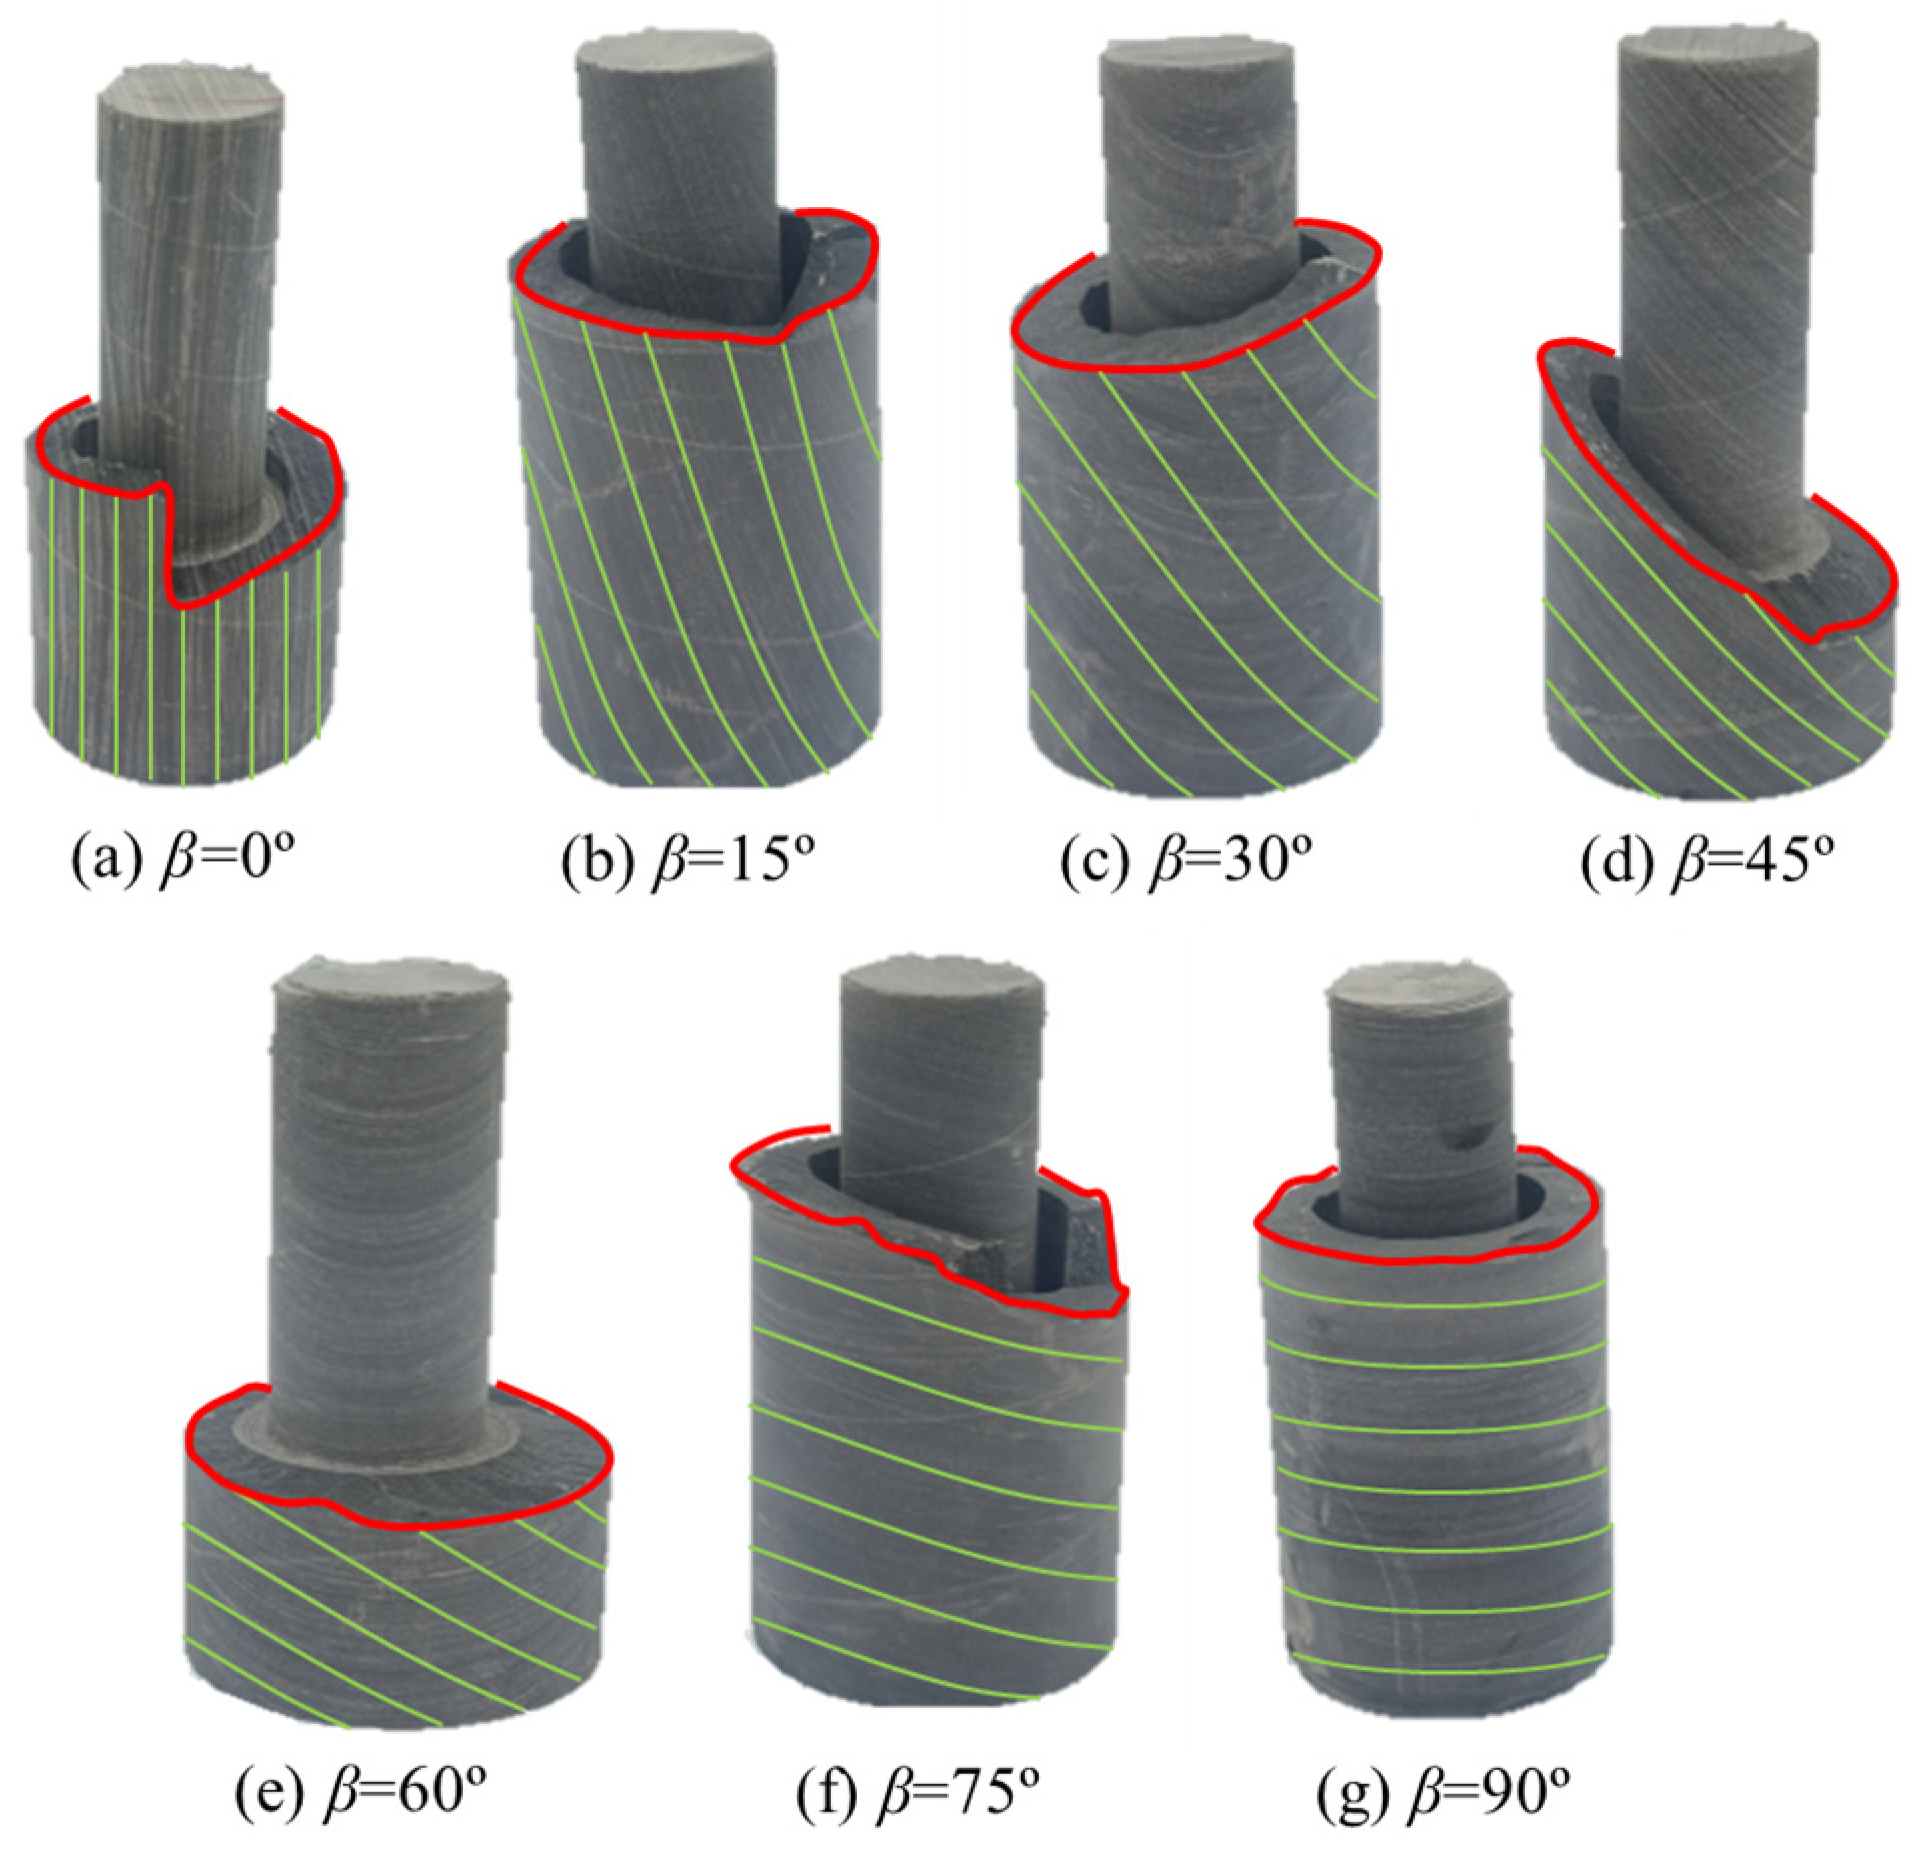
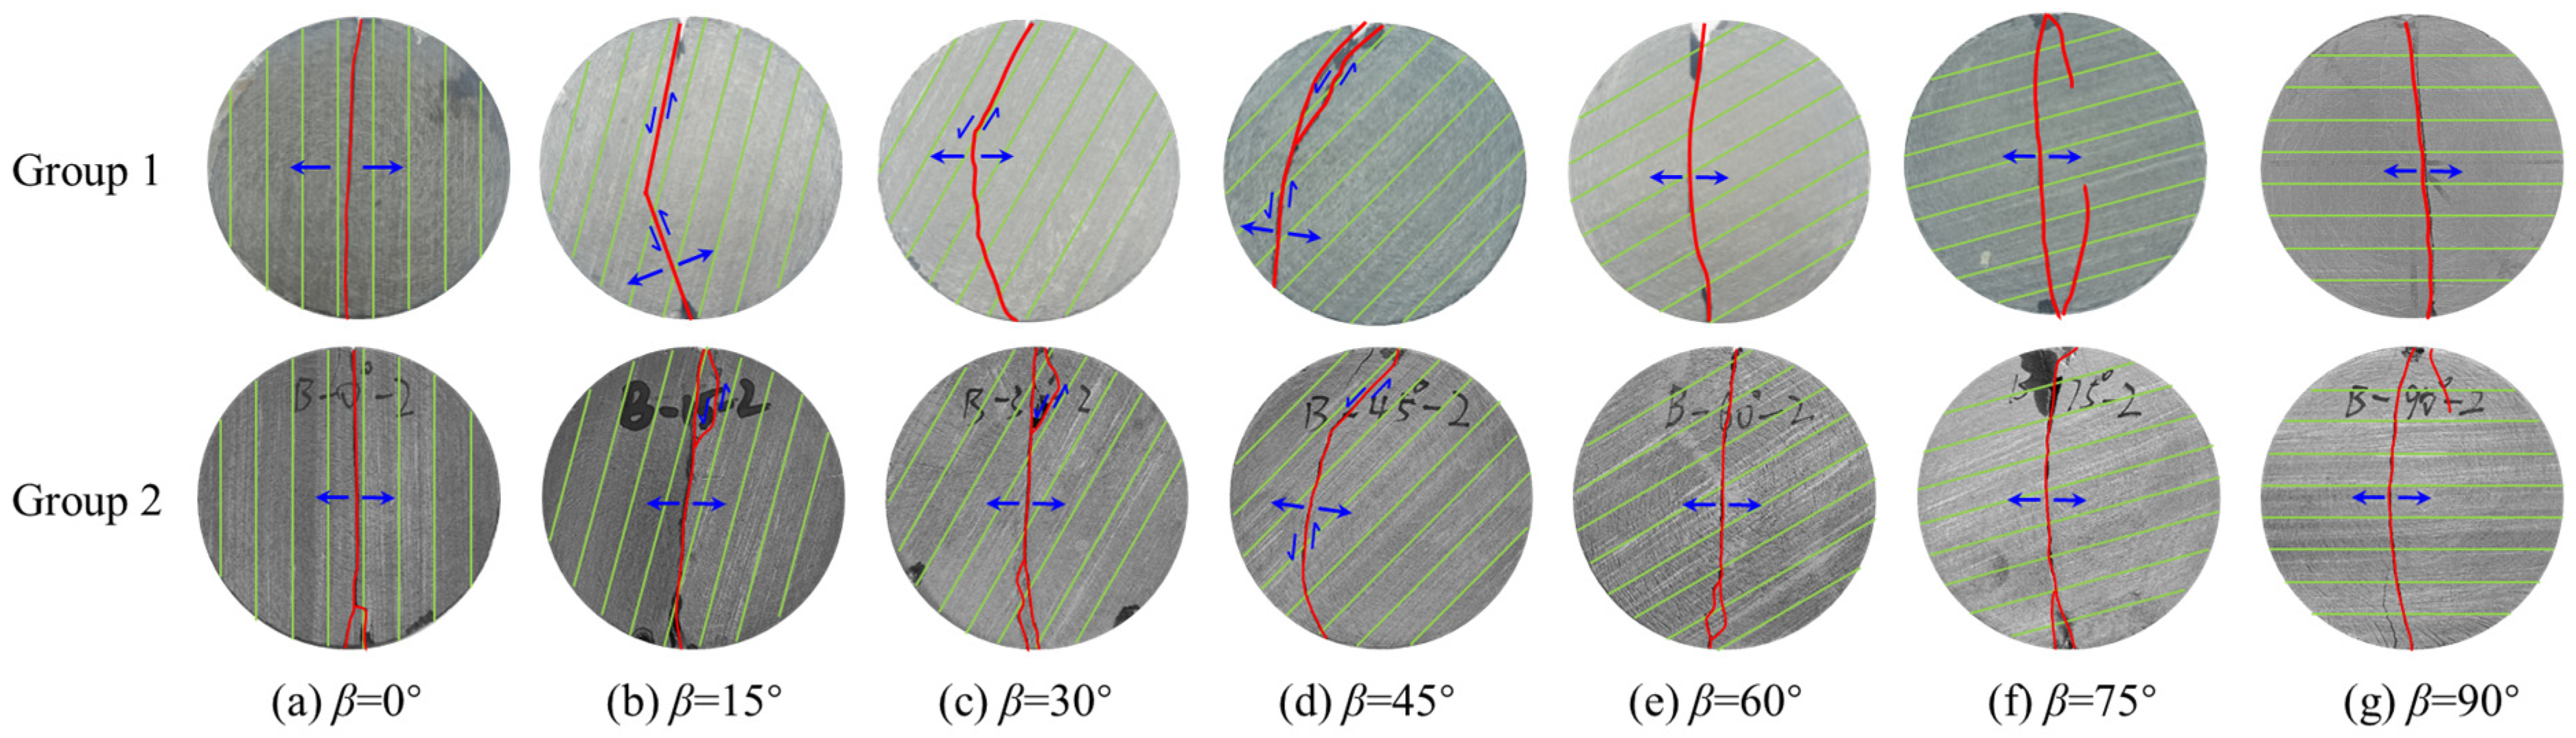
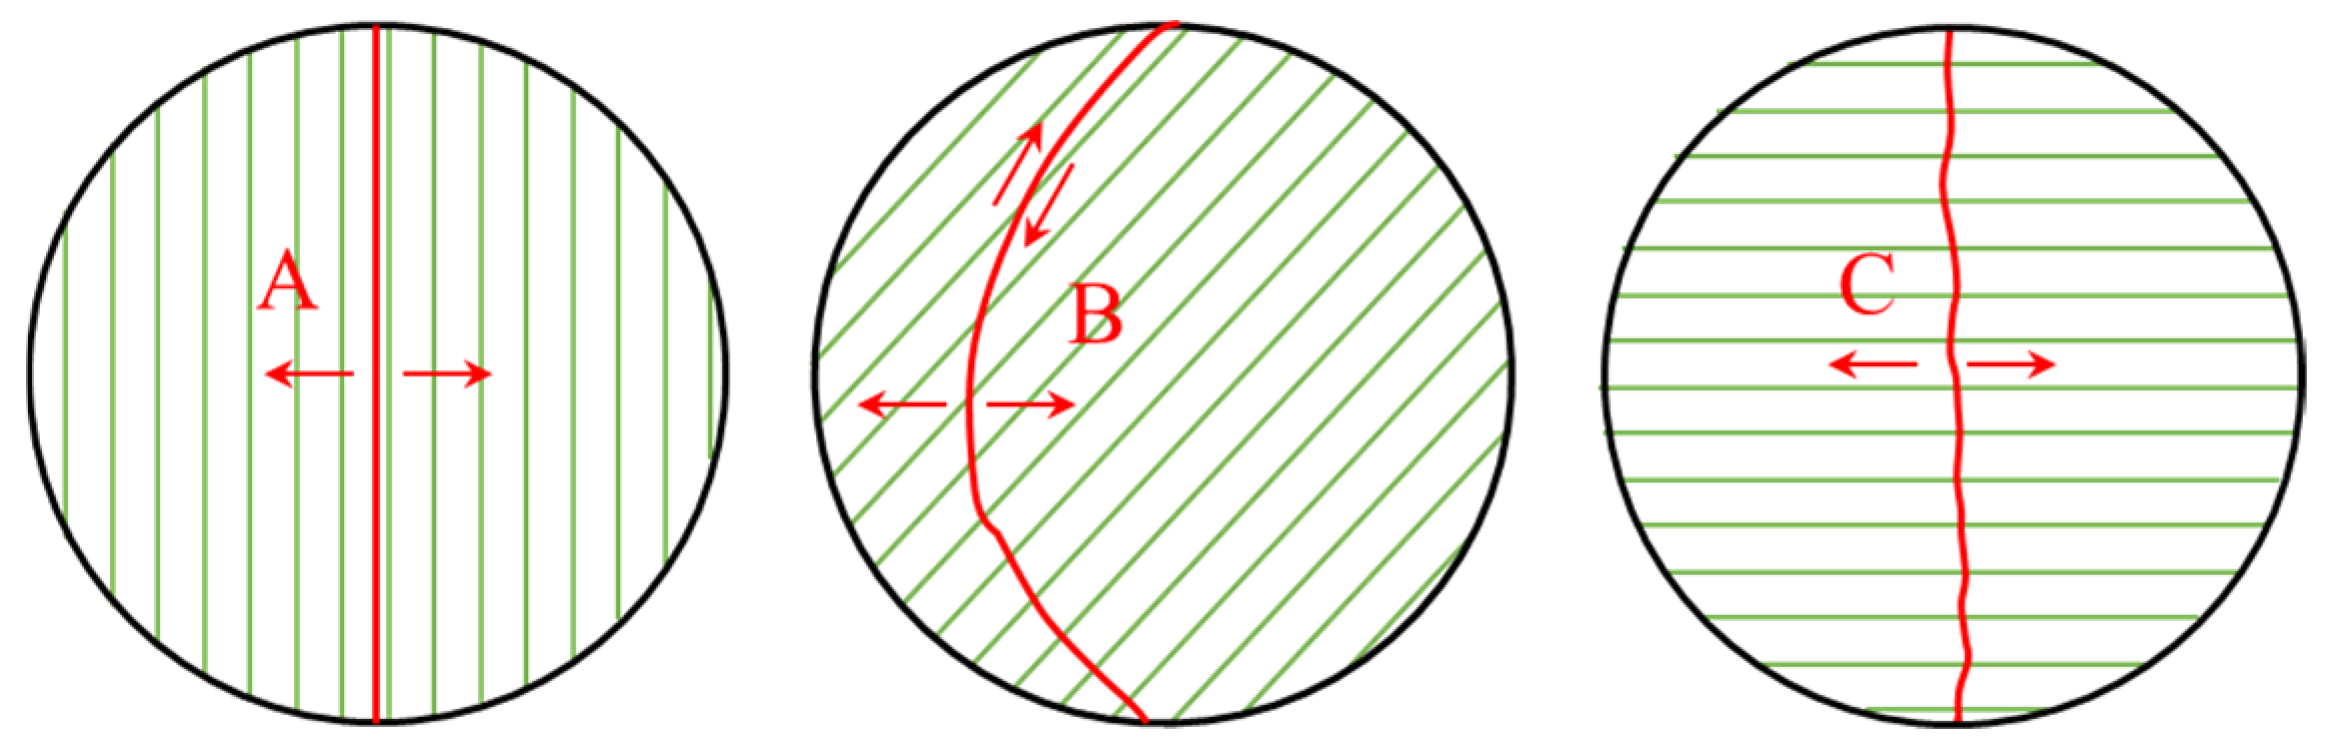
Anisotropy also significantly affects the failure modes of DTT and BST specimens. For DTT specimens, the primary failure mode is tensile–shear mixed failure, with pure tensile failure across the bedding plane observed only at loading angles of β = 60° and 90°. Similarly, BST specimens predominantly exhibit tensile–shear mixed failure, except for tensile failure along the bedding plane at β = 0° and tensile failure across the bedding plane at β = 90°.
(4)
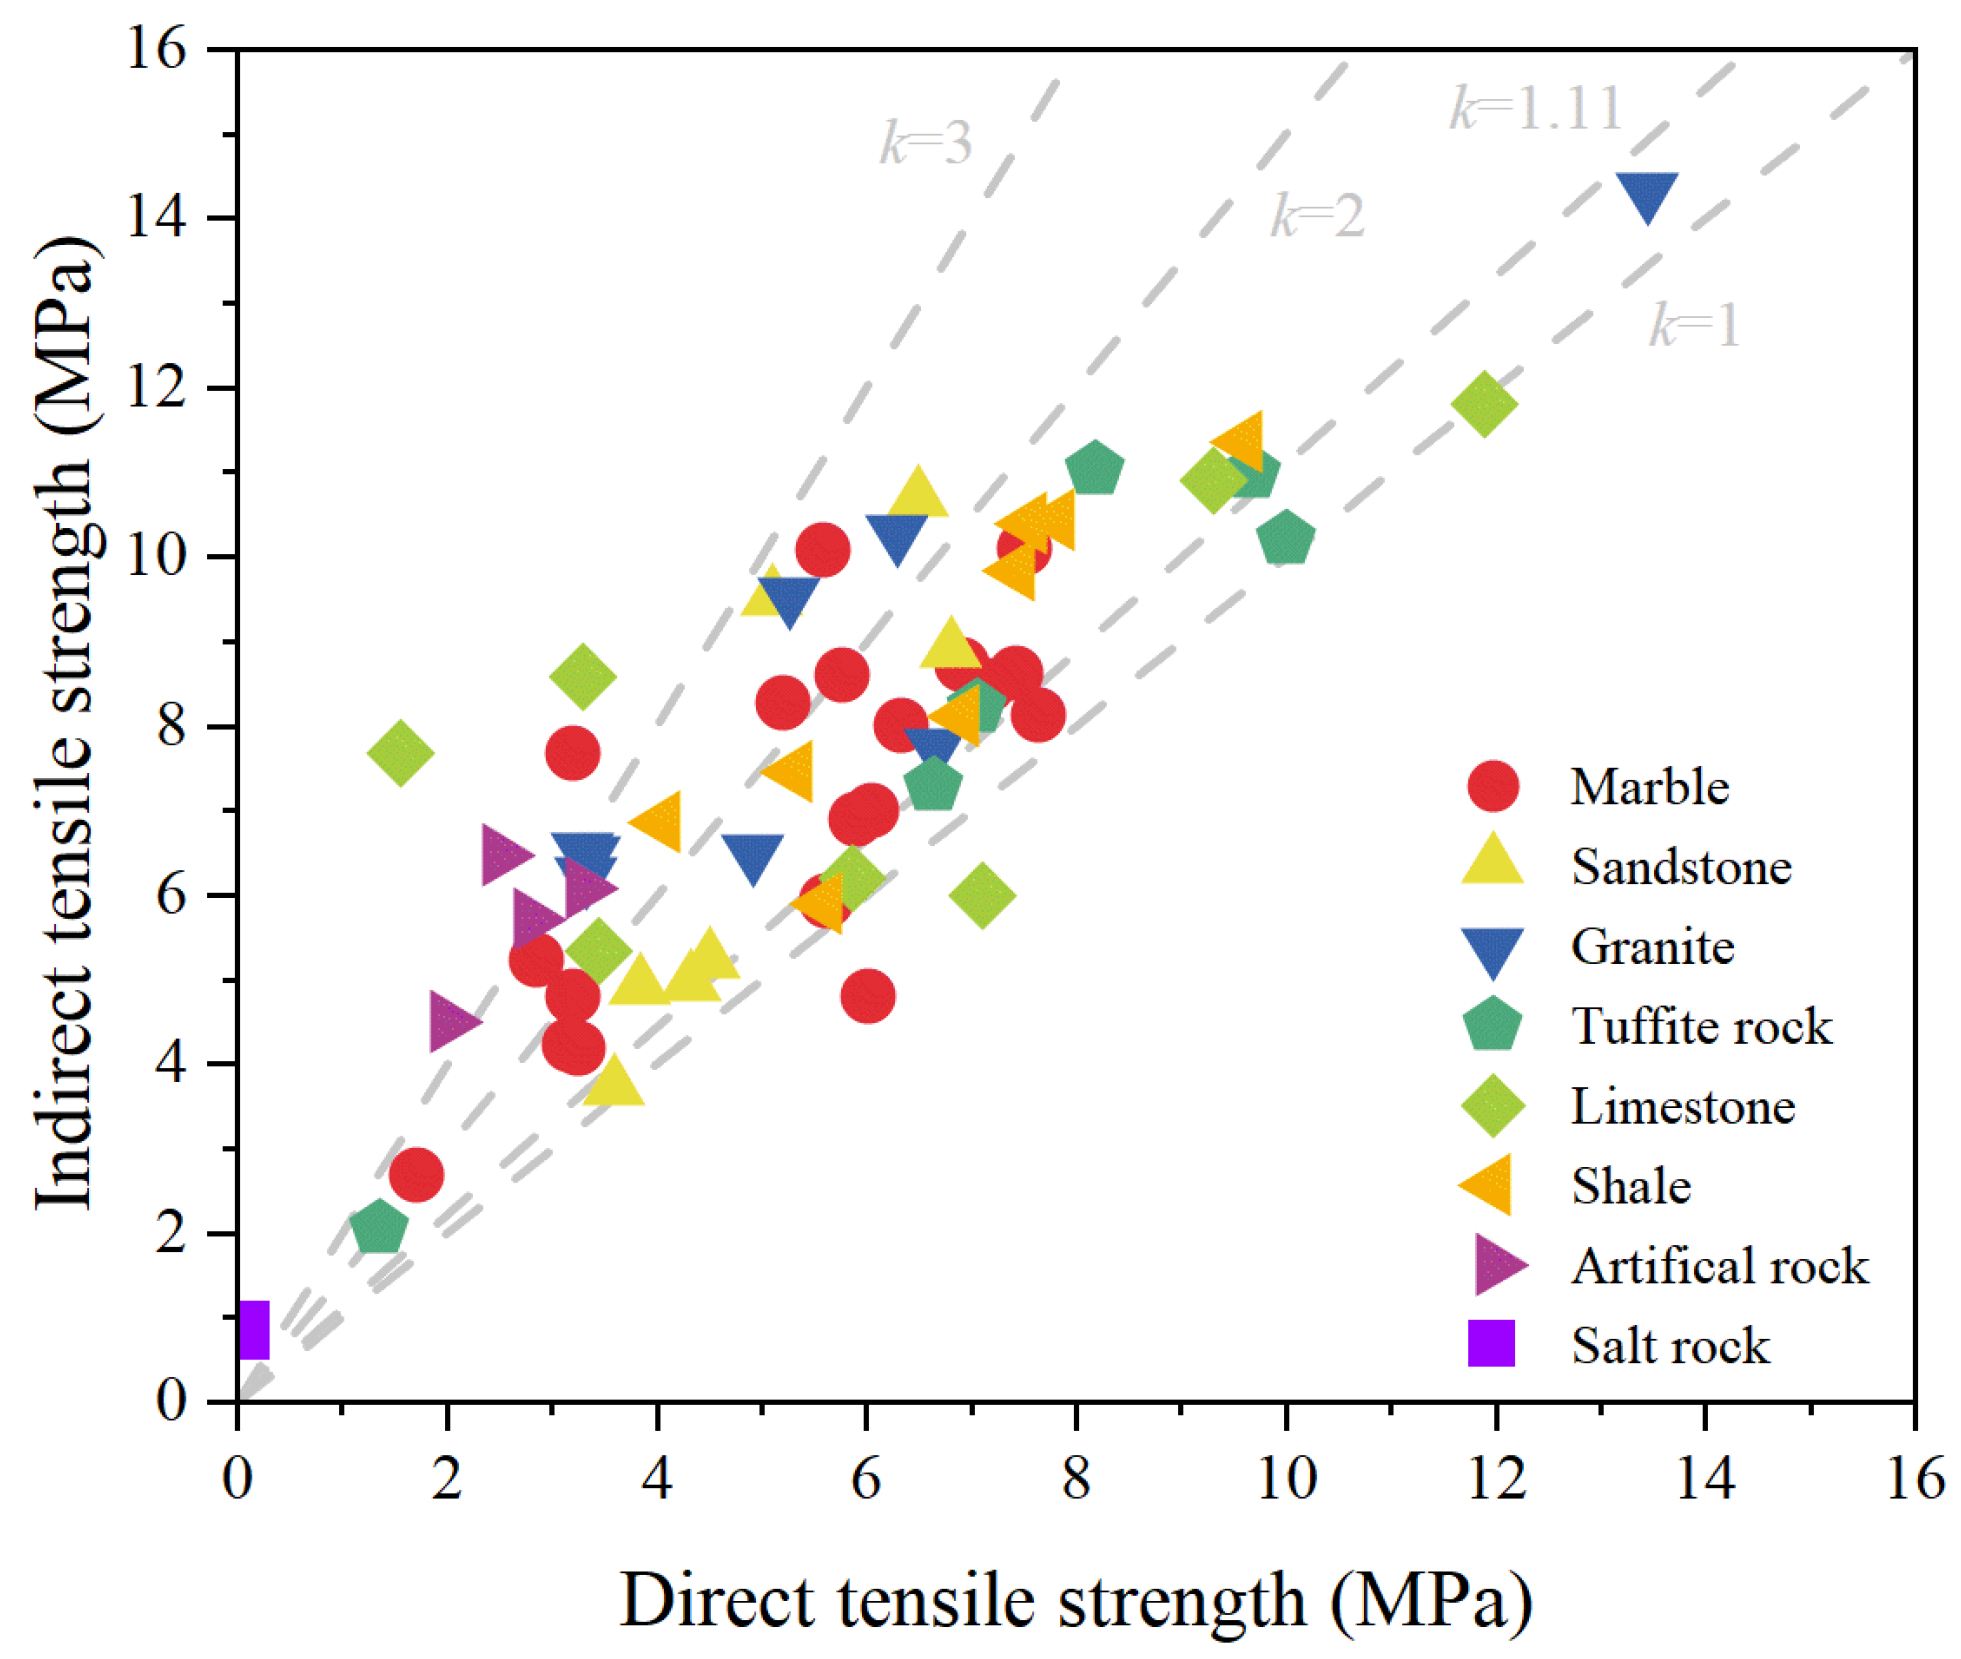
The difference between direct and indirect tensile strength is influenced by rock anisotropy, the testing method, and specimen geometry. The results obtained from the L-P criterion, SS criterion, and CPA criterion show good agreement with the measured results of both direct and indirect tensile strength. Furthermore, based on the statistical analysis in this study, estimating the indirect tensile strength as 1.11 times the direct tensile strength provides a reliable approximation for most cases.

Author Contributions

Conceptualization, T.M.; methodology, A.M.F.; investigation, A.M.F., T.M. and H.W.; writing—original draft preparation, A.M.F. and H.W.; writing—review and editing, T.M.; visualization, A.M.F. and H.W.; supervision, T.M.; funding acquisition, T.M. All authors have read and agreed to the published version of the manuscript.

Funding

This research was funded by the Natural Science Foundation of Sichuan Province, grant number 2024NSFSC0023.

Institutional Review Board Statement

Not applicable.

Informed Consent Statement

Not applicable.

Data Availability Statement

Data are contained within the article.

Conflicts of Interest

The authors declare no conflicts of interest.

References

  1. Wang, Y.M.; Wang, Z.L.; Zhang, Z.C.; Yao, S.S.; Zhang, H.; Zheng, G.Q.; Luo, F.F.; Feng, L.L.; Liu, K.Q.; Jiang, L.L. Recent techniques on analyses and characterizations of shale gas and oil reservoir. Energy Rev. 2024, 3, 100067. [Google Scholar] [CrossRef]
  2. Zhang, Y.; Kleit, A.; Morgan, E.; Wang, J. Analysis of ultimate gas recovery in shale reservoirs. J. Energy Resour. Technol. 2024, 146, 083001. [Google Scholar] [CrossRef]
  3. Zhou, J.; Wu, G.A.; Geng, Y.N.; Guo, Y.T.; Chang, X.; Peng, C.Y.; Ai, C.Z. Laboratory study of the factors affecting hydraulic fracturing effect for inter-salt oil shale layers, Qianjiang Depression, China. Pet. Sci. 2023, 20, 1690–1706. [Google Scholar] [CrossRef]
  4. Dan, D.Q.; Konietzky, H.; Herbst, M. Brazilian tensile strength tests on some anisotropic rocks. Int. J. Rock Mech. Min. Sci. 2013, 58, 1–7. [Google Scholar] [CrossRef]
  5. Li, C.B.; Yang, D.C.; Xie, H.P.; Ren, L.; Wang, J. Size effect of fracture characteristics for anisotropic quasi-brittle geomaterials. Int. J. Min. Sci. Technol. 2023, 33, 201–213. [Google Scholar] [CrossRef]
  6. Wang, H.N.; Ma, T.S.; Liu, Y.; Wu, B.S.; Ranjith, P.G. Numerical and experimental investigation of the anisotropic tensile behavior of layered rocks in 3D space under Brazilian test conditions. Int. J. Rock Mech. Min. Sci. 2023, 170, 105558. [Google Scholar] [CrossRef]
  7. Liu, Z.D.; Li, D.Y.; Liu, Y.P.; Yang, B.; Zhang, Z.X. Prediction of uniaxial compressive strength of rock based on lithology using stacking models. Rock Mech. Bull. 2023, 2, 100081. [Google Scholar] [CrossRef]
  8. Chong, Z.; Yao, Q.; Li, X. Experimental investigation of fracture propagation behavior induced by hydraulic fracturing in anisotropic shale cores. Energies 2019, 12, 976. [Google Scholar] [CrossRef]
  9. Ma, T.S.; Wang, H.N.; Liu, Y.; Shi, Y.F.; Ranjith, P.G. Fracture-initiation pressure model of inclined wells in transversely isotropic formation with anisotropic tensile strength. Int. J. Rock Mech. Min. Sci. 2022, 159, 105235. [Google Scholar] [CrossRef]
  10. Luo, N.; Zhang, H.; Chai, Y.; Li, P.; Zhai, C.; Zhou, J.; Ma, T. Research on damage failure mechanism and dynamic mechanical behavior of layered shale with different angles under confining pressure. Deep. Undergr. Sci. Eng. 2023, 2, 337–345. [Google Scholar] [CrossRef]
  11. Zhang, Y.K.; Chen, S.B.; Zhai, X.H.; Khan, J.; Zhang, Y.H. Brazilian splitting experiment and finite element simulation analysis of the influence of bedding loading angle on shale fracture mode. Nat. Gas Ind. B 2023, 10, 602–612. [Google Scholar] [CrossRef]
  12. Zhao, H.; Li, P.; Li, X.; Yao, W. Fracture propagation and evolution law of indirect fracturing in the roof of broken soft coal seams. Int. J. Coal Sci. Technol. 2024, 11, 4. [Google Scholar] [CrossRef]
  13. Perras, M.A.; Diederichs, M.S. A review of the tensile strength of rock: Concepts and testing. Geotech. Geol. Eng. 2014, 32, 525–546. [Google Scholar] [CrossRef]
  14. Ma, T.S.; Peng, N.; Zhu, Z.; Zhang, Q.B.; Yang, C.H.; Zhao, J. Brazilian tensile strength of anisotropic rocks: Review and new insights. Energies 2018, 11, 304. [Google Scholar] [CrossRef]
  15. Efe, T.; Demirdag, S.; Tufekci, K.; Sengun, N.; Altindag, R. Estimating the direct tensile strength of rocks from indirect tests. Arab. J. Geosci. 2021, 14, 1343. [Google Scholar] [CrossRef]
  16. Tan, X.; Konietzky, H.; Frühwirt, T.; Dan, D.Q. Brazilian tests on transversely isotropic rocks: Laboratory testing and numerical simulations. Rock Mech. Rock Eng. 2015, 48, 1341–1351. [Google Scholar] [CrossRef]
  17. Zhong, S.; Zuo, S.; Mao, L.; Luo, S.; Wang, X. Mechanism of anisotropic characteristics of layered limestone and a constitutive model for different bedding angles based on a Brazilian tensile test. Arab. J. Geosci. 2020, 13, 1228. [Google Scholar] [CrossRef]
  18. Li, C.; Zou, B.; Zhou, H.; Wang, J. Experimental investigation on failure behaviors and mechanism of an anisotropic shale in direct tension. Geomech. Geophys. Geo-Energy Geo Resour. 2021, 7, 98. [Google Scholar] [CrossRef]
  19. Liu, P.; Liu, Q.; Huang, X.; Hu, M.; Bo, Y.; Yuan, D.; Xie, X. Direct tensile test and FDEM numerical study on anisotropic tensile strength of Kangding slate. Rock Mech. Rock Eng. 2022, 55, 7765–7789. [Google Scholar] [CrossRef]
  20. Alencar, A.; Muñiz-Menéndez, M.; Pérez-Rey, I.; Galindo, R. An experimental study of tensile stress and deformation in an anisotropic rock. IOP Conf. Ser. Earth Environ. Sci. 2024, 1295, 012010. [Google Scholar] [CrossRef]
  21. Huang, Z.; Zhang, Y.; Li, Y.; Zhang, D.; Yang, T.; Sui, Z. Determining tensile strength of rock by the direct tensile, Brazilian splitting, and three-point bending methods: A comparative study. Adv. Civ. Eng. 2021, 2021, 5519230. [Google Scholar] [CrossRef]
  22. Fuenkajorn, K.; Klanphumeesri, S. Laboratory determination of direct tensile strength and deformability of intact rocks. Geotech. Test. J. 2011, 34, 97–102. [Google Scholar] [CrossRef]
  23. Liu, J.; Lyu, C.; Lu, G.; Shi, X.; Li, H.; Liang, C.; Deng, C. Evaluating a new method for direct testing of rock tensile strength. Int. J. Rock Mech. Min. Sci. 2022, 160, 105258. [Google Scholar] [CrossRef]
  24. Claesson, J.; Bohloli, B. Brazilian test: Stress field and tensile strength of anisotropic rocks using an analytical solution. Int. J. Rock Mech. Min. Sci. 2002, 39, 991–1004. [Google Scholar] [CrossRef]
  25. Ma, T.S.; Wang, H.N.; Liu, Y.; Fu, C.L.; Ranjith, P.G. Experimental investigation on the anisotropy of mode-I fracture and tensile failure of layered shale. Eng. Fract. Mech. 2023, 290, 109484. [Google Scholar] [CrossRef]
  26. Hobbs, D.W. Rock tensile strength and its relationship to a number of alternative measures of rock strength. Int. J. Rock Mech. Min. Sci. 1976, 4, 115–127. [Google Scholar] [CrossRef]
  27. Barron, K. Brittle fracture initiation in and ultimate failure of rocks: Part I—Anisotropic rocks: Theory. Int. J. Rock Mech. Min. Sci. 1971, 8, 553–563. [Google Scholar] [CrossRef]
  28. Nova, R.; Zaninetti, A. An investigation into the tensile behaviour of a schistose rock. Int. J. Rock Mech. Min. Sci. 1990, 27, 231–242. [Google Scholar] [CrossRef]
  29. Lee, Y.K.; Pietruszczak, S. Tensile failure criterion for transversely isotropic rocks. Int. J. Rock Mech. Min. Sci. 2015, 79, 205–215. [Google Scholar] [CrossRef]
  30. Liu, P.; Liu, Q.S.; Deng, P.H.; Huang, X.; Xie, X.Q. A new phenomenological anisotropic tensile failure criterion and its application in FDEM simulations. Eng. Fract. Mech. 2023, 289, 109359. [Google Scholar] [CrossRef]
  31. Nejati, M.; Aminzadeh, A.; Driesner, T.; Saar, M.O. On the directional dependency of mode I fracture toughness in anisotropic rocks. Theor. Appl. Fract. Mech. 2020, 107, 102494. [Google Scholar] [CrossRef]
  32. Jaeger, J.C. Failure of rocks under tensile conditions. Int. J. Rock Mech. Min. Sci. Geomech. Abstracts 1967, 4, 219–227. [Google Scholar] [CrossRef]
  33. Mellor, M.; Hawkes, I. Measurement of tensile strength by diametral compression of discs and annuli. Eng. Geol. 1971, 5, 173–225. [Google Scholar] [CrossRef]
  34. Efimov, V.P. The rock strength in different tension conditions. J. Min. Sci. 2009, 45, 569–575. [Google Scholar] [CrossRef]
  35. Pandey, P.; Singh, D.P. Deformation of a rock in different tensile tests. Eng. Geol. 1986, 22, 281–292. [Google Scholar] [CrossRef]
  36. Briševac, Z.; Kujundžić, T.; Čajić, S. Current cognition of rock tensile strength testing by Brazilian test. Min. Geol. Pet. Eng. Bull. 2015, 30, 101–128. [Google Scholar] [CrossRef]
  37. Cacciari, P.P.; Futai, M.M. Assessing the tensile strength of rocks and geological discontinuities via pull-off tests. Int. J. Rock Mech. Min. Sci. 2018, 105, 44–52. [Google Scholar] [CrossRef]
  38. Unlu, T.; Yilmaz, O. Development of a new push–pull direct tensile strength testing apparatus (PPTA). Geotech. Test. J. 2014, 37, 60–70. [Google Scholar] [CrossRef]
  39. Read, S.A.L.; Richards, L.R. Correlation of direct and indirect tensile tests for use in the Hoek-Brown constant mi. In Proceedings of the ISRM Regional Symposium–EUROCK 2014, Vigo, Spain, 27–29 May 2014. [Google Scholar]
Figure 1. Specimen preparation of DTT with different loading angles. (a) Schematic diagram of shale coring, (b) Top view [23], (c) Section-cutting plane [23], (d) 3D perspective, and (e) Typical shale specimen for DTT.
Applsci 15 02669 g001
Figure 2. Specimen preparation of BST with different loading angles. (a) Schematic diagram of shale coring, and (b) Typical shale specimen for BST.
Applsci 15 02669 g002
Figure 3. Test set-up for DTT and BST. (a) Set-up for rock mechanics test system, (b) Set-up for DTT, (c) Set-up for BST, and (d) AE probe configuration for BTS.
Applsci 15 02669 g003
Figure 4. Load–displacement curves with different loading angles obtained by (a) DTT and (b) BST.
Applsci 15 02669 g004
Figure 5. The direct and indirect tensile strength under different loading angles.
Applsci 15 02669 g005
Figure 6. Accumulated AE ringing count and energy of DTT and BST with different loading angles. (a) β = 0°, (b) β = 15°, (c) β = 30°, (d) β = 45°, (e) β = 60°, (f) β = 75°, and (g) β = 90°.
Applsci 15 02669 g006aApplsci 15 02669 g006b
Figure 7. Typical failure modes of DTT specimens under different loading angles.
Applsci 15 02669 g007
Figure 8. Failure modes of BST specimens under different loading angles.
Applsci 15 02669 g008
Figure 9. Comparison between theoretical and test tensile strength. (a) Direct tensile strength, and (b) Indirect tensile strength.
Applsci 15 02669 g009
Figure 10. The direct and indirect tensile strength of eight kinds of rocks.
Applsci 15 02669 g010
Figure 11. Typical failure modes of BST specimen of layered Longmaxi shale, where the letter relates to (A) Tensile failure along the bedding plane, (B) Arc-shaped tensile–shear mixed failure, and (C) Tensile failure across the bedding plane.
Applsci 15 02669 g011
Figure 12. Typical failure modes of BST specimen of layered shale [14], where the number relates to (1) Tensile failure across the weakness planes, (2) Tensile failure along the weakness planes, (3) Shear failure across the weakness planes, (4) Shear failure along the weakness planes, and (5) Mixed failure.
Applsci 15 02669 g012
Figure 13. Typical failure modes of DTT specimen of layered Longmaxi shale. where the letter relates to (A) Tensile failure within the rock matrix, (B) Slipping failure along the bedding plane, (C) Tensile–slipping mixed failure, and (D) More complex tensile–shear failure.
Applsci 15 02669 g013
Table 1. Accuracy comparison of seven anisotropic tensile strength criteria based on experimental results.
Mean Error for BST (%)Mean SD for BST (MPa)Mean Error for DTT (%)Mean SD for DTT (MPa)
H-B criterion6.620.2915.140.53
N-Z criterion2.740.1213.260.45
SPW criterion7.550.3214.110.49
L-P criterion2.350.1110.360.36
CPA criterion3.230.149.500.33
Phenomenological criterion7.960.3724.350.87
SS criterion2.350.1110.360.36
Disclaimer/Publisher’s Note: The statements, opinions and data contained in all publications are solely those of the individual author(s) and contributor(s) and not of MDPI and/or the editor(s). MDPI and/or the editor(s) disclaim responsibility for any injury to people or property resulting from any ideas, methods, instructions or products referred to in the content.

