
Analysis of Corrosion-Mechanical Properties of Electroplated and Hot-Dip Zinc Coatings on Mechanically Pre-Treated Steel Substrate


Abstract
1. Introduction
- Natural abrasives (e.g., silica sand, flint, garnet, zircon).
- Agricultural by-products (e.g., walnut shells, corn cobs).
- Industrially manufactured abrasives (e.g., steel shots, aluminum oxide, silicon carbide, plastics, glass beads).
2. Materials and Methods
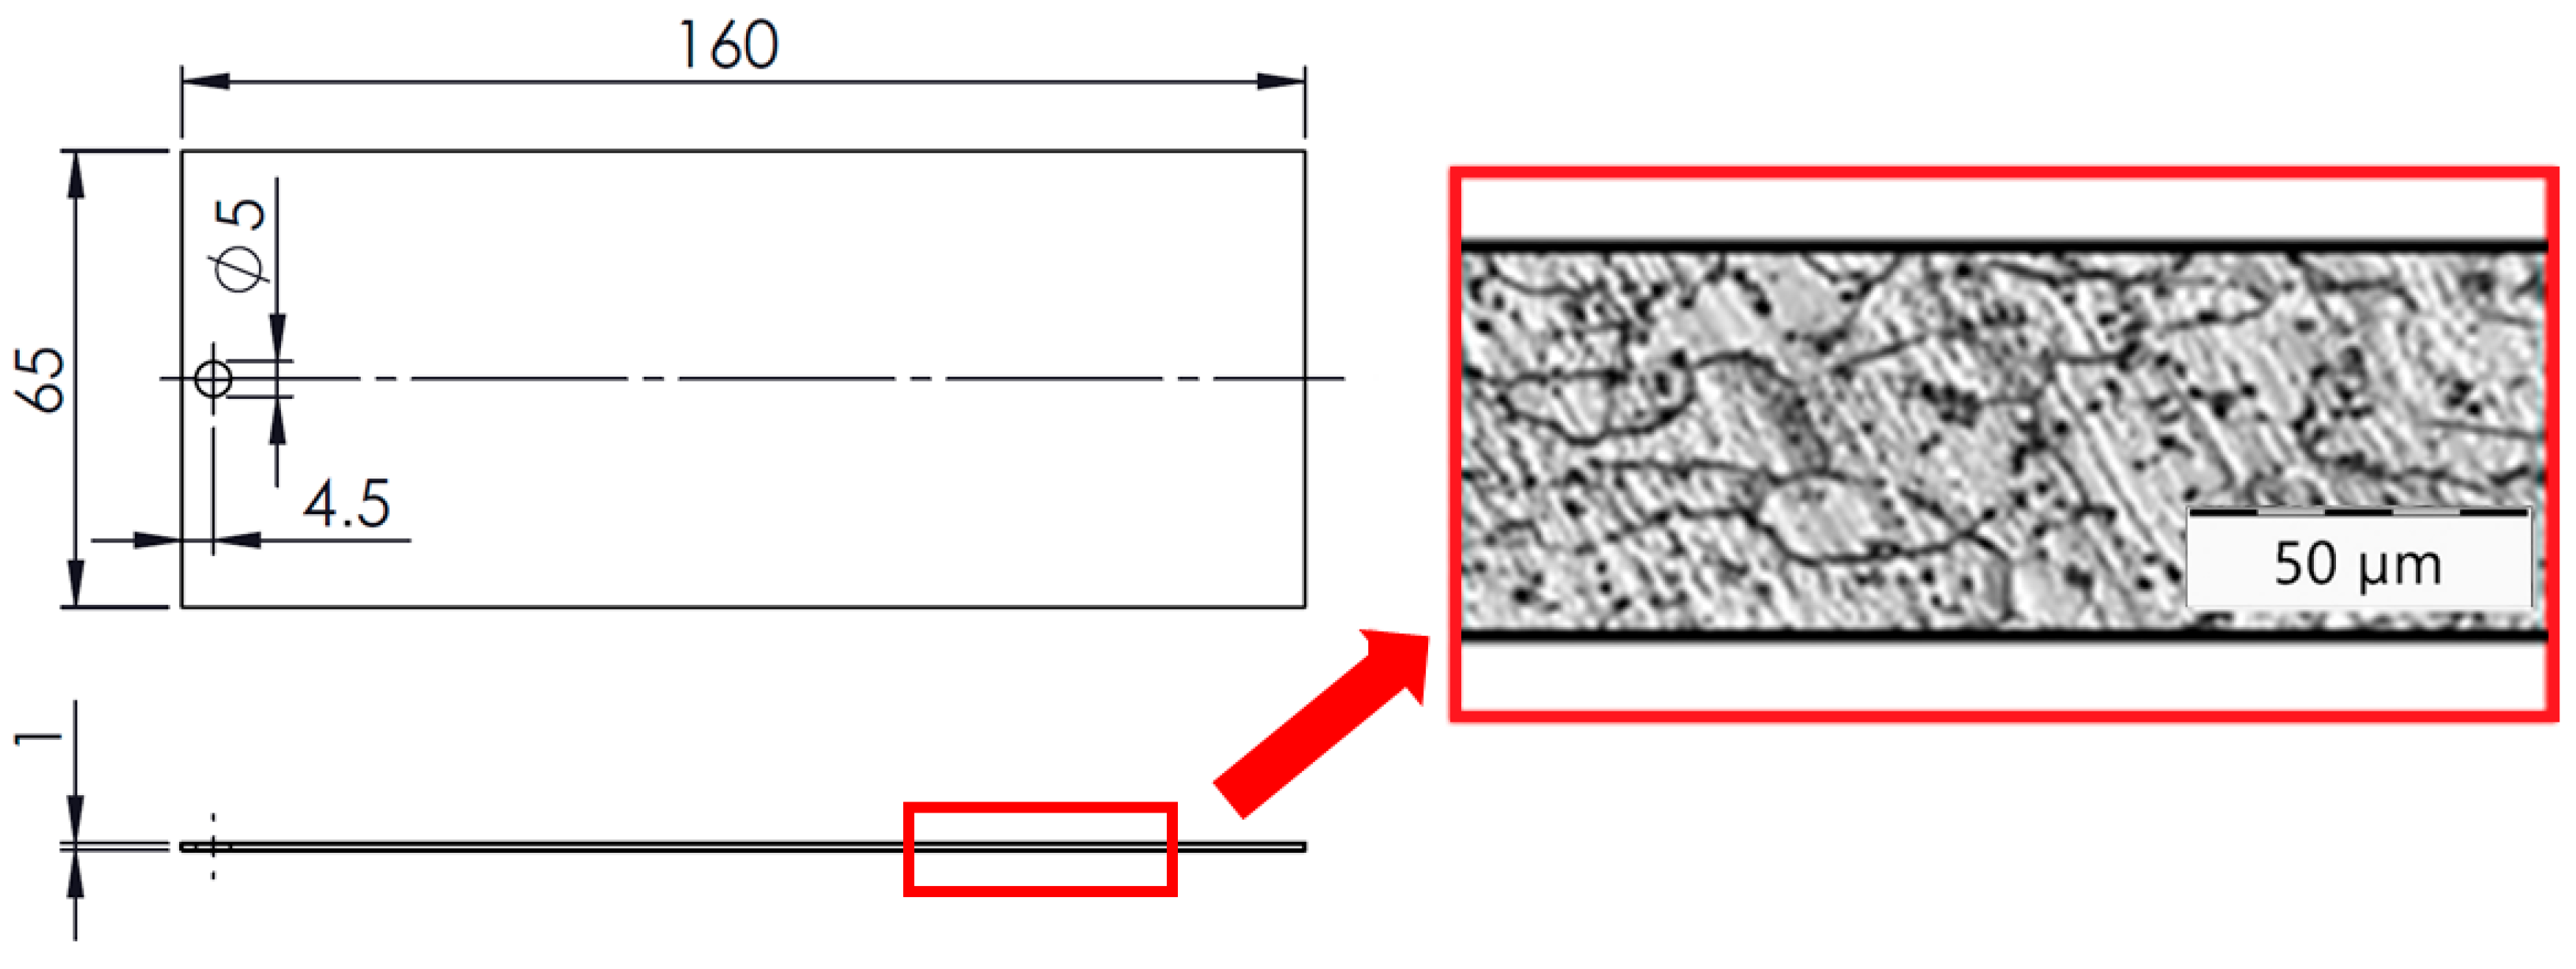
2.1. Base Substrate, Sample Dimensions, and Mechanical Pre-Treatments
- Pressure: 0.5 ± 0.05 MPa
- Nozzle-to-sample distance: 200–250 mm
- Abrasive impact angle: 45 ± 10°
- Blasting duration: 70–80 s per side
- Tool rotational speed: n = 45 min−1
- Workpiece feed rate (cross-feed of milling table): s = 450 mm·min−1
- Wire diameter: 1.6 mm
- Outer diameter: 12 mm
- Free length: 45 mm
- Number of coils: 11

| Physical Property | Synthetic Corundum | Steel Grit | ||
|---|---|---|---|---|
| Hardness | 9 Mohs | 390–530 HV | ||
| Melting Point, °C | 2040 | 1530 | ||
| Bulk Density, kg·m−3 | 1800 ± 300 | 7000 ± 60 | ||
| Grain Shape | Angular | Spherical | ||
| Grain Size Designation | F40 (355–500 µm) | S170 (350–710 µm) | ||
| Chemical Composition | Compound, wt.% | Chem. Element, wt.% | ||
| Al2O3 | 99.52 | C | 0.80–1.20 | |
| TiO2 | 0.07 | Si | 0.40–1.50 | |
| SiO2 | 0.17 | Mn | 0.60–1.20 | |
| Fe2O3 | 0.07 | S | max. 0.05 | |
| MgO | 0.01 | P | max. 0.05 | |
| CaO | 0.02 | Fe | Remainder | |

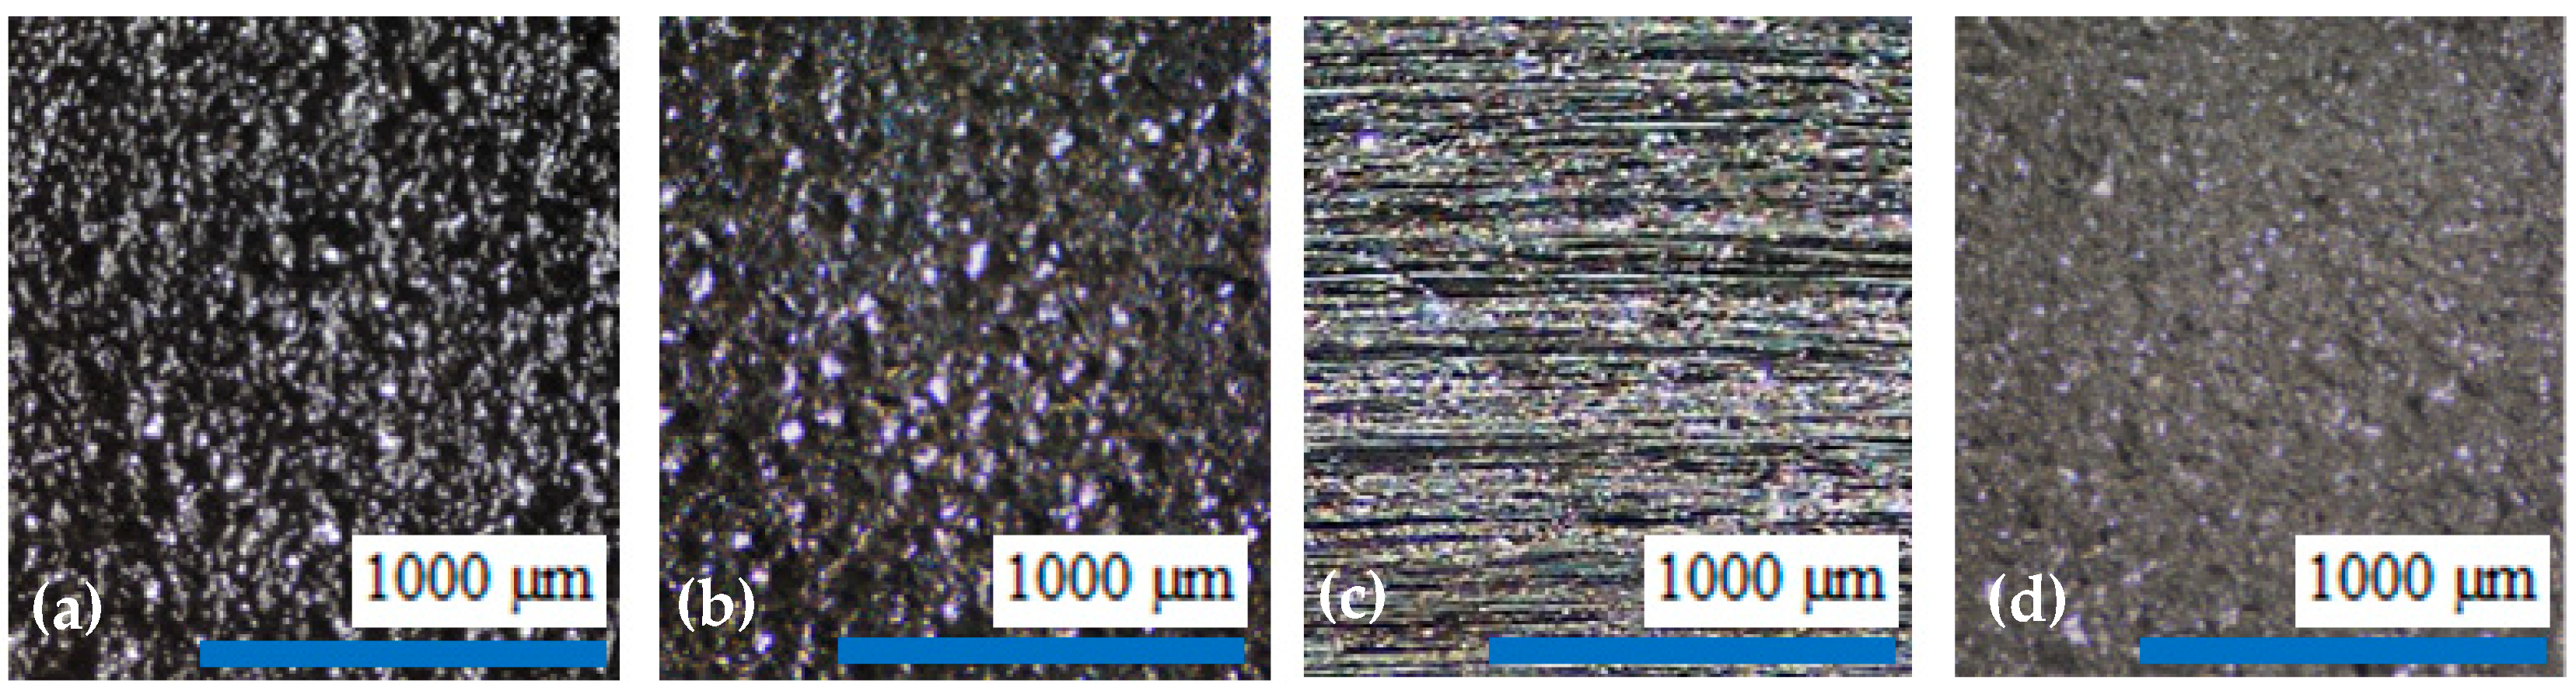
- Steel shot blasting induces significant plastic deformation, creating a surface morphology characterized by intersecting spherical depressions.
- Synthetic corundum blasting also results in notable plastic deformation; however, the impact on subsurface layers is less extensive due to the lower kinetic energy of angular abrasive particles. The interaction between the sharp-edged abrasive and the substrate produces distinct indentations and protrusions.
- Grinding predominantly involves material removal, with only minimal plastic deformation. Unlike blasting, plastic deformation in grinding is negligible, particularly when using new abrasive tools, as was the case in this experiment.
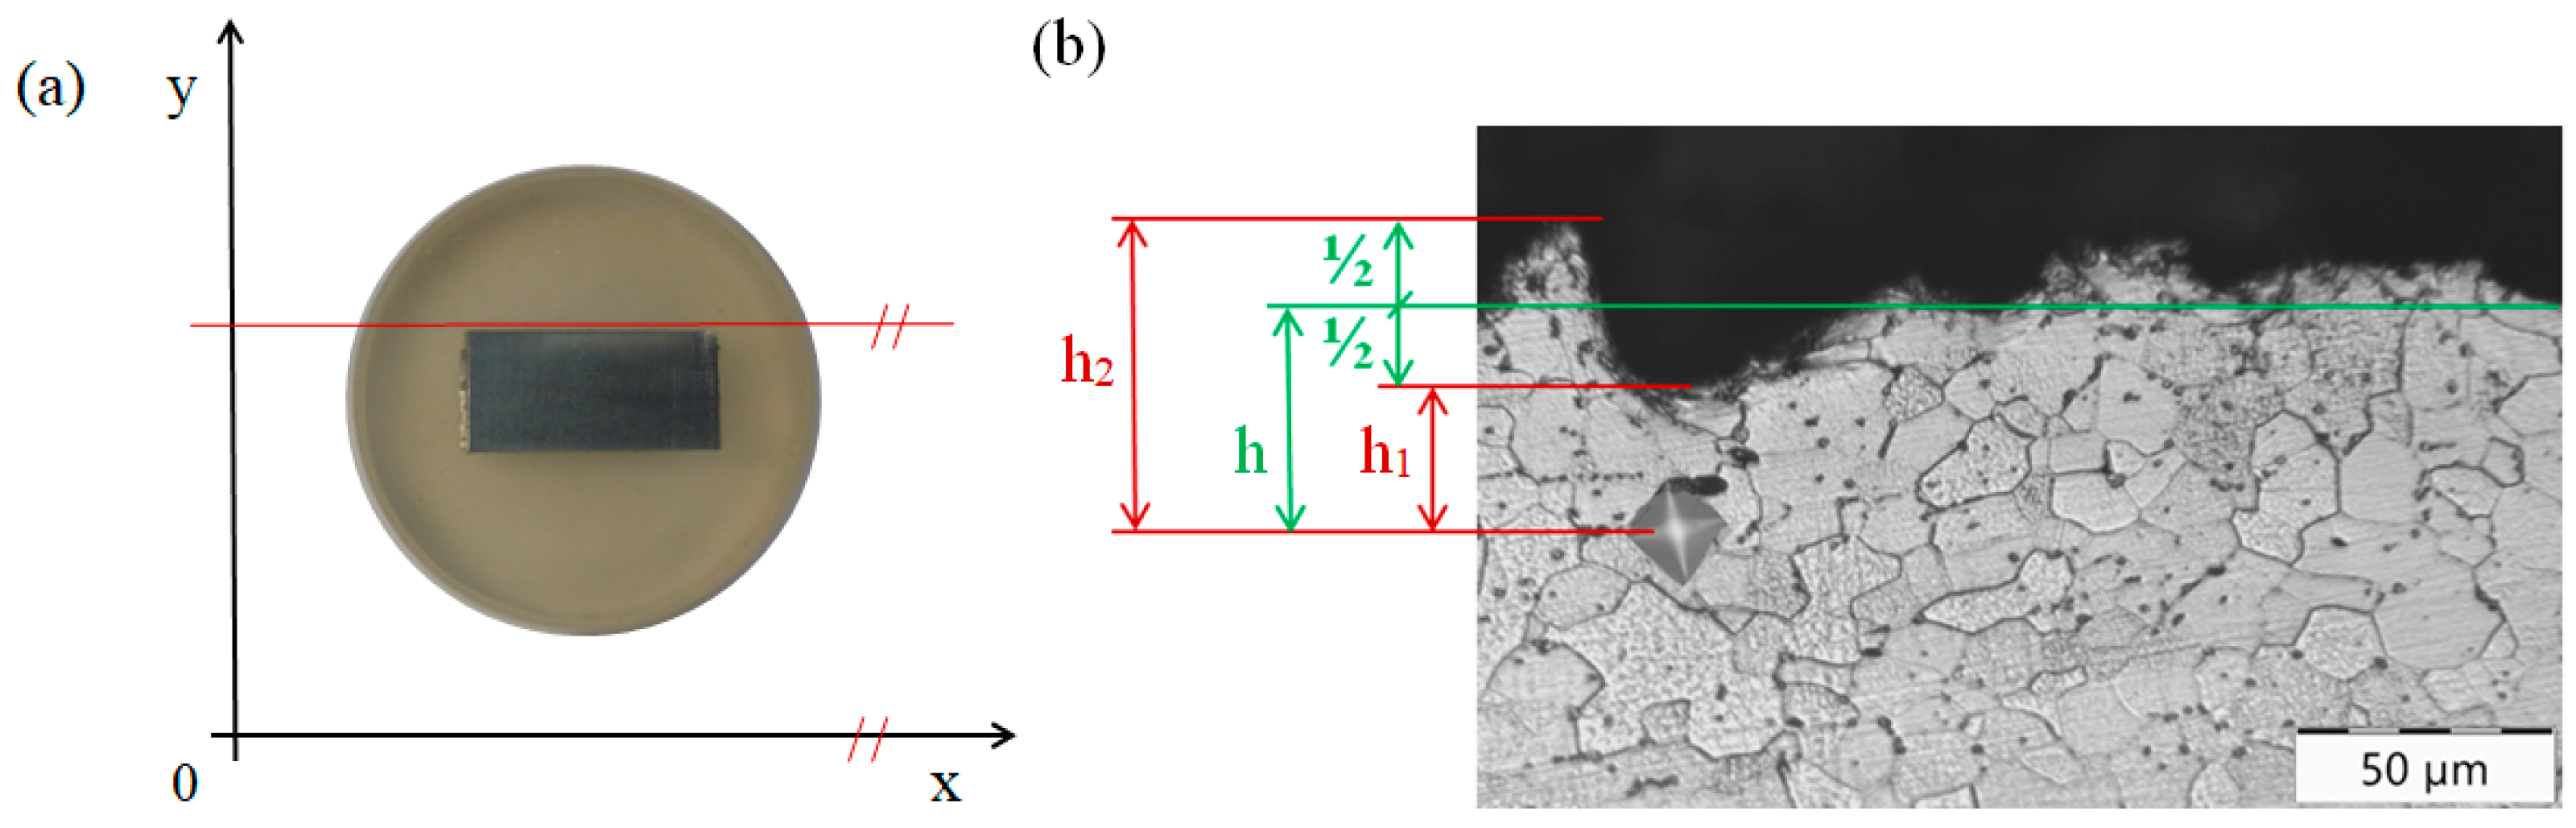
2.2. Evaluation of Surface Integrity of the Steel Substrate
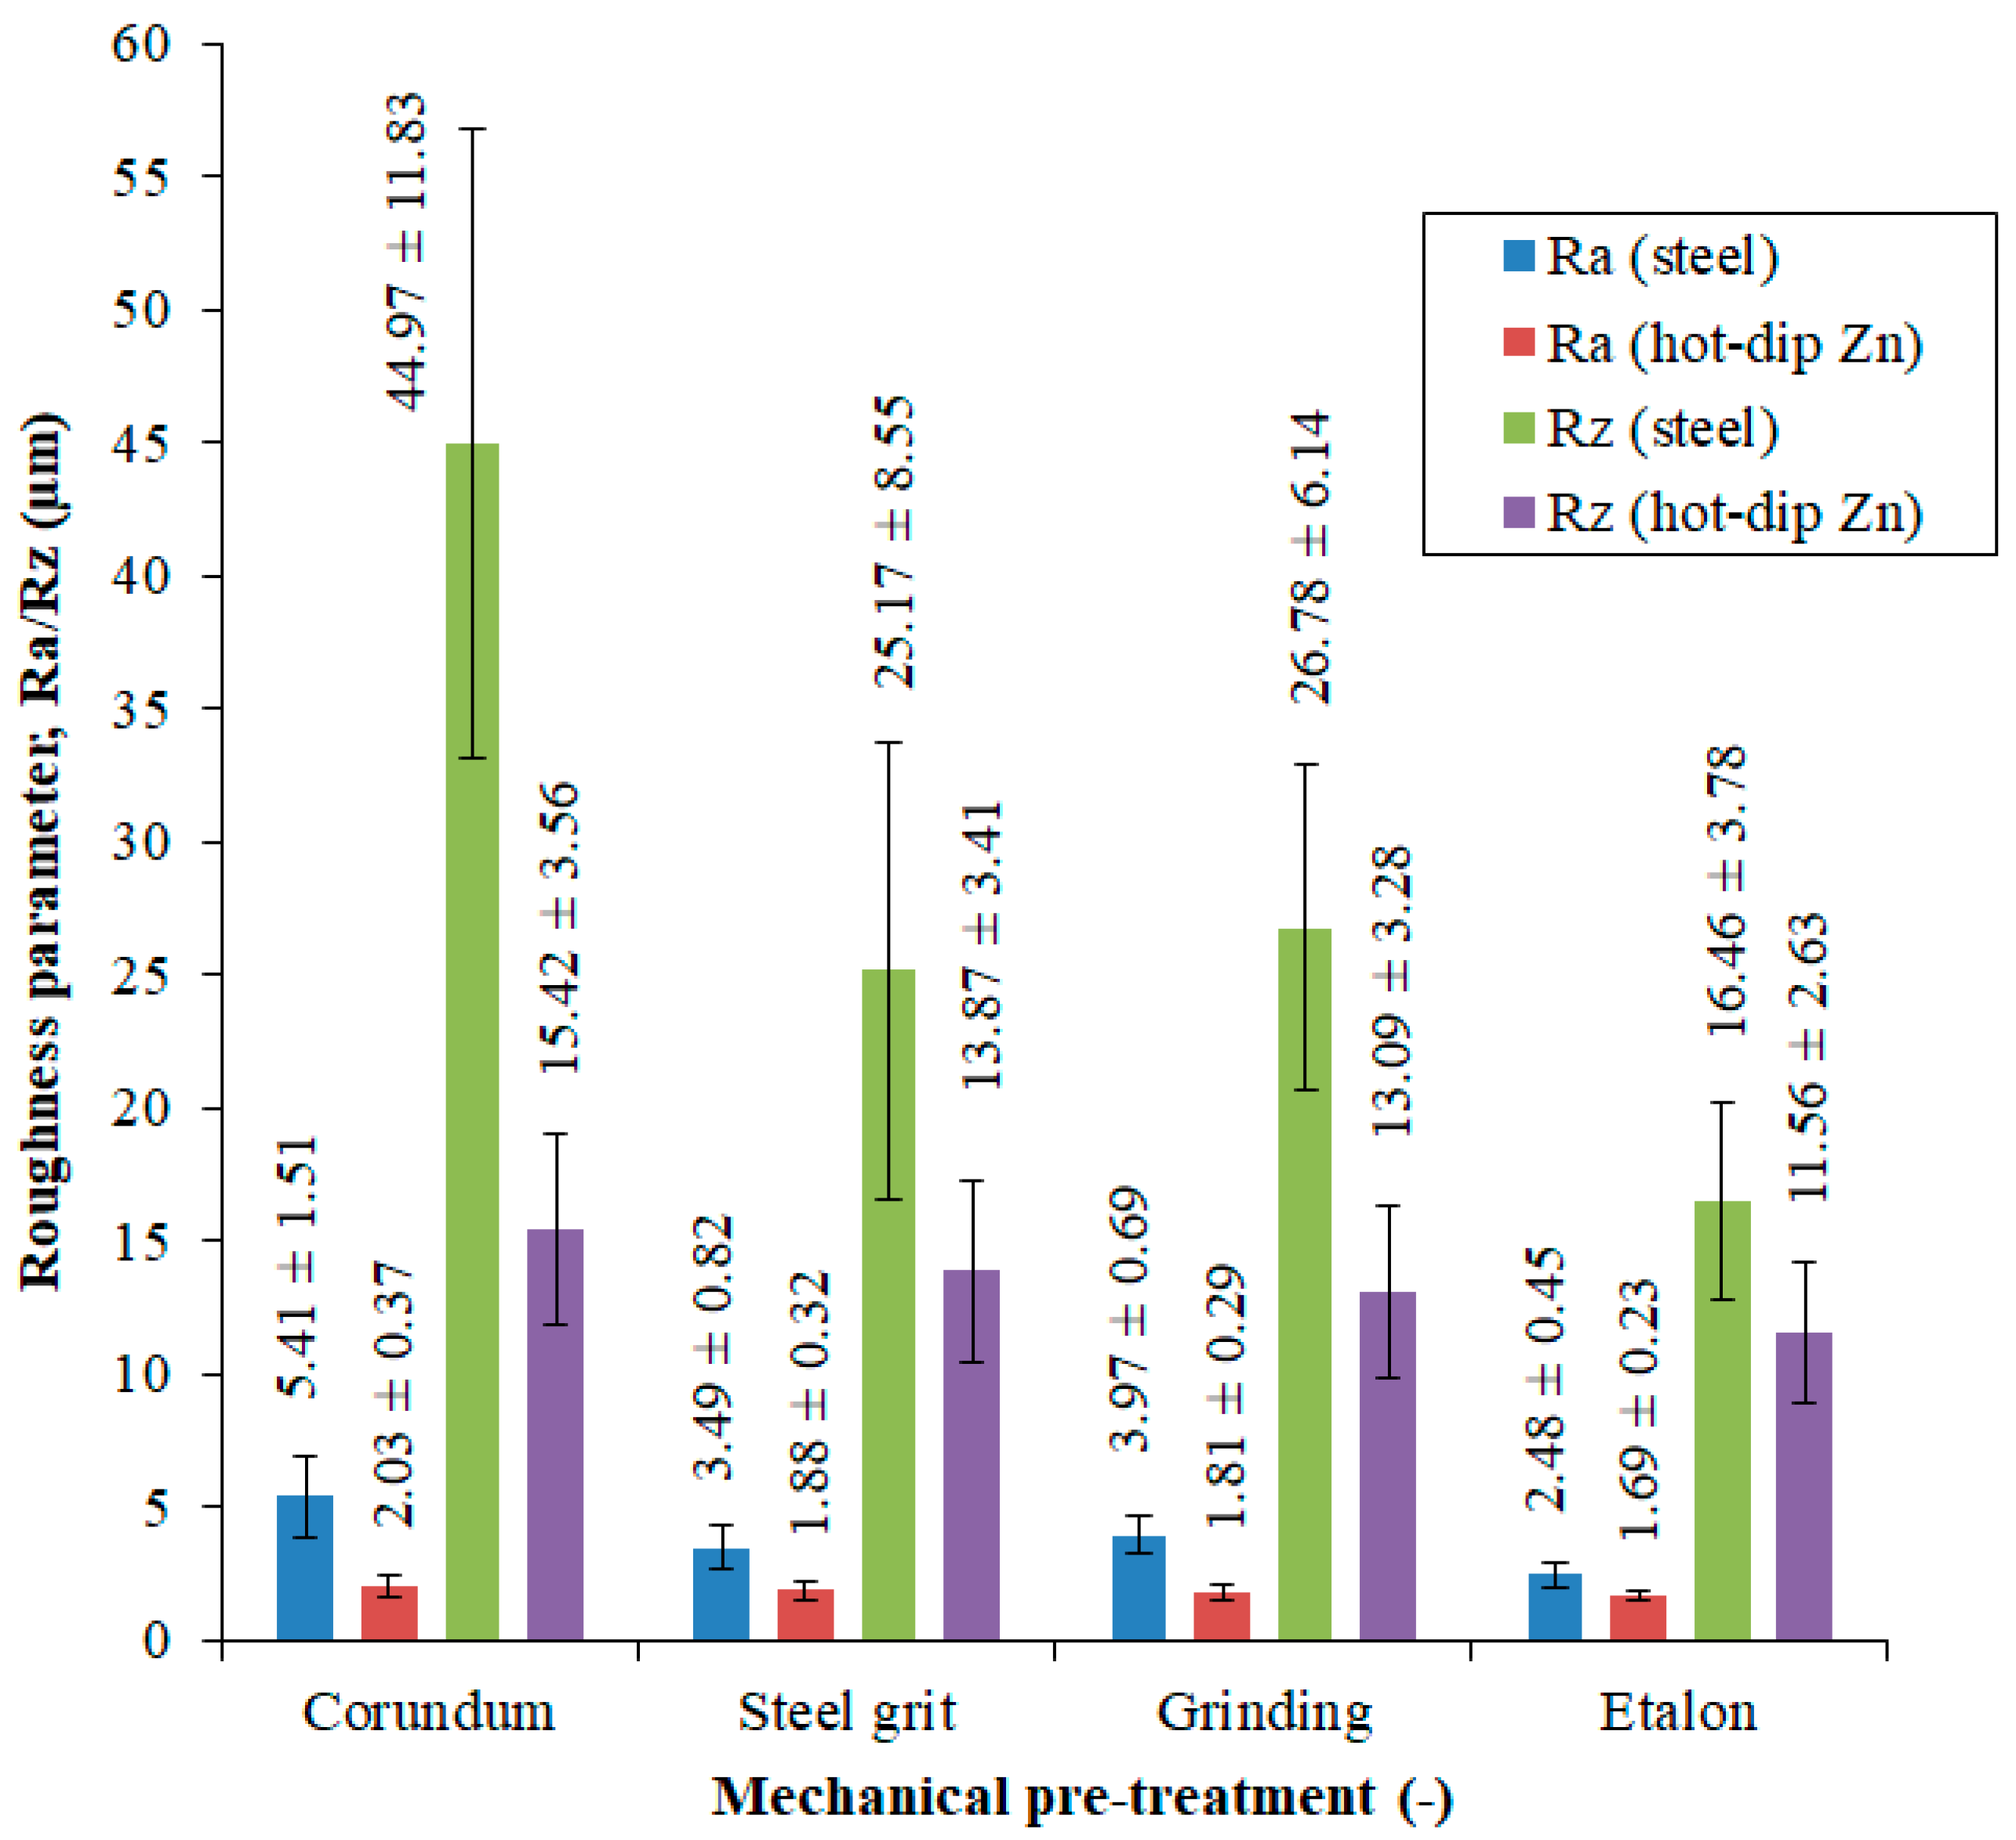
- Ra (arithmetical mean deviation of the assessed roughness profile)
- Rz (maximum roughness height, defined as the sum of the highest peak and the lowest valley depth)
- Sampling length (λc): 2.5 mm
- Number of sampling lengths: 5
- Total evaluation length (ln): 12.5 mm
- Filter type: Gaussian
- P200
- P400
- P1000
- P2500
2.3. Electrolytic Zinc Coating Process
- 900 s (15 min)
- 1800 s (30 min)
- 2700 s (45 min)
- 3600 s (60 min)
- 4500 s (75 min)
2.4. Hot-Dip Galvanizing Process
- 99.50 wt.% Zn
- 0.30 wt.% Al
- 0.15 wt.% Sn
- 0.05 wt.% Bi
- 70 s
- 105 s
- 140 s
- 175 s
- 210 s
2.5. Methodology of Analysis of Deposited Zinc Mass and Zinc Coating Quality
2.6. Methodology of Mechanical Testing of Zinc Coatings
2.7. Methodology of Corrosion Testing of Zinc Coatings
- A total of 16 h of continuous salt spray exposure.
- A period of 8 h for the natural evaporation of the deposited solution from the sample surface (ambient temperature: 20–24 °C, relative humidity: 40–60%).
- Regular photographic documentation and additional analyses.
- Salt fog environment temperature: 35 ± 2 °C
- Sodium chloride concentration in distilled water: 50 ± 5 g·L−1
- pH of the sodium chloride solution (at 20 ± 2 °C): 6.5–7.2
- Consumption rate of sodium chloride solution: 0.5–0.6 L·h−1
- Air pressure at spray nozzles: 120 kPa
- Inclination angle of test samples: 20 ± 2° (relative to the vertical plane)
- Number of test samples per set: 5
3. Results and Discussion
3.1. Evaluation of the Surface Integrity of the Steel Substrate
3.2. Analysis of Deposited Zinc Mass and Zinc Coating Quality
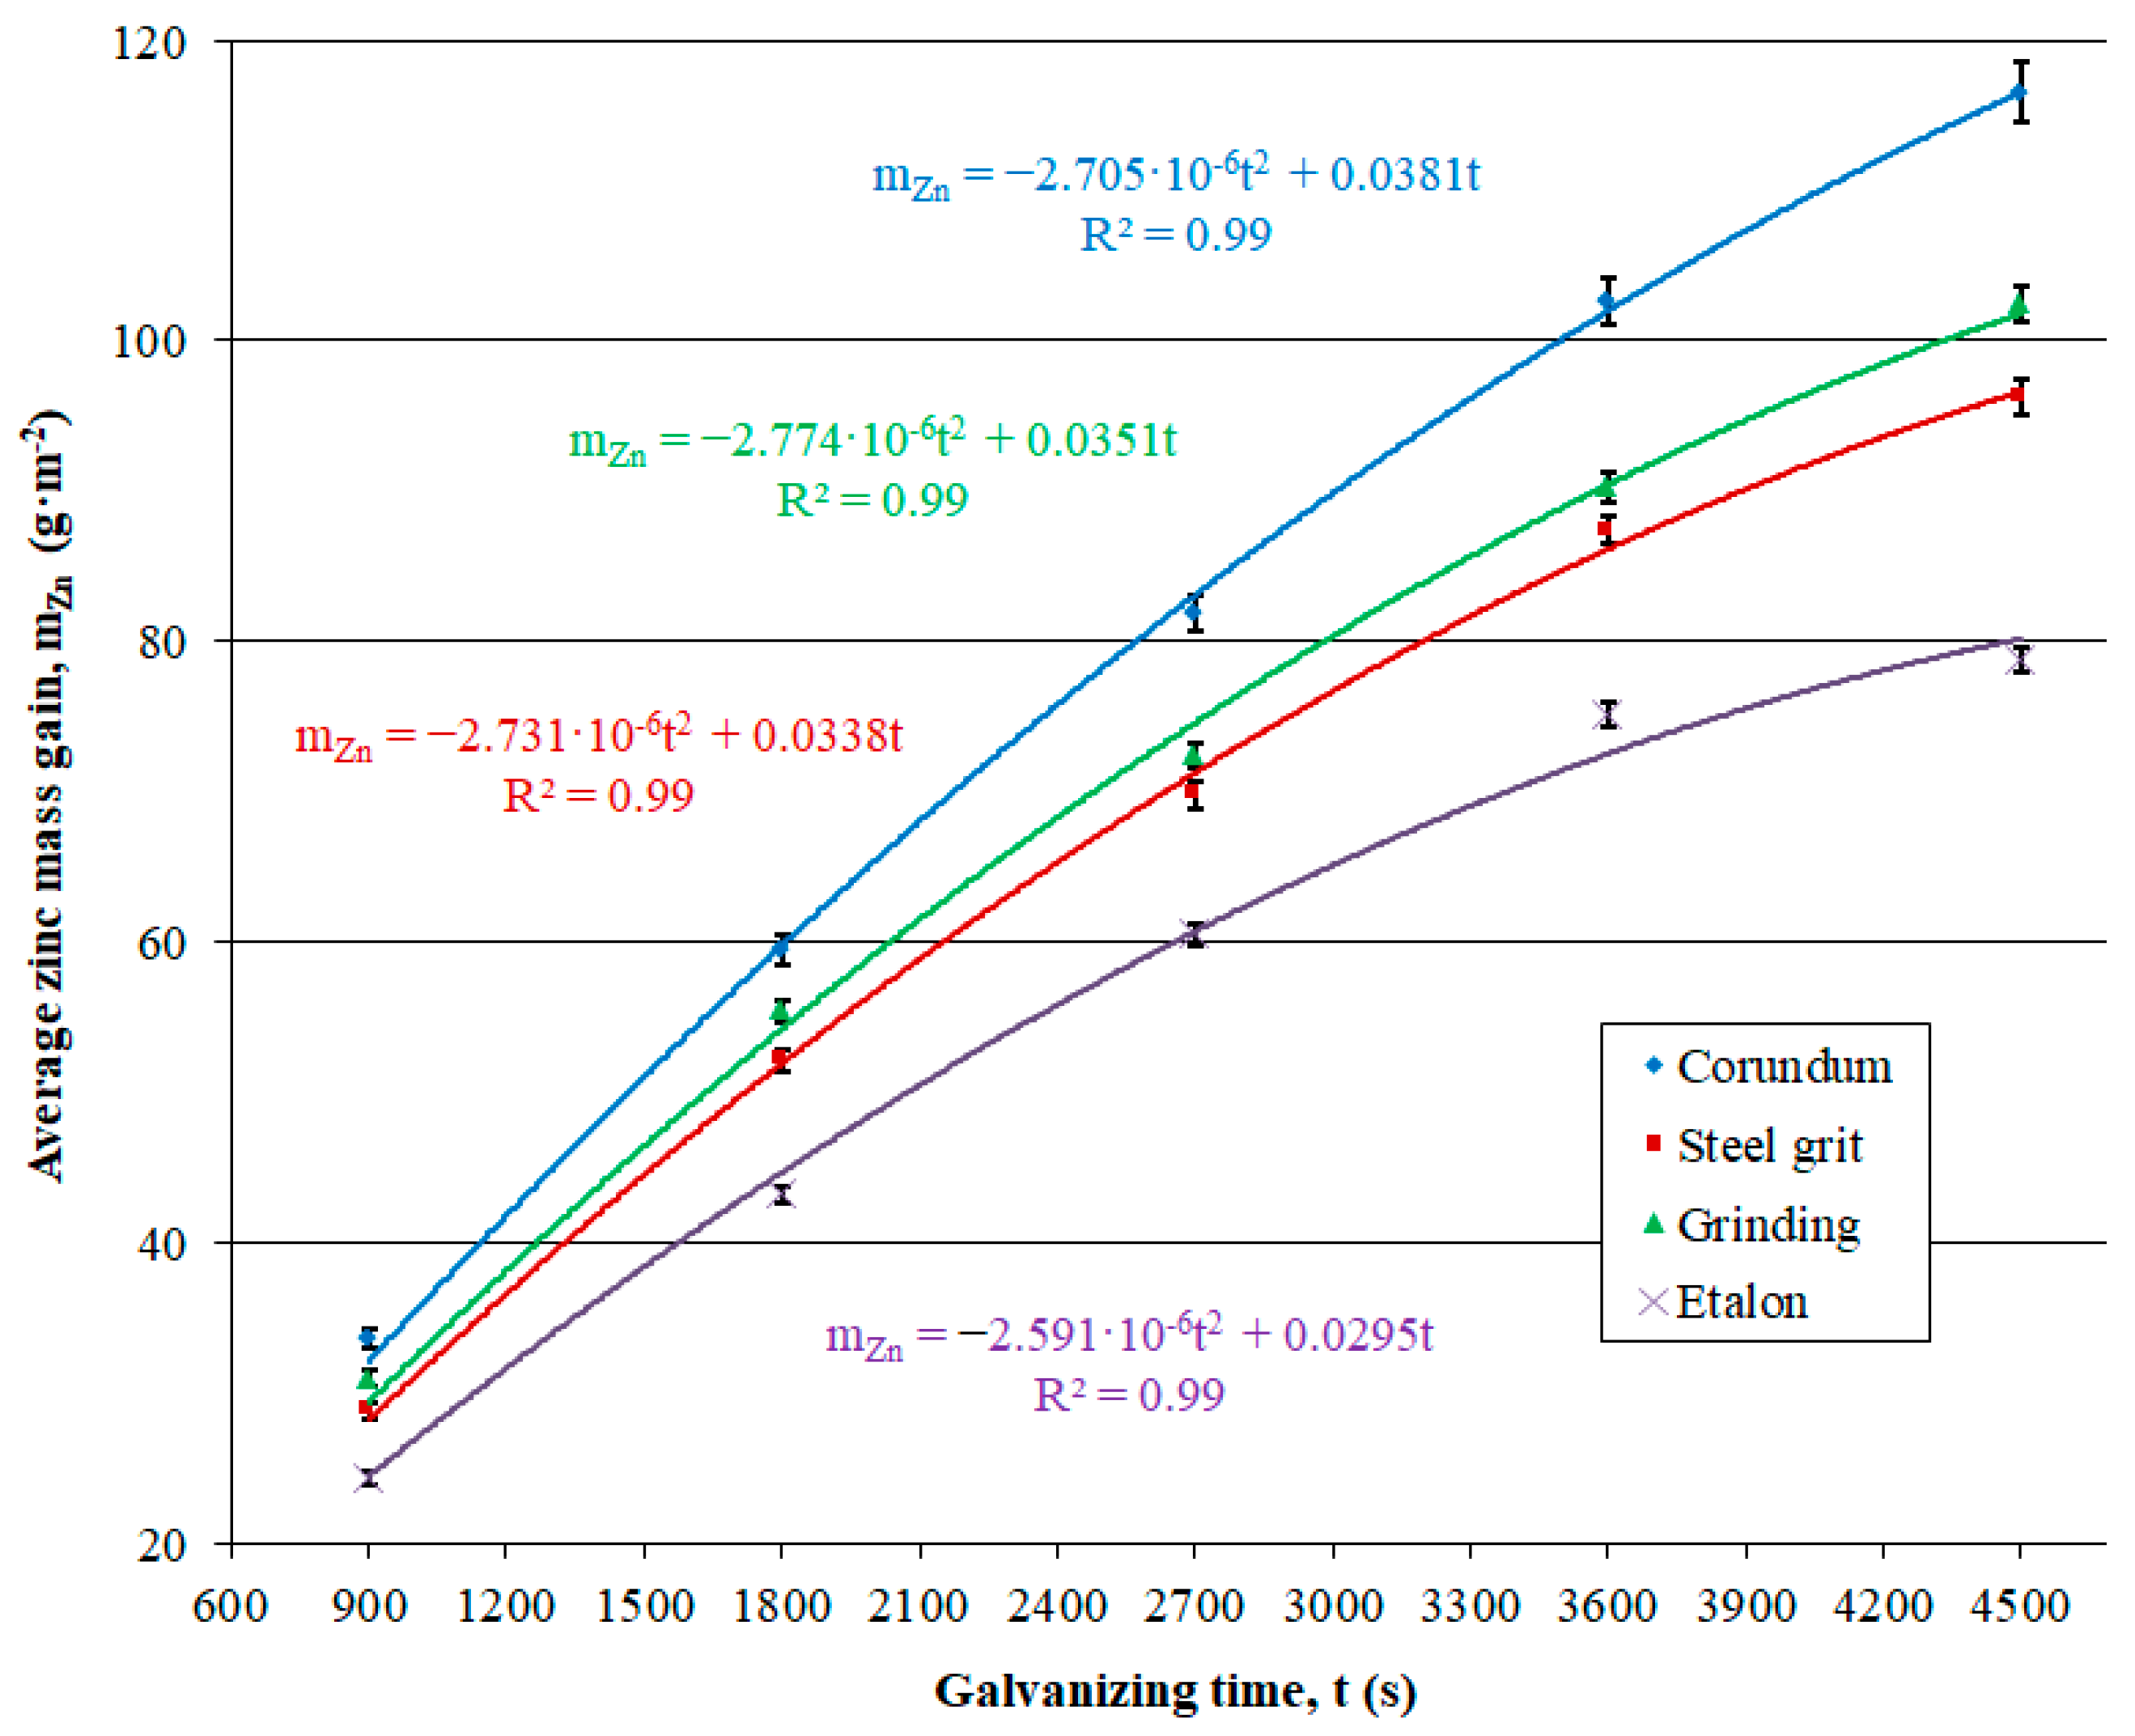
3.2.1. Electrolytic Zinc Coating
- Slag removal from weld joints.
- Addressing localized corrosion damage.
- Cleaning areas contaminated with residual old coatings.
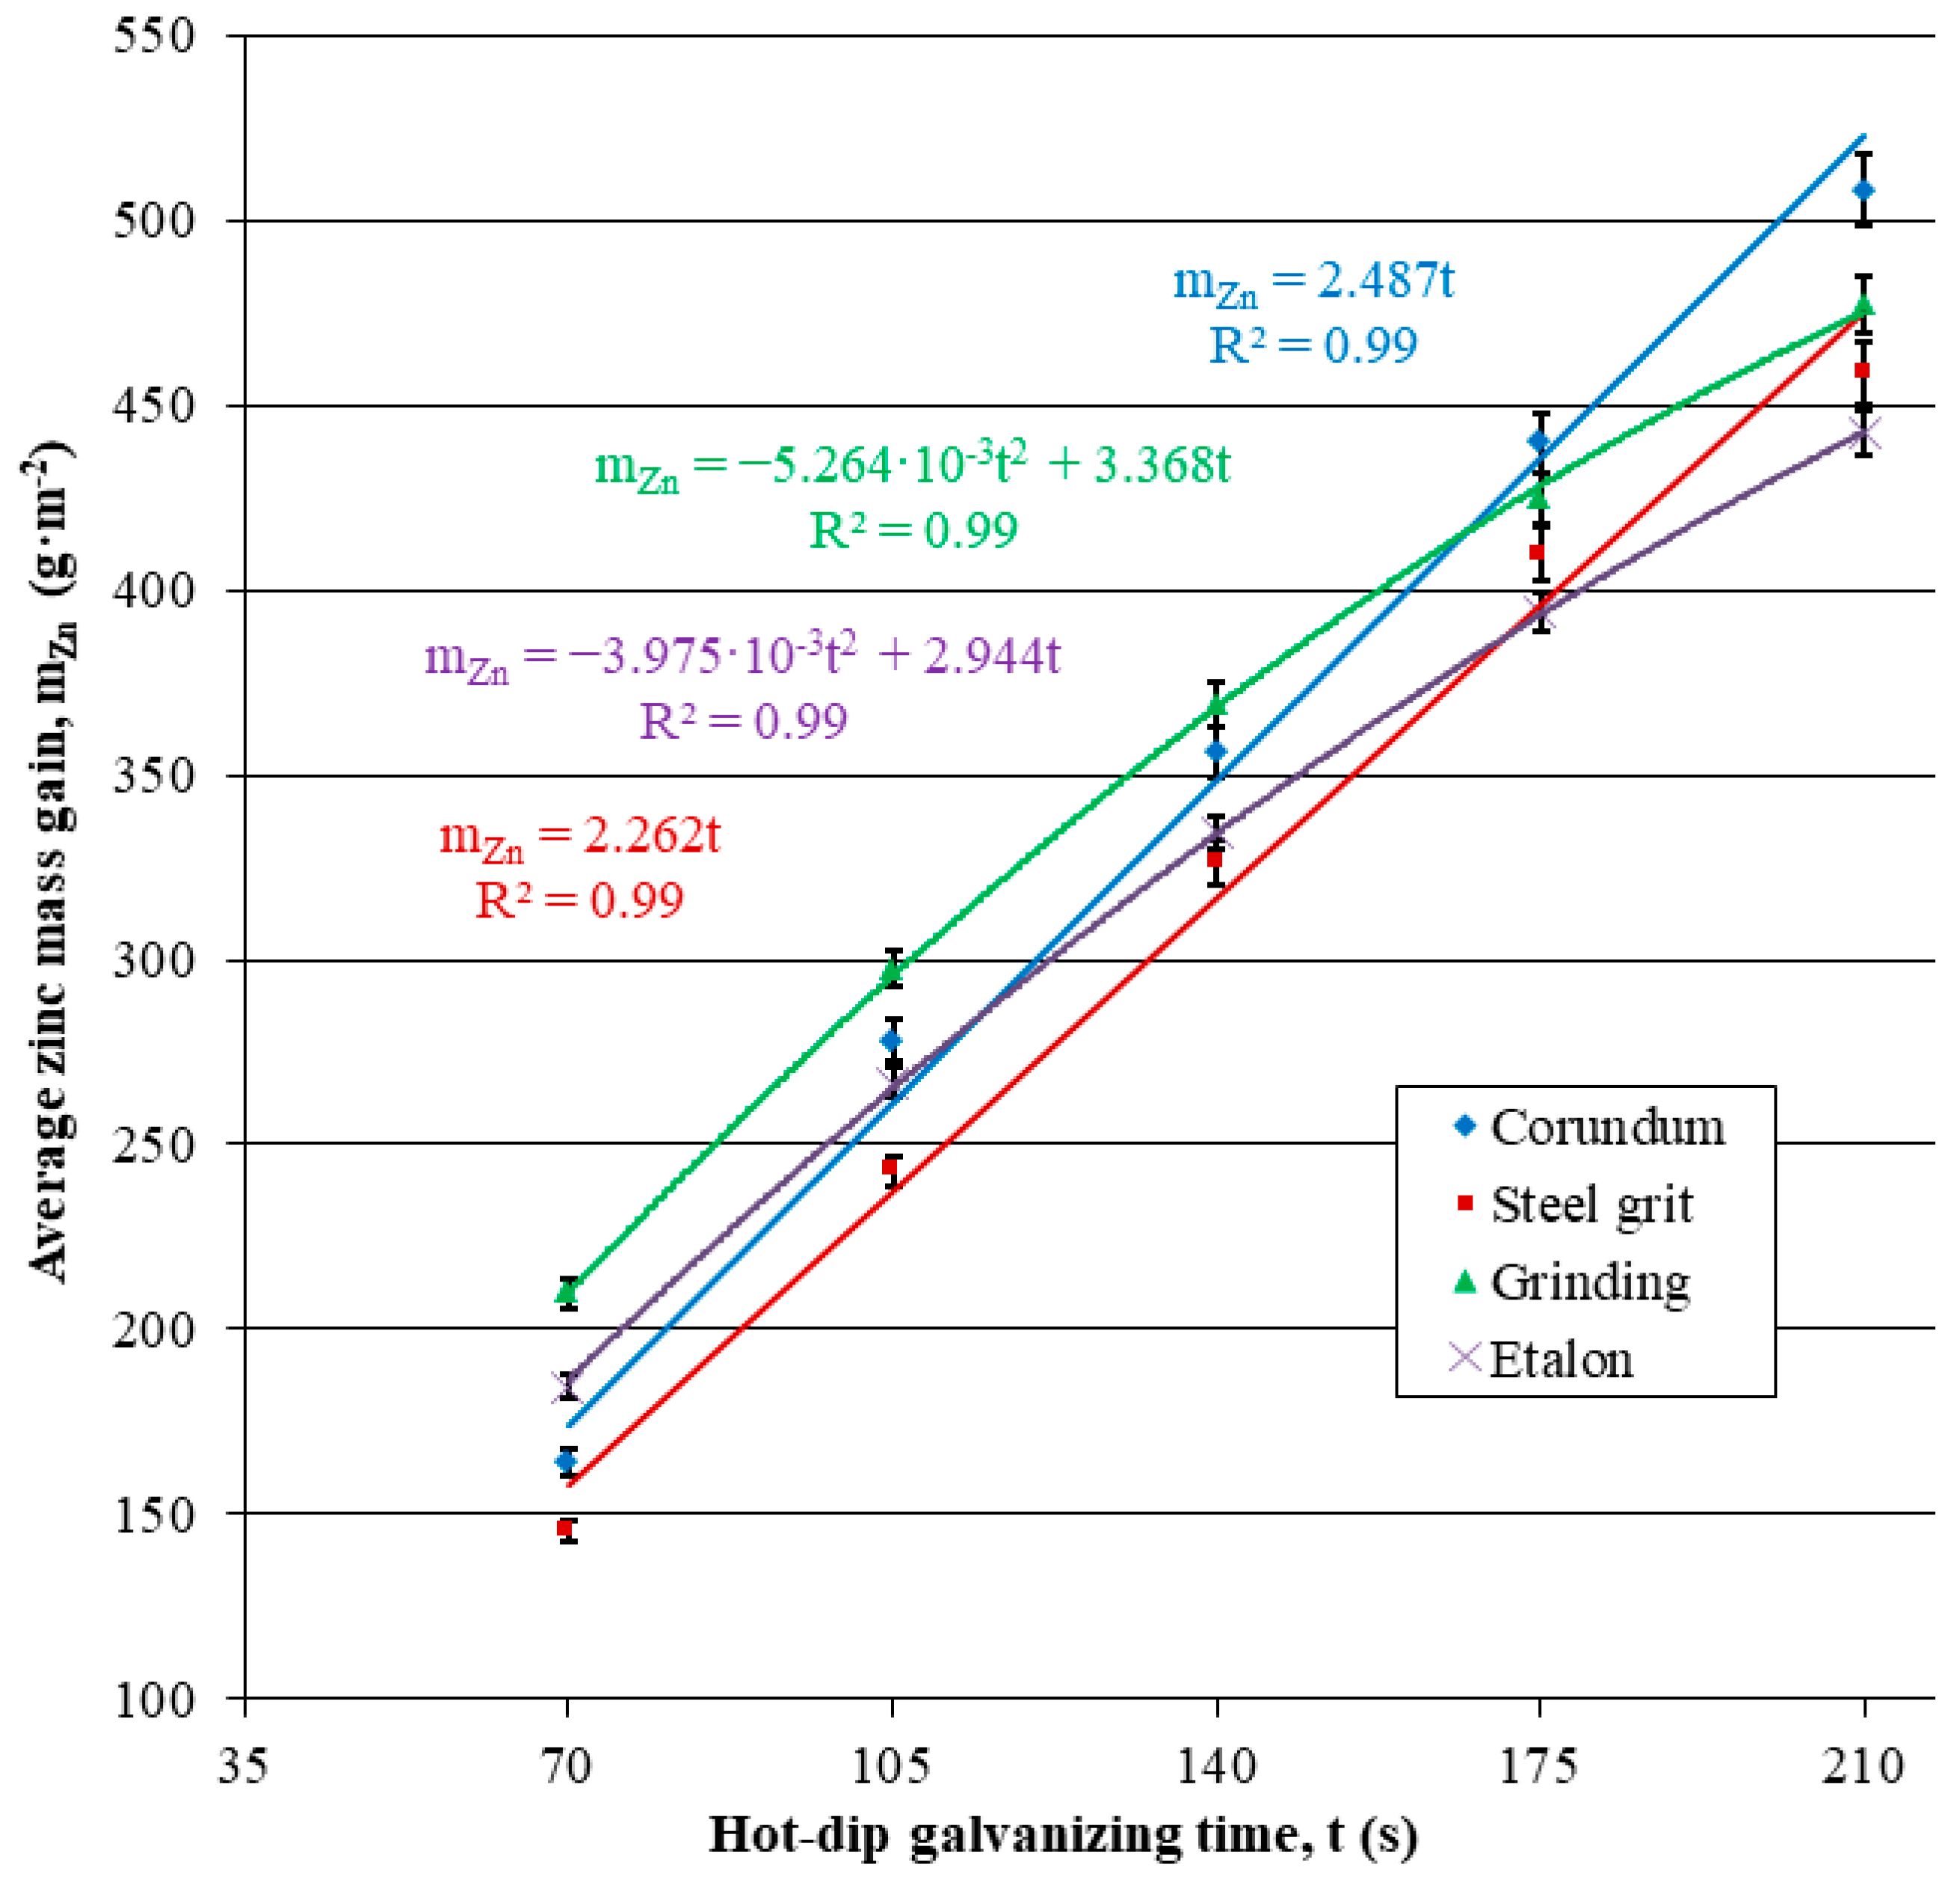
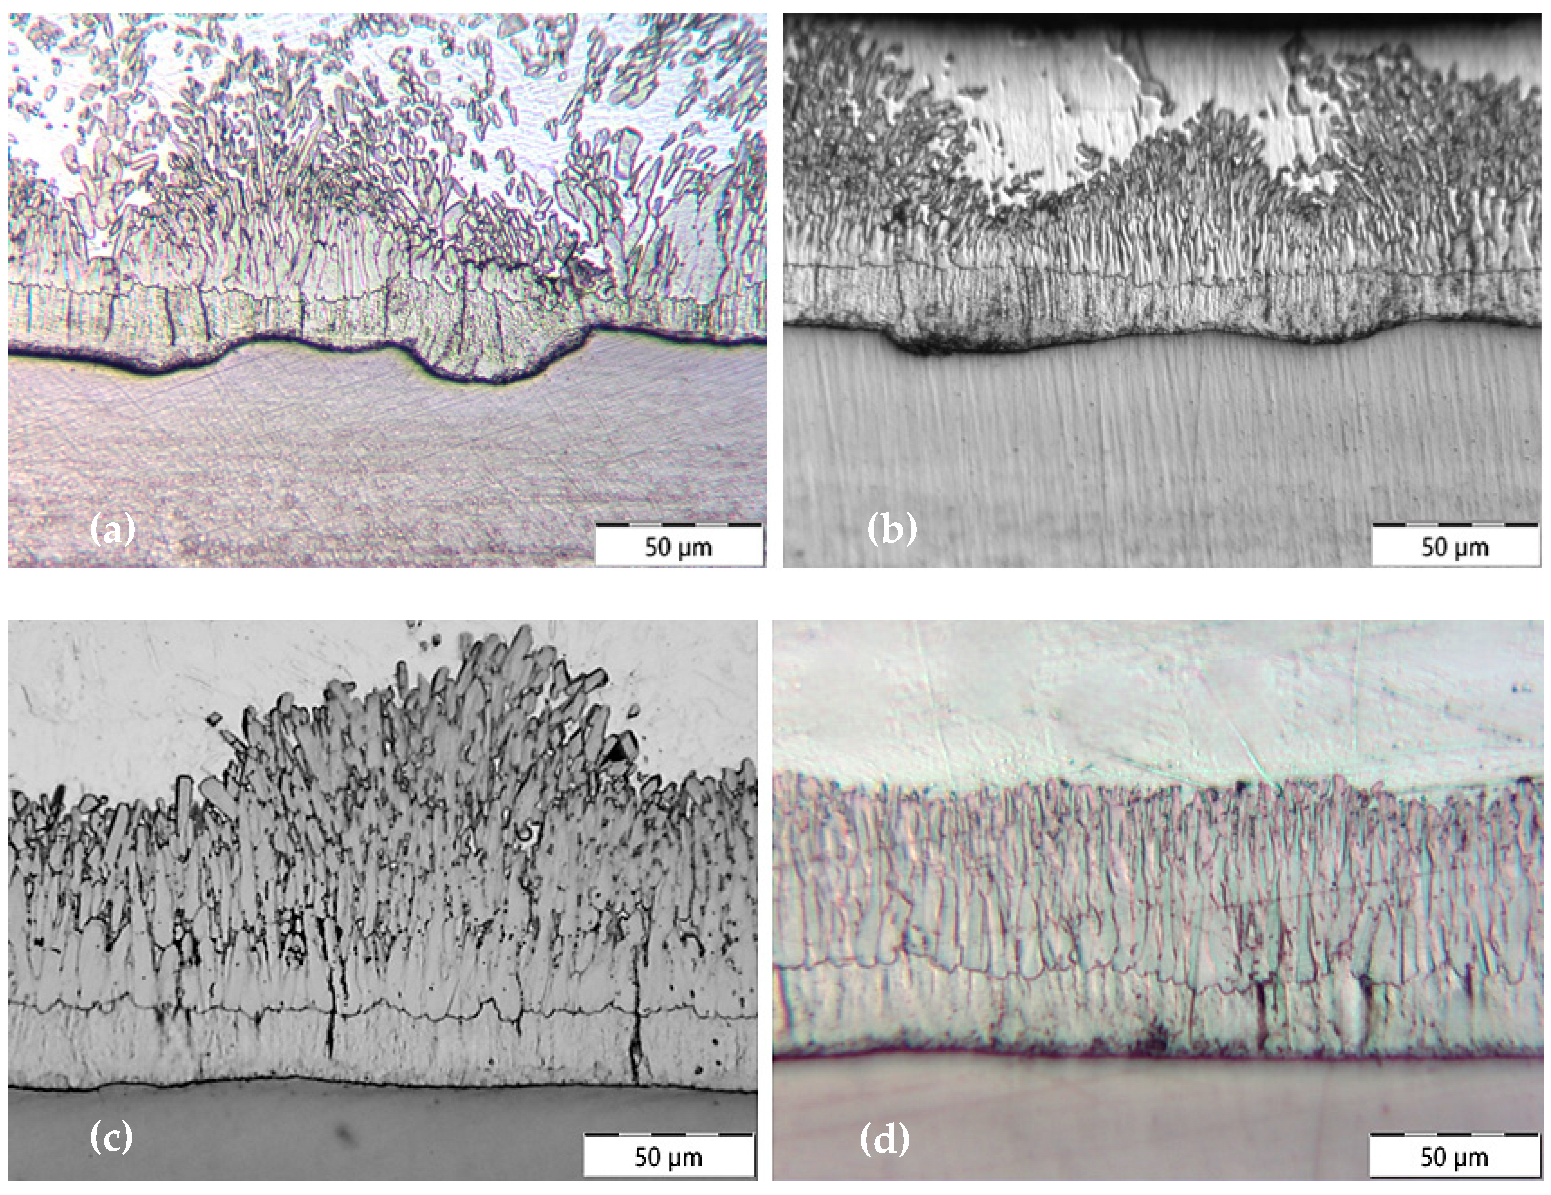
3.2.2. Hot-Dip Zinc Coating
- Higher surface roughness.
- Lower subsurface hardness.
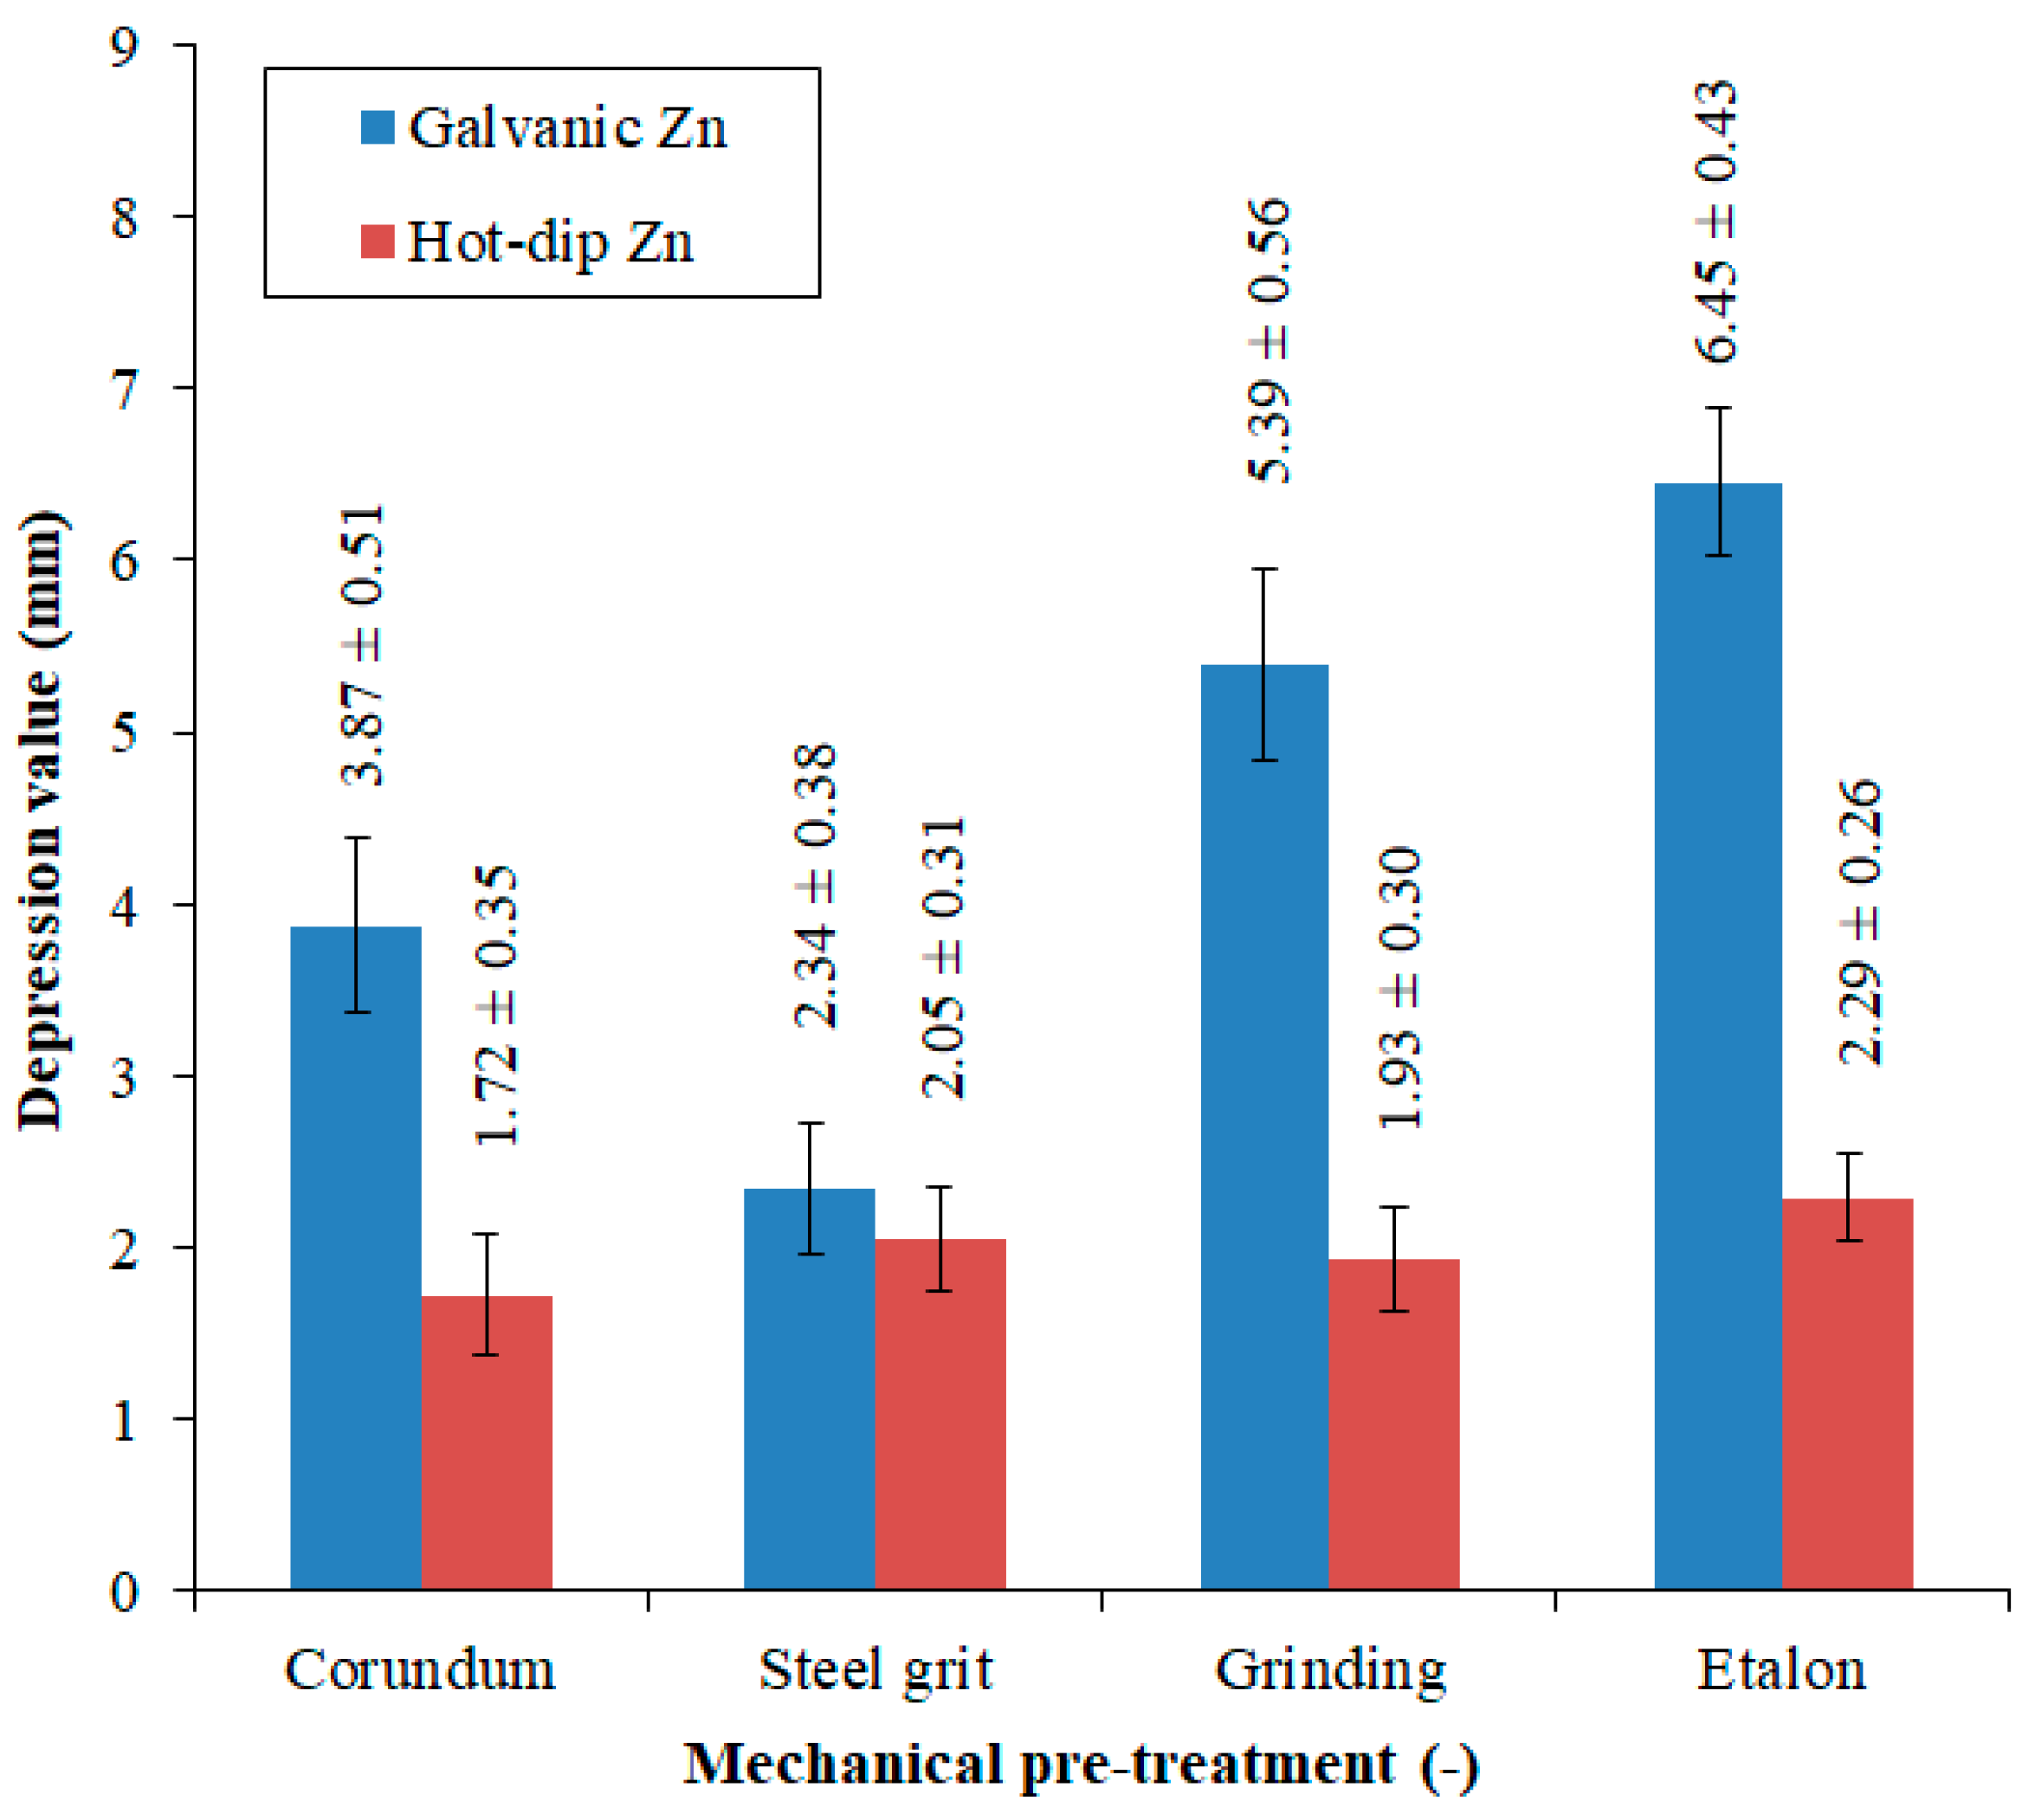
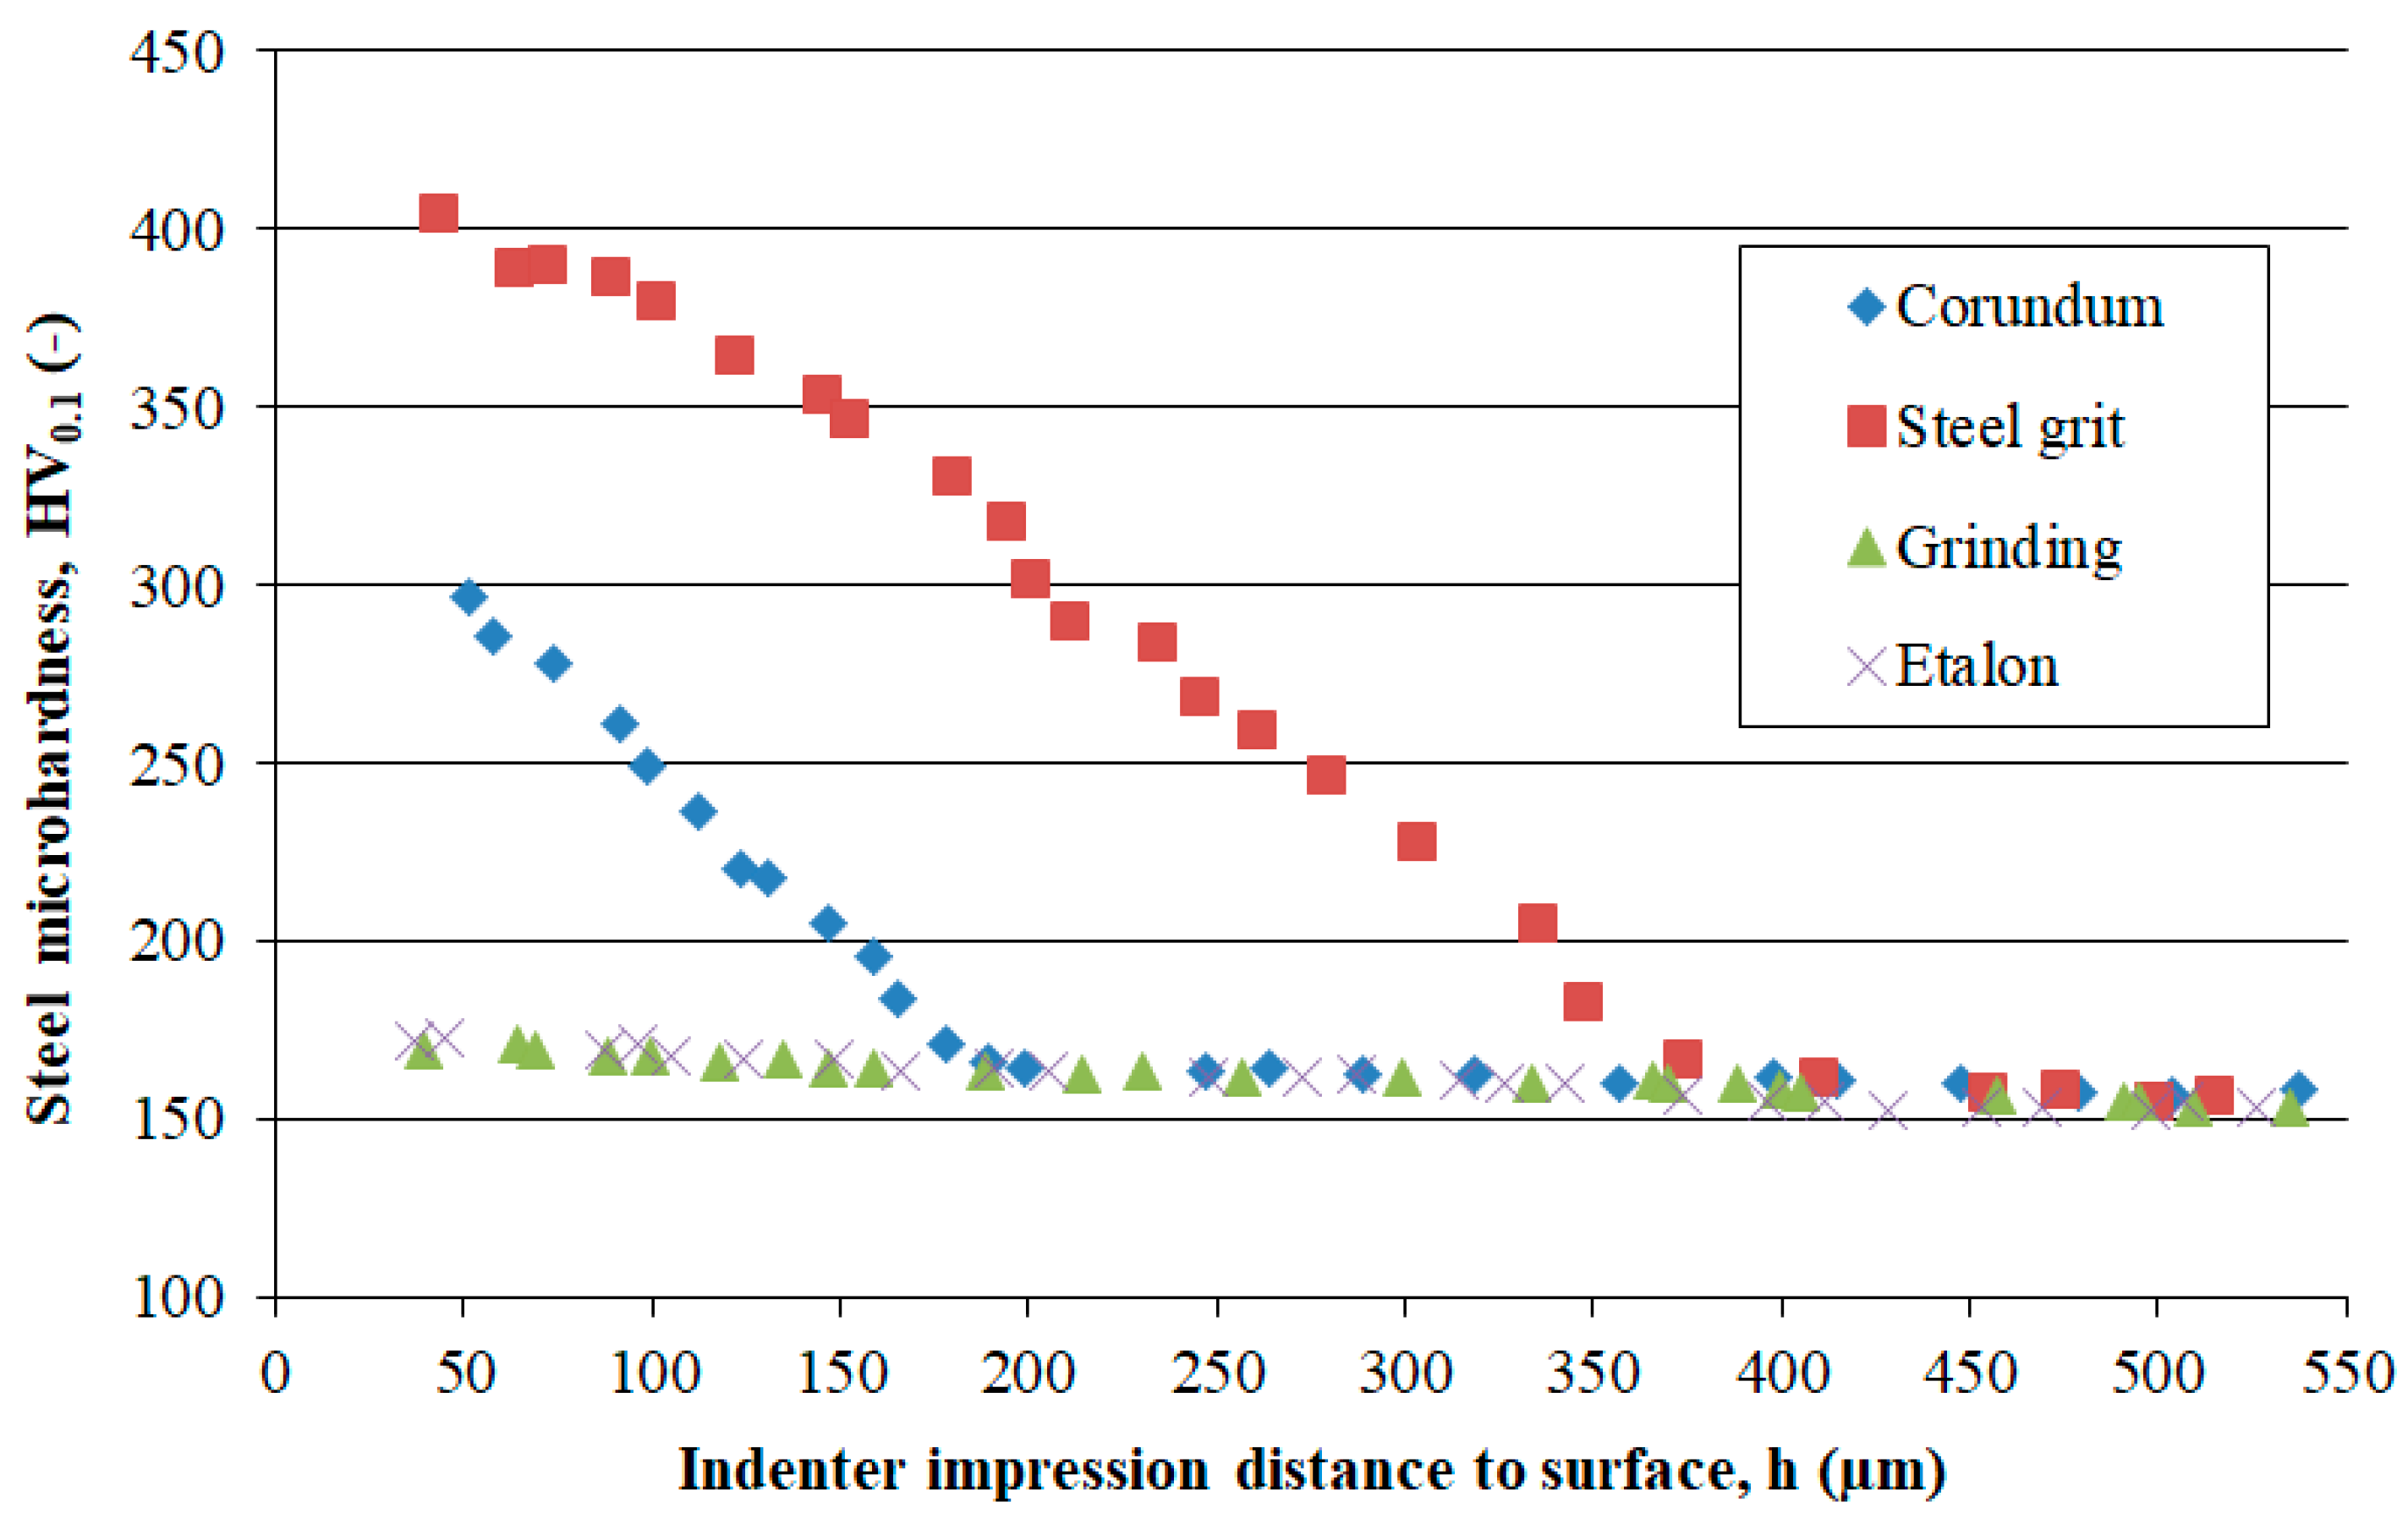
3.3. Analysis of Mechanical Properties
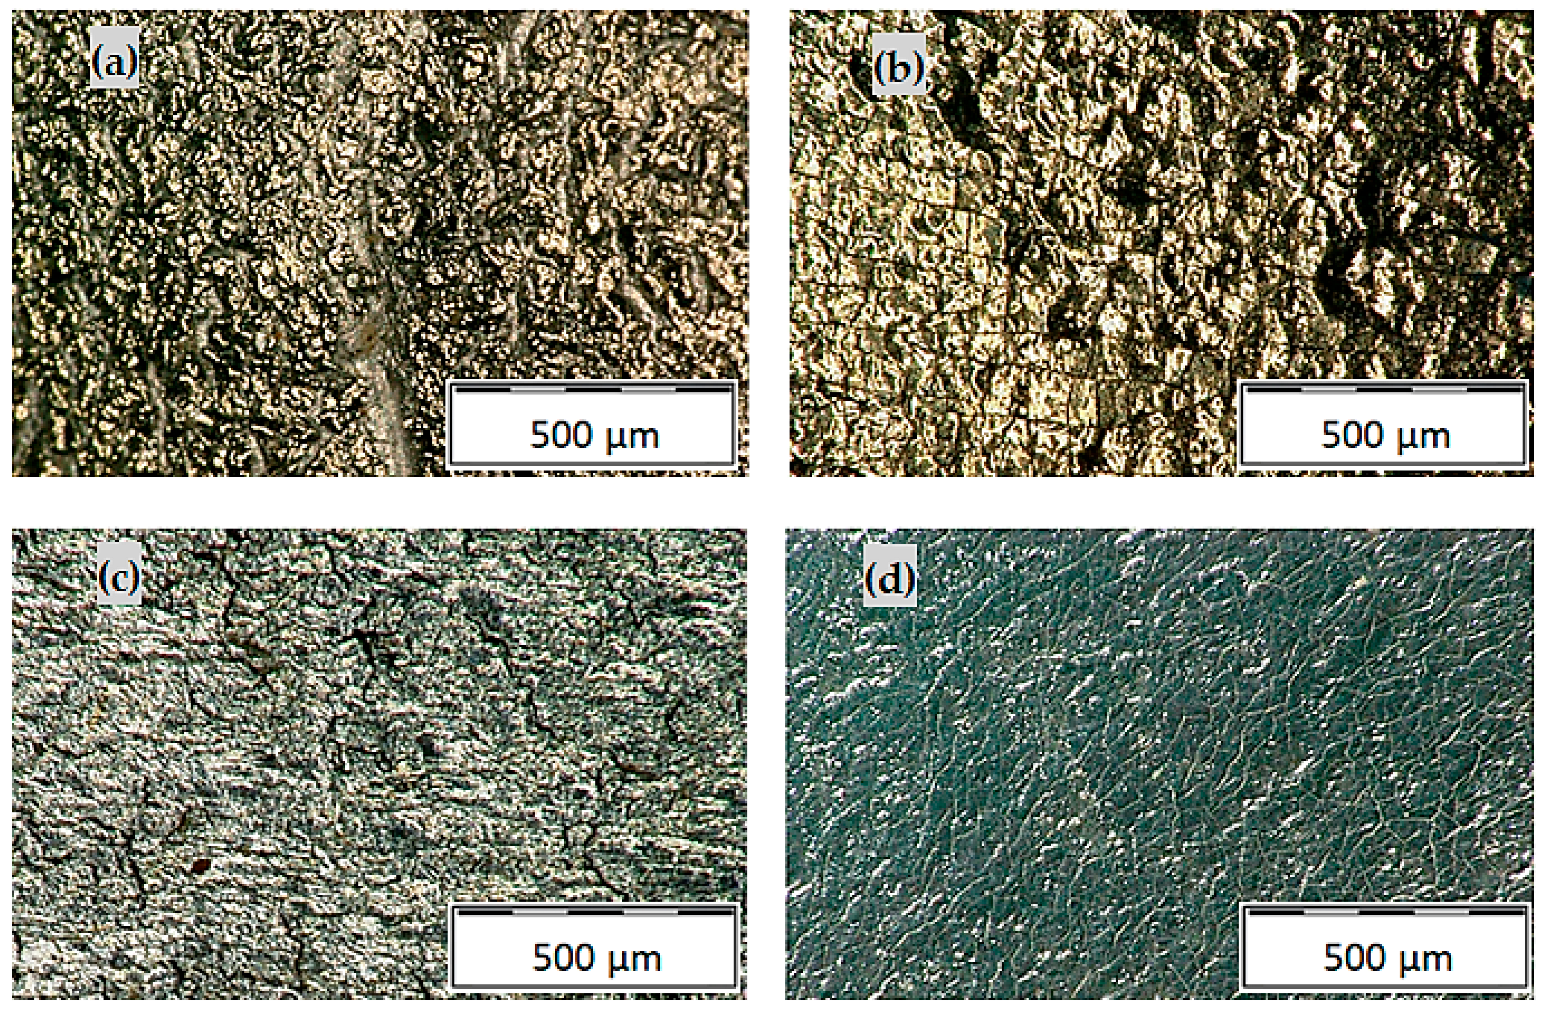
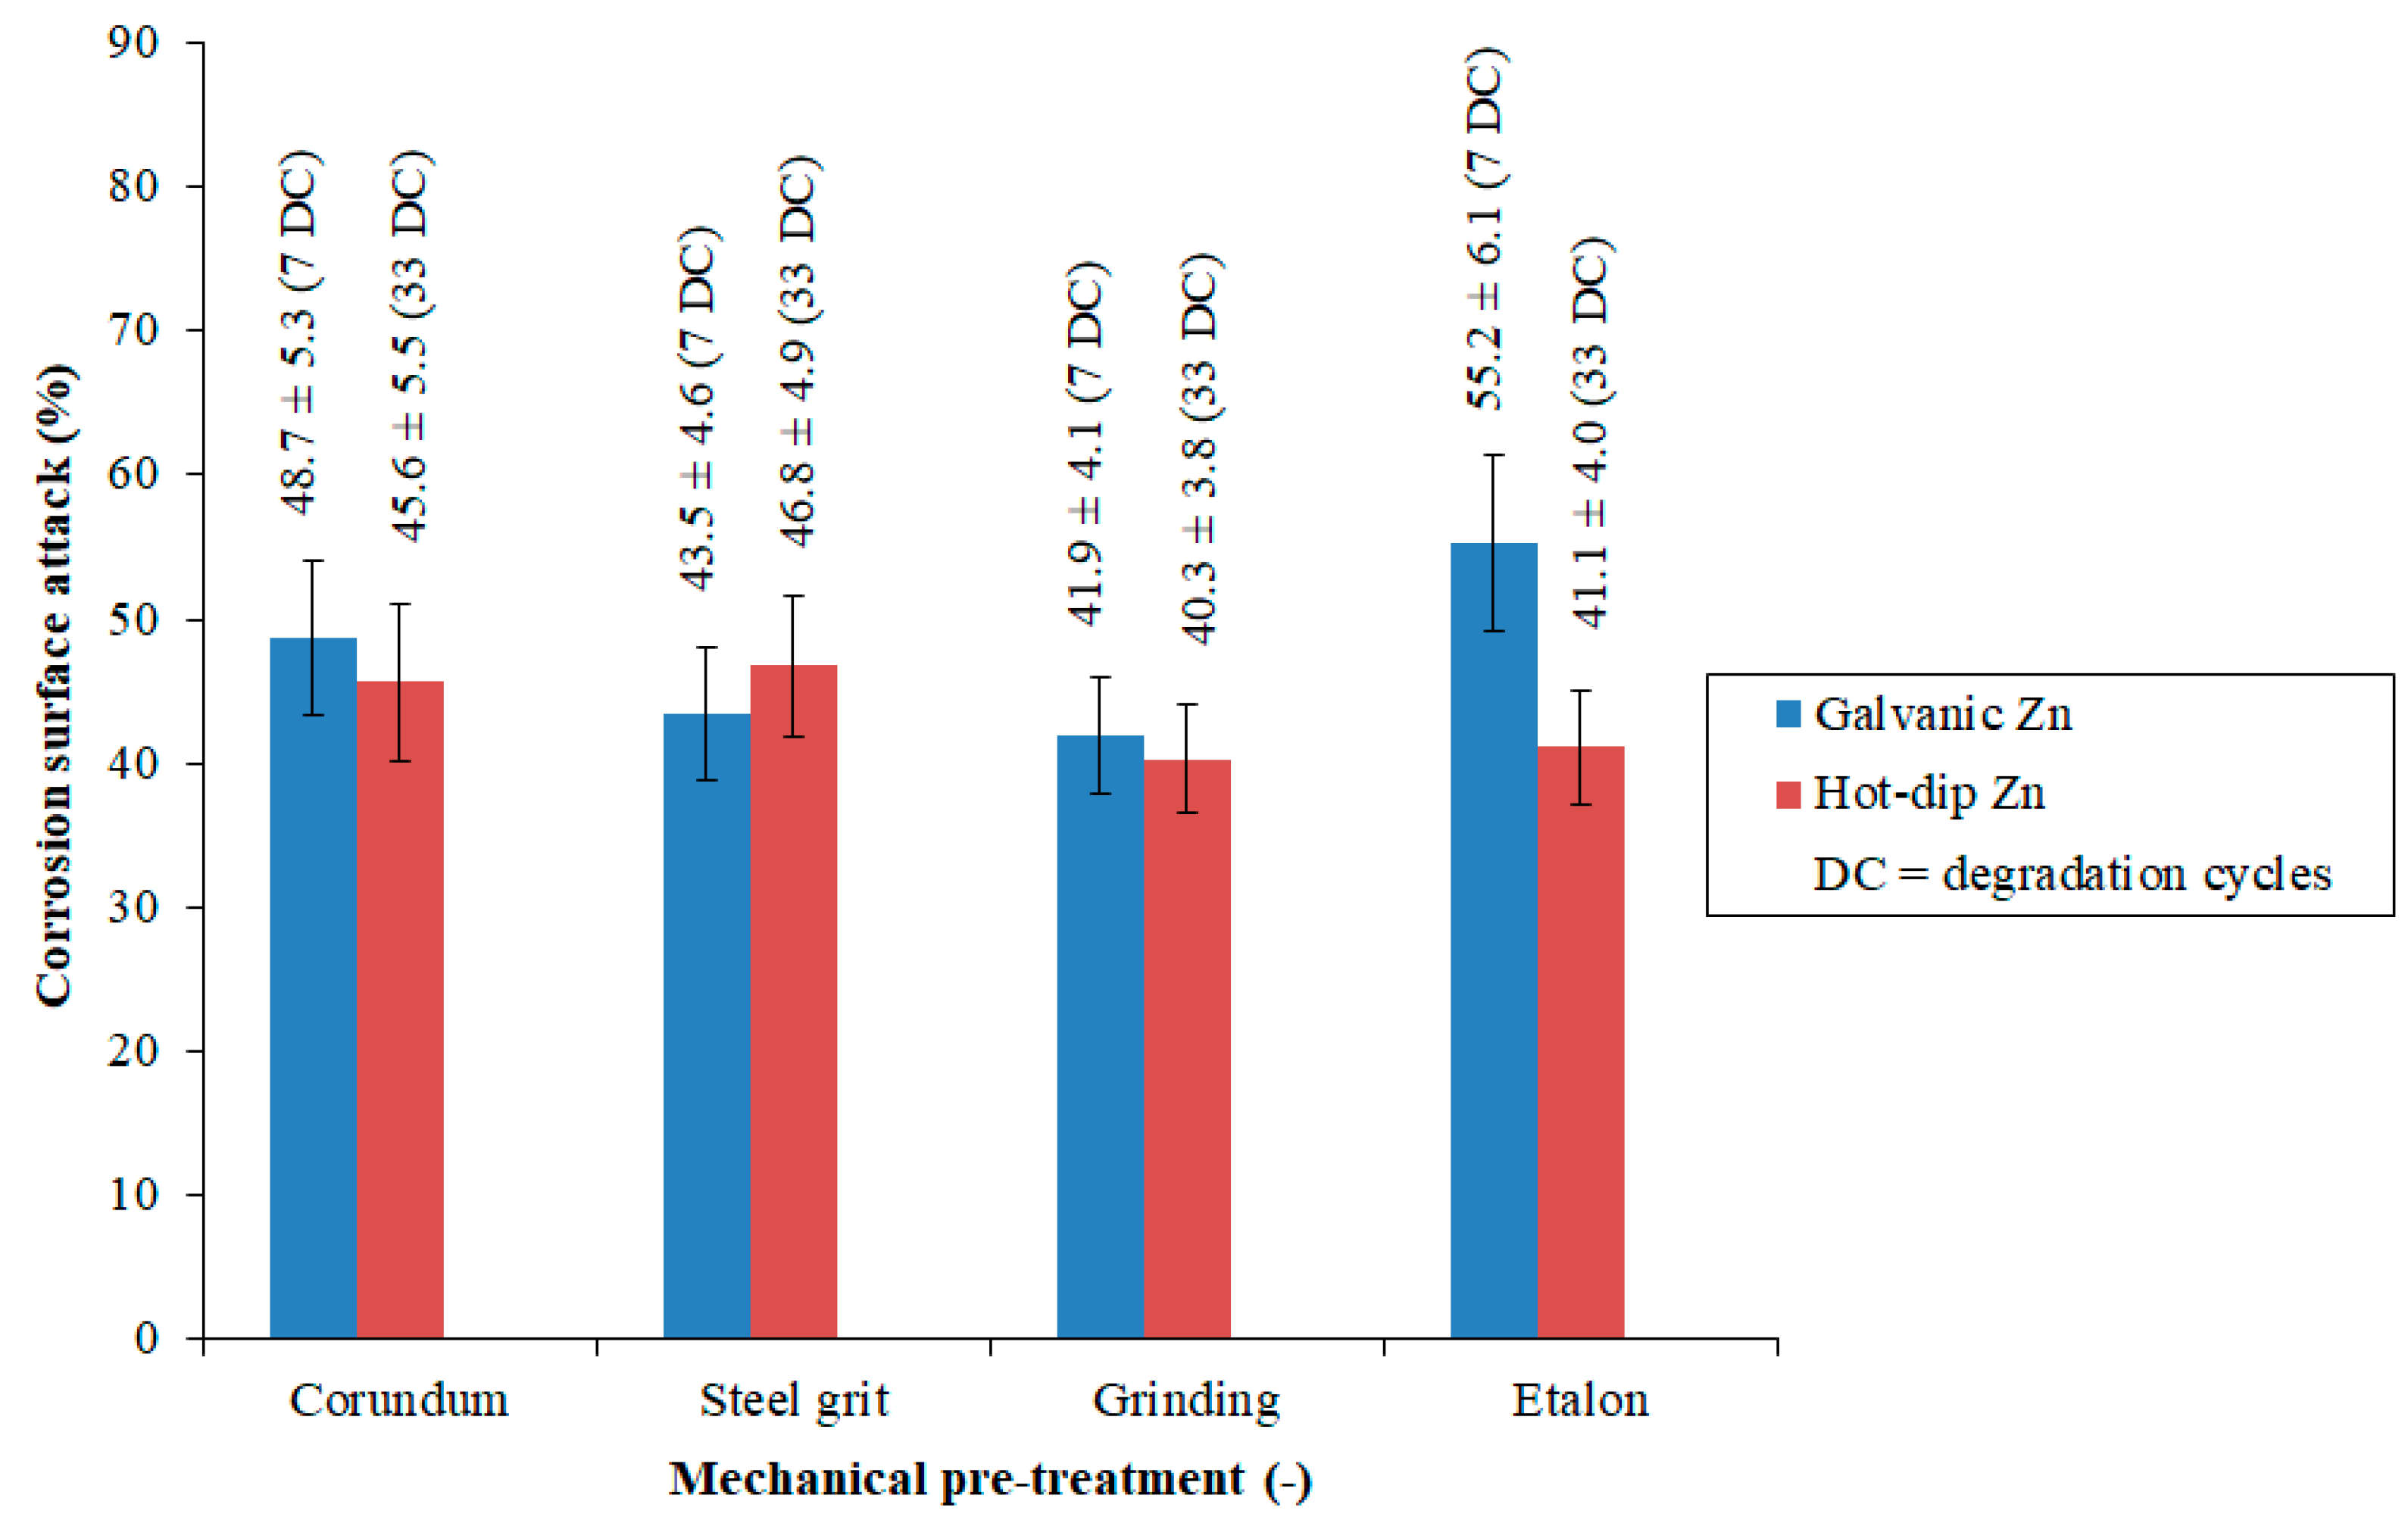
3.4. Analysis of Corrosion Resistance
- Coating structure quality.
- The mass of deposited zinc, which represents the quantitative aspect.
4. Conclusions
- Selecting spherical particles with lower specific density.
- Reducing subsurface hardness through appropriate heat treatment.
Author Contributions
Funding
Institutional Review Board Statement
Informed Consent Statement
Data Availability Statement
Conflicts of Interest
References
- Ahmad, Z. Principles of Corrosion Engineering and Corrosion Control, 1st ed.; Elsevier: London, UK, 2006; pp. 382–437. [Google Scholar]
- Kuklík, V.; Kudláček, J. Hot-Dip Galvanizing of Steel Structures, 1st ed.; Association of Czech and Slovak Zinc Plants: Prague, Czech Republic, 2014; pp. 72–79. [Google Scholar]
- Luo, X.; Palumbo, J.; Papini, M.; Spelt, J.C. Aerodynamic focusing of an abrasive air jet and its effect on machining resolution. Int. J. Mach. Tools Manuf. 2019, 143, 92–106. [Google Scholar] [CrossRef]
- Guzanová, A.; Brezinová, J.; Draganovská, D.; Jaš, F. A study of the effect of surface pre-treatment on the adhesion of coatings. J. Adhes. Sci. Technol. 2014, 28, 1754–1771. [Google Scholar] [CrossRef]
- Praveen, M.; Murthy, N.V.; Krishna, N.N. Surface cleaning of IS-2062 E350 grade steel plates by shot blasting method. Mater. Today Proc. 2023, in press. [CrossRef]
- Hansel, D. Abrasive blasting systems. Met. Finish. 1999, 97, 29–55. [Google Scholar] [CrossRef]
- Dunham, K.J. Preparing hot-dip galvanized steel surfaces for painting or powder coating: A primer. Met. Finish. 2002, 100, 20–25. [Google Scholar] [CrossRef]
- Mulhall, R.C.; Nedas, N.D. Impact blasting with glass beads. Met. Finish. 2007, 105, 65–71. [Google Scholar] [CrossRef]
- Snyder, D.D. Preparation for Deposition. In Modern Electroplating, 5th ed.; Schlesinger, M., Paunovic, M., Eds.; John Wiley & Sons: Hoboken, NJ, USA, 2010; pp. 507–512. [Google Scholar]
- Nguyen, V.B.; Tran, S.B.Q.; Ahmad, S.A.R.; Cheng, K.F.H.; Ahluwalia, K.; Tan, S.H.; Tan, K.H.; Kang, C.W. Optimal model-based control for automated robotized abrasive blasting system. J. Manuf. Process. 2024, 109, 1–15. [Google Scholar] [CrossRef]
- Liao, Z.; Monaca, A.; Murray, J.; Speidel, A.; Ushmaev, D.; Clare, A.; Axinte, D.; M’Saoubi, R. Surface integrity in metal machining-Part I: Fundamentals of surface characteristics and formation mechanisms. Int. J. Mach. Tools Manuf. 2021, 162, 103687. [Google Scholar] [CrossRef]
- Huang, C.A.; Wang, T.H.; Weirich, T.; Neubert, V. A pretreatment with galvanostatic etching for copper electrodeposition on pure magnesium and magnesium alloys in an alkaline copper-sulfate bath. Electrochim. Acta. 2008, 53, 7235–7241. [Google Scholar] [CrossRef]
- Uhlmann, E.; Jaczkowski, R. Mechanical pretreatment before electroplating of aluminium alloy AlSi12. Surf. Coat. Technol. 2018, 352, 483–488. [Google Scholar] [CrossRef]
- Gómez-Guarneros, M.A.; Domínguez-Cabrera, B.A.; Quinto-Saure, C.; Farfan-Cabrera, L.I.; Santander-Reyes, J.N.; Gallardo-Hernández, E.A. Investigating the erosive wear caused by dry-ice blasting in paint stripping process. Mater. Lett. 2022, 308, 131203. [Google Scholar] [CrossRef]
- Vega-Bosch, A.; Santamarina-Campos, V.; Osete-Cortina, L.; Sánchez-Pons, M.; Bosch-Roig, P. Efficient and Sustainable Cleaning: A Comparative Analysis of Cryogenic Technology. Appl. Sci. 2024, 14, 6591. [Google Scholar] [CrossRef]
- Wang, H.; Liu, X.; Zhang, Z. Approaches for electroplating sludge treatment and disposal technology: Reduction, pretreatment and reuse. J. Environ. Manage. 2024, 349, 119535. [Google Scholar] [CrossRef]
- Marquardt, T.; Momber, A.W. Classified substrate roughness parameters of blast-cleaned steel substrates and their effects on fractal dimensions. J. Adhes. Sci. Technol. 2022, 37, 1233–1255. [Google Scholar] [CrossRef]
- Lozrt, J.; Votava, J.; Šmak, R.; Polcar, A. Influence of zinc coatings mechanical pre-treatments for the formation of environmentally friendly passivation duplex anti-corrosion systems. Acta Technol. Agric. 2022, 25, 53–60. [Google Scholar] [CrossRef]
- EN 10270-1; Steel wire for mechanical springs—Part 1: Patented cold drawn unalloyed spring steel wire. CEN: Brussels, Belgium, 2012.
- Lozrt, J.; Votava, J.; Šmak, R. Alternative mechanical pre-treatment methods of hot-dip galvanising surface to increase of the organic coatings adhesion. In Proceedings of the 28th International PhD Students Conference, Brno, Czech Republic, 10 November 2021. [Google Scholar]
- ISO 21920-2; Geometrical Product Specifications (GPS)—Surface Texture: Profile Part 2: Terms, Definitions and Surface Texture Parameters. ISO: Geneva, Switzerland, 2021.
- ISO 6507-1; Metallic Materials—Vickers Hardness Test Part 1: Test Method. ISO: Geneva, Switzerland, 2023.
- Šmak, R.; Votava, J.; Polcar, A. The Cooling Media Influence on Selected Mechanical Properties of Steel. Acta Technol. Agric. 2020, 23, 183–189. [Google Scholar] [CrossRef]
- Kavitha, B.; Santhosh, P.; Renukadevi, M.; Kalpana, A.; Shakkthivel, P.; Vasudevan, T. Role of organic additives on zinc plating. Surf. Coat. Technol. 2006, 201, 3438–3442. [Google Scholar] [CrossRef]
- ISO 1520; Paints and Varnishes–Cupping Test. ISO: Geneva, Switzerland, 2006.
- ISO 9227; Corrosion Tests in Artificial Atmospheres—Salt Spray Tests. ISO: Geneva, Switzerland, 2022.
- ISO 10289; Methods for Corrosion Testing of Metallic and Other Inorganic Coatings on Metallic Substrates—Rating of Test Specimens and Manufactured Articles Subjected to Corrosion Tests. ISO: Geneva, Switzerland, 1999.
- Maleki, E.; Unal, O.; Kashyzadeh, K.R.; Bagherifard, S.; Guagliano, M. A systematic study on the effects of shot peening on a mild carbon steel: Microstructure, mechanical properties, and axial fatigue strength of smooth and notched specimens. Appl. Surf. Sci. Adv. 2021, 4, 100071. [Google Scholar] [CrossRef]
- Qian, A.; Jin, P.; Tan, X.; Wang, D. Effect of Shot Peening on Surface Integrity of AerMet100 Steel. In Proceedings of the 3rd International Conference on Mechatronics and Information Technology (ICMIT 2018), Chengdu, China, 30–31 October 2018. [Google Scholar]
- Zhang, Y. Tin and Tin Alloys for Lead-Free Solder. In Modern Electroplating, 5th ed.; Schlesinger, M., Paunovic, M., Eds.; John Wiley & Sons: Hoboken, NJ, USA, 2010; pp. 139–204. [Google Scholar]
- YU, Y.D.; Wei, G.Y.; Lou, J.W.; Ge, H.L.; Sun, L.X.; Zhu, L.Z. Influence of bath temperature on zinc platingand passivation proces. Surf. Eng. 2013, 29, 169–246. [Google Scholar] [CrossRef]
- Malone, J.F. Painting Hot Dip Galvanized Steel. Mater. Perform. 1992, 31, 39–42. [Google Scholar]
- Seré, P.R.; Armas, A.R.; Elsner, C.I.; Sarli, A.R.D. The surface condition effect on adhesion and corrosion resistance of carbon steel/chlorinated rubber/artificial sea water systems. Corros. Sci. 1996, 38, 853–866. [Google Scholar] [CrossRef]
- Votava, J.; Kumbár, V.; Polcar, A. Degradation Processes in Anticorrosive Coatings for Machinery Designed for Fertiliser Application. Acta Univ. Agric. Silvic. Mendel. Brun. 2016, 64, 1257–1265. [Google Scholar] [CrossRef]
- Nayana, K.O.; Venkatesha, T.V. Synergistic effects of additives on morphology, texture and discharge mechanism of zinc during electrodeposition. J. Electroanal. Chem. 2011, 663, 98–107. [Google Scholar] [CrossRef]
- Winand, R. Electrodeposition of Zinc and Zinc Alloys. In Modern Electroplating, 5th ed.; Schlesinger, M., Paunovic, M., Eds.; John Wiley & Sons: Hoboken, NJ, USA, 2010; pp. 285–308. [Google Scholar]
- Byk, T.V.; Gaevskaya, T.V.; Tsybulskaya, L.S. Effect of electrodeposition conditions on the composition, microstructure, and corrosion resistance of Zn–Ni alloy coatings. Surf. Coat. Technol. 2008, 202, 5817–5823. [Google Scholar] [CrossRef]
- Lee, H.; Kim, D.; Jung, J.; Pyoun, Y.; Shin, K. Influence of peening on the corrosion properties of AISI 304 stainless steel. Corros. Sci. 2009, 51, 2826–2830. [Google Scholar] [CrossRef]
- Alvarez, R.B.; Martin, H.J.; Horstemeyer, M.F.; Chandler, M.Q.; Williams, N.; Wang, P.T.; Ruiz, A. Corrosion relationships as a function of time and surface roughness on a structural AE44 magnesium alloy. Corros. Sci. 2010, 52, 1635–1648. [Google Scholar] [CrossRef]
- Okamoto, N.L.; Yasuhara, A.; Inui, H. Order–disorder structure of the δ1k phase in the Fe–Zn system determined by scanning transmission electron microscopy. Acta Mater. 2014, 81, 345–357. [Google Scholar] [CrossRef]
- Pokorný, P. Influence of Fe-Zn intermetallic layer on corrosion behaviour of galvanized concrete reinforcement. Corros. Mater. Prot. J. 2016, 60, 91–100. [Google Scholar] [CrossRef]
- Nazir, M.H.; Khan, Z.A.; Stokes, K. Analysing the coupled effects of compressive and diffusion induced stresses on the nucleation and propagation of circular coating blisters in the presence of micro-cracks. Eng. Fail. Anal. 2016, 70, 1–15. [Google Scholar] [CrossRef]
- Li, J.; Du, A.; Fan, Y.; Zhao, X.; Ma, R.; Wu, J. Effect of shot-blasting pretreatment on microstructures of hot-dip galvanized coating. Surf. Coat. Technol. 2019, 364, 218–224. [Google Scholar] [CrossRef]
- Marder, A.R. The metallurgy of zinc-coated steel. Prog. Mater. Sci. 2000, 45, 191–271. [Google Scholar] [CrossRef]
- Wu, J.; Zou, S.; Zhang, Y.; Gong, S.; Sun, G.; Ni, Z.; Cao, Z.; Che, Z.; Feng, A. Microstructures and mechanical properties of β forging Ti17 alloy under combined laser shock processing and shot peening. Surf. Coat. Technol. 2017, 328, 283–291. [Google Scholar] [CrossRef]
- Jordan, L.M.; Marder, A.R. Effect of substrate grain size on iron-zinc reaction kinetics during hot-dip galvanizing. Metall. Mater. Trans. A 1997, 28, 2683–2694. [Google Scholar] [CrossRef]
- Muralidhara, H.B.; Naik, Y.A. Electrochemical deposition of nanocrystalline zinc on steel substrate from acid zincate bath. Surf. Coat. Technol. 2008, 202, 3403–3412. [Google Scholar] [CrossRef]
- Votava, J.; Jukl, M.; Polcar, A.; Kumbár, V.; Dostál, P. Anti-corrosion systems in vehicles for the transportation and application of fertilizers. Kov. Mater. Metal. Mater. 2018, 56, 131–136. [Google Scholar] [CrossRef]
- Tian, W.; Chao, B.; Xiong, X.; Li, Z. Effect of Surface Roughness on Pitting Corrosion of 2A12 Aluminum Alloy. Int. J. Electrochem. Sci. 2018, 13, 3107–3123. [Google Scholar] [CrossRef]
- Votava, J.; Kumbár, V. Usage of Waterborne Acrylate Anticorrosion Systems for Ecological Environment. Manuf. Technol. 2017, 17, 103–110. [Google Scholar] [CrossRef]
- Cheong, Z.; Sorce, F.S.; Ngo, S.; Lowe, C.; Taylor, A.C. The effect of substrate material properties on the failure behaviour of coatings in the Erichsen cupping test. Prog. Org. Coat. 2021, 151, 106087. [Google Scholar] [CrossRef]
- Hamada, A.S.; Kisko, A.; Khosravifard, A.; Hassan, M.A.; Karjalainen, L.P.; Porter, D. Ductility and formability of three high-Mn TWIP steels in quasi-static and high-speed tensile and Erichsen tests. Mater. Sci. Eng. A 2018, 712, 255–265. [Google Scholar] [CrossRef]
- Singh, M.; Choubey, A.K.; Sasikumar, C. Formability Analysis of Aluminium Alloy by Erichsen Cupping Test Method. Mater. Today Proc. 2017, 4, 805–810. [Google Scholar] [CrossRef]
- Almeida, E.; Santos, D.; Uruchurtu, J. Corrosion performance of waterborne coatings for structural steel. Prog. Org. Coat. 1999, 37, 131–140. [Google Scholar] [CrossRef]
- Lozrt, J.; Votava, J.; Šmak, R. Duplex Anti-Corrosion Protection of Steel Using a Combination of Hot-Dip Galvanising and Water-Soluble Paints. Acta Technol. Agric. 2021, 24, 129–135. [Google Scholar] [CrossRef]
- Hesamedini, S.; Bund, A. Trivalent chromium conversion coatings. J. Coat. Technol. Res. 2019, 16, 623–641. [Google Scholar] [CrossRef]
- Foster, K.; Claypool, J.; Fahrenholtz, W.G.; O’Keefe, M.; Nahlawi, T.; Almodovar, F. Characterization of cobalt containing and cobalt-free trivalent chromium passivations on γ-ZnNi coated steel substrates. Thin Solid Films 2021, 735, 138894. [Google Scholar] [CrossRef]
- Puig, M.; Gimeno, M.J.; Gracenea, J.J.; Suay, J.J. Anticorrosive properties enhancement in powder coating duplex systems by means of ZMP anticorrosive pigment. Assessment by electrochemical techniques. Prog. Org. Coat. 2014, 77, 1993–1999. [Google Scholar] [CrossRef]
- Seré, P.R.; Schvezov, C.; Sarli, A.R.D.; Deyá, C. Triplex systems: Accelerated and outdoor tests. Mater. Corros. 2019, 70, 470–480. [Google Scholar] [CrossRef]

| Mechanical Property | Minimum Value, MPa |
|---|---|
| Tensile Strength (Rm) | 360 |
| Yield Strength (Re) | 235 |
| Chemical Composition | Maximum Value, wt.% |
| Carbon (C) | 0.170 |
| Manganese (Mn) | 1.400 |
| Phosphorus (P) | 0.045 |
| Sulphur (S) | 0.045 |
| Nitrogen (N) | 0.014 |
| Silicon (Si) | – |
| Iron (Fe) | Remainder |
| Scheme | Brief Description of the Operation |
|---|---|
| 1 | Degreasing in an 8% NaOH solution (immersion time: 480 s, temperature: 60 ± 2 °C) |
| 2 | Rinsing (2×) in demineralized water (immersion time: 30 s per rinse, temperature: 21 ± 1 °C) |
| 3 | Electrolytic degreasing in a 5% NaOH solution (immersion time: 240 s, temperature: 60 ± 2 °C) |
| 4 | Rinsing (2×) in demineralized water (immersion time: 30 s per rinse, temperature: 21 ± 1 °C) |
| 5 | Pickling (acid cleaning) in a 10% HCl solution (immersion time: 120 s, temperature: 25 ± 1 °C) |
| 6 | Rinsing (2×) in demineralized water (immersion time: 30 s per rinse, temperature: 21 ± 1 °C) |
| 7 | Electrolytic zinc deposition (as described above) |
| 8 | Rinsing (3×) in demineralized water (immersion time: 30 s per rinse, temperature: 21 ± 1 °C) |
| 9 | Drying of samples in a continuous dryer (drying time: 720 s, temperature: 60 ± 5 °C) |
| 10 | Final visual inspection |
| Step No. | Brief Description of the Operation |
|---|---|
| 1 | Degreasing in a solution of NaOH (20 g·L−1) and K3PO4 (30 g·L−1) (immersion time: 300 s, temperature: 60 ± 2 °C) |
| 2 | Rinsing (2×) in demineralized water (immersion time: 30 s per rinse, temperature: 22 ± 1 °C) |
| 3 | Pickling in a 14% HCl solution (immersion time: 180 s, temperature: 50 ± 2 °C) |
| 4 | Rinsing (2×) in demineralized water (immersion time: 30 s per rinse, temperature: 22 ± 1 °C) |
| 5 | Immersion in a flux solution composed of ZnCl2 and NH4Cl in a 3:2 ratio (immersion time: 120 s, temperature: 45 ± 2 °C) |
| 6 | Drying of samples in an electric annealing furnace (drying time: 600 s, temperature: 65 ± 2 °C) |
| 7 | Hot-dip galvanizing process (as described above) |
| 8 | Final visual inspection |
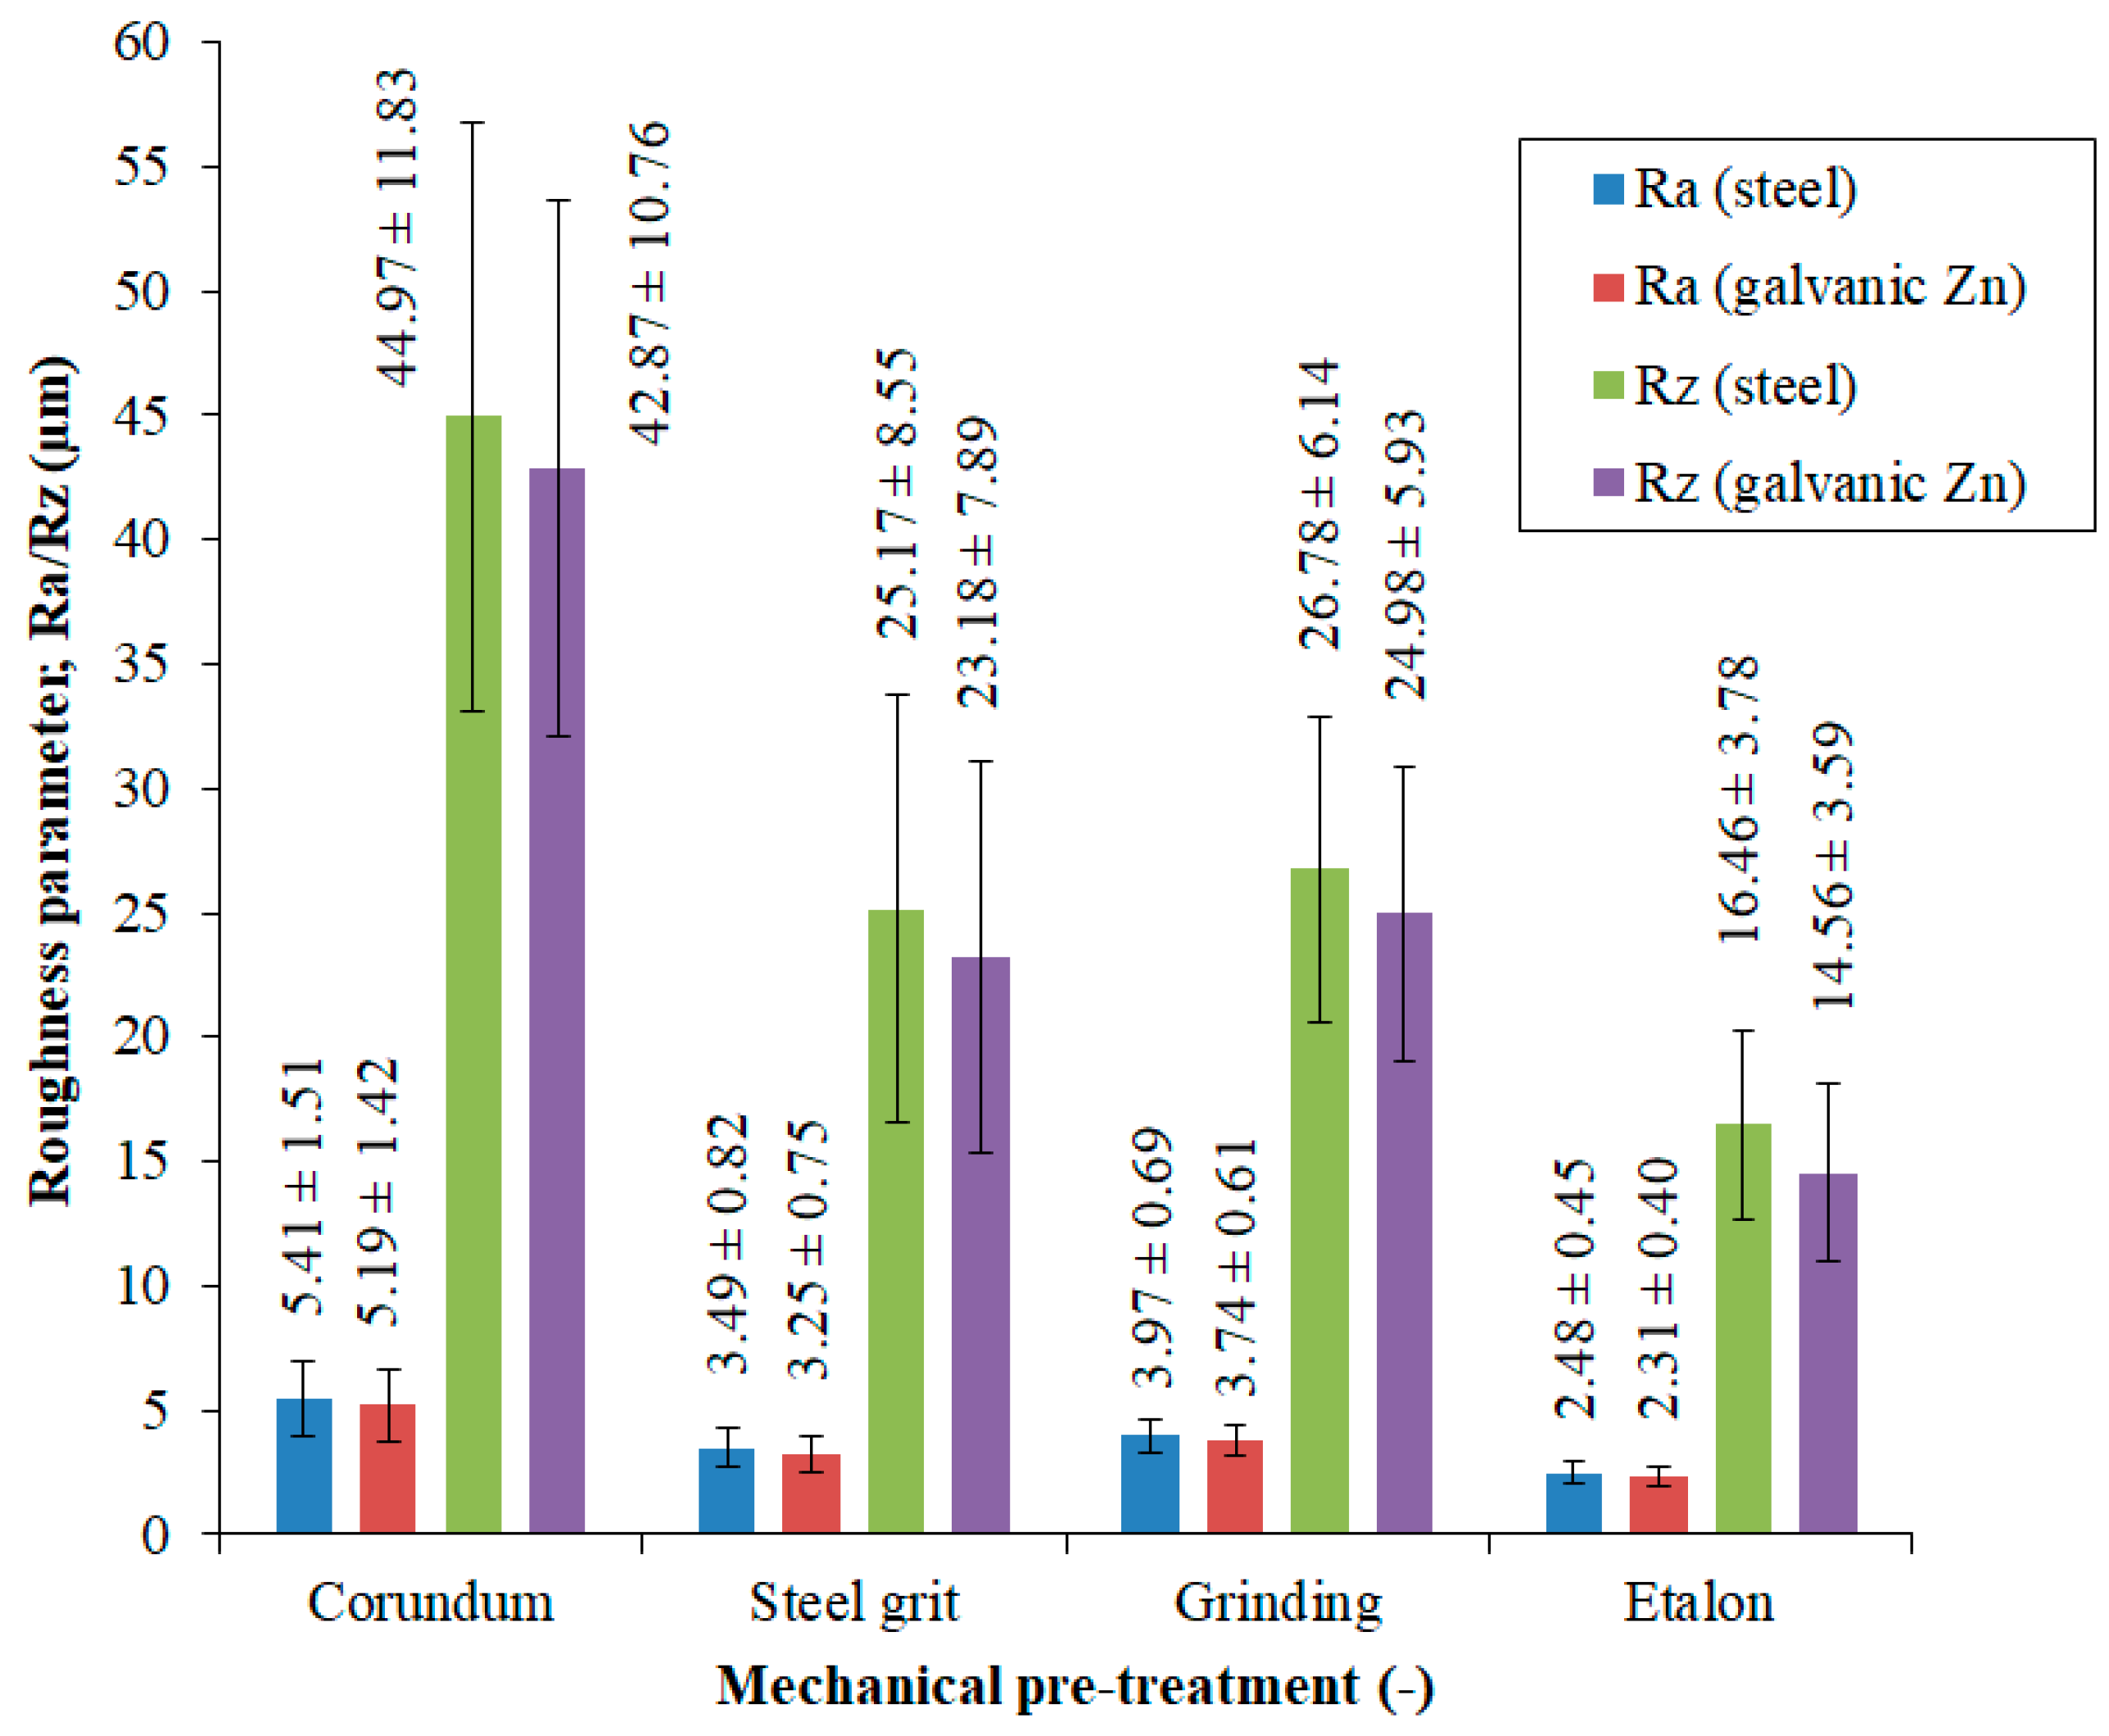
| Mechanical Pre-Treatment | Mean Roughness Parameter ± Standard Deviation | |
|---|---|---|
| Ra, µm | Rz, µm | |
| Synthetic Corundum Blasting | 5.41 ± 1.51 | 44.97 ± 11.83 |
| Steel Granulate Blasting | 3.49 ± 0.82 | 25.17 ± 8.55 |
| Grinding | 3.97 ± 0.69 | 26.78 ± 6.14 |
| Reference Sample (Without Pre-treatment) | 2.48 ± 0.45 | 16.46 ± 3.78 |
| Type of MP | Electrolytic Zinc Deposition Time (s) | ||||
|---|---|---|---|---|---|
| 900 | 1800 | 2700 | 2600 | 4500 | |
| SCB | 33.62 ± 0.71 | 59.48 ± 0.97 | 81.93 ± 1.22 | 102.59 ± 1.57 | 116.45 ± 1.96 |
| SGB | 28.72 ± 0.49 | 52.13 ± 0.70 | 69.88 ± 0.92 | 87.47 ± 0.99 | 96.27 ± 1.16 |
| G | 30.97 ± 0.52 | 55.46 ± 0.74 | 72.44 ± 0.89 | 90.23 ± 1.02 | 102.45 ± 1.19 |
| E | 24.21 ± 0.39 | 43.18 ± 0.57 | 60.53 ± 0.71 | 75.14 ± 0.83 | 78.80 ± 0.87 |
| Hot-Dip Zinc Deposition Time (s) | |||||
| 70 | 105 | 140 | 175 | 210 | |
| SCB | 164.17 ± 3.77 | 278.24 ± 5.29 | 356.32 ± 6.73 | 439.84 ± 8.02 | 507.91 ± 9.81 |
| SGB | 145.85 ± 2.93 | 242.80 ± 4.36 | 326.37 ± 5.87 | 409.58 ± 7.39 | 458.44 ± 8.23 |
| G | 209.83 ± 3.94 | 297.51 ± 5.07 | 368.74 ± 5.98 | 424.69 ± 6.78 | 477.13 ± 7.87 |
| E | 184.39 ± 3.31 | 266.89 ± 4.17 | 334.28 ± 4.80 | 393.95 ± 5.53 | 442.21 ± 6.09 |
Disclaimer/Publisher’s Note: The statements, opinions and data contained in all publications are solely those of the individual author(s) and contributor(s) and not of MDPI and/or the editor(s). MDPI and/or the editor(s) disclaim responsibility for any injury to people or property resulting from any ideas, methods, instructions or products referred to in the content. |
© 2025 by the authors. Licensee MDPI, Basel, Switzerland. This article is an open access article distributed under the terms and conditions of the Creative Commons Attribution (CC BY) license (https://creativecommons.org/licenses/by/4.0/).
Share and Cite
Lozrt, J.; Votava, J.; Kumbár, V.; Polcar, A. Analysis of Corrosion-Mechanical Properties of Electroplated and Hot-Dip Zinc Coatings on Mechanically Pre-Treated Steel Substrate. Appl. Sci. 2025, 15, 2626. https://doi.org/10.3390/app15052626
Lozrt J, Votava J, Kumbár V, Polcar A. Analysis of Corrosion-Mechanical Properties of Electroplated and Hot-Dip Zinc Coatings on Mechanically Pre-Treated Steel Substrate. Applied Sciences. 2025; 15(5):2626. https://doi.org/10.3390/app15052626
Chicago/Turabian StyleLozrt, Jaroslav, Jiří Votava, Vojtěch Kumbár, and Adam Polcar. 2025. "Analysis of Corrosion-Mechanical Properties of Electroplated and Hot-Dip Zinc Coatings on Mechanically Pre-Treated Steel Substrate" Applied Sciences 15, no. 5: 2626. https://doi.org/10.3390/app15052626
APA StyleLozrt, J., Votava, J., Kumbár, V., & Polcar, A. (2025). Analysis of Corrosion-Mechanical Properties of Electroplated and Hot-Dip Zinc Coatings on Mechanically Pre-Treated Steel Substrate. Applied Sciences, 15(5), 2626. https://doi.org/10.3390/app15052626