Abstract
The aim of the study was to determine whether football players of different age groups who use their dominant leg more frequently when playing football exhibit greater functional asymmetries between the right and left leg. The study included 116 football players (age groups from U12 to U19). The number of touches of the ball with the right and left leg was determined by detailed video analysis. The data were used to calculate the percentage of use of the dominant leg. Functional asymmetries were determined based on measurements of motor skills in the field and measurements with a portable dual-force plate. Significant correlations were found between the percentage of the dominant leg use and the differences between legs in kicking the ball (ball flight speed) from a standing position in the entire sample, from a running position in the entire sample and in the U17 age group and in relative maximum power in the CMJ in the U15 age group. No significant correlations were found with differences between the legs when dribbling the ball with a change in direction. The proportion of use of the dominant leg correlates with some of the observed functional asymmetries in young football players of different age groups and varies across age groups.
1. Introduction
Daily life is full of one-sided actions. We decide whether to use our left or right hand to unlock a door or drink a cup of coffee, we decide which side to turn to see who is behind us, or which eye to use to look through a peephole in a door, or which foot to use to kick a stone when walking in the park [1]. Most people always look through a telescope with the same eye or press the same ear to the door to listen. In these and many other ways, people show a massive bias in the use of their limbs and senses [2].
Laterality is a multidimensional construct [3] that views development as an active process influenced by environmental and genetic factors [4]. About 20% of the normal population uses the left foot to kick a ball [5], which can also be observed in professional footballers [6].
On the one hand, harmony means the proper relationship, harmony, and balance between two elements of a whole. On the other hand, the definition of harmony is also bilateral harmony—symmetry between the left and right sides. Both definitions refer to the structure of the body, i.e., physical harmony, and can also refer to human movements [7]. The occurrence of body asymmetries only increases with age and indicates a connection with functional asymmetries [8]. Functional asymmetries are defined as differences between limbs or organs located on opposite sides of the human body. These differences manifest themselves in the form of differences in the person’s speed, strength, power, dexterity, and other characteristics or motor skills [9].
In sport, there is a great need to find factors that significantly influence the achievement of the best results, which is particularly evident in top athletes. In addition to other factors, such as updating training methods or biological regeneration, a certain level of physical factors plays an important role [10]. Numerous studies have shown that there are morphological and functional asymmetries in sport [11,12,13,14,15,16,17], which must be monitored to determine their effects on the differences between the left and right sides of the body, between the limbs, and between the upper and lower body, which are reflected in the limbs, body fat percentage, bone density, lean body mass, muscle mass, etc. [18]. The finding of functional asymmetry means that one part of the body is better at a particular skill than another part of the body [19]. There are several types of functional asymmetry, including motor, sensory, autonomic, biochemical, and psychological [20].
It is obvious that physical diversity depends on the specifics of the sport, which means that participation in unilateral sports is associated with inconsistent changes in soft tissues [21,22]. Determining differences in the consistency of physical characteristics is one of the indicators of whether the exerciser is creating conditions for injury during exercise [23,24].
Football is a complex sport that requires the repetition of many different movements [25] and consists of many different technical elements. Some technical elements are performed with the ball, while others are performed without the ball; many are performed with the player’s feet, while others are performed with other parts of the body [26]. Many of these are one-sided, such as goal kicks, passes, dribbling, jumps, changes in direction and tackling of the ball [26,27]. It has been found that performing repetitive and prolonged nonrepetitive movements with a unilateral movement pattern can cause differences between two body parts or between agonists and antagonists of the same body part [28,29]. More frequent use of the dominant leg often leads to the development of musculoskeletal imbalances and increased unilateralism [30]. Muscular imbalance may depend on the player’s age, years of training, and playing position [31].
In team sports, such as football, athletes are often confronted with situations in which they have to adapt their actions to rapidly changing game situations. These situations often require them to perform technical elements with their non-dominant leg or arm. The extent to which a player can successfully execute technical elements with their non-dominant side is an indicator of their level of “bilateral ability”. It is believed that the level of a player’s bilateral ability is a limitation for progression to higher levels of play [32,33]. Attackers in football who are able to shoot with both feet or defenders who are able to clear the ball with both feet are considered faster and more effective than highly one-footed footballers who have to radically adjust their position to use their dominant leg, risking a quicker reaction from their opponents [6]. The strong tendency to use the dominant leg in football players is often attributed to coaches’ lack of knowledge and insufficient practice [34], but this is not entirely correct. Actual leg use in professional football shows a strong tendency to use the right leg for right-footed players and the left foot for left-footed players when executing various football elements. The use of the dominant leg is highest (85%) for free kicks, penalties, corners, dribbling, and passing, while the use of the dominant leg is slightly lower (70%) for tackling, free kicks, one-touch shots, and passes. Footballers only seem to switch to the “weak” non-dominant leg when they are under force from the opponent or do not have time to switch to the dominant leg. The strong tendency to use the dominant leg when performing football-specific skills suggests that even extensive football-specific training does not influence the innate tendency to dominate one leg when playing football. On the other hand, this could simply be due to the characteristics of the game of football and the training procedures (coach’s instructions, drills and movement tasks) that favour the dominant leg (about 80% of all drills) [34,35].
Success factors in football also include appropriate physical characteristics, adequately developed motor skills, and an appropriate balance of physical characteristics and motor skills between the right and left sides of the body. The basic aims of the study were, therefore, to determine the effects of using the dominant leg in a football match on functional asymmetries.
2. Materials and Methods
2.1. Sample
A total of 144 male subjects took part in the study. All measurements were taken from a total of 116 subjects from the following age groups: U12 (N = 17), U13 (N = 18), U14 (N = 15), U15 (N = 16), U16 (N = 18), U17 (N = 13), U18 (N = 10), and U19 (N = 9). All subjects were members of the Maribor Tabor football club with a well-organised football school, in which they have at least five activities per week (four training sessions and one match) and have regularly participated in football training for at least 4 years. All subjects trained regularly and had not been injured in the six months prior to the study. They were duly informed about the study and gave their written consent to participate in the study at the football club (consent was given by the parents for those under 18 years of age). The study was conducted in accordance with the Helsinki–Tokyo Declaration (1964). The approval of the Ethics Committee of the Faculty of Sport of the University of Ljubljana (2019) was obtained. The data obtained are protected in accordance with the provisions of the GDPR (protection of personal data) and were used exclusively for the needs of the research. The subjects completed a questionnaire in which they provided their first and last name, date of birth, age group, dominant hand, dominant kicking leg, take-off leg, leg injuries and years playing football.
2.2. Recordings and Measurements
The football game was recorded on a football pitch with artificial turf using two Sony HDR CX240E cameras (Sony, Tokyo, Japan) on a tripod. The ball flight speed during kicking, measured with a Stalker ATS 2 radar gun (Stalker Sport, Nashua, NH, USA), as well as the time of dribbling with a change in directions with one foot over 20 m (adjusted measurement according to [36]) measured with photocells (Beam Trainer BLE, Bicyclehero, Anyangsi, Republic of Korea), were measured on a football pitch with artificial turf. The height of the counter-movement jump (CMJ) and take-off power were measured with a force plate in a sports hall with an S2P portable dual-force plate (with ARS software—Analysis and Reporting Software; S2P Ltd., Ljubljana, Slovenia, http://www.s2p.si/software.html, accessed date: 9 February 2020).
Before the actual measurements, all test subjects completed a trial with all the motor ability tests included in the study without recording the results. All measurements and recordings of the subjects in the football game were carried out within four days. The sequence of measurements was as follows: dribbling the ball with change in direction, ball flight speed when kicking, CMJ on the force plate, and the recording of the football game. Before the measurements and the recording of the football match, all test subjects completed a standardised 15 min warm-up (running and stretching exercises). Before the measurements on the force plate in the sports hall, the test subjects also completed a 15 min warm-up programme (cycling on a stationary bike and stretching exercises).
The reliability and validity of the measurement of the dribbling with changes in direction time was validated [36]. Stalker ATS 2 is a reliable and valid device for measuring the flight speed of a football by placing a radar gun behind the goal [37]. Force plate measurements are generally considered valid and reliable. For the CMJ, good to excellent reliability of the measured variables (including jump height and jump force) is observed [38]. The kinetic variables of the CMJ measured with a force plate are considered reliable measures of propulsive force in young athletes [39].
2.2.1. Measuring the Time of Dribbling with Changes in Direction
Figure 1 shows the right and left obstacle course for measuring the dribbling time with changes in direction, the measuring points and the placement of the photocells, the distance in metres, and the cones with the distances between them.
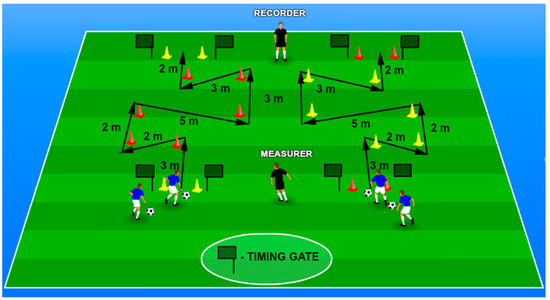
Figure 1.
Dribbling the ball with changes in direction, right and left obstacle course (adapted from [36]).
The subject stands with the ball just behind the starting line. At the signal “Ready, steady, go”, he begins to guide the ball around the cones as quickly as possible with just one foot. The task is completed when he crosses the finish line marked by 2 cones together with the ball. The result is the time in seconds, with an accuracy of 0.01 s, measured from the interruption of the photocell beam at the start to the point at which the subject crosses the finish line with the ball and interrupts the photocell beam at the finish. If the subject runs round the cone from the wrong side or the ball escapes them or they touch it with the other foot, the attempt is invalid. The subject has 3 separate attempts with the right and left foot on the right training area with obstacles and 3 separate attempts with the right and left foot on the left training area with obstacles, totalling 12 attempts, with a break of at least 1 min between repetitions. All results are recorded and the best results are used for statistical analysis.
2.2.2. Measuring the Ball Flight Speed When Kicking
Figure 2 shows the organisation of the measurement of the ball flight speed when kicking, and the placement of the goal, the radar, the measuring device, the measuring devices, the ball, and the cones, as well as the distance between the radar and the goal, between the goal and the ball, and the length of the run.
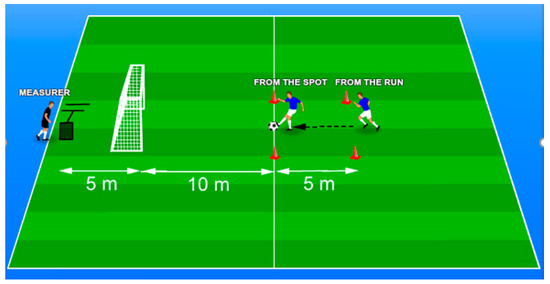
Figure 2.
Kicking the ball—ball flight speed (adapted from [17]).
The measurer stands behind a radar gun, which is placed on a stand at a height of 90 cm and 5 m behind the goal. Additionally, 10 m in front of the goal, the place where the ball is to be kicked is marked with two cones set 5 m apart. Then, 15 m in front of the goal, the place where the ball is to be kicked out of the goal is marked with two cones set 5 m apart. Task 1: The test subject places the supporting leg next to and behind the ball and kicks the ball into the goal from the spot with the inside of the foot with maximum force without moving the supporting leg. Task 2: The test subject takes a running start 5 m from the ball, runs to the ball, and kicks the ball into the goal with the inside of the foot with maximum force. The radar gun recognises the fastest object (ball) in the space and measures the maximum speed of the ball in the direction of the goal in km/h with an accuracy of up to 0.1 km/h. The test subject has 3 attempts each with the right and left foot for shots without and with a run-up, i.e., 12 attempts in total. All results are recorded, and the best results are used for statistical analysis.
2.2.3. Measuring the CMJ Relative Maximum Power
Figure 3 shows a test subject on a portable double-sided force plate while performing a counter-movement jump (CMJ).
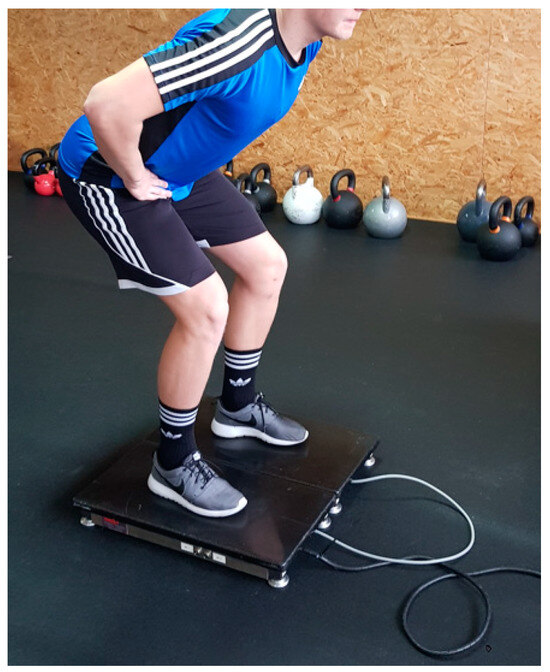
Figure 3.
Counter-movement jump from a standing position on a dual-force plate [17].
From a standing position with their feet hip-width apart, the subject begins to lower into a half squat as quickly as possible (up to a hip and knee flexion position of 90°), and decelerates the vertical downward movement and transitions from lowering to vertical lifting as quickly as possible—with the aim of pushing off as quickly and as high as possible [40]. The gaze was directed forwards and the palms rested on the hips during the entire jump. The depth of the vertical descent was carefully monitored by the measurer. After a two-second stabilisation in the starting position, which was monitored by the measuring device (stabilisation of the force–time curve), the subject began to move downwards as quickly as possible in order to jump as high as possible in response to the signal from the measurer (“hop”). The reliability of the jumping performance was monitored by the measurer. Repetitions in which the subject lifted five feet off the ground during the jump or the jump height was too low to go into a half squat were excluded from the evaluation. Each subject performed three valid repetitions. If there were problems with the quality of the performance, the measurements were repeated, with none of the test subjects completing more than six jumps. The jump height and the relative maximum power of one and the other leg in W/kg were measured with an accuracy of 0.01. We included the mechanical variables of the jump in which the subject jumped the highest in the statistical analysis [41].
2.2.4. Recording of the Football Match
Figure 4 shows a four-on-four football match with two goals and goalkeepers. The players are lined up in a 1–2–2 formation: goalkeeper (G)–left defender (LD) and right defender (RD)–left attacker (LA) and right attacker (RA). The setup of the cameramen with cameras can also be seen.
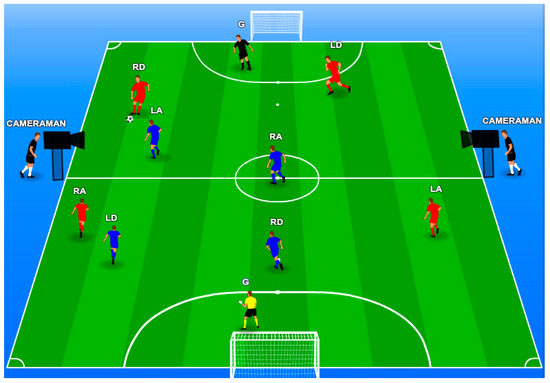
Figure 4.
A four-on-four football match, with two goals and goalkeepers.
All test subjects were filmed for 30 min on a 55 × 30 square metre artificial turf pitch in a four-on-four football match with two 5 × 2 square metre goals and goalkeepers. All players played in all four positions. This means that each player played for 7.5 min in the positions of left defender, right defender, right attacker, and left attacker. The goalkeepers were not substituted. By carefully analysing the footage of each player during the football match, we determined the number of touches of the ball with the right and left leg.
2.3. Statistical Analysis
The collected data were processed using the IBM SPSS 25.0 programme for Windows. The Kolmogorov–Smirnov test was used to check the normality of the distribution of the results for the individual variables. The paired t-test was used to determine the differences in the working characteristics of the left and right legs and to determine consistency. The correlations between the selected variables and groups of variables were determined by calculating the Spearman correlation. The calculation of the validity and reliability of the measurement of the time for dribbling the ball with changes in direction and the measurement of the flight speed of the ball at the kick was carried out using factor analysis and the calculation of the Cronbach alpha coefficients.
3. Results
Table 1 shows the descriptive statistics of the variables (for the entire sample and by age group) of the proportion of use of the dominant leg in the football game.

Table 1.
Proportion of dominant leg use in the football game.
Table 2 shows the descriptive statistics of the variables considered and the results of the paired t-tests with the statistical significance of the differences between the two legs (total sample and by individual age groups) in the number of touches of the ball in a football match with the right and left leg, the time of dribbling the ball with a change in direction with the right and left leg on the right and left obstacle course, the flight speed of the ball when kicking the ball with the right and left leg from a standing position and with a run-up, and the relative maximum strength of the right and left leg when jumping with simultaneous counter-movement from a standing position into the air (CMJ). The differences between the legs in the number of touches are statistically significant for the entire sample (p < 0.001) and in all individual age groups (from p < 0.001 to p = 0.19). The differences between the legs in the time for dribbling the ball with a change in direction are statistically significant for the whole sample (p = 0.007), U12 (p < 0.001), U13 (p = 0.006), U16 (p < 0.001), and U17 (p = 0.007) on the right obstacle course and for U15 (p = 0.036) and U17 (p = 0.004) on the left obstacle course. The differences between the legs in the ball flight speed when kicking the ball from a standing position are statistically significant for the entire sample (p < 0.001), U17 (p = 0.004), U18 (p < 0.001), and U19 (p = 0.025), and with run-up for the entire sample (p < 0.001), U12 (p = 0.001), U13 (p = 0.048), U14 (p = 0.018), U16 (p = 0.02), U17 (p = 0.001), U18 (p = 0.004), and U19 (p = 0.045). The differences between the legs in the relative maximum strength of the CMJ are statistically significant for the entire sample (p = 0.017). Table 2 also shows the values of the Cronbach’s alpha coefficients indicating poor (Cr. α ≥ 0.5), acceptable (Cr. α ≥ 0.6), and excellent (Cr. α ≥ 0.9) validity and reliability of the measurements of the time of dribbling the ball with a change in direction on the right and left obstacle course and the ball flight speed when kicking the ball from a standing position and with a run-up.
Table 2.
Descriptive statistics and t-tests. Statistically significant differences are marked in bold.
Table 3 shows the statistics of the variables considered in relation to the relationship between the proportion of dominant leg use in the game and functional asymmetries. The proportion of dominant leg use in the game is statistically significantly related to the differences between the legs in ball flight speed when kicking from a standing position in entire sample and in the U17 and in ball flight speed when kicking with a run-up only in the whole sample. The proportion of use of the dominant leg in the game is statistically significantly correlated with the differences between the legs in the relative maximum strength in the CMJ in the U15. There are no statistically significant correlations with the differences between the right and left leg when dribbling the ball with changing diagonals on the right and left obstacle course in the entire sample and in any age group.
Table 3.
The relationship between the proportion of use of the dominant leg in football and compliance at work.
4. Discussion
This study emphasises the importance of the proportion of use of the dominant leg when playing football and its correlations with some functional asymmetries between the two legs. We analysed the differences between the two legs in ball flight speed during kicking, dribbling time with changes in direction, and the relative maximal strength of the CMJ (Table 2). We found many statistically significant functional asymmetries between the two legs. The proportion of use of the dominant leg is statistically significantly correlated with some of the observed functional asymmetries in young football players of different age groups and varies across age groups (Table 3), which may be related to the development and growth of youth and the quantity and quality of football training.
When analysing the results, we find, similar to many other studies [42,43,44,45,46,47], that young football players of different age groups perform quite inconsistently (Table 2). Across the sample of subjects, work incoherence was most evident in the differences between the legs when touching the ball, which is to be expected, as this is associated with a high proportion of use of the dominant leg in play. Work incoherences were also seen in the power of shots on the ball (especially with a run-up), which is also to be expected, as decisive movements in football are normally performed with maximum power and with the dominant leg. Goal kicks, free kicks, corners, and penalties are also performed with the dominant leg (up to 86.2%) [35].
The actual average percentage of use of the dominant leg in the game, which is 77.78% (Table 1), is similar to the average percentage of use of the dominant leg in football (from 71.7% to 83.7%) that other authors have found in their studies [34,35,48]. In the study, we found statistically significant differences in the number of touches between the two legs during a football match in the entire sample of subjects and in all the age groups considered (Table 2). On the basis of these data, statistically significant differences can be expected, which also indicate a bias, namely the tendency for one side of the body to dominate over the other. In a sample of 71 young football players, the effect of 6 months of training with the non-dominant leg on the proportion of use of the dominant leg in a football match was investigated. The experimental group (N = 35; 14.37 ± 1.94 years) performed 20 min training sessions three times a week with the non-dominant leg only. The control group (N = 36; 14.50 ± 1.81 years) trained according to the usual programme. When calculating the utilisation index of the dominant leg using the SEFFAL-FOOT system (system of assessment of functional asymmetry of the lower limbs in football) [49] on the basis of video analysis of players in a 5–5 football match, a significant decrease in the utilisation of the dominant leg was observed in the test group during the match (utilisation index at the beginning 7.72 and 7.13 at the end, i.e., a decrease of 7.5%), while there were no significant changes in the control group (utilisation index at the beginning and end of the study—7.57) [50].
Similar to other studies [42,43], we also found statistically significant differences between the legs during dribbling with a change in direction (Table 2). On the right obstacle course, the differences were statistically significant for all age groups and for three age groups (U12, U15, and U16), whereas on the left obstacle course, the differences were statistically significant for two age groups (U14 and U16). In the aforementioned studies, it was found that increased use of the non-dominant leg during football training can reduce the differences between the legs in dribbling speed [42,43]. We found a number of statistically significant differences between the legs in the speed of the ball on the kick (Table 2), which is consistent with other studies [43,44,45]. The differences in standing kicking are statistically significant for all age groups combined, U17, U18, and U19, and in running kicking for all age groups combined, U12–U19. They found that with increasing football training with the non-dominant leg, the results of kicking measurements improved for both legs, but the differences remained similar [43]. In our study, we found statistically significant differences in relative maximal force between the right and left leg when jumping in counter-movement on a dual-force plate for all age groups combined (Table 2). Other researchers have also found statistically significant differences between the legs when jumping with counter-movement on a force plate [46].
The results of the study on the correlation between the proportion of use of the dominant leg in football and work compliance of young football players of different age groups show that there are some statistically significant correlations in the whole sample of subjects and in individual age groups (Table 3). In a detailed review of the literature, we found no studies that correlated the proportion of use of the dominant leg in football with work compliance. We also found no such studies in other sports (e.g., the correlation between the proportion of dominant hand use in basketball and non-compliance with work). The proportion of dominant leg use in football is statistically significantly associated with the difference between the right and left leg in the force of the kick (ball flight speed) after the ball without running in the U17 and in the total, with running in the total (Table 3) and with the difference between the two legs in the relative maximum force in a sound jump with the opposite movement on the force plate only in the U15 (Table 3). The proportion of use of the dominant leg in football play is not statistically significantly associated with the differences between the legs in the time taken to dribble the ball with a change in direction on the right and left training pitches with obstacles.
It should be emphasised that football players work much more with the ball during training than during a football match or game, where they are only with the ball 2% of the time [51]. This means that with properly planned and executed training, the proportion of use of the dominant foot in a football match can be reduced, which can also increase the efficiency of football players in the match, as they can more easily resolve match situations that require the use of the non-dominant leg.
Research limitations: Due to the extensive research and numerous measurements, the number of subjects decreased due to injury, illness, or personal reasons, and due to the small sample of subjects overall and in individual age groups, we cannot generalise the results of the study to the entire age group or the entire population of young football players. Due to the impossibility of intervening in the training process of the football club, the groups considered were separated according to chronological and not biological age. In future studies, it would be useful to include a larger number of young football players from several football clubs (from the beginning of serious involvement with football in the U8 age category to adulthood in the U21 age category) and a larger number of observed work inconsistency variables. It would also be useful to conduct a study with the same subjects over a longer period.
5. Conclusions
In sport, the basic idea is “higher, stronger, faster”, which leads to the desire to win in competition. The fundamental goal of any sporting activity is also the athlete’s health, which is often in conflict with the athlete’s performance, which must be as efficient as possible (faster, stronger, more enduring, etc.) in order to be successful. We have found numerous functional asymmetries between the legs in the number of touches on the ball, the duration of dribbling with a change in direction, the speed of the ball on the kick, and the relative maximum force of simultaneous jumps with the counter-movement from a standing position upwards. The correlation between the proportion of the dominant leg used in a football match and functional asymmetries is statistically significant, especially in the differences between the right and left leg in the speed of the ball when kicking from a standing position and with a run-up and in the relative maximum force when jumping with the opposite movement, while we found no statistically significant correlations with the differences between the legs in the duration of dribbling with a change in direction. In addition to organized training in a football club, the amount of use of the dominant leg when playing football and the emergence of functional asymmetries can also be influenced by playing football at school (another 2-3 times a week) and by unorganized football matches between peers on local sports fields (for which we were unable to obtain data on the possible extent). Coaches who are only after results expose their athletes to training that is too demanding, too extensive, not varied enough, one-sided, and not progressive, which only enables short-term results, but in the long term can lead to overtraining, exhaustion, illness, injuries, decreasing motivation for training and competitions, and, of course, the development of major physical and professional inconsistencies that reduce competition and performance and increase the risk of injury. Sick or injured athletes are unable to train, compete, or achieve success. Frequent injuries force many to stop playing sport.
For sporting success and health, it is important to regularly measure physical and work characteristics and inconsistencies in order to plan, implement, monitor and evaluate the training process in young and adult football players. It is useful to perform a variety of exercises with equal loading on the left and right sides of the body, the front and back of the body, and the upper and lower body. Equal loading of the right and left leg during training can eliminate the effect of more stress on the dominant leg in the football game, which can have an impact on reducing inconsistencies in the work between the right and left leg, which in turn reduces some physical inconsistencies and, therefore, increases efficiency and reduces the risk of injury.
Without a properly planned and controlled training process with equal stress on both sides of the body during training, most young football players (exceptions are possible) will only develop their dominant side. Much additional education is needed not only for football coaches and players, but also for their parents and teachers at school to realise the importance of physical and occupational compatibility and laterality. Some ideas in the conclusion have not yet been explored, but it is important to explore them in order to improve the theory and practice of training so that athletes are healthy and successful.
Author Contributions
Conceptualization, M.Ž. and I.Č.; methodology, M.Ž. and I.Č.; software, M.Ž.; validation, M.Ž. and I.Č.; formal analysis, M.Ž.; investigation, M.Ž.; resources, M.Ž.; data curation, M.Ž.; writing—original draft preparation, M.Ž.; writing—review and editing, M.Ž., I.Č. and K.Š.; visualisation, K.Š.; supervision, I.Č.; project administration, M.Ž., I.Č. and K.Š. All authors have read and agreed to the published version of the manuscript.
Funding
This research received no external funding.
Institutional Review Board Statement
The study was conducted in accordance with the Declaration of Helsinki, and approved by the Institutional Ethics Committee of University of Ljubljana, Faculty of sport (protocol code 01.2019).
Informed Consent Statement
Informed consent was obtained from all subjects involved in the study.
Data Availability Statement
The data presented in this study is available on request from the corresponding author.
Conflicts of Interest
The authors declare no conflicts of interest.
References
- Loffing, F.; Hagemann, N.; Strauss, B.; MacMahon, C. Chapter 1—Laterality in Sports: More Than Two Sides of the Same Coin. In Laterality in Sports: Theories and Applications; Loffing, F., Hagemann, N., Strauss, B., MacMahon, C., Eds.; Academic Press, Elsevier: San Diego, CA, USA, 2016; pp. 1–7. [Google Scholar] [CrossRef]
- Coren, S.; Porac, C.; Duncan, P. Lateral Preference Behaviors in Preschool Children and Young Adults. Child Dev. 1981, 52, 443–450. [Google Scholar] [CrossRef]
- Corballis, M.C. Handedness and cerebral asymmetry: An evolutionary perspective. In The Two Halves of the Brain: Information Processing in the Cerebral Hemispheres, 1st ed.; Hugdahl, K., Westerhausen, R., Eds.; MIT Press: Cambridge, USA, 2010; pp. 65–88. [Google Scholar] [CrossRef]
- Musálek, M. Skilled performance tests and their use in diagnosing handedness and footedness at children of lower school age 8–10. Front. Psychol. 2015, 5, 1513. [Google Scholar] [CrossRef] [PubMed]
- Loffing, F.; Hagemann, N. Chapter 12—Performance Differences Between Left- and Right-Sided Athletes in One-on-One Interactive Sports. In Laterality in Sports: Theories and Applications; Loffing, F., Hagemann, N., Strauss, B., MacMahon, C., Eds.; Academic Press, Elsevier: San Diego, CA, USA, 2016; pp. 249–277. [Google Scholar] [CrossRef]
- Stöckel, T.; Carey, D.P. Chapter 14—Laterality Effects on Performance in Team Sports: Insights From Football and Basketball. In Laterality in Sports: Theories and Applications; Loffing, F., Hagemann, N., Strauss, B., MacMahon, C., Eds.; Academic Press, Elsevier: San Diego, CA, USA, 2016; pp. 309–328. [Google Scholar] [CrossRef]
- Starosta, W. Symmetry and Asymmetry of Movements in Sport; Institutute of Sport: Warsaw, Poland, 1990. [Google Scholar]
- Malinowski, A. Auksologia. Rozwój Osobniczy Człowieka w Ujęciu Biomedycznym; Wydawnictwo Uniwersytetu Zielonogórskiego: Zielona Góra, Poland, 2004. [Google Scholar]
- Koszczyc, T. Asymetria Morfologiczna Idynamicz Orazmożliwości jej Kształtowania Udzieciwmłod Szym Wieku Szkolnym; AWF: Wrocław, Poland, 1991. [Google Scholar]
- Petersen, H.L.; Peterson, C.T.; Reddy, M.B.; Hanson, K.B.; Swain, J.H.; Sharp, R.L.; Alekel, D.L. Body composition, dietary intake, and iron status of female collegiate swimmers and divers. Int. J. Sport Nutr. Exerc. Metab. 2006, 16, 281–295. [Google Scholar] [CrossRef] [PubMed]
- Berdejo del Fresno, D.; Vicente-Rodríguez, G.; González-Ravé, J.M.; Moreno, L.A.; Rey-López, J.P. Body composition and fitness in elite Spanish children tennis players. J. Hum. Sport Exerc. 2010, 5, 250–264. [Google Scholar] [CrossRef]
- Filipčič, A.; Čuk, I.; Filipčič, T. Lateral asymmetry in upper and lower limb bioelectrical impedance analysis in youth tennis players. Int. J. Morphol. 2016, 34, 890–895. [Google Scholar] [CrossRef]
- Hart, N.H.; Nimphius, S.; Spiteri, T.; Newton, R.U. Leg strength and lean mass symmetry influences kicking performance in Australian football. J. Sports Sci. Med. 2014, 13, 157–165. [Google Scholar] [PubMed Central]
- Poliszczuk, T.; Mańkowska, M.; Poliszczuk, D.; Wiśniewski, A. Symmetry and asymmetry of reaction time and body tissue composition of upper limbs in young female basketball players. Pediatr. Endocrinol. Diabetes Metab. 2013, 19, 132–136. [Google Scholar]
- Rauter, S.; Vodičar, J.; Šimenko, J. Body asymmetries in young male road cyclists. Int. J. Morphol. 2017, 35, 907–912. [Google Scholar] [CrossRef][Green Version]
- Rynkiewicz, M.; Rynkiewicz, T.; Starosta, W. Asymmetry of spinal segments mobility in canoeists and its relationship with racing speed. J. Hum. Kinet. 2013, 36, 37–43. [Google Scholar] [CrossRef][Green Version]
- Železnik, M. Povezanost Uporabe Prevladujoče Noge s Telesnimi in z Delovnimi Skladnostmi pri Mladih Nogometaših Različnih Starostnih 612 Skupin. Ph.D. Dissertation, Univerza v Ljubljani, Fakulteta za Šport, Ljubljana, Slovenia, 2024. [Google Scholar]
- Krzykala, M. Dxa as a Tool for the Assessment of Morphological Asymmetry in Athletes; IntechOpen: London, UK, 2012; pp. 1–18. [Google Scholar] [CrossRef][Green Version]
- Functional Asymmetry. Available online: https://psychologydictionary.org/functional-asymmetry/ (accessed on 15 June 2023).
- Zaidi, Z.F. Body Asymmetries: Incidence, Etiology and Clinical Implications. Aust. J. Basic Appl. Sci. 2011, 5, 2157–2191. [Google Scholar]
- Ducher, G.; Courteix, D.; Meme, S.; Magni, C.; Viala, J.F.; Benhamou, C.L. Bone geometry in response to long-term tennis playing and its relationship with muscle volume: A quantitative magnetic resonance imaging study in tennis players. Bone 2005, 37, 457–466. [Google Scholar] [CrossRef] [PubMed]
- Haapasalo, H.; Kannus, P.; Sievänen, H.; Pasanen, M.; Uusi-Rasi, K.; Heinonen, A.; Oja, P.; Vuori, I. Effect of long-term unilateral activity on bone mineral density of female junior tennis players. J. Bone Miner. Res. Off. J. Am. Soc. Bone Miner. Res. 1998, 13, 310–319. [Google Scholar] [CrossRef]
- Ferriss, T. The 4 Hour Body; Crown Publishing Group: New York, NY, USA, 2010. [Google Scholar]
- Sattler, T. Notranji Dejavniki Tveganja Športnih Poškodb pri Odbojki. Ph.D. Dissertation, Univerza v Ljubljani, Fakulteta za Šport, Ljubljana, Slovenia, 2010. [Google Scholar]
- Rampinini, E.; Bishop, D.; Marcora, S.M.; Ferrari Bravo, D.; Sassi, R.; Impellizzeri, F.M. Validity of simple field tests as indicators of match-related physical performance in top-level professional football players. Int. J. Sports Med. 2007, 28, 228–235. [Google Scholar] [CrossRef]
- Pocrnjič, M. Prognostična Vrednost Ekspertnih Modelov za Usmerjanje, Izbiranje in Nadzorovanje Procesa Treniranja Mladih Nogometašev. Ph.D. Dissertation, Univerza v Ljubljani, Fakulteta za Šport, Ljubljana, Slovenia, 1999. [Google Scholar]
- Pinniger, G.; Steele, J.; Groeller, H. Does fatigue induced by repeated dynamic efforts affect hamstring muscle function? Med. Sci. Sports Exerc. 2000, 32, 647–653. [Google Scholar] [CrossRef] [PubMed]
- Lehance, C.; Binet, J.; Bury, T.; Croisier, J.L. Muscular strength, functional performances and injury risk in professional and junior elite football players. Scand. J. Med. Sci. Sports 2009, 19, 243–251. [Google Scholar] [CrossRef]
- Masuda, K.; Kikuhara, N.; Demura, S.; Katsuta, S.; Yamanaka, K. Relationship between muscle strength in various isokinetic movements and kick performance among football players. J. Sports Med. Phys. Fit. 2005, 45, 44–52. [Google Scholar]
- Rahnama, N.; Lees, A.; Bambaecichi, E. Comparison of muscle strength and flexibility between the preferred and nonpreferred leg in English football players. Ergonomics 2005, 48, 1568–1575. [Google Scholar] [CrossRef]
- Fousekis, K.; Tsepis, E.; Poulmedis, P.; Athanasopolus, S.; Vagenas, G. Intrinsic risk factors of non-contact quadriceps and hamstring strains in football: A prospective study of 100 professional players. Br. J. Sports Med. 2011, 45, 709–714. [Google Scholar] [CrossRef] [PubMed]
- Bale, P.; Scholes, S. Lateral dominance and basketball performance. J. Hum. Mov. Stud. 1986, 12, 145–151. [Google Scholar]
- Grouios, G.; Kollias, N.; Tsorbatzoudis, H.; Alexandris, K. Overrepresentation of mixed-footedness among professional and semi-professional football players: An innate superiority or a strategic advantage? J. Hum. Mov. Stud. 2002, 42, 19–29. [Google Scholar]
- Carey, D.P.; Smith, G.; Smith, D.T.; Shepherd, J.W.; Skriver, J.; Ord, L.; Rutland, A. Footedness in world football: An analysis of France ‘98. J. Sport Sci. 2001, 19, 855–864. [Google Scholar] [CrossRef] [PubMed]
- Carey, D.P.; Smith, D.T.; Martin, D.; Smith, G.; Skriver, J.; Rutland, A.; Shepherd, J.W. The bi-pedal ape: Plasticity and asymmetry in footedness. Cortex 2009, 45, 650–661. [Google Scholar] [CrossRef]
- Pocrnjič, M. Struktura in Povezanost Osnovne in Nogometne Motorike pri Nogometaših Starih od 12 do 13 Let. Master’s Thesis, Univerza v Ljubljani, Fakulteta za Šport, Ljubljana, Slovenia, 1996. [Google Scholar]
- Díez-Fernández, D.M.; Rodríguez-Rosell, D.; Gazzo, F.; Giráldez, J.; Villaseca-Vicuña, R.; Gonzalez-Jurado, J.A. Can the Supido Radar Be Used for Measuring Ball Speed during Football Kicking? A Reliability and Concurrent Validity Study of a New Low-Cost Device. Sensors 2022, 22, 7046. [Google Scholar] [CrossRef] [PubMed]
- Spudić, D. Primerjava Različnih Protokolov Inercijske Vadbe za Moč nog. Ph.D. Dissertation, Univerza v Ljubljani, Fakulteta za Šport, Ljubljana, Slovenia, 2022. Available online: https://repozitorij.uni-lj.si/IzpisGradiva.php?lang=slv&id=139102 (accessed on 18 January 2025).
- Parry, G.N.; Herrington, L.C.; Horsley, I.G. The Test-Retest Reliability of Force Plate-Derived Parameters of the Countermovement Push-Up as a Power Assessment Tool. J. Sport Rehabil. 2020, 29, 381–383. [Google Scholar] [CrossRef] [PubMed]
- McMahon, J.J.; Suchomel, T.J.; Lake, J.P.; Comfort, P. Understanding the key phases of the countermovement jump force-time curve. Strength Cond. J. 2018, 40, 96–106. [Google Scholar] [CrossRef]
- Petrigna, L.; Karsten, B.; Marcolin, G.; Paoli, A.; D’Antona, G.; Palma, A.; Bianco, A. A Review of Countermovement and Squat Jump Testing Methods in the Context of Public Health Examination in Adolescence: Reliability and Feasibility of Current Testing Procedures. Front. Physiol. 2019, 10, 1384. [Google Scholar] [CrossRef] [PubMed]
- Haaland, E.; Hoff, J. Non-dominant leg training improves the bilateral motor performance of football players. Scand. J. Med. Sci. Sports 2003, 13, 179–184. [Google Scholar] [CrossRef] [PubMed]
- Teixeira, L.A.; Silva, M.V.; Carvalho, M. Reduction of lateral asymmetries in dribbling: The role of bilateral practice. Laterality Asymmetries Body Brain Cogn. 2003, 8, 53–65. [Google Scholar] [CrossRef]
- Nunome, H.; Ikegami, Y.; Kozakai, R.; Apriantono, T.; Sano, S. Segmental dynamics of football instep kicking with the preferred and non-preferred leg. J. Sports Sci. 2006, 24, 529–541. [Google Scholar] [CrossRef]
- Dörge, H.C.; Bull-Andersen, T.; Sørensen, H.; Simonsen, E.B. Biomechanical differences in football kicking with the preferred and the non-preferred leg. J. Sports Sci. 2002, 20, 293–299. [Google Scholar] [CrossRef] [PubMed]
- Yanci, J.; Camara, J. Bilateral and unilateral vertical ground reaction forces and leg asymmetries in football players. Biol. Sport 2016, 33, 179–183. [Google Scholar] [CrossRef] [PubMed]
- Painter, K. Bilateral Ground Reaction Force Jumping Asymmetry and Performance. Ph.D. Thesis, East Tennessee State University, Johnson City, TN, USA, 2021. Paper 3962. Available online: https://dc.etsu.edu/etd/3962 (accessed on 2 March 2024).
- Krondorf, L. Physiological Improvements in Male Football Players. In Laterality Aspect Changes by Training the Non-Dominant Leg; Norwegian University of Science and Technology, Department of Circulation and Medical Imaging: Trondheim, Norway, 2018. [Google Scholar] [CrossRef]
- Guilherme, J.; Graça, A.; Seabra, A.; Garganta, J. Validação de um sistema de avaliação da assimetria funcional dos membros inferiores em Futebol. Rev. Port. De Ciências Do Desporto 2012, 12, 77–97. [Google Scholar]
- Guilherme, J.; Garganta, J.; Graça, A.; Seabra, A. Influence of non-preferred foot technical training in reducing lower limbs functional asymmetry among young football players. J. Sports Sci. 2015, 33, 1790–1798. [Google Scholar] [CrossRef] [PubMed]
- Marković, G.; Bradić, A. Nogomet—Integralni Kondicijski Trening; Udruga »Tjelesno vježbanje i zdravlje«: Zagreb, Croatia, 2008. [Google Scholar]
Disclaimer/Publisher’s Note: The statements, opinions and data contained in all publications are solely those of the individual author(s) and contributor(s) and not of MDPI and/or the editor(s). MDPI and/or the editor(s) disclaim responsibility for any injury to people or property resulting from any ideas, methods, instructions or products referred to in the content. |
© 2025 by the authors. Licensee MDPI, Basel, Switzerland. This article is an open access article distributed under the terms and conditions of the Creative Commons Attribution (CC BY) license (https://creativecommons.org/licenses/by/4.0/).