Article

The Influence of Overlying High-Speed Rail Dynamic Loads on the Stability of Shield Tunnel Faces During Excavation

School of Resources and Safety Engineering, Central South University, Changsha 410083, China
*
Author to whom correspondence should be addressed.
Appl. Sci. 2025, 15(5), 2567; https://doi.org/10.3390/app15052567
Submission received: 23 January 2025 / Revised: 23 February 2025 / Accepted: 25 February 2025 / Published: 27 February 2025
(This article belongs to the Special Issue Geotechnical Engineering and Infrastructure Construction)

Abstract

:
This study investigates the stability of multilayer shield tunnels beneath high-speed railway bases, with a particular focus on the influence of dynamic loads induced by high-speed rail vibrations and shield thrust. A self-designed scale test apparatus was employed to simulate the effects of these dynamic loads on tunnel soil stability, face integrity, formation stress, deformation, and settlement. The experimental setup was specifically designed to accurately replicate the deformation characteristics of the tunnel face and surrounding strata under the combined influence of shield tunneling and high-speed rail loads. The reliability of the experimental results was validated through comparison with numerical simulations performed using FLAC3D software. The study underscores the effectiveness of integrating physical model tests with numerical simulations to predict the failure characteristics and ultimate support forces of tunnel faces under dynamic loading conditions. The findings provide novel insights into the deformation and failure mechanisms of tunnel faces during shield excavation, particularly under the influence of high-speed rail loads. This research establishes a robust methodological framework for assessing tunnel face stability and offers valuable guidance for the design and construction of shield tunnels in analogous geological and operational contexts.

1. Introduction

Subway tunnel excavation frequently traverses intricate subterranean environments and often necessitates the penetration of diverse surface structures, particularly the complex network of crisscrossing railways and high-speed railway embankments. The process of shield tunnel excavation inevitably exerts an impact on the overlying strata and the foundations of high-speed railways [1,2]. Conversely, the passage of high-speed trains generates vibrational effects on the underlying strata and tunnel construction. In regions characterized by loess and other soft soil layers, the construction of tunnels encounters significant challenges due to the loose structure of these soils, which are highly susceptible to disturbance. The stability of the tunnel face during shield tunneling is of paramount importance, as it is a critical issue that demands meticulous attention and robust engineering solutions [3,4,5]. In recent years, many scholars have studied the stability of shield tunnel faces [6,7,8]. Kamata and Mashimo [9] used a centrifugal model of a sandy foundation to test typical auxiliary anchorage methods, and the research results showed that each anchorage technique had its optimal anchorage length and anchorage arrangement; the failure state of a tunnel face under three anchorage positions was given. Pham, Otani [10] used X-ray scanning technology to conduct a scanning study on the formation-deformation process during the failure of tunnel faces and obtained the failure mode of tunnel faces. The results showed that it was more reasonable to describe the failure surface of tunnel faces using a logarithmic spiral equation. Kirsch [11] conducted a 1 g (gravity) small-scale model test to evaluate the supporting pressure model required for the face of a shallow buried tunnel and simulated the collapse of the face of the tunnel. The results showed that a chimney wedge collapse mechanism formed in the dense sand and spread to the soil surface. Fellin, King et al. [12] studied the failure behavior of tunnel faces under different buried depths in a sandy stratum of Ottendorf-Okrilla using a 1 g model test method and obtained the load-displacement curve of tunnel faces and the ultimate supporting force of tunnel faces under different working conditions. Idinger, Aklik [13] used a small geocentrifuge to study the collapse mechanism of the face of non-cohesive soil tunnels under different soil pressures, surface settlements, stresses (acting on the face of the tunnel), and supporting forces required to ensure the safety of the face. Li, Liu [14] carried out indoor physical model tests on the influence of faults on tunnel stability, and the results showed that the influence range of tunnel excavation across faults increased significantly. di Prisco, Flessati [15] carried out a series of 1 g small-scale tunnel tests, taking into account the influence of excavation rate (unloading time) on system response and the change in displacement of the tunnel face with time due to a rapid reduction in horizontal stress imposed on the tunnel face. Huang J et al. [16] conducted dynamic model tests to study the dynamic characteristics of an inverted arch and its foundation soil regarding high-speed railway tunnels under different train speeds; they analyzed the acceleration, dynamic coefficient, and dynamic stress of the inverted arch and foundation soil and discussed their relationship with train speed in detail. They obtained an attenuation law of vibration propagating upward along the track, established the calculation formula of the speed influence coefficient of the tunnel inverted arch, and determined the depth of the stratum affected by vibration. Fei R et al. [17] used a combined method of centrifugal tests and 3D numerical simulation to study the dynamic response of shield tunnels passing under existing high-speed railway tunnels; they analyzed the influence of settlement joints and steel pipe pile reinforcement on the existing tunnels. Liu Z et al. [18] used centrifugal model tests to evaluate the impact of ground vibration near elevated transportation systems on the safety of tunnel structures, analyzing the vertical vibration attenuation trend of vibration load propagation and the vibration response of the tunnel model.
According to the scale and principle of the test model, the existing test methods can be divided into centrifugal model tests, 1 g model tests, similar model tests, scale model tests, etc. While existing research has offered invaluable insights into tunnel excavation and support, particularly regarding the instability mechanisms and support strategies for tunnel faces across various soil conditions, certain limitations persist [19,20,21]. The majority of studies concentrate on experiments involving a singular stratum type, with a notable deficiency in exploring the dynamic response of shield excavation and the stability of tunnel faces under unique geological circumstances, such as those presented by loess with significant loose collapsibility [22,23]. Moreover, the preponderance of current research is either static or reliant on simplified model tests, lacking a profound examination of the tunnel system’s response to the dynamic loading imposed by high-speed trains. The principal aim of this study is to meticulously investigate the influence of high-speed train dynamic loads on the stability of tunnel faces and ground response, with a specific emphasis on underpass high-speed shield tunnel excavation in loess regions. By employing a sophisticated amalgamation of high-precision, similar model testing and numerical simulation, the research undertakes a thorough analysis of the dynamic response elicited by high-speed train vibration loads during tunnel excavation. Additionally, it offers an exhaustive dissection of the damage characteristics and ultimate support forces associated with tunnel faces.

2. Similar Model Test Design

A laboratory-based similar model can truly reflect physical material’s physical behavior, including nonlinearity, anisotropy, and time-dependent properties, without simplifying assumptions. The lab model provides an opportunity for intuitive observation of physical phenomena such as fracture development, failure patterns, deformation processes, etc. A lab model can also provide reliable validation data for numerical models; this is very important in validating the results of theoretical analysis and numerical simulation.

2.1. Similarity Constant

The model size is scaled down from the actual dimensions of the prototype structure to an appropriate proportion. In the initial phase, to ensure genuine and reliable test outcomes, efforts are made to facilitate the ease of conducting similar model tests. The deformation and stress of the similar model are meticulously monitored using a variety of specialized equipment. The results derived from the similar model tests are notably reliable and readily applicable. However, to theoretically guarantee the similarity ratio between the model and the actual engineering scenario, the fundamental principles of elastic mechanics are employed. This ensures that the similar model and the actual engineering project adhere to specific similarity indices. Such adherence allows the test results to accurately mirror the mechanical phenomena occurring in real engineering situations right from the source. The theory of similarity encompasses the first, second, and third theorems of similarity, which collectively underpin the validity and applicability of the model’s findings to real-world engineering contexts.
In this study, a derivation method for similarity criteria based on dimensional analysis was employed to ascertain the test similarity constant. Within a typical engineering system, three fundamental dimensions generally prevail: length [L], time [T], and either force [F]—constituting the FLT system—or mass [M]—forming the MLT system. Specifically, this study adopts mass, length, and time as the foundational physical quantities, utilizing kilograms, meters, and seconds as their respective base units. Through a meticulous analysis of the dimensions of physical quantities, a corresponding dimensional matrix was constructed. Adhering to the principle of dimensional equilibrium, the similarity criterion for the test is systematically deduced. This approach ensures that the relationships between the model and the prototype are accurately represented, thereby facilitating a reliable extrapolation of the test results to real-world engineering applications.
The basic physical quantities selected are mass (M), length (L), and time (T). Their dimensions are as follows:
[ M ] = M [ L ] = L [ T ] = T
The physical quantities discussed below include elastic modulus (E), density (ρ), stress (σ), strain (ε), displacement (Δ), velocity (v), acceleration (a), time (t), frequency (f), etc. The following are dimensional expressions of the relevant physical quantities:
[ E ] = M     L 1     T 2 [ ρ ] = M     L 3 [ σ ] = M     L 1     T 2 [ ε ] = 1 [ Δ ] = L [ v ] = L     T 1 [ a ] = L     T 2 [ t ] = T [ f ] = T 1
According to the dimensional expression of the above physical quantities, a dimensional matrix can be constructed. Each row of the matrix table represents a physical quantity, and the values in the column represent the exponents of mass (M), length (L), and time (T) in the dimension of that physical quantity. a1, a2, a3, …, a9 represent the indices of the physical quantities E, ρ, σ, and f, respectively. Then, the dimension matrix is shown in Table 1.
According to the principle of dimensional equilibrium, the following equation can be obtained, ensuring that the dimensions of each physical quantity are balanced over the fundamental physical quantities (M, L, and T).
For the mass dimension, there is the following equation:
M : a 1 + a 2 + a 3 = 0
For the length dimension, there is
L : a 1 3 a 2 a 3 + a 5 + a 6 + a 7 = 0
For the time dimension, there is
T : 2 a 1 2 a 3 a 6 2 a 7 + a 8 a 9 = 0
Given that the number of equations is insufficient to match the number of variables, a direct solution for all unknowns is unattainable. Consequently, it becomes necessary to designate certain variables as free parameters and express the remaining variables as functions of these chosen parameters. In this study, we posit that certain quantities are known, and the other variables are subsequently represented in terms of these known quantities. By integrating and manipulating the equations, the following relationship can be derived:
a 1 = a 2 a 3
a 5 = 2 a 2 a 6 a 7
a 9 = 2 a 2 a 6 2 a 7 + a 8
Assuming that there are 6 known quantities, the number of similarity criteria is 6. a 2 ,   a 3 ,   a 4 ,   a 6 ,   a 7 ,   a 8 is set to 6 sets of parameter values respectively, that is,
  • when a 2 = 1 , a 3 = a 4 = a 6 = a 7 = a 8 = 0 , then a 1 = 1 , a 5 = 2 , a 9 = 2 ;
  • when a 3 = 1 , a 2 = a 4 = a 6 = a 7 = a 8   = 0 , then a 1 = 1 , a 5 = 0 , a 9 = 0 ;
  • when a 4 = 1 , a 2 = a 3 = a 6 = a 7 = a 8 = 0 , then a 1 = 0 , a 5 = 0 , a 9 = 0 ;
  • when a 6 = 1 , a 2 = a 3 = a 4 = a 7 = a 8 = 0 , then a 1 = 0 , a 5 = 1 , a 9 = 1 ;
  • when a 7 = 1 , a 2 = a 3 = a 4 = a 6 = a 8 = 0 , then a 1 = 0 , a 5 = 1 , a 9 = 2 ;
  • when a 8 = 1 , a 2 = a 3 = a 4 = a 6 = a 7 = 0 , then a 1 = 0 , a 5 = 0 , a 9 = 1 .
Through the above analysis, the following π matrix shown in Table 2 can be obtained. Each row represents a dimensionless factor, and each column represents a different physical quantity and its corresponding power exponent. The values in the table represent the power of each physical quantity in a dimensionless factor. According to the Buckingham π theorem [24], the number of dimensionless factors is n m = 6 , where n = 9 is the total number of physical quantities, and m = 3 is the number of fundamental quantities. The final 6 similar criteria can be expressed as π 1 = ρ Δ 2 f 2 E , π 2 = σ E , π 3 = ε , π 4 = v Δ f , π 5 = a Δ f 2 , π 6 = t f .
In line with Buckingham’s π theorem [24], to ensure the requisite similarity between the model and the prototype, the following condition must be met:
( π n ) p = ( π n ) m         ( n = 1 , 2 , 3 , , 6 )
where subscript p represents the prototype, and the subscript m represents the model.
In accordance with the principle of similarity constants, the specific similar conditions that this test fulfills, as delineated in Equation (9), can be articulated as follows:
C ρ C Δ 2 C f 2 = C E C σ = C E C ε = 1 C v = C Δ C f C a = C Δ C f 2 C t C f = 1
Considering the engineering scale and laboratory test conditions of this study, due to the limitations of the testing machine and mold size, we chose the smallest possible similarity ratio to ensure the accuracy of the test results. An excessive similarity ratio may lead to boundary effects and size effects and affect stress distribution and deformation behavior; this can cause the failure mode to be inconsistent with the prototype, affecting the reliability of the result. The size similarity ratio between the prototype and the model, C L , was finally determined to be 20, the mass density similarity ratio is C ρ = 1 , and the elastic modulus similarity ratio is C E = 1 . Finally, the similarity relationship between the engineering prototype and the indoor similar model can be determined as shown in the following table. Table 3 lists the similarity relationship between the engineering prototype and the indoor similar model and lists each physical quantity and its corresponding similarity ratio. The similarity ratio refers to the proportional relationship between the model and the prototype in the physical quantity. Through this similarity relationship, the physical behavior of the prototype can be simulated in a scaled-down model, thus predicting the performance of the prototype.

2.2. Test Equipment

During the similar model scaling tests conducted in the shield tunneling chamber, the primary components utilized are the loading equipment system, sample molds, and monitoring equipment. The loading equipment system is a comprehensive setup that encompasses a loading frame, a sophisticated control system, an actuating system, and a data-monitoring system. These elements work in tandem to provide precise control and data collection throughout the testing process.
The sample molds play a crucial role in the preparation of scaled models. They consist of a model box specifically designed for crafting scaled-down samples that mimic the actual tunnel environment. Additionally, a tunnel model is included to simulate the shield driving and lining processes, thereby replicating the conditions encountered during real-world tunnel construction.
The data-monitoring system is an integral part of the testing setup. It is tasked with diligently monitoring the stress changes and distribution patterns in the strata located above the tunnel face, particularly in the area directly ahead of the shield tunneling process. Furthermore, this system also tracks the surface deformation processes occurring in the strata on the sides of the scaled test model. Through this comprehensive monitoring, valuable insights into the mechanical behavior of the tunnel and surrounding strata are obtained, facilitating a deeper understanding of the tunneling dynamics. The details are as follows:
(1)
Loading device
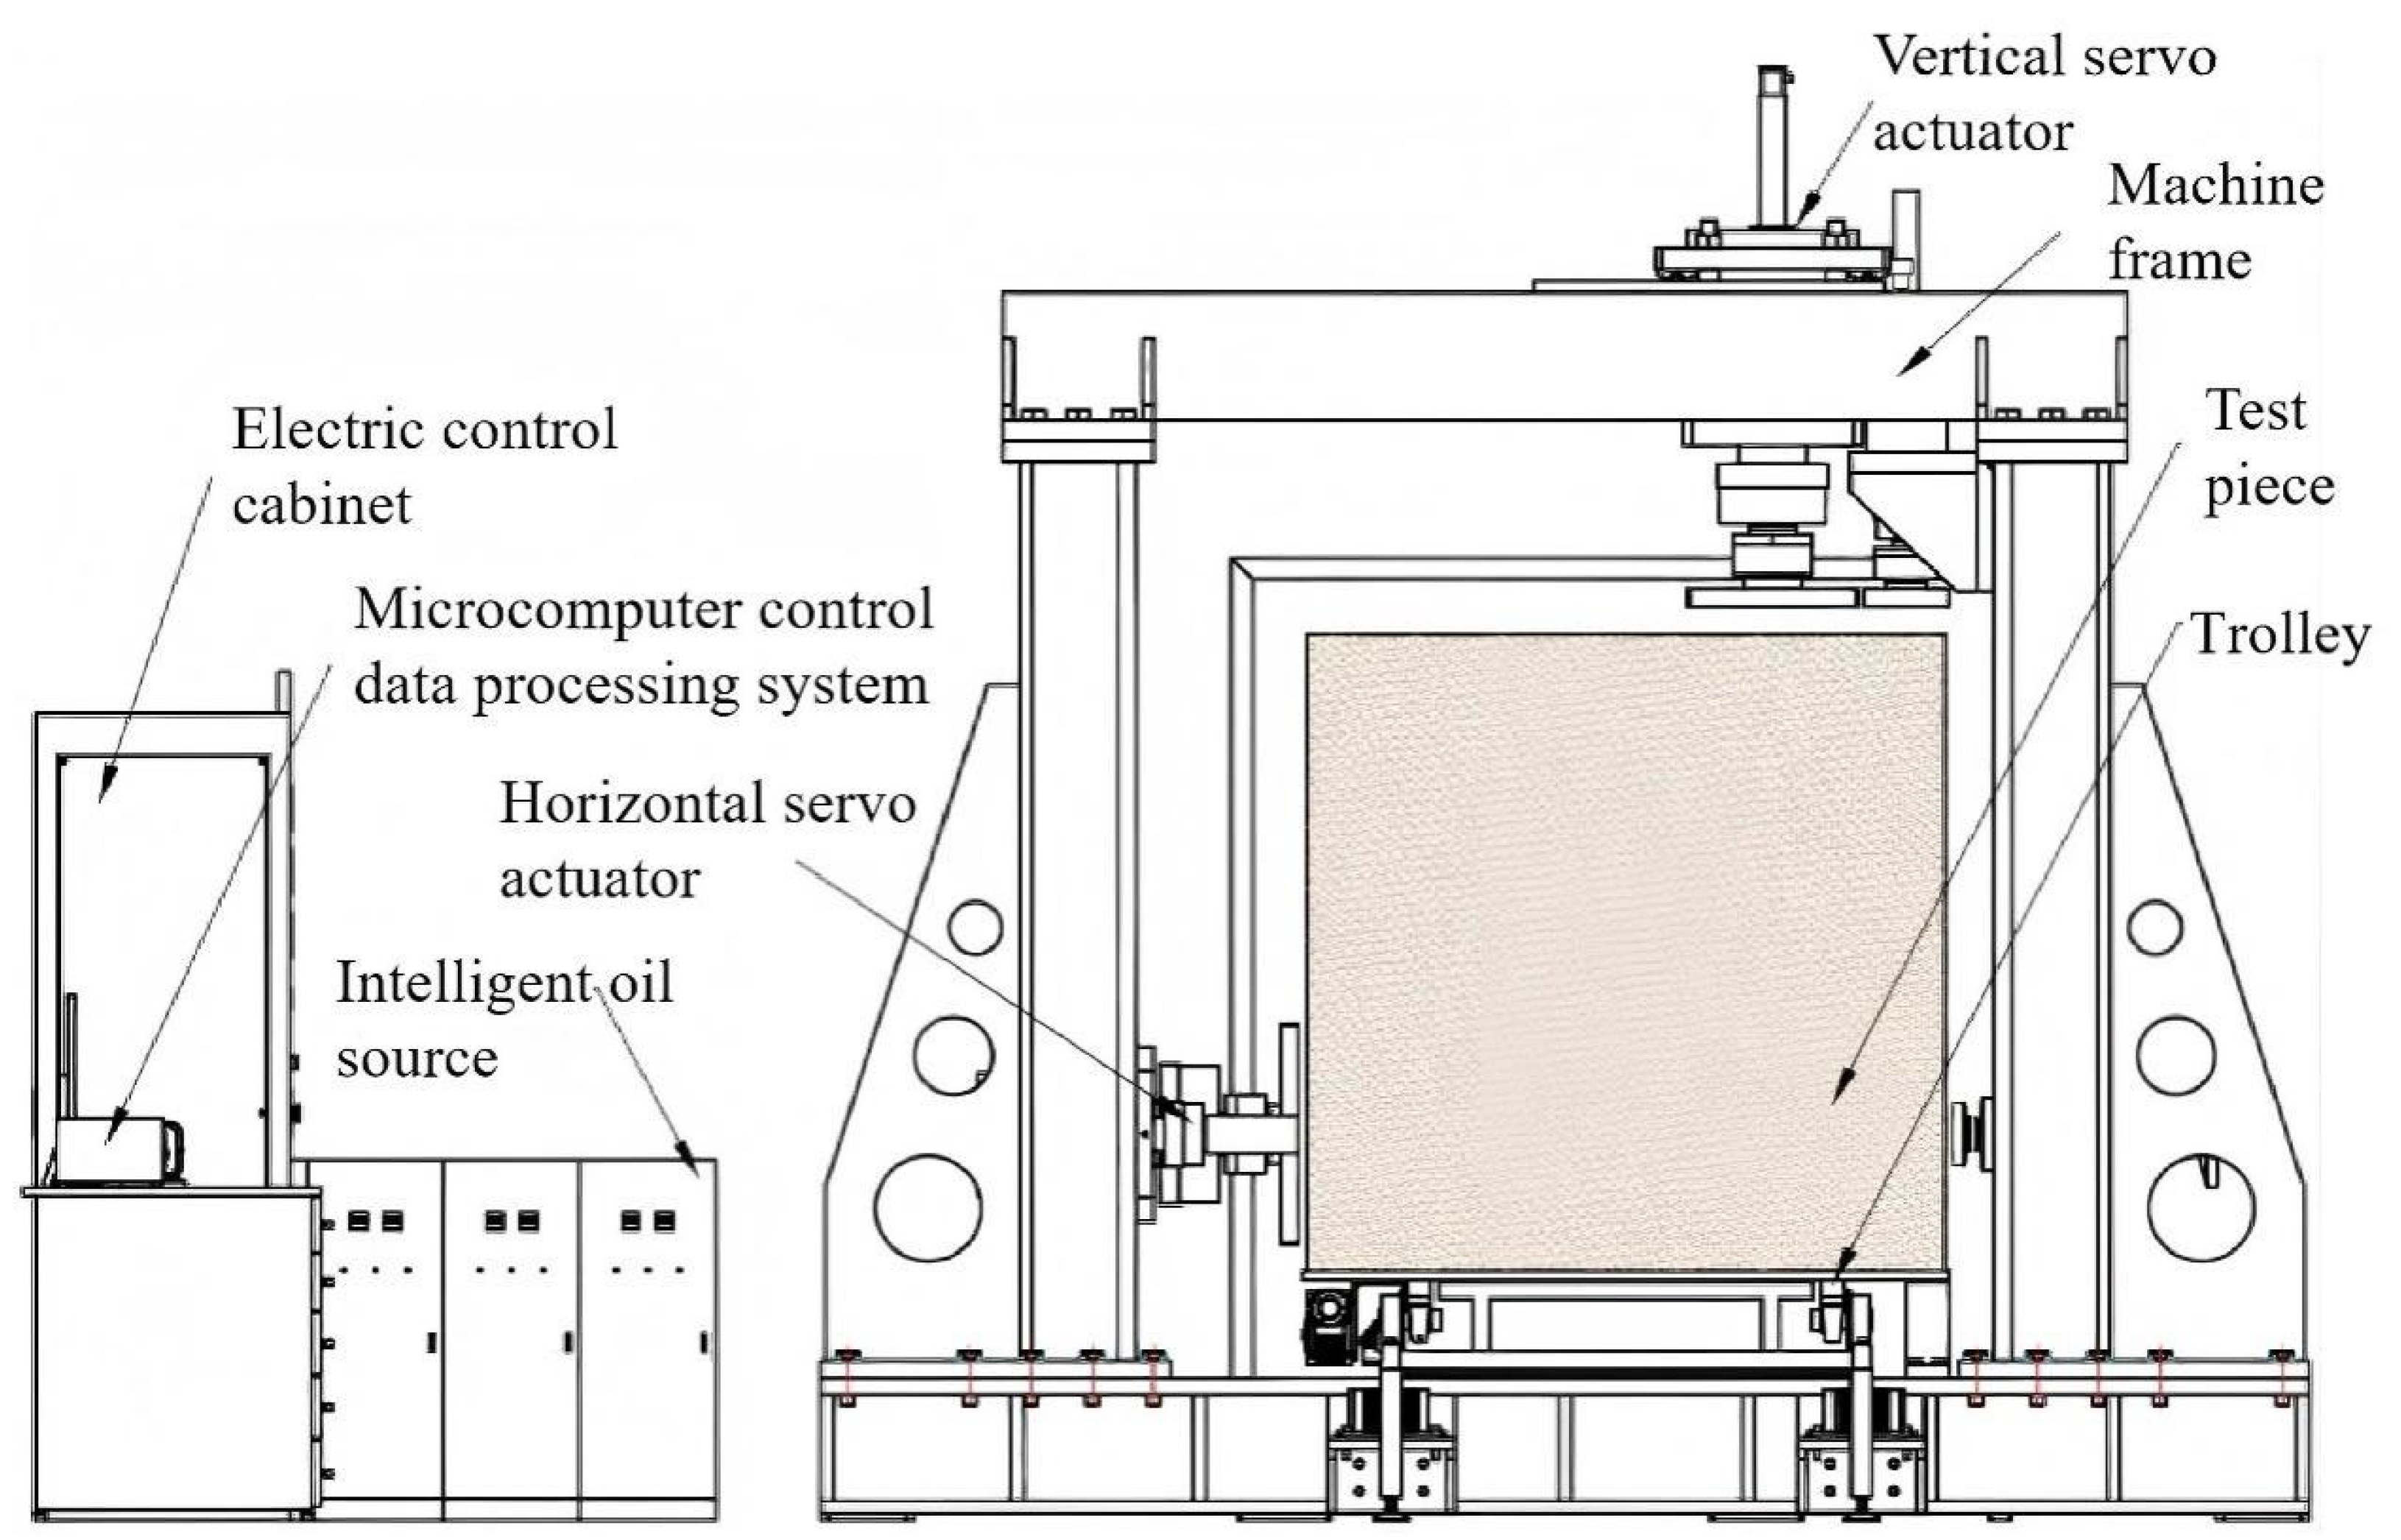
The testing apparatus employed is a large-scale dynamic and static coupling loading system designed for assessing slope stability. This advanced system comprises several key components: a return reaction frame serving as the main engine, an electro-hydraulic servo loading system, an electrical driving system, a measurement control system, and a computer control and data-processing system.
This integrated system is capable of simultaneously applying dynamic and static loads in both vertical and horizontal directions. This dual-loading capability allows for an in-depth investigation into the mechanical behavior of large-scale soil samples under the complex interplay of dynamic and static forces. A schematic representation of the equipment is presented in Figure 1.
During the testing procedure, the meticulously prepared sample is positioned on a trolley. The electrical driving system then precisely maneuvers the trolley to the optimal loading location. The electro-hydraulic servo loading system takes over, expertly controlling the horizontal and vertical servo actuators to impart predetermined loads onto the sample. Throughout the test, the measurement control system, in conjunction with the computer control and data-processing system, diligently records and stores the horizontal and vertical displacements of the sample model within the control computer. This comprehensive data capture ensures a thorough analysis of the sample’s response to the applied loads.
The back reaction frame type adopts the form of a reflexive integrated host frame, uses the whole cast frame structure, and forms a closed stress frame. The frame structure is stable and rigid, which can ensure the safety and stability of the test process. The frame size (length × width × height) of the host frame is (2800–3200) × (800–1000) × (2900–3200) mm. The constant loading rate of the test system ranges from 0.5 kN/s to 9.9 kN/s, and the relative error (accuracy) of the indicating value is less than 1.0%. The servo actuator stroke is 0–200 mm, and the output is 0–1000 kN, using a multi-channel closed-loop measurement and control instrument, electro-hydraulic servo valve control channel (force, displacement closed-loop control, 18-bit A/D), displacement sensor (0–200 mm, accuracy not less than 0.05%FS), and load sensor (0–1000 kN, accuracy not less than 0.05%FS).
(2)
Sample mold
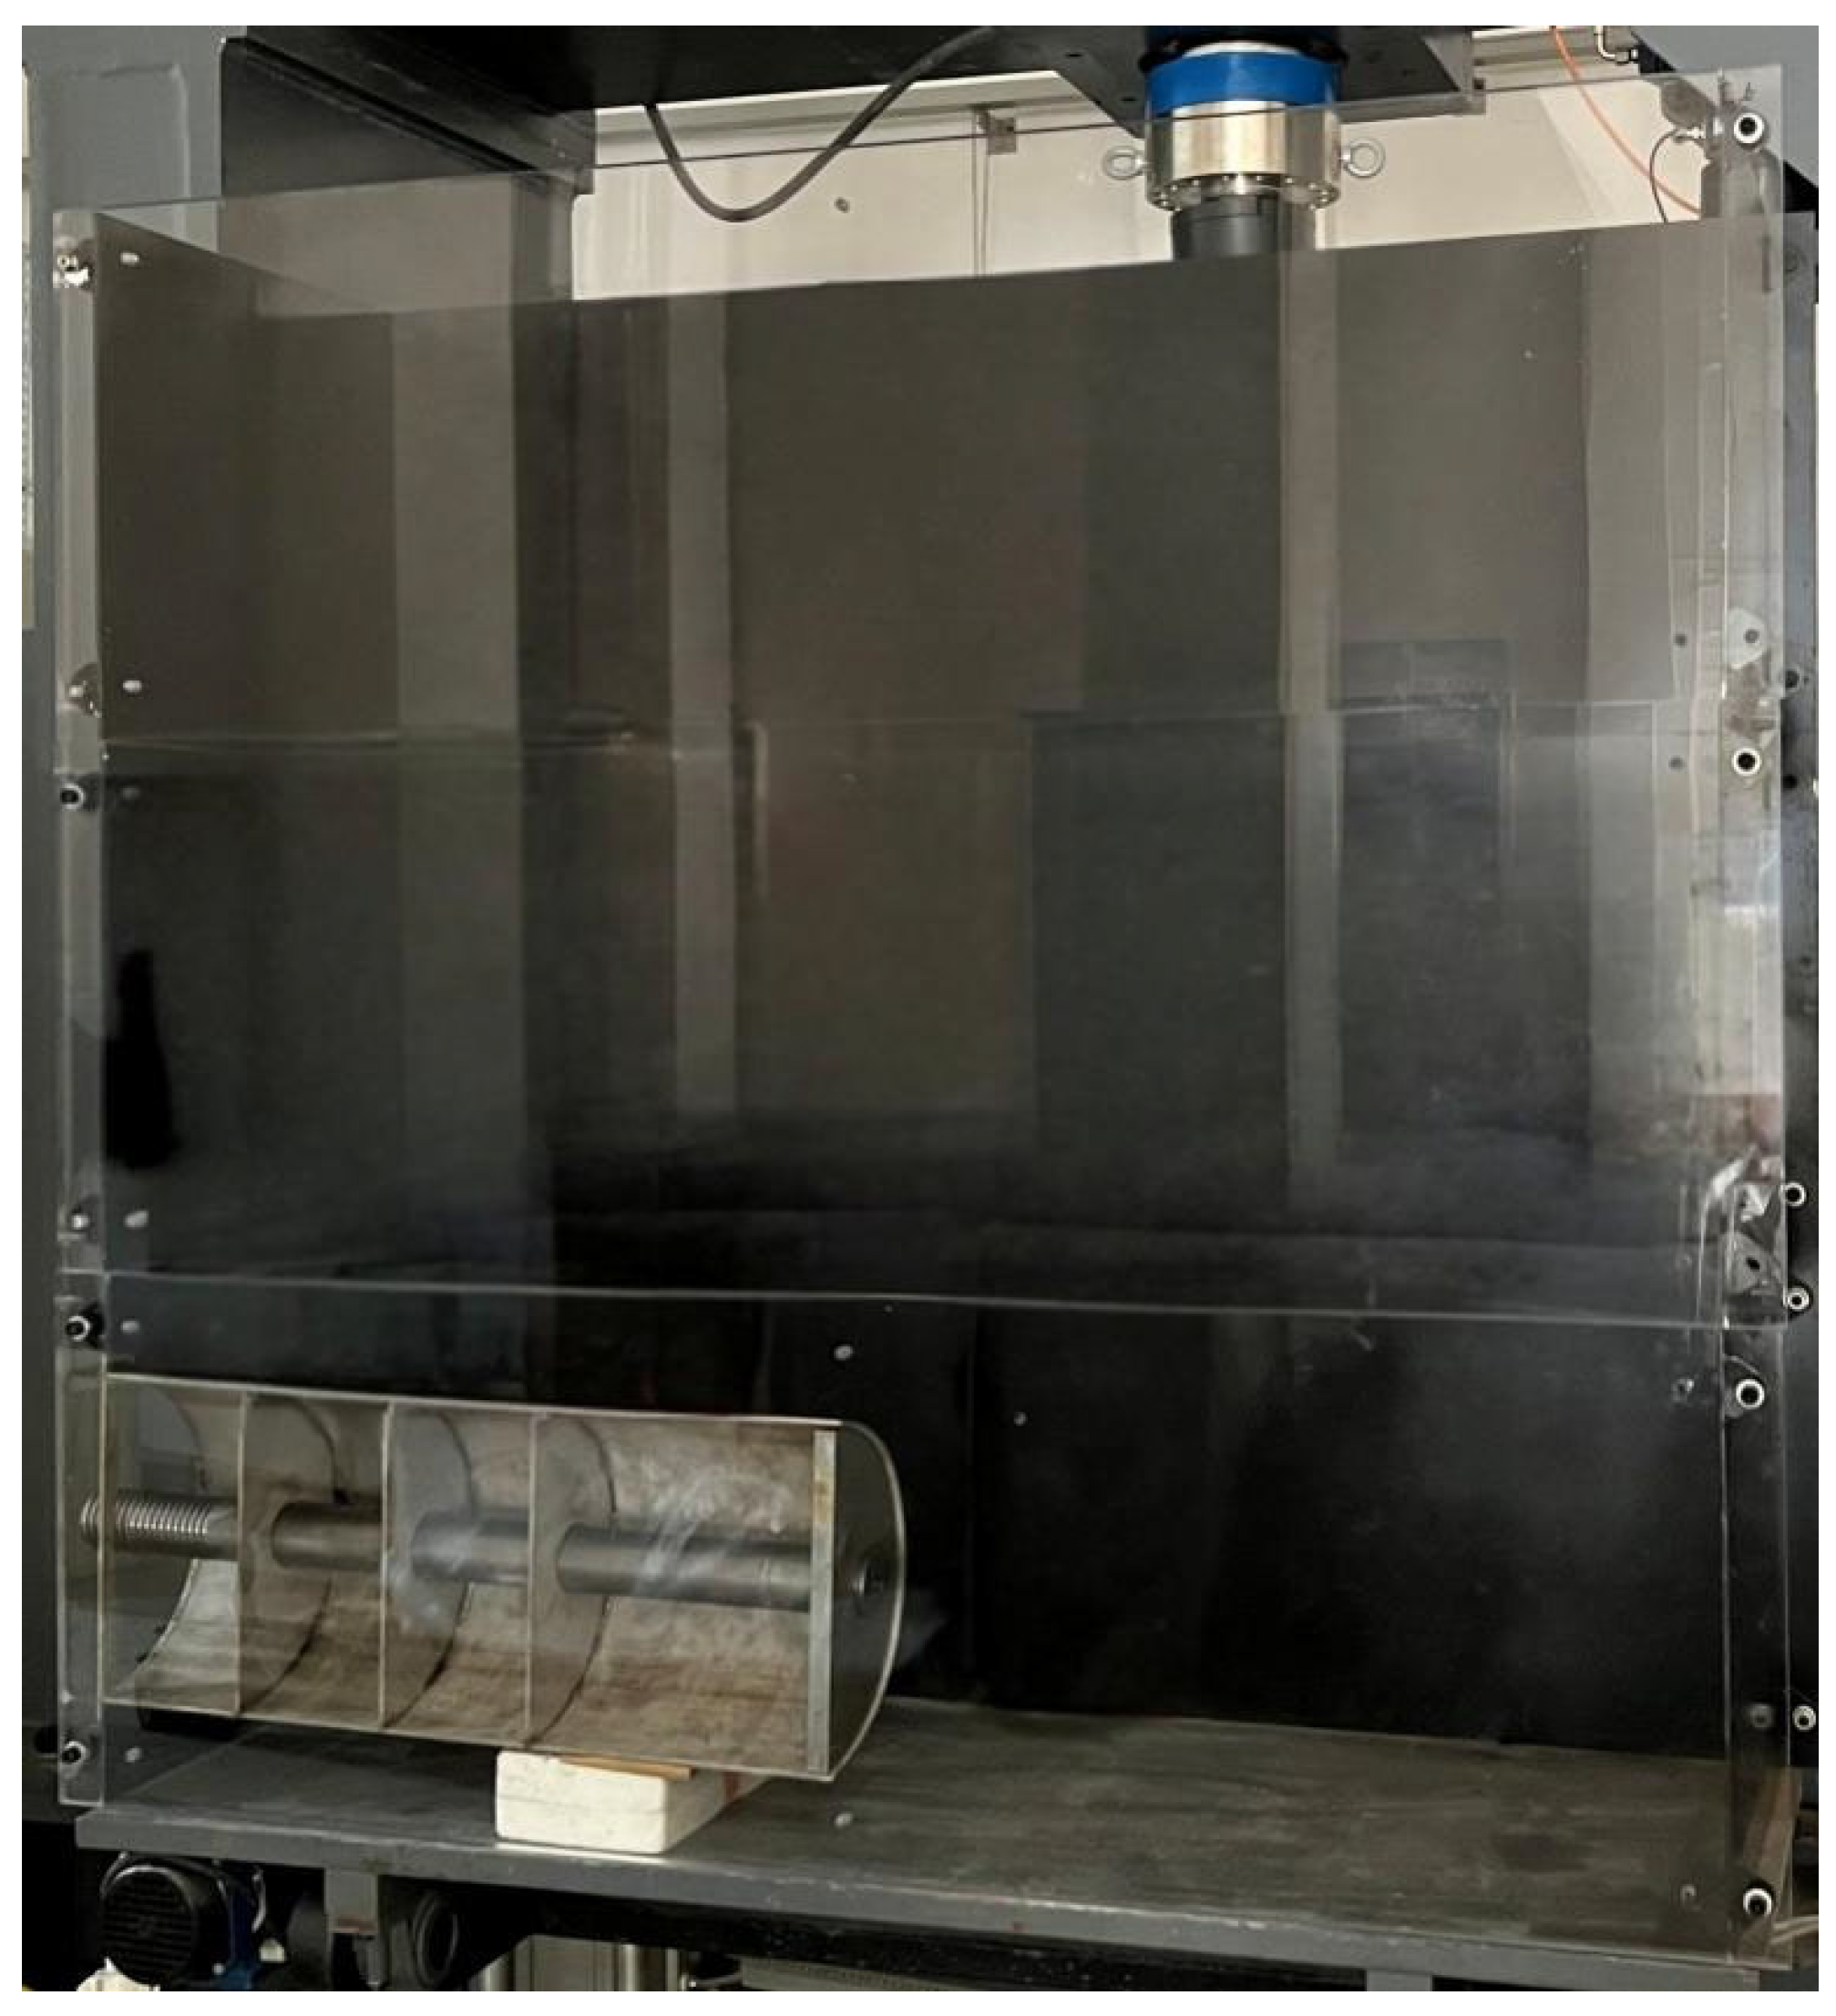
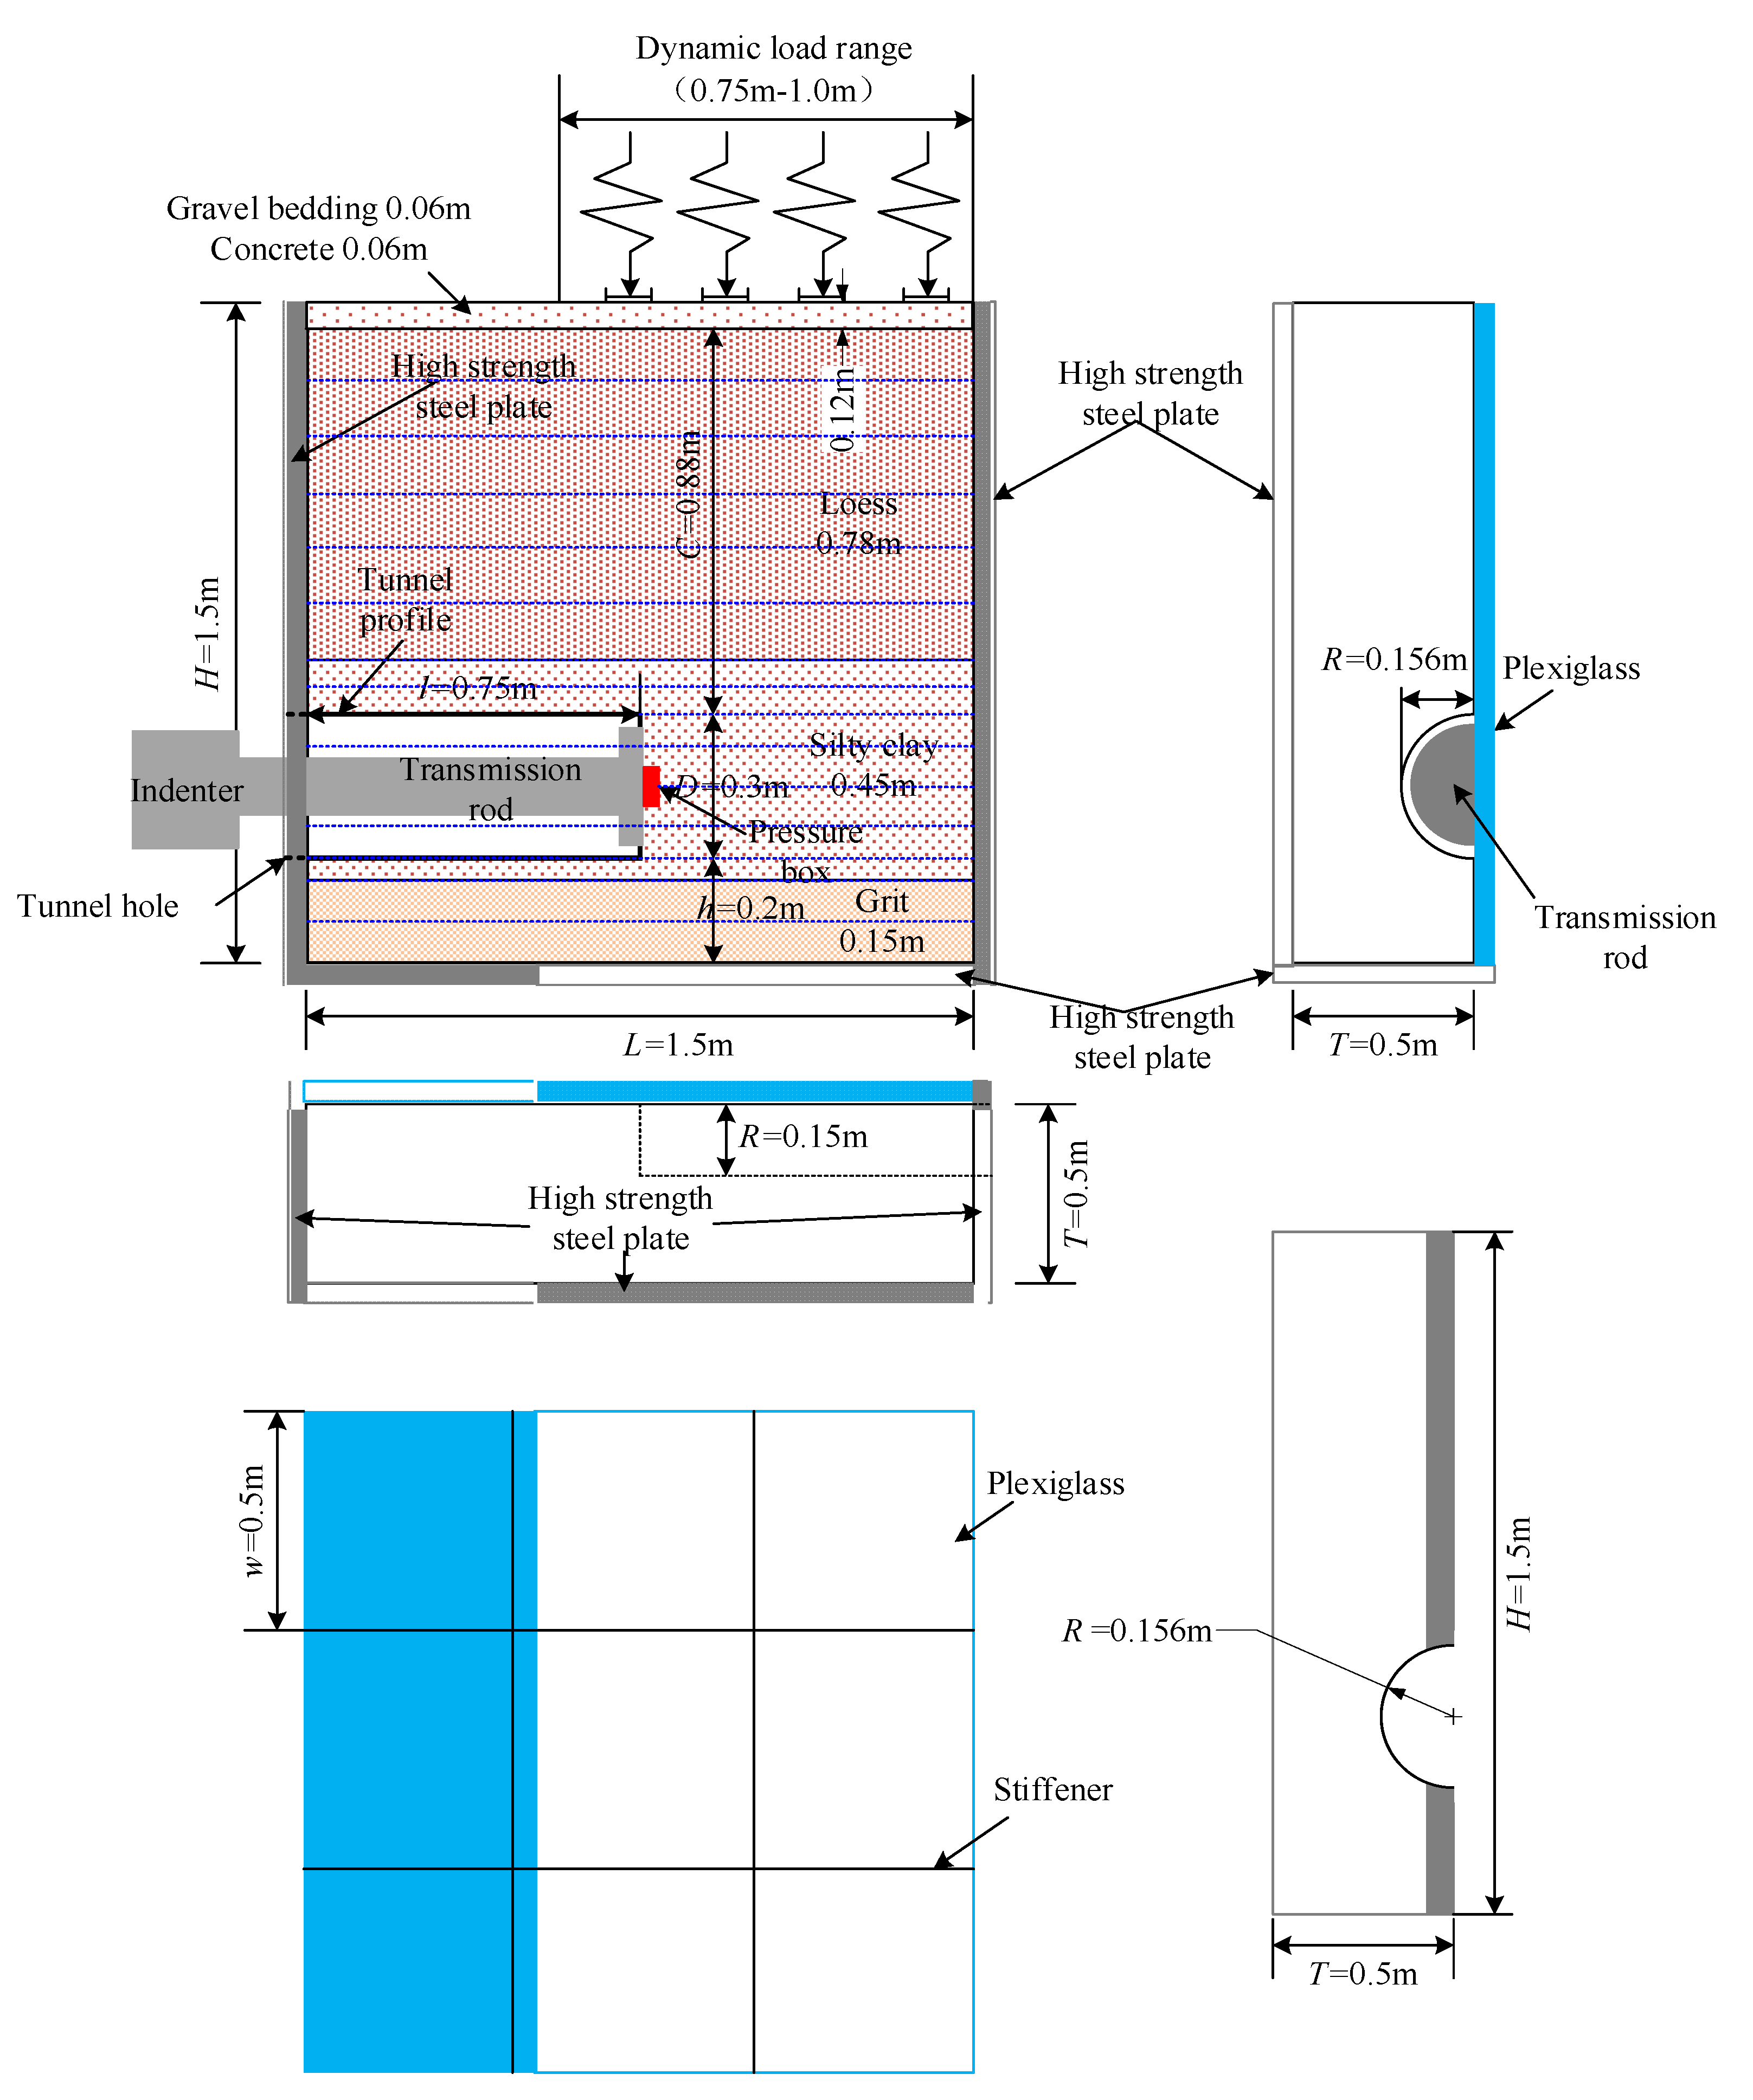
The tunnel is buried at a depth of approximately 20.0 m, with a diameter of 6.0 m. Based on the geometric similarity relationship between the engineering prototype and the indoor similar model, the scaled experimental tunnel has a burial depth of 1.0 m and a diameter of 0.3 m. To minimize the impact of the test model’s boundary conditions on the experimental results and to accommodate the size constraints of the testing equipment, the sample size for the scaled test was determined to be 1.5 m in length, 1.5 m in height, and 0.5 m in thickness. The scaled test sample was created by filling soil into the mold depicted in Figure 2, which has an internal dimension of 1.5 m in length, 1.5 m in height, and 0.5 m in thickness. The tunnel scaling test mold, as illustrated in Figure 3, comprises a tunnel mold and a sample box. The tunnel mold consists of a pressure plate, a force transfer rod, and a supporting structure, while the sample box is made up of a mold enclosure and high-strength plexiglass. Pins and stiffeners are incorporated to ensure that the plexiglass meets the testing requirements. Thanks to the transparency of the plexiglass, the deformation of the tunnel face during the shield propulsion process can be clearly observed. By taking into account the symmetry of the tunnel, this study considers the vertical plane passing through the center of the tunnel as the plane of symmetry. Consequently, only half of the tunnel is selected as the research object for the experimental investigation.
(3)
Rail model
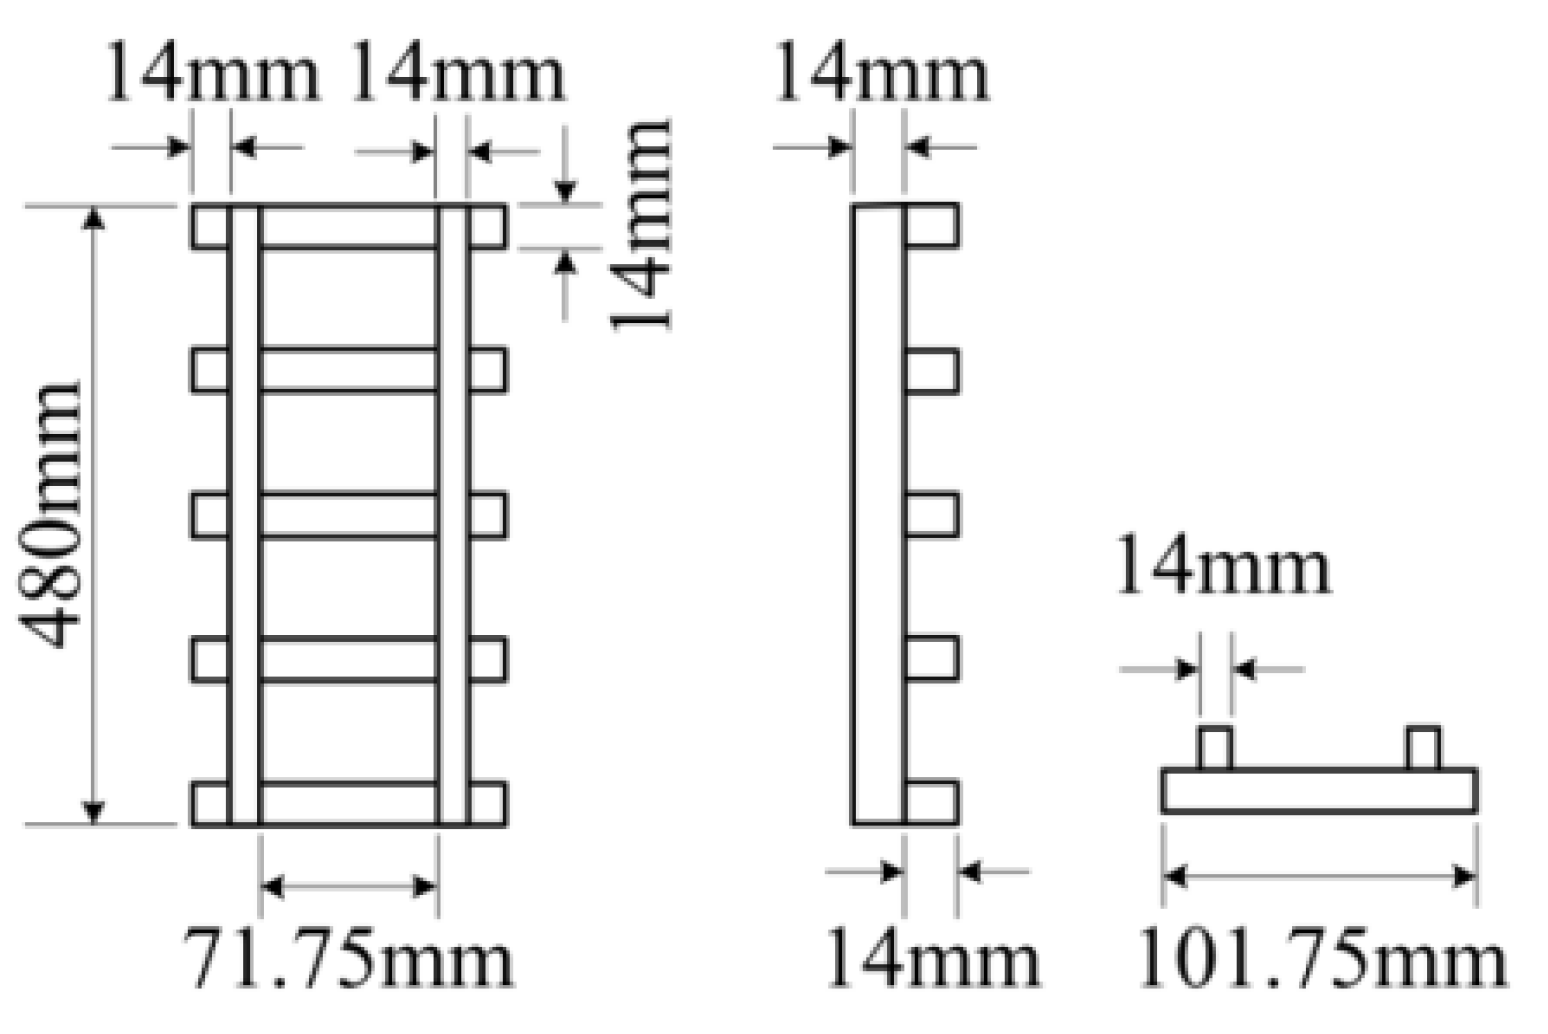
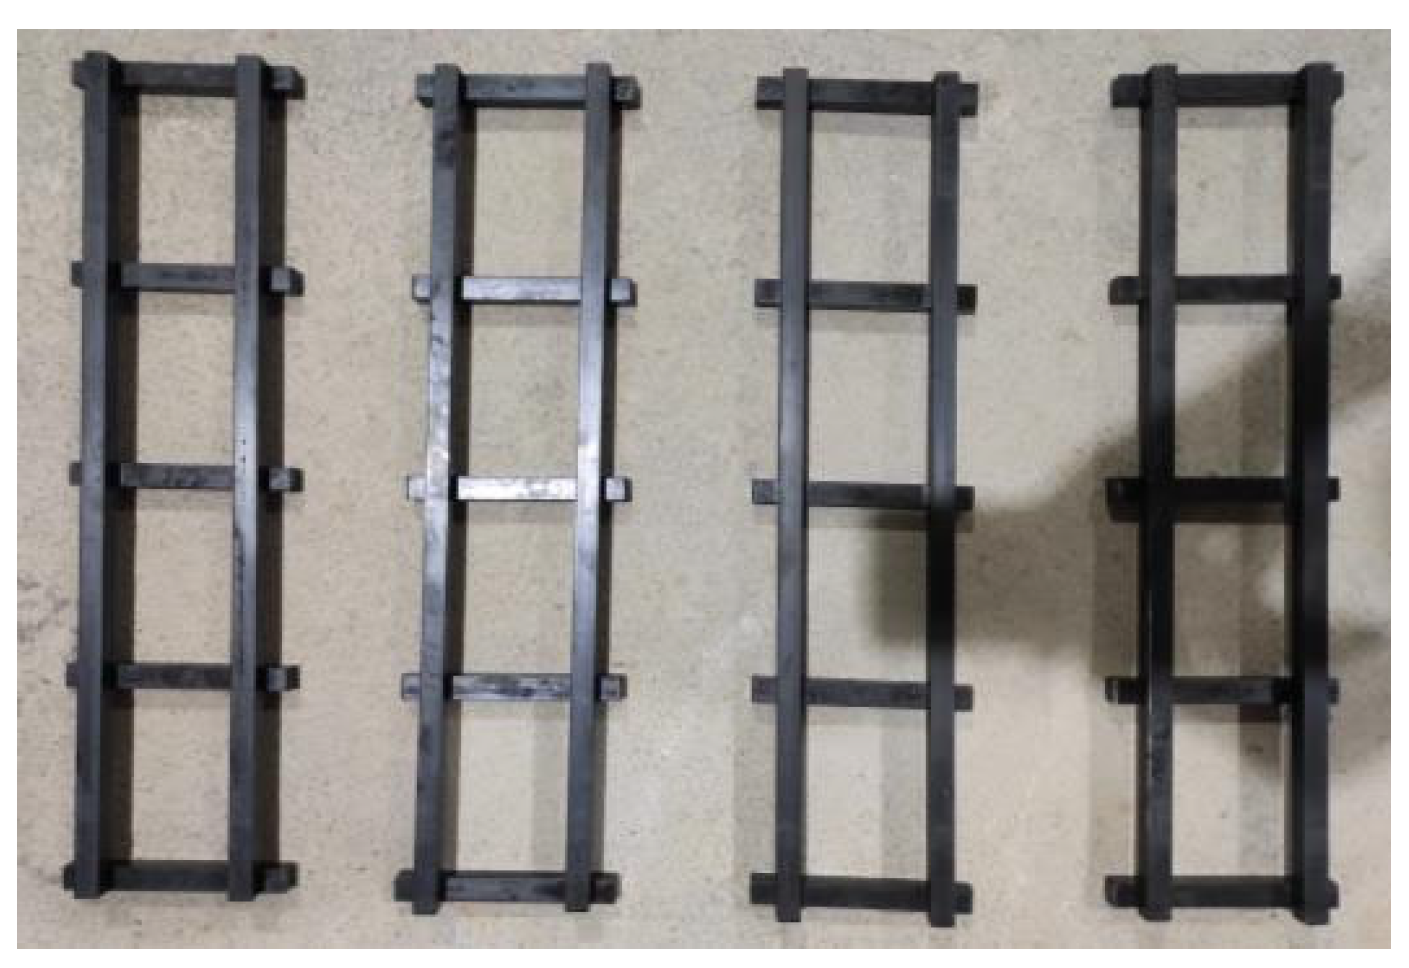
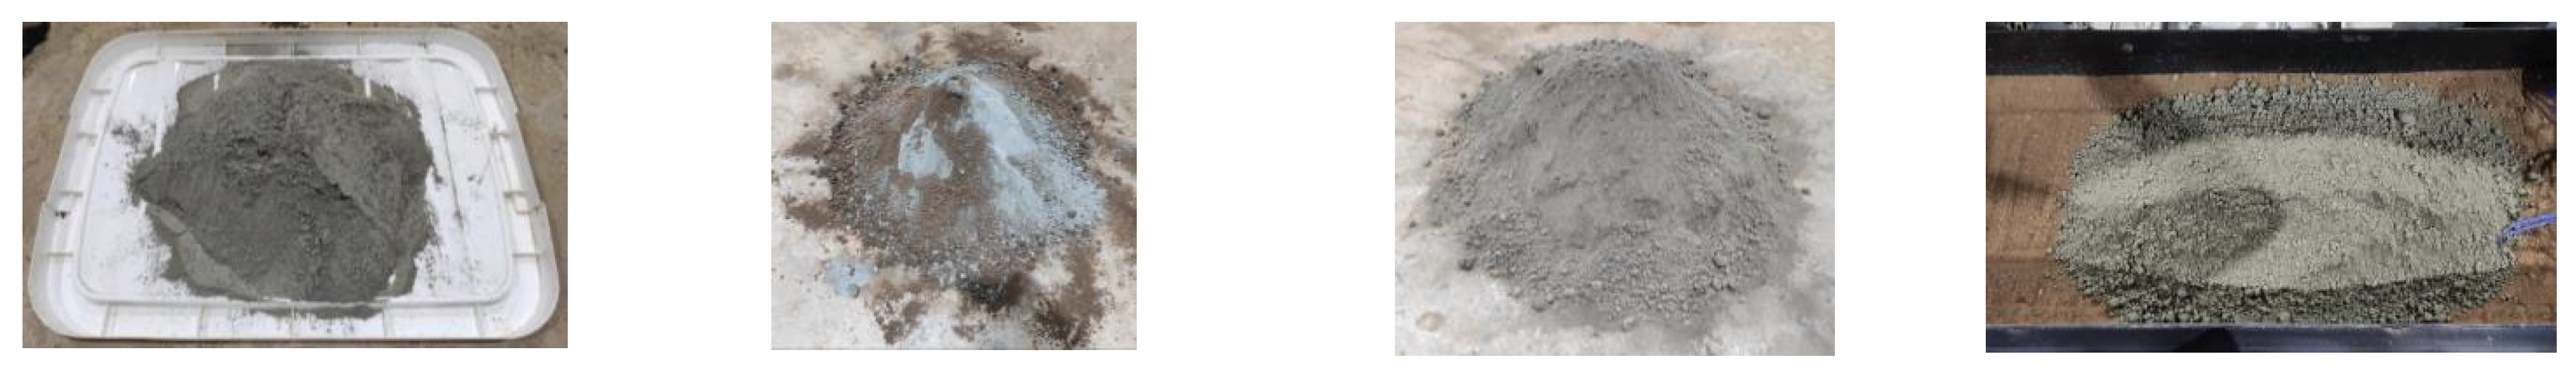
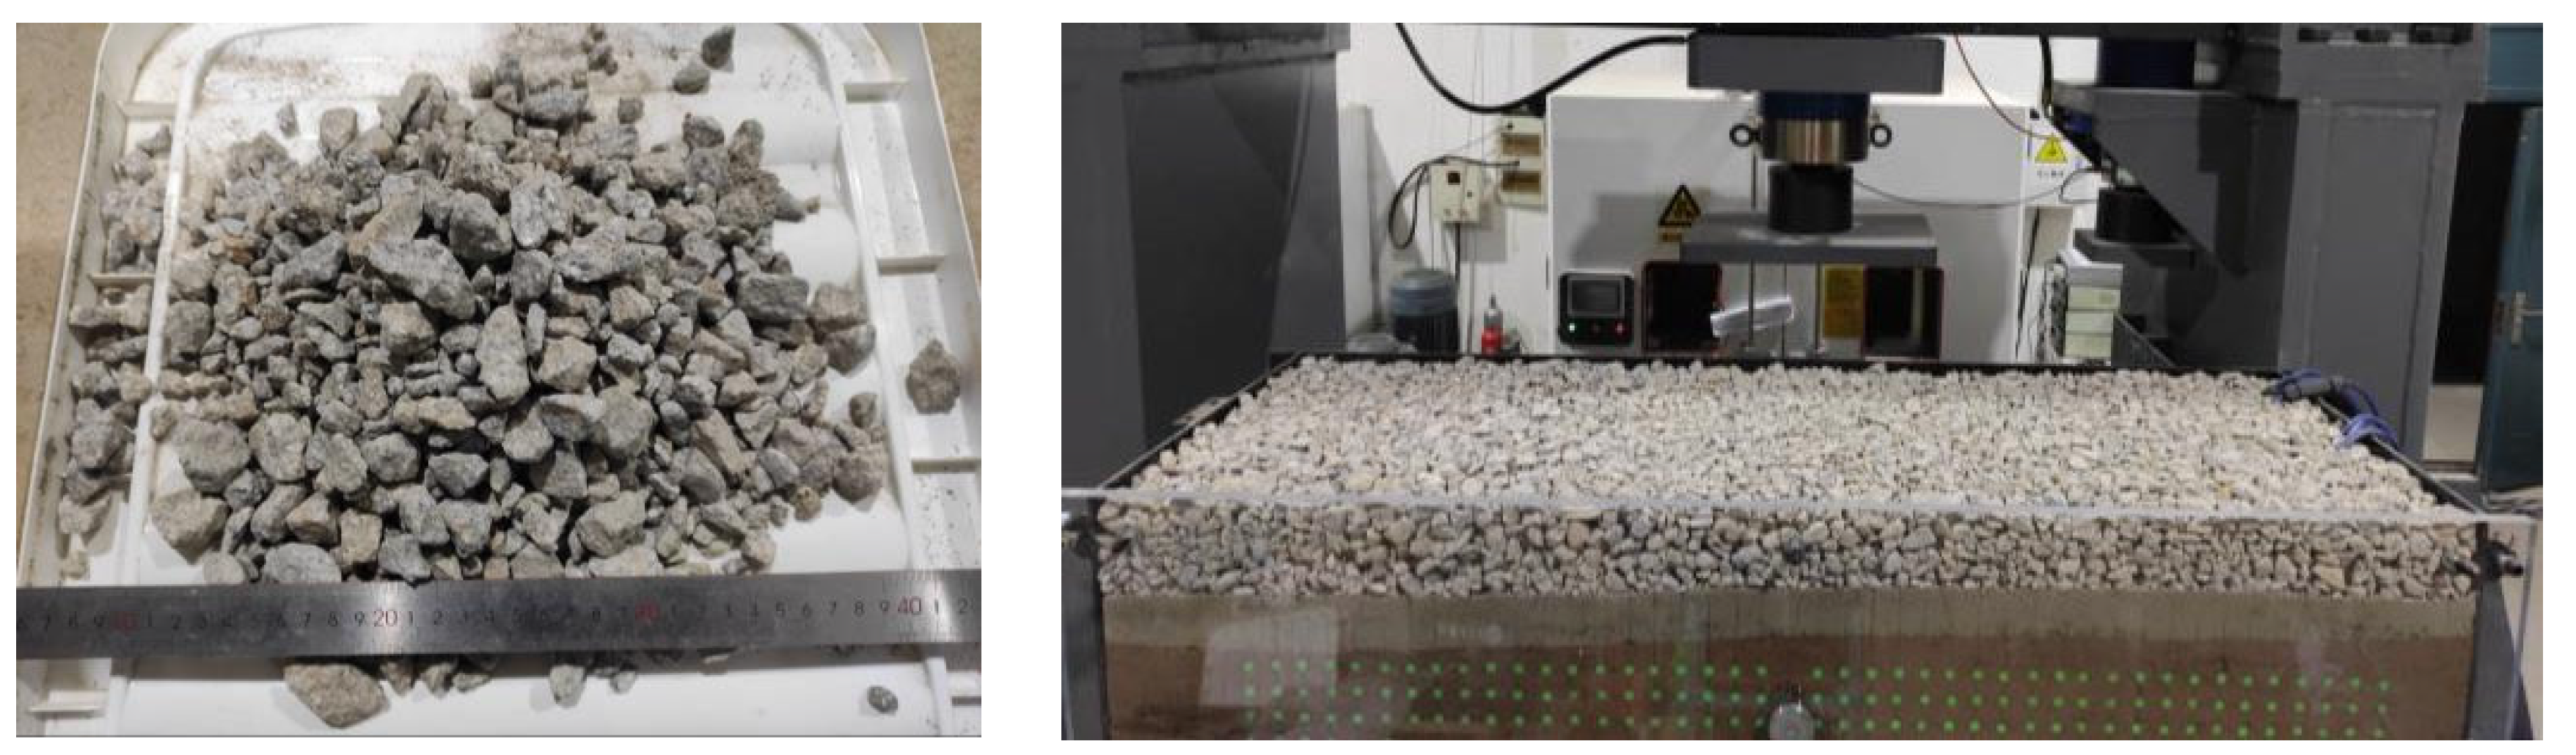
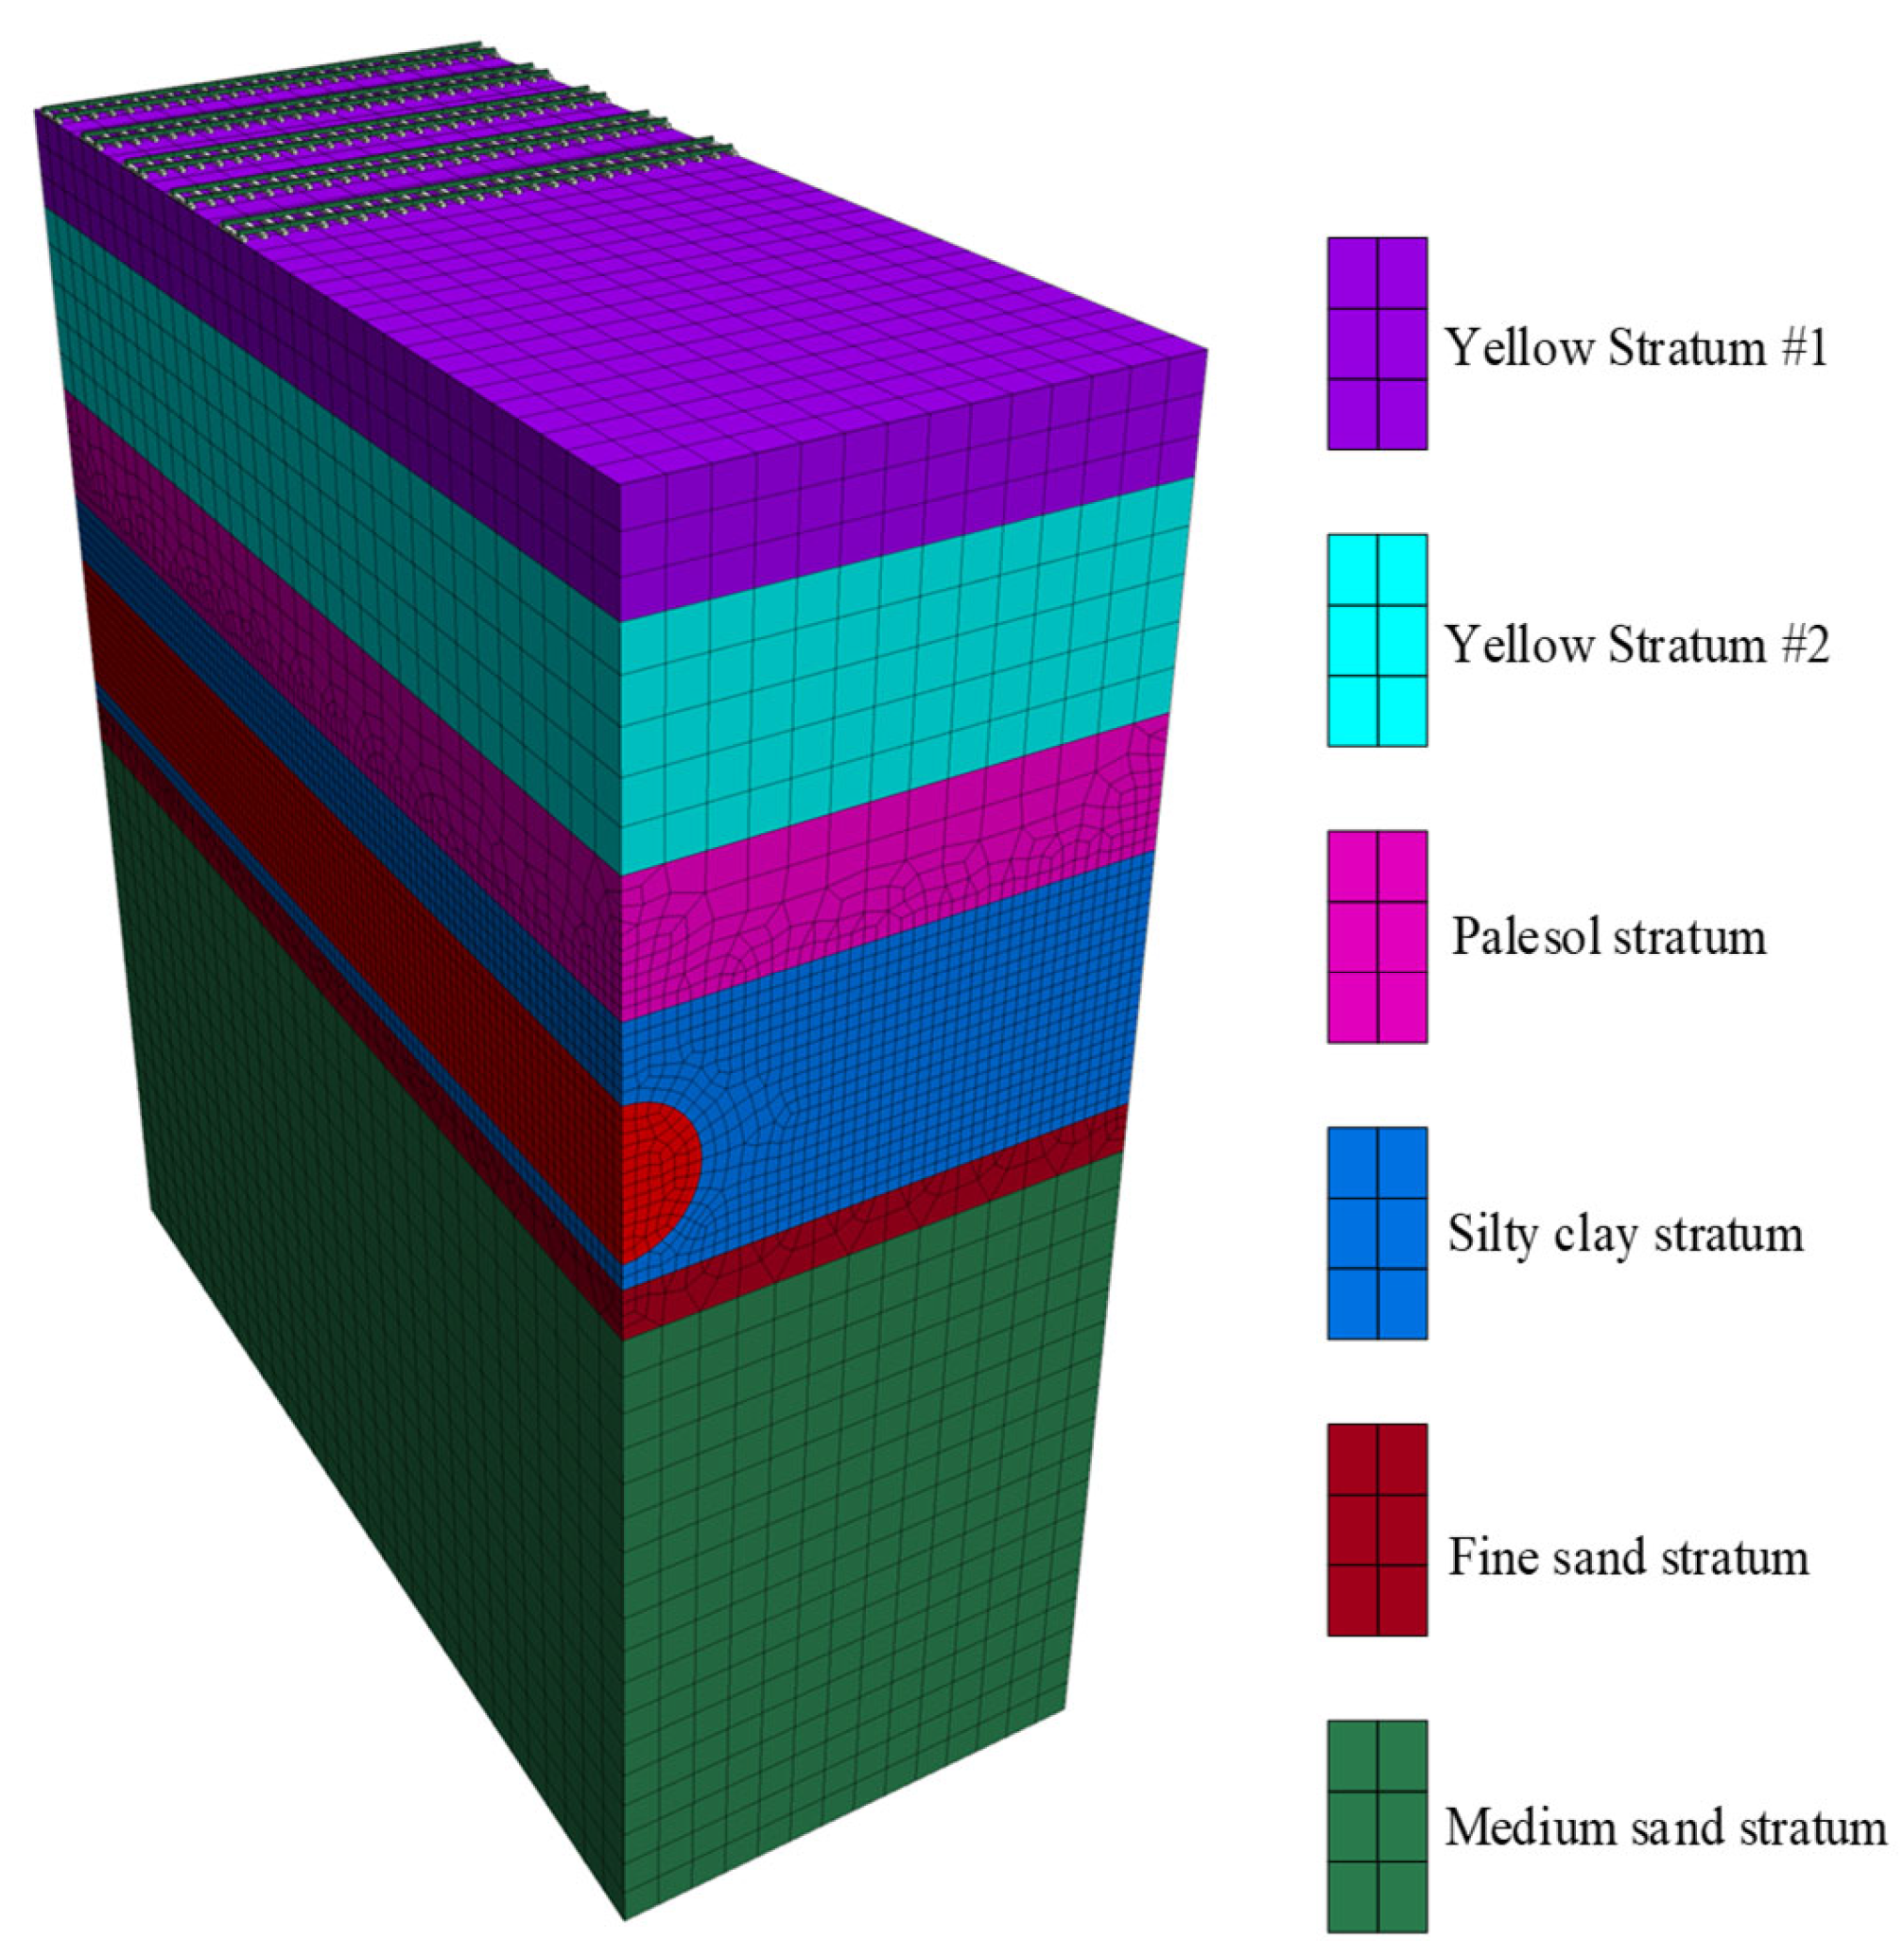
According to engineering practice and the feasibility of the research process, the overlying strata of the tunnel can be simplified into a 0.06 m thick gravel cushion, a 0.06 m thick cement-soil layer, a 0.78 m thick yellow soil layer, a 0.45 m thick silty clay layer, and a 0.15 m thick fine sand layer. In addition, there was Longhai Railway and Xulan high-speed railway on the ground surface. In order to consider the influence of vibration load during train passage on the formation-deformation process of the tunnel face during shield propulsion, a rail model similar to the train track structure was made (as shown in Figure 4 and Figure 5), and the rail model was placed above the similar model of the tunnel. The effect of train vibration load on the overlying strata of the tunnel can be simulated by applying a simplified load to the rail model through the slope stability system.
(4)
Monitoring equipment
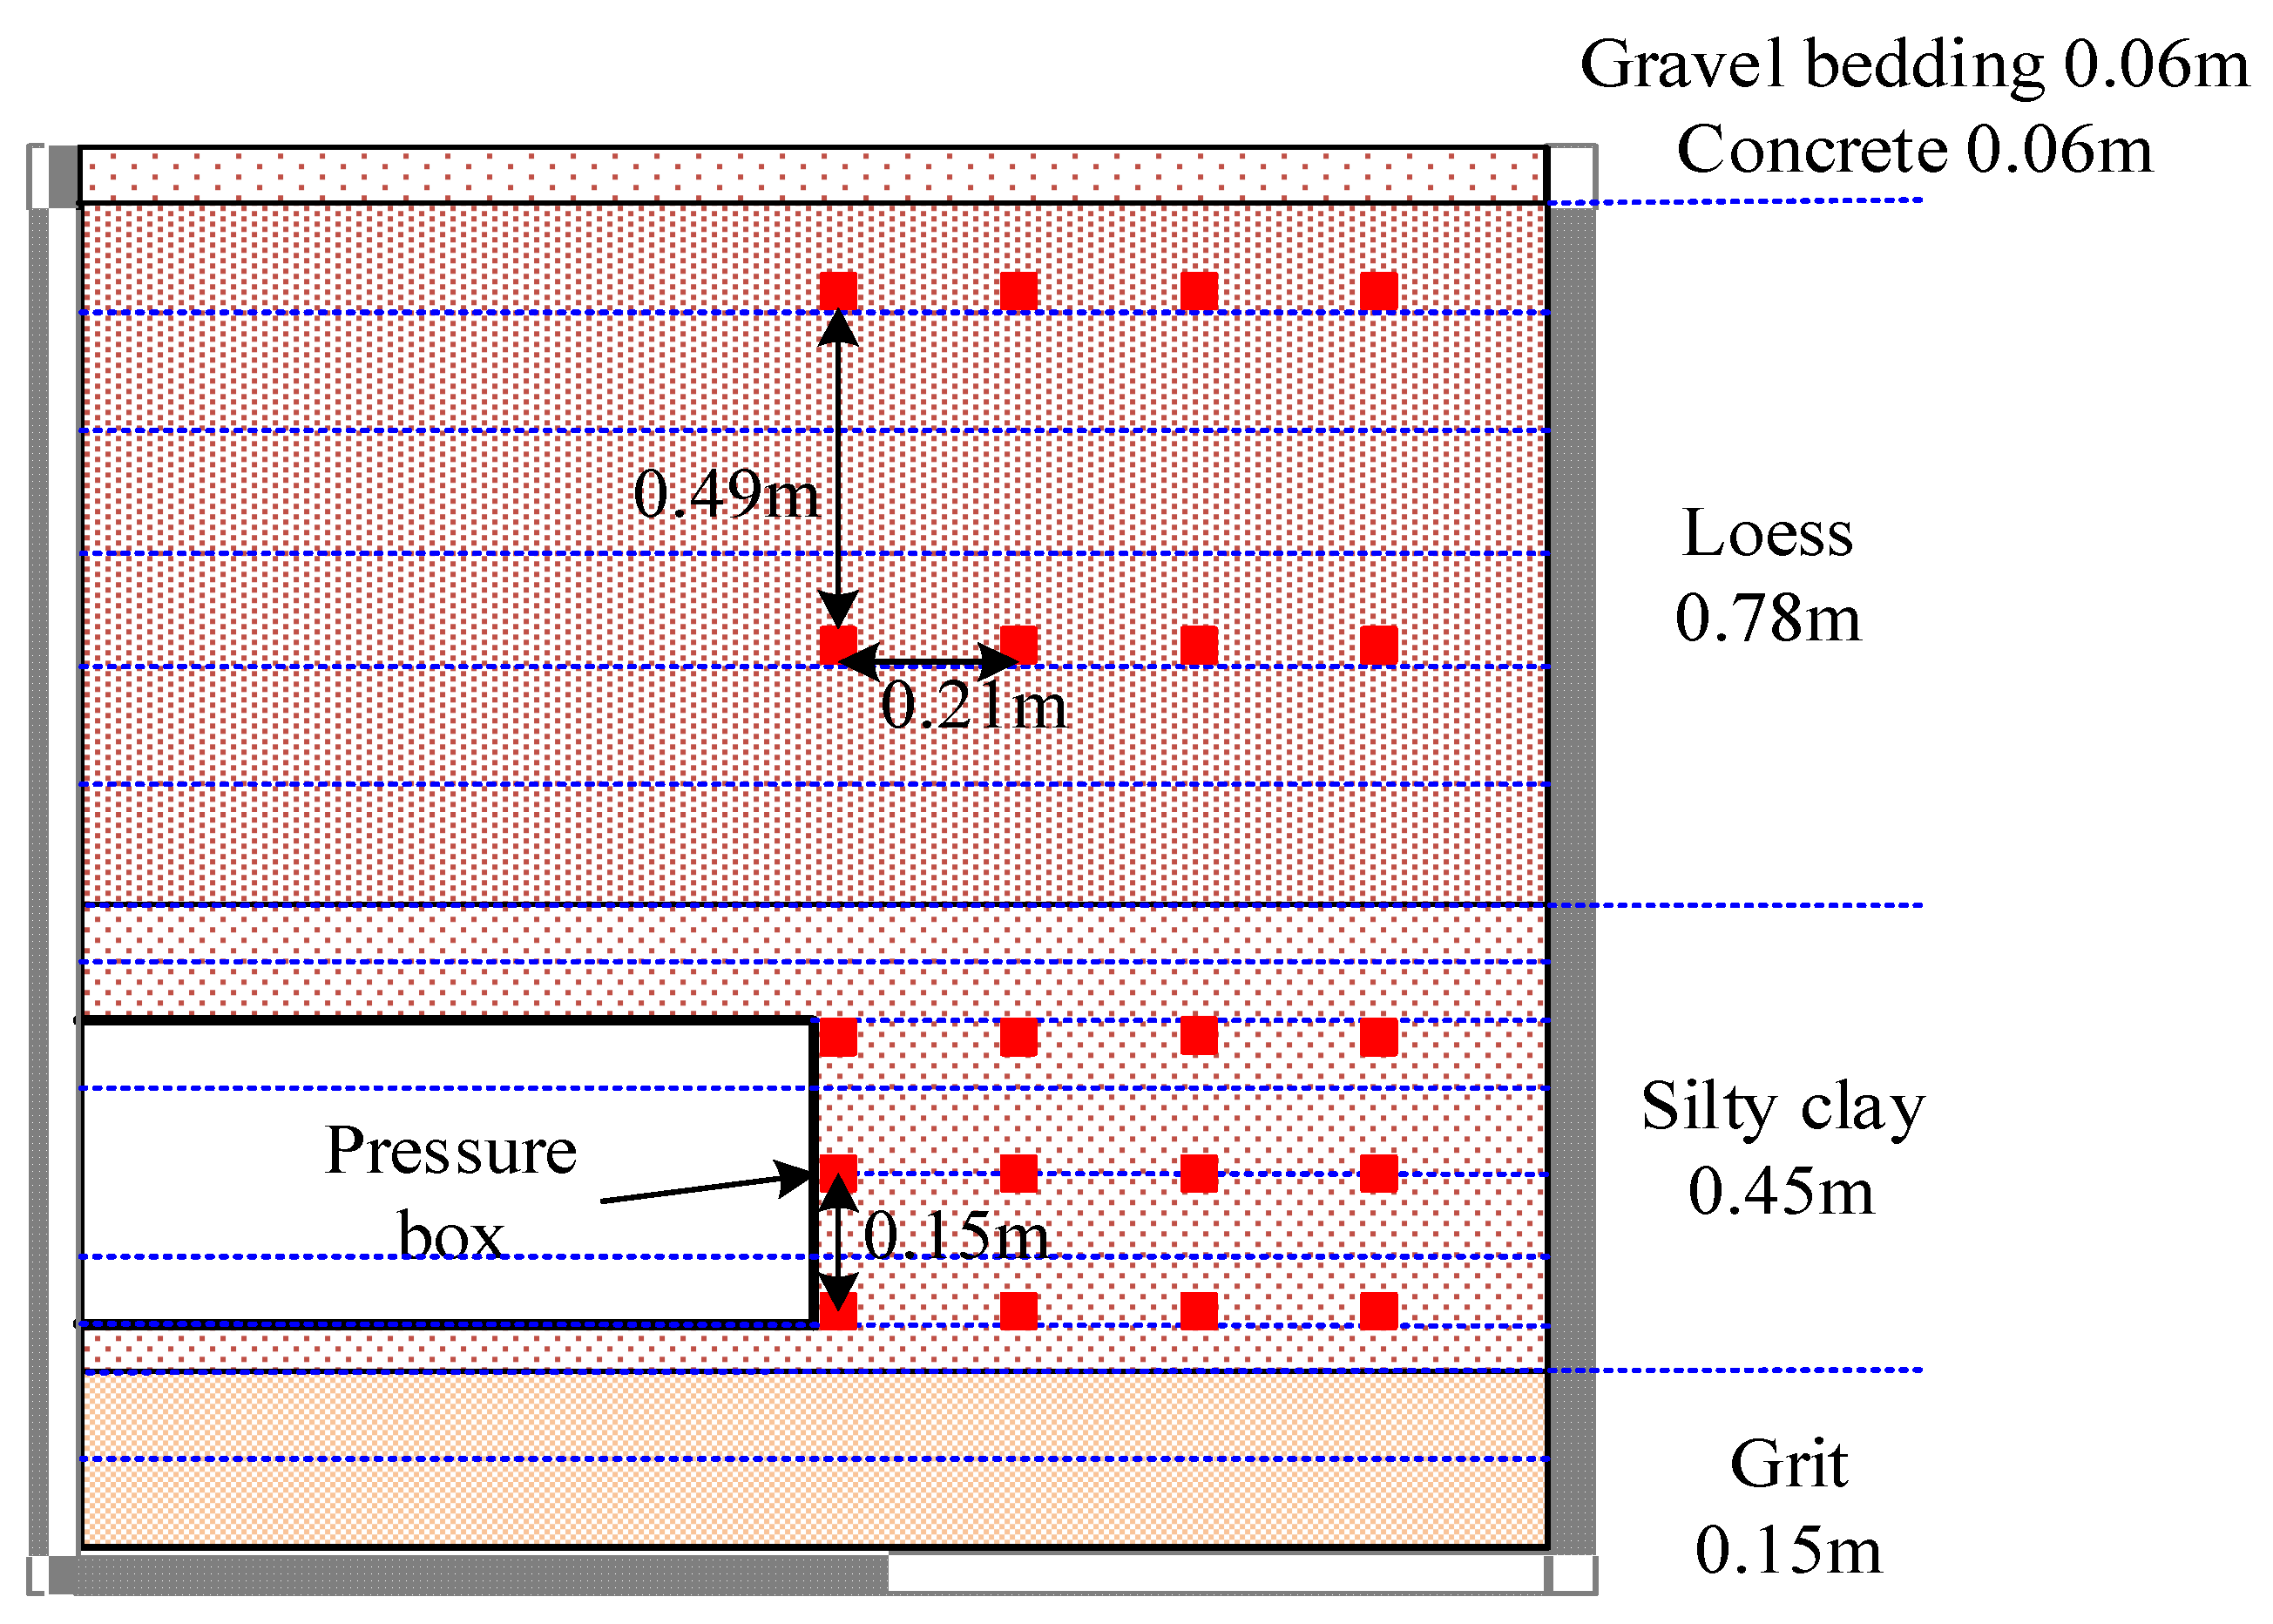
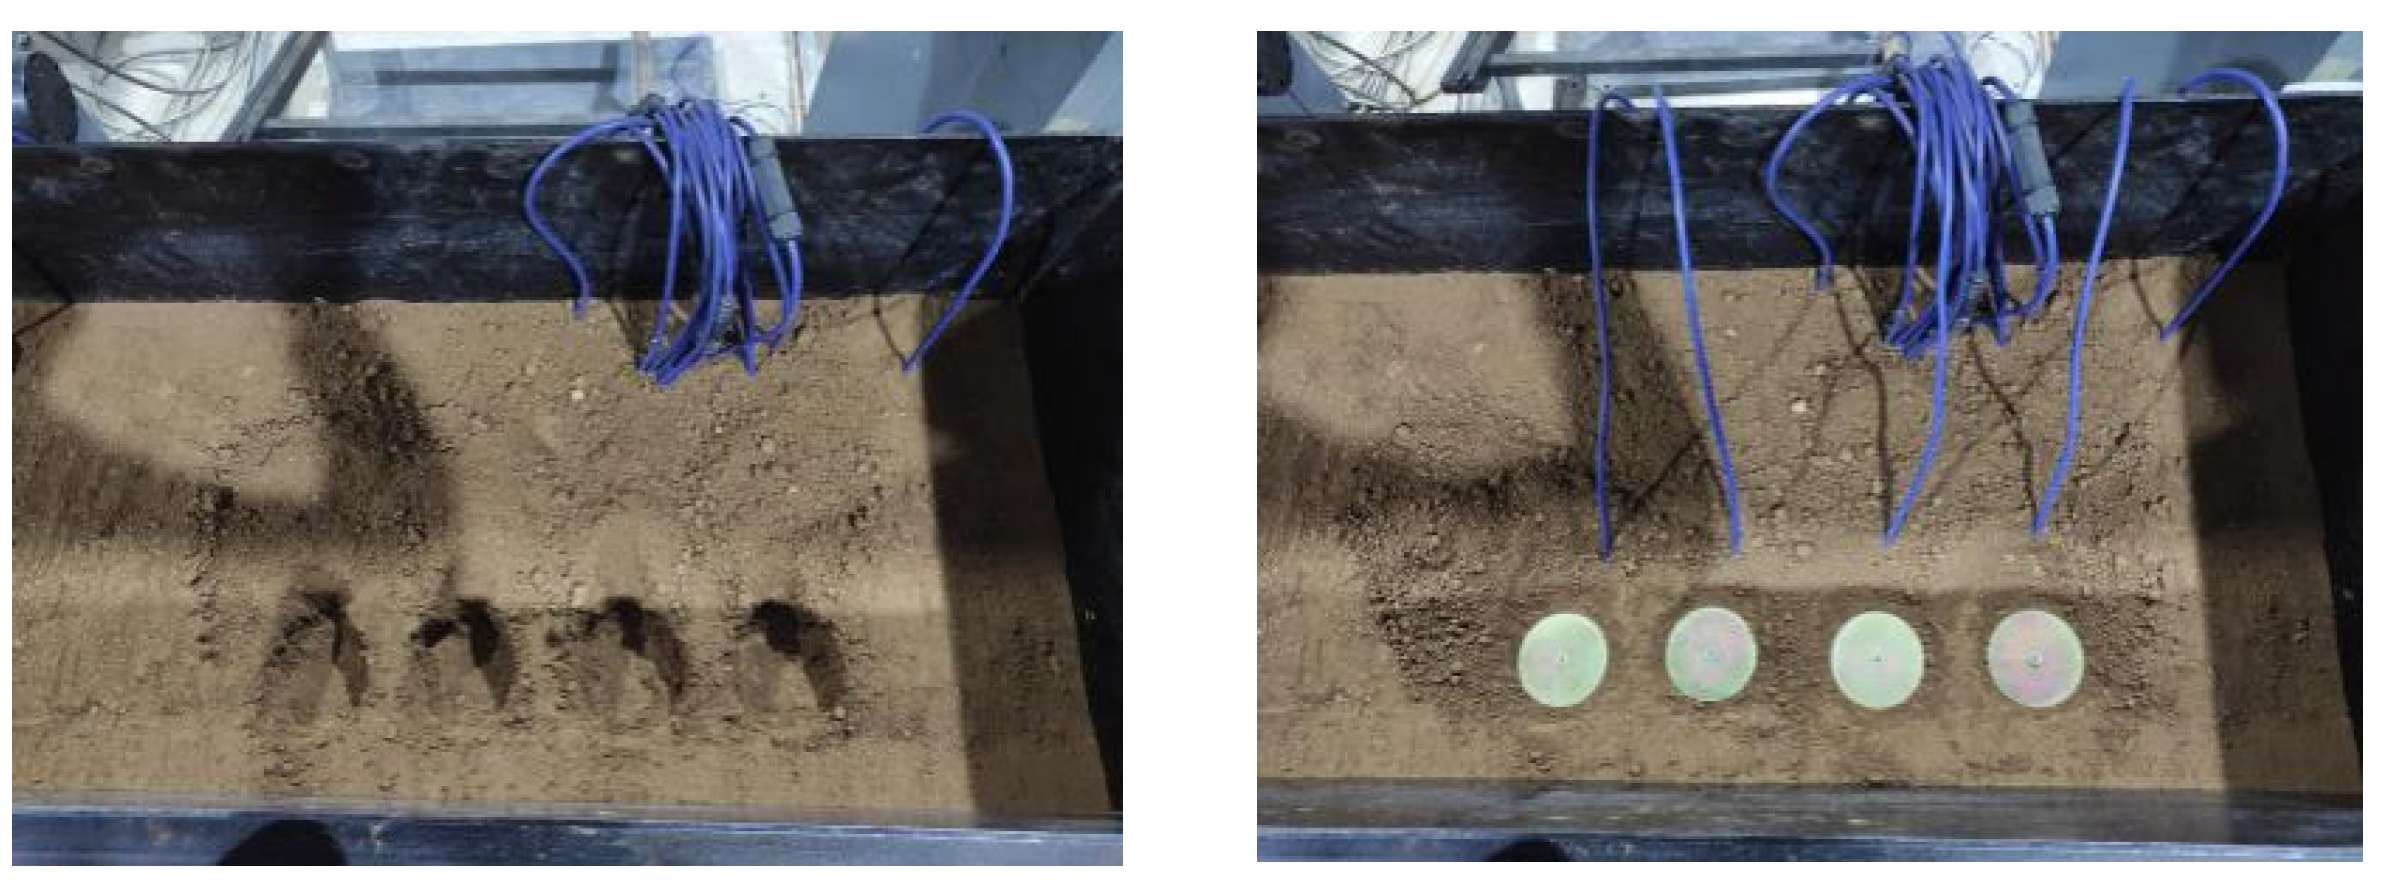
During the scale test of the shield tunnel, the YC-VWE-type vibrating wire earth pressure gauge provided by Changsha Yunchao Information Technology Co., Ltd. (Changsha, China) was used to monitor the pressure change process and the final pressure distribution characteristics in front of the tunnel face and inside the overlying strata. The YC-VWE-type vibrating string earth pressure gauge has a measuring range of 0–3000 kPa and a resolution of ≤0.025%; it is composed of a backplane, an inductor, an observation cable, a vibrating wire, and an exciting electromagnetic coil. It is suitable for long-term monitoring of compressive stress inside geotechnical materials and is an effective piece of monitoring equipment to grasp the changes in soil pressure inside geotechnical materials in real time, which can meet the needs of this test. The layout of the earth pressure box in the mold is shown in Figure 6, which mainly focuses on the shield direction of the tunnel face and the soil layer above in order to monitor the change in soil pressure, which is mainly affected during the test.
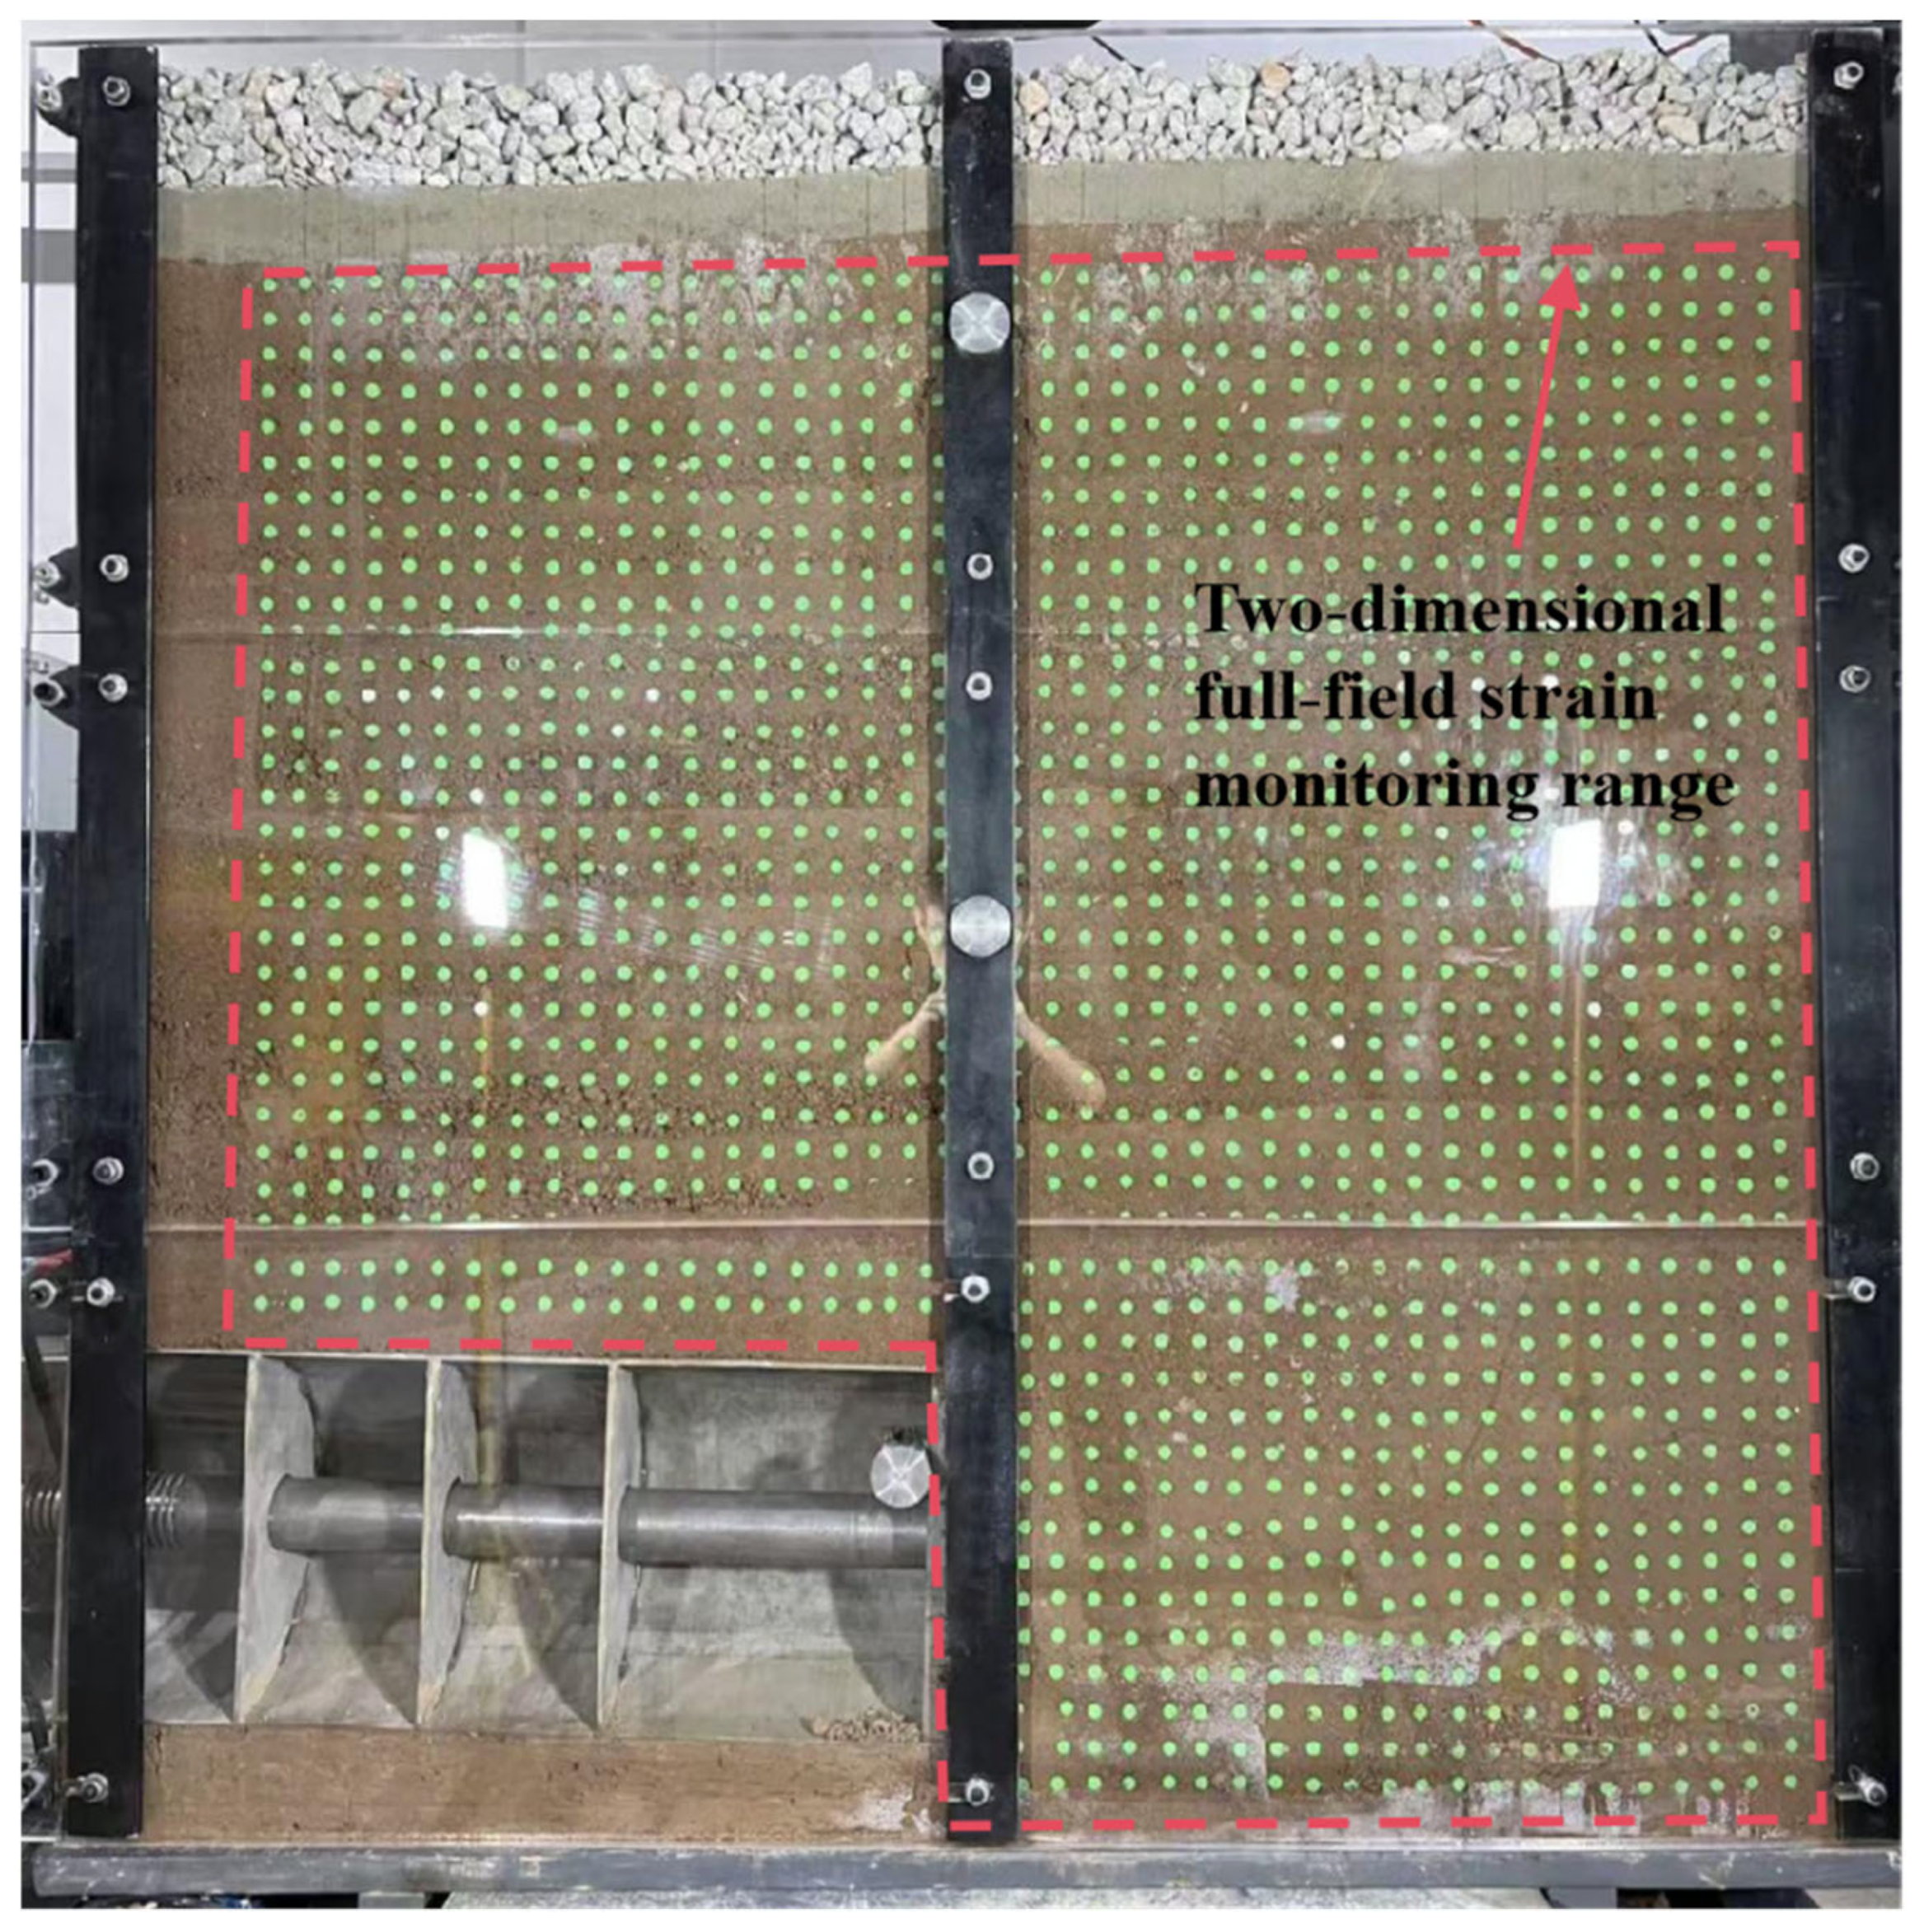
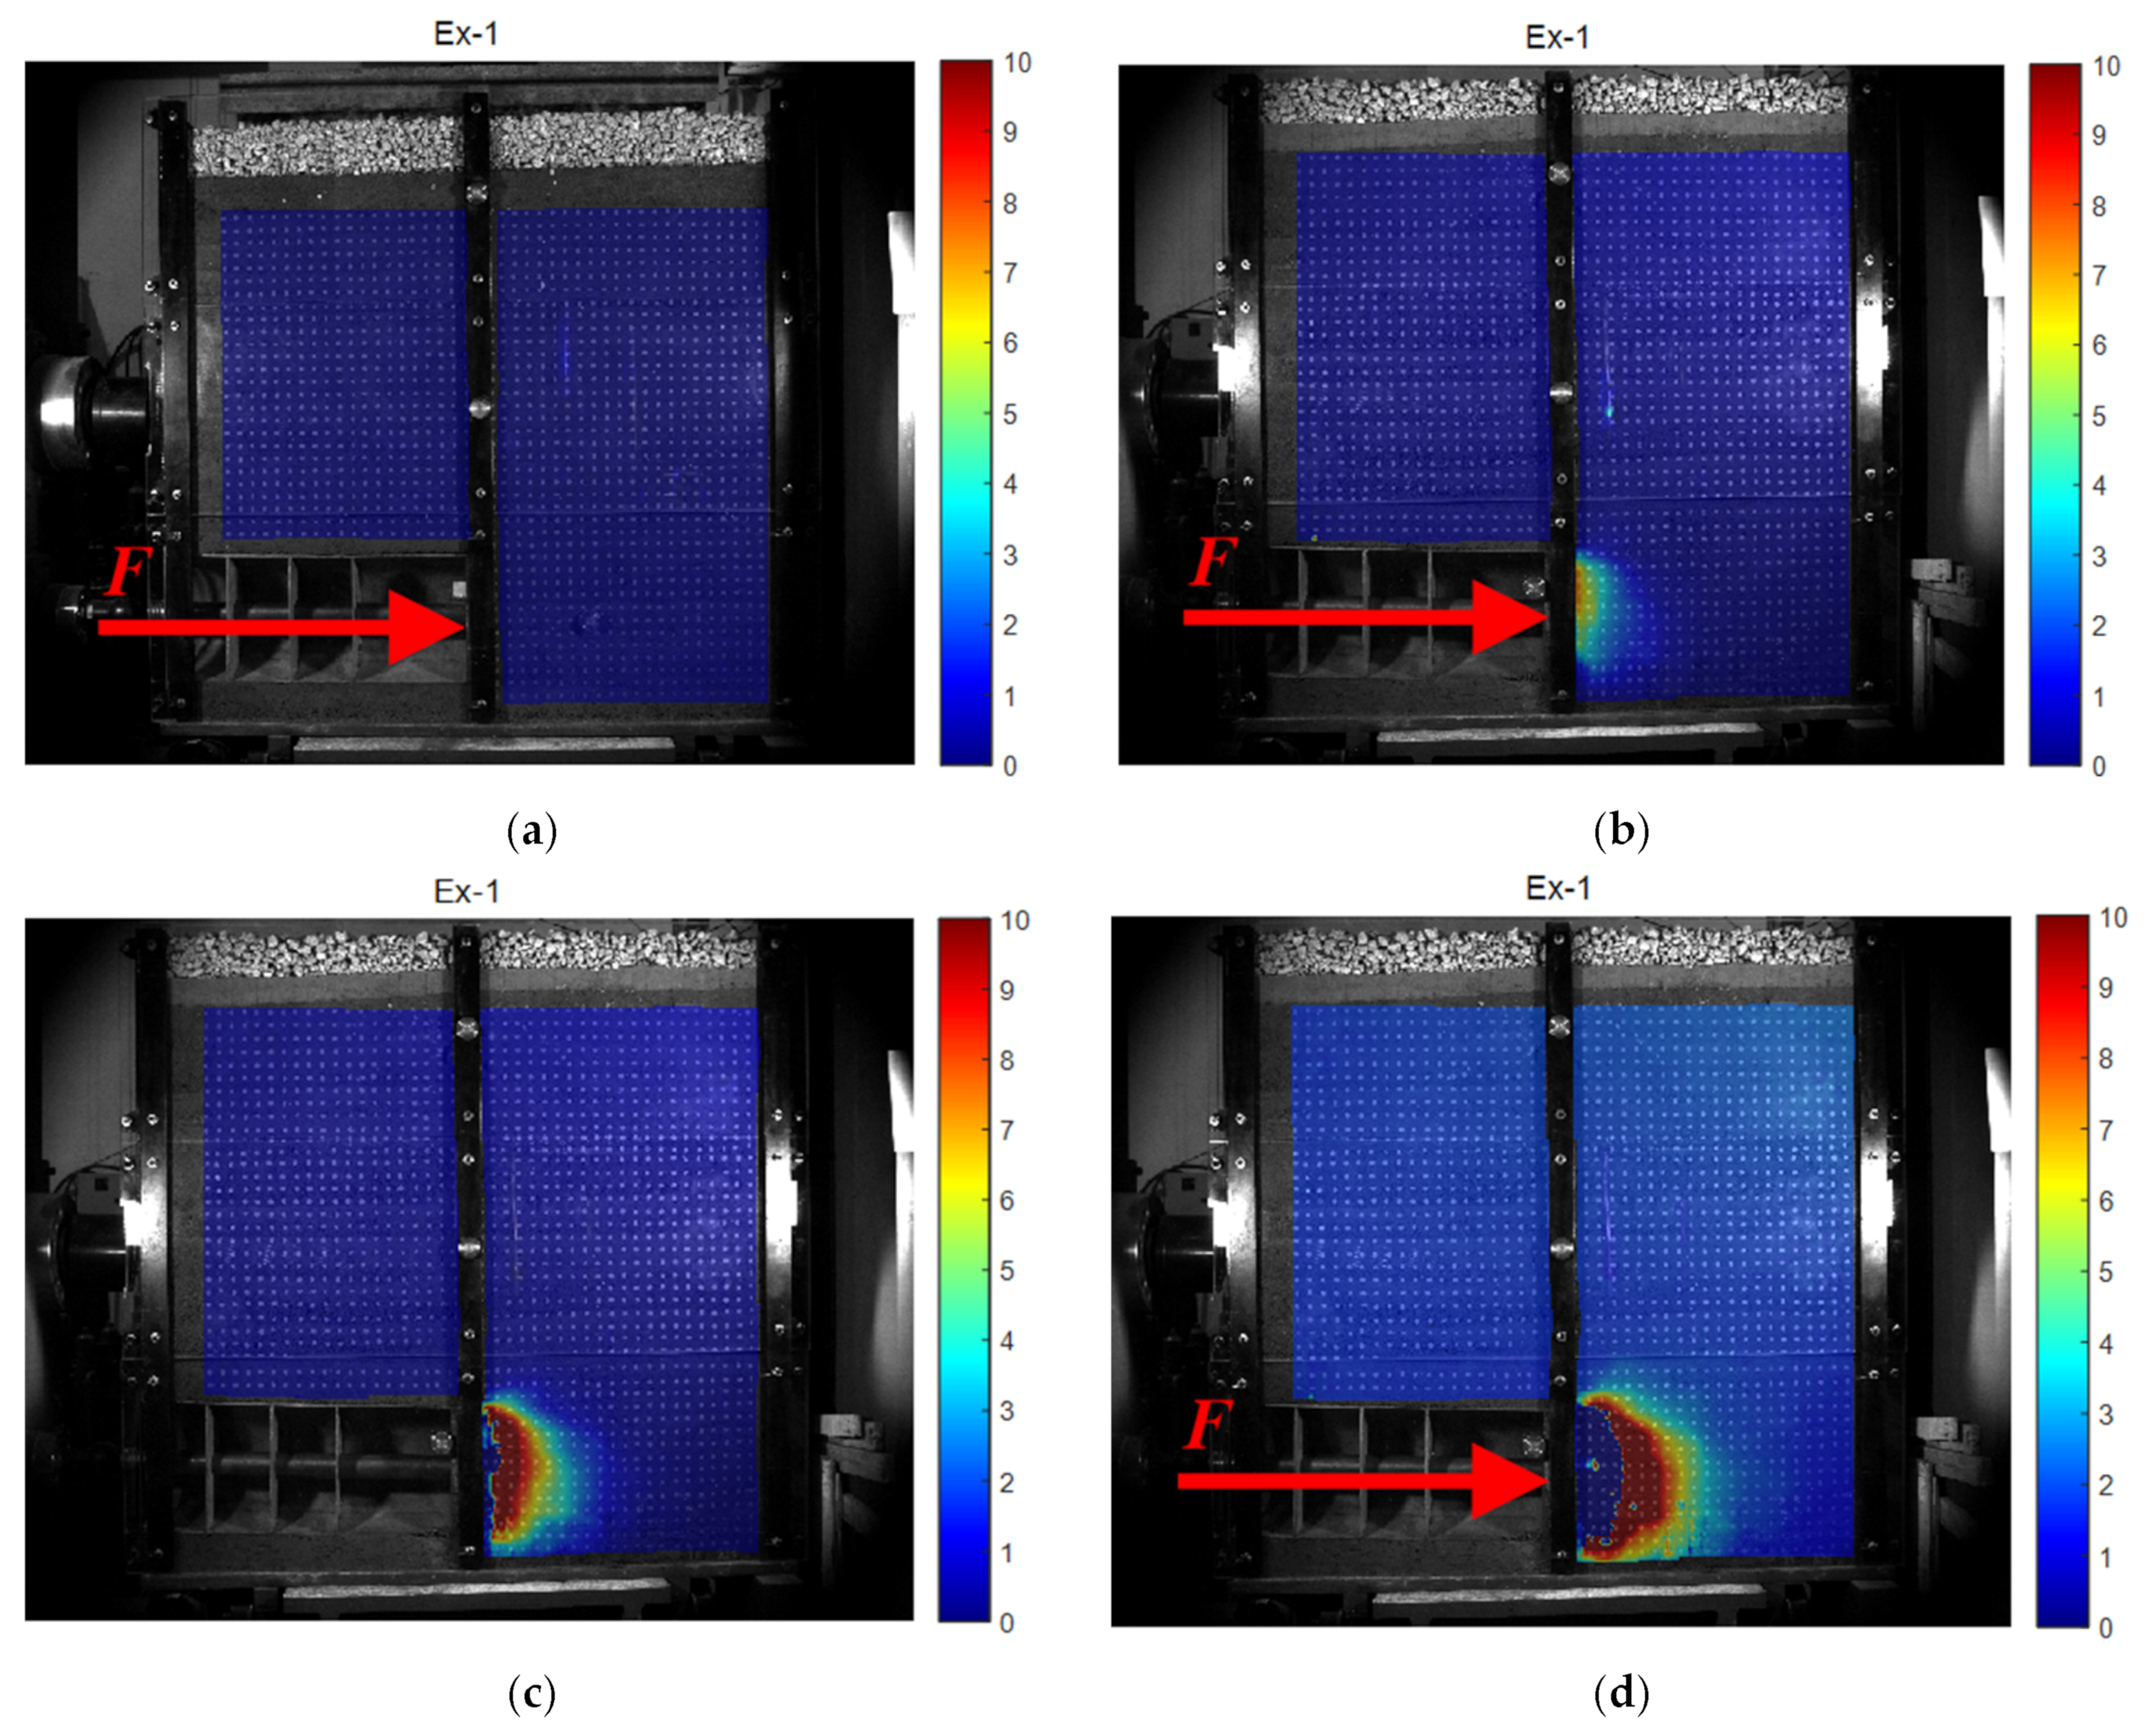
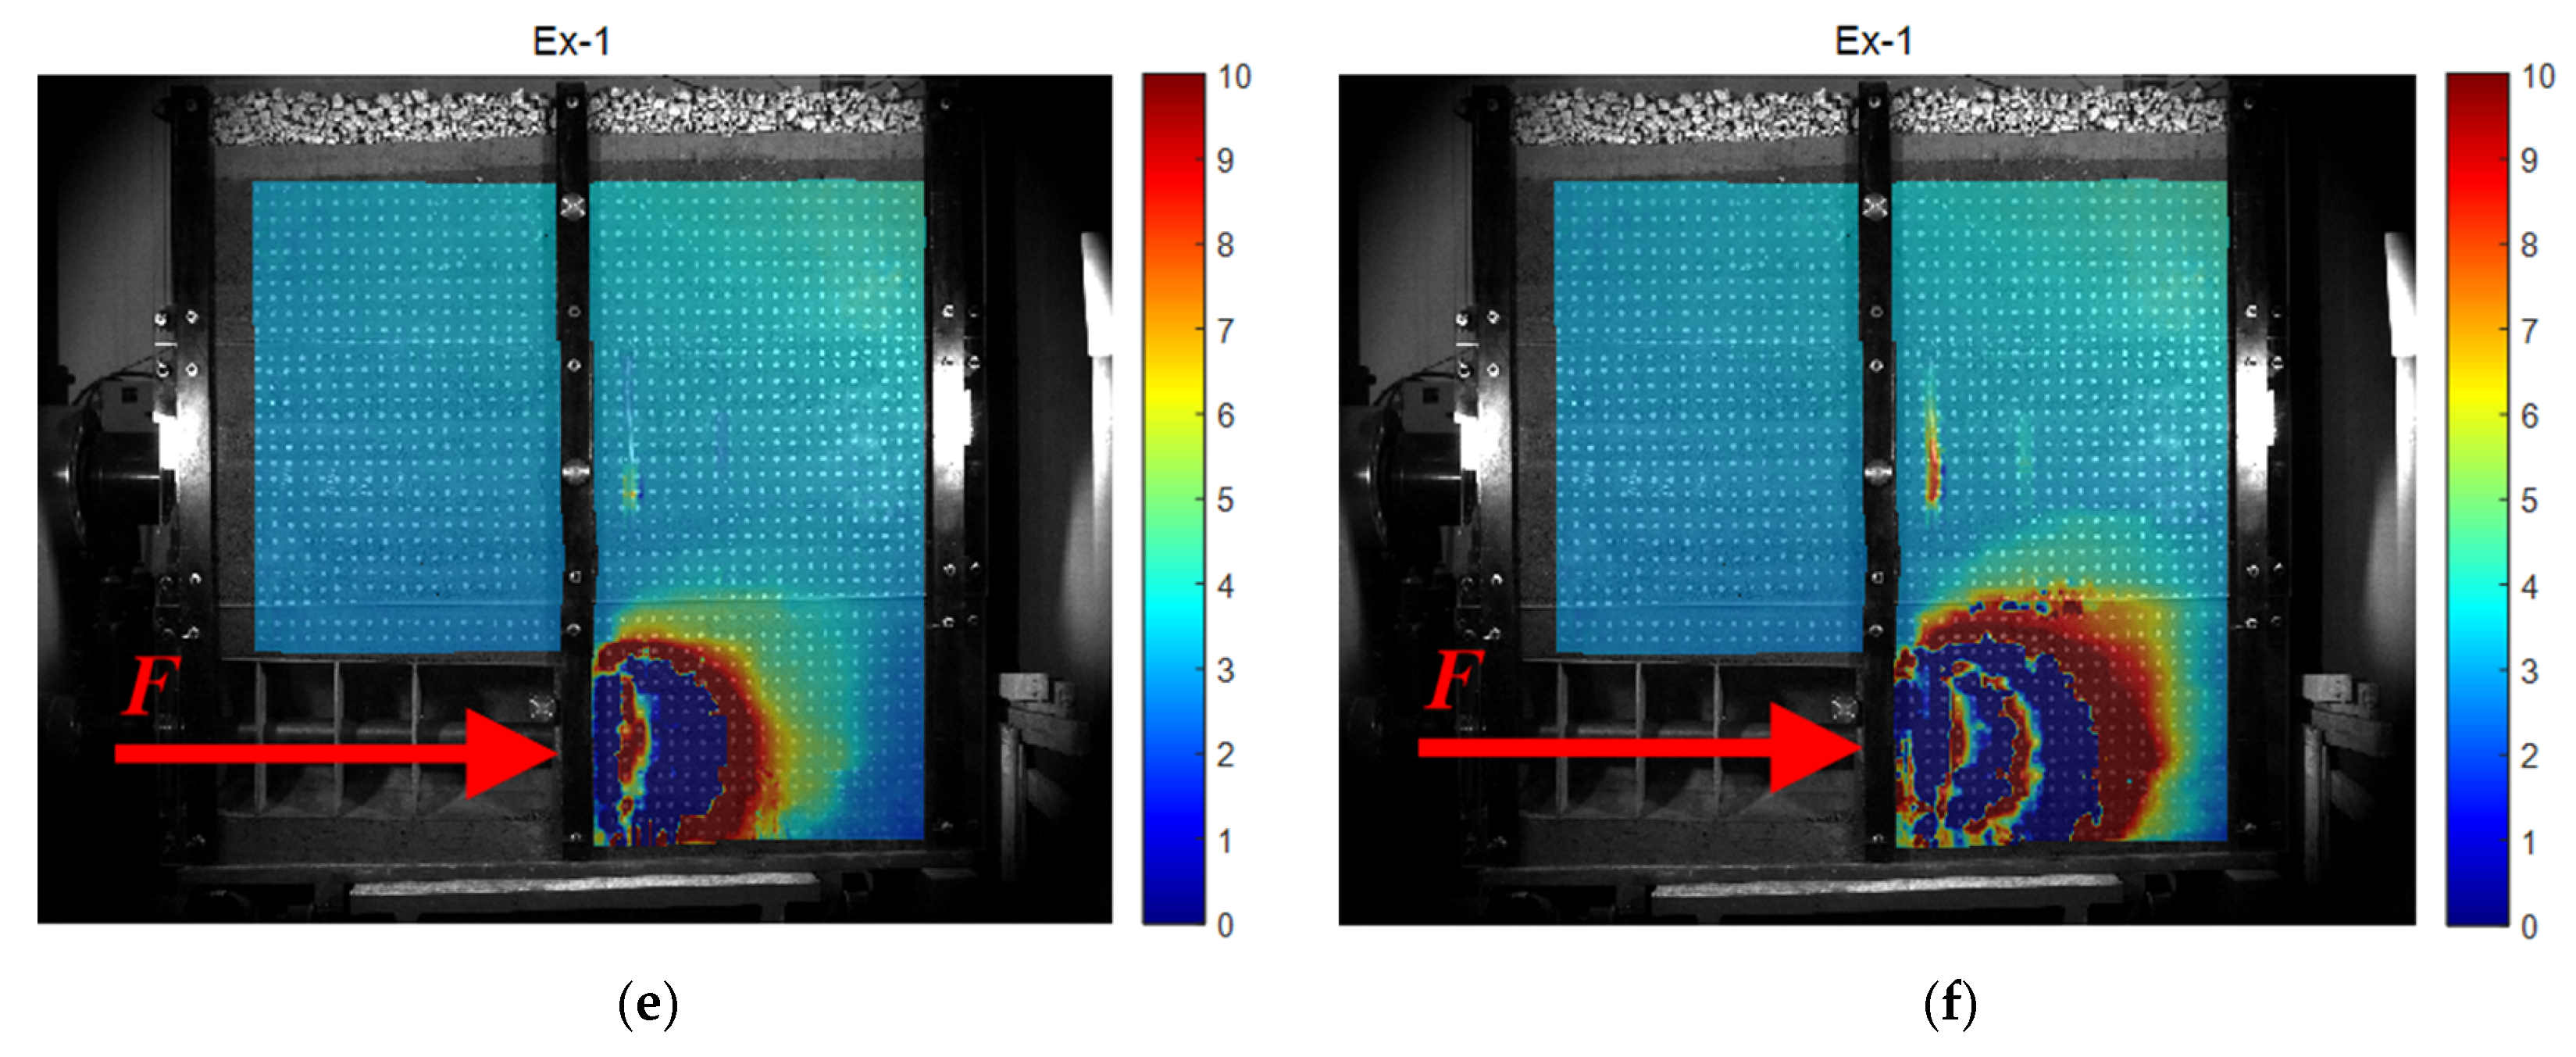
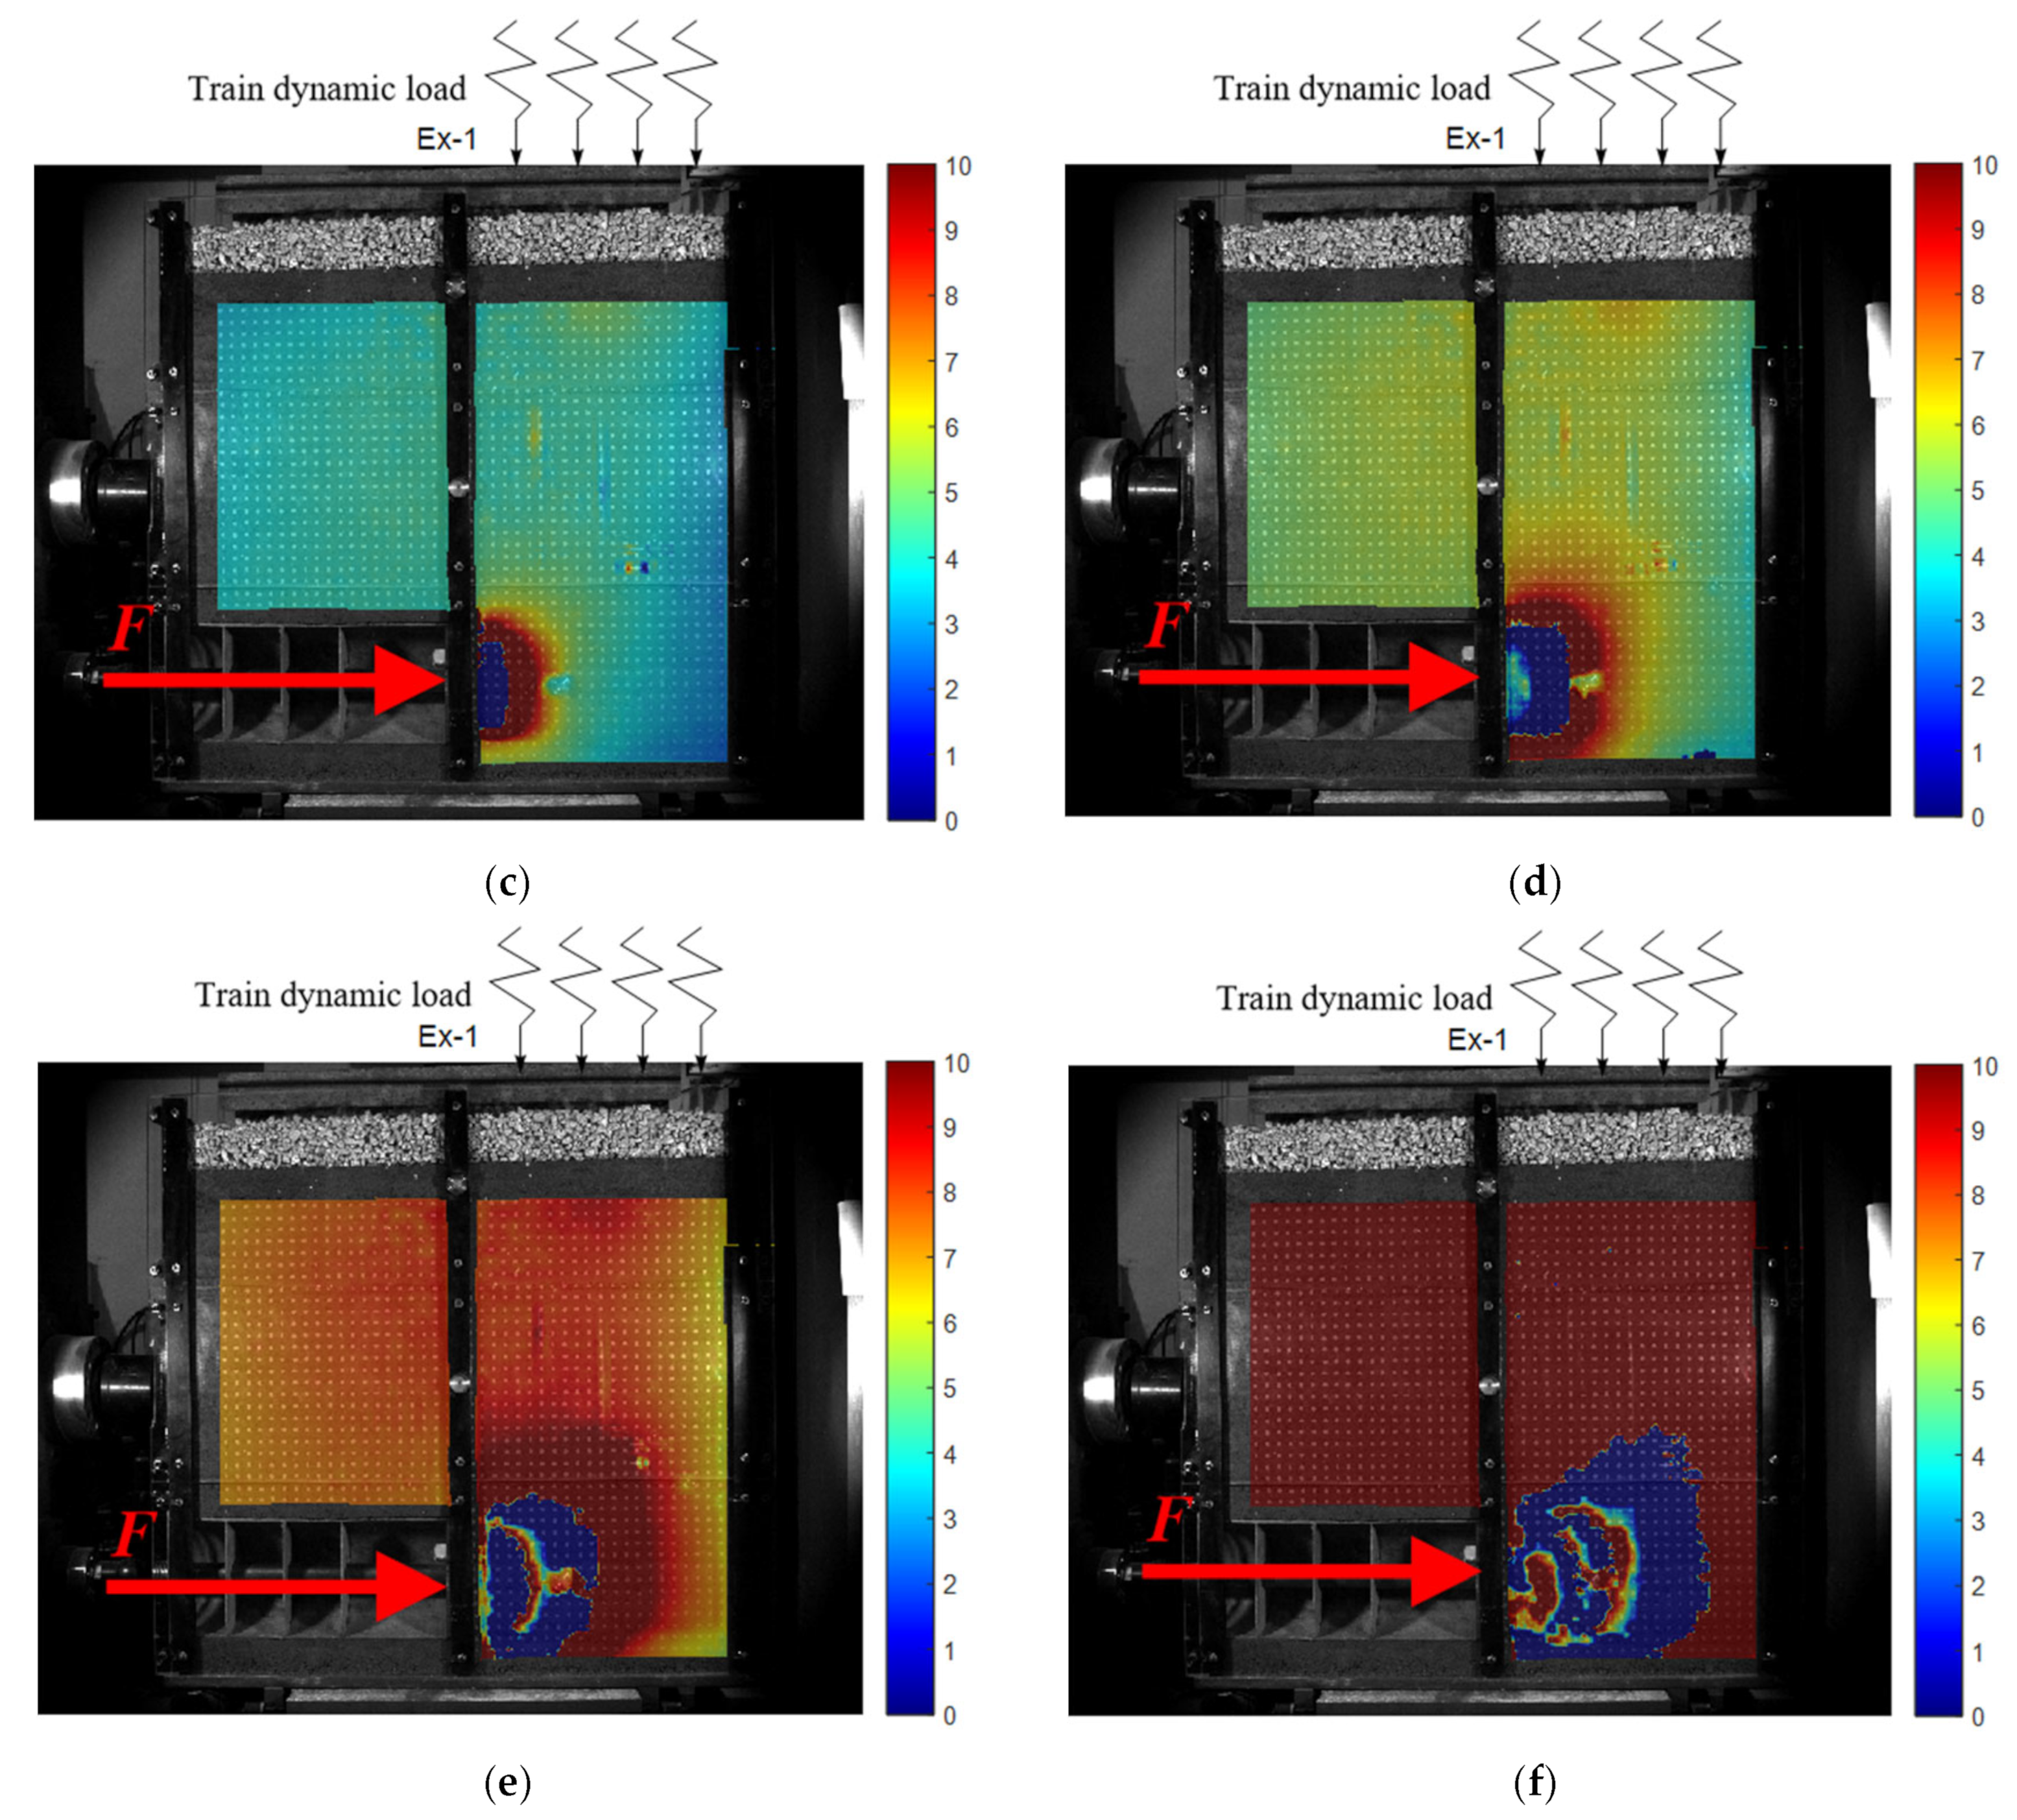
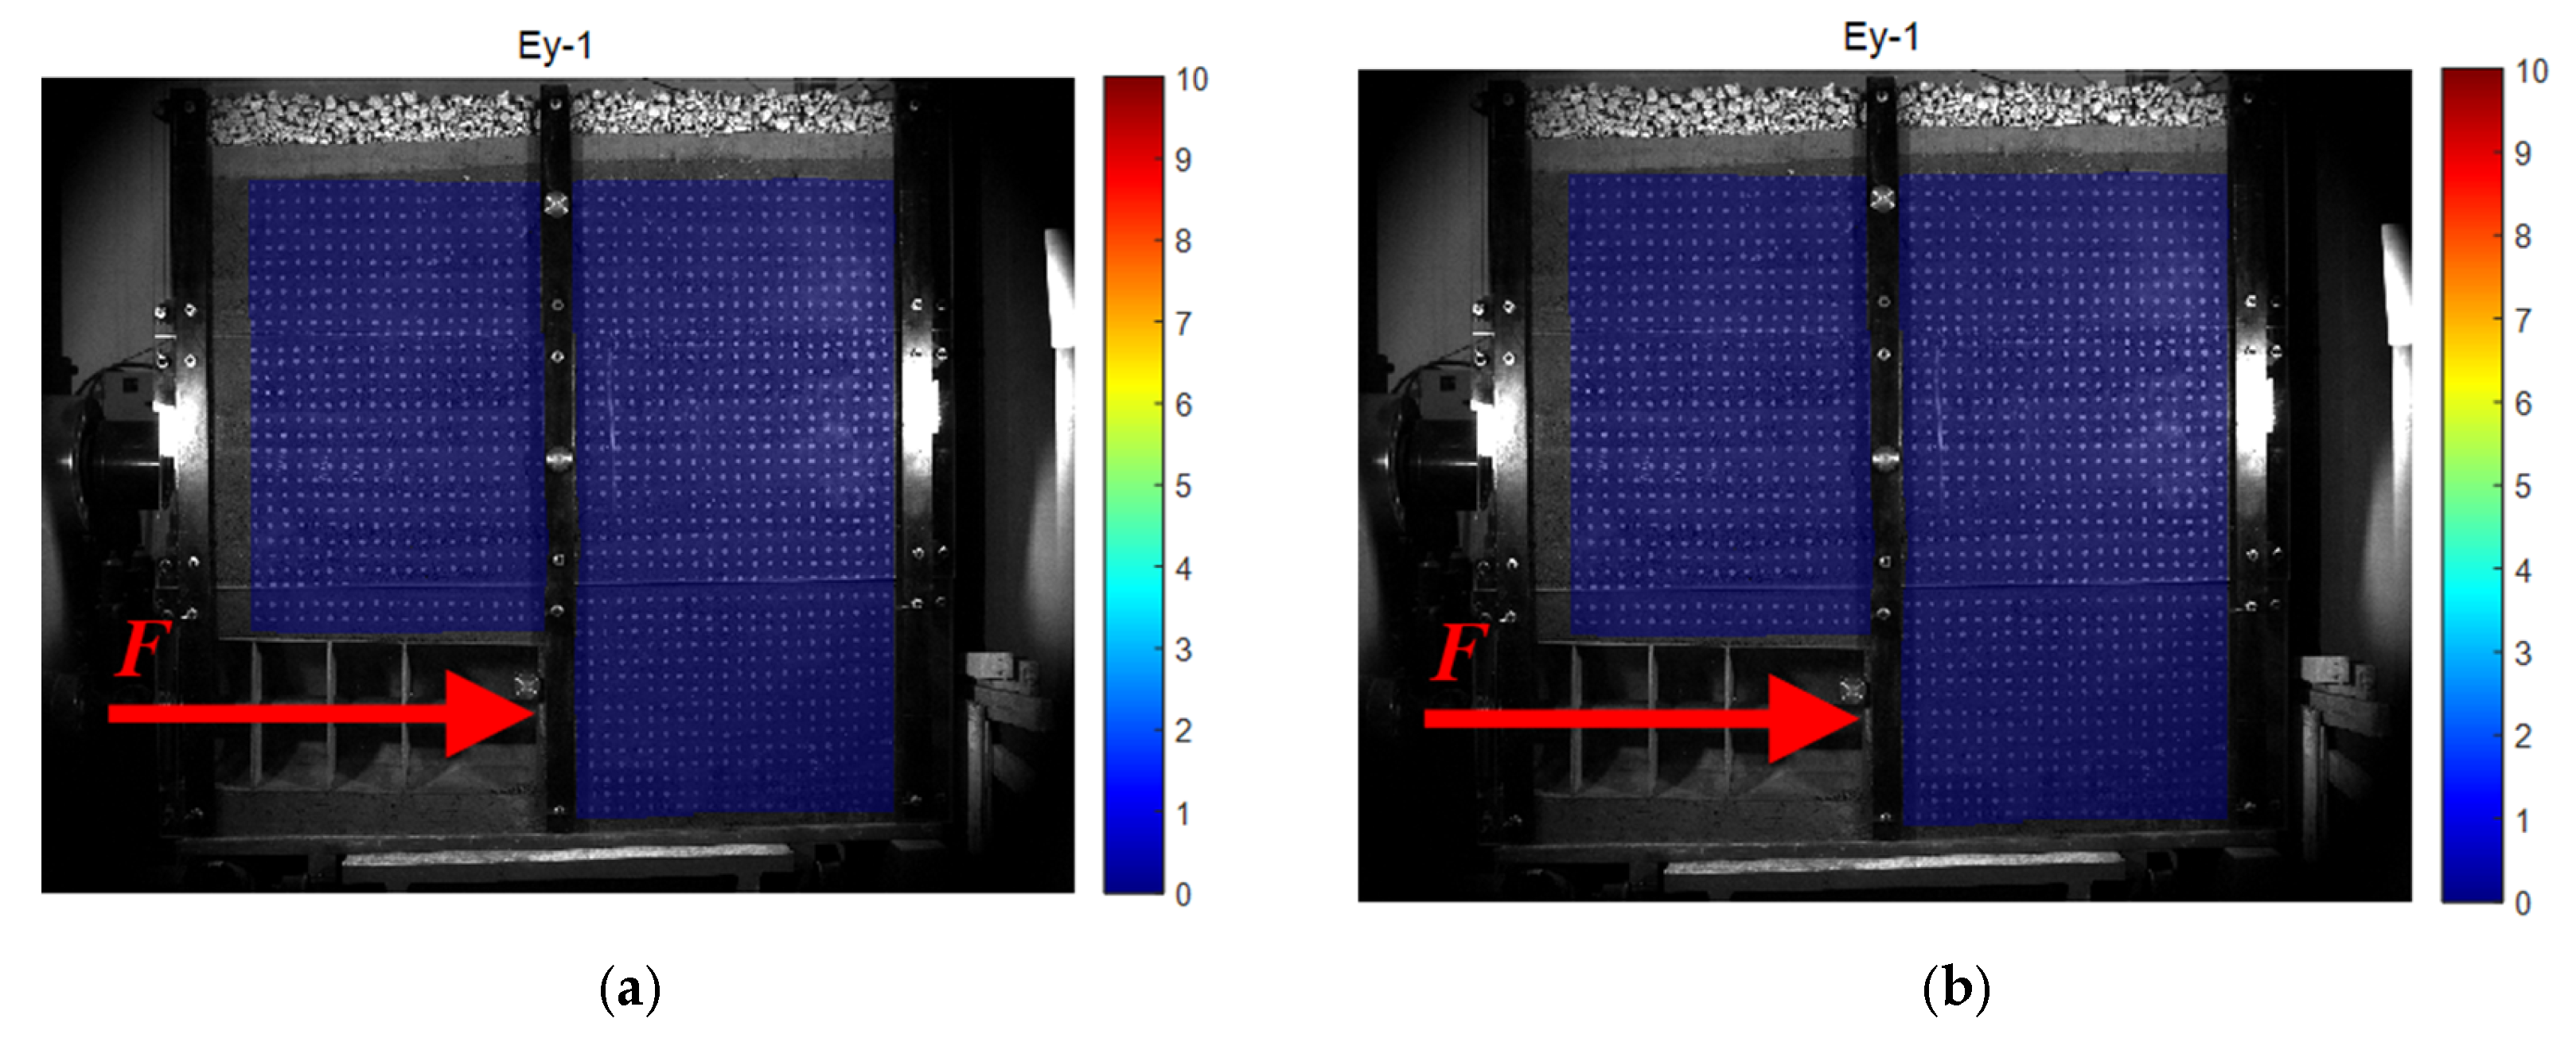
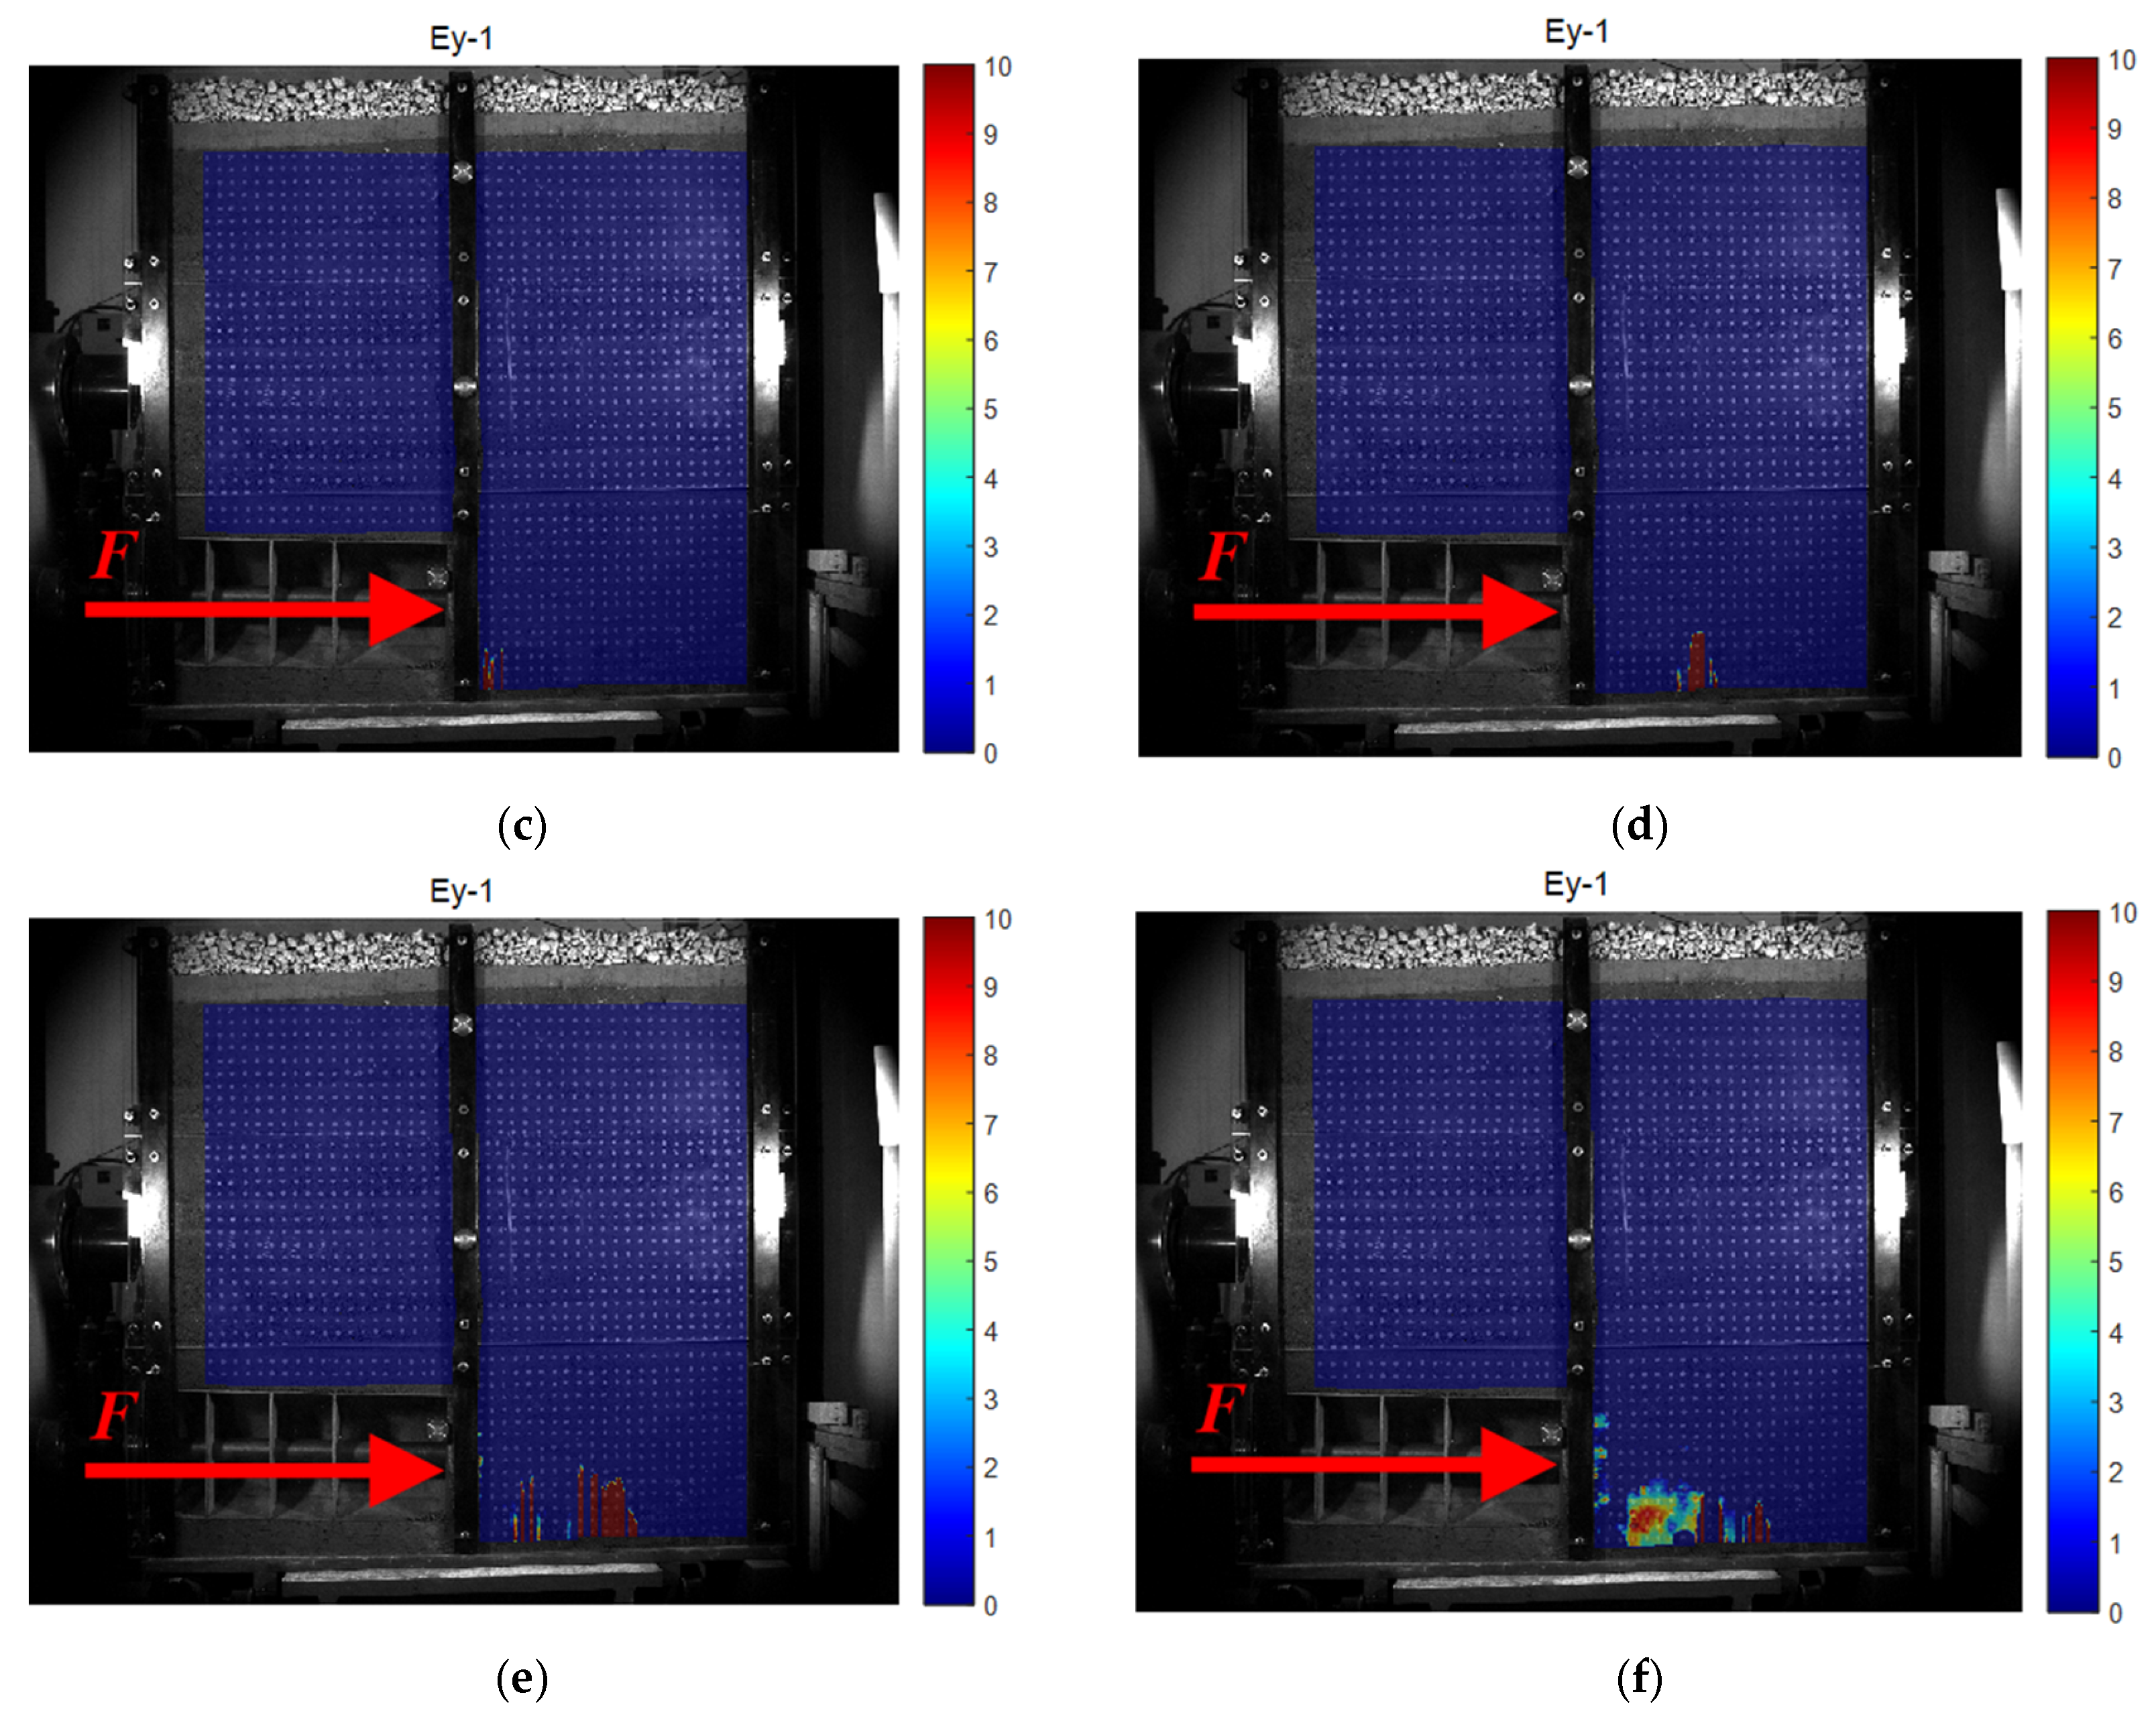
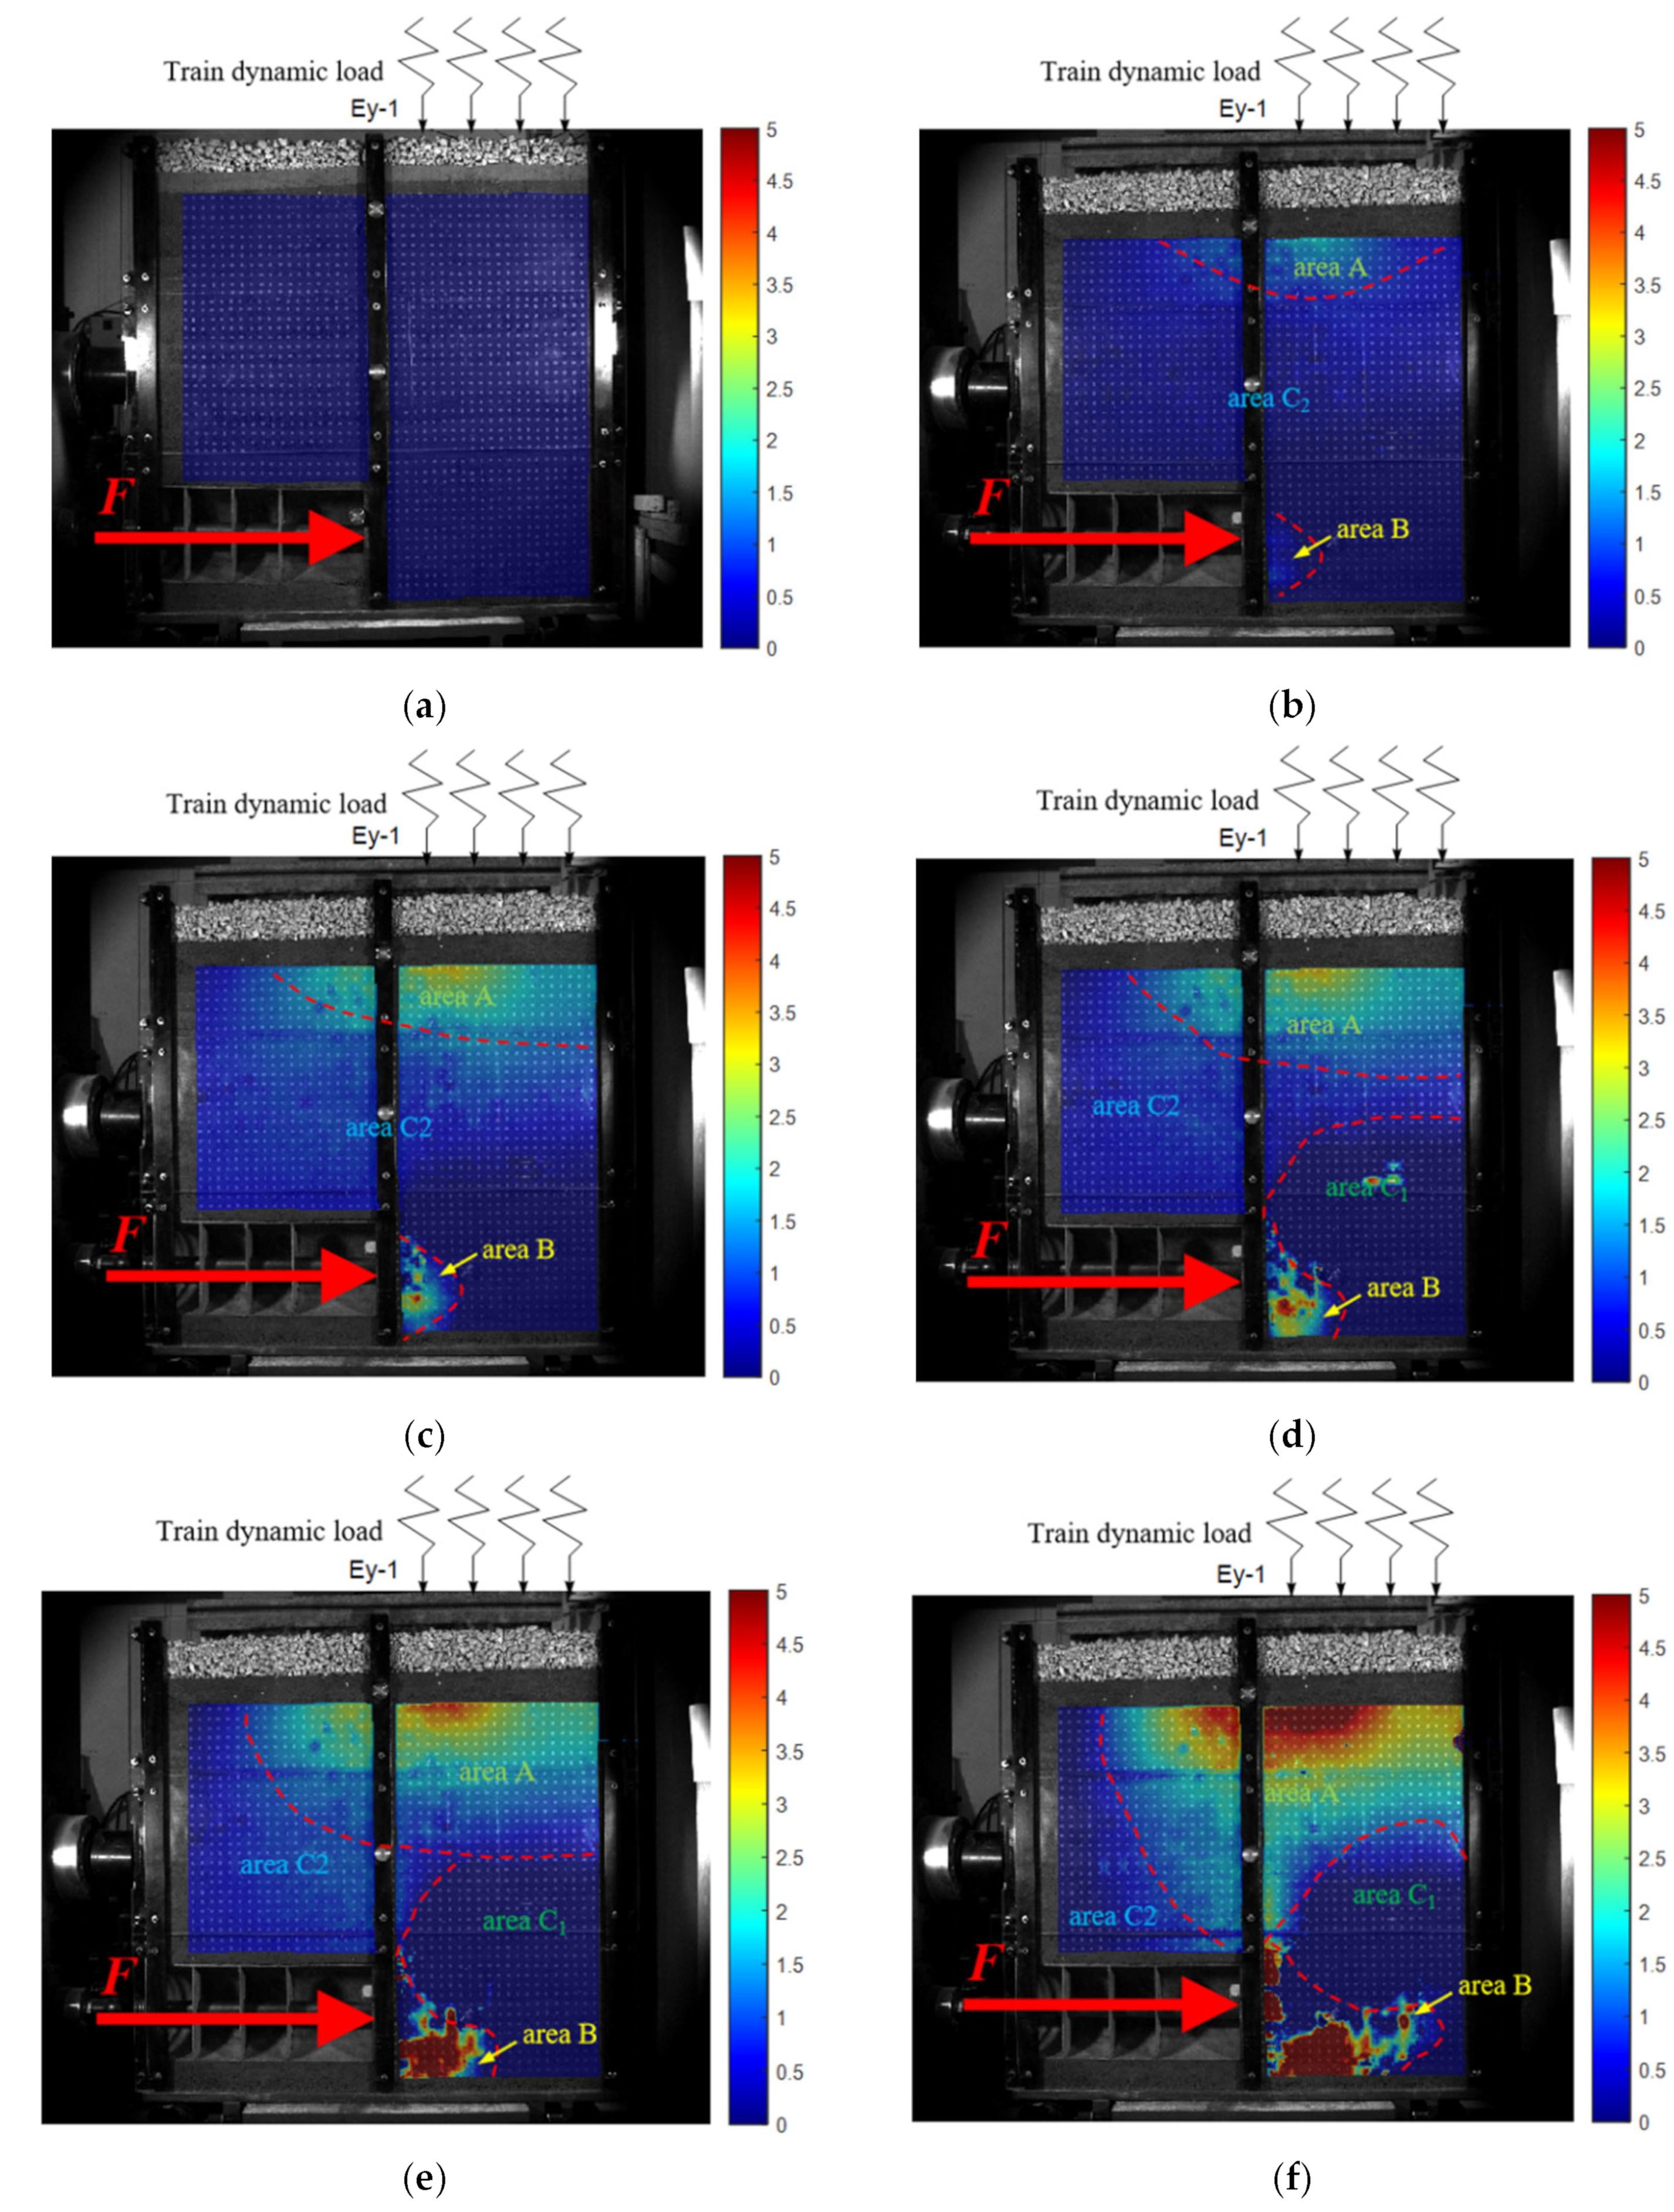
The 2D full-field strain measurement system collects images in real time (through a single industrial camera), captures the surface features of the specimen before and after deformation, identifies the surface feature changes in the measured object, and then obtains the corresponding co-ordinate changes in each pixel of the image through the digital image correlation algorithm, thus calculating the 2D displacement field, 2D strain field, and 2D deformation field data in the process.
The measurement results provided by the system include data, charts, and cloud images, which can intuitively and clearly reflect the displacement, deformation, and strain changes in the measured object, providing convenience for related research work. In this experiment, industrial cameras were used to photograph and record the whole process of shield deformation (on the side of the scaled test model), identify and track the displacement of specific points on the whole process of the shield deformation image, and generate a surface deformation cloud map and displacement vector map to analyze the deformation characteristics of the whole process of the shield tunnel face under the influence of train vibration load.
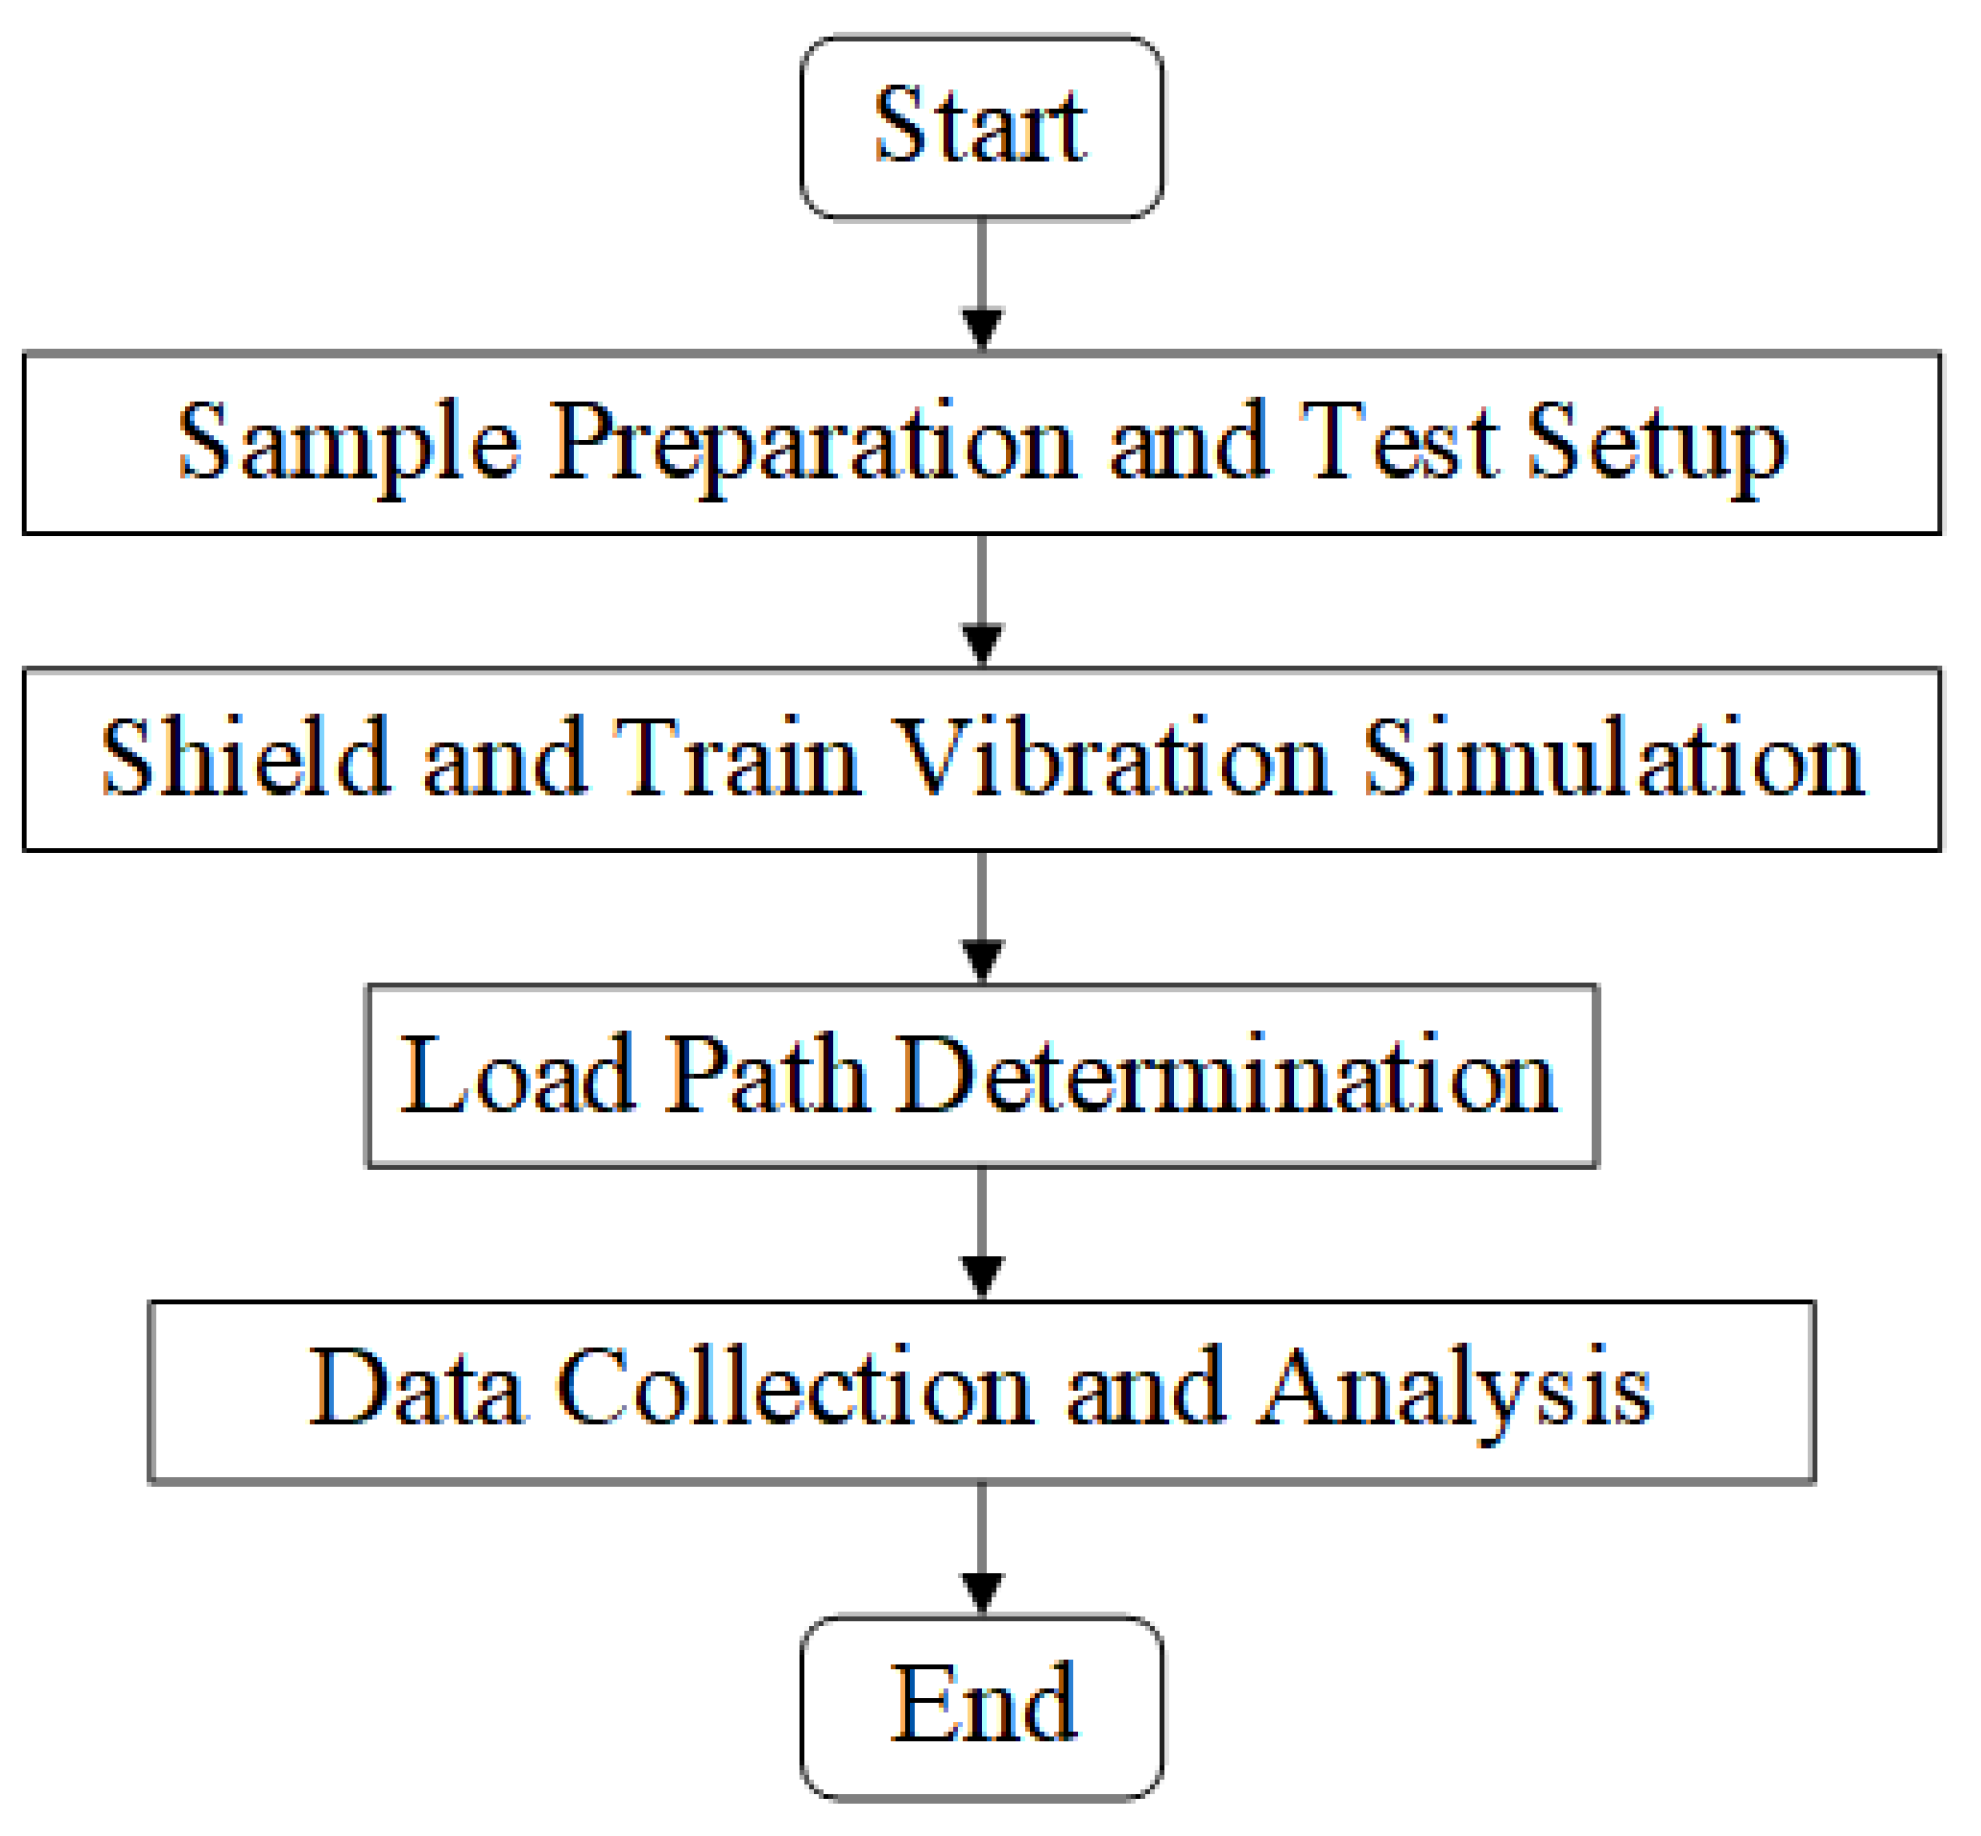
2.3. Test Material

Considering that the Xi’an subway tunnel is completely located in a silty clay stratum, according to the purpose of this study—combined with the engineering background and test conditions—the new loess, fine sand, and silty clay obtained on-site were used to prepare similar model samples during the test. The new loess was taken from the layer less than 1 m after the peeling of the topsoil, as shown in Figure 7, and the fine sand was taken from the fine sand excavated from the bottom of the tunnel, as shown in Figure 8. The silty clay was taken from the soil sample of the tunnel face during the shield excavation, as shown in Figure 9. The moisture content of the soil sample obtained on-site decreased during transportation. In the preparation of the laboratory test model, the soil sample was initially broken, and the moisture content was adjusted to be similar to that of the field soil sample and was further broken down to ensure that the particle size of the crushed soil sample was consistent with that of the field soil sample. Finally, it was used to prepare the scaled test stratum.
In the field, the high railway foundation of the railway above the tunnel was laid with a cement-soil cushion composed of 42.5 Portland cement and loess, and the same material and ratio was used to make the cement-soil cushion mixture in the indoor scaling test. As shown in Figure 10, after filling the test model, we filled the cement-soil mixture to the top of the test model.
In order to truly simulate the impact of train vibration on strata in the process of shield tunneling, granite gravel with the same particle diameter as the roadbed bedding was used as the gravel cushion, which was laid under the rail model in the scale test to simulate the mechanical response of strata characteristics under real conditions, as shown in Figure 11.

2.4. Test Process

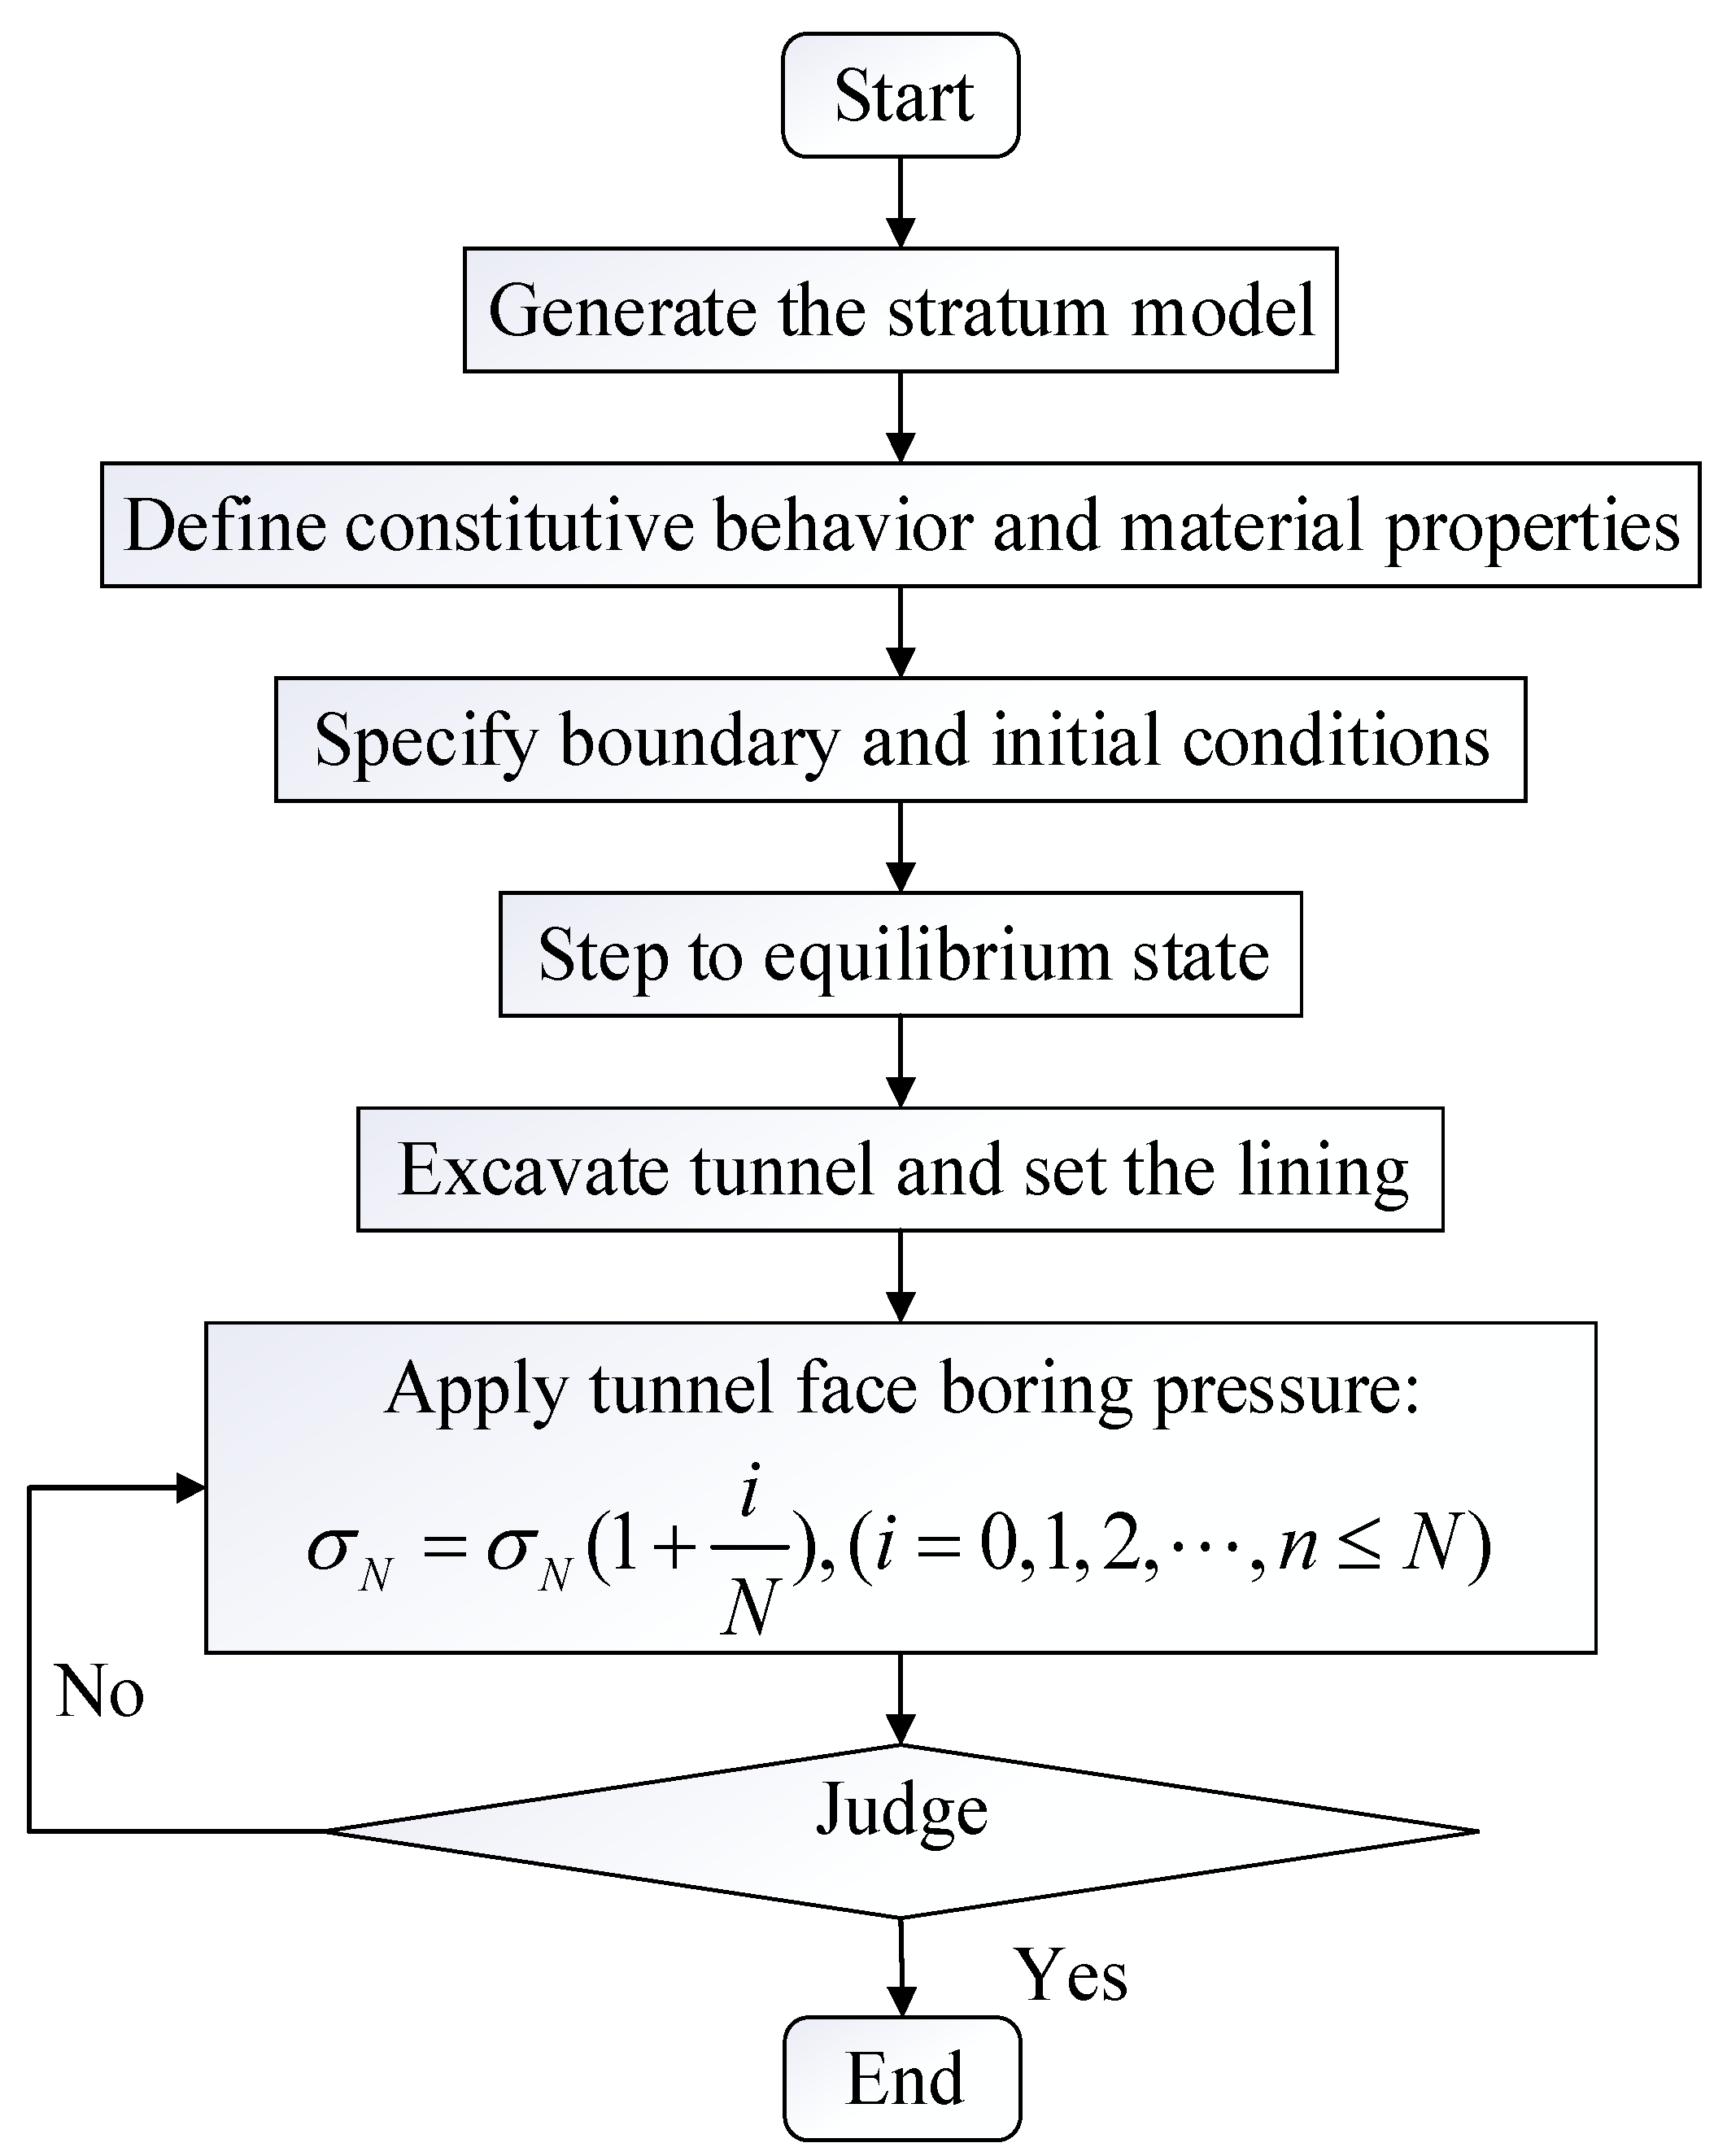
The flowchart of the test, including the main steps, is shown in Figure 12 as follows.
(1)
Sample preparation and test preparation
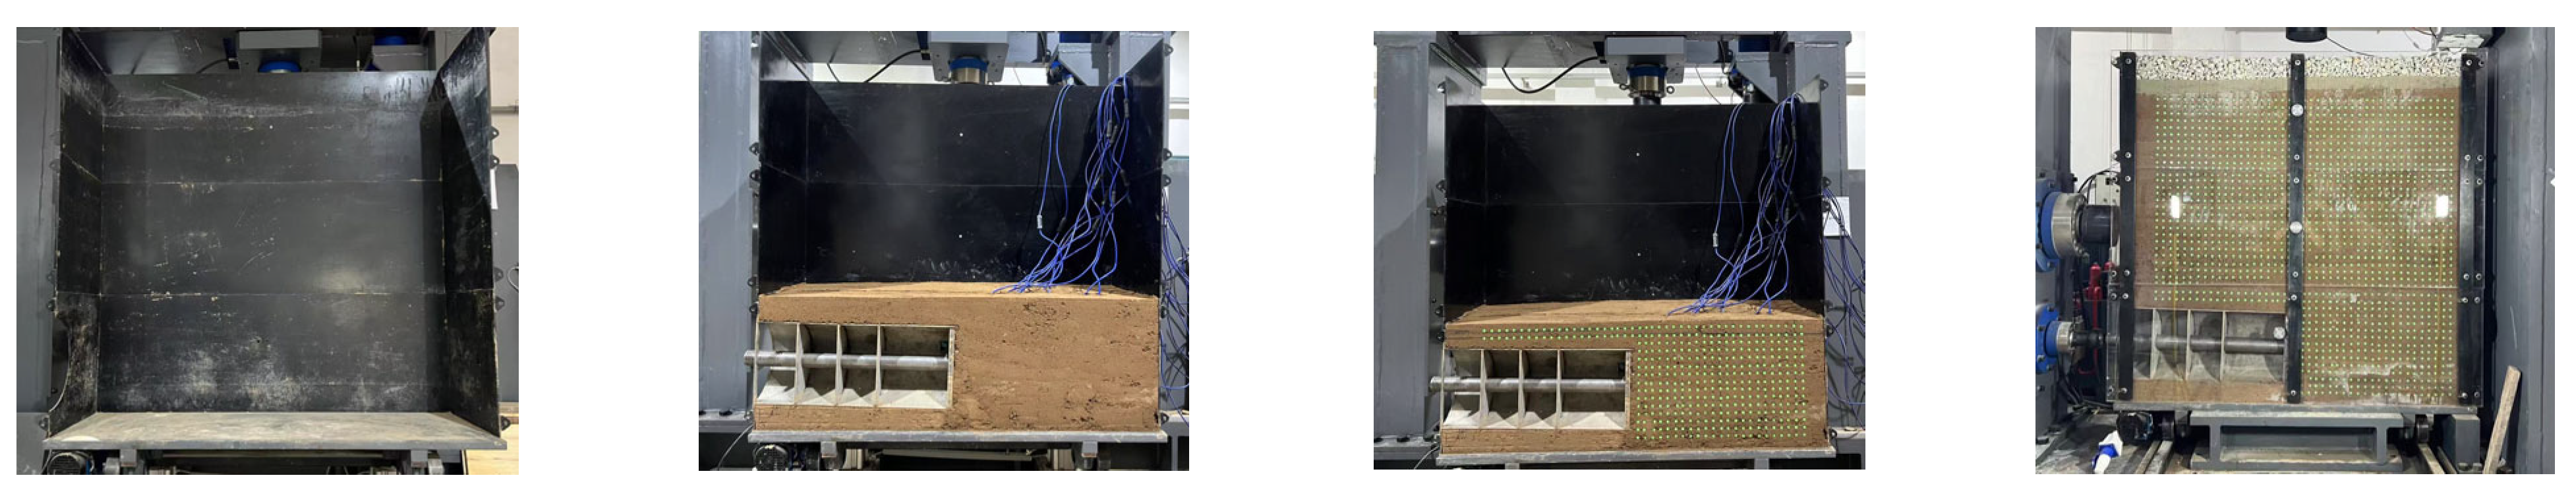
In the process of the layered filling test model, each layer of the 10 cm soil layer was left standing for 24 h to ensure that each layer had initially settled fully under the action of its own weight, and then the next layer of soil sample was filled. Considering that the test model box was assembled using three layers of enclosure, when the soil layer was filled to a height of 50 cm, the rigid enclosure was removed, and green pushpins were used to make speckle. The pushpins were driven into the soil layer surface, and then the prepared plexiglass was installed on the model box; the next layer of the soil layer was filled by repeating the above steps. The final test model is shown in Figure 13. During the soil-filling process, we buried the prepared earth pressure box at a predetermined position according to the test plan, as shown in Figure 14. After the soil layer filling was completed, the prepared cement soil and gravel were filled on top of the soil sample, and the prepared test model is shown in 
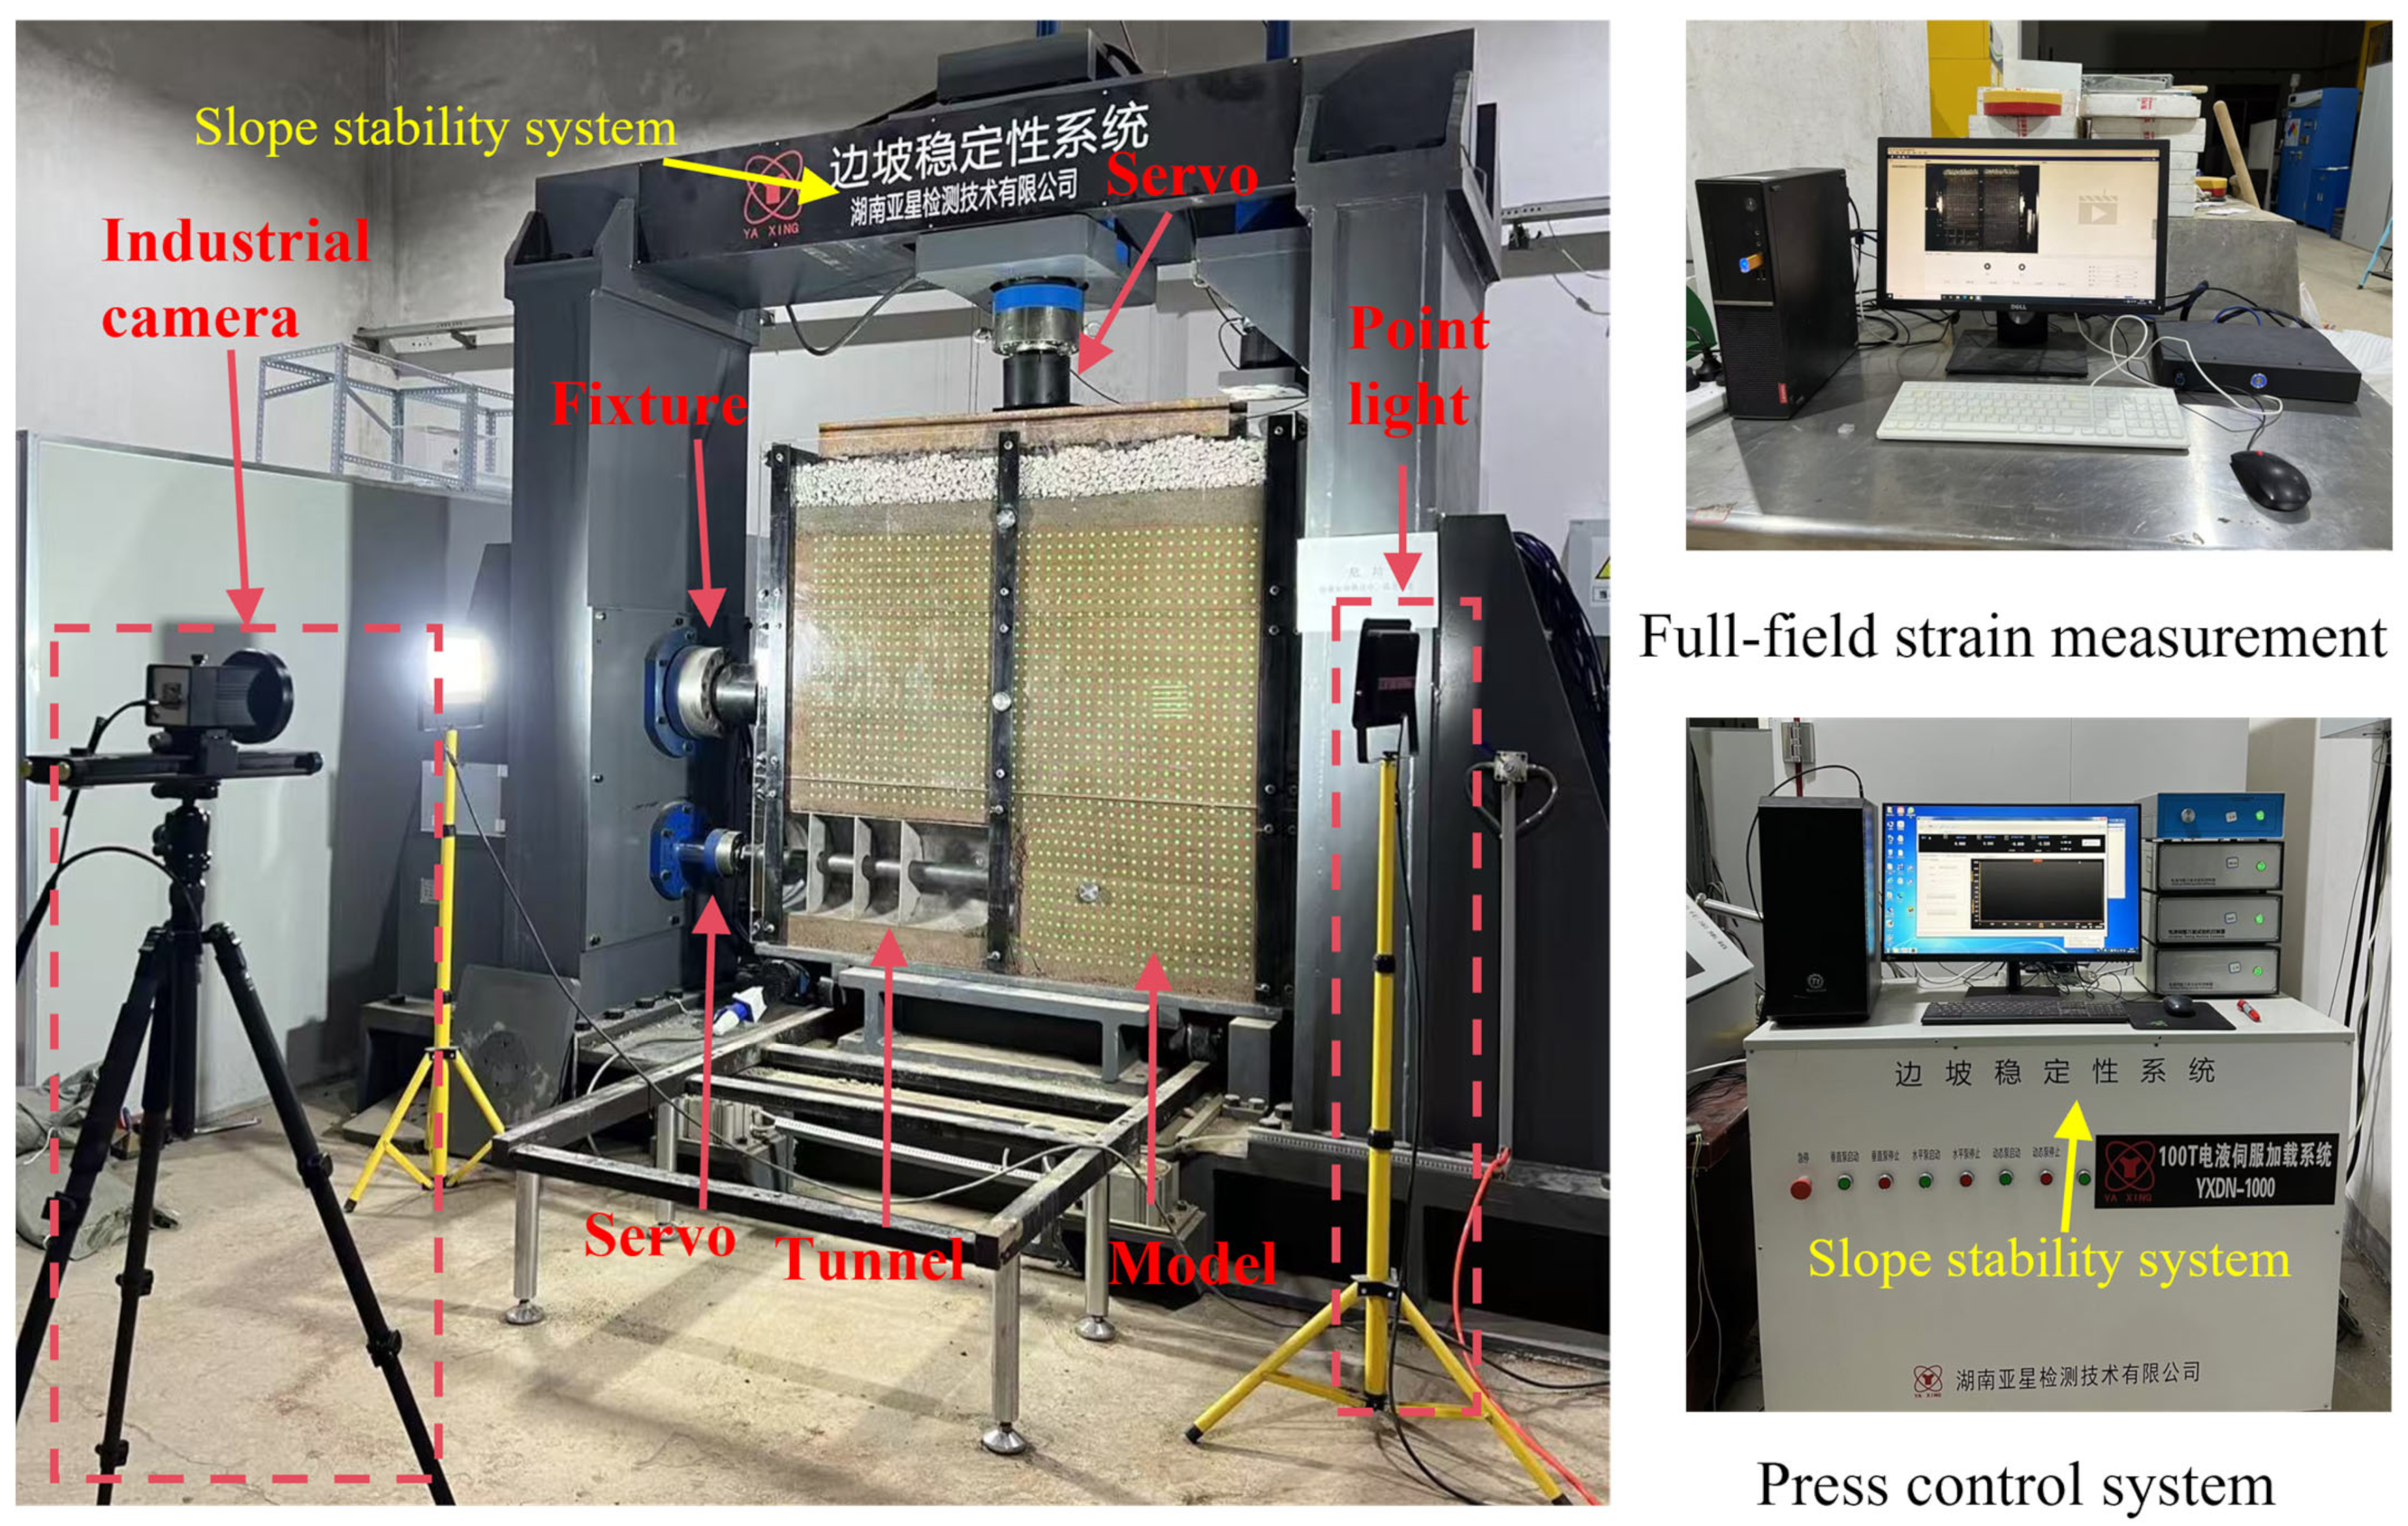
Figure 15. After the scaled test model was prepared, the soil sample was transported to the indicated position using the trolley of the slope stability system, and the 2D full-field strain measurement system and earth pressure box were connected with the corresponding control hardware. All the test equipment was debugged, slope stability system loading and test data-monitoring performance were debugged under no-load conditions, and the loading path was set. Figure 16 shows the equipment layout of the tunnel scaling test site after the final debugging of data-monitoring performance and data-monitoring settings for the 2D full-field strain measurement system and earth pressure box.
(2)
Shield and train vibration simulation
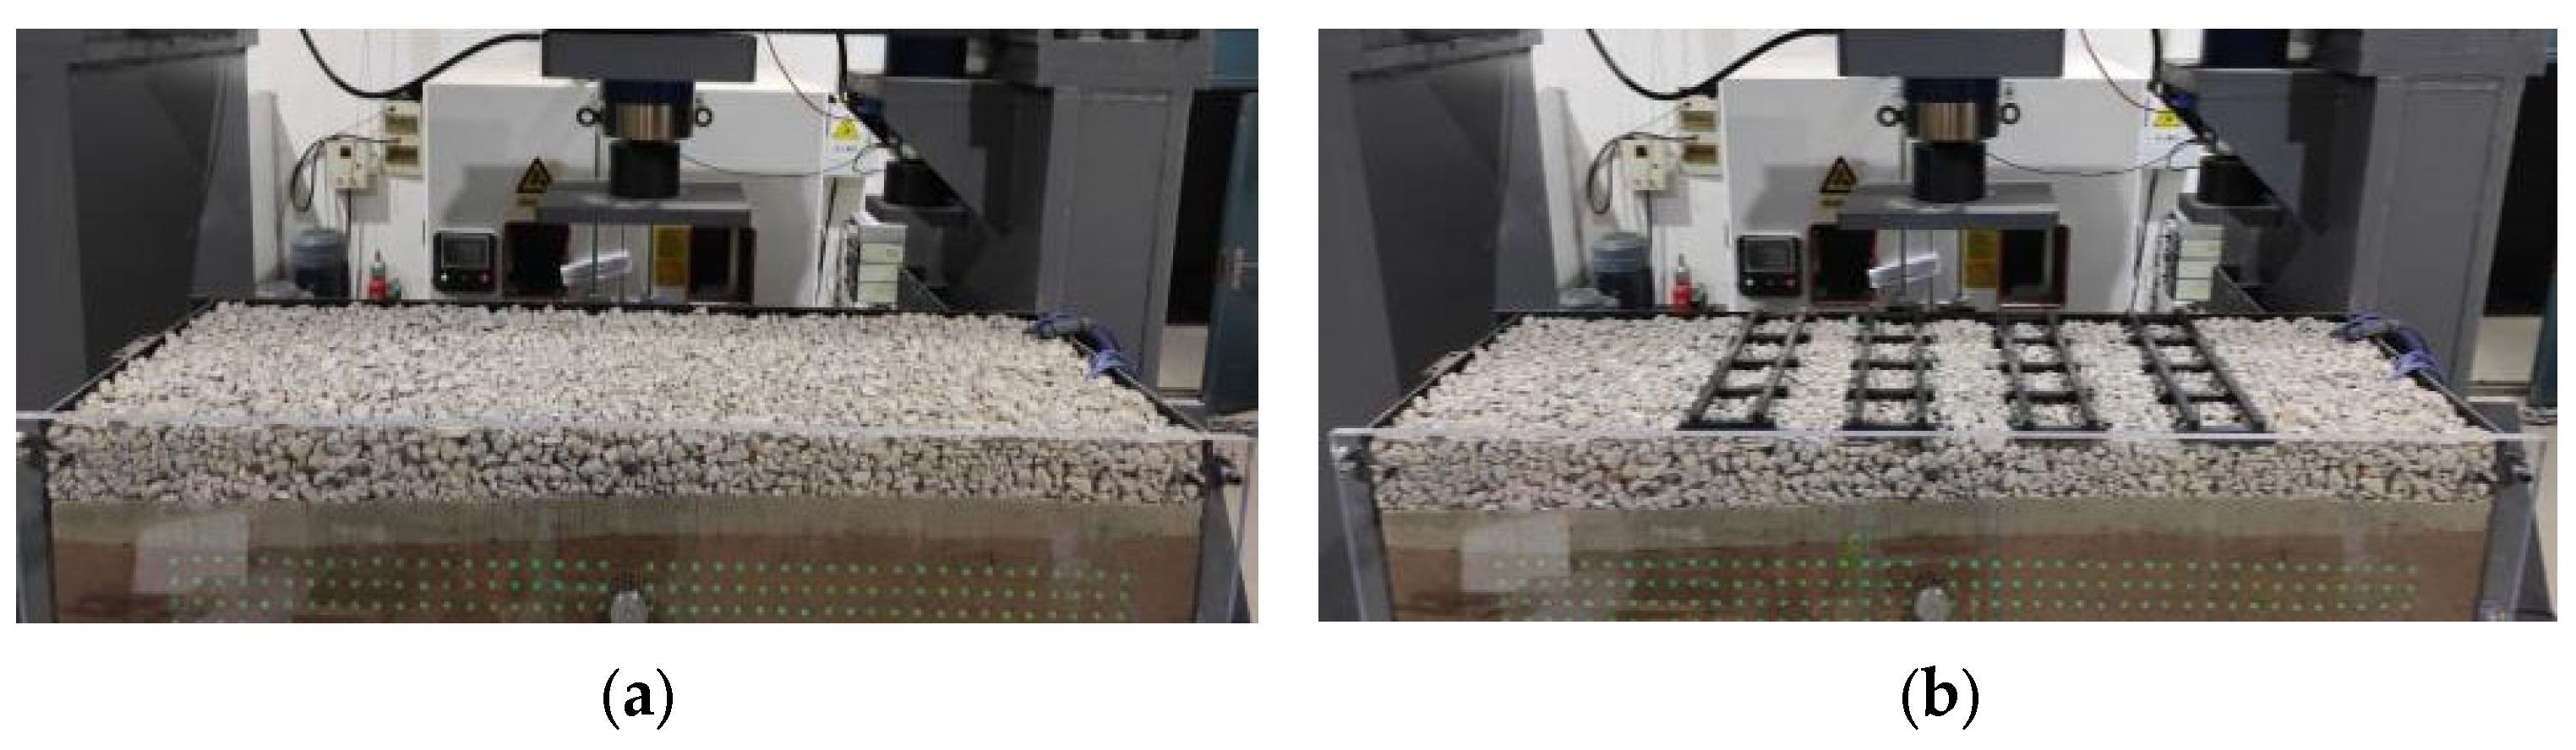
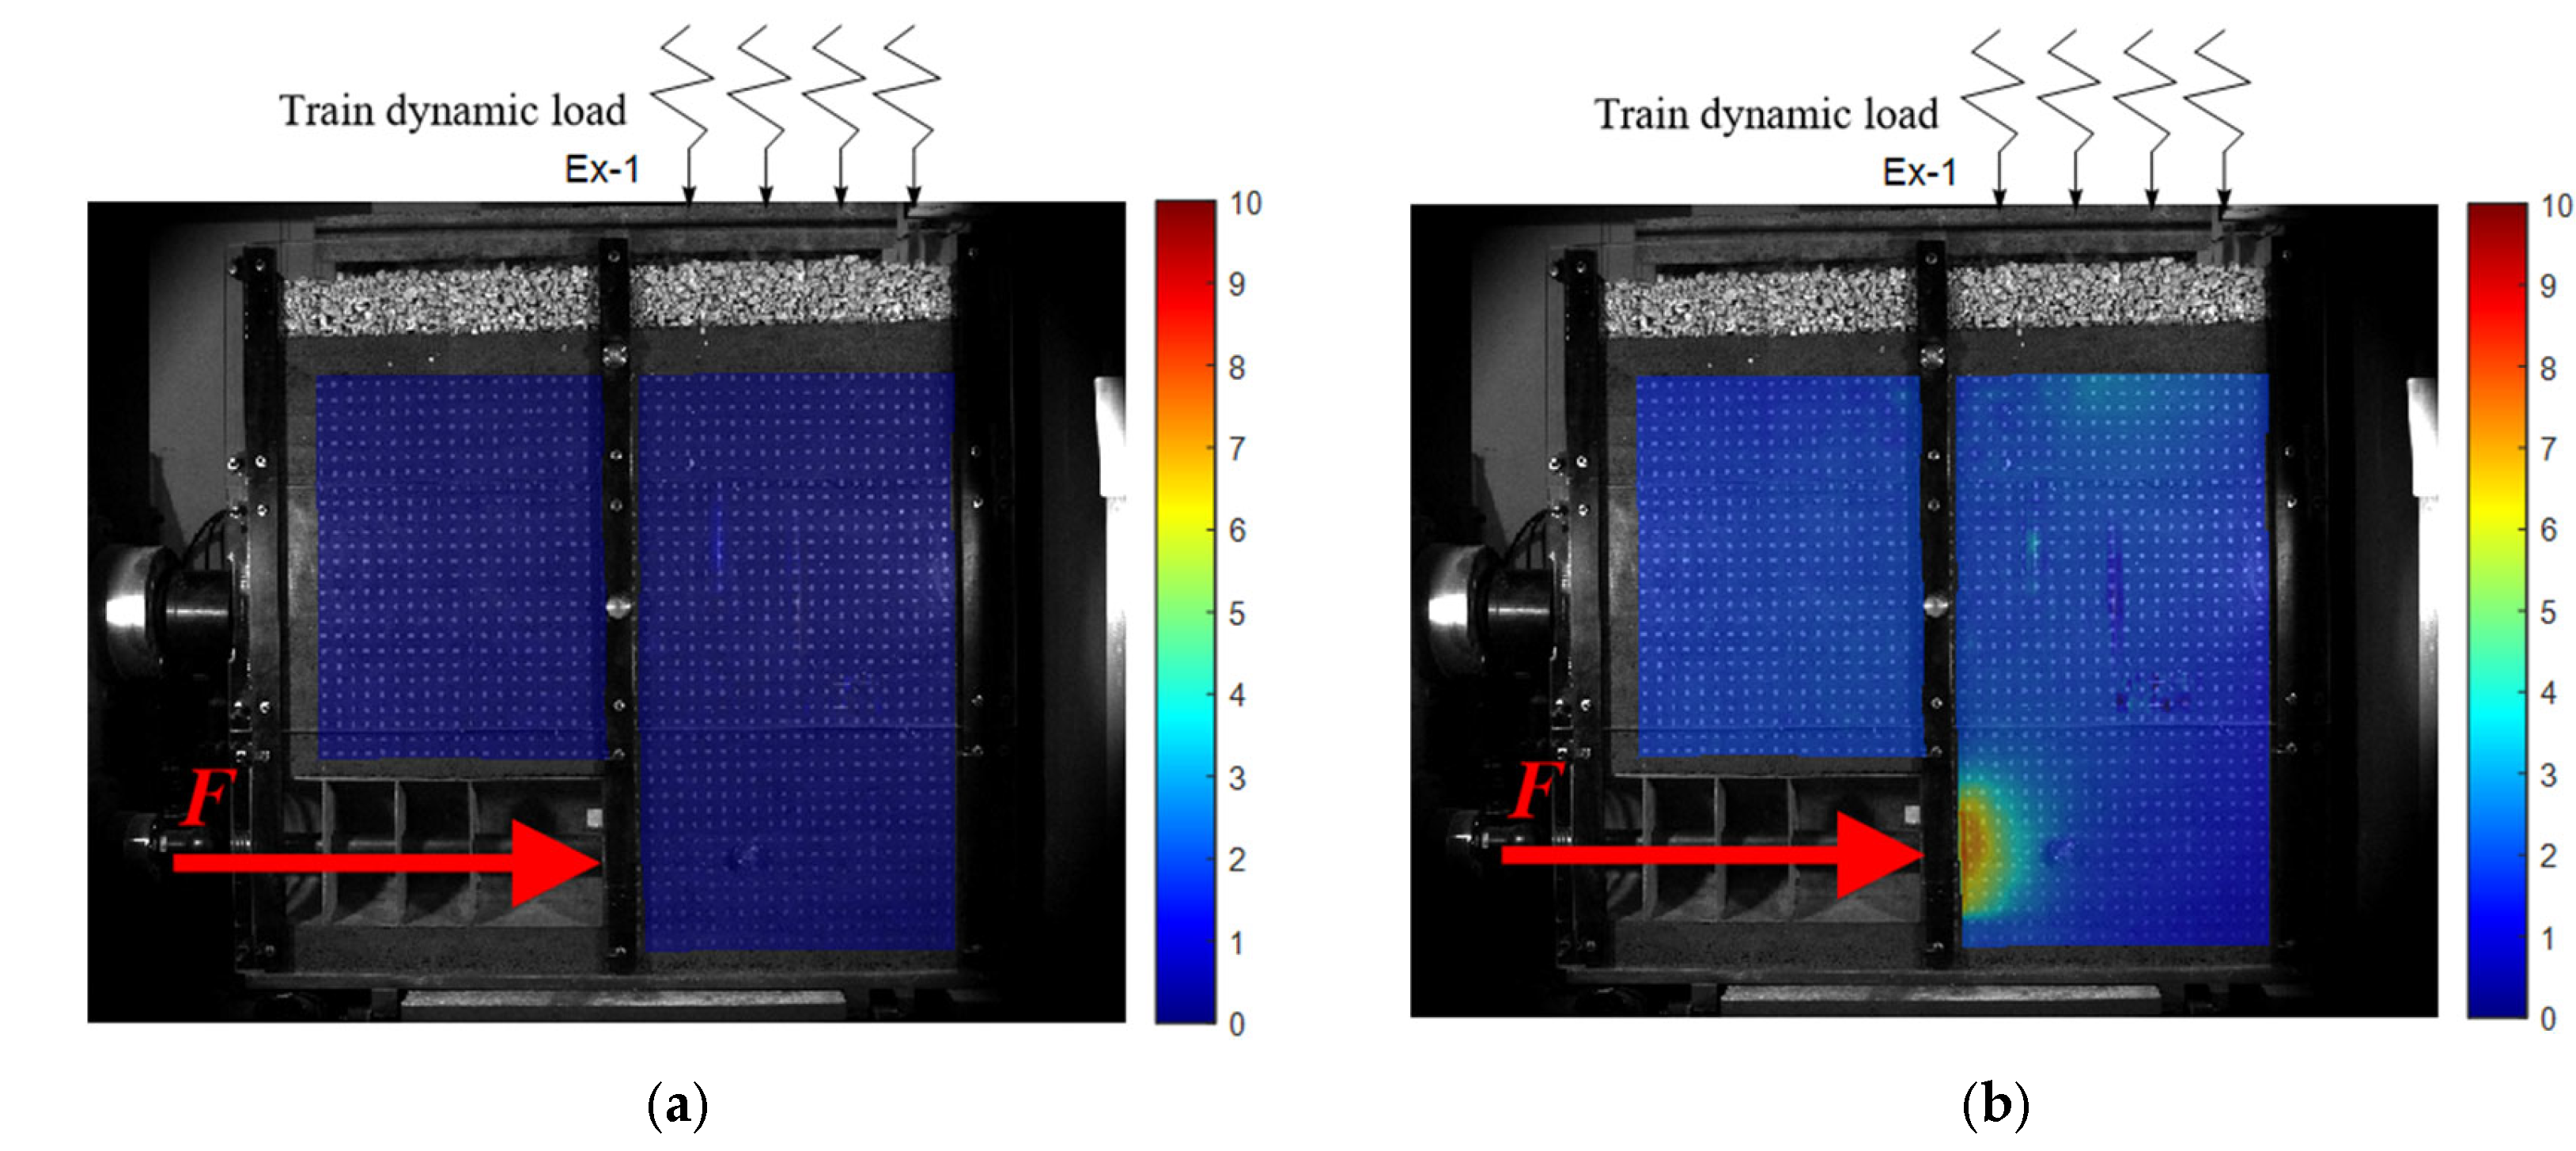
In order to simulate the deformation and load of the tunnel face and overlying strata during shield tunneling without and with trains, two test conditions were determined in this scaled test: The first is the case of no train vibration load, meaning there is no load on the upper part of the test model, and only horizontal thrust is applied to the tunnel axis to simulate the influence of thrust during shield propulsion on tunnel face deformation and load distribution. The second is the case of train vibration load, meaning when simulated train vibration load is applied to the upper part of the test model, horizontal thrust is also applied to the tunnel axis, and the coupling effect of train vibration load and shield thrust on the tunnel face deformation and load distribution is simulated. In the first case, no rail model is arranged on the upper part of the test model, as shown in Figure 17a; in the second case, a rail model of similar proportions is arranged on the upper part of the test model according to the rail distribution of Xulan high-speed railway (on-site), as shown in Figure 17b.
(3)
Load path determination
(1)
Test condition 1: Loading path
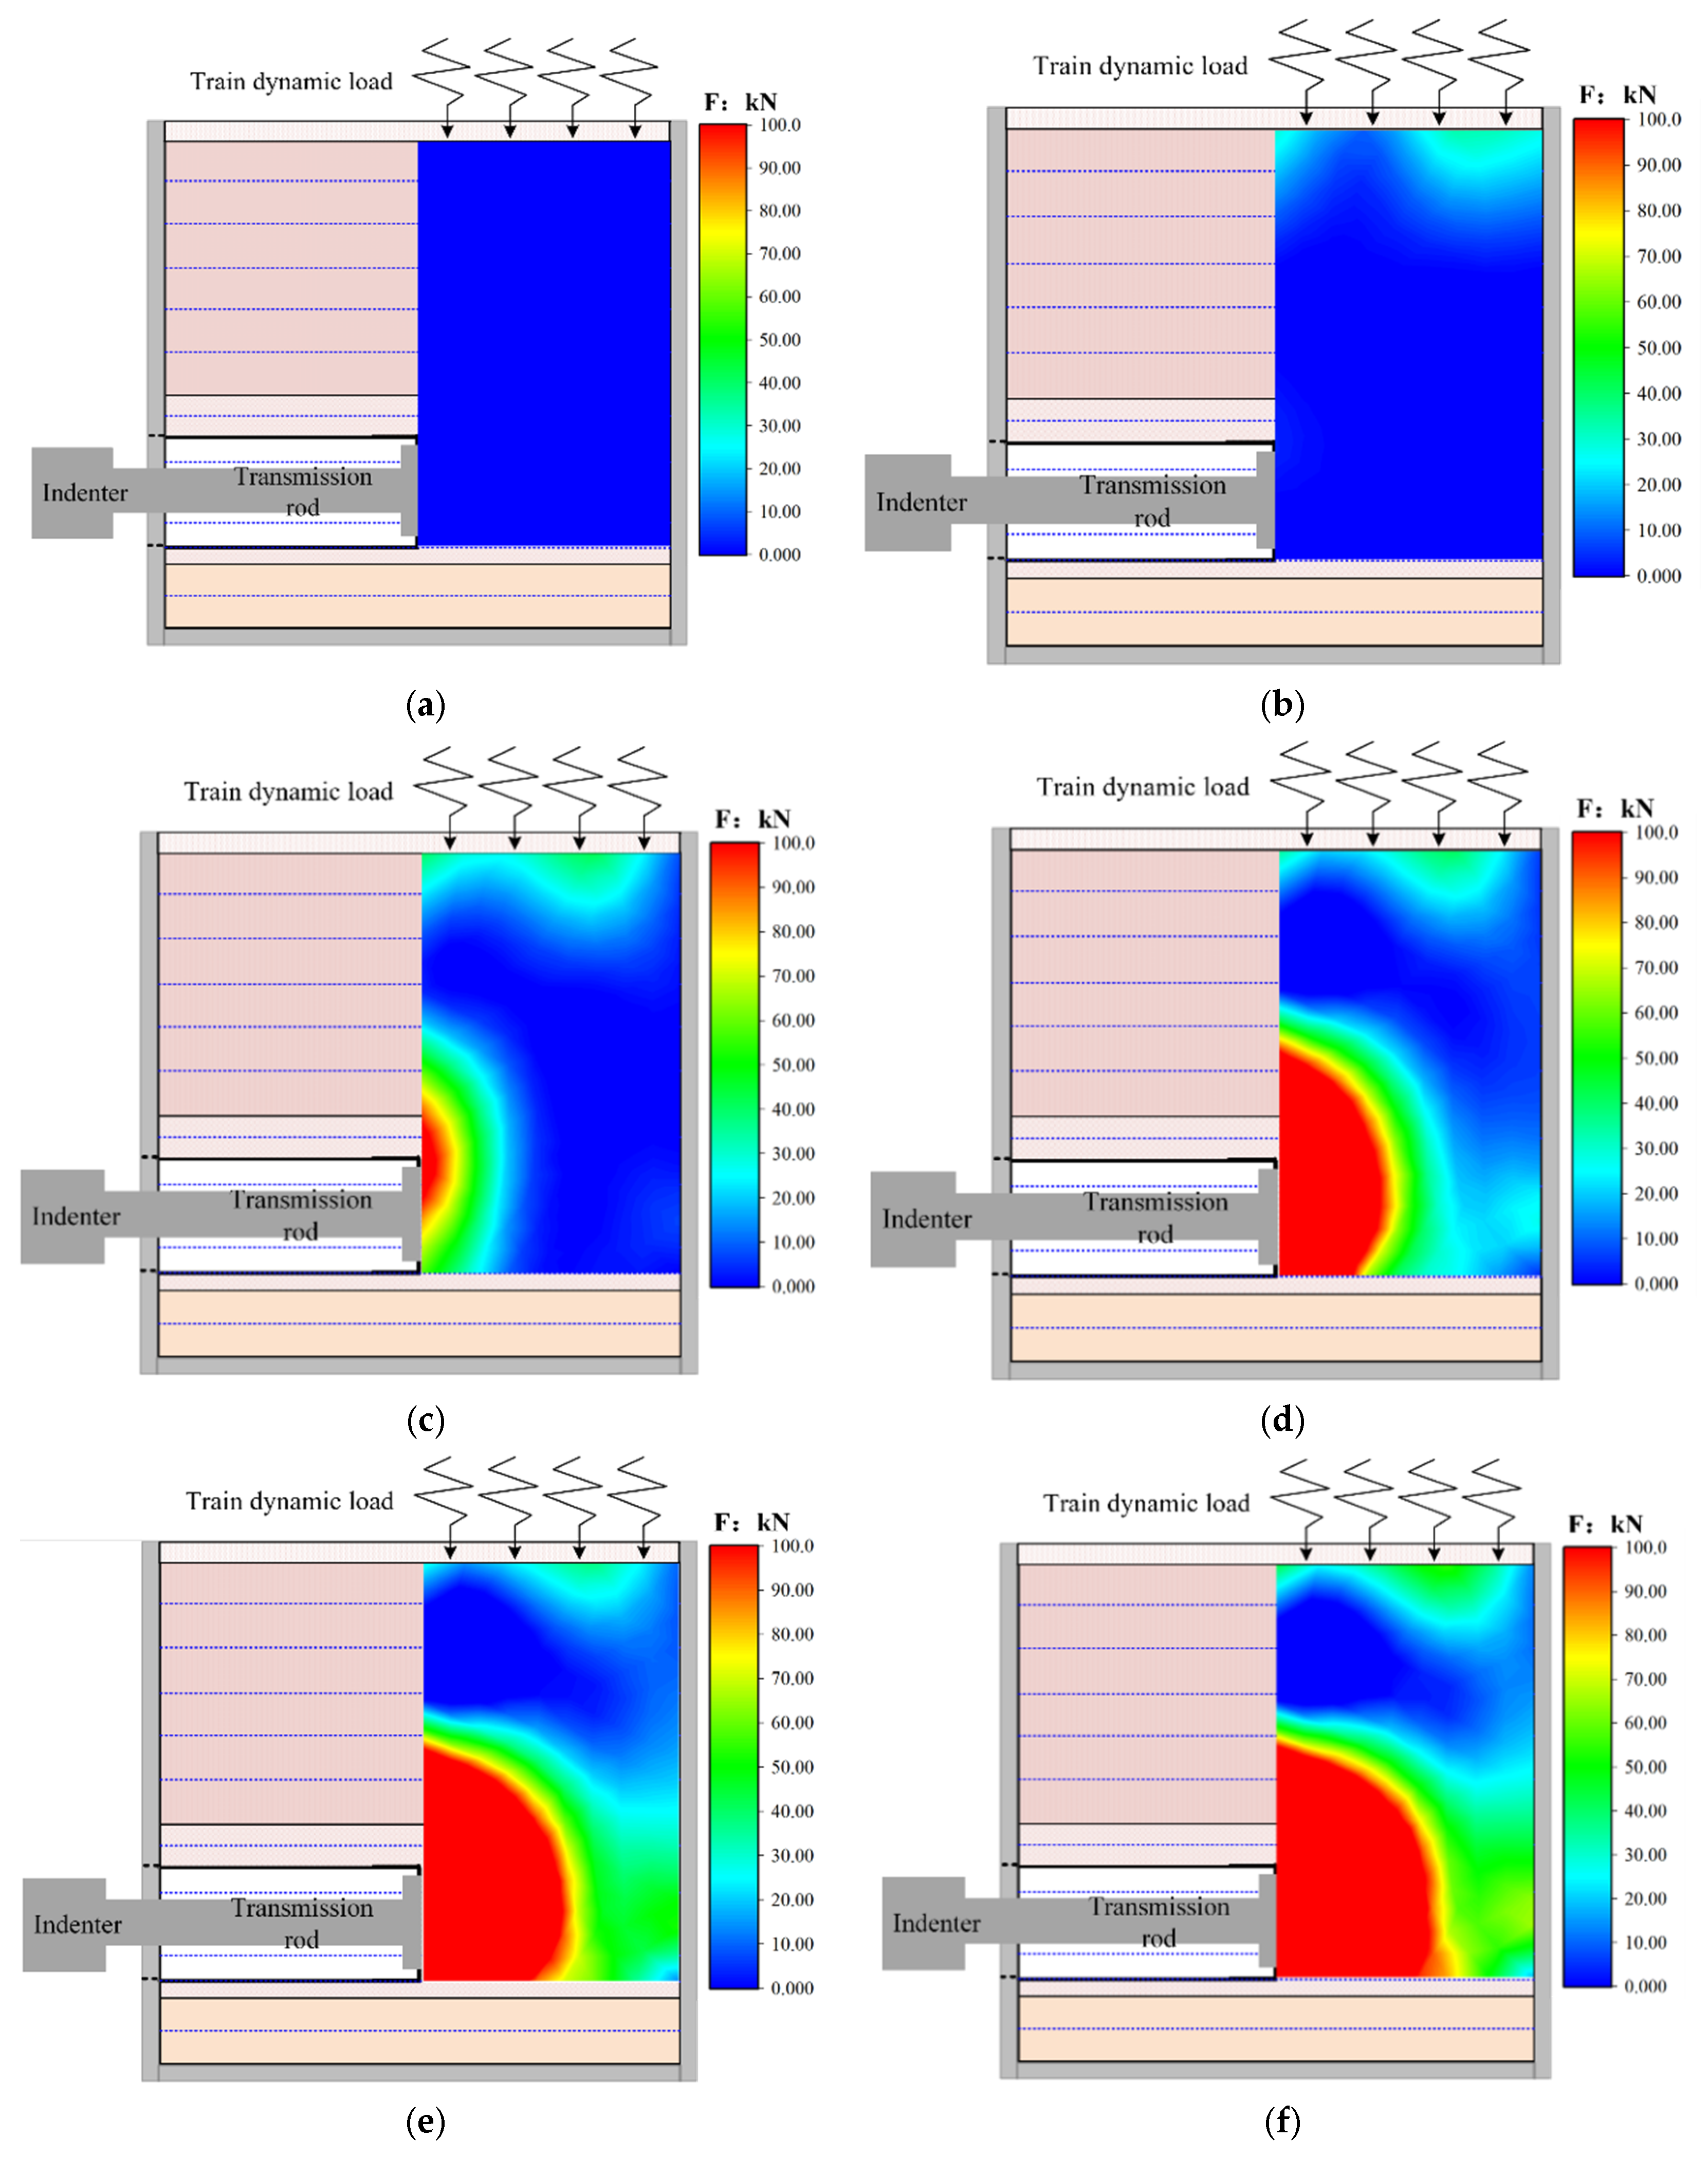
For condition 1, there was no train load in the upper part of the test model, and only the stratum dead weight acted on the tunnel face during shield tunneling. Therefore, only the influence of the thrust along the water level on the tunnel face during shield tunneling was considered during the test. In the test process, the hydraulic servo actuator of the slope stability system pushes the force transfer rod of the tunnel mold and then acts on the tunnel face, and the pressure and deformation characteristics of the tunnel face and the overlying ground layer during the process of the horizontal servo actuator are monitored using the earth pressure box and the 2D full-field strain measurement system. In the simulated shield driving process, the horizontal servo actuator adopts displacement control square propulsion, and the propulsion rate is 0.02 mm/s. In the process of propulsion, the horizontal thrust recorded on the computer of the slope stability control system is observed in real time. When the thrust suddenly drops, it is considered that the tunnel face is completely destroyed; the test is stopped immediately, the horizontal servo actuator is withdrawn, and all monitoring data are saved. Figure 18a shows the loading path of condition 1.
      (2)
Test condition 2: Load path
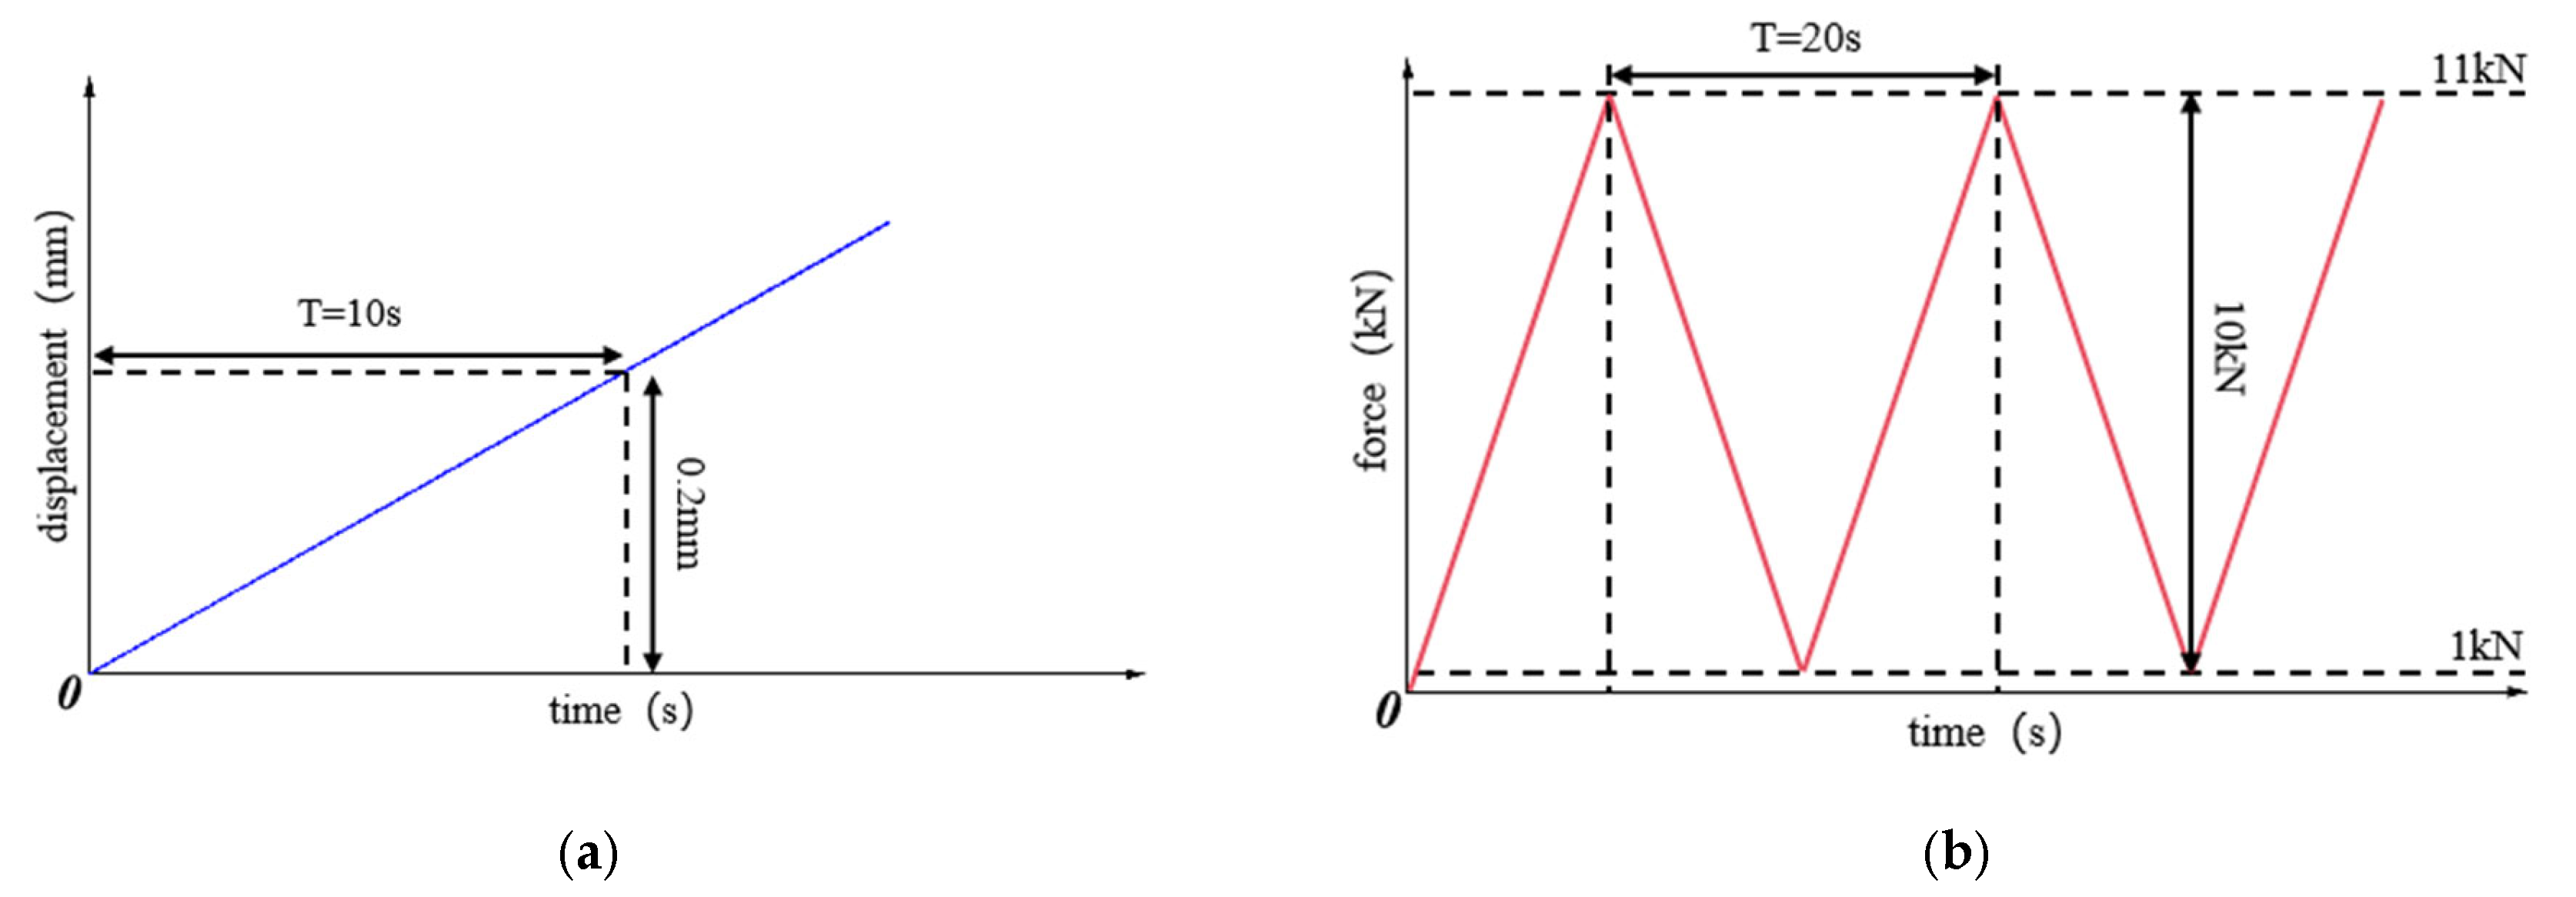
As for condition 2, the load of the Xulan high-speed railway train acted on the upper part of the test model, and the stratum dead weight during shield tunneling acted on the tunnel face. Therefore, the influence of horizontal thrust during shield tunneling and the passing load of a high-speed railway train on the tunnel face is taken into account during the test. During the test, the horizontal servo actuator of the slope stability system pushes the force transfer rod of the tunnel mold to act on the tunnel face, and the triangular waveform load is applied to the upper part of the test model through the vertical servo actuator to simulate the high-speed rail traffic load. The pressure and deformation characteristics of the tunnel face and overlying strata during horizontal servo actuator propulsion are monitored by the earth pressure box and the 2D full-field strain measurement system. In the simulated shield driving process, the hydraulic servo actuator adopts displacement control mode, and the advance rate is 0.02 mm/s. In the simulated train passing process, the vertical servo actuator adopts force control mode, and the loading rate is 1 kN/s, the maximum load is 11 kN, the minimum load is 1 kN, and the loading amplitude is 10 kN. The loading period is 20 s, and the loading frequency is 0.05 Hz. During the loading process of the horizontal servo actuator, the vertical servo actuator is loaded until the tunnel paw surface is stopped due to damage. The loading path of condition 2 is shown in Figure 18a,b. In the process of propulsion, the horizontal thrust recorded on the computer of the slope stability control system is observed in real time. When the thrust suddenly drops, it is considered that the tunnel face is completely destroyed; the test is stopped immediately, the horizontal and vertical servo actuators are withdrawn, and all monitoring data are saved.

3. Test Results

3.1. Tunnel Face Load and Internal Earth Pressure

According to the results of the horizontal displacement and load of the tunnel face, as monitored during the indoor scaling test of tunnel face stability, when no train passes through the surface, the tunnel face load changes in different stages with the advance of the shield, and the change stages can be divided into the load deceleration and growth stage, the stable growth stage, and the slight acceleration growth stage. The corresponding accelerated deformation, stable deformation, and unstable deformation stages are shown in Figure 19.
In the load deceleration growth stage, the load gradually decelerates and increases with the acceleration of the horizontal displacement of the tunnel face. When the displacement reaches 24.27 mm, the tunnel face load is 2.35 kN (66.53 kPa). Then, it enters the stage of steady growth, where the relationship between load and deformation is linear, and the growth rate remains constant. When the stable deformation reaches 61.35 mm, the load is 4.11 kN (116.35 kPa), indicating that the deformation enters the deceleration stage, and the load begins to accelerate and increase. In this process, it can be determined that the first critical load and the second critical load and displacement change from accelerating deformation to stable deformation and from stable deformation to unstable deformation, respectively. In the first stage, the soil mass is accelerated by compression deformation; in the second stage, the soil mass is moved and deformed as a whole; in the third stage, the soil mass on the tunnel face exceeds its limit deformation and is completely crushed.
Compared with the results of the influence of a single factor of shield propulsion on the tunnel face load and displacement, the basic process and trend of the tunnel face load-displacement curve under the coupling action of a shield-train load are similar, as shown in Figure 20, which can also be divided into the load deceleration and growth stage, steady growth stage, and the slightly accelerated growth stage. However, the slope of the load-displacement curve of the tunnel face under shield-train load coupling is larger, and the first and second critical loads and displacements are significantly greater than those under the influence of a single factor of shield-train propulsion. The first and second critical loads and displacements of the tunnel face under the coupling of shield and train loads are 5.42 kN (154.85 kPa) and 26.31 mm and 13.73 kN (387.83 kPa) and 80.20 mm, respectively.

3.2. Formation Stress Gradient Rule

(1)
Gradient rule of formation stress under no train vibration load
The study of the gradient law of the internal stress in the tunnel face caused by cutter head thrust during the shield driving process can provide an important basis for understanding the correlation between shield driving and stress formation. Figure 21 shows the gradient rule of stress on the face of the tunnel without a train vibration load under different processes. With the continuous advancement of the horizontal servo actuator, the pressure plate of the force transmission rod gradually moves towards the tunnel excavation direction face, and the soil surface of the tunnel face is gradually compressed; the influence range of the pressure inside the formation becomes more and more obvious. When the transmission rod is moved to 19 mm, the soil mass in the initial formation is relatively loose, which is mainly due to the compression and deformation of the loose soil, and the internal stress is small. With the process of the transmission rod moving in, the internal stress increases to 38 mm, and the maximum stress is mainly concentrated in front of the tunnel face. The maximum stress range extends to about 1 times the diameter of the tunnel at the top of the tunnel face, and when the process increases to 76 mm and 95 mm, the stress range extends to 2 times the diameter of the tunnel along the driving direction and 1.2 times the diameter in the vertical direction.
(2)
Gradient rule of formation stress under train vibration load
As can be seen from Figure 22, with the continuous advance of the horizontal servo actuator, the pressure plate of the force transmission rod gradually advances towards the tunnel excavation direction face, and the soil mass on the tunnel face is gradually compressed; the influence range of the pressure inside the formation becomes more and more obvious. Meanwhile, the stress phenomenon caused by the train load also appears in the upper stratum. When the rod is moved to 28 mm, due to the loose soil in the initial formation, the internal stress is small, but the train load causes a significant wavy stress range in the upper formation, which increases to 56 mm with the moving process of the rod, and the maximum stress appears in the range of one times the diameter in the horizontal direction and two times the diameter in the vertical direction in front of the tunnel face. When the process is further increased to 84 mm, the stress only increases along the horizontal direction, and the stress caused by vibration load becomes weak. When the process is increased to 112 mm and 140 mm, the stress range increases along the horizontal and vertical directions, and the stress caused by train vibration load also increases at 140 mm.

3.3. Progressive Damage Law of Tunnel Face

(1)
Condition 1: Without train dynamic load
The FreeDIC method proposed by Li Chengsheng et al. [25,26] was used to calculate the image of soil speckle deformation for the tunnel face. The failure characteristics of a tunnel face form the important basis for studying the stability of a tunnel face and the key to realizing its stability control. Based on the scale test results of shield tunneling, the progressive damage results of the tunnel face in different processes of shield tunneling without the influence of train vibration load are shown in Figure 23. With the advance of the force transmission rod, the soil mass in front of the tunnel face gradually deforms, and the deformation phenomenon becomes more and more significant; the influence range becomes larger and larger, extending from the semi-elliptical deformation range at the initial 19 mm mark to the semi-circular deformation range at 38 mm, and the deformation range expands along the tunnel excavation direction and vertical direction at the same time. There are two obvious deformation phenomena in front of the tunnel face, represented by the dark red area and the blue area in Figure 23, and the tunnel face mainly shows the form of cutting elliptic surface failure.
(2)
Condition 2: With train dynamic load
Figure 24 shows the progressive damage results of the tunnel face in different processes of a tunnel shield under the influence of train vibration load. The deformation process of the tunnel face is similar to that under the influence of no train vibration load. However, the deformation of the tunnel face under the influence of train vibration load is greater than that without its influence. Moreover, under the influence of train vibration load, the final damage to the soil surface of the tunnel is mainly in the form of a bull horn. Compared with Figure 23, it can be seen that the damage range of the tunnel face under the coupling action of shield-train load is larger than that under the influence of a single factor, e.g., shield.

3.4. Formation-Deformation Characteristics

Figure 25 shows the deformation results of strata in different processes under the influence of shield propulsion. It can be seen that only shield propulsion has no significant influence on the overall deformation of the strata, and the strata above the tunnel face hardly generate any deformation, while shield propulsion only causes local deformation to the soil in a small range in front of the tunnel face. The influence of shield propulsion on the strata above the tunnel face is very small, and the influence on the soil in front of the tunnel face is light.
Figure 26 shows the formation-deformation results under the influence of train vibration load and the shield propulsion process. As can be seen from Figure 26, under the influence of train vibration load, the strata near the track mainly deform along the vertical direction, showing obvious deformation zoning characteristics. When the shield advances 5 mm, 12 times the surface train load is applied. At this time, the soil deformation is mainly concentrated in the shallow formation area A, below the track, which is mainly caused by the track and is called the track influence zone (A), while the other areas are the no-influence zone (C2). With the increase in the shield advancing process to 20 mm, the deformation range of the track impact zone (A) expands. At the same time, the shield excavation impact zone (B) caused by the shield advancing appears near the tunnel face, which is called the shield excavation impact zone (B). When the shield advances further to 40 mm, the influence zone (A and B) of shield excavation further expands, and the common influence zone (C1) of shield excavation and train vibration load is caused by shield excavation and train vibration load. When the shield thrust increases to 60 mm, the impact zone (B) of shield excavation increases slightly, and the track impact zone (A), shield excavation impact zone (B), the joint shield excavation and train vibration load impact zone (C1), and no impact zone (C2) appear at the same time. In all subsequent processes, only the impact zone (B) of shield excavation increases significantly. The influence zone (C1) of shield tunneling and train vibration load decreases.

4. Limiting Support Force of the Tunnel Face

4.1. Stratigraphic Model

To further investigate the stability of shield tunnel faces in loess regions, a 3D formation model was reconstructed utilizing FLAC3D 6.0 numerical simulation software [27,28], as depicted in Figure 27. Given the symmetrical nature of the issue, only half of the model was developed, significantly reducing computational workload while still achieving the research objectives. Additionally, to address the complexity of modeling due to the multitude of strata and considering the similarities in stratum thickness and mechanical properties, certain strata were consolidated. Specifically, the mixed fill soil and the new loess layer #1 were modeled as a single stratum, streamlining the model without compromising the accuracy of the analysis. The stratum parameters are shown in Table 4.

4.2. Three-Dimensional Numerical Model

In the development of this model, it is assumed that the strata and ground are horizontal. Capitalizing on the tunnel’s symmetry, only a half-section of the tunnel was modeled. The numerical model spans dimensions of 50 m in length, 21 m in width, and 56 m in height. By taking hydrological conditions into account, the water level was situated at a depth of 42 m from the model’s base. Comprising approximately 74,100 zones and 79,894 grid points, the numerical model presumes that the strata conform to the Mohr-Coulomb strength criterion [29,30]. The boundary conditions were delineated as follows: (1) The upper boundary of the numerical model is unrestricted, while the lower boundary is fully constrained; (2) the model’s lateral boundaries are fixed solely in the normal direction, with the remaining directions being unimpeded. Post-excavation, a shell element was applied to the tunnel’s periphery to simulate the lining as a linear elastic shell element. Characterized by a Young modulus of 20 GPa, a Poisson ratio of 0.17, and a lining thickness of 0.3 m, the lining model is integral to the simulation’s fidelity. The simulation employs a single-step excavation method, with a primary focus on assessing the stability of the tunnel face. Throughout the numerical simulation in this study, the tunnel was incrementally formed through the excavation of 25 m sections at a time. This incremental approach facilitates a granular evaluation of the tunnel face stability at each critical juncture of the excavation process, ensuring a comprehensive understanding of the structural integrity under dynamic conditions.
The simulation here does not consider the influence of the excavation process on soil deformation, so the single-step excavation method was adopted in the numerical simulation. The “shell” unit was then installed on the soil around the excavated tunnel to simulate the lining. Then, a uniform support pressure (σN) was applied to the driving face to simulate shield thrust. The uniform support pressure is equal to the original horizontal earth pressure at the center of the tunnel face. In the numerical simulation, the support pressure gradually increases with the gradient σN/N, and N is the simulation number. Each calculation can obtain a set of shield thrusts and tunnel face center horizontal position movements (Si). After N times of simulation, we could obtain N groups of shield machine thrust and the corresponding horizontal displacement (Si).
According to the results of N times of simulation, the relationship between the thrust of the shield machine and the horizontal displacement (Si) of the corresponding tunnel face is obtained. With the decrease in thrust, σN, the horizontal displacement, Si, increases gradually. When the horizontal displacement suddenly increases under the thrust of a shield machine, the thrust of the shield machine at this time can be regarded as the maximum support pressure of the shield machine. Figure 28 shows the simulation flowchart.

4.3. Verification of Support Force of Shield Face

Based on the correlation between the horizontal displacement of soil and the uniform stress applied, the ultimate load of the tunnel can be ascertained. As the uniform horizontal thrust exerted on the tunnel face incrementally rises, the soil on the tunnel face undergoes compression and deformation. When the thrust is minimal, the soil on the face actively deforms inward towards the tunnel; conversely, when the thrust is substantial, the soil on the face is passively squeezed and deforms into the surrounding soil. Upon reaching a certain critical thrust, the soil deformation on the tunnel face undergoes a sudden shift from positive (negative) to negative (positive), or there is a sudden increase in the soil deformation on the tunnel face. This critical point is identified as the ultimate support force on the tunnel face.
Consequently, during the numerical simulation process, the horizontal displacement of the center point of the tunnel face along the tunnel axis was concurrently monitored under varying horizontal thrust conditions. The monitoring outcomes are illustrated in Figure 29.
In accordance with the displacement change patterns at the center point of the tunnel face under different horizontal thrusts, as obtained through the FLAC3D numerical simulation method, it can be deduced that when the horizontal thrust applied to the tunnel face reaches 350 kPa, the trend of horizontal displacement at the center point of the tunnel face inverts. Specifically, when the horizontal thrust is below 350 kPa, the horizontal displacement at the center point is positive, indicating that the soil mass on the tunnel face predominantly moves inward towards the tunnel. However, when the horizontal thrust exceeds 350 kPa, the horizontal displacement at the center point becomes negative. At this juncture, the soil mass on the tunnel face is passively compressed and deformed into the earth ahead of the tunnel face under the influence of the horizontal thrust. This observation preliminarily suggests that the limiting support force of the tunnel face exceeds 350 kPa.
As shown in Figure 30, as the uniform thrust applied to the tunnel face gradually increases from 0, the soil mass on the tunnel face first moves to the inside of the tunnel, and the displacement of the tunnel face is negative, which is because the stress applied to the face is not enough to support the self-weight of the soil mass on the face, and the face actively departs. When the uniform thrust exerted on the face of the tunnel further increases, the soil mass on the face of the tunnel compresses and degenerates inside the soil mass. At this time, the displacement of the face of the tunnel is positive because the stress exerted on the face can support not only the dead weight of the soil mass on the face but also the dead weight of the soil mass on the face. In addition, it breaks through the cohesive force of the soil, the sliding resistance generated at the middle section of the deformation process, and the passive deformation of the soil’s squeezing face. That is, when the stress exerted on the face increases to about 412 kPa, the horizontal displacement value of the tunnel face shows an obvious turning point, as shown in Figure 30 as the intersection points of the red inclined dashed line and the red near-horizontal dashed line. After that, when the uniform thrust applied on the tunnel face increases slightly, the horizontal displacement of the tunnel face increases substantially, as shown by the red dashed horizontal line in Figure 30. Therefore, the stress value that causes significant changes in the deformation state of the tunnel face can be defined as the ultimate support force of the tunnel face, and the ultimate support force of the tunnel face determined by the numerical model in this study is 412 kPa.

4.4. Tunnel Face Damage Characteristics

By utilizing the FLAC3D numerical simulation technique, the displacement contour diagrams corresponding to the tunnel face under two distinct working conditions are depicted in Figure 31. Throughout the numerical simulation process, the progressive evolution of the displacement isogram of the tunnel face across various computational steps was also captured. As the number of calculation steps increased, deformation initially manifested in the region directly ahead of the tunnel face and subsequently expanded forward. Prior to failure, a conspicuously red deformation zone emerged in the upper portion of the soil mass on the tunnel face. Post-failure, a deformation area of considerable extent also materialized in the lower part of the soil mass on the tunnel face. This observed phenomenon aligns closely with the sequence and location of cracks both above and below the tunnel face, as identified through scaled testing in this study.
The displacement characteristics of the tunnel face ascertained through the FLAC3D numerical simulation method are fundamentally in accord with the deformation evolution process of the tunnel face obtained via the large-scale test scheme proposed in this paper. This scheme was specifically designed to simulate the shield excavation process in a laboratory setting. The comparative results further substantiate that the large-scale scaled test put forth in this study is capable of effectively replicating the deformation characteristics of the tunnel face under the coupled influence of surface train loads and the shield excavation process. This congruence underscores the validity and applicability of both the numerical simulation and the scaled testing methods in elucidating the complex mechanical behaviors encountered during tunnel construction.

5. Conclusions

(1) By focusing on the stability of the tunnel face in composite formation shield tunnels beneath high-speed railway bases, a comprehensive test plan was devised. This plan takes into account the impacts of high-speed railway vibration loads and shield thrust on the stability of the tunnel soil, face, formation stress, deformation, and settlement. It is capable of intuitively replicating the formation-deformation characteristics influenced by shield and high-speed rail factors. The test plan presented herein enables research testing of the stability of tunnel faces in composite formation shield tunnels under high-speed railway base sections. The plan is proven to be feasible, and the test results are highly reliable.
(2) The ultimate support force of the tunnel face, as determined through indoor scaled testing, is 387.8 kPa. Meanwhile, the FLAC3D numerical simulation method yields an ultimate support force of 412 kPa. This value is strikingly close to the limit support force obtained via the indoor scaled test, with a difference of 6.2%, indicating that the indoor scaled test model constructed in this study effectively predicts and evaluates the tunnel face failure characteristics and limit support force.
(3) In laboratory-based similar model tests, different initial conditions may affect the test results. If the strength of the model material does not match that of the prototype, the stress distribution and failure mode may be distorted. The loading rate directly affects the stress-strain response and time-dependent behavior of the material. Fast loading may cause the material to behave in a brittle manner, ignoring time-dependent deformation (e.g., creep, consolidation). Slow loading allows time-dependent deformation to develop closer to actual conditions. The boundary condition is the key to simulating the actual condition in the model test, and its change will significantly affect stress distribution and deformation behavior. Rigid boundaries can lead to stress concentration, affecting stress distribution and failure modes. A flexible boundary can better simulate the actual working conditions, but it is difficult to design and realize.
(4) The variations in tunnel face load during shield excavation can be categorized into three distinct phases: the deceleration and growth stage, the stable growth stage, and the slight acceleration stage. Tunnel face load and displacement can be further divided into the first and second critical loads and displacements. The tunnel face predominantly exhibits a horn-like failure feature. However, the damage range of the tunnel face under train load conditions is significantly more extensive than in the absence of train loads. In the initial phase of shield propulsion, the damage range of the tunnel face is primarily characterized by an increase in the width of the horizontal damage area. As the process progresses, both the width and height of the damaged area expand.
(5) Laboratory-based similar model tests serve as a dependable methodology for studying the influence of overlying high-speed rail dynamic loads on the stability of shield tunnel faces during excavation. Through this experimental approach, a more precise comprehension of the actual response characteristics of the strata during shield tunneling can be achieved, with particular emphasis on the deformation and potential instability of the tunnel face under the influence of dynamic load. This research can provide a reliable basis for determining safe shield thrust in the design and construction of similar projects and offer important references for adjusting the design of tunneling parameters during the shield tunneling process.

Author Contributions

Conceptualization, Y.P. and H.L.; methodology, Y.P.; software, Y.P. and G.M.; validation, Y.P., H.L. and P.C.; formal analysis, Y.P.; investigation, Y.P.; resources, P.C.; data curation, H.L.; writing—original draft preparation, Y.P. and H.L.; writing—review and editing, Y.P. and H.L.; visualization, Y.P.; supervision, H.L. and P.C.; project administration, H.L. and P.C.; funding acquisition, H.L. All authors have read and agreed to the published version of the manuscript.

Funding

This paper gets its funding from Projects (42277175) supported by National Natural Science Foundation of China.

Institutional Review Board Statement

On behalf of all authors, the corresponding author states that there is no conflict of interest. This article does not contain any studies with human participants or animals performed by any of the authors.

Informed Consent Statement

Not applicable.

Data Availability Statement

The data used to support the findings of this study are available from the corresponding author upon request.

Acknowledgments

This paper received funding from Projects (42277175) supported by the National Natural Science Foundation of China. The authors wish to acknowledge this support.

Conflicts of Interest

The authors declare no conflicts of interest.

References

  1. Han, Y.; Xu, Q.; Cui, Y. Deformation of Existing Shield Tunnel Adjacent to Deep Excavations: Simulation and Monitoring Analysis. Appl. Sci. 2024, 14, 4153. [Google Scholar] [CrossRef]
  2. Gan, X.; Liu, N.; Bezuijen, A.; Gong, X. Random Responses of Shield Tunnel to New Tunnel Undercrossing Considering Spatial Variability of Soil Elastic Modulus. Appl. Sci. 2024, 14, 3949. [Google Scholar] [CrossRef]
  3. Chen, G.H.; Zou, J.F.; Guo, Y.C.; Tan, Z.A.; Dan, S. Face stability assessment of a longitudinally inclined tunnel considering pore water pressure. Int. J. Numer. Anal. Methods Geomech. 2024, 48, 3725–3747. [Google Scholar] [CrossRef]
  4. Georgiou, D.; Kalos, A.; Kavvadas, M. 3D Numerical Investigation of Face Stability in Tunnels with Unsupported Face. Geotech. Geol. Eng. 2022, 40, 355–366. [Google Scholar] [CrossRef]
  5. An, Y.L.; Zhou, J.; Ouyang, P.B.; Li, J.H. Analysis of tunnel face stability with advanced pipes support. J. Cent. South Univ. 2021, 28, 604–617. [Google Scholar] [CrossRef]
  6. Ter-Martirosyan, A.Z.; Anzhelo, G.O.; Rud, V.V. The Influence of Metro Tunnel Construction Parameters on the Settlement of Surrounding Buildings. Appl. Sci. 2024, 14, 6435. [Google Scholar] [CrossRef]
  7. He, J.; Yang, Z.; Zhang, X. Effect of Undercrossing Shield Tunnels Excavation on Existing Rectangular Pipe-Jacking Tunnels. Appl. Sci. 2023, 13, 12235. [Google Scholar] [CrossRef]
  8. Ter-Martirosyan, A.Z.; Cherkesov, R.H.; Isaev, I.O.; Shishkina, V.V. Surface Settlement during Tunneling: Field Observation Analysis. Appl. Sci. 2022, 12, 9963. [Google Scholar] [CrossRef]
  9. Kamata, H.; Mashimo, H. Centrifuge model test of tunnel face reinforcement by bolting. Tunn. Undergr. Space Technol. 2003, 18, 205–212. [Google Scholar] [CrossRef]
  10. Pham, K.D.; Otani, J.; Watanabe, Y.; Mukunoki, T. Application of X-Ray CT on Boundary Value Problems in Geotechnical Engineering: Research on Ground Failure Due to Lateral Pile Loadings. In GeoCongress 2006: Geotechnical Engineering in the Information Technology Age; American Society of Civil Engineers: Reston, VA, USA, 2012; pp. 1–6. [Google Scholar]
  11. Kirsch, A. Experimental investigation of the face stability of shallow tunnels in sand. Acta Geotech. 2010, 5, 43–62. [Google Scholar] [CrossRef]
  12. Fellin, W.; King, J.; Kirsch, A.; Oberguggenberger, M. Uncertainty modelling and sensitivity analysis of tunnel face stability. Struct. Saf. 2010, 32, 402–410. [Google Scholar] [CrossRef]
  13. Idinger, G.; Aklik, P.; Wu, W.; Borja, R.I. Centrifuge model test on the face stability of shallow tunnel. Acta Geotech. 2011, 6, 105–117. [Google Scholar] [CrossRef]
  14. Li, S.C.; Liu, H.L.; Li, L.P.; Zhang, Q.Q.; Wang, K.; Wang, K. Large scale three-dimensional seepage analysis model test and numerical simulation research on undersea tunnel. Appl. Ocean Res. 2016, 59, 510–520. [Google Scholar] [CrossRef]
  15. Di Prisco, C.; Flessati, L.; Frigerio, G.; Castellanza, R.; Caruso, M.; Galli, A.; Lunardi, P. Experimental investigation of the time-dependent response of unreinforced and reinforced tunnel faces in cohesive soils. Acta Geotech. 2018, 13, 651–670. [Google Scholar] [CrossRef]
  16. Huang, J.; Yuan, T.; Peng, L.; Yu, J.; Ding, Z. Model test on dynamic characteristics of invert and foundation soils of high-speed railway tunnel. Earthq. Eng. Eng. Vib. 2015, 14, 549–559. [Google Scholar] [CrossRef]
  17. Fei, R.; Peng, L.; Zhang, C.; Zhang, J.; Zhang, P. Experimental and Numerical Studies of a Shield Twin Tunnel Undercrossing the Existing High-Speed Railway Tunnel. Geotech. Geol. Eng. 2024, 42, 1871–1886. [Google Scholar] [CrossRef]
  18. Liu, Z.; Ma, X.; Chi, J.; Chen, Y.; Wang, C. Centrifuge model tests and numerical simulation on ground-borne vibration propagating and vibration reduction scheme for tunnel inner structure. Tunn. Undergr. Space Technol. 2024, 153, 105996. [Google Scholar] [CrossRef]
  19. Yang, W.C.; Wang, J.; Deng, E.; Liu, Y.K.; Luo, L.S.; Yang, J. A hybrid ventilation scheme applied to bi-directional excavation tunnel construction with a long inclined shaft. J. Cent. South Univ. 2024, 31, 3187–3205. [Google Scholar] [CrossRef]
  20. Bian, W.H.; Yang, J.; Zhu, C.; Wang, K.X.; Xu, D.M. Application of excavation compensation method for enhancing stability and efficiency in shallow large-span rock tunnels. J. Cent. South Univ. 2024, 31, 3242–3263. [Google Scholar] [CrossRef]
  21. Zhang, X.; Lin, Y.; Pan, Z.; Jiang, X. Risk assessment of water inrush in deep-buried karst tunnel with rich water based on combined weighting method. Earth Sci. Inform. 2025, 18, 28. [Google Scholar] [CrossRef]
  22. Liu, Y.; Cheng, X.; Sun, H.; Ding, K.; Wei, Q.; Ding, H. Disturbance characteristics test about double-line shield tunnel excavation in grouting-reinforced water-rich sand stratum. Eng. Res. Express 2024, 6, 025120. [Google Scholar] [CrossRef]
  23. Liu, X.Y.; Gan, X.Y.; Shao, C.; Wang, Y.D.; Cong, Q.M. CNN-GRU-Based intelligent online prediction of screw machine rotation speed for Earth pressure balance shield machine. Eng. Res. Express 2022, 4, 045021. [Google Scholar] [CrossRef]
  24. Dumka, P.; Chauhan, R.; Singh, A.; Singh, G.; Mishra, D. Implementation of Buckingham? s Pi Theorem Using Python. Adv. Eng. Softw. 2022, 173, 103232. [Google Scholar] [CrossRef]
  25. Li, C.; Kong, L.; Zhang, B.; Liu, Z.; Shu, R.; Li, T. Determination of damage evolution characteristics in granite residual soil shear bands by micro-CT-based advanced digital volume correlation. Eng. Geol. 2024, 333, 107505. [Google Scholar] [CrossRef]
  26. Li, C.; Shu, R. Accurate and simple digital volume correlation using pre-interpolation. Meas. Sci. Technol. 2020, 31, 095201. [Google Scholar] [CrossRef]
  27. Ren, K.; Jiang, A.; Guo, X.; Min, Q. Research on Optimization Design of Tunnel Blasting Scheme Adjacent to Buildings. Appl. Sci. 2023, 13, 11509. [Google Scholar] [CrossRef]
  28. Dong, Y.; Zhang, H.; Zhu, Z.; Zhu, Y. Numerical Simulation Method for Tunnel Excavation Considering Mechanical Characteristic Variation of Soft Rock with the Confining Pressure Influence. Appl. Sci. 2023, 13, 7305. [Google Scholar] [CrossRef]
  29. Wang, Z.; Lin, H.; Cheng, Y. Upper limit analysis for seismic sliding stability of double-sided limited narrow slope retaining wall. Earth Sci. Inform. 2024, 18, 131. [Google Scholar] [CrossRef]
  30. Pan, J.; Tang, Y.; Yuan, W.; Luo, J.; Chen, Y.; Lin, H. A method for automatically identifying the shape of locking sections in slopes. Environ. Earth Sci. 2024, 83, 243. [Google Scholar] [CrossRef]
Figure 1. Scale test equipment diagram.
Applsci 15 02567 g001
Figure 2. Tunnel scale test specimen mold (physical drawing).
Applsci 15 02567 g002
Figure 3. Tunnel scale test mold structure (three views).
Applsci 15 02567 g003
Figure 4. Rail model diagram.
Applsci 15 02567 g004
Figure 5. Rail model (physical drawing).
Applsci 15 02567 g005
Figure 6. Layout plan of earth pressure box.
Applsci 15 02567 g006
Figure 7. New loess.
Applsci 15 02567 g007
Figure 8. Fine sand.
Applsci 15 02567 g008
Figure 9. Silty clay and its treatment process in Xi’an subway tunnel site.
Applsci 15 02567 g009
Figure 10. Cement-soil-making process.
Applsci 15 02567 g010
Figure 11. Gravel bedding.
Applsci 15 02567 g011
Figure 12. Test flowchart.
Applsci 15 02567 g012
Figure 13. Sample preparation process.
Applsci 15 02567 g013
Figure 14. Buried version of earth pressure box.
Applsci 15 02567 g014
Figure 15. Prepared test model.
Applsci 15 02567 g015
Figure 16. Tunnel scale test site equipment layout.
Applsci 15 02567 g016
Figure 17. Effect of train vibration load: (a) No train movements; (b) train movements.
Applsci 15 02567 g017
Figure 18. Load path: (a) condition 1; (b) condition 2.
Applsci 15 02567 g018
Figure 19. Load-displacement curve and critical load of the tunnel under shield.
Applsci 15 02567 g019
Figure 20. Load-displacement curve and critical load of tunnel face under coupled shield-train load.
Applsci 15 02567 g020
Figure 21. The stress gradient of the tunnel face without train vibration load in different processes: (a) 0 mm; (b) 19 mm; (c) 38 mm; (d) 57 mm; (e) 76 mm; (f) 95 mm.
Applsci 15 02567 g021
Figure 22. The stress gradient of the tunnel face under train vibration load in different processes: (a) 0 mm; (b) 28 mm; (c) 56 mm; (d) 84 mm; (e) 112 mm; (f) 140 mm.
Applsci 15 02567 g022
Figure 23. Condition 1: tunnel face progressive damage: (a) 0 mm; (b) 19 mm; (c) 38 mm; (d) 57 mm; (e) 76 mm; (f) 95 mm.
Applsci 15 02567 g023aApplsci 15 02567 g023b
Figure 24. Condition 2: progressive damage of tunnel face: (a) 0 mm; (b) 28 mm; (c) 56 mm; (d) 84 mm; (e) 112 mm; (f) 140 mm.
Applsci 15 02567 g024aApplsci 15 02567 g024b
Figure 25. Formation-deformation characteristics under the influence of different shield processes. (a) 0 mm; (b) 5 mm; (c) 20 mm; (d) 40 mm; (e) 60 mm; (f) 80 mm.
Applsci 15 02567 g025aApplsci 15 02567 g025b
Figure 26. Formation-deformation characteristics for different processes under train vibration load: (a) 0 mm; (b) 5 mm; (c) 20 mm; (d) 40 mm; (e) 60 mm; (f) 80 mm.
Applsci 15 02567 g026
Figure 27. Three-dimensional formation model of shield excavation.
Applsci 15 02567 g027
Figure 28. Flowchart of tunnel face stability simulation.
Applsci 15 02567 g028
Figure 29. Horizontal displacement of tunnel face center point under different shield thrust: (a) 0–418 kPa; (b) 200–412 kPa.
Applsci 15 02567 g029
Figure 30. Horizontal displacement of tunnel face center point under different shield thrust.
Applsci 15 02567 g030
Figure 31. Cloud picture of displacement in front of tunnel face. (a) Before failure without train dynamic load. (b) After failure without train dynamic load. (c) Before failure with train dynamic load. (d) After failure with train dynamic load.
Applsci 15 02567 g031aApplsci 15 02567 g031b
Table 1. Test system dimension matrix.
Physical Quantity MLT
E a 1 1−1−2
ρ a 2 1−30
σ a 3 1−1−2
ε a 4 000
Δ a 5 010
v a 6 01−1
a a 7 01−2
t a 8 001
f a 9 00−1
Table 2. π matrix.
Table 2. π matrix.
Dimensionless Factor π Corresponding Power Index of Different Physical Quantities
a1a2a3a4a5a6a7a8a9
EρσεΔv a tf
π 1 −110020002
π 2 −101000000
π 3 000100000
π 4 0000−1100−1
π 5 0000−1010−2
π 6 000000011
Table 3. Similarity relationship between engineering prototype and indoor similar model.
Physical QuantitySymbolSimilarity Ratio
Geometric dimensionCL20
DensityCρ1
Elasticity modulusCE1
StrainCε1
StressCσ1
DisplacementCΔ20
VelocityCv1
Accelerated velocityCa0.05
TimeCt20
FrequencyCf0.05
Table 4. Stratum parameter.
StratumThickness (m)Density (kg/m3)E (MPa)c/kPaφ (°)ν
Yellow stratum #14174013.0024.019.00.23
Yellow stratum #28194014.0024.420.00.30
Paleosol stratum5188011.2027.620.10.32
Silty clay stratum10189015.6033.723.20.28
Fine sand stratum2202025.240.030.50.25
Medium sand stratum27206031.000.031.10.25
Disclaimer/Publisher’s Note: The statements, opinions and data contained in all publications are solely those of the individual author(s) and contributor(s) and not of MDPI and/or the editor(s). MDPI and/or the editor(s) disclaim responsibility for any injury to people or property resulting from any ideas, methods, instructions or products referred to in the content.

