Abstract
The torsion beam, integral to rear suspension systems in vehicles, is a critical component where strength and durability must be prioritized in specific regions. To enhance the strength of these regions, induction hardening, a localized heat treatment method, is employed. However, the application of this treatment introduces distortion, which compromises the precision of welding between components and raises significant concerns about product quality and safety. To address these challenges, the present study introduces a front-end analysis process for induction hardening aimed at predicting distortion following heat treatment. A three-dimensional model of the product was utilized to simulate the front-end process of induction hardening. A coupled analysis of electrical and thermal fields was conducted to replicate the heating effect induced by coils during the heat treatment process. Additionally, a thermo-structural coupled analysis was performed to predict the distortion occurring during the cooling phase. A comparative analysis with actual product measurements demonstrated that the proposed method achieved a distortion displacement prediction accuracy of 98%, thereby validating the efficacy of the proposed analysis process.
1. Introduction
1.1. Research Background
The coupled torsion beam axle (CTBA) is a critical component in automotive engineering, necessitating high strength and durability. It is primarily utilized in rear suspension systems to support the vehicle’s weight and endure forces encountered during driving, thereby ensuring a stable and reliable ride. These operational demands require exceptional strength and durability, particularly in regions subjected to concentrated external loads [1]. Traditional manufacturing processes, such as hot press forming and heat treatment, are commonly employed to fulfill these stringent requirements. Hot press forming involves shaping metal at elevated temperatures, followed by rapid cooling to enhance material strength. While effective in improving the overall strength of a component, this process is time-intensive and cost-prohibitive. Furthermore, because only specific regions of the torsion beam endure significant loading, enhancing the strength of the entire component through hot press forming results in inefficiencies [2]. As an alternative, induction hardening has garnered significant attention due to its ability to selectively treat specific regions of a component. Induction hardening operates on the principle of electromagnetic induction, wherein high-frequency current passing through a coil generates induced currents that facilitate rapid heating of targeted areas. This method is not only efficient, but also allows for precise and selective heating, rendering it an appealing alternative to conventional approaches [3].
Despite its advantages, the induction hardening process inherently produces non-uniform temperature distributions, which can lead to thermal deformation such as distortion. These distortions compromise the quality and integrity of the final product [4,5]. Therefore, designing an optimized induction hardening process that minimizes distortion is crucial to maintaining product quality and performance.
1.2. Literature Review
Experimental methodologies can be employed to design optimal processes; however, limitations related to time and cost restrict their effectiveness in deriving optimal solutions solely through experimentation. Consequently, recent research has shifted its focus toward predictive and optimization studies of induction hardening processes using analytical methods that incorporate various physical factors.
Hatem [6] performed coupled electromagnetic-thermal analysis to investigate the interaction between electromagnetic fields and temperature during induction hardening. This study demonstrates that the geometry of the coil and the associated current parameters significantly influence heating efficiency. Similar investigations employing electromagnetic-thermal coupling have been conducted by several researchers. For instance, Javaheri et al. [7] and Tong et al. [8] adopted multiphysical approaches to predict temperature distributions and deformations occurring during the heat treatment of metallic materials. Their research provided insights into the thermal effects induced by electromagnetic heating on material microstructures and phase transformations.
Furthermore, Ferguson et al. [9] extended this scope by conducting a coupled electromagnetic-thermal-structural analysis to examine the stresses and deformations generated during induction hardening. Their findings highlight the critical impact of temperature-induced residual stresses and deformations on the quality and performance of the final product.
Recent advancements have also focused on the sensitivity of material parameters and the optimization of process conditions through numerical simulations. Mühl et al. [10] performed a sensitivity analysis using a coupled electromagnetic-thermal model to evaluate the effects of material parameters and surface conditions on the induction hardening process. Their study emphasized the importance of accurate material data and surface preparation to achieve optimal hardening outcomes. Additionally, studies on induction cladding, such as those by Shokouhmand et al. [11], have provided valuable insights into the thermal and electromagnetic interactions during the coating process, demonstrating the benefits of simulation for optimizing energy efficiency and coating quality. These studies highlight how numerical analysis is evolving to optimize complex physical interactions, improving both simulation accuracy and process efficiency.
1.3. Motivation and Novelty
Existing studies have employed various numerical analysis and simulation techniques to predict and control the electromagnetic, thermal, and structural deformations that occur during induction hardening. However, these approaches face significant limitations, such as insufficient consideration of structural deformations that arise after heat treatment and the exclusion of phase transformations induced by the process. Moreover, most analyses have been conducted on two-dimensional (2D) models, which fail to fully capture the complex characteristics of three-dimensional (3D) geometries.
To address these limitations, this study proposes an induction hardening analysis process specifically designed for 3D geometries. Unlike previous studies that primarily focused on simplified models, this research aims to develop a predictive methodology applicable to induction hardening and quenching processes for workpieces with complex geometries. Furthermore, the proposed methodology is validated through a comparison with actual product measurements. By applying induction hardening to specific regions of the CTBA, this study seeks to improve the accuracy of localized strength and distortion predictions.
Additionally, this study leverages the advantages of 3D analysis by simulating key phenomena such as deformation caused by hardness changes and the quenching phase, replicating real-world induction hardening conditions more accurately. Ultimately, this research presents a validated approach that enhances the reliability of induction hardening simulations for complex geometries.
2. Multiphysics-Coupled Analysis-Based Induction Hardening Process
2.1. Fundamental Theories of Electromagnetic-Thermal Interaction
2.1.1. Joule Heating Theory
Joule heating occurs when electrical current flows through a resistive material, generating heat as electrons collide with the atoms of the material. This phenomenon can be quantified as the power per unit volume using Equation (1).
Here, is the energy loss due to electrical forces in the electric field, V is the volume, is the current density, and E represents the electric field. For a conductor with conductivity σ, Ohm’s Law relates current density J and electric field E, as expressed in Equation (2). Substituting Equation (2) into Equation (1), the power density per unit volume due to Joule heating is expressed as Equation (3). In this context, J is the simplified current density term [12].
2.1.2. Induction Heating Theory
Induction heating involves two primary losses: resistive (ohmic) loss and hysteresis loss. Resistive loss arises from current flow in conductive materials and is described by Equation (4).
Hysteresis occurs in magnetic materials due to cyclic magnetization and demagnetization:
Here, the hysteresis loss is the energy efficiency (hysteresis loss coefficient), f is the frequency, is the maximum magnetic flux density, and V is the volume of the core. Figure 1 illustrates the direction and pattern of the magnetic field generated around the material being heated. As shown, high-frequency induction heaters utilize the loss caused by eddy currents and hysteresis loss to generate heat rapidly, amounting to the loss shown in Equation (11).
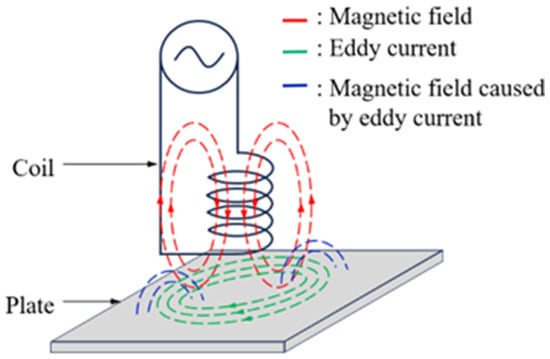
Figure 1.
Direction and shape of surrounding magnetic field due to heated object and magnetic field.
2.1.3. Skin Effect Theory
The skin effect refers to the tendency of the electrical current to concentrate near the surface of a conductor, leading to a decrease in current density toward the interior. The penetration depth (δ), where the current density drops to 1/e (approximately 36.8%) of its surface value, is a function of the angular frequency (ω), permeability (μ), and resistivity (ρ) of the conductor, expressed in Equation (10). As resistivity (ρ) is inversely proportional to conductivity (σ), it can be rewritten as Equation (11). Angular frequency (ω) is a function of the frequency (f), as expressed in Equation (12). Substituting Equations (12) and (13) into Equation (10), the final expression for penetration depth is derived as in Equation (14) [13,14].
The skin effect’s importance increases with frequency, as higher frequencies lead to smaller penetration depths, making the surface current concentration more significant. This relationship is crucial for optimizing induction heating systems.
2.1.4. Current Distribution
The distribution of electric current within the workpiece during induction heating follows an exponential decay as the depth increases from the surface. This phenomenon can be described using the current distribution equation, where f(r) represents the current density at a given depth r and fs is the current density at the surface. The penetration depth δw, as previously defined, governs the rate of this decay [13,14].
This equation illustrates that current density decreases exponentially with depth, indicating that most of the induced current—and, consequently, the generated heat—is concentrated near the surface of the workpiece. The proper selection of operating frequency ensures that sufficient current penetration is achieved for uniform heating.
2.2. Multiphysics-Coupled Analysis
Induction hardening involves two primary phases: the heating phase, during which a workpiece is heated using electricity applied to a coil, and the quenching phase, where the heated workpiece is rapidly cooled in water. During the heating phase, interactions such as electromagnetic and thermal effects are analyzed using distinct solvers within a unified simulation platform. Electromagnetic interactions, which involve the application of a current, are addressed using an electromagnetic solver. Thermal interactions, including heat transfer and thermal stress generated during heating and cooling, are analyzed using a thermal solver. Structural interactions, such as deformation resulting from temperature variations, are evaluated using a structural solver. Given that structural deformations caused by induction hardening require a comprehensive analysis of all these interactions, a multiphysics-coupled approach is indispensable.
Moreover, because induction hardening involves temperature changes exceeding 1000 °C, it is crucial to incorporate material properties that dynamically adapt to temperature variations in real time to ensure accuracy. Traditional electromagnetic-thermal coupled analyses are typically conducted using a one-way coupling method, as depicted in Figure 2a. In this method, results from one analysis are sequentially passed to the subsequent analysis, limiting the ability to capture real-time changes in temperature-dependent properties. To address these limitations, this study employs a two-way coupling method, illustrated in Figure 2b. This method enables real-time data exchange among electromagnetic, thermal, and structural analyses, thereby accurately capturing the dynamic effects of temperature on material properties, such as electrical conductivity.
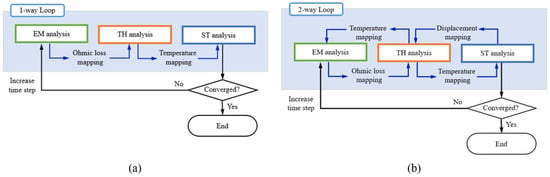
Figure 2.
Process flowchart of multiphysics coupling analysis through one-way and two-way loops. (a) One-way coupling approach (b) Two-way coupling approach.
However, the two-way coupling method significantly increases computational resource requirements and complexity, particularly as the number of coupled interactions grows. This added complexity may also result in convergence issues that are proportional to the intricacy of the interactions. FE results were obtained using a NVIDIA DGX STATION (Future Automotive Intelligent Electronics Core Technology Center, Cheonan, Republic of Korea).
To validate the accuracy of this multiphysics-coupled model, experimental comparisons were conducted. The simulated temperature distribution matched well with infrared camera measurements, as shown in Figure 3. This ensures reliable predictions for future optimization.
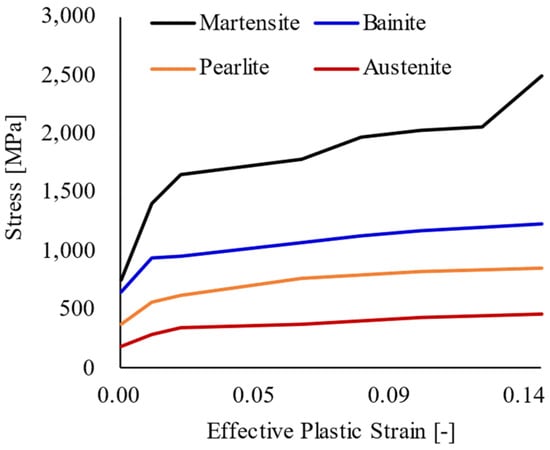
Figure 3.
Hardness variation of boron steel according to phases.
2.3. Phase Transformation Analysis
The primary principle of high-frequency heat treatment involves strengthening materials by inducing a martensitic phase transformation during rapid cooling following high-temperature heating. If heating is not conducted appropriately or cooling methods are inadequate, an undesired austenite phase transformation may occur, resulting in reduced strength and deformation. To address this issue, the analysis incorporates the effect of phase transformations on material hardness.
In this study, the simulation software LS-Dyna4.11 employs the MAT-244 material card to account for phase transformations [15]. This material card calculates phase ratios based on temperature values using a Continuous Cooling Transformation (CCT) diagram. It also integrates flow curves, as illustrated in Figure 3, to compute strain values according to the stress characteristics of each phase for structural analysis. By considering phase transformations, the simulation accurately captures changes in phase distribution during the heating and cooling processes. This approach enables precise calculations of deformation based on variations in material hardness across different regions of the component. The strain induced by phase transformations is critical for predicting residual stresses and can be calculated using Equation (16).
Accurate modeling of this strain ensures better predictions of distortion and residual stress during quenching.
2.4. Finite Element Analysis (FEA)
The model utilized in this study simplifies the actual geometry of the CTBA and the induction heating coil setup. While real induction heaters consist of multiple components in addition to the coil and the CTBA, their effects on the simulation are considered negligible and were therefore excluded from the analysis model. Although the actual CTBA exceeds 1200 mm in length, simulating the entire geometry would significantly increase computational time and hinder convergence. Consequently, a half-model was used, focusing on the interaction between the CTBA and the coil. The center of the CTBA, which is fixed during real-world heating, was represented using a fixed boundary, as shown in Figure 4. The finite element model applied in this study used 1 mm sized eight-node solid hexahedral elements with constant stress. To capture the skin effect, the mesh was constructed with three layers in the thickness direction, and hexahedral elements were used to improve convergence. The skin effect, characterized by induced currents concentrating near the conductor’s surface, was modeled to ensure that the simulated temperature distribution closely matches real-world phenomena [16,17].
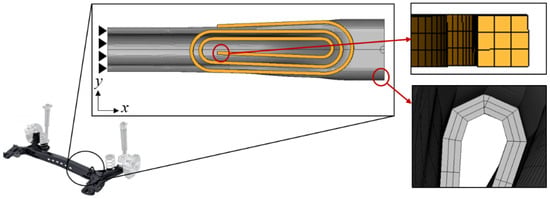
Figure 4.
FEA modeling and meshing.
The induction hardening process was divided into two phases: heating and quenching. In the heating phase, involving an electromagnetic-thermal coupled analysis, a current of 1500 A at 58 kHz was applied to both ends of the coil. eCoil surroundings and the CTBA was included in the model, but convection effects were excluded as their impact was expected to be negligible due to the short heating duration. In the quenching phase, involving a thermal-structural coupled analysis, the initial temperature and stress values obtained from the heating phase were used. Cooling was modeled by applying an external surface temperature of 25 °C to the CTBA submerged in water.
Material properties for the simulation were sourced from the software’s database. Boron steel was used to model the CTBA, while copper was used for the coil. The material properties are detailed in Table 1 [18]. Electrical, thermal, and structural properties were incorporated into the simulation, with electrical conductivity specified as temperature-dependent, as illustrated in Figure 5. The electrical conductivity decreases with increasing temperature due to the heightened vibration of metal atoms, which disrupts the flow of free electrons by increasing the frequency of collisions.

Table 1.
Thermal and structure properties.
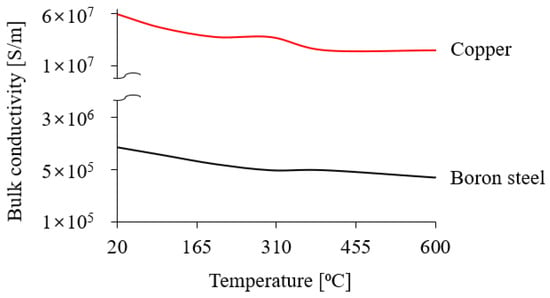
Figure 5.
Electromagnetic properties—electrical conductivity.
3. Finite Element Analysis Results
3.1. Heating Analysis
The heating analysis was conducted using an electromagnetic-thermal coupled method, yielding the temperature distribution illustrated in Figure 6. In Region a of Figure 6, where the coil made contact with the CTBA, the temperature distribution was uneven due to the non-uniform gap caused by the curved surface of the CTBA. The maximum temperature, 879.9 °C, was observed at the smallest gap of 2 mm between the coil and the CTBA, while the minimum temperature occurred at the largest gap of 3.5 mm. A similar temperature distribution pattern was identified in the symmetric region along the x-axis.
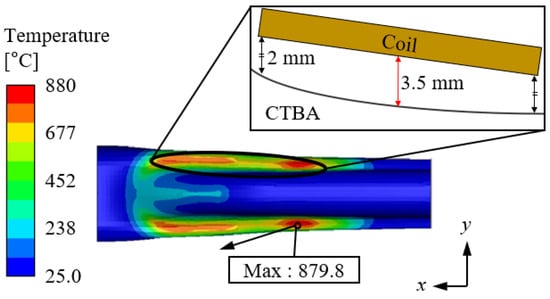
Figure 6.
Temperature analysis of CTBA.
As described in Section 2.4, the results underscore the significant influence of the skin effect on the observed temperature distribution. Figure 7a illustrates the case in which the skin effect was considered, showing that heat was concentrated on the product’s surface. In contrast, Figure 7b presents a scenario wherein the skin effect was excluded. Under these conditions, not only the product surface, but also the regions adjacent to the coil were excessively heated, resulting in exaggerated temperature distributions and unrealistically high heating outcomes.
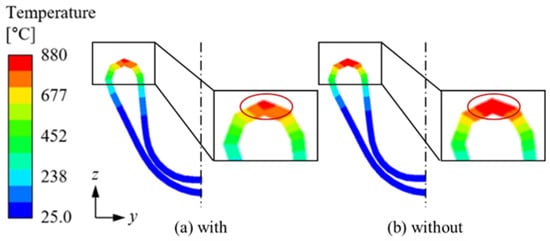
Figure 7.
Temperature analysis of CTBA with and without skin effect: (a) with skin effect (b) without skin effect.
3.2. Quenching Analysis
Building upon the heating analysis detailed in Section 3.1, quenching analysis was performed using a thermal-structural coupled method. Localized phase transformations can induce non-uniform volume changes and residual stresses, leading to structural deformation. This phenomenon is particularly significant in induction hardening, where rapid heating and cooling generate microstructural changes that influence mechanical stability [19]. Figure 8a presents the results under actual operational conditions, while Figure 8b shows the outcomes under ideal conditions, where the material was heated above 1000 °C and cooled within 11 s. A comparison of these two conditions reveals that, under actual operational conditions, the heating temperature did not exceed 1000 °C, and the cooling duration surpassed 12 s, failing to meet the criteria for martensitic transformation. As a result, the actual conditions exhibited a significantly lower martensite ratio compared to Figure 8b. As shown in Figure 9, the martensite ratio had a direct impact on the hardness distribution. The hardness results demonstrate that an increase in the martensite ratio corresponded to higher hardness values. Figure 9a illustrates the distribution under ideal conditions. Under actual conditions, the lower martensite content led to a less uniform hardness distribution, which could negatively affect the mechanical properties of the material. Additionally, transformation-induced plasticity (TRIP) effects may contribute to additional strain in regions where the martensite fraction is inconsistent. This transformation-induced strain can locally alter stress distributions, exacerbating residual stresses and deformation [20]. Following the quenching process, product distortion was evaluated to analyze its impact on assembly accuracy. The displacement results are shown in Figure 10. As indicated in Figure 10a, the z-axis displacement was most significant at Point P, measuring 0.94 mm. The cross-sectional analysis at Point P, presented in Figure 10b, reveals a height discrepancy relative to the design dimensions. Localized phase transformations occurring at Point P may have led to differential volume expansion and contraction, contributing to distortion. Point P corresponds to a welding section that connects to another component, and if the height difference is not corrected, it may result in misalignment and potential welding defects. This could compromise the structural integrity of the product.
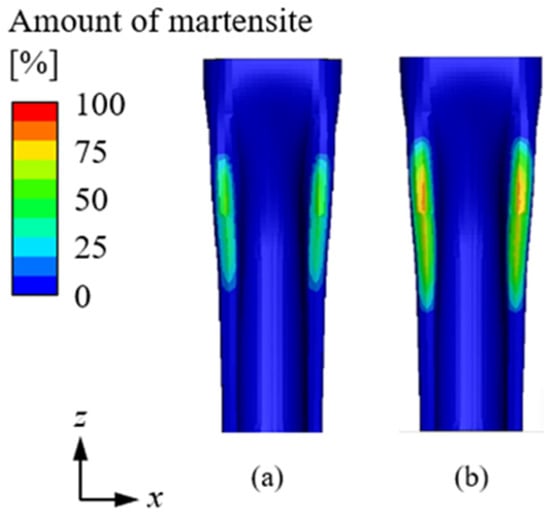
Figure 8.
Result of martensite after induction hardening: (a) actual and (b) ideal conditions.
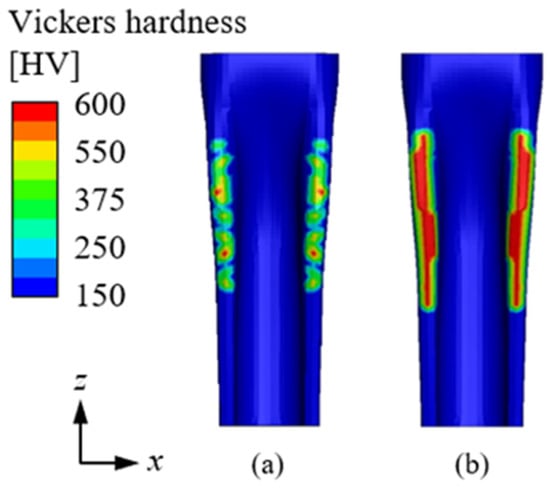
Figure 9.
Hardness distribution after induction hardening (a) actual and (b) ideal conditions.
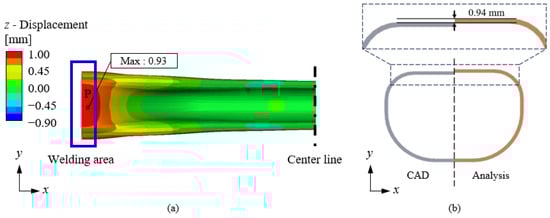
Figure 10.
(a) Result of z displacement and (b) difference in geometry comparing CAD data (left: CAD, right: analysis).
3.3. Validation of the Analysis Process
To validate the proposed methodology, the front-end analysis results of induction hardening were compared with the actual product. The induction hardening system used for this validation consisted of a TruHeat MF Series 7000 generator (Trumpf SE + Co., KG, Ditzingen, Germany) and a cooling system [21], as shown in Figure 11. The generator provided an output power of 40 kW with an operating frequency range of 20–100 kHz. The cooling system maintained stable heat transfer during the process by regulating the water temperature within the range of 5–35 °C.
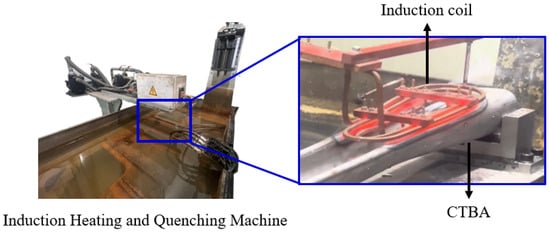
Figure 11.
Induction hardening system setup showing the heating coil, workpiece, generator, and cooling system configuration.
The deformation of the actual product was measured using a GOM ATOS 3D scanner (GOM mbH, Braunschweig, Germany) [22], a high-precision device equipped with dual cameras for accurately capturing reflective and curved surfaces. The scanning process and the appearance of the scanner are presented in Figure 12. To ensure an accurate comparison with finite element analysis (FEA) results, the scanned surface data were processed using Zeiss Quality Suite software (Ver. 4.5) [23]. The software aligned the experimental scan data with the original computer-aided design (CAD) model using a best-fit algorithm, correcting for positioning deviations. It then quantified shape deviations and visualized discrepancies between the scanned data and the FEA results. Additionally, the software identified localized defects and generated comprehensive analysis reports.
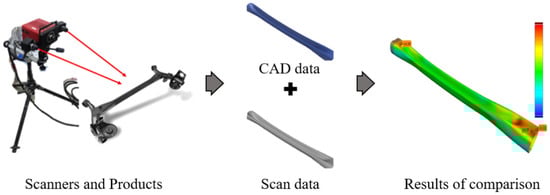
Figure 12.
Three-dimensional scanning-based deformation measurement and CAD model comparison.
The validation results are presented in Figure 13a, illustrating the direct comparison between the scanned product data and numerical analysis outcomes. Figure 13b provides a visual representation of this comparison: the left section displays the actual product alongside the CAD model, while the right section highlights the deviation analysis between the CAD model and the simulation results. In addition to this overall analysis, the experimental and simulation results were compared by evaluating displacement values at specific points. Identical reference points were marked on both the experimental and simulated data, and the displacement occurring between these points was analyzed. Furthermore, the trend in temperature distribution legends was compared between the experimental and simulated results to confirm consistency in thermal behavior.
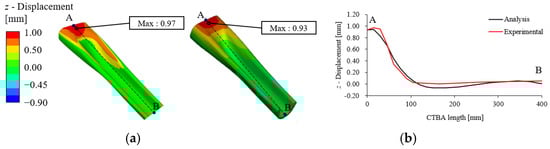
Figure 13.
Comparison of CTBA z-direction displacement between experimental and FE analysis, (a) 3D geometry, and (b) A–B section.
The maximum z-direction deformation at Point P was found to be highly consistent between the actual product and the simulation results. The measured deformation values were 0.97 mm and 0.93 mm, respectively, indicating an accuracy of approximately 96%. Additionally, the z-direction deformation along the product cross-section, spanning from welding Point A to center Point B, was analyzed, as depicted in Figure 13b. However, some discrepancies were observed between the experimental results and the FEA predictions, which are likely attributed to the simplifications in the FEA modeling. In particular, the omission of convection heat transfer in the simulation may have led to an underestimation of the cooling rate. In real-world cooling conditions, heat exchange occurs between the surrounding fluid and the workpiece, whereas the FEA model did not account for such external convection effects, potentially leading to variations in temperature distribution and deformation. Based on these results, the proposed analysis methodology is expected to demonstrate validity and reliability in predicting deformation behavior under real operating conditions.
4. Conclusions
This study proposes a multiphysics-coupled analysis method to simulate the entire induction hardening process for 3D geometries, examining its potential to improve product quality and minimize defects.
A electromagnetic-thermal coupled analysis was conducted to implement a process that considers electrical and thermal interactions, including the skin effect. Based on this analysis, the temperature distribution in the CTBA was evaluated. The results indicate that an imbalance in the gap between the induction coil and the product could lead to a non-uniform temperature distribution. Therefore, to minimize deformation in the CTBA, future research should focus on optimizing coil design to eliminate such imbalances.
Additionally, the thermal-structural coupled analysis incorporated the effects of temperature variations and phase transformations on structural deformation. The simulation results predicted the occurrence of structural deformation in the final product, confirming that such deformation could significantly affect product integrity.
A comparison between the simulation results and actual measurements demonstrated an accuracy of approximately 96%, validating the feasibility of the proposed approach for industrial applications. However, some discrepancies were attributed to modeling simplifications introduced to enhance computational convergence.
This study confirms that multiphysics-coupled simulations of induction hardening can contribute to improving product performance and production efficiency. However, the phase transformation itself was not experimentally validated, and specific solutions for mitigating deformation caused by imbalance were not provided. Therefore, future research should focus on experimental validation of the phase transformation effects and optimizations of the coil design to improve localized hardness distribution and reduce structural deformation.
Author Contributions
S.H. (Soonjae Hwang): Model design, Methodology, Writing—original draft. S.Y. and J.P.: Writing—modification of draft, Writing—review and editing. S.H. (Seokmoo Hong): Supervision, Writing—modification of draft, Writing—review and editing. All authors have read and agreed to the published version of the manuscript.
Funding
This work was supported by the Technology Innovation Program (2024-0913-01) funded by the Ministry of Trade, Industry, and Energy (MOTIE, Korea). This work was partly supported by the Technology development Program of MSS [RS-2024-00446241] and the Regional Innovation Strategy (RIS) through the National Research Foundation of Korea (NRF) funded by the Ministry of Education (MOE) [(2021RIS-004)].
Institutional Review Board Statement
Not applicable.
Informed Consent Statement
Not applicable.
Data Availability Statement
Data are contained within the article.
Conflicts of Interest
Author Jongkyu Park was employed by the company Hwashin Co., Ltd. The remaining authors declare that the research was conducted in the absence of any commercial or financial relationships that could be construed as a potential conflict of interest.
References
- McCrone, D.J.; Margolis, D.; Kim, N. A Bond Graph Approach to Analysis and Simulation of a Coupled Torsion Beam Axle. In Proceedings of the 2019 Spring Simulation Conference (SpringSim), Tucson, AZ, USA, 29 April–2 May 2019; IEEE: Piscataway, NJ, USA, 2019; pp. 1–12. [Google Scholar] [CrossRef]
- Sackl, S.; Leitner, H.; Zuber, M.; Clemens, H.; Primig, S. Induction Hardening vs Conventional Hardening of a Heat Treatable Steel. Metall. Mater. Trans. A 2014, 45, 5657–5666. [Google Scholar] [CrossRef]
- Mühlbauer, A. History of Induction Heating and Melting; Vulkan-Verlag GmbH: Essen, Germany, 2008. [Google Scholar]
- Aswad, M.F.; Mohammed, A.J.; Faraj, S.R. Induction Surface Hardening: A Review. J. Phys. Conf. Ser. 2021, 1973, 012087. [Google Scholar] [CrossRef]
- ScienceDirect. Flux Concentrator. Available online: https://www.sciencedirect.com/topics/engineering/flux-concentrator (accessed on 4 December 2024).
- Hatem, S. Simulation and Implementation of an Induction Heating System for Heating Brittle Thin Metal Sheets by Various Excitation Current Frequencies. Preprint 2023. [Google Scholar] [CrossRef]
- Javaheri, V.; Pohjonen, A.; Asperheim, J.I.; Ivanov, D.; Porter, D. Physically Based Modeling, Characterization and Design of an Induction Hardening Process for a New Slurry Pipeline Steel. Mater. Des. 2019, 182, 108047. [Google Scholar] [CrossRef]
- Tong, D.; Gu, J.; Totten, G.E. Numerical Investigation of Asynchronous Dual-Frequency Induction Hardening of Spur Gear. Int. J. Mech. Sci. 2018, 142–143, 1–9. [Google Scholar] [CrossRef]
- Ferguson, L. Stress and Deformation during Induction Hardening of Tubular Products. In Proceedings of the 6th International Conference on Induction Heating and Heat Treatment of Materials, Chicago, IL, USA, 9–13 September 2012. [Google Scholar]
- Mühl, J.; Pfeifer, T.; Frick, T.; Weiss, D. Simulation of Induction Hardening: Simulative Sensitivity Analysis with Respect to Material Parameters and the Surface Layer State. Comput. Mater. Sci. 2020, 183, 109916. [Google Scholar] [CrossRef]
- Shokouhmand, A.; Sadeghi, M.; Mostafavi, M. Induction Cladding of Alloys and Metal-Matrix Composite Coatings. Mater. Today Proc. 2020, 27, 2034–2042. [Google Scholar] [CrossRef]
- David, W. Permanently Laminated Flux Concentrator Assemblies and Flexible Flux Concentrator Assemblies. KR101671048B1, 25 August 2010. Available online: https://patents.google.com/patent/KR101671048B1/ko (accessed on 4 December 2024).
- Amarulloh, A.; Haikal, H.; Atmoko, N.T.; Utomo, B.R.; Setiadhi, D.; Marchant, D.; Riyadi, T.W.B. Effect of Power and Diameter on Temperature and Frequency in Induction Heating Process of AISI 4140 Steel. Mech. Eng. Soc. Ind. 2022, 2, 26–34. [Google Scholar] [CrossRef]
- Encyclopedia Magnetica™. Skin Depth. Available online: https://www.e-magnetica.pl/doku.php/skin_depth (accessed on 4 December 2024).
- Lee, I.; Tak, S.; Pack, I.; Lee, S. Comparative Study on Numerical Analysis Using Co-Simulation and Experimental Results for High-Frequency Induction Heating on SCM440 Round Bar. J. Aerosp. Syst. Eng. 2017, 11, 1–7. [Google Scholar] [CrossRef]
- Della Posta, G.; Ciri, U.; Leonardi, S.; Bernardini, M. A Novel Two-Way Coupling Method for the Study of the Aeroelasticity of Wind Turbines in a Large Eddy Simulation Framework. In Proceedings of the 14th European Conference on Turbomachinery Fluid Dynamics & Thermodynamics, Gdansk, Poland, 12–16 April 2021. [Google Scholar] [CrossRef]
- Luo, H.; Zhang, X.; Wang, Y.; Jiang, B.; Deng, Z.; Liu, J. Multi-Physics Coupled Numerical Simulation Study to Optimize Process Parameters for Electromagnetic Stirring of Semi-Solid A356 Aluminum Alloy under the Influence of Skin Effect. Int. Commun. Heat Mass Transf. 2024, 157, 107834. [Google Scholar] [CrossRef]
- Ansys. Ansys Granta Materials Data. Available online: https://www.ansys.com/products/materials/materials-data-library#tab1-1 (accessed on 4 December 2024).
- Oh, J.H.; Hong, S.G.; Park, C.K. Influence of Secondary Phase Morphology and Dissolved Carbon on the Plastic Deformation of Transformation-Induced Plasticity Steel. In Proceedings of the Korean Society for Technology of Plasticity Conference, October 1999; pp. 116–119. [Google Scholar]
- Kim, K.W.; Lee, C.H.; Kang, J.Y.; Lee, T.H.; Cho, K.M. Microstructure and Tensile Properties of Commercial TRIP Steel Subjected to Multi-Step Isothermal Transformation Heat Treatment. J. Korean Heat Treat. Soc. 2016, 29, 103–108. [Google Scholar] [CrossRef]
- TRUMPF. TruHeat MF Series 7000 User Manual and Product Specifications. Available online: https://www.trumpf.com (accessed on 7 February 2025).
- GOM ATOS 3D Scanner. Available online: https://www.zeiss.com/metrology/en/systems/optical-3d/3d-scanning/atos/atos-q.html (accessed on 7 February 2025).
- Zeiss Quality Suite. Available online: https://www.handsonmetrology.com/products/software/ (accessed on 7 February 2025).
Disclaimer/Publisher’s Note: The statements, opinions and data contained in all publications are solely those of the individual author(s) and contributor(s) and not of MDPI and/or the editor(s). MDPI and/or the editor(s) disclaim responsibility for any injury to people or property resulting from any ideas, methods, instructions or products referred to in the content. |
© 2025 by the authors. Licensee MDPI, Basel, Switzerland. This article is an open access article distributed under the terms and conditions of the Creative Commons Attribution (CC BY) license (https://creativecommons.org/licenses/by/4.0/).