Abstract
The design of passenger-dedicated lane width is essential for freeway reconstruction and expansion projects. However, the technical standard of lane width established in China is based on trucks. This study aims to propose a passenger-dedicated lane width calculation method for freeways based on overtaking behavior. Computer vision technology was used to extract vehicle trajectories and dimensions from videos captured by an unmanned aerial vehicle (UAV). Statistical methods such as cumulative frequency statistics, typical percentile statistics and regression analysis were employed to elaborate on the lateral displacement and distance of vehicles during overtaking. The results show that vehicles’ lateral displacements are mainly related to behaviors such as lane changing, lateral distance maintenance and lane keeping. The body width sum of parallel vehicles has little effect on the geometric center distance but significantly reduces the wheel distance when increasing. The general value of the passenger-dedicated lane width on freeways is recommended to be 3.5 m, and the limit value is 3.25 m. Compared with existing lane width calculation methods, this study pays more attention to the relationship between vehicle width and lateral distance, which can better cope with the challenges caused by vehicle diversity in lane width design.
1. Introduction
Lane width is a critical parameter in road geometric design. If the lane width is excessively wide, while traffic capacity can be ensured, the excessive lateral clearance may lead to a rapid decline in drivers’ lane-keeping sensitivity and increase the risk of distracted driving. Conversely, if the lane width is too narrow, it can significantly impede the free flow of vehicles and increase the likelihood of collisions between vehicles and with roadside obstacles. Therefore, designing an appropriate lane width is essential to ensure both traffic safety and efficient vehicle operation.
In recent years, China’s freeway network has been gradually improved. To meet the increasing transportation requirements of the masses, freeway reconstruction and expansion projects have been gradually put on the agenda, and the design of passenger-dedicated lanes has become a focus of attention [1]. However, the current established Chinese technical standards for lane widths are mainly for mixed passenger and freight traffic, with trucks rather than passenger cars as the design vehicle. The external dimensions and dynamic characteristics of cars are quite different from trucks, and whether and to what extent the width of their dedicated lanes can be reduced are yet to be analyzed and justified by relevant studies.
Understanding and mastering the driving behavior of highway vehicles, particularly their overtaking maneuvers, are essential for the design of appropriate lane widths. Overtaking is a complex process where vehicles have certain speed differences and are spatially close to each other, which can easily lead to accidents such as scratches, rollovers and rear-end collisions [2]. According to statistics, 4–10% of all traffic accidents occur in the overtaking process [3,4]. Therefore, mastering the motion characteristics of vehicles along the cross-section of the road in the overtaking scenario not only helps to deeply understand the formation mechanism of vehicle overtaking risk but also provides data support for lane width design.
However, most data acquisition methods in previous studies have relied on real-vehicle driving [5] and simulation [6], and the former approach struggles to capture comprehensive dynamic and static parameters of surrounding vehicles, while the latter faces challenges in ensuring the reliability and applicability of the results. Moreover, these traditional data collection methods often fail to provide a sufficiently large sample size, thereby limiting the generalizability of the research findings. With the rapid advancement of artificial intelligence in recent years, computer vision technology has become increasingly sophisticated, making it feasible to extract high-precision vehicle trajectories [7]. Utilizing UAV video-based vehicle detection and tracking algorithms can yield micro-traffic information characterized by large sample sizes and multiple parameters [8].
This study aims to propose a passenger lane width calculation method for freeways based on overtaking behavior. UAVs are used to record videos on the common two-way six-lane freeways in China. Parameters such as the position and outermost dimensions of the vehicle are extracted from the aerial video based on computer vision technology. After screening the eligible overtaking events, the lateral motion and lateral distance of vehicles during the overtaking process are analyzed.
The main contributions of this research work are as follows:
- To intuitively express the relative motion between vehicles, a vehicle coordinate system is established at the geometric center of the overtaken vehicle.
- To describe the lateral motion of a vehicle during overtaking, the absolute lateral displacement is defined in the road coordinate system and the relative lateral displacement is defined in the vehicle coordinate system.
- According to the characteristics of the lateral displacement of vehicles in the process of overtaking, the expected lateral distance of the driver before and after overtaking is calculated by using the linear fitting method.
- Based on the width of the truck lane and the lateral distance of two parallel vehicles, the width of the passenger lane is calculated.
2. Literature Review
Road design codes or guidelines in many developed countries provide recommended lane widths for various road conditions. For example, highway design reference documents in the United States recommend a highway lane width of 12 feet (3.66 m) [9]. According to the German Road and Traffic Research Association, the right-side lane width, which is mainly used by heavy vehicles, should be 3.75 m, while the left-side lane width can be set to 3.5 m [10]. The Canadian Transport Association defines a highway lane width of 3.5 to 3.7 m [11], while the British Highways Agency considers a typical lane width of 3.65 to 3.7 m [12]. Currently, the recommended lane width on China’s highways is 3.75 m, but when passenger cars dominate, the lane width can be reduced to 3.50 m [13].
Effective lane width design must balance both road capacity and safety. On the one hand, reducing lane width should not significantly compromise traffic flow efficiency. Kondyli et al. [14] argue that the Highway Capacity Manual (HCM) guidelines for lane width adjustments are outdated and propose a predictive model to simulate the impact of narrower lanes on traffic flow efficiency. Fitzpatrick et al. [15] found that, under identical conditions, operating speeds between 12-foot and 11-foot lanes exhibit minimal variation. On the other hand, lane width reduction must prioritize traffic safety. Dixon et al. [16] examined the effect of lane width reduction on overall highway safety performance and discovered that left shoulder width has a more significant impact on collision rates compared to lane width. Improving safety levels becomes challenging when lane widths exceed 12 feet. Wu et al. [17] quantified the impact of different lane widths on vehicle collision frequency in various accidents on urban expressways using vehicle collision and traffic flow data. Their results indicated that standard-sized lanes with a width of 3.45 m have the lowest collision risk.
Developing an effective lane width calculation model is crucial for the design of lane widths. One common approach is to utilize the Boryankov model to determine appropriate lane widths by controlling lateral safety spacing between vehicles or between vehicles and the curb. Some scholars have utilized data collected from different scenarios to fit different “speed–distance” models, in which the terms containing the speed are in the form of primary function, power function, speed difference and squared difference [18]. However, this model considers only the impact of speed. An alternative method involves determining lane width by considering three factors: vehicle width, lateral safety clearance and lateral oscillation of the track [19]. This approach does not account for vehicle interactions.
Driving behavior serves as the primary foundation for developing the methodology of lane width calculation. Behaviors such as avoidance, lane change and merging in overtaking scenarios need to be emphasized in lane width design due to their high occupancy of the road cross-section. Figueira et al. [20] investigated the effects of the speed of the impeding vehicle, the type of vehicle being overtaken and the passing sight distance on the initial following gap distance. Their results indicated that the speed of the impeding vehicle had a more substantial influence on the initial following gap distance during overtaking maneuvers compared to the type of the impeding vehicle or the passing sight distance. Soni et al. [21] introduced a novel variable, “excess distance”, to analyze overtaking behavior. The data showed that the rate of change in excess distance is influenced by both road type and characteristics of the overtaking vehicle. Choudhari et al. [22] developed models for overtaking distance and time under mixed traffic conditions. Their findings revealed that the distance and time required to overtake heavy vehicles are significantly greater than for other types of vehicles. Pawar et al. [23] conducted a driving simulator study to examine the impact of increasing time pressure on driving performance, particularly focusing on overtaking maneuvers and crash probabilities. The results indicated that as the minimum time-to-line crossing increased and the coefficient of variation in speed values rose, both overtaking and crash probabilities decreased. Qian et al. [24] used the overtaking ratio as a key indicator of traffic safety levels. Numerical experiments demonstrated that different lane control conditions and mixing ratios significantly affect traffic safety. Zhang et al. [25] developed a driving simulator to simulate overtaking behavior on highways and employed an eye tracker to collect drivers’ eye movement data. The results indicated that the probability of drivers obtaining traffic information from the left and right mirrors is approximately 14%, which is significantly higher than from other areas.
Table 1 provides a comparative overview of the existing studies. In general, it is feasible to further reduce lane width while ensuring both efficiency and safety. However, existing lane width design methodologies largely overlook the influence of vehicle width on driving behavior. In the context of lane width determination, there is likely a significant correlation between vehicle width and lateral distance, which should be verified through an analysis of overtaking behavior. At present, research on overtaking behavior mainly focuses on the longitudinal operating characteristics of vehicles, including speed change, overtaking distance, overtaking time and safety, while the lateral motion of vehicles is less mentioned. The motion of vehicles along the road cross-section will also face safety risks, such as lateral vehicle oscillations caused by the non-linearity of the steering system, which leads to lane departure [26], or the driver’s insufficient analysis of the traffic environment situation, which leads to collisions with other vehicles [27]. Some scholars started from the perspective of lateral vehicle sway, clarified the utilization of the vehicle on the lane width and used this as the basis to explore the setting of the lane width [28] but did not take into account the overtaking scenarios in which the lateral motion of the vehicle is more obvious. Therefore, this paper aims to employ advanced data collection techniques to investigate overtaking behavior and apply statistical analysis to quantify the lateral displacement and spacing of vehicles during the overtaking process. The influence of vehicle width on lateral spacing is a focal point, which is crucial for establishing a new lane width calculation model.

Table 1.
Comparison of current study reviews.
3. Materials and Methods
3.1. Vehicle Trajectory Extraction
Trajectory data are important carriers of vehicle motion characteristics, and the lateral motion parameters of the vehicle can be resolved through the traveling trajectory, such as lateral displacement, lateral speed (the moving speed along the direction of the roadway cross-section) and lateral distance. To obtain trajectory data with sufficient sample size, a UAV is used to take aerial video shots of multiple scenes on two freeways in Chongqing, China (Figure 1a), and vehicle trajectories are extracted by computer vision technology. For fitting the purpose of the study, when labeling the vehicle dataset, all the models are simply divided into passenger cars (class “car”) and large trucks (class “truck”). Figure 1b shows the recognition performance of a single video frame, the interface only shows the “class–ID–speed” and the rest of the parameters are saved in the form of a table. Table 2 shows the basic information about UAV video recordings. The selected roads are all two-way six-lane freeways, with lane widths of 3.75 m. The UAV flies at an altitude of 300 m and captures video at a resolution of 4096 × 2160 pixels and a frame rate of 25 frames per second, covering a length of the roadway ranging from 405 to 419 m. It is worth mentioning that we have open-sourced part of the extracted data on http://www.cqskyeyex.com (accessed on 16 May 2023) and verified by comparing the driving trajectory of real vehicles that the extracted trajectory data can reach centimeter-level error [29], which is sufficient to meet the requirements of this work. The total length of the final valid video is 747 min, and a total of 34,404 vehicle trajectories are obtained, of which 27,334 are car trajectories and 7070 are truck trajectories. In addition to trajectories, the vehicle profile dimensions as well as the relative positions between neighboring vehicles are also extracted.
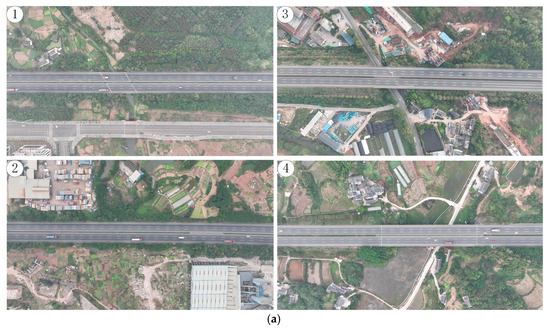
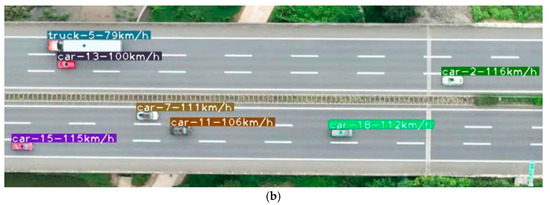
Figure 1.
Data acquisition scenario and extraction method. (a) UAV Video Shooting Scene; (b) Vehicle identification and tracking example.
Table 2.
Basic information about UAV video recordings.
3.2. Overtaking Event Extraction
In this study, we define overtaking as a process in which two vehicles with speed differences undergo a reversal of their front–back positional relationships while traveling in the same direction and are located in adjacent lanes to each other when they are side-by-side. Based on the video observation, the overtaking process and the vehicles involved were defined and categorized. According to the average speed of participants during the overtaking, the large one is defined as the “overtaking vehicle”, and the other one is defined as the “overtaken vehicle”. The overtaking process in which the overtaking vehicle always stays in the adjacent lane of the overtaken vehicle is defined as “lane-keeping overtaking”, and the overtaking process in which there is a change in lanes is defined as “lane-changing overtaking”. The extraction process of overtaking events is shown in Figure 2, which is based on whether there is a side-by-side phase of vehicles to judge whether overtaking behavior occurs, then comparing the speed to judge the overtaking vehicle ID and finally according to whether changing lanes occurs to judge the type of overtaking.
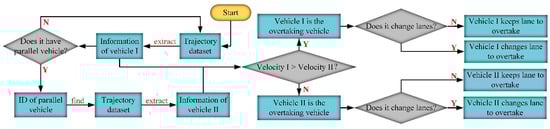
Figure 2.
The extraction process of overtaking events. Y stands for “Yes” and N stands for “No”.
3.3. Vehicle Motion Reference Frames
Normally, the study of vehicle motion mainly takes the road as the reference frame (Figure 3a). The coordinates of the overtaken vehicle and the overtaking vehicle are denoted as and , so that the respective motion can be analyzed through the change in trajectory coordinates. In overtaking scenarios, vehicles’ motion characteristics observed in the road reference frame are independent, which is not conducive to showing the coupling motion relationship between the two vehicles [30]. For a more intuitive expression of the relative motion of the two vehicles, the vehicle reference frame shown in Figure 3b is introduced. It takes the geometric center of the overtaken vehicle as the coordinate origin and the driving direction as the X-axis. Vehicles are mostly overtaking from the left side of the driving direction, which is stipulated as the positive direction of the Y-axis. Through the change in the coordinates of the overtaking vehicle, the relative position of the two vehicles in the longitudinal and lateral directions of the road can be visually expressed. The position coordinates of the overtaking vehicle in the two reference frames have the following relationship:
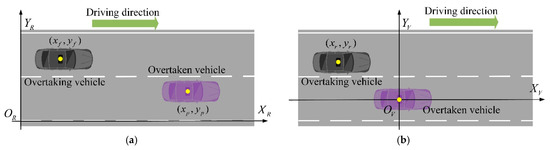
Figure 3.
Vehicle motion reference frames. (a) Road reference frame; (b) Vehicle reference frame.
3.4. Overtaking Phase Division
To ensure that the screened overtaking clips have sufficient duration, the average speed difference of vehicles when overtaking is first subjected to cumulative frequency statistics, as shown in Figure 4. The results show that the 85th quantile speed difference is 9.64 m/s, indicating that if the relative longitudinal motion distance between vehicles captured by the UAV is greater than 100 m, the duration is longer than 10 s. Screening the overtaking events according to the above criterion, a total of 17,245 eligible overtaking events are obtained. Limited by the capture range of the UAV, it is difficult to record a complete overtaking process within a traveling distance of about 400 m. Parallel driving is the intermediate state of the overtaking process. Taking it as the demarcation point, the overtaking process is divided into two phases, “before overtaking” and “after overtaking”. According to the driving experience, the duration of 10 s can cover the overtaking process in a single phase. In the vehicle reference frame, the overtaking events have a secondary screening according to the criterion that the trajectories of overtaking vehicles cover (−100, 0) m before or (0, 100) m after overtaking. Finally, 2482 and 1929 events are respectively obtained.
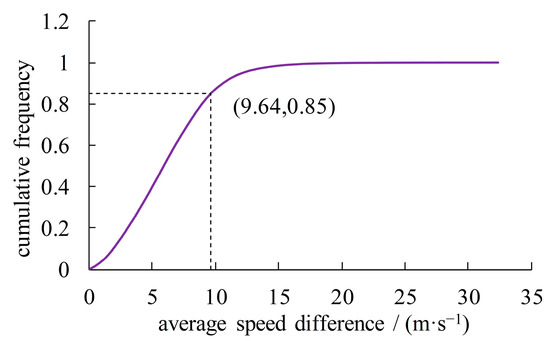
Figure 4.
Cumulative frequency distribution of average speed difference in overtaking scenario.
3.5. Lateral Displacement Definition
Through aerial video observation, vehicles moving along the road cross-section are ubiquitous in the overtaking scene, which is quantified by the lateral displacement. This study introduces two lateral displacements, including the absolute displacement in the road reference frame and the relative displacement in the vehicle reference frame.
As shown in Figure 5a, in the road reference frame, the position coordinates of the overtaking vehicle and the overtaken vehicle are and at one moment and are and in a later moment. Then the absolute displacements and of the two vehicles are calculated by
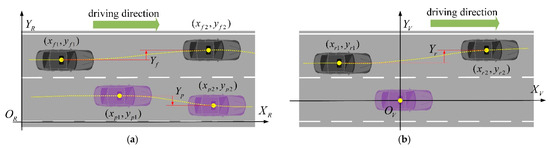
Figure 5.
Lateral displacement of vehicles in different reference frames. (a) Road reference frame; (b) Vehicle reference frame.
When or takes negative values, the vehicle laterally approaches the other vehicle. Conversely, it laterally departs from the other vehicle in the case of positive values.
As shown in Figure 5b, in the vehicle reference frame, assuming that the position coordinates of the overtaking vehicle at two moments are and , the relative displacement of the overtaking vehicle is
Similarly, when , parallel vehicles laterally approach each other; when , they laterally depart from each other. The relationship between relative displacement and absolute displacement is
3.6. Lateral Distance Definition
To ensure driving safety, vehicles are required to maintain sufficient lateral distance between each other, which is one of the important control factors for freeway lane width designs. In this study, we introduce two lateral distances for parallel vehicles, geometric center distance and wheel distance. The former is the length of the parallel vehicle centroid line, and the latter is numerically equal to the space width between the two vehicle bodies. Parallel vehicles in the overtaking process provide important data for lateral distance. As shown in Figure 6, based on the trajectories and body widths of parallel vehicles extracted by computer vision technology, the wheel distance can be calculated by:
where and are the body widths of overtaking and overtaken vehicles, is the geometric center distance of the parallel vehicles.
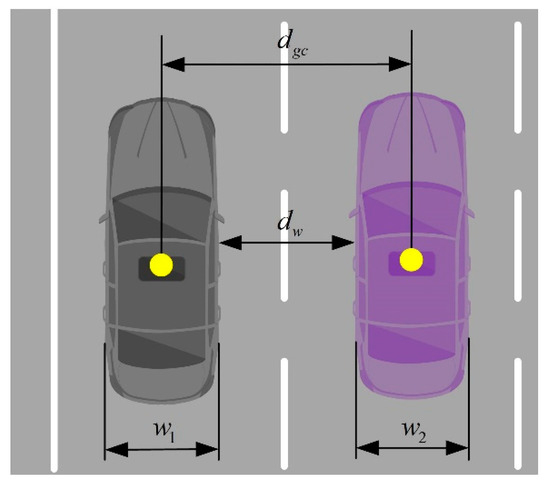
Figure 6.
Lateral distance between parallel vehicles.
4. Results and Discussion
4.1. Overtaking Trajectory in the Vehicle Reference Frame
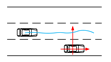
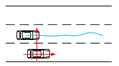
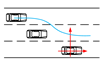
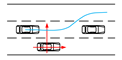
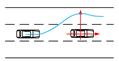
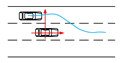
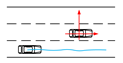
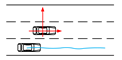
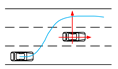
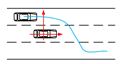
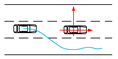
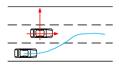
In the vehicle reference frame, trajectories of the overtaking vehicle are categorized according to the initial lane position relative to the overtaken vehicle and the driving operation during the overtaking, as shown in Figure 7. Six different trajectory patterns were obtained for both before and after overtaking phases, and the basic characteristics of each type of trajectory are shown in Table 3, where the “left lane” and the “right lane” are both relative to the overtaken vehicle and the “inner lane” is the lane near the median strip.
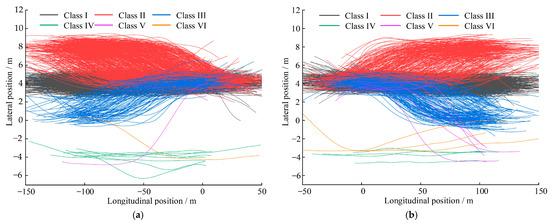
Figure 7.
Trajectories of overtaking vehicles in the vehicle reference frame. (a) Before overtaking; (b) After overtaking.
Table 3.
Different types of overtaking trajectories and their basic characteristics.
Class I contains trajectories of keeping lane to overtake from the left and has the richest samples due to the higher running speed of the left lane. Trajectories in Class II are formed by the influence of a third vehicle, and if the third vehicle is taken as the reference frame, trajectories in this class are similar to that in Class III; Class III is common in many studies about overtaking, and their trajectories perform overtaking from the left lane (before overtaking) or merging to the right lane (after overtaking). The samples of trajectories in Classes IV–VI are relatively fewer, mainly because these trajectories do not meet the running speed difference between different lanes of the freeway or the overtaking habits of most drivers. Considering that the trajectories in Class II are greatly affected by a third vehicle, they will not be analyzed in depth. The trajectories in the last three classes will also not be analyzed because of their scarcity. Therefore, this paper focuses on the trajectories of lane-keeping overtaking represented by Class I and lane-changing overtaking represented by Class III.
4.2. Lateral Displacement for Lane-Keeping Overtaking
4.2.1. Distribution Characteristics of Lateral Displacement
In the vehicle reference frame, the Y-axis coordinates of overtaking vehicles at X = −100 m and X = 0 m (before overtaking) or X = 0 m and X = 100 m (after overtaking) are extracted from the trajectories in Class I. The relative displacement of the overtaking vehicle within the range of 100 m is computed according to Equation (4), and the cumulative frequency statistics are shown in Figure 8a. It can be seen that the relative displacements before and after overtaking are roughly distributed in the ranges of (−1.5, 2.5) and (−2, 2) m. The relative displacement of the 85th quantile before overtaking is 0.52 m, which is 0.28 m more than after overtaking, indicating that the lateral departing behavior is more obvious before overtaking. The relative displacement value of the 15th quantile after overtaking is −0.61 m, which is 0.29 m less than before overtaking, meaning that vehicles approach each other more obviously after overtaking. Table 4 shows the proportion of lateral displacement behaviors in different overtaking phases. The proportion of lateral departing behavior before overtaking is higher, which indicates that vehicles tend to keep a constant lateral distance to ensure driving safety. The proportion of lateral approaching behavior after overtaking reaches 66%, mostly because the avoidance behavior in the previous phase makes the vehicle deviate from the centerline of the lane.
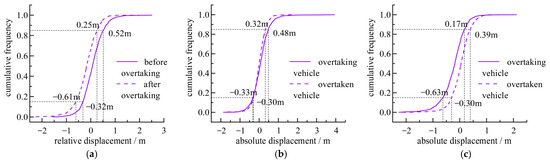
Figure 8.
Cumulative frequency distribution characteristics of lateral displacement. (a) Relative displacement during overtaking; (b) Absolute displacement before overtaking; (c) Absolute displacement after overtaking.
Table 4.
The proportion of different lateral displacement behaviors.
Similarly, the absolute displacements of the overtaking vehicle and the overtaken vehicle in the road reference frame during the two phases are calculated according to Equations (2) and (3). The cumulative frequency statistics results in Figure 8b show that the absolute displacements in the 15th quantile of the two vehicles before overtaking differ only by 0.03 m, which indicates that there is not much difference in their lateral approaching behaviors; the absolute displacements in the 85th quantile of the overtaking vehicle are 0.16 m higher than that of the overtaken vehicle, and its lateral departing behavior is more obvious. It is worth noting that the absolute displacement of the 85th quantile of the overtaken vehicle is 0.22 m higher than that of the overtaking vehicle, showing more obvious moving away behavior, which is reasonably explained by the fact that most of the overtaking vehicles have lateral approaching behaviors after they have moved to the front of the overtaken vehicle, and the overtaken vehicle has taken avoidance measures to ensure a safe lateral distance. Combined with the results in Table 4, the overtaking vehicles show more lateral departing behavior before overtaking and more lateral approaching behavior after overtaking; the overtaken vehicles have no obvious preference for lateral displacement behavior before overtaking and show more lateral departing behavior after overtaking.
4.2.2. Factors Affecting Lateral Displacement
The results in Figure 8 and Table 4 show that there is some difference in the distribution of absolute displacement of vehicles during overtaking, but specifically what kind of difference exists in each overtaking process has not been clarified. According to Equation (5), the relative displacement is formed by stacking the absolute displacements of the two vehicles. Thus, the relative displacement of vehicles is grouped at an interval of 0.5 m and the absolute displacements corresponding to each relative displacement are counted, and the results are shown in Figure 9.
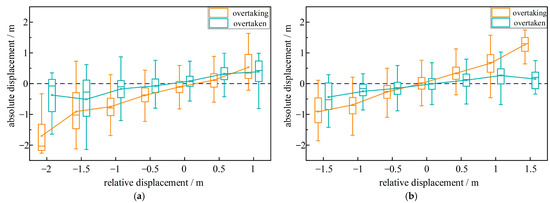
Figure 9.
The relationship between absolute displacement and relative displacement of vehicles. (a) Before overtaking; (b) After overtaking.
As can be seen from the line connecting the mean values of absolute displacements of each group in Figure 9a, the absolute displacement of the overtaking vehicle shows a monotonically increasing relationship with the change in relative displacement. The amplitude of its absolute displacement at the same level of relative displacement is significantly higher than that of the overtaken vehicle, which indicates that the relative displacement before overtaking is mainly contributed by the overtaking vehicle. The results in Figure 9b show that when the two vehicles are laterally close to each other (negative relative displacement), the overtaking vehicle is still the main contributor to the relative displacement because the overtaking vehicle that deviates from the lane center before overtaking will return to travel near the lane center after overtaking. However, when the two vehicles move away from each other, the absolute displacement of the overtaken vehicle was not significantly weaker than that of the overtaking vehicle, and even the mean value of some groups was slightly higher than that of the overtaking vehicle, most likely because the front-to-back positional relationship of the vehicles after overtaking has been reversed, and the overtaken vehicle was able to see the overtaking vehicle directly in front of it and adopted moving away behavior to maintain a safe lateral distance. Taken together, in addition to the obvious lane-changing behavior, the lateral displacement of the vehicles is also related to the lateral distance-keeping behavior and lane-keeping behavior.
According to the statistical results of the cumulative frequency, both before and after overtaking vehicles are not uniformly shown to be laterally close to or moving away from each other, and there are some differences in the amplitude of the lateral displacements, which are likely to be related to the initial lateral distance of the vehicles at the beginning of each phase. To verify the above conjecture, the initial geometric center distances as well as the relative displacements of the Class I trajectories at the beginning of the overtaking phase were extracted in the vehicle reference frame. Figure 10 shows the two-dimensional scatter distribution of relative displacement versus initial geometric center distance. It can be found that the relative displacement changes from positive to negative as the initial geometric center distance increases, indicating that the two vehicles tend to move away from each other when the initial geometric center distance is small. A linear function was used to fit the scatter points, and the results are shown in Table 5. According to the parameters obtained by fitting, the lateral displacement zeros of the two phases before and after overtaking can be calculated as 4.24 m and 3.75 m. The lateral displacement zero reflects the driver’s expectation of lateral distance in different overtaking stages. The expected lateral distance before overtaking is 0.49 m more than the lane width of 3.75 m, which indicates that the vehicle tends to keep a larger lateral distance than the lane width to ensure the safety of overtaking. Moreover, the expected lateral distance after overtaking is exactly one lane width, which indicates that, after completing the overtaking task, vehicles are expected to return to running near the lane centerline.
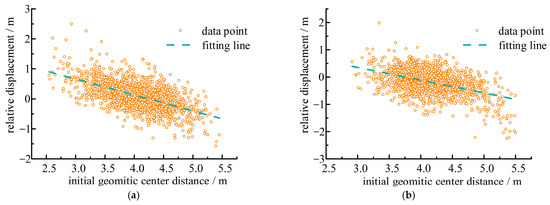
Figure 10.
The relationship between initial lateral spacing and relative displacement of vehicles. (a) Before overtaking; (b) After overtaking.
Table 5.
Linear fitting results of initial lateral distance and relative displacement.
4.3. Lateral Displacement for Lane-Changing Overtaking
According to the overtaking process with lane-changing behavior, the absolute displacement of the overtaking vehicle is much larger than that of the overtaken vehicle, and there is no need to perform much comparison with lane-keeping overtaking. Taking 1 m intervals, the overtaking trajectories in Class III are arranged in ascending order at each cross-section to obtain the typical percentile trajectory curves of consecutive sections, as shown in Figure 11a. Similarly, the typical percentile curves of lateral speed in Figure 11b can be obtained. It is found that the 50th percentile trajectory before overtaking is already in the lane-changing process at X = −100 m, while the 50th percentile trajectory after overtaking has already finished lane changing at about X = 90 m. Combined with the lateral speed curves, it can be seen that the overtaking vehicle tends to prepare in advance before overtaking and completes overtaking over a longer distance with a lower lateral speed; on the contrary, the lane-merging process after overtaking is completed in a shorter distance with a higher lateral speed. The safe following distance of the freeway is generally greater than 100 m, and changing lanes as early as possible before overtaking is conducive to obtaining better visual conditions and sufficient reaction time. It should be noted that most of the merging behaviors are completed within the safe following distance. In this case, the overtaken vehicle cannot accelerate sharply to avoid the potential risk of rear-end collision.
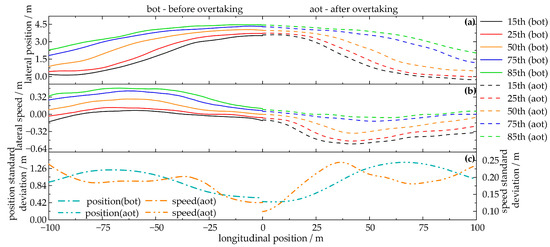
Figure 11.
Typical percentile curves of vehicle trajectory and lateral speed during lane-changing overtaking. (a) Typical percentile curves of vehicle trajectory; (b) Typical percentile curves of lateral speed; (c) Standard deviation of trajectory and lateral speed.
By analyzing the trajectory and lateral speed curves at different quantile values, it is evident that the degree of curve distribution dispersion varies across sections. The magnitude of the standard deviation can be used as an indicator to assess this dispersion, as illustrated in Figure 11c. We found that the standard deviation takes the minimum when the vehicles are parallel. In other words, the driving behaviors are convergent. When the driving parameters are distributed in a narrow interval, the design parameters of the road can be adjusted in a smaller range to take care of the behavioral habits of most drivers. Therefore, when the lateral distance of vehicles is taken as the control factor for lane width design, it is more representative to choose the lateral distance at the moment of vehicle parallelism.
Although the trajectories before and after overtaking come from different samples, the typical percentile values of the trajectories at X = 0 are close and the trend is also smooth. Furthermore, existing studies have confirmed that “50th percentile drivers” and “85th percentile drivers” exist in the real world. In other words, drivers who are highly close to the trend of a typical percentile curve can always be found in the sample. Given this, a relatively complete overtaking trajectory can be obtained by stitching together the trajectory curves for the same percentile values before and after the overtaking. It is noted that 85% of the overtaking vehicles can complete overtaking beyond the 15th percentile trajectory curve. From the perspective of freeway driving safety, this percentile trajectory curve can be used as the overtaking warning curve of the vehicle-assisted driving frame. For example, when the overtaking vehicle is about to intrude into the inner area of the 15th percentile trajectory curve, it reminds drivers to adjust the speed and direction to maintain a safe distance between vehicles.
4.4. Lateral Distance Between Parallel Vehicles
4.4.1. Distribution Characteristics of Lateral Distance
In Section 3.1, we classify all vehicles into two classes, car and truck, so that the combinations of parallel vehicles are of the following three types: car–car (CC), car–truck (CT) and truck–truck (TT). Relative frequency statistics for lateral distance with a group distance of 0.2 m are shown in Figure 12 (the dashed line is the fitted normal distribution curve), and the descriptive statistics are shown in Table 6. The results of the Kolmogorov–Smirnov test indicate that all lateral distances do not obey a normal distribution. All distribution curves have positive skewness coefficients, with CT being the largest. The lateral distance distribution of the TT is more centralized than the other two combinations due to the larger dimensions of the truck which limited the available lane space to adjust the lateral distance. Comparing the wheel distances at the same typical percentile for different vehicle combinations, the pattern is “CC > CT > TT”; for the geometric center distance at the lower percentile, the pattern is “CC < CT < TT”, and the 75th and 85th quartiles follow the trend of “CC < CT = TT”. The high percentile values of the geometric center distance for CT and TT combinations are close because some of the cars will maintain as much lateral distance from the truck as possible to ensure driving safety, space permitting. We also find that the geometric center distance of all the quartiles except the 15th percentile is greater than the lane width of 3.75 m. This indicates that vehicles in parallel do not travel near the centerline of the lane at the same time, which does not meet the assumption that “vehicles travel along the centerline of the lane” in the design of the roadway.
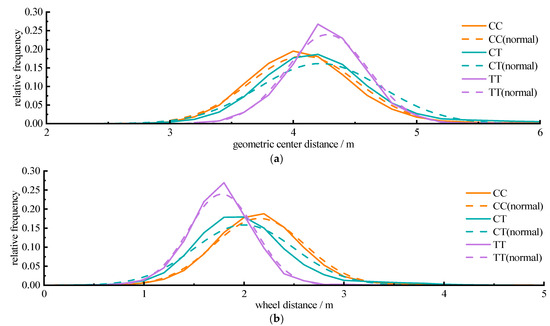
Figure 12.
Lateral distance distribution of different vehicle combinations in parallel. (a) Geometric center distance; (b) Wheel distance.
Table 6.
Descriptive statistics of the lateral distance of different vehicle combinations.
4.4.2. Factors Affecting Lateral Distance
With a constant lane width, an increase in the width of the vehicle body compresses the available lateral spacing, further affecting the vehicle’s control of lateral distance. To grasp the relationship between lateral distance and vehicle body widths, the sum of the widths of parallel vehicles is grouped at a distance of 0.2 m, and the distribution of lateral distance in each group is counted separately, as shown in Figure 13 (where the boxed portion indicates the 5th–95th percentile and the dotted line is the mean value of the different groups). It can be seen that, with the vehicle width sum increasing, the growth trend of the geometric center distance is not obvious, while the wheel distance has a significant downward trend. For two cars with a width sum of about 1.6 m, the average wheel distance is about 2.5 m. For two trucks with a width of about 2.5 m, the average wheel distance is less than 1.8 m. Therefore, the effect of the body width on the geometric center distance is relatively weak. However, since the geometric center distance does not change significantly, an increase in the width will lead to a significant decrease in the wheel distance.
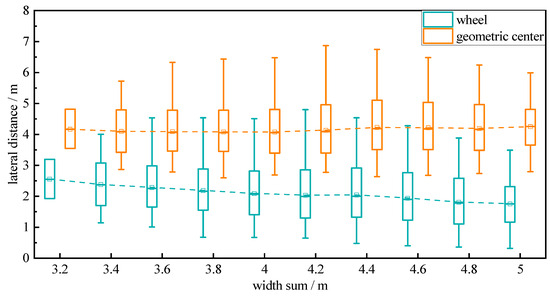
Figure 13.
The variation law of the lateral distance of vehicles along with the width sum of vehicles.
In the existing studies, speed is considered to be the main factor affecting the lateral distance between parallel vehicles and a higher speed requires a greater lateral distance to ensure driving safety. To verify the above viewpoints, parameters such as speed sum, speed difference and speed squared difference are considered as factors affecting the wheel distance. According to the survey results of the best-selling models in China’s passenger car market, the body width of a car is generally around 1.9 m. To exclude the influence of body width, only vehicles with a width of 1.9 ± 0.1 m are considered. Figure 14 shows the metrological heat map of the relationship between different speed indicators and wheel distance for typical parallel vehicles. It can be seen that the effects of the three indicators on wheel distance have the same pattern. The wheel distance is mainly distributed around 2.1 ± 0.4 m; for different groups of a single indicator, the frequency number decreases step by step with group 2.1 m as the center to both ends. The Pearson correlation coefficients between the three indicators and wheel distance were −0.032, 0.049 and 0.028. Thus, it can be concluded that speed does not significantly affect wheel distance in the freeway driving environment.
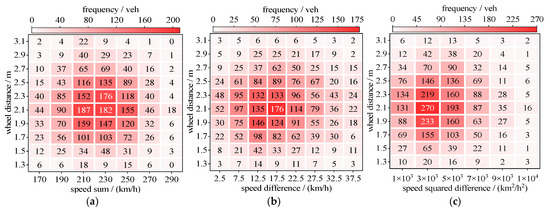
Figure 14.
Metrological heat maps of different speed indexes and wheel distance of cars. (a) Speed sum; (b) Speed difference; (c) Speed squared difference.
4.5. Freeway Lane Width Design Based on the Overtaking
In engineering applications, the lane width design mainly concerns the Poliakoff model. As shown in Figure 15a, the control factors mainly include the vehicle width w, the lateral safety distance dw (wheel distance) and the lateral safety margin M, where both dw and M are considered to be related to the vehicle speed. Zhuang et al. [19] proposed the lane width control factors from the perspective of vehicle lateral swing, as shown in Figure 15b, as the vehicle width w, the lateral swing amplitude A and the safety margins M1 and M2 on the left and right sides of the lane. However, the model did not take into account the interactions between vehicles, and it is suitable for the lane width design for the free flow.
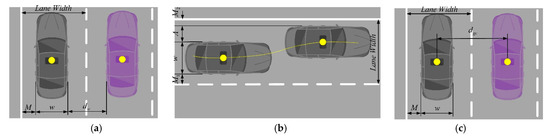
Figure 15.
Different methods to design lane width. (a) Polyakov model; (b) Model of Zhuang et al.; (c) This paper.
From the above two models, it is evident that lane width design primarily considers vehicle width along with the safe spacing on both sides of the vehicle. The width of the vehicle is typically determined by referencing the dimensions of the most popular model in the local market. Drawing on the model proposed by Zhuang et al., we assume that the safety distance on the left side of the overtaking vehicle remains unaffected by other vehicles and can therefore be set as a fixed value, whereas the safety distance on the right side is determined based on the findings presented in this study. Our work demonstrates that the wheel distance of vehicles in the freeway driving environment is insensitive to speed, but there is a significant negative correlation with body width. To avoid complex interaction effects, control factors should be independent of each other in the lane width design. Given that the geometric center distance exhibits low sensitivity to variations in vehicle width, this parameter is utilized as an evaluation metric to determine the safe lateral distance on the right side of the overtaking vehicle. In summary, as shown in Figure 15c, the vehicle width w, the geometric center distance dgc and the lateral safety margin M are taken as the control factors for freeway lane width design, and the relationship is given by Equation (7).
According to the survey results of the best-selling models in China’s passenger car market, the body width of a car is generally around 1.9 m, while a truck is generally around 2.5 m. In the design specification of developed countries and the existing research, the lateral safety margin is taken as 0.25 m. Generally, the 50th percentile or 85th percentile driving parameters are the basis for design in road engineering. As shown in Table 6, the geometric center distance of TT in the 85th percentile is 4.59 m, and if the width of the truck is taken as 2.5 m, the lateral margin of the outermost lane is 3.75 − (4.59 + 2.5)/2 = 0.205 m, which is close to the freeway lateral safety margin in developed countries. According to Equation (7), when the geometric center distance of CC in the 85th percentile is 4.52 m, the width of the car is taken as 1.9 m, and when the lateral safety margin is taken as 0.25 m, the width of the passenger-dedicated lane is (4.52 + 1.9)/2 + 0.25 = 3.46 m, which is taken as 3.5 m according to Chinese design custom, and it can be taken as the general value of the passenger-dedicated lane. Similarly, when the geometric center distance of CC in the 50th percentile is 4.07 m, the width of the passenger-dedicated lane is (4.07 + 1.9)/2 + 0.25 = 3.235 m, which is taken as 3.25 m according to Chinese design custom, and it can be taken as the limiting value of the passenger-dedicated lane. Since the speed limit value of the data collection roads is 120 km/h, any lane width design for the freeway that does not exceed this speed limit value can refer to the above method.
5. Conclusions
This study proposed a calculation method for freeway passenger-dedicated lane width based on overtaking behavior. UAVs are used to record videos on the common two-way six-lane freeways in China. Parameters such as the position and outermost dimensions of the vehicle are extracted from the aerial video based on computer vision technology. To intuitively express the relative motion between vehicles, we introduced a vehicle coordinate system at the geometric center of the overtaken vehicle. Based on this, the lateral motion and lateral distance of vehicles during the overtaking process are analyzed. The following conclusions could be drawn.
- (1)
- Vehicles’ lateral displacements are mainly related to behaviors such as lane changing, lateral distance maintenance and lane keeping. In the process of lane-keeping overtaking, the lateral approaching behavior and departing behavior exist in a certain proportion. The difference in lateral displacement behavior is related to the initial geometric center distance between vehicles and the lateral distance expectation of drivers. Taking the expectation of 4.24 m before overtaking and 3.75 m after overtaking as a baseline, when the initial geometric center distance is higher than this value, vehicles tend to approach each other; otherwise, they tend to depart from each other.
- (2)
- For lane-changing overtaking behaviors, it can be seen that the overtaking vehicle tends to prepare in advance before overtaking and completes overtaking over a longer distance with a lower lateral speed; on the contrary, the lane-merging process after overtaking is completed over a shorter distance with a higher lateral speed. The standard deviation of overtaking trajectory and lateral speed take the minimum when the vehicles are parallel, and the lateral distance at that moment is better as the control factor of lane width design to take care of the behavioral habits of most drivers.
- (3)
- The geometric center distance and wheel distance between parallel vehicles do not obey the normal distribution. Most of the geometric center distances are larger than the lane width of 3.75 m, which indicates that parallel vehicles cannot travel near the centerline of the lane at the same time. With the increasing the body width sum of vehicles, the geometric center distance does not change significantly, while the wheel distance has a significant decrease. In addition, speed does not significantly affect wheel distance in the freeway driving environment.
- (4)
- In this study, the geometric center distance between parallel vehicles is taken as one of the controlling factors in lane width design due to its lower sensitivity to the change in vehicle body width. Moreover, the vehicle body width and the lateral safety margin are also taken as the control factors for freeway lane width design. The general value of the passenger-dedicated lane width on freeways is recommended to be 3.5 m, and the limit value is 3.25 m.
- (5)
- In practical applications of freeway engineering, it is advisable to adopt a standard lane width of 3.5 m for passenger car lanes. Given a fixed construction budget, consideration may be given to utilizing the minimum permissible lane width of 3.25 m for inner lanes. The conserved lateral space can then be reallocated to widen the shoulder, thereby enhancing sight distance within curves to some extent.
This study focuses on the relationship between vehicle width and lateral distance, which is crucial for addressing the challenges posed by vehicle diversity in lane width design. The proposed model enhances our ability to manage these challenges effectively. Nonetheless, this study has certain limitations that warrant discussion. Firstly, all scenarios examined in this study featured lane widths of 3.75 m. The impact of varying lane widths on the lateral distance between vehicles remains an open question for future research. A narrower lane width could alter driving behavior and consequently affect the distribution of lateral spacing between vehicles compared to the standard 3.75 m lanes. Secondly, while our focus was primarily on the relative positions of vehicles with respect to each other, limited attention was given to their relative positions concerning lane markings. In the lane width calculation model proposed herein, the centroid distance between parallel vehicles is evenly distributed across two lanes. However, findings from this study indicate that in overtaking scenarios the lateral displacement between overtaking vehicle and overtaken vehicle is different, suggesting that the proportional allocation of the geometric center distance between lanes should be reconsidered. Future work will therefore incorporate the lateral position of vehicles within lanes, comparing the distances relative to lane markings between overtaking vehicles and overtaken vehicles, to further refine the lane width calculation method. Lastly, this study addresses lane width design from a macroscopic perspective based on driving behavior, without delving into factors such as driver psychology, visual field, shoulder width and weather conditions, which may influence lane width design. These aspects may require further exploration through field test data.
Author Contributions
Conceptualization, J.X.; methodology, C.P.; software, C.P. and H.Z.; validation, Y.Z. and H.Z.; formal analysis, C.P. and Y.Z.; investigation, C.P. and H.Z.; resources, J.X.; data curation, Y.Z.; writing—original draft preparation, C.P.; writing—review and editing, Y.Z.; visualization, H.Z.; supervision, J.X.; project administration, J.X.; funding acquisition, J.X. All authors have read and agreed to the published version of the manuscript.
Funding
This research was funded by the National Natural Science Foundation of China, grant number 52172340.
Institutional Review Board Statement
Not applicable.
Informed Consent Statement
Not applicable.
Data Availability Statement
Part of the raw dataset is available online at: http://www.cqskyeyex.com (accessed on 16 May 2023).
Conflicts of Interest
The authors declare no conflicts of interest.
References
- Ding, R.; Pan, C.; Dai, Z.; Xu, J. Lateral oscillation characteristics of vehicle trajectories on the straight sections of freeways. Appl. Sci. 2022, 12, 11498. [Google Scholar] [CrossRef]
- Jeon, S.; Lee, K.; Kum, D. Overtaking decision and trajectory planning in highway via hierarchical architecture of conditional state machine and chance constrained model predictive control. Robot. Auton. Fram. 2022, 151, 104014. [Google Scholar] [CrossRef]
- Motro, M.; Chu, A.; Choi, J.; Lavieri, P.S.; Pinjari, A.R.; Bhat, C.R.; Ghosh, J.; Heath, R.W., Jr. Vehicular ad-hoc network simulations of overtaking maneuvers on two-lane rural highways. Transp. Res. Part C Emerg. Technol. 2016, 72, 60–76. [Google Scholar] [CrossRef]
- Perumal, P.S.; Wang, Y.; Sujasree, M.; Mukthineni, V.; Shimgekar, S.R. Intelligent advice frame for human drivers to prevent overtaking accidents in roads. Expert Fram. Appl. 2022, 199, 117178. [Google Scholar] [CrossRef]
- Shoaeb, A.; El-Badawy, S.M.; Shawly, S.; Shahdah, U.E. A proposed overtaking model for Egyptian two-lane two-way roads. IATSS Res. 2024, 48, 275–287. [Google Scholar] [CrossRef]
- Zhang, R.; Qiong, B.; Brijs, K.; Hermans, E.; Qu, Q.; Shen, Y. Overtaking maneuvers on two-lane highways under the microscope: Exploration of a multidimensional framework for the analysis of safety, comfort and efficiency using simulator data. Accid. Anal. Prev. 2024, 202, 107613. [Google Scholar] [CrossRef] [PubMed]
- Chen, X.; Li, Z.; Yang, Y.; Qi, L.; Ke, R. High-resolution vehicle trajectory extraction and denoising from aerial videos. IEEE Trans. Intell. Transp. Fram. 2020, 22, 3190–3202. [Google Scholar] [CrossRef]
- Krajewski, R.; Bock, J.; Kloeker, L.; Eckstein, L. The highd dataset: A drone dataset of naturalistic vehicle trajectories on german highways for validation of highly automated driving frames. In Proceedings of the 2018 21st International Conference on Intelligent Transportation Frames (ITSC), Maui, HI, USA, 4–7 November 2018; IEEE: New York, NY, USA, 2018; pp. 2118–2125. [Google Scholar]
- Hancock, M.W.; Wright, B. A Policy on Geometric Design of Highways and Streets; American Association of State Highway and Transportation Officials: Washington, DC, USA, 2013; Volume 3, p. 20. [Google Scholar]
- Road and Transportation Research Association. Guidelines for the Design of Motorways; Road and Transportation Research Association: Cologne, Germany, 2008. [Google Scholar]
- Transportation Association of Canada. Geometric Design Guide for Canadian Roads: Design Controls, Classification and Consistency; Transportation Association of Canada: Ottawa, ON, Canada, 2017. [Google Scholar]
- The UK Highways Agency. Design Manual for Roads and Bridges; The UK Highways Agency: London, UK, 2020. [Google Scholar]
- JTG B01-2014; Technical Standard of Highway Engineering. Ministry of Transportation of China Press: Beijing, China, 2014.
- Kondyli, A.; Hale, D.K.; Asgharzadeh, M.; Schroeder, B.; Jia, A.; Bared, J. Evaluating the operational effect of narrow lanes and shoulders for the highway capacity manual. Transp. Res. Rec. 2019, 2673, 558–570. [Google Scholar] [CrossRef]
- Fitzpatrick, K.; Dixon, K.; Avelar, R. Evaluating operational implications of reduced lane and shoulder widths on freeways. J. Transp. Eng. 2016, 142, 04016052. [Google Scholar] [CrossRef]
- Dixon, K.; Fitzpatrick, K.; Avelar, R. Operational and safety trade-offs: Reducing freeway lane and shoulder width to permit an additional lane. Transp. Res. Rec. 2016, 2588, 89–97. [Google Scholar] [CrossRef]
- Wu, L.; Sun, J.; Li, T. Relationship between lane width and safety along urban expressways in Shanghai. J. Transp. Eng. Part A Syst. 2019, 145, 05018004. [Google Scholar] [CrossRef]
- Wang, Q.; Yan, Y.; Wang, K. Research on optimized design of road space in mixed sections of historical district: A case study of Xi’an, China. Can. J. Civ. Eng. 2021, 48, 1105–1114. [Google Scholar] [CrossRef]
- Zhuang, J.F.; Li, Z.J.; Ding, R.; Xiong, W.L.; Zhang, H.S.; Xu, J. Vehicles trajectory oscillation characteristics and passenger cars’ lane width for freeways. J. Transp. Fram. Eng. Inf. Technol. 2023, 23, 324. [Google Scholar]
- Figueira, A.C.; Larocca, A.P.C. Analysis of the factors influencing overtaking in two-lane highways: A driving simulator study. Transp. Res. Part F Traffic Psychol. Behav. 2020, 69, 38–48. [Google Scholar] [CrossRef]
- Soni, R.; Vasudevan, V.; Dutta, B. Analysis of overtaking patterns of Indian drivers with data collected using a LiDAR. Transp. Res. Part F Traffic Psychol. Behav. 2020, 74, 139–150. [Google Scholar] [CrossRef]
- Choudhari, T.; Budhkar, A.; Maji, A. Modeling overtaking distance and time along two-lane undivided rural highways in mixed traffic condition. Transp. Lett. 2022, 14, 75–83. [Google Scholar] [CrossRef]
- Pawar, N.M.; Velaga, N.R. Investigating the influence of time pressure on overtaking maneuvers and crash risk. Transp. Res. Part F Traffic Psychol. Behav. 2021, 82, 268–284. [Google Scholar] [CrossRef]
- Qian, Y.; Luo, J.; Zeng, J.; Shao, X.; Guo, W. Study on security features of freeway traffic flow with cellular automata model—Taking the number of overtake as an example. Measurement 2013, 46, 2035–2042. [Google Scholar] [CrossRef]
- Zhang, W.H.; Li, P.; Hu, M.; Li, Y. Driver’s visual behavior characteristics during overtaking on a freeway. J. Tsinghua Univ. 2014, 54, 1204–1208. [Google Scholar]
- Sui, Z.; Liang, S.; Tian, Y. Intelligent driving model considering lateral active safety of vehicles. Zidonghua Xuebao 2021, 47, 1899–1911. [Google Scholar]
- Svärd, M.; Markkula, G.; Aust, M.L.; Bärgman, J. Using naturalistic and driving simulator data to model driver responses to unintentional lane departures. Transp. Res. Part F Traffic Psychol. Behav. 2024, 100, 361–387. [Google Scholar] [CrossRef]
- Liu, J.; Guo, Z.; Shan, D.; Liu, X. Effective lane width for cars considering lateral oscillation characteristics based on high-precision field data. Int. J. Transp. Sci. Technol. 2024, 16, 18–33. [Google Scholar] [CrossRef]
- Pan, C.; Dai, Z.; Zhang, Y.; Zhang, H.; Fan, M.; Xu, J. An approach for accurately extracting vehicle trajectory from aerial videos based on computer vision. Measurement 2024, 242, 116212. [Google Scholar] [CrossRef]
- Jiao, Y.; Calvert, S.C.; Van Cranenburgh, S.; van Lint, H. Inferring vehicle spacing in urban traffic from trajectory data. Transp. Res. Part C Emerg. Technol. 2023, 155, 104289. [Google Scholar] [CrossRef]
Disclaimer/Publisher’s Note: The statements, opinions and data contained in all publications are solely those of the individual author(s) and contributor(s) and not of MDPI and/or the editor(s). MDPI and/or the editor(s) disclaim responsibility for any injury to people or property resulting from any ideas, methods, instructions or products referred to in the content. |
© 2025 by the authors. Licensee MDPI, Basel, Switzerland. This article is an open access article distributed under the terms and conditions of the Creative Commons Attribution (CC BY) license (https://creativecommons.org/licenses/by/4.0/).