Article

Numerical Calculation Optimization for Particulate Matter Trapping and Oxidation of Catalytic Diesel Particulate Filter

1
Activities of the Institute of Innovation for Future Society, Nagoya University, Chikusa-ku, Nagoya City 456-0053, Aichi, Japan
2
Institute of Material and Systems for Sustainability, Nagoya University, Chikusa-ku, Nagoya City 456-0053, Aichi, Japan
*
Authors to whom correspondence should be addressed.
Appl. Sci. 2025, 15(5), 2356; https://doi.org/10.3390/app15052356
Submission received: 17 January 2025 / Revised: 17 February 2025 / Accepted: 21 February 2025 / Published: 22 February 2025
(This article belongs to the Special Issue Novel Advances of Combustion and Its Emissions)

Abstract

:
In recent years, the transition to electric vehicles has accelerated significantly. However, this shift does not imply the complete elimination of diesel engine vehicles, particularly in commercial and cargo transport, where diesel engines remain essential due to their high thermal efficiency and torque. Despite their advantages, diesel engines produce particulate matter (PM) in their exhaust, which poses environmental and health risks. To mitigate PM emissions, diesel particulate filters (DPFs) are integrated into exhaust systems. However, as PM accumulates in the DPF, pressure drops occur, increasing the load on the engine. Therefore, periodic removal of PM through oxidation, known as regeneration, is required. Optimizing the PM combustion temperature improves fuel efficiency, but since diesel engine exhaust temperatures typically range from 100 to 500 °C, catalysts that facilitate PM oxidation at lower temperatures are necessary. This study focuses on PM oxidation catalysts designed for low-temperature diesel exhaust conditions. One of the key challenges in this area is the difficulty in directly observing PM trapping and oxidation behavior within a catalyzed DPF. Additionally, changing the catalyst during experiments is not straightforward. To address these challenges, we have developed a numerical model that simulates the entire process—from PM deposition to oxidation—inside a DPF. This model allows for easy modification of catalyst properties, providing a flexible framework for analyzing PM oxidation behavior under various conditions. In this study, numerical simulations were conducted to analyze the PM deposition and oxidation processes within the DPF. The results were derived from a simplified model developed specifically for this research. The proposed calculation method allows for the qualitative assessment of DPF performance when catalysts are altered, contributing to the optimization of DPF design.

1. Introduction

Diesel engines are widely utilized in transportation due to their high thermal efficiency, strong torque output, and superior fuel economy. However, their exhaust emissions present significant environmental and health challenges. Compared to gasoline engines, diesel engines release higher levels of nitrogen oxides (NOxs) and particulate matter (PM), which contribute to air pollution and pose health risks. In response, governments worldwide have implemented stricter regulations on vehicle emissions, emphasizing the need for advancements in PM reduction technologies [1,2,3,4]. A key solution for mitigating PM emissions is the diesel particulate filter (DPF). Typically constructed from porous ceramic materials such as silicon carbide (SiC) or cordierite, the DPF features a honeycomb-like structure designed to capture and filter PM from exhaust gases [5,6]. As illustrated in Figure 1, the filter consists of alternating sealed and open channels: exhaust gases enter through unsealed pathways, where PM is captured on the filter walls, while the cleaned exhaust exits through the outlet. Although DPF walls generally have a thickness of 300–400 μm, PM deposition predominantly occurs within the first few tens of micrometers from the surface. As PM accumulates over time, the pressure drop across the filter increases, imposing a greater load on the engine. To maintain efficiency, PM must be periodically removed through an oxidation process known as regeneration (Figure 2). Carbon-based PM typically combusts at approximately 650 °C; however, given that diesel exhaust temperatures range between 100 and 500 °C, additional fuel is often required to elevate exhaust temperatures to enable PM oxidation [7,8,9].
Frequent regeneration substantially raises fuel consumption due to the energy required for the process. Therefore, to reduce fuel consumption, it is desirable to lower the PM oxidation temperature during regeneration. In general, we use PM oxidation catalysts for the low-temperature oxidation of PM. Various catalysts for PM oxidation have been studied so far [10,11,12,13,14,15,16,17,18,19,20,21,22,23,24,25,26,27,28,29,30,31,32]. The main PM oxidation catalysts are cerium oxide-based, platinum-based, and copper-based catalysts. Preceding studies have reported that a decrease in the PM oxidation temperature caused by a PM oxidation catalyst is possible. However, since these catalysts have been evaluated for their performance in particulate form, their values cannot be used directly for DPFs. Several studies have shown experimental results when PM oxidation catalysts are supported on a DPF. The figures below illustrate the differences in catalytic activity depending on the form in which the catalyst is applied. They compare particulate catalysts (Figure 3a) with catalysts supported on a DPF (Figure 3b), highlighting how these configurations affect the oxidation process of PM. In the case of particulate catalysts, catalyst particles are attached directly to PM, creating multiple points of contact between the catalyst and PM. This direct interaction enhances the oxidation reaction, leading to a higher frequency factor for catalytic activity. The oxidation reaction occurs efficiently because the catalyst is near the carbonaceous PM. In the case of the catalyst supported on the DPF, the catalyst is coated on the surface of the DPF rather than being directly attached to PM. When PM accumulates on the DPF wall, only a portion of it comes into direct contact with the catalyst. As a result, oxidation is more dependent on gas-phase reactions, and the catalytic activity is generally lower compared to the particulate catalyst case. This configuration leads to a lower frequency factor, as not all PM interacts directly with the catalyst. These differences play a crucial role in optimizing DPF design and improving the efficiency of PM oxidation processes in diesel after-treatment systems.
In addition, various experiments and simulations related to DPF have been conducted in the past. However, these were limited to experiments and numerical calculations on parts of a DPF. Furthermore, it is not easy to experiment with the performance of various catalysts on DPFs under various conditions. This study aims to analyze the behavior of PM deposition and oxidation processes in DPFs with various catalysts and to identify the optimal range for effective PM oxidation catalysts.
In this study, we have numerically calculated the performance of the PM oxidation of various catalysts supported on a DPF. To achieve our goal, we made three improvements to the previous model, subdividing the soot oxidation process in more detail. First, we assumed the existence of two oxidation reactions. The first is the reaction between the catalyst and the soot (solid-state reaction: SSR). The second reaction occurs between soot and oxygen present in the gas phase, known as the vapor-phase reaction (GPR) (Figure 4).
Next, we developed a model where the activity of particulate catalysts converts into catalytic activity supported on a DPF. Finally, we determined the catalytic performance during the reaction of oxygen and soot in the gas phase experimentally. We used experimental values for the numerical calculations. After the refinement of the above model, PM was deposited and oxidized to evaluate the performance of the PM oxidation catalyst under these conditions.

2. Method

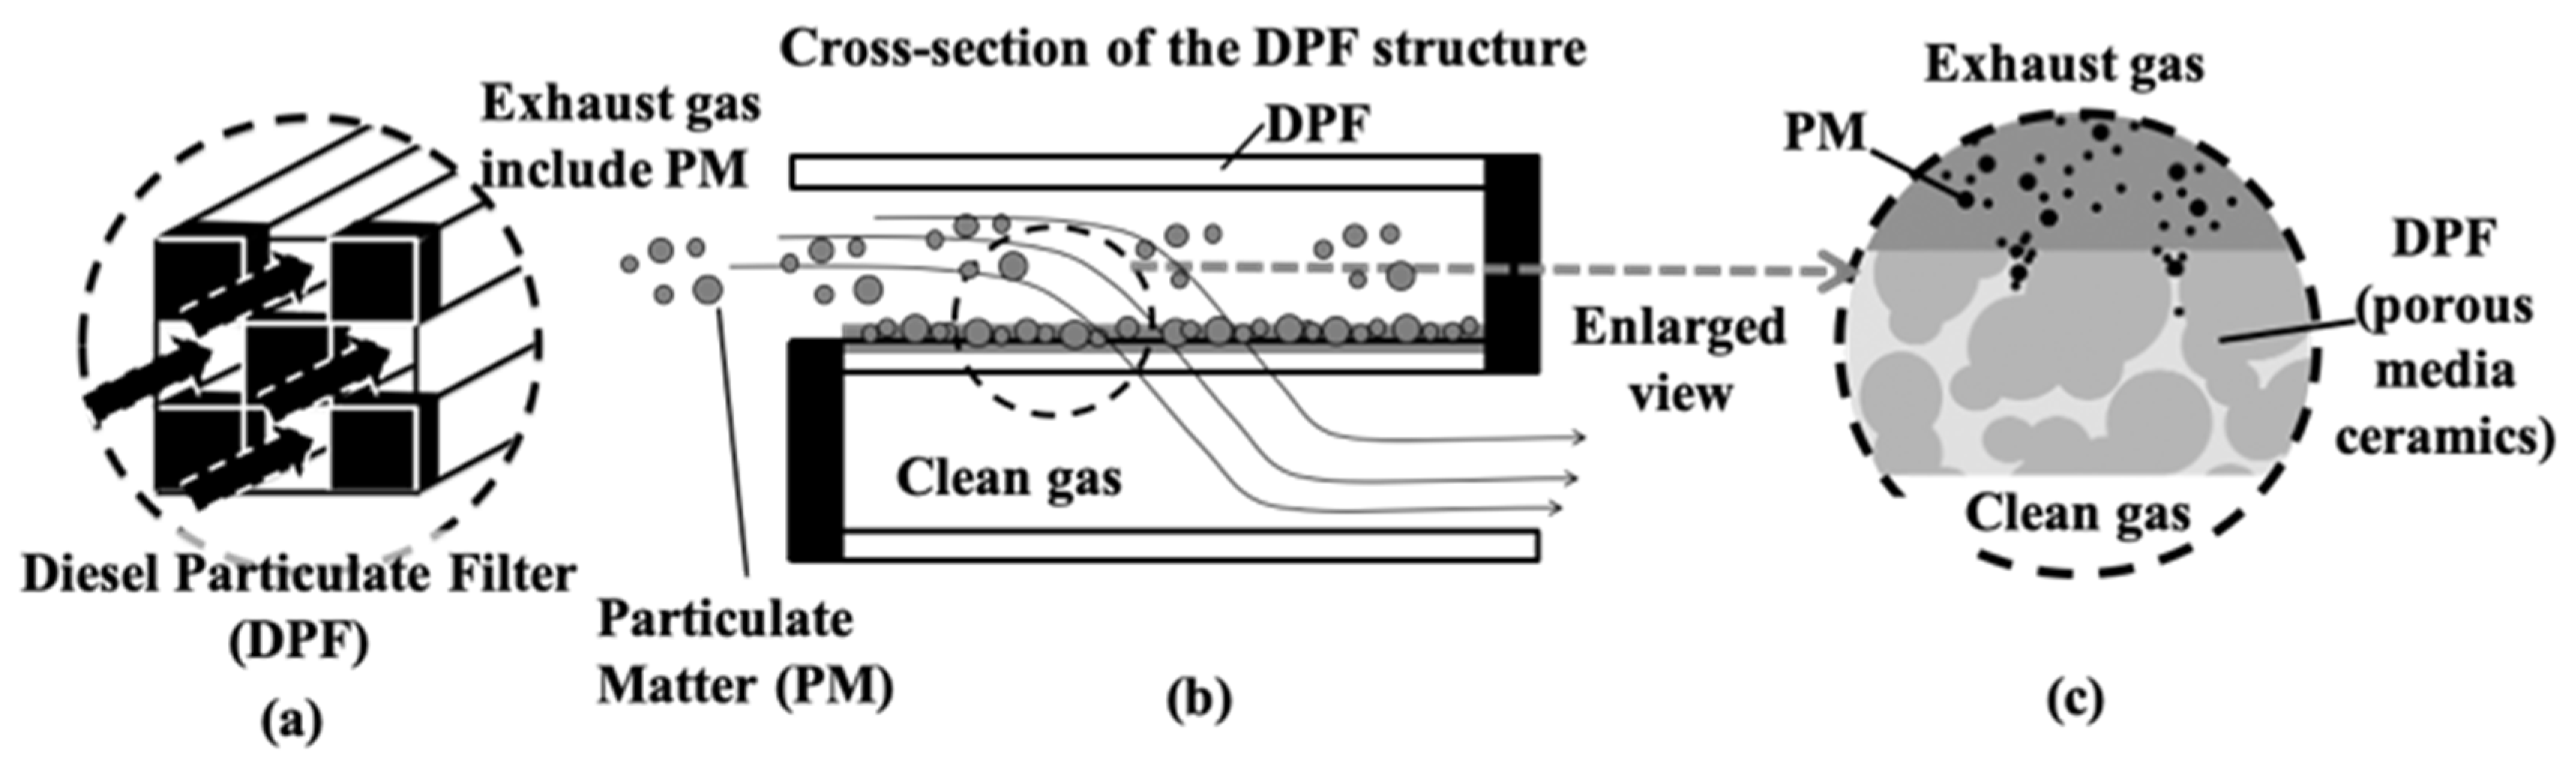
2.1. Calculation Model for PM Trapping Process

In this study, the numerical calculation was performed using the new DPF model with two modifications to the numerical calculation model of the previous study (10 to 16). The calculation model is shown below. A conceptual diagram of a DPF is shown in Figure 5a, and a cross-sectional view is shown in Figure 5b. Assuming a columnar diameter, D, and length, L, we can divide the DPF into n cells at equal intervals in the length direction (x-direction). As shown in Figure 5b, the divided cells were further divided into an inflow part, a filter wall surface, and an outflow part. Inside the filter wall, it was divided into n pieces at equal intervals in the wall’s thickness direction (y-direction). In this study, PM deposition amounts of 1 g, 10 g, 20 g, and 30 g were selected to represent various engine operating conditions.

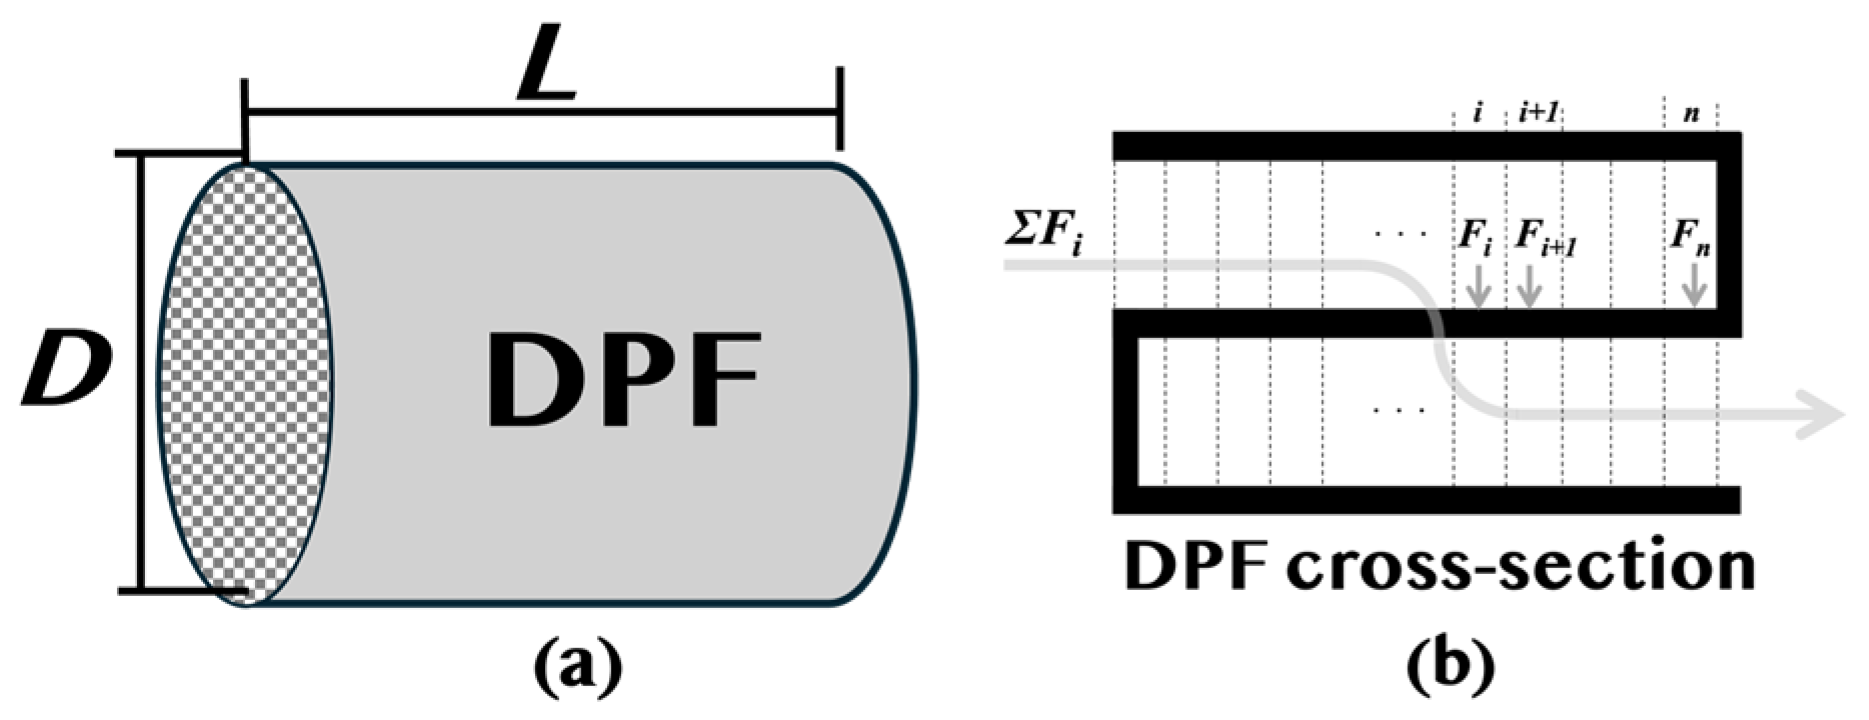
2.2. Exhaust Gas Flow in the DPF Length Direction (x-Direction)

The exhaust gas flow in the length direction (x-direction) of the DPF will be explained. As shown in Figure 5b, the total flow rate of the exhaust gas flowing into the DPF is ΣFi [m3/s], and the total flow rate is divided into each cell and expressed by the following equation.
Σ i = 1 n F i = Δ F 1 + Δ F 2 + + Δ F n
The flow rate, Fi, of each cell is shown by the following formula.
F n i = v n i × σ
The flow rate of each cell is indicated by Fni [m3/s], and the flow velocity of each cell is indicated by vni [m/s] and the area through which the fluid passes σ [m2]. The pressure loss at this time is shown by the following equation.
Δ P = λ L W P + P M D w a l l   s · v i 2 2 · ρ
λ is the coefficient of friction of the pipe, LWP+PM is the length [m], Dwalls is the diameter [m], V is the average speed [m/s], and ρ is the fluid density [kg/m3]. At this stage, during the initial phase of PM deposition (when no prior deposition has occurred), it is assumed that the gas containing PM is evenly distributed across all cells. Furthermore, it is assumed that the pressure is constant in all cells when the exhaust gas flows in the y-direction. The calculation is performed in the i-th cell, and the result is passed on to the next i + 1-th cells. The PM deposition inside the DPF wall, temperature handling, PM oxidation, and the oxidation reaction site are explained below.

2.3. Sedimentation Inside the DPF Wall

This section describes the process of PM deposition within the DPF wall. Previous studies have shown that PM initially forms cross-linked structures near the surface of the DPF wall within several tens of μm from the start of deposition [33]. Subsequently, PM accumulates predominantly on the surface rather than penetrating deeper into the wall. In this study, the model has been refined to reflect this behavior, assuming that PM is deposited primarily on the surface instead of being distributed throughout the entire thickness of the DPF wall. Additionally, research has indicated that porosity varies from the outer surface to the inner layers [34]. Based on this, it is assumed that the PM deposition rate decreases exponentially as it moves from the surface to the deeper regions of the wall (Figure 6). Figure 6 provides a schematic representation of soot deposition in the DPF. In Figure 6a, an overview of the DPF structure is presented, showing the inlet, porous wall, and outlet for exhaust gas flow. Figure 6b expands on the DPF wall, illustrating the segmentation utilized in the numerical model to analyze soot deposition. Additionally, Figure 6c offers a more detailed view of the soot deposition mechanism within the DPF wall, emphasizing the formation of soot bridges and the accumulation of soot in the porous structure, as described in [35].

2.4. Handling of Temperature
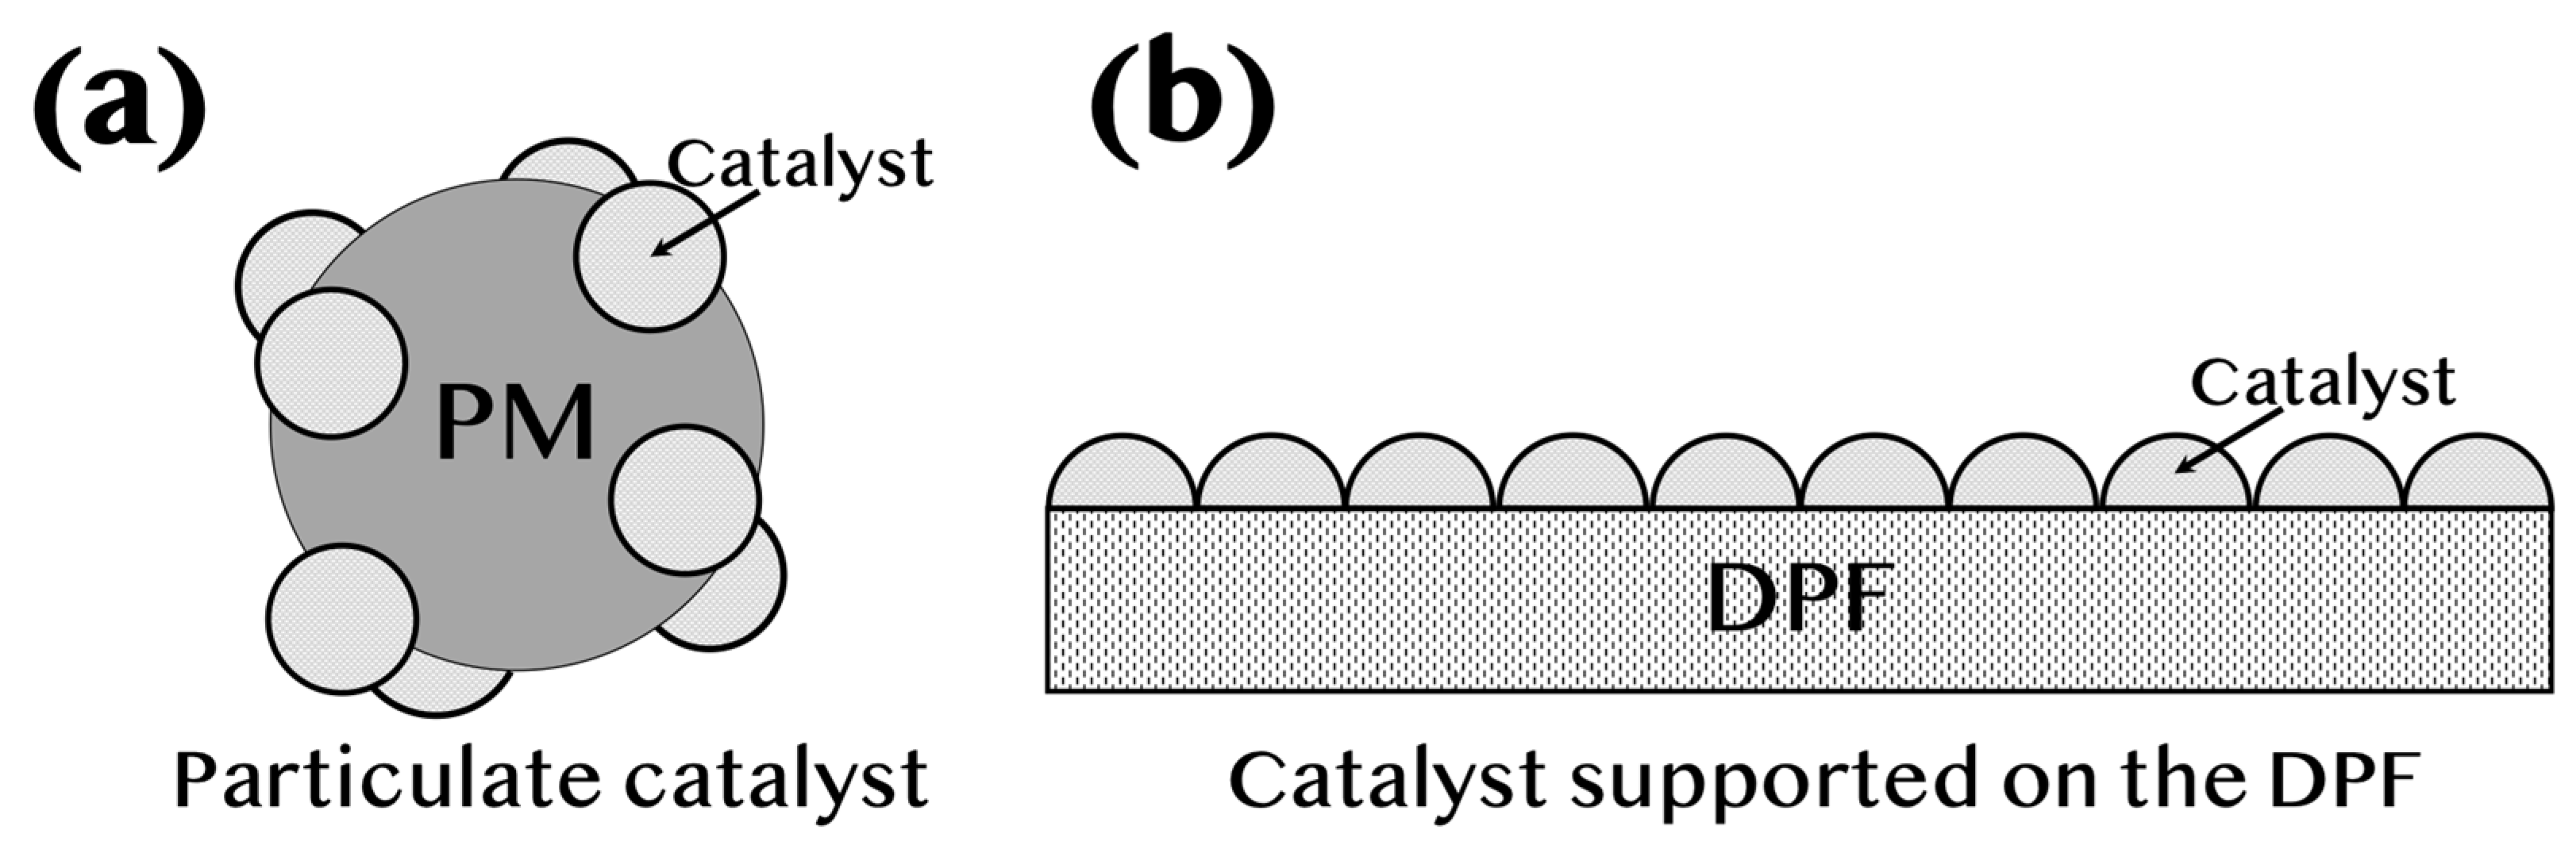
First, it is assumed that there is no heat transfer between PM particles and that the gas temperature and PM particles are at the same temperature in the PM oxidation reaction. Furthermore, it assumed that radiation or convection is not affected during PM oxidation. This is because there are fine PM particles of several μm sparsely distributed in the gas phase. Based on the above assumptions, the handling of heat will be explained.
First, the heat capacity, Q [J/K], of the cell to be calculated is shown by the following formula.
Q = C c V d c 1 μ + S C g
Cell deposition is V [mL], gas passage is S [mol], DPF wall transmittance is μ, the specific heat of the wall material (cordierite) is CC [J/(kg)], density is dC [kg/m3], and the specific heat of the exhaust gas is Cg [J/(gk)]. The PM reaction amount, Rpm [mol], is shown as
R p m = P M t = 0 t d P M d t d t .
The reaction temperature rise, ΔT [°C], at that time is shown as
Δ T = R p m Q .
At this stage, it is assumed that the PM particles retain their temperature, and the gas maintains its temperature as it moves between cells. When transitioning to the next cell, the wall temperature at the gas inflow side before the reaction is considered to be equal to the gas temperature. If the gas temperature exceeds approximately 650 °C, the following formula should be applied.
T R = T w + ( T P M ) / Q
The modified temperature is represented as TR [°C], the wall temperature as Tw [°C], and the PM combustion temperature as TPM [°C]. The temperature variation associated with PM oxidation is analyzed between unit cells j and j + 1 in the y-direction (Figure 6b). If PM is still present, oxidation generates heat, causing the gas temperature to rise. Conversely, if no PM remains, the gas temperature decreases. Additionally, in the x-direction, a temperature increase is anticipated between unit cells i and i + 1 due to the cumulative heat released by PM oxidation.

2.5. PM Oxidation

The PM oxidation process is represented by the following equation. In this study, it is assumed that PM undergoes a primary reaction, where oxidation occurs completely with carbon as the sole reactive component.
s o o t C + O 2 C O 2
The PM oxidation reaction rate per unit of time due to the reaction is shown as
d P M d t = A e x p E R T V O 2 · P M .
The frequency factor is A [m3/(mol·s)], the PM amount is PM [mol], the activation energy is E [kJ/mol], the gas constant is R [J/(K·mol)], and the absolute temperature set to T [K].

2.6. Reaction Between the Catalytic Reaction and O2 in the Gas Phase

In a previous report by Nakamura et al. [12,34,35,36,37,38], the reaction between the PM oxidation catalyst and PM was numerically calculated using a specific frequency factor and activation energy when all PM was in contact with the catalyst. However, in reality, as shown in Figure 4, there is a reaction to PM in contact with the catalyst (solid-phase reaction: SSR) and a reaction between oxygen in the gas phase and PM not in contact with the catalyst (gas-phase reaction: GPR). Therefore, in this study, we proposed a catalytic reaction model that explains the PM regeneration process in more detail.
A D P F = F r e q u e n c e   f a c t o r   w i t h i n   t h e   D P F F r e q u e n c y   f a c t o r   o f   t h e   p o w d e r   × A p
where ADPF is the frequency factor in the DPF, and Ap is the frequency factor for the powder. For this reason, we modeled the contact condition between the PM and catalyst and formulated the specific surface area for the two conditions: the powder and the inside of the DPF. We used this model to convert the frequency factor of particulate catalysts and used it to calculate in this study.

2.7. Calculation Conditions

In this study, numerical simulations were conducted using the proposed model to analyze PM deposition and oxidation behavior inside a DPF with catalysts. The conditions applied in the calculations are summarized in Table 1, Table 2 and Table 3. Table 1 presents the thermal properties of solid materials used in this study, including the oxidation heat of carbon, the specific heat capacity of cordierite, and the density of cordierite. These parameters were incorporated into the numerical model to evaluate heat transfer and temperature changes during PM oxidation. The oxidation heat of carbon determines the energy released during combustion, while the specific heat capacity and density of cordierite influence the thermal response of the DPF structure. Table 2 provides the structural and flow-related parameters of the DPF, including the total length and diameter of the filter, wall thickness, porosity, and exhaust flow rate. These values were implemented in the numerical calculations to determine the exhaust flow distribution, pressure drops across the filter, and the impact of PM accumulation on engine performance. The wall thickness and porosity are particularly important in defining the permeability of the filter, which affects PM-trapping efficiency and pressure loss. Table 3 lists the activation energy values used for the solid-state reaction (SSR) and gas-phase reaction (GPR) in the calculations. The activation energy values, ranging from 90 to 200 kJ/mol, were selected based on the previous literature and experimental data. Platinum-based and silver-based catalysts typically exhibit lower activation energies in a range of 90–140 kJ/mol, while cerium oxide-based and manganese-based catalysts fall within a range of 100–180 kJ/mol. Non-catalytic conditions generally require activation energies exceeding 180 kJ/mol. By evaluating different activation energies, this study aims to determine the optimal catalyst type for efficient PM oxidation under various operating conditions [10,11,12,13,14,15,16,17,18,19,20,21,22,23,24,25,26,27,28,29,30,31,32].
Additionally, the PM deposition amounts used in the calculations were set to 1 g, 10 g, 20 g, and 30 g to represent different real-world engine operating conditions. A PM deposition amount of 1 g represents a recently regenerated DPF or a low-emission condition, typically observed under continuous operation with efficient regeneration. A PM deposition amount of 10 g corresponds to a typical level of PM accumulation before regeneration, which is commonly encountered in standard engine cycles. A PM deposition amount of 20 g represents a high PM accumulation scenario, such as frequent stop-and-go urban driving, where incomplete regeneration leads to a higher PM load. A PM deposition amount of 30 g represents a worst-case scenario where excessive PM accumulation leads to significant back pressure, reduced engine efficiency, and the potential clogging of the DPF. These PM deposition levels were selected based on realistic PM accumulation estimates. For example, a 1.5 L diesel engine operating at a space velocity of 50,000 h−1 with a PM accumulation rate of 10 g/L results in an estimated PM accumulation of 30 g in a DPF volume of 3 L. This estimation aligns with real-world PM emission rates, where an engine emitting 0.1 g/kWh at 50 kW produces approximately 5 g/h of PM. Under normal regeneration conditions, PM is oxidized before reaching 30 g, but in cases of regeneration failure, excessive accumulation can occur, leading to increased pressure drop and decreased fuel efficiency. By incorporating these selected PM deposition amounts into the numerical model, this study aims to capture a wide range of practical operating conditions. This approach ensures that the results of the study apply to real-world DPF performance evaluation, allowing for the better optimization of catalyst selection and exhaust system design.

3. Result

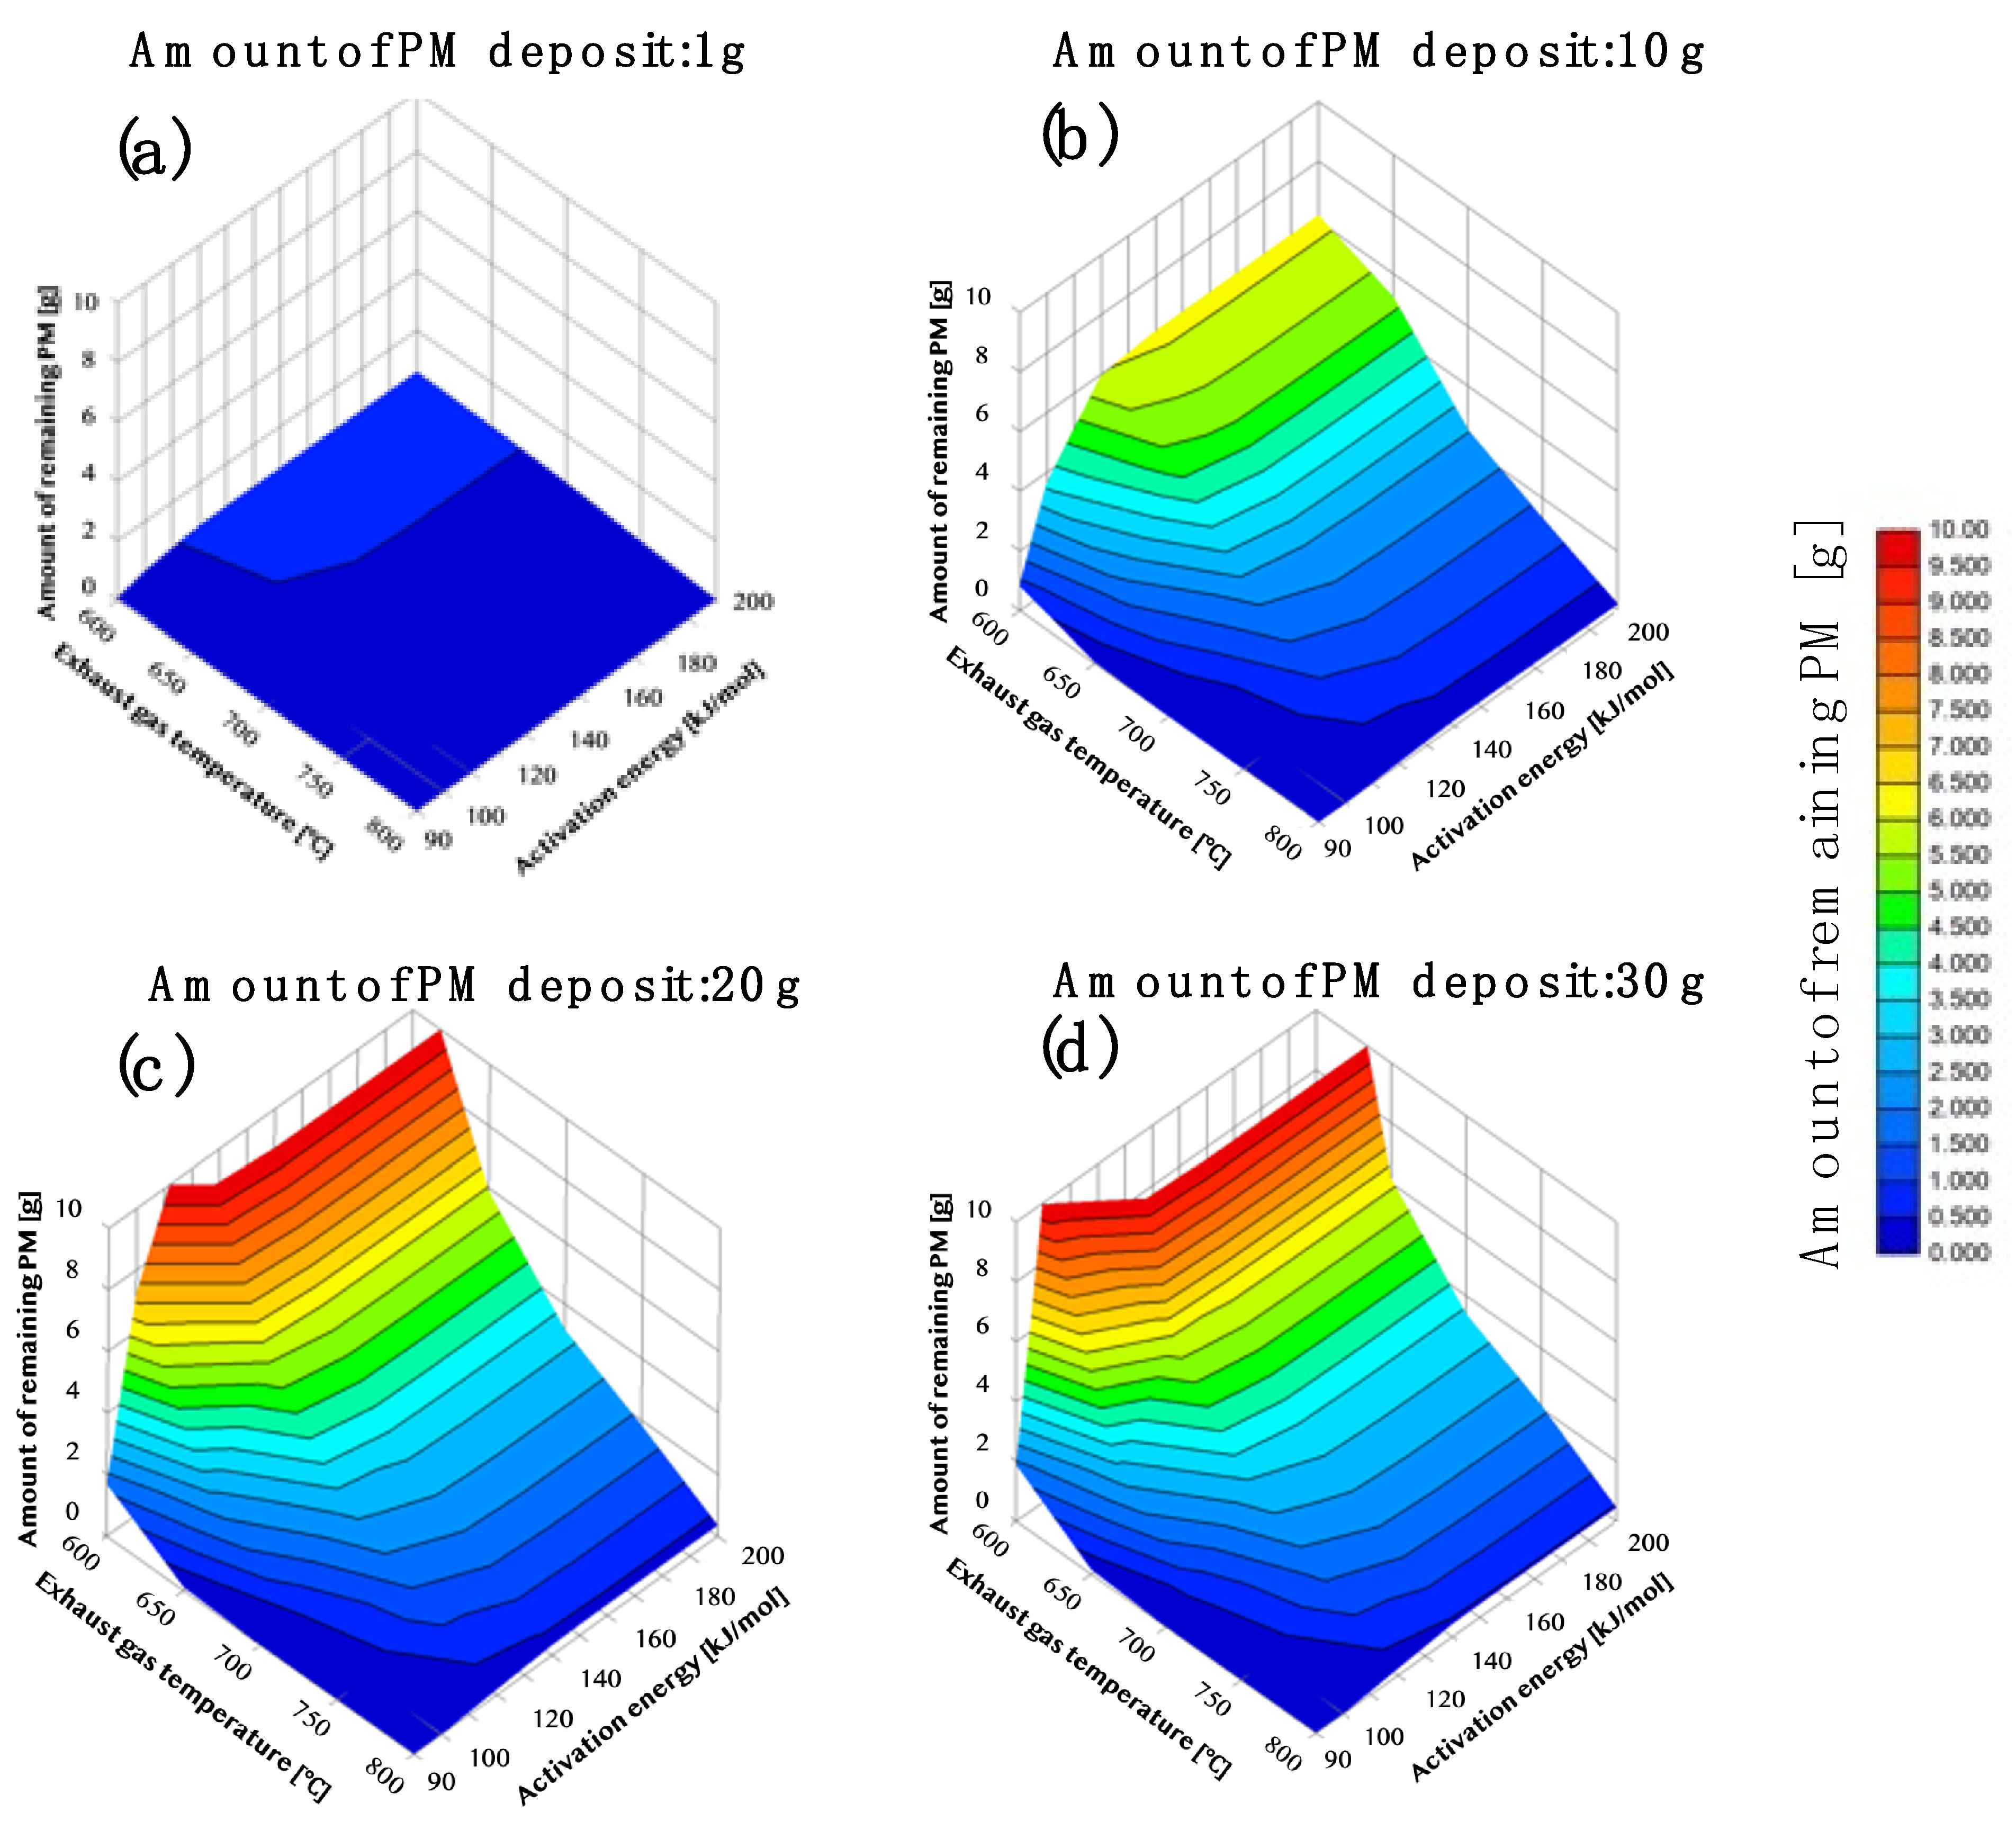
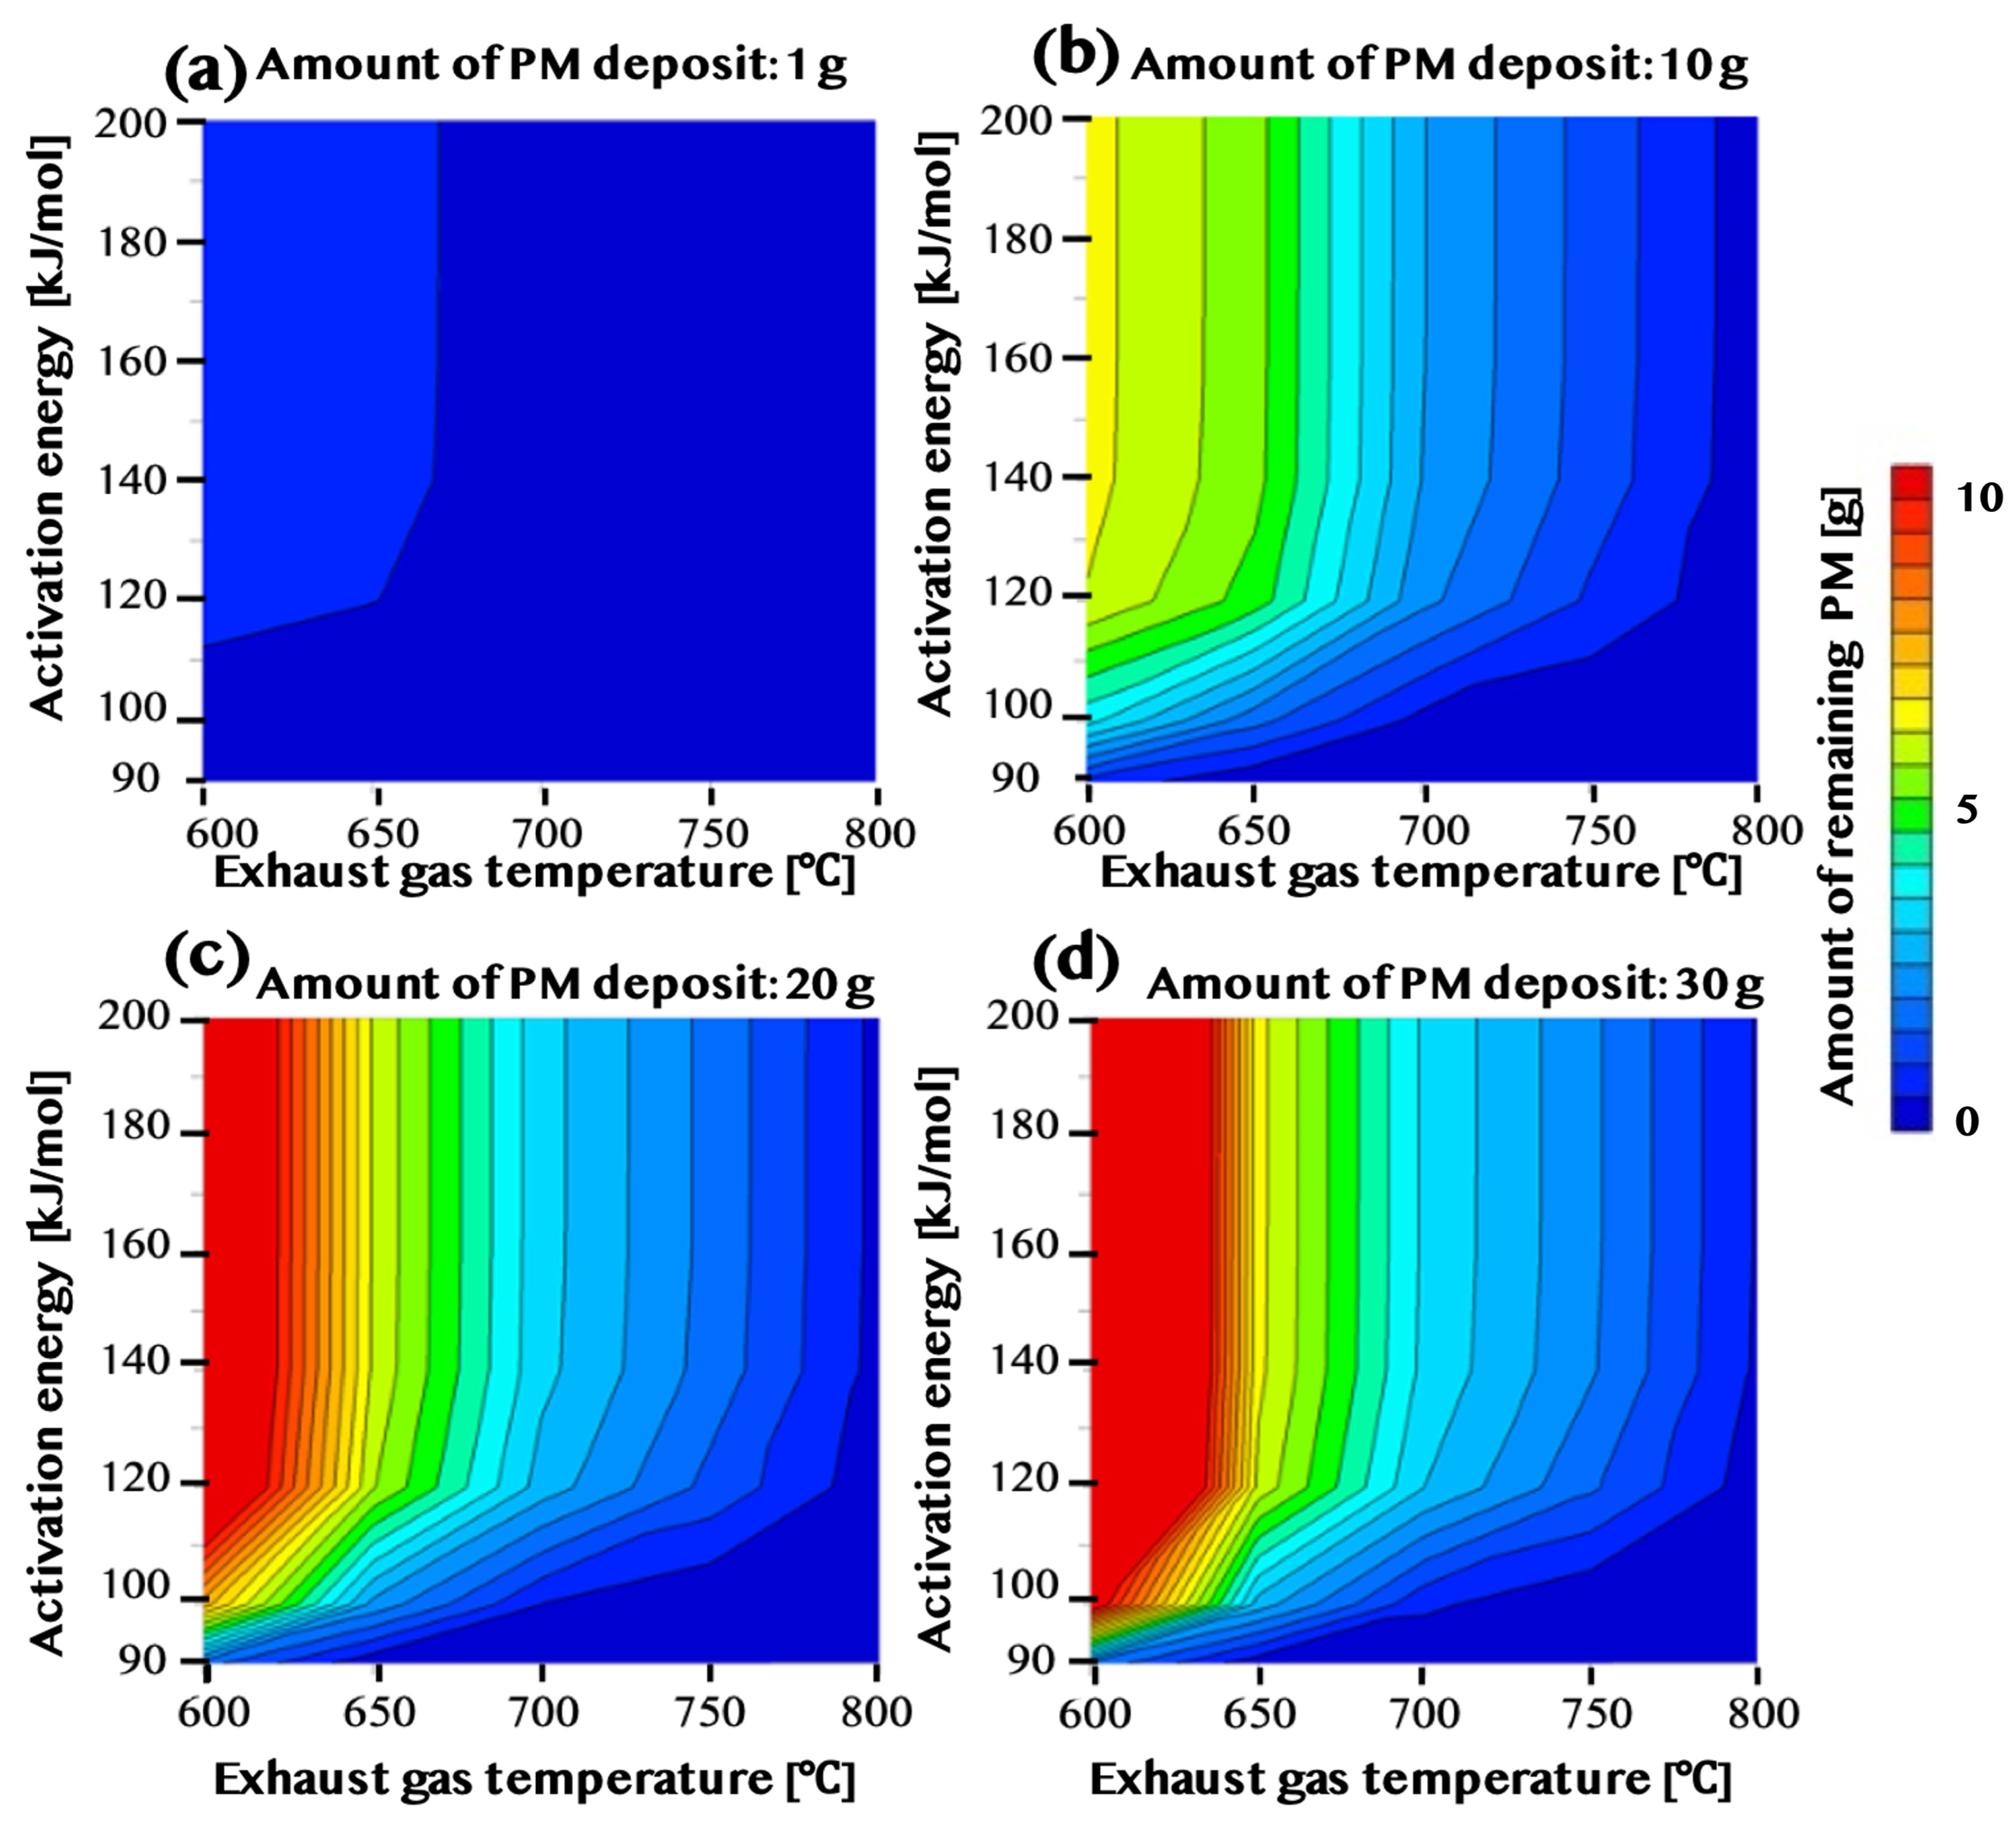
3.1. Three-Dimensional and Two-Dimensional Mapping of Amount of PM Remaining

Figure 7 shows the dependence of the regeneration condition. The x-axis shows the activation energy. The y-axis shows the exhaust gas temperature. The z-axis shows the remaining PM per unit deposited, including the space. The PM sedimentation quantities showing the relationships of the remaining amounts are (Figure 7a–d) 1 g, 10 g, 20 g, and 30 g. The remaining amount of PM according to each condition is shown in the field; when the remaining amount of PM is large, it is shown in red, and when the remaining amount is small, it is in blue.
Figure 8 shows that when the amount of PM deposited is as low as 1 g, the amount of PM remaining is low when the activation energy is low (Figure 8a). For E = 90 and 100 kJ/mol, the amount of remaining PM is 0.5 g or less even at 600 °C. On the other hand, when the activation energy is 120 kJ/mol or more, the residual amount of PM is 0.5 g or more. However, when the temperature becomes 700 °C or more, the remaining amount of PM in all conditions becomes 0.5 g or less. Similarly, when the PM deposition amount is 10 g, the remaining amount of PM when the activation energy is low (Figure 8b). When the activation energy is 90 kJ/mol at 650 °C or higher, the remaining amount of PM becomes 0.5 g or less. However, when the activation energy is 120 kJ/mol, the residual amount of PM does not become 0.5 g or less unless the condition is 750 °C or higher. The behavior is almost the same when the activation energy is 140 kJ/mol or more. When the amount of PM deposited is as large as 20 g or 30 g, the condition becomes more severe (Figure 8c,d). When the activation energy is E = 90, the remaining amount of PM becomes 0.5 g or less at 650 °C or higher. However, it has been found that about 700 °C is required when the activation energy is 100 kJ/mol, and about 800 °C is required when the activation energy is 120 kJ/mol. In addition, in the case of low temperature, the remaining amount of PM was very large, 10 g or more. This is because the action of the catalyst supported on the DPF is effective only for the PM in direct contact. In the case of a large amount of PM, all of the PM is not in direct contact with the catalyst. When the amount of PM deposited is large, most of the PM becomes a reaction in the gas phase. Thus, the higher the temperature, the better the combustion rate of the PM. Conversely, when the amount of PM deposited is small, the catalyst and most PM come into contact. In this case, the combustion efficiency of the PM is good when the activation energy of the catalyst is low even at a low temperature. In other words, we found that the catalyst is effective when the amount of PM deposited is small.
These results can evaluate the activities of the catalysts used to the fullest extent, for example, when the conditions are E = 120 kJ/mol, T = 800 °C, and the amount of PM deposited = 20 g. In order to lower the exhaust temperature by 100 °C compared with the catalyst-free catalyst, it is more effective to select a catalyst with an activation energy of less than 100 kJ/mol. Using the 3D map and 2D map proposed by us, we can investigate the activity of the catalyzer and the remaining amount of PM-burned gas that is provided by the exhaust gas temperature.

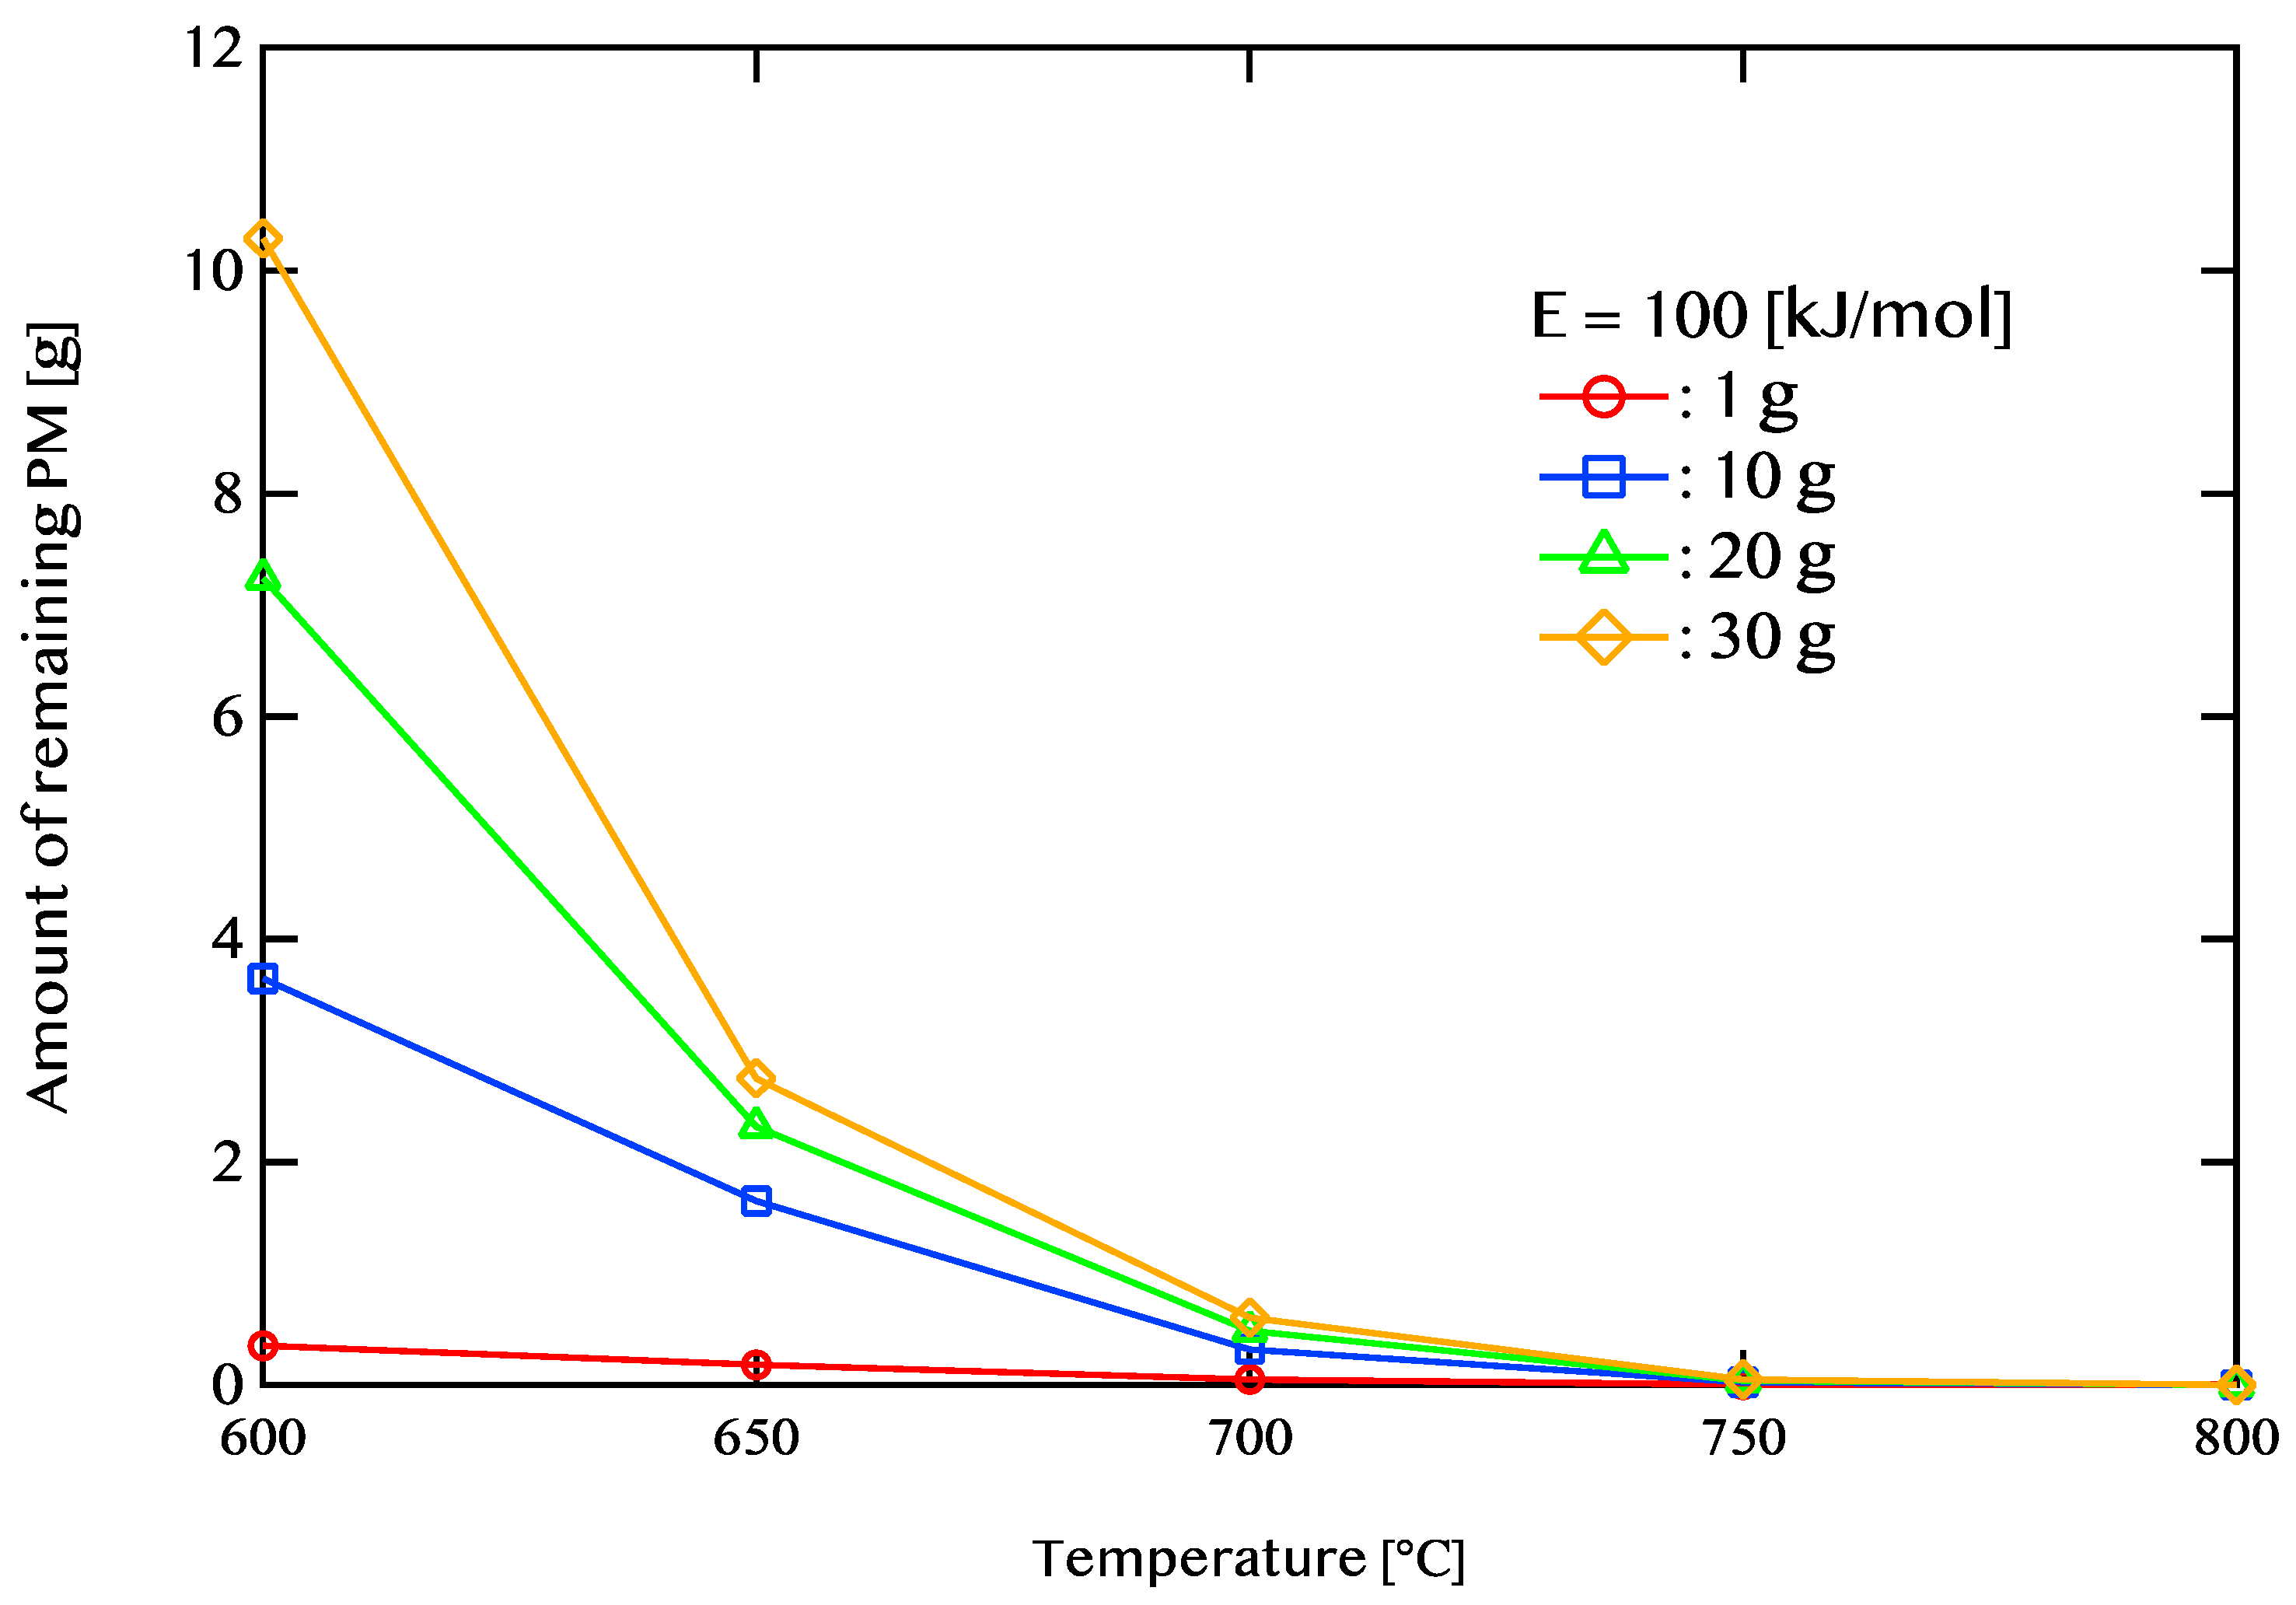
3.2. Dependence of Exhaust Gas Temperature and Amount of Remaining PM

Figure 9 illustrates the relationship between exhaust gas temperature and the remaining amount of PM. The conditions for this analysis include an activation energy of 100 kJ/mol; an exhaust flow rate (GA) of 30 g/s; and PM deposition amounts of 1 g, 10 g, 20 g, and 30 g, with temperatures set at 600, 650, 700, 750, and 800 °C. When the exhaust gas temperature is 600 °C, a substantial amount of PM remains trapped in the DPF. When 30 g of PM is initially deposited, the unburned PM amount is 10.29 g. Conversely, for an initial PM deposit of 1 g, only 0.35 g remains unburned. As the temperature increases, the extent of PM combustion also improves. For instance, at 650 °C, even when 30 g of PM is accumulated, the remaining unburned PM is reduced to 2.7 g.
Figure 10 depicts the relationship between pressure drop and elapsed time for PM deposition amounts of 1 g and 30 g. In the case where the PM deposit is 1 g, at an exhaust gas temperature of 600 °C, the unburned PM amount is 0.35 g, and the pressure drop is relatively low at 11.21 kPa. At 800 °C, despite the PM being almost entirely combusted, the pressure drop reaches 12.77 kPa, which can be attributed to thermal expansion effects. Maintaining lower exhaust gas temperatures can help regulate pressure drop, making low-temperature combustion a desirable approach.
For a PM deposition amount of 30 g, a sharp rise in pressure drop occurs within the first 100 s of the regeneration process. At an exhaust temperature of 800 °C, the pressure drop reaches 107 kPa. After approximately 300 s, the pressure drop decreases and remains relatively stable until 5400 s. However, at 600 °C, the PM does not significantly decrease. Under this condition, both the remaining PM amount and the pressure drop are significantly high at 10.29 g and 33.12 kPa, respectively. When the exhaust temperature is raised to 800 °C, the residual PM is nearly eliminated, and the pressure drop reduces to 12.77 kPa. At 700 °C, even with 0.61 g of residual PM, the pressure drop remains low at 12.72 kPa. Furthermore, at 750 °C, the lowest pressure drop, 12.30 kPa, is observed with only 0.04 g of remaining PM.
These findings indicate that, at lower exhaust gas temperatures, gas-phase reactions play a more dominant role compared to direct contact with the catalyst. Additionally, when the PM deposition is high, the pressure drop tends to rise irrespective of activation energy. To mitigate excessive pressure drops while handling large PM accumulations, an exhaust temperature range of approximately 700 to 750 °C is considered optimal.

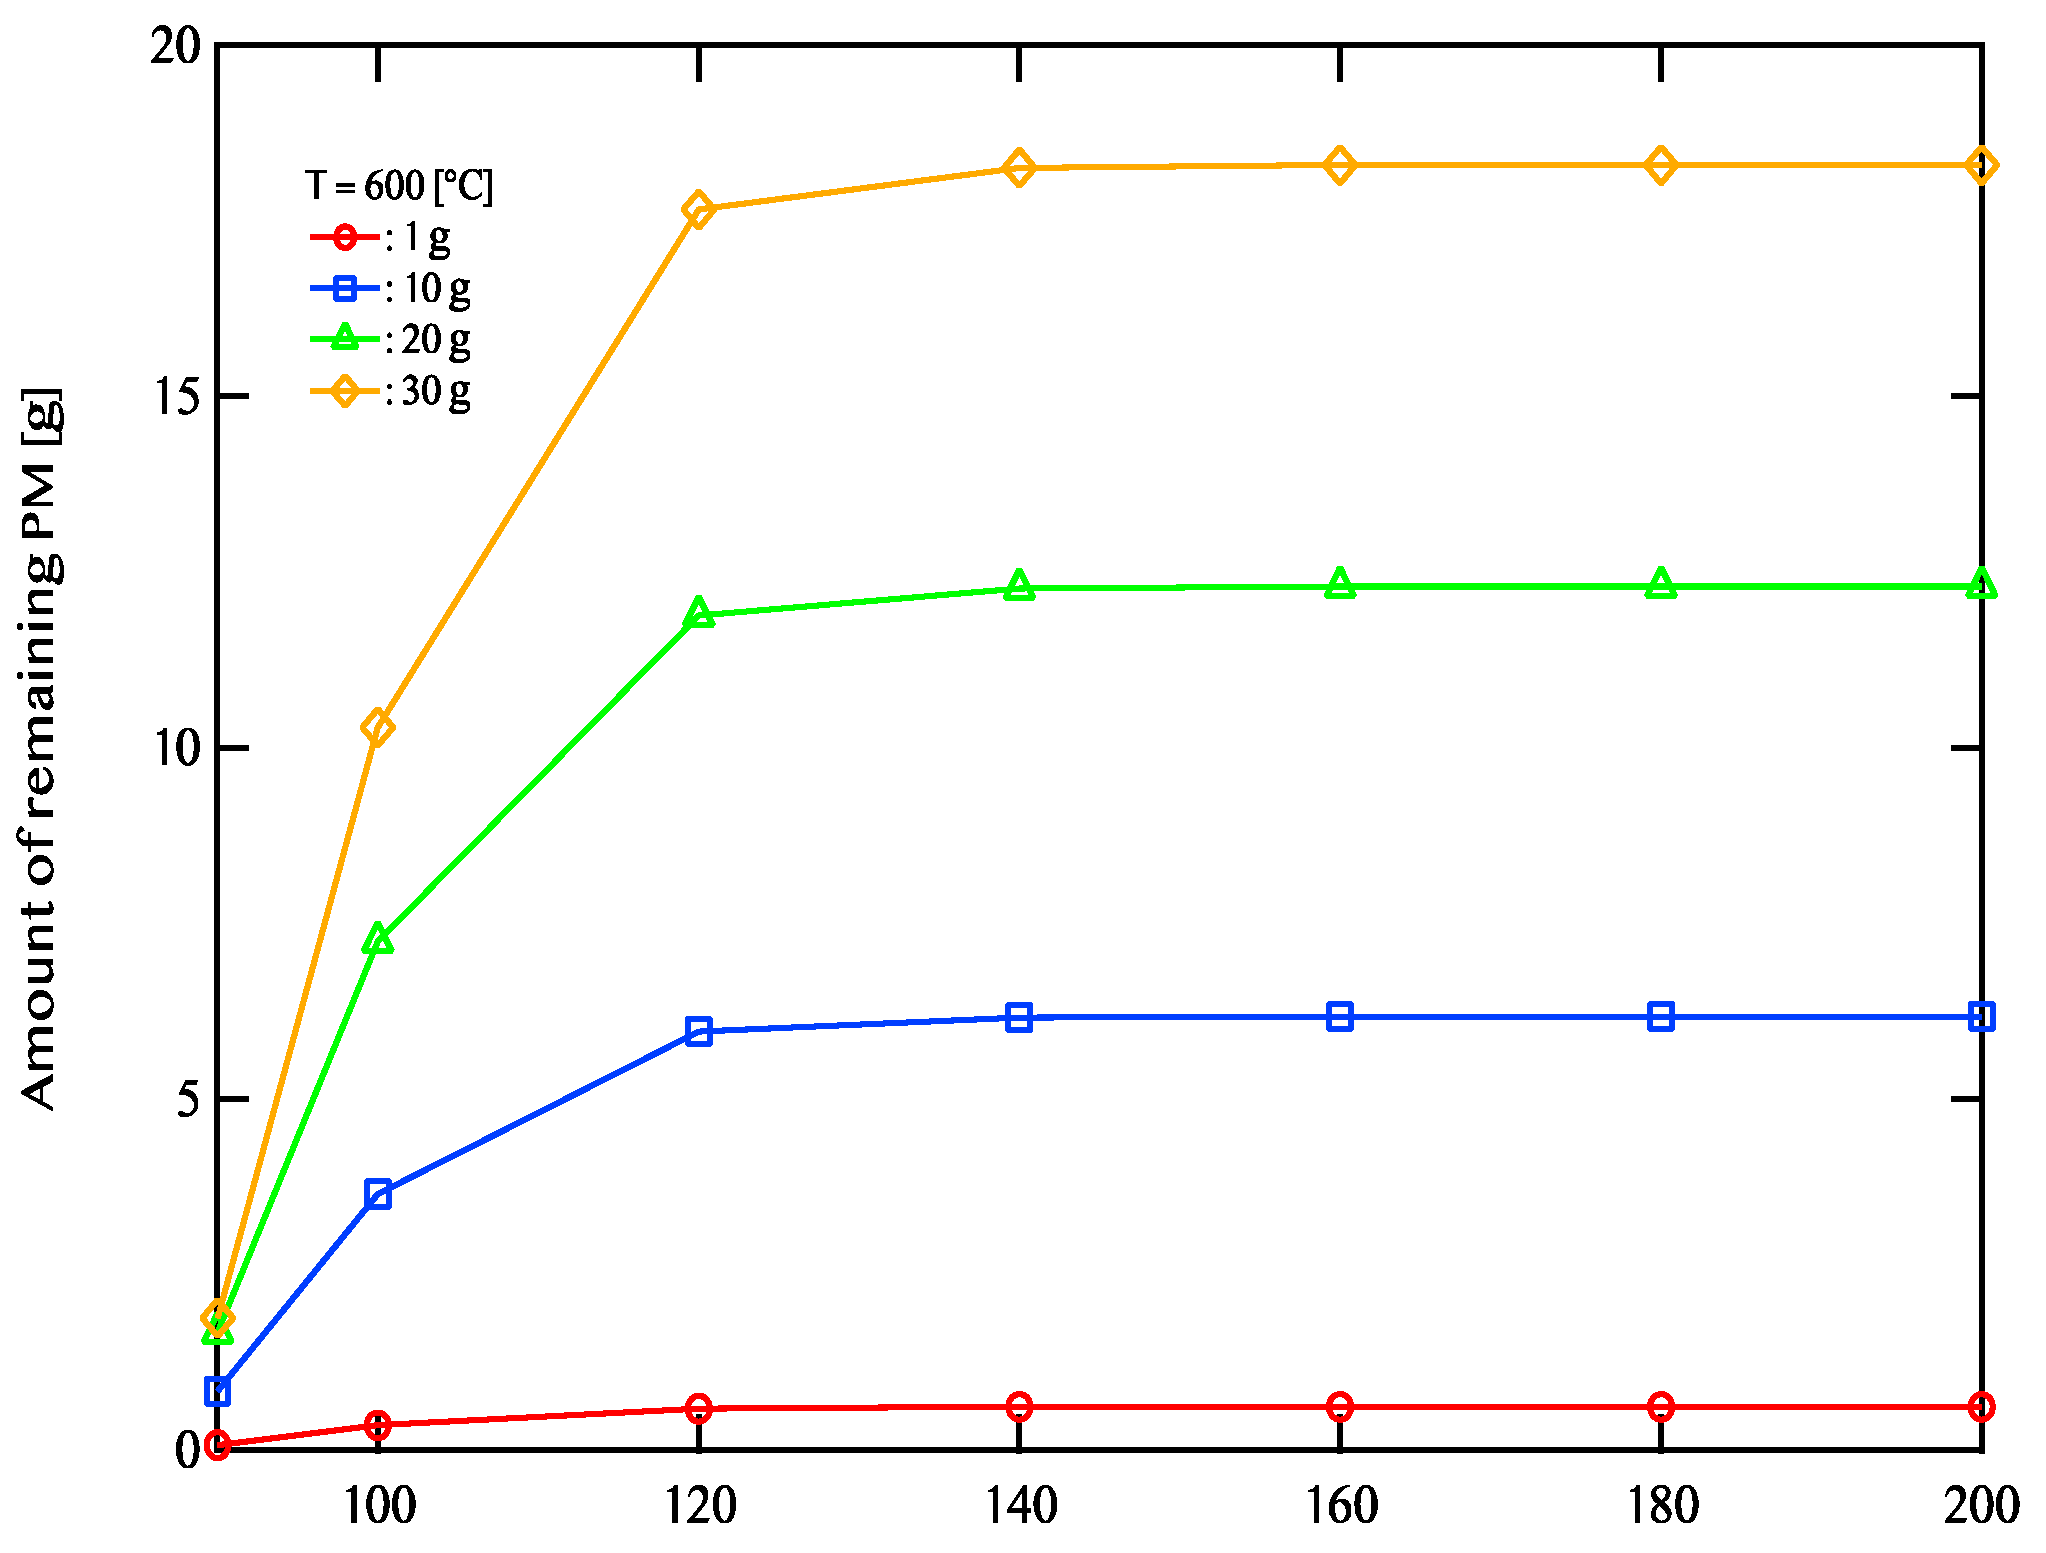
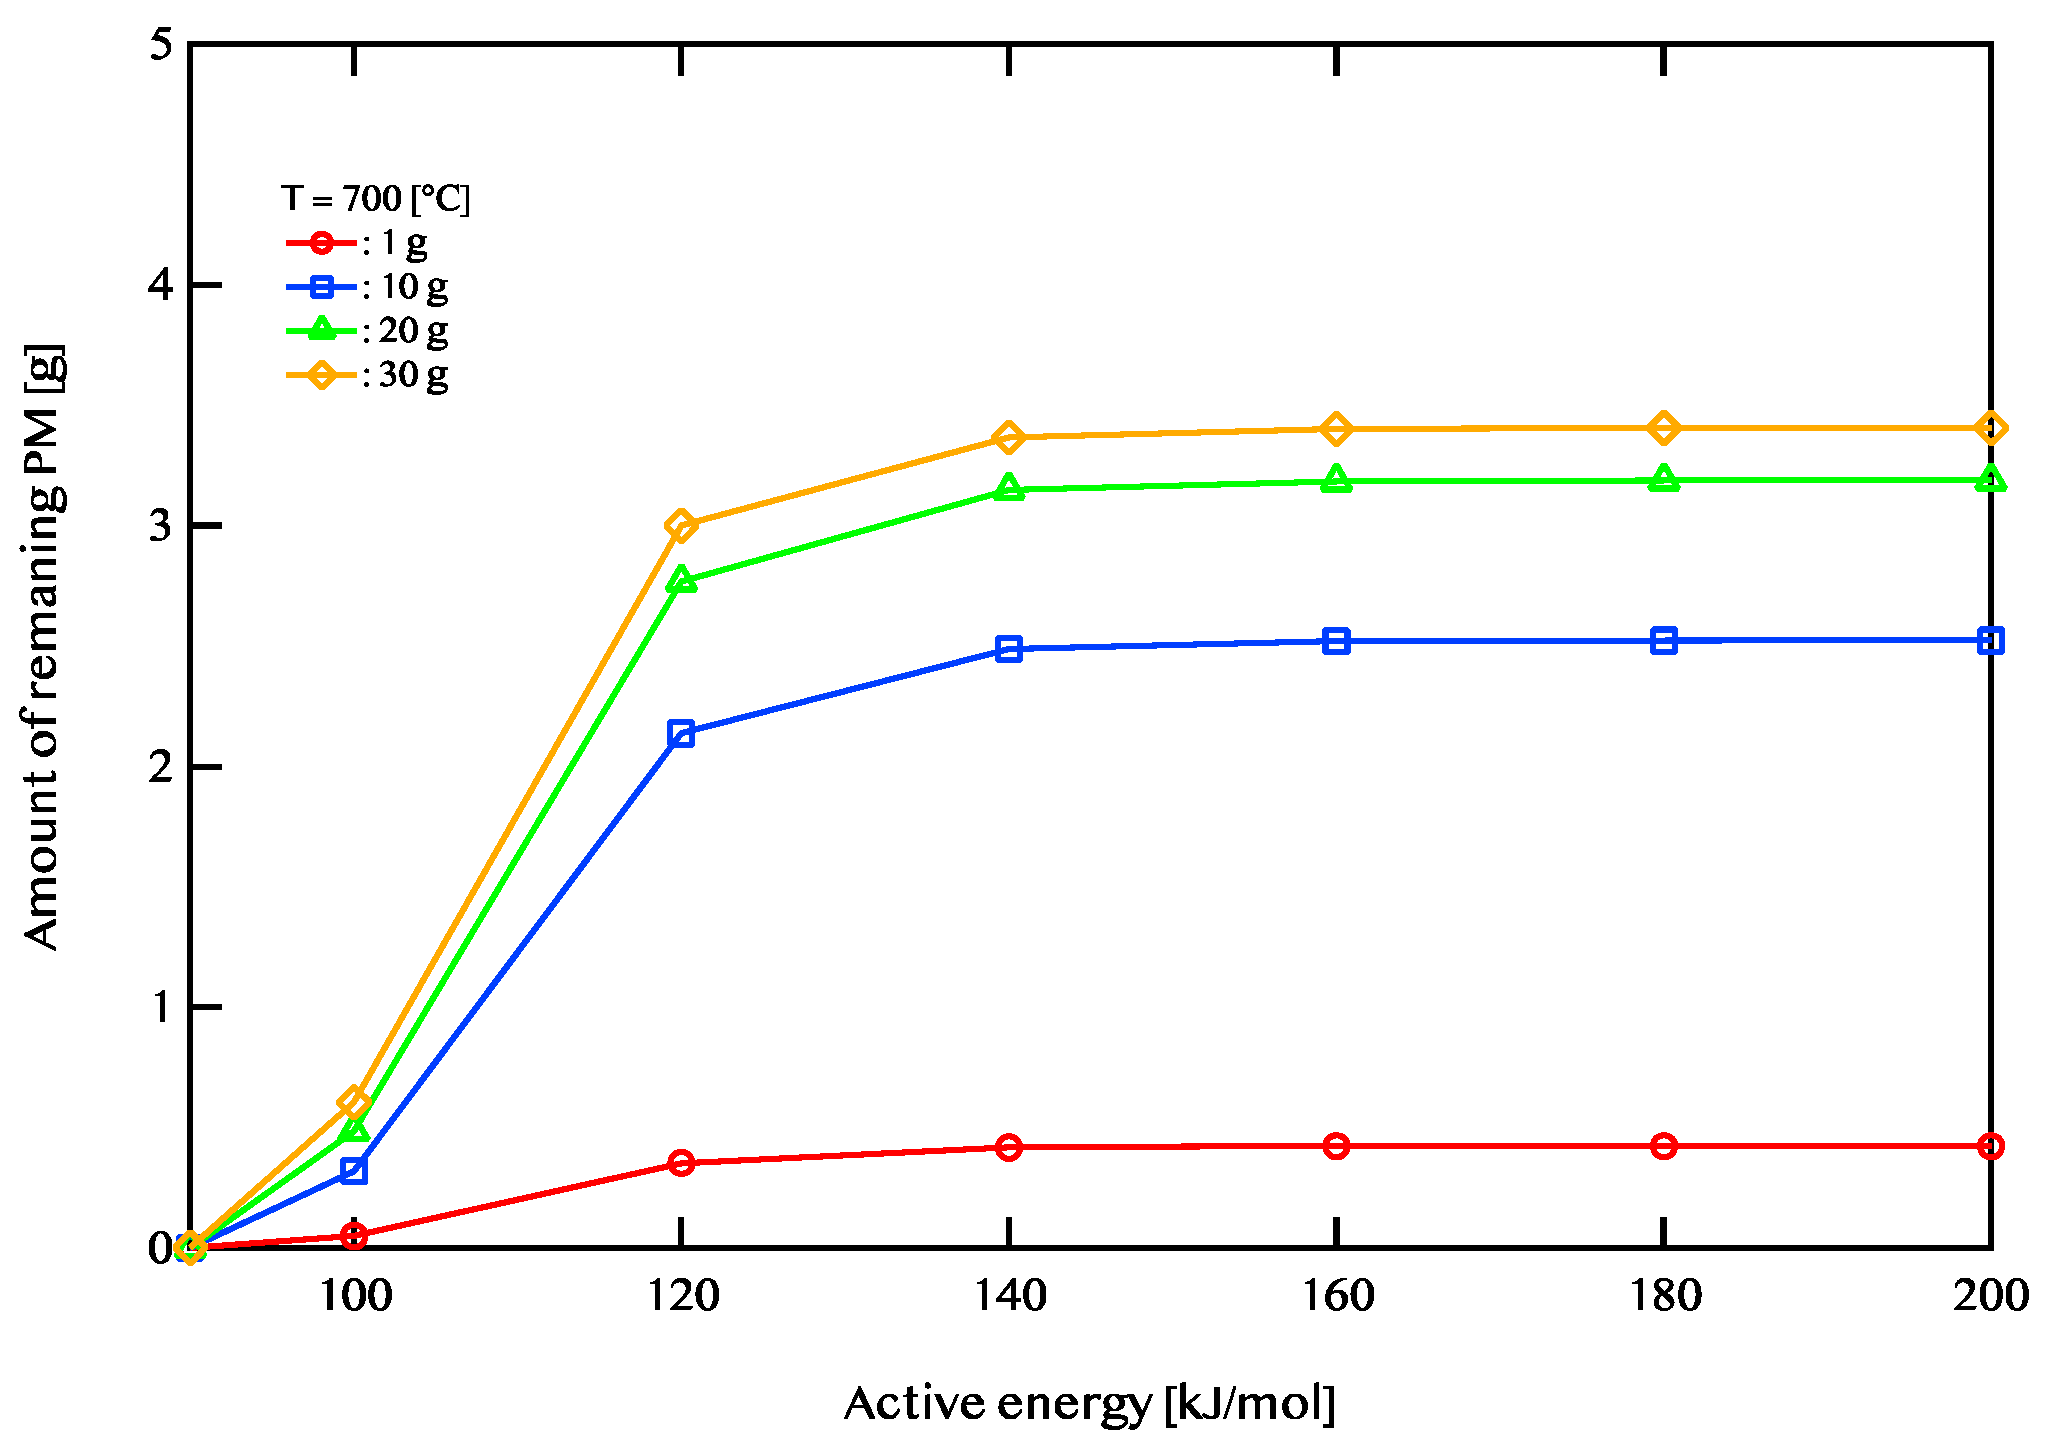
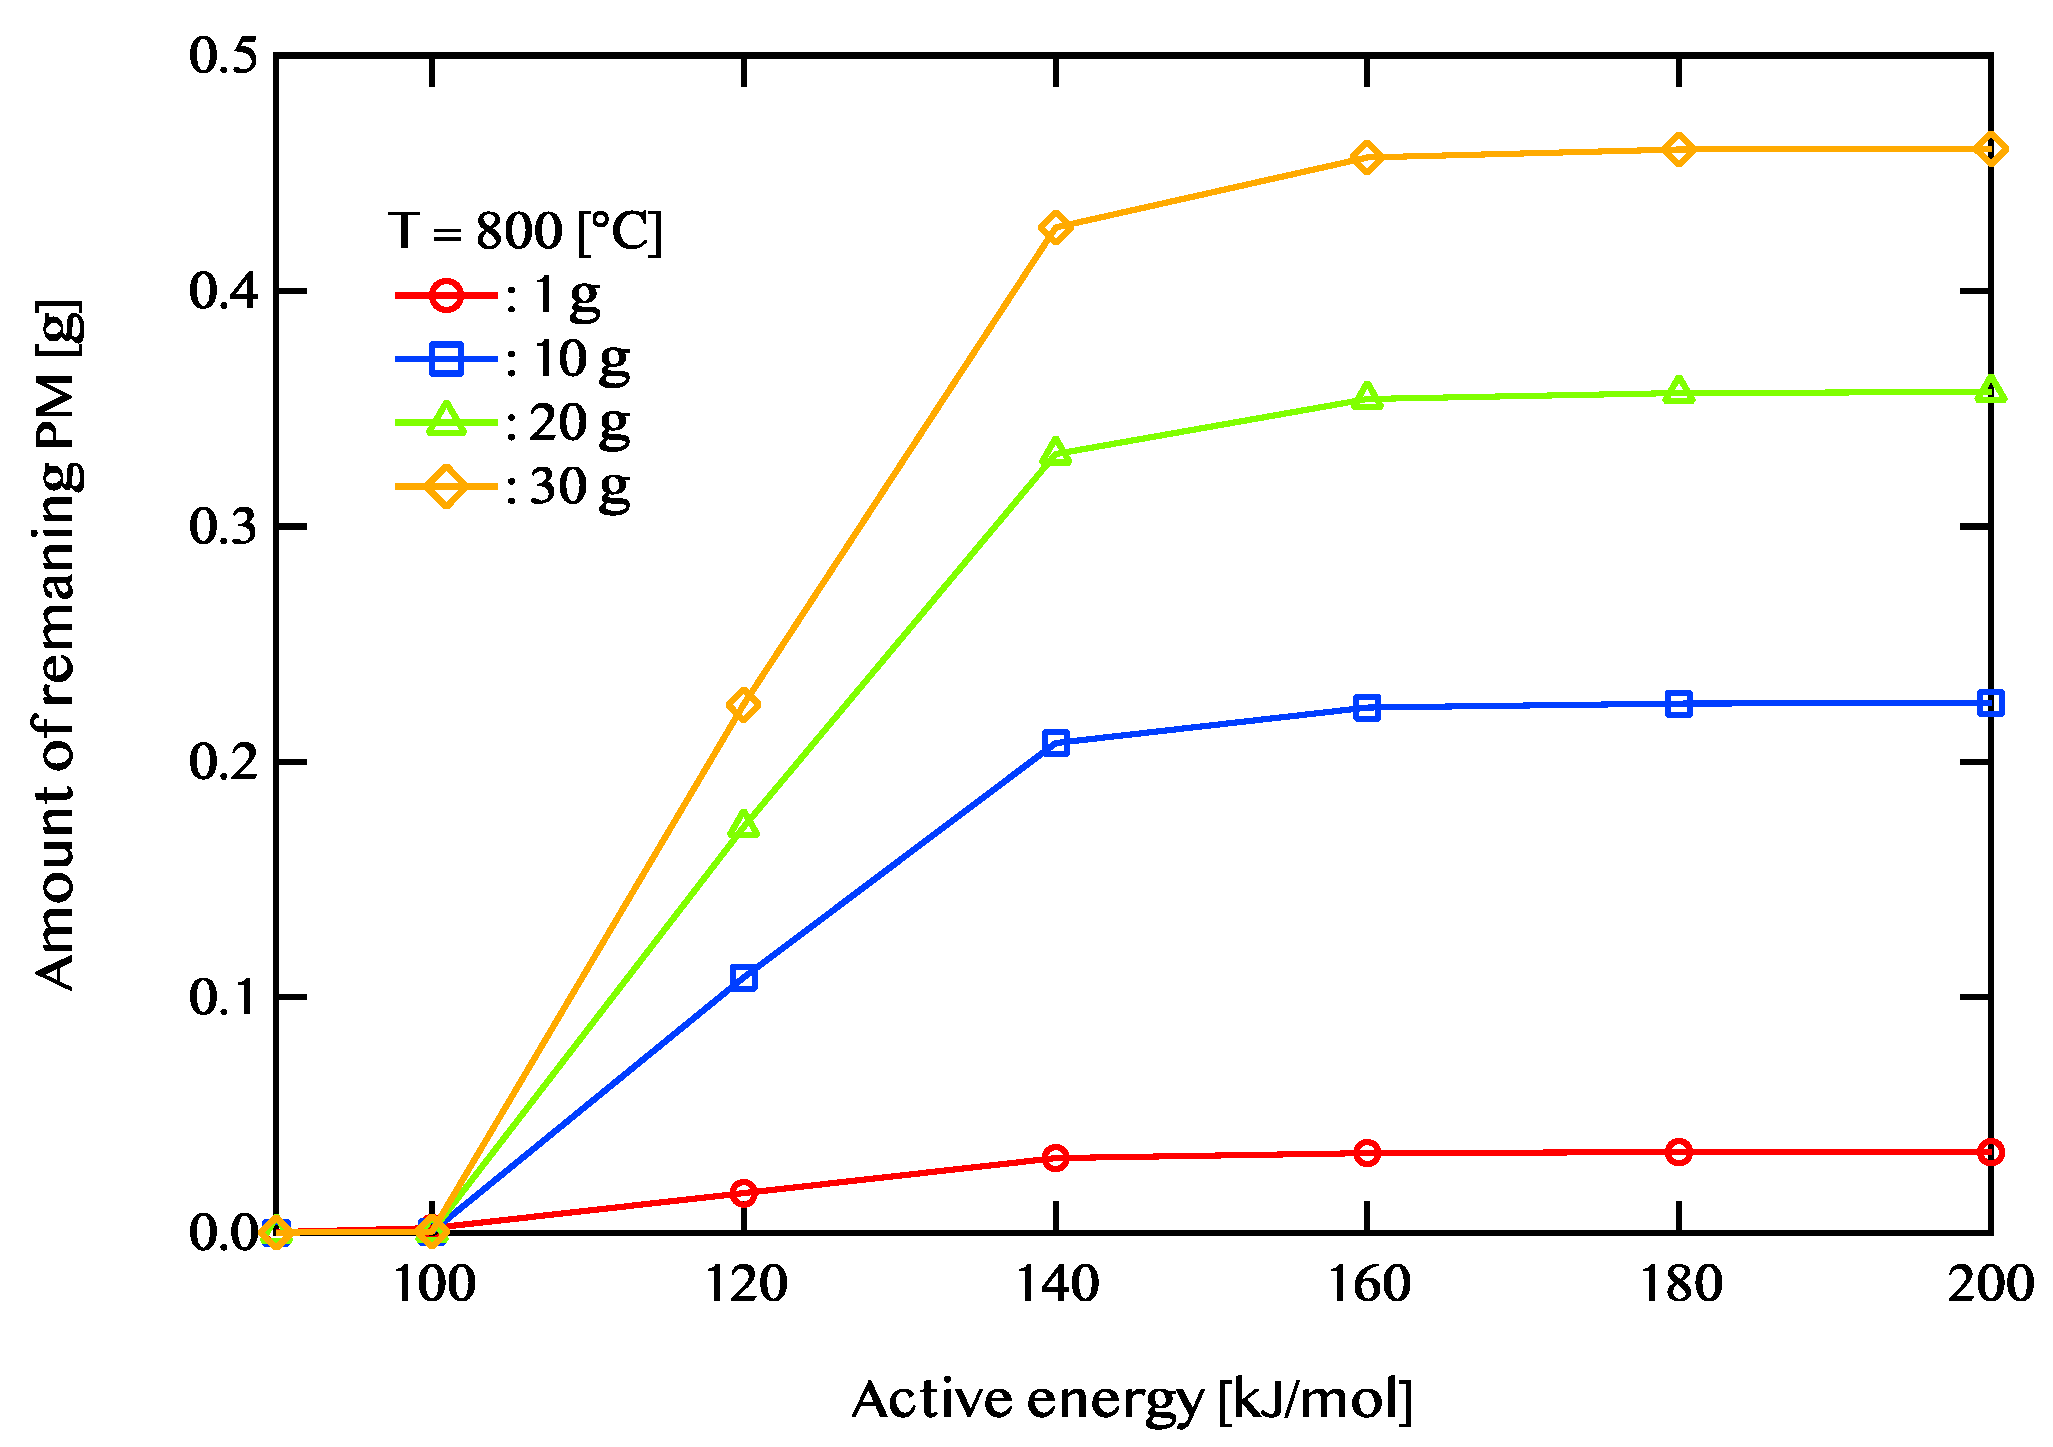
3.3. Impact of Activation Energy

Figure 11, Figure 12 and Figure 13 illustrate the relationship between activation energy and the amount of remaining PM. Specifically, Figure 11 corresponds to an exhaust gas temperature of 600 °C, Figure 12 represents 700 °C, and Figure 13 depicts 800 °C. At 600 °C, when the activation energy exceeds 120 kJ/mol, the remaining PM amount remains nearly constant. Similarly, at 700 °C, the PM residue shows little variation when the activation energy is 140 kJ/mol or higher. At 800 °C, the remaining PM amount stabilizes beyond an activation energy of 160 kJ/mol. For efficient PM combustion at 600 °C, catalysts with activation energies below 120 kJ/mol are beneficial. When the exhaust temperature is increased to 700 °C, catalysts with activation energies of 140 kJ/mol or lower are more effective. Likewise, at 800 °C, catalysts with activation energies of 160 kJ/mol or less demonstrate better performance. The findings indicate that as the exhaust temperature rises, the range of activation energies that enable effective catalytic performance expands. Additionally, PM combustion efficiency improves at lower activation energies when the exhaust temperature is high.

4. Summary and Conclusions

We investigated the processes of PM deposition and oxidation within a DPF using a catalyst through numerical calculations. Both 3D and 2D mapping were employed to visualize the results. This study analyzed the remaining PM amount and pressure loss in the DPF under varying activation energies and exhaust gas temperatures for different catalysts. Based on these findings, the correlation between exhaust gas temperature and activation energy for PM combustion catalysts was mapped and is outlined below.
(1)
The relationship between the exhaust gas temperature and the activation energy for the PM combustion catalyst was mapped. These results can evaluate the activities of the catalysts used to the fullest extent. We suggest that the optimum conditions may differ depending on the PM combustion catalyst used.
(2)
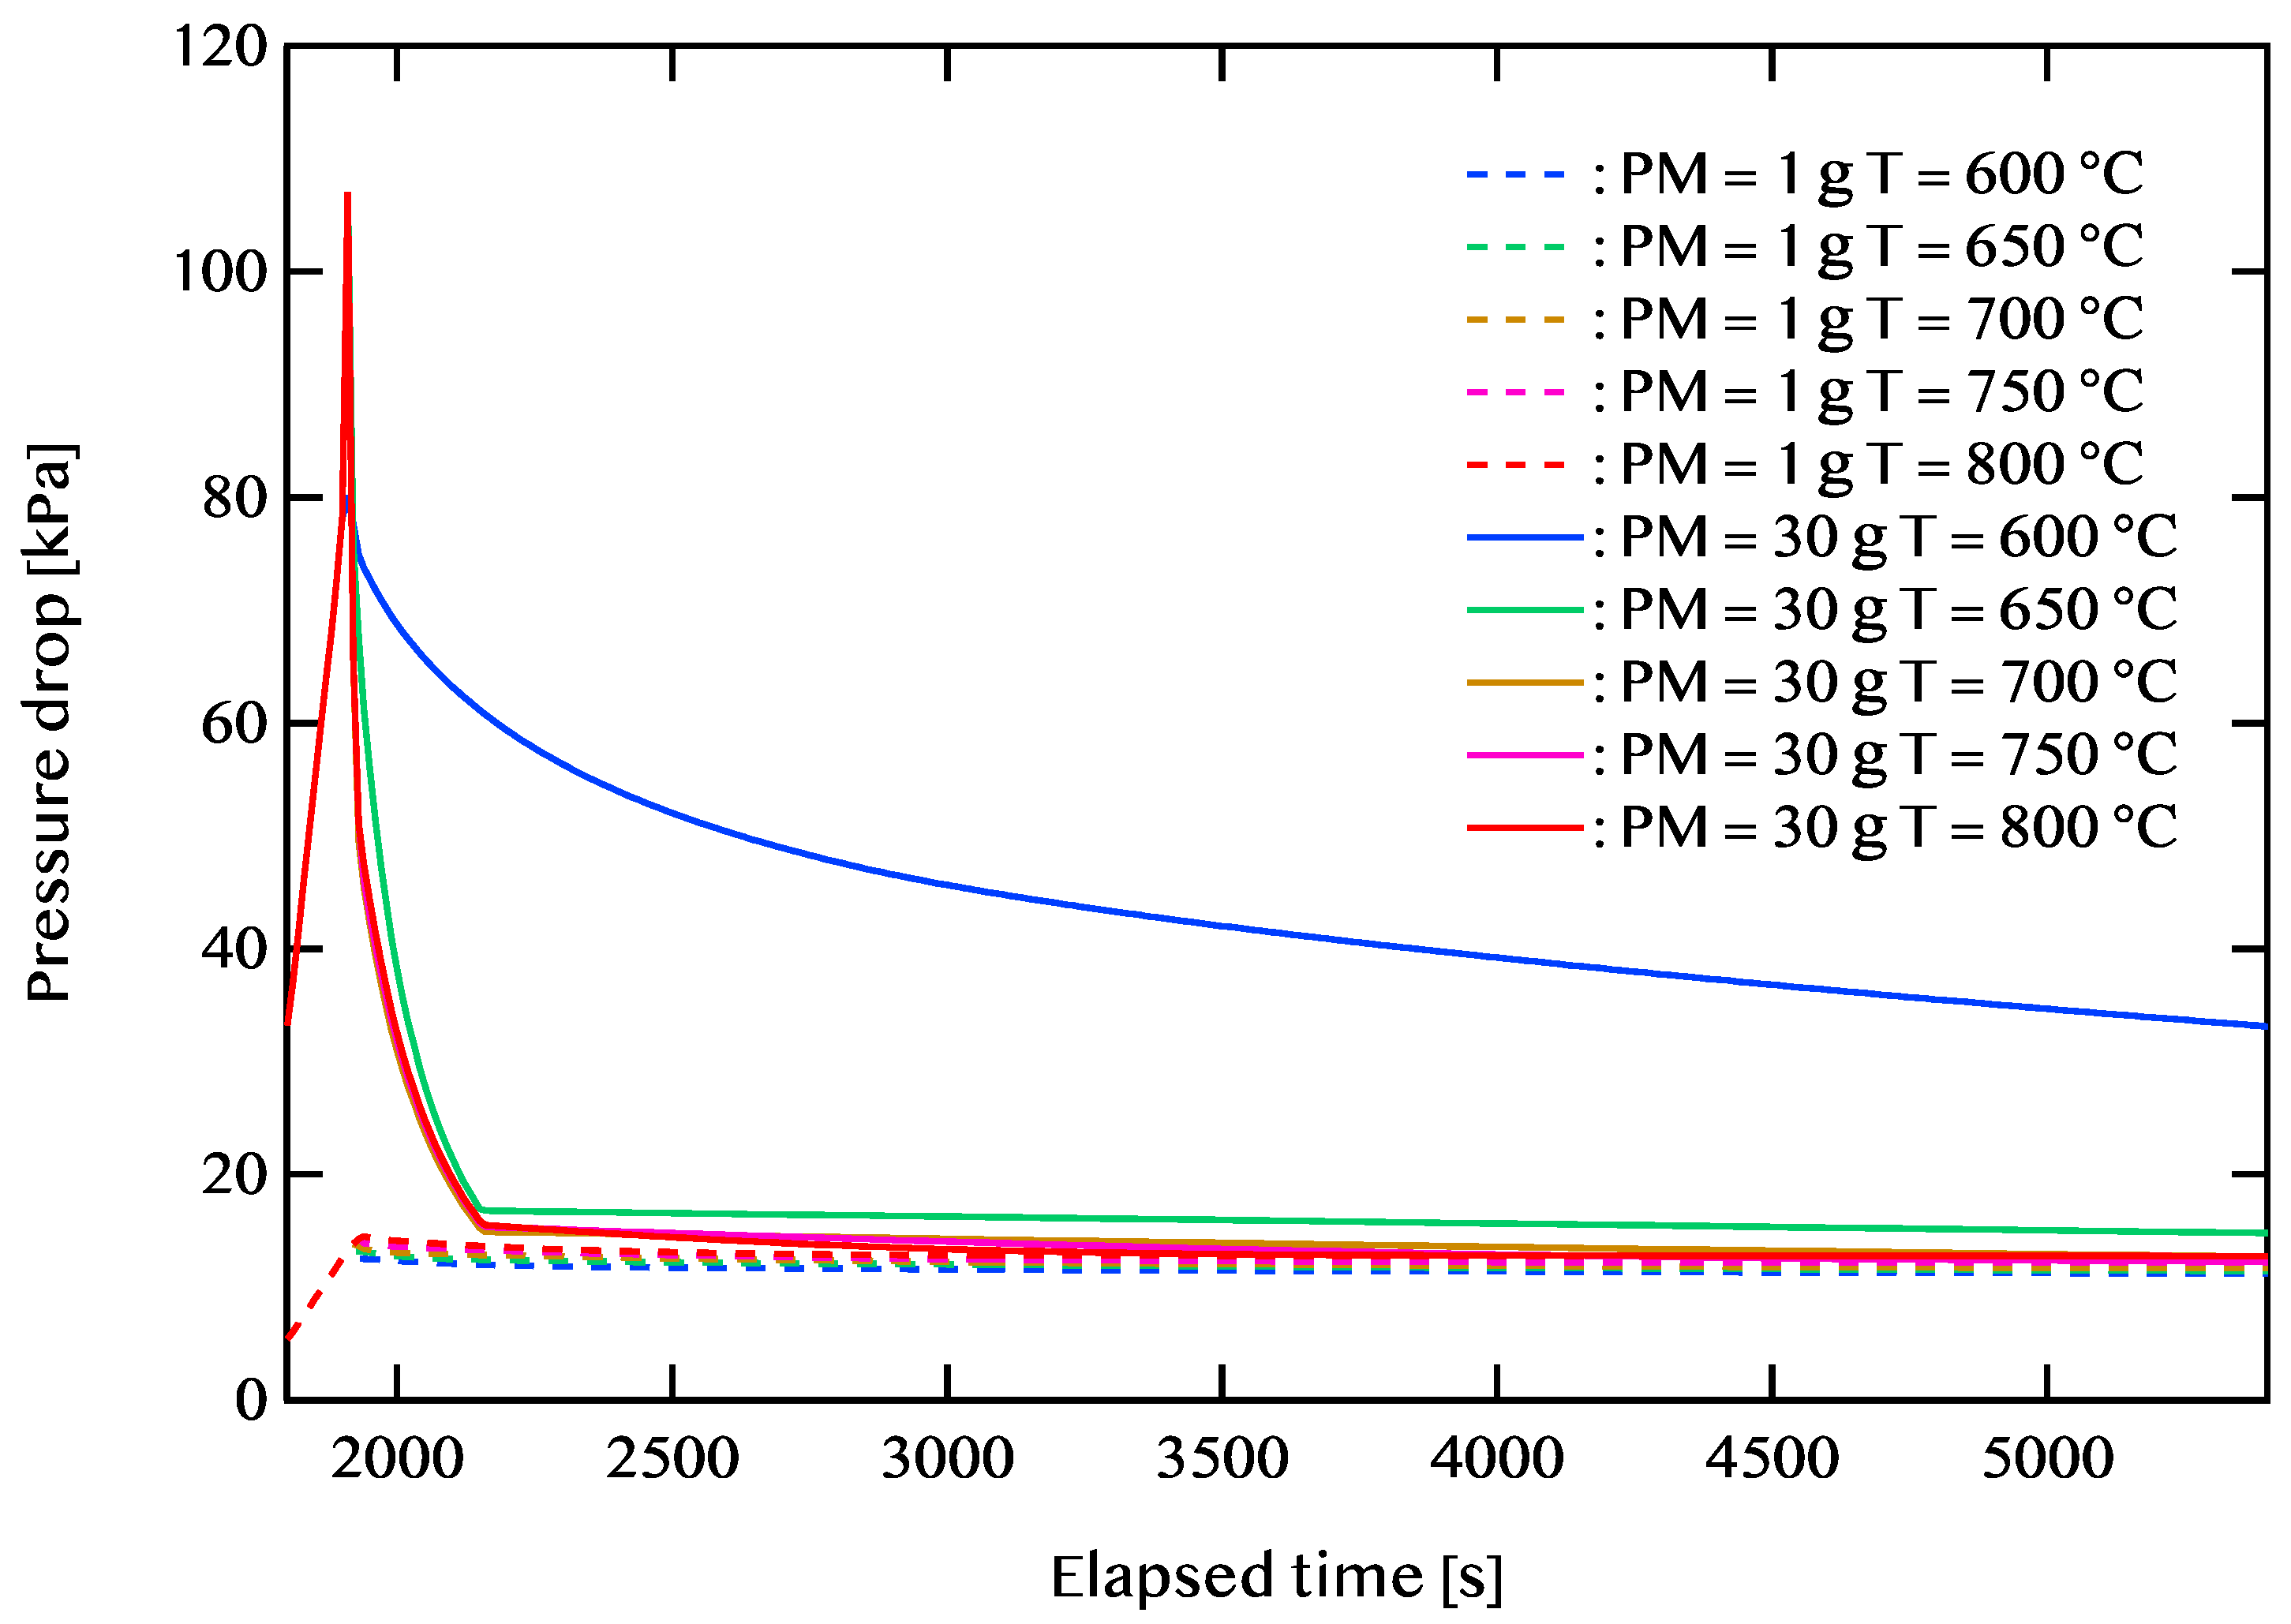
When the amount of PM deposited is low, the catalytic reaction plays a more significant role. To maximize catalyst efficiency, it is preferable to perform regeneration with a smaller PM accumulation. Conversely, when the PM deposition exceeds approximately 20 g, gas-phase reactions become more dominant than direct catalytic contact. Additionally, the results indicate that pressure loss increases regardless of activation energy when a large amount of PM is present. To minimize pressure loss even under high PM accumulation, maintaining the exhaust gas temperature within a range of 700 to 750 °C is recommended. Furthermore, it was observed that when a catalyst is applied, regeneration time at elevated temperatures (above 650 °C) can be reduced.
(3)
The study also revealed that lower activation energy enhances PM combustion efficiency at high exhaust gas temperatures. This suggests that higher temperatures expand the effective range of catalytic activity. A threshold for catalytic efficiency was identified between activation energies of 100 and 120 kJ/mol.
By utilizing the 3D and 2D mapping techniques developed in this study, the catalytic activity and the remaining PM after combustion can be evaluated as a function of exhaust gas temperature. The results provide valuable insights for optimizing the design of DPF systems incorporating catalysts.

Author Contributions

Conceptualization, M.N., K.Y. and M.O.; Methodology, M.N., K.Y. and M.O.; Software, K.Y.; Formal analysis, M.N.; Writing—original draft, M.N.; Writing—review & editing, M.N. and M.O.; Visualization, M.N.; Supervision, M.N. and M.O. All authors have read and agreed to the published version of the manuscript.

Funding

This work was supported by JSPS KAKENHI, Grant Number 20K04325, and the Creation of Life Innovation Materials for Interdisciplinary and International Researcher Development of the MEXT.

Institutional Review Board Statement

Not applicable.

Informed Consent Statement

Not applicable.

Data Availability Statement

The original contributions presented in this study are included in the article. Further inquiries can be directed to the corresponding author.

Conflicts of Interest

The authors declare no conflict of interest.

Definitions/Abbreviations

AFrequency factor [m3/(mol·s)]
aLongitudinal mesh width [m]
bLateral mesh width [m]
CCSpecific heat of cordierite [J/(kg·K)]
CgSpecific heat of exhaust gas [J/(kg·K)]
DDPF diameter [m]
DcDensity of cordierite [kg/m3]
EActivation energy [J/mol]
ΣFTotal flow rate [m3/s]
iCell number in the x direction [-]
jNumber in the wall thickness direction (y direction) in each i-th cell [-]
LTotal length of DPF [m]
NCell number from inlet in direction i [-]
PMPM content [mol]
QHeat capacity [J/K]
RGas constant [J/(K·mol)]
RpmReaction amount of PM [mol]
SGas passage [kg]
TAbsolute temperature used in the formula for PM oxidation reaction rate [°C]
TwWall surface temperature [°C]
TRCorrected temperature [°C]
TPMOxidation heat temperature of PM [°C]
ΔTTemperature change [°C]
VCalculated unit cell deposition [m3]
ViFlow rate [m/s]
VO2O2 concentration [mol/m3]
WTDPF wall-surface thickness [m]
αFlow rate of each cell (superficial velocity) [m/s]
μPermeability of DPF wall-surface [-]
σCross-sectional area of each cell [m2]
φPorosity [-]

References

  1. Murayama, T. Diesel engine no shoraizo. J. Mar. Eng. Soc. Jpn. 1994, 29, 881–888. [Google Scholar]
  2. Sydbom, A.; Blomberg, A.; Parnia, S.; Stenfors, N.; Sandström, T.; Dahlén, S.-E. Health effects of diesel exhaust emissions. Eur. Respir. J. 2001, 17, 733–746. [Google Scholar] [CrossRef] [PubMed]
  3. Kakegawa, T. Clean diesel no kanousei -shin choki kisei no gaiyo to ohgata diesel no haishutsugasu teigen gijutsu. Jpn. Automob. Manuf. Assoc. 2008, 42, 14–20. [Google Scholar]
  4. Jahng, P.D.J. Kankyo to kenko risk -diesel haikigasu no risk management. Environ. Sci. 1993, 6, 403–411. [Google Scholar]
  5. Robert Bosch GmBH. Automotive Handbook (Japanese); Nikkei Bp.: Tokyo, Japan, 2011; pp. 497–501. [Google Scholar]
  6. Ichikawa, S.; Harada, T.; Hamanaka, T. Development of honeycomb ceramic for diesel particulate filters (DPF). J. Ceram. Soc. Jpn. 2003, 38, 296–300. [Google Scholar]
  7. Wirojsakunchai, E.; Schroeder, E.; Kolodziej, C.; Foster, D.E.; Schmidt, N.; Root, T.; Kawai, T.; Suga, T.; Nevius, T.; Kusaka, T. Detailed Diesel Exhaust Particulate Characterization and Real-Time DPF Filtration Efficiency Measurements During PM Filling Process; SAE Technical Paper 2007-01-0320; SAE International: Warrendale, PA, USA, 2007. [Google Scholar]
  8. Allanson, R.; Blakeman, P.G.; Cooper, B.J.; Hess, H.; Silcock, P.J.; Walker, A.P. Optimizing the Low Temperature Performance and Regeneration Efficiency of the Continuously Regenerating Diesel Particulate Filter (CR-DPF) System; SAE Technical Paper 2002-01-0428; SAE International: Warrendale, PA, USA, 2002. [Google Scholar]
  9. Koltsakis, G.C.; Konstantinou, A.; Haralampous, O.A.; Samaras, Z.C. Measurement and Intra-Layer Modeling of Soot Density and Permeability in Wall-Flow Filters; SAE Technical Paper 2006-01-0261; SAE International: Warrendale, PA, USA, 2006. [Google Scholar]
  10. Uenishi, T.; Sato, S.; Tanaka, E.; Otoguro, Y.; Kusaka, J.; Daisho, Y. Research on internal transfer phenomena of the diesel particulate filter performance (second report)—Numerical study of the effect of soot loading condition on soot cake layer. Trans. Soc. Automot. Eng. Jpn. 2014, 132, 31–36. [Google Scholar]
  11. Karin, P. Microscopic Visualization and Characterization of Particulate Matter Trapping and Oxidation in Diesel Particulate Filters and Membrane Filter. Ph.D. Thesis, Institute of Science Tokyo, Meguro, Japan, 2010. [Google Scholar]
  12. Nakamura, M.; Hanamura, K.; Shibuta, T.; Yoshino, H.; Iwasaki, K. Numerical Simulation of Trapping Process in Hexagonal Diesel Particulate Filter. Trans. Soc. Automot. Eng. Jpn. 2015, 46, 313–317. [Google Scholar]
  13. Nakamura, M.; Ozawa, M. Effect of Surface Cavity Shape on PM Deposition and Pressure Drop on DPF Porous Material. J. Soc. Mater. Sci. Jpn. 2018, 67, 562–567. [Google Scholar] [CrossRef]
  14. Nakamura, M.; Ozawa, M. Phenomena of PM Deposition and Oxidation in the Diesel Particulate Filter; SAE Technical Paper 2019-01-2288; SAE International: Warrendale, PA, USA, 2019. [Google Scholar]
  15. Okai, K. Characteristic Modeling of Catalytic Converter for Diesel Particulate Combustion. Licentiate Thesis, Nagoya University, Nagoya, Japan, 2020. [Google Scholar]
  16. Orihuela, M.P.; Miceli, P.; Ramirez-Rico, J.; Fino, D.; Chacartegui, R. Ceria-based catalytic coatings on biomorphic silicon carbide: A system for soot oxidation with enhanced properties. Chem. Eng. J. 2021, 415, 128959. [Google Scholar] [CrossRef]
  17. Perez, V.R.; Bueno-López, A. Catalytic regeneration of diesel particulate filters: Comparison of Pt and CePr active phases. Chem. Eng. J. 2015, 279, 79–85. [Google Scholar] [CrossRef]
  18. Miceli, P.; Bensaid, S.; Russo, N.; Fino, D. Effect of the morphological and surface properties of CeO2-based catalysts on the soot oxidation activity. Chem. Eng. J. 2015, 278, 190–198. [Google Scholar] [CrossRef]
  19. Kumar, P.A.; Tanwar, M.D.; Bensaid, S.; Russo, N.; Fino, D. Soot combustion improvement in diesel particulate filters catalyzed with ceria nanofibers. Chem. Eng. J. 2012, 207–208, 258–266. [Google Scholar] [CrossRef]
  20. Andana, T.; Piumetti, M.; Bensaid, S.; Russo, N.; Fino, D.; Pirone, R. Nanostructured ceria-praseodymia catalysts for diesel soot combustion. Appl. Catal. B Environ. 2016, 197, 125–137. [Google Scholar] [CrossRef]
  21. Atribak, I.; Bueno-López, A.; García-García, A. Thermally stable ceria–zirconia catalysts for soot oxidation by O2. Catal. Commun. 2008, 9, 250–255. [Google Scholar] [CrossRef]
  22. Liang, Q.; Wu, X.; Weng, D.; Lu, Z. Selective oxidation of soot over Cu doped ceria/ceria–zirconia catalysts. Catal. Commun. 2008, 9, 202–206. [Google Scholar] [CrossRef]
  23. Mukherjee, D.; Rao, B.G.; Reddy, B.M. CO and soot oxidation activity of doped ceria: Influence of dopants. Appl. Catal. B Environ. 2016, 197, 105–115. [Google Scholar] [CrossRef]
  24. Piumetti, M.; Bensaid, S.; Fino, D.; Russo, N.; Pirone, R. Investigations into nanostructured ceria–zirconia catalysts for soot combustion. Appl. Catal. B Environ. 2016, 180, 271–282. [Google Scholar] [CrossRef]
  25. Liang, Q.; Wu, X.; Weng, D.; Xu, H. Oxygen activation on Cu/Mn–Ce mixed oxides and the role in diesel soot oxidation. Catal. Today 2008, 139, 113–118. [Google Scholar] [CrossRef]
  26. Di Sarli, V.; Landi, G.; Lisi, L.; Saliva, A.; Di Benedetto, A. Catalytic diesel particulate filters with highly dispersed ceria: Effect of the soot-catalyst contact on the regeneration performance. Appl. Catal. B Environ. 2016, 197, 116–124. [Google Scholar] [CrossRef]
  27. dos Santos Xavier, L.P.; Rico-Pérez, V.; Hernández-Giménez, A.M.; Lozano-Castelló, D.; Bueno-López, A. Simultaneous catalytic oxidation of carbon monoxide, hydrocarbons and soot with Ce–Zr–Nd mixed oxides in simulated diesel exhaust conditions. Appl. Catal. B Environ. 2015, 162, 412–419. [Google Scholar] [CrossRef]
  28. Palma, V.; Ciambelli, P.; Meloni, E.; Sin, A. Study of the catalyst load for a microwave susceptible catalytic DPF. Catal. Today 2013, 216, 185–193. [Google Scholar] [CrossRef]
  29. Van Setten, B.A.A.L.; Schouten, J.M.; Makkee, M.; Moulijn, J.A. Realistic contact for soot with an oxidation catalyst for laboratory studies. Appl. Catal. B Environ. 2000, 28, 253–257. [Google Scholar] [CrossRef]
  30. Jeguirim, M.; Tschamber, V.; Ehrburger, P. Catalytic effect of platinum on the kinetics of carbon oxidation by NO2 and O2. Appl. Catal. 2007, 76, 235–240. [Google Scholar] [CrossRef]
  31. Nakamura, M.; Yokota, K.; Hattori, M.; Ozawa, M. Numerical Calculation of PM Trapping and Oxidation of Diesel Particulate Filter with Catalyst; SAE Technical Paper 2020-01-2169; SAE International: Warrendale, PA, USA, 2020. [Google Scholar] [CrossRef]
  32. Sawatmongkhon, B.; Promhuad, P.; Thaisruang, T.; Theinnoi, K.; Sittichompoo, S.; Wongchang, T.; Sukjit, E. Kinetic Analysis of Devolatilized Diesel-Soot Oxidation Catalyzed by Ag/Al2O3 and Ag/CeO2 Using Isoconversional and Master-Plots Techniques. ACS Omega 2023, 8, 29437–29447. [Google Scholar] [CrossRef] [PubMed]
  33. Daido, S.; Takagi, N. Visualization of the PM Deposition and Oxidation Behavior Inside DPF Wall; SAE Technical Paper 2009-01-1473; SAE International: Warrendale, PA, USA, 2009. [Google Scholar]
  34. Konstandopoulos, A.G.; Johnson, J.H. Wall-flow diesel particulate filters—Their pressure drop and collection efficiency. SAE Trans. 1989, 98, 625–647. [Google Scholar]
  35. Sanui, R.; Hanamura, K. Electron microscopic time-lapse visualization of surface cavity filtration on particulate matter trapping process. J. Microsc. 2016, 263, 250–259. [Google Scholar] [CrossRef] [PubMed]
  36. Karin, P.; Cui, L.; Rubio, P.; Tsuruta, T.; Hanamura, K. Microscopic Visualization of PM Trapping and Regeneration in Micro-Structural Pore s of a DPF Wall; SAE Technical Paper 2009-01-1476; SAE International: Warrendale, PA, USA, 2009. [Google Scholar]
  37. Hanamura, K.; Karin, P.; Cui, L.; Rubio, P.; Tsuruta, T.; Tanaka, T.; Suzuki, T. Micro- and macroscopic visualization of particulate matter trapping and regeneration processes in wall-flow diesel particulate filters. Int. J. Engine Res. 2009, 10, 305. [Google Scholar] [CrossRef]
  38. Konstandopoulos, A.G. Flow Resistance Descriptors for Diesel Particulate Filters: Definitions, Measurements and Testing; SAE Technical Paper 2003-01-0846; SAE International: Warrendale, PA, USA, 2003. [Google Scholar]
Figure 1. Schematic representation of a diesel particulate filter (DPF) and its filtration mechanism. (a) Conceptual diagram of the DPF structure, illustrating the flow of exhaust gas containing particulate matter (PM). (b) Cross-sectional view of the DPF, showing how PM is trapped on the filter walls while clean gas passes through. (c) Enlarged view of the porous media ceramic structure within the DPF, highlighting the PM capture process and clean gas emission.
Applsci 15 02356 g001
Figure 2. Schematic representation of the regeneration process of a DPF. The left diagram illustrates the initial state where PM is trapped on the DPF walls, while high-temperature gas containing 5–10% oxygen flows through. During the regeneration process, PM undergoes oxidation, producing CO2 and CO. The right diagram shows the cleaned DPF after regeneration, where PM has been removed, allowing clean exhaust gas to pass through freely.
Applsci 15 02356 g002
Figure 3. Schematic representation of two types of catalysts used for PM oxidation. (a) Particulate catalyst, where catalyst particles are attached directly to PM, enabling higher catalytic activity due to direct contact. (b) Catalyst supported on a DPF, where the catalyst is coated on the DPF surface, leading to a lower frequency factor, as not all PM directly contacts the catalyst.
Applsci 15 02356 g003
Figure 4. Type of reaction. Left side: Reaction to soot in contact with the catalyst (SSR). Right side: Reaction to soot that is not in contact with the catalyst (GPR).
Applsci 15 02356 g004
Figure 5. Schematic representation of a diesel particulate filter (DPF) structure. (a) External view of the DPF, with its length, L, and diameter, D, indicated. (b) Cross-sectional view of the DPF, illustrating the flow distribution of exhaust gas through the filter.
Applsci 15 02356 g005
Figure 6. Schematic of soot deposition in the DPF: (a) DPF structure with inlet, porous wall, and outlet, (b) segmented DPF wall for numerical analysis, and (c) soot deposition mechanism with bridge formation and accumulation [35].
Applsci 15 02356 g006
Figure 7. The left side of (ad) shows the dependence of regeneration conditions on the DPF with the catalyst. The x-axis shows the activation energy. The y-axis shows the exhaust gas temperature. The z-axis shows the remaining PM per unit deposited, including the space. The PM deposition amounts 1 g, 10 g, 15 g, and 20 g in relation to (a,b,c,d).
Applsci 15 02356 g007
Figure 8. The right-hand side of (ad) shows the activation energy on the vertical axis and the temperature of the exhaust gas on the horizontal axis. The remaining amount of PM according to each condition is shown in the field; when the remaining amount of PM is large, it is shown in red; when the remaining amount is small, it is in blue. The PM sedimentation quantities showing the relationships of the remaining amounts are (a,b,c,d) 1 g, 10 g, 20 g, and 30 g.
Applsci 15 02356 g008
Figure 9. Relationship between exhaust gas temperature and the amount of remaining PM after 5400 s of regeneration. The red, blue, green, and yellow lines represent PM deposition amounts of 1 g, 10 g, 20 g, and 30 g, respectively. The results highlight the effect of temperature on PM oxidation efficiency.
Applsci 15 02356 g009
Figure 10. Pressure drop over time for PM deposition amounts of 1 g and 30 g. Dashed lines represent 1 g of PM, and solid lines indicate 30 g under different exhaust gas temperatures (600–800 °C).
Applsci 15 02356 g010
Figure 11. The relationship between activation energy and the amount of remaining PM after 5400 s of regeneration at an exhaust gas temperature of 600 °C. The red line represents a PM deposition of 1 g, the blue line corresponds to 10 g, the green line indicates 20 g, and the yellow line denotes 30 g.
Applsci 15 02356 g011
Figure 12. The dependence of the remaining PM amount on activation energy after 5400 s of regeneration at an exhaust gas temperature of 700 °C. The red line corresponds to a PM deposition of 1 g, the blue line represents 10 g, the green line indicates 20 g, and the yellow line denotes 30 g.
Applsci 15 02356 g012
Figure 13. The relationship between activation energy and the remaining PM amount after 5400 s of regeneration at an exhaust gas temperature of 800 °C. The red line represents a PM deposition of 1 g, the blue line corresponds to 10 g, the green line indicates 20 g, and the yellow line denotes 30 g.
Applsci 15 02356 g013
Table 1. Thermal properties of solids (Ref. [31]).
Oxidation heat of carbon [kJ/mol]292.51
Specific heat of cordierite [J/(g·K)]0.75
The density of cordierite [kg/m3]2.5
Table 2. Parameters of a DPF ceramic part (Ref. [31]).
The total length of the DPF, L [mm]110
The diameter of the DPF, R [mm]130
DPF wall thickness [mil]13
DPF wall porosity [%]60
Exhaust amount flow rate [g/s]30
Table 3. Activation energy conditions of the SSR and GPR.
Activation energy of SSR [kJ/mol]183
Activation energy of GPR [kJ/mol]
(References [10,11,12,13,14,15,16,17,18,19,20,21,22,23,24,25,26,27,28,29,30,31,32])
90, 100, 120,
140, 160, 180, 200
Disclaimer/Publisher’s Note: The statements, opinions and data contained in all publications are solely those of the individual author(s) and contributor(s) and not of MDPI and/or the editor(s). MDPI and/or the editor(s) disclaim responsibility for any injury to people or property resulting from any ideas, methods, instructions or products referred to in the content.

