Article

Monitoring the Thermal Degradation of Two Spruce Species, (Picea abies L., Picea rubens Sarg.), Cherry (Prunus avium), and Oak (Quercus spp.) Under the Influence of Radiant Heat

Department of Fire Engineering, Faculty of Security Engineering, University of Žilina, Univerzitná 1, 010 26 Žilina, Slovakia
*
Author to whom correspondence should be addressed.
Appl. Sci. 2025, 15(4), 2065; https://doi.org/10.3390/app15042065
Submission received: 6 November 2024 / Revised: 17 December 2024 / Accepted: 13 February 2025 / Published: 16 February 2025
(This article belongs to the Section Environmental Sciences)

Abstract

:
Wood, in the form of cladding or furniture, is often placed in close proximity to heat radiant sources. This research focused on samples, which are Norway spruce (Picea abies L.), Red spruce (Picea rubens Sarg.), cherry (Prunus avium), and oak (Quercus spp.). The aim of this paper was to observe the effect of the distance of the selected wood samples from the radiant heat source on the process of thermal degradation of wood. Additionally, this research aimed to identify significant effects of wood species and sample distance on this process. A hot-plate device, an electric plate heated according to a temperature–time curve, was used as the initiating source. Samples were placed directly on the plate, as well as at two different distances from the plate (12 and 32 mm). During the experiment, the temperature history on the heat-exposed side of the sample, its mass loss, and the formation of a charred layer were monitored. Additionally, the progression of thermal degradation and related effects (smell, smoldering, and charring layer) were visually observed. The highest level of degradation was observed in the spruce sample placed directly on the plate, which started to smolder after 540 s of exposure to radiant heat at 291.2 °C.

1. Introduction

Wood, as a natural renewable material, remains an integral part of building elements in both interiors and exteriors [1,2,3,4]. It is used, due to its physical [5] and chemical properties [6], as an insulating material [7,8,9], as a building element in the form of wooden beams or solid wood [10,11], and as a raw material for furniture [12,13,14]. However, in terms of chemical composition, wood is an organic material composed of cellulose, hemicelluloses, lignin, and trace elements [15]. The combustibility of wood, or its susceptibility to combustion, has been studied from the last century [16,17,18,19,20,21]. These studies describe in detail the thermal decomposition of its main components, such as the levoglucosan theory of cellulose decomposition [22,23]; the decomposition of hemicelluloses [24,25]; and the most stable component, lignin [26], which ensures the preservation of the anatomical structure of the wood until it chars [27]. Despite these findings, research on the thermal degradation of wood and its combustion remains relevant. The behavior of wood as a combustible material is influenced by the environment in which it is located and the presence of an initiator [28,29,30,31,32]. Wood is frequently exposed to heat sources such as furnaces and heaters, which produce sufficient radiant heat to initiate its thermal degradation [33,34]. One of the factors causing the heat is the increasingly widespread use of infrared radiant heaters used in residential and public heating systems.
Holiday homes or cottages are built of wood in Slovakia. Tiled stoves or metal fireplaces or infrared heaters are installed in the interiors. Fires in the above-mentioned objects are frequent [35], accompanied by significant material damage. Fire investigators state that the cause of the fire is the action of radiant heat. Our current experiment can offer an example of the behavior of selected wood samples under the action of radiant heat.
The form and intensity of the thermal degradation of wood samples by heat loading are discussed in the following article.
The aim of this article is to observe the influence of the distance of wood samples—Norway spruce (Picea abies L.), Red spruce (Picea rubens Sarg.), cherry (Prunus avium), and oak (Quercus spp.)—from a radiant heat source (0, 12, and 32 mm) on the process of their thermal degradation. Part of the research focuses on identifying the significant effects of species and sample distance on the thermal degradation process of wood.

2. Methodology

These samples represent both softwood and hardwood (Table 1 and Figure 1a). The selection of samples was targeted. Two coniferous (spruce and red spruce) and two deciduous (oak and cherry) trees were selected. They were also chosen as representatives of softwood (spruce and red spruce) and hardwood (cherry and oak). The choice was also based on availability: the most abundant in the environment are spruce and oak, while the relatively poorly represented trees are red spruce and cherry.
Spruce is the most commonly used wood in our environment. Red spruce lumber is traditionally used mainly outdoors. Oak is the hardest wood in our environment with wide use. Cherry is a very popular wood in the furniture industry.
Norway spruce (Picea abies L.) is naturally widespread in Northern and Central Europe. In Slovakia, it was originally widespread in mountainous areas, predominantly on poorer soils above an altitude of 800 to 900 m [36]. Spruce wood has the widest application due to its excellent technical properties, superb workability, and large domestic resources [37,38]. It is the most important wood for sawmill processing [39]. Spruce is mainly used in the production of furniture, as a raw material to produce plywood, slats, fiberboard, chipboard, etc. Additionally, spruce is a traditional and important raw material for the paper and pulp industry [40].
Red spruce (Picea rubens Sarg.), also called larch deciduous, is widely used [41], as it is well adapted to humid, cool climatic conditions [42,43], but there are justified concerns about its future existence [44]. The main advantages of larch wood include its high hardness, longevity, resistance to water and moisture, and, most importantly, its resistance to alternating wet and dry conditions [45]. It is a durable construction timber [46].
Cherry (Prunus avium L.) is a representative of fruit trees. It was historically used in Slovak sacral architecture [47]. Sweet cherry (Prunus avium L.) is a tree widely cultivated in temperate regions for its tasty and healing fruits [48,49,50,51].
Oak (Quercus alba) is a representative of high-density hardwoods [52] and the second most abundant deciduous species in Slovakia [53]. It is known for its extensive utilization in various applications [54].
The selected experimental wood samples were cut to a size of 100 × 100 × 20 mm and were treated at an initial temperature of 21 °C and a pressure of 100.56 kPa, either placed directly on the heating plate or on metal rings of 12 mm and 32 mm thickness. The experiments were part of a research task, and the sample sizes were the same for multiple experimental measures. The choice of the distance of the sample from the hot-plate surface was based on the technical possibilities of the test equipment. Wood is a thermal insulator. By placing wood on a hot plate, it is possible to observe the processes of thermal conductivity that take place on the surface of the sample. Subsequently, the choice of separation distance offers the possibility of spreading radiant heat. The choice of rings as extensions was deliberate. It was necessary to prepare a homogeneous environment for the spread of radiant heat on the surface of the sample and to eliminate the process of heat spread by flow (natural convection). The repeatability of measurements was three times.
Experiments were conducted using the identical radiant heat source on a hot-plate device (Figure 1b). The position of the experimental sample was varied, and the position and designation of the samples are presented in Table 2. A detailed description of the testing apparatus is provided in the articles by Mračková et al. [55] and Marková et al. [56].
The samples were tested at an initial temperature of 21 °C and a pressure of 100.56 kPa. They were placed on the hot plate directly (1S) or on metal rings to attain different distances from the radiant heat source (samples 2S, 3S, and 4S).
The thermal degradation process was observed using a hot-plate device with temperature-controller CLARE 4.0 (Clasic, Praguea, Czech Republic) (Figure 1b), which served as the source of radiant heat. The device is fully automatic, and the temperature increase was continuous and recorded by a separate thermocouple built into the hot-plate structure. The surface of the wood exposed to heat was sensed by a thermocouple type K5 Almemo (Rožnov pod Radhoštěm, Czech Republic). As can be seen in Figure 2, the task of the thermocouples was to record changes in the contact area of the hot plate and the wood surface depending on time.
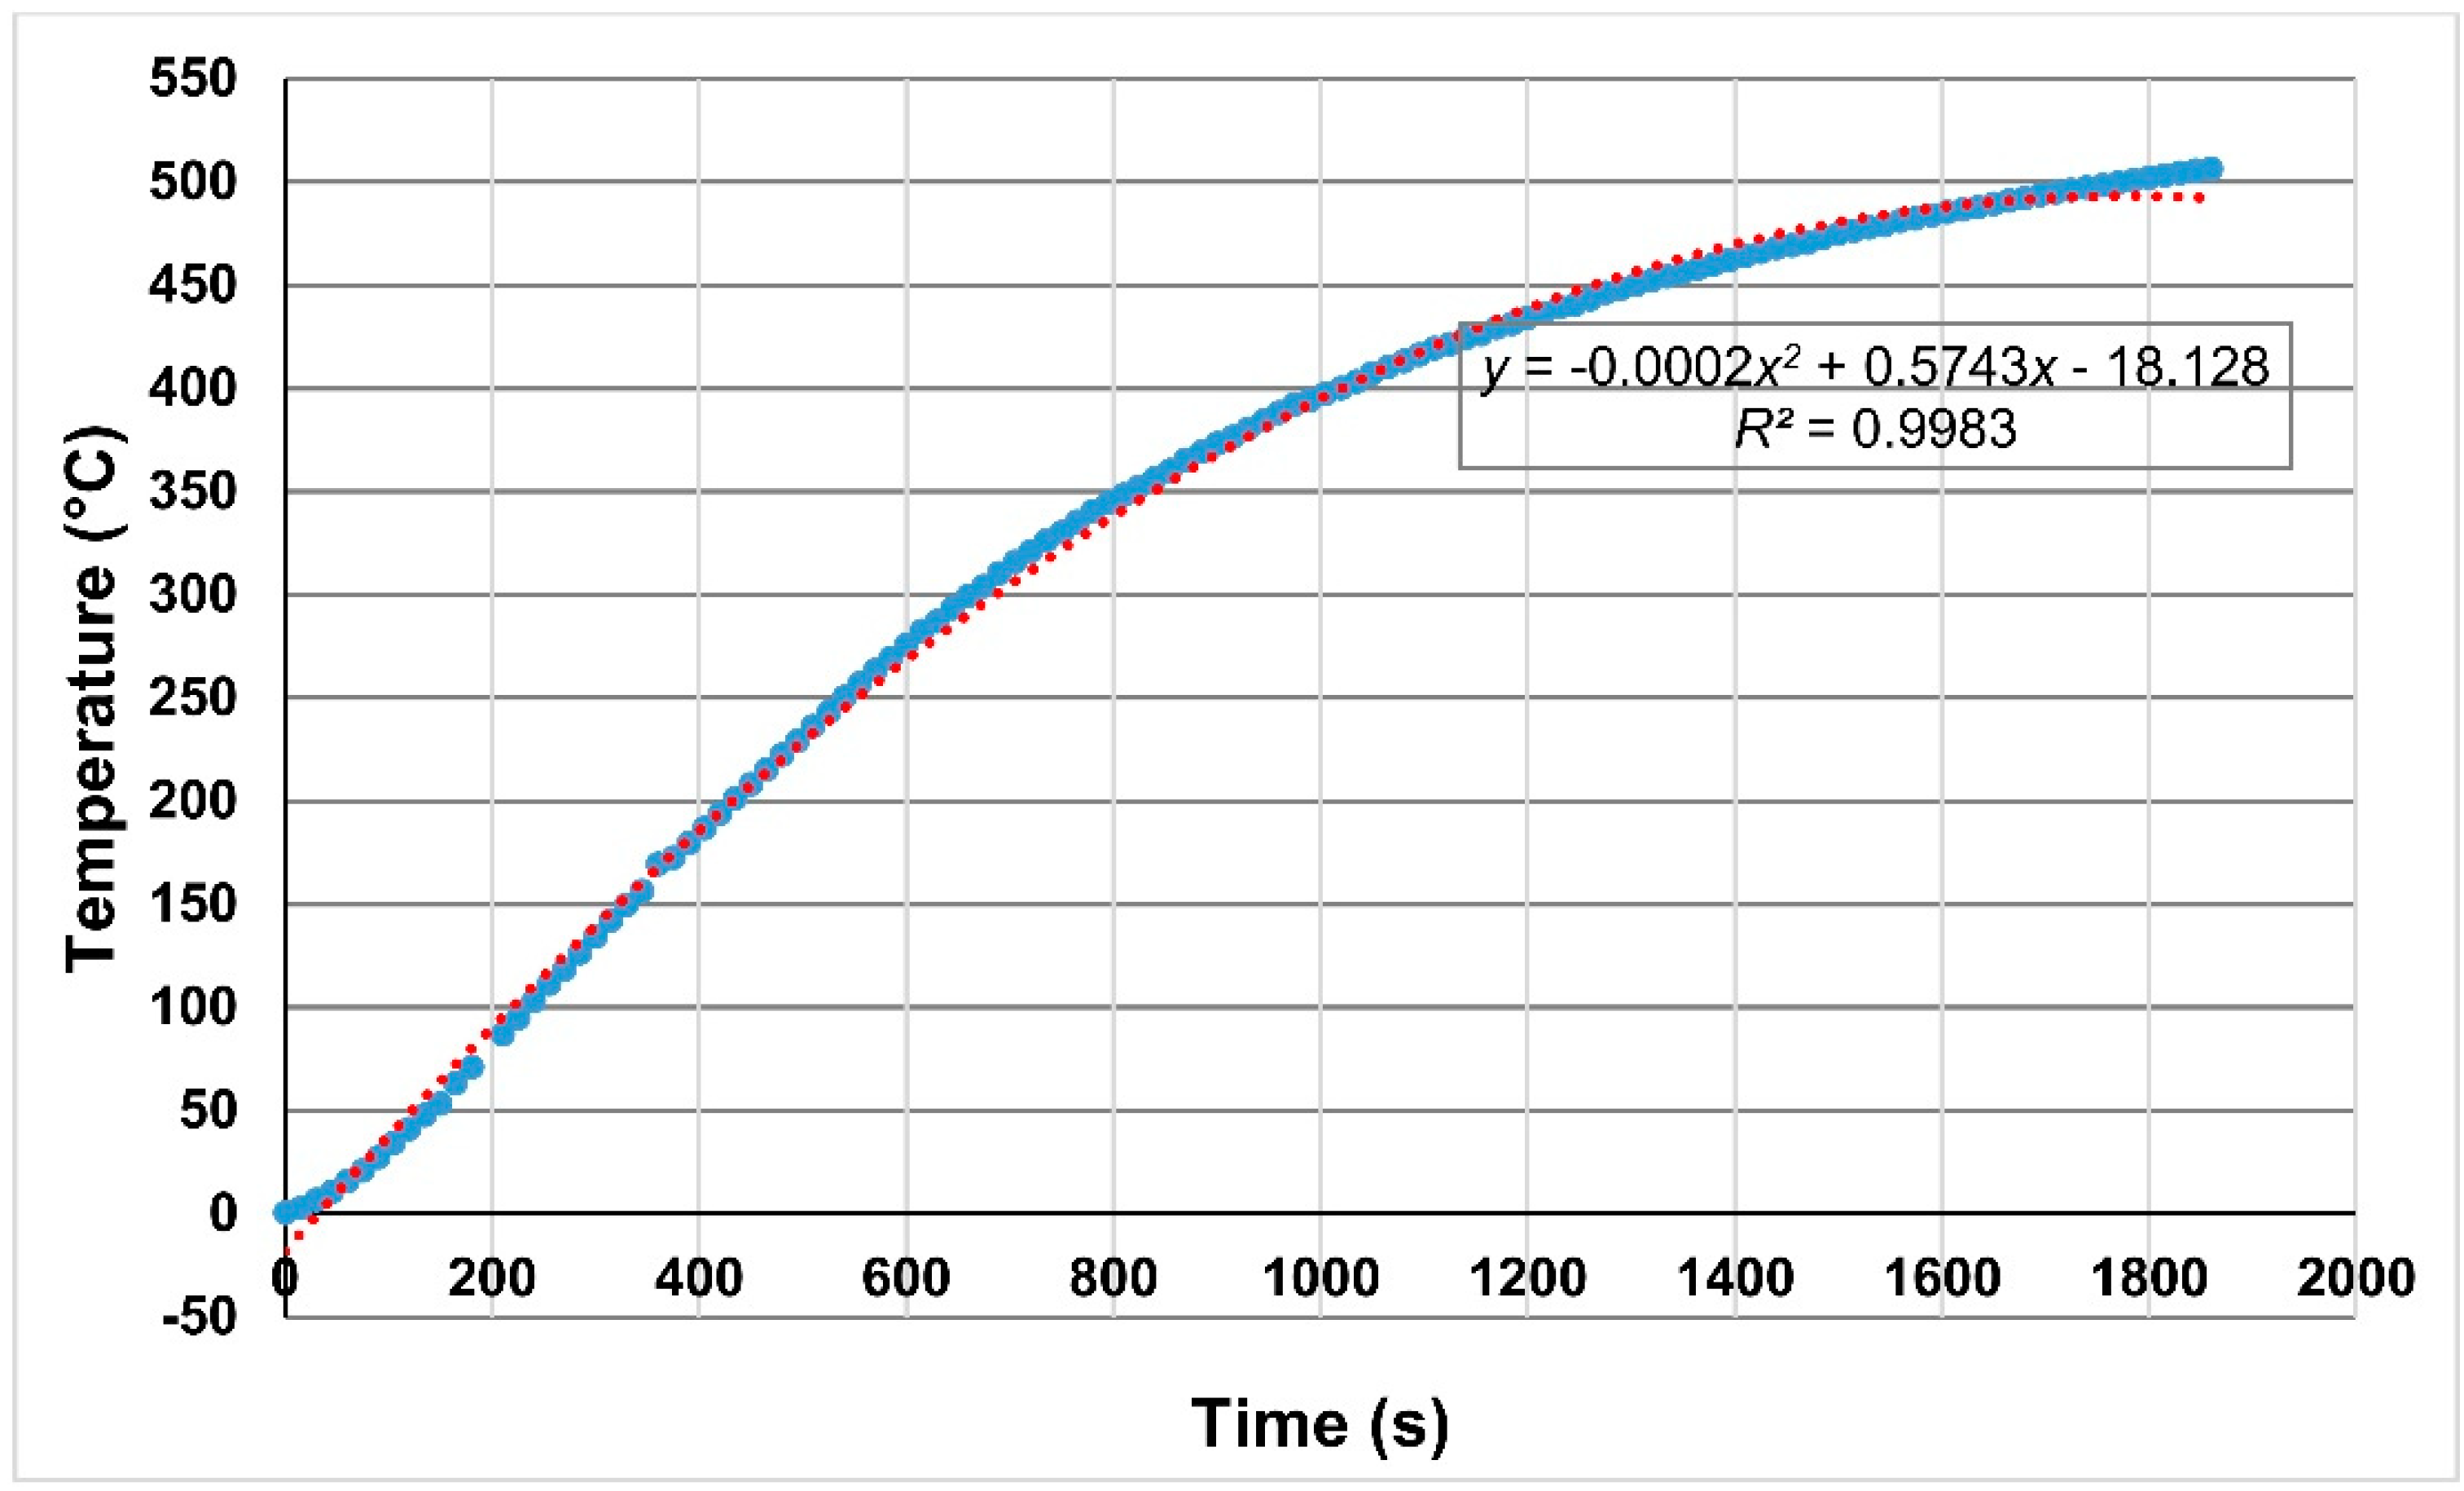
The thermal–time curves of the hot-plate equipment were elaborated and presented by Jadudova et al. [57], Marková et al. [56], and Harusincová [58]. Expression of exposure time and temperature development on the surface of the hot plate is shown in Figure 2.
During the experiment, the temperature inside the sample and the surface temperature of the hot plate were measured using thermocouples type K. The first thermal thermocouple measured the actual temperature of the heated metal plate (hot-plate equipment), while the second one measured the temperature of the tested sample located under the loading sides of the samples. Before and after the experiment, the samples were weighed to determine the mass loss.

3. Results and Discussion

The aim of the experiment was to demonstrate the influence of the distance from the source on the thermal degradation processes. The following processes were monitored during all experiments: smell, smoldering, cracks, thermal degradation, and bending of the sample. Qualitative observations (e.g., smell and visible smoldering) introduce subjectivity, therefore they were not quantified. The mentioned processes will be manifested on the basis of reaching critical values of heat on a heat-load surface. The probability of a increase in temperature on the surface of the sample depending on the time of radiant heat action is generally confirmed. The time to reach critical temperatures in the sample depends on the source’s distance and type of wood, as discussed in the following results section.

4. Results of Spruce Thermal Degradation by Thermal Loading

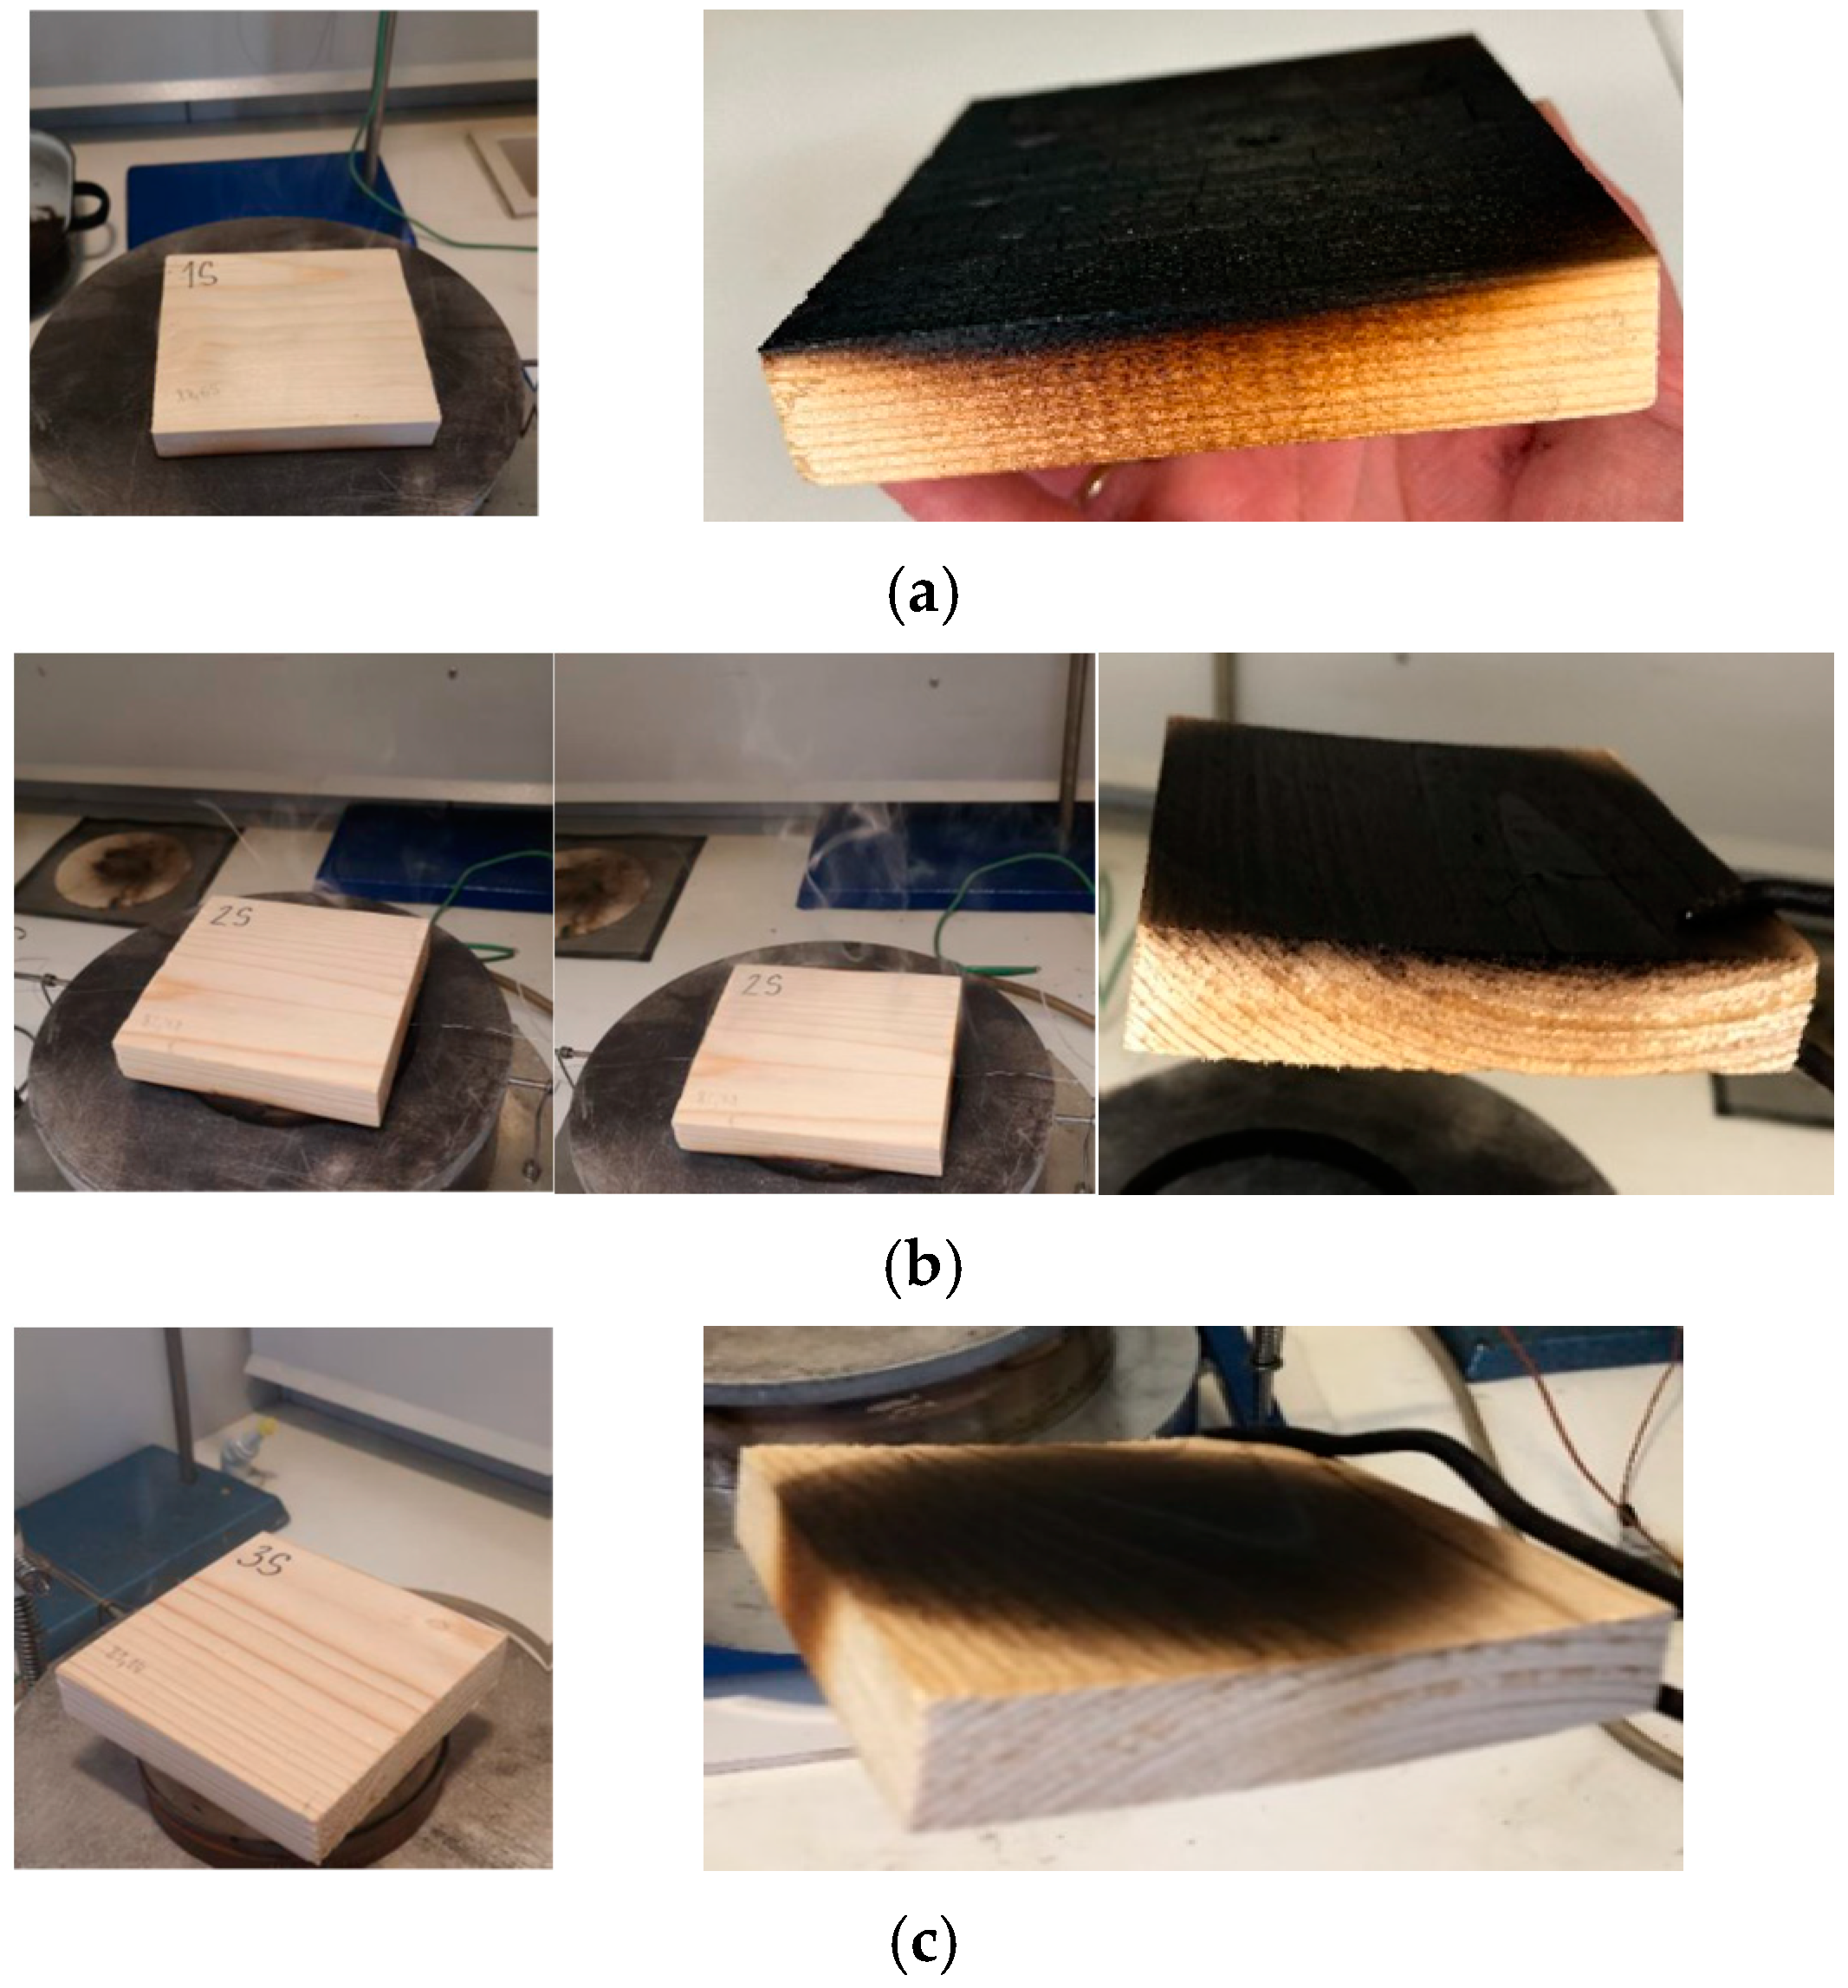
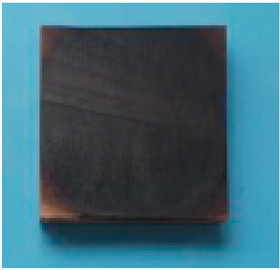
The largest changes were observed for the sample that was in direct contact with the radiant heat source (sample 1S). The thermal degradation process started at 690 s, at a sample temperature of 354.2 °C. At 455.8 °C, the sample began to bend slightly. There was a mass loss of 18.83%. The amount of charring was 12 mm. The surface of the sample exposed to the radiant heat source was charred and cracked (Figure 3a).
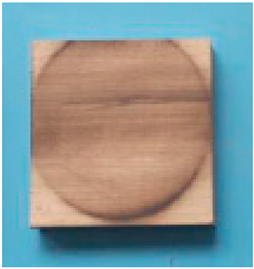
Sample 2S was 12 mm from the radiant heat source. Compared to sample 1S, the thermal degradation process occurred at a later time of 1155 s and at a higher temperature of 410.4 °C. The charring process was visible over the entire area of the bottom of the sample, especially in the area of the located metal ring (Figure 3b). The layer of charring was 5 mm, and the mass loss was 8.52%.
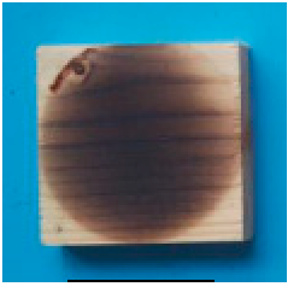
At a distance of 25 mm (sample 3S), there was charring of the sample at the sides and at the bottom, where the sample was in contact with the circle (Figure 3c). Charring of the sample was not observed. Towards the end of the experiment (1200 s), a slight bending of the sample was observed. The weight loss was 6.32%, and the charring height was 3.5 mm.
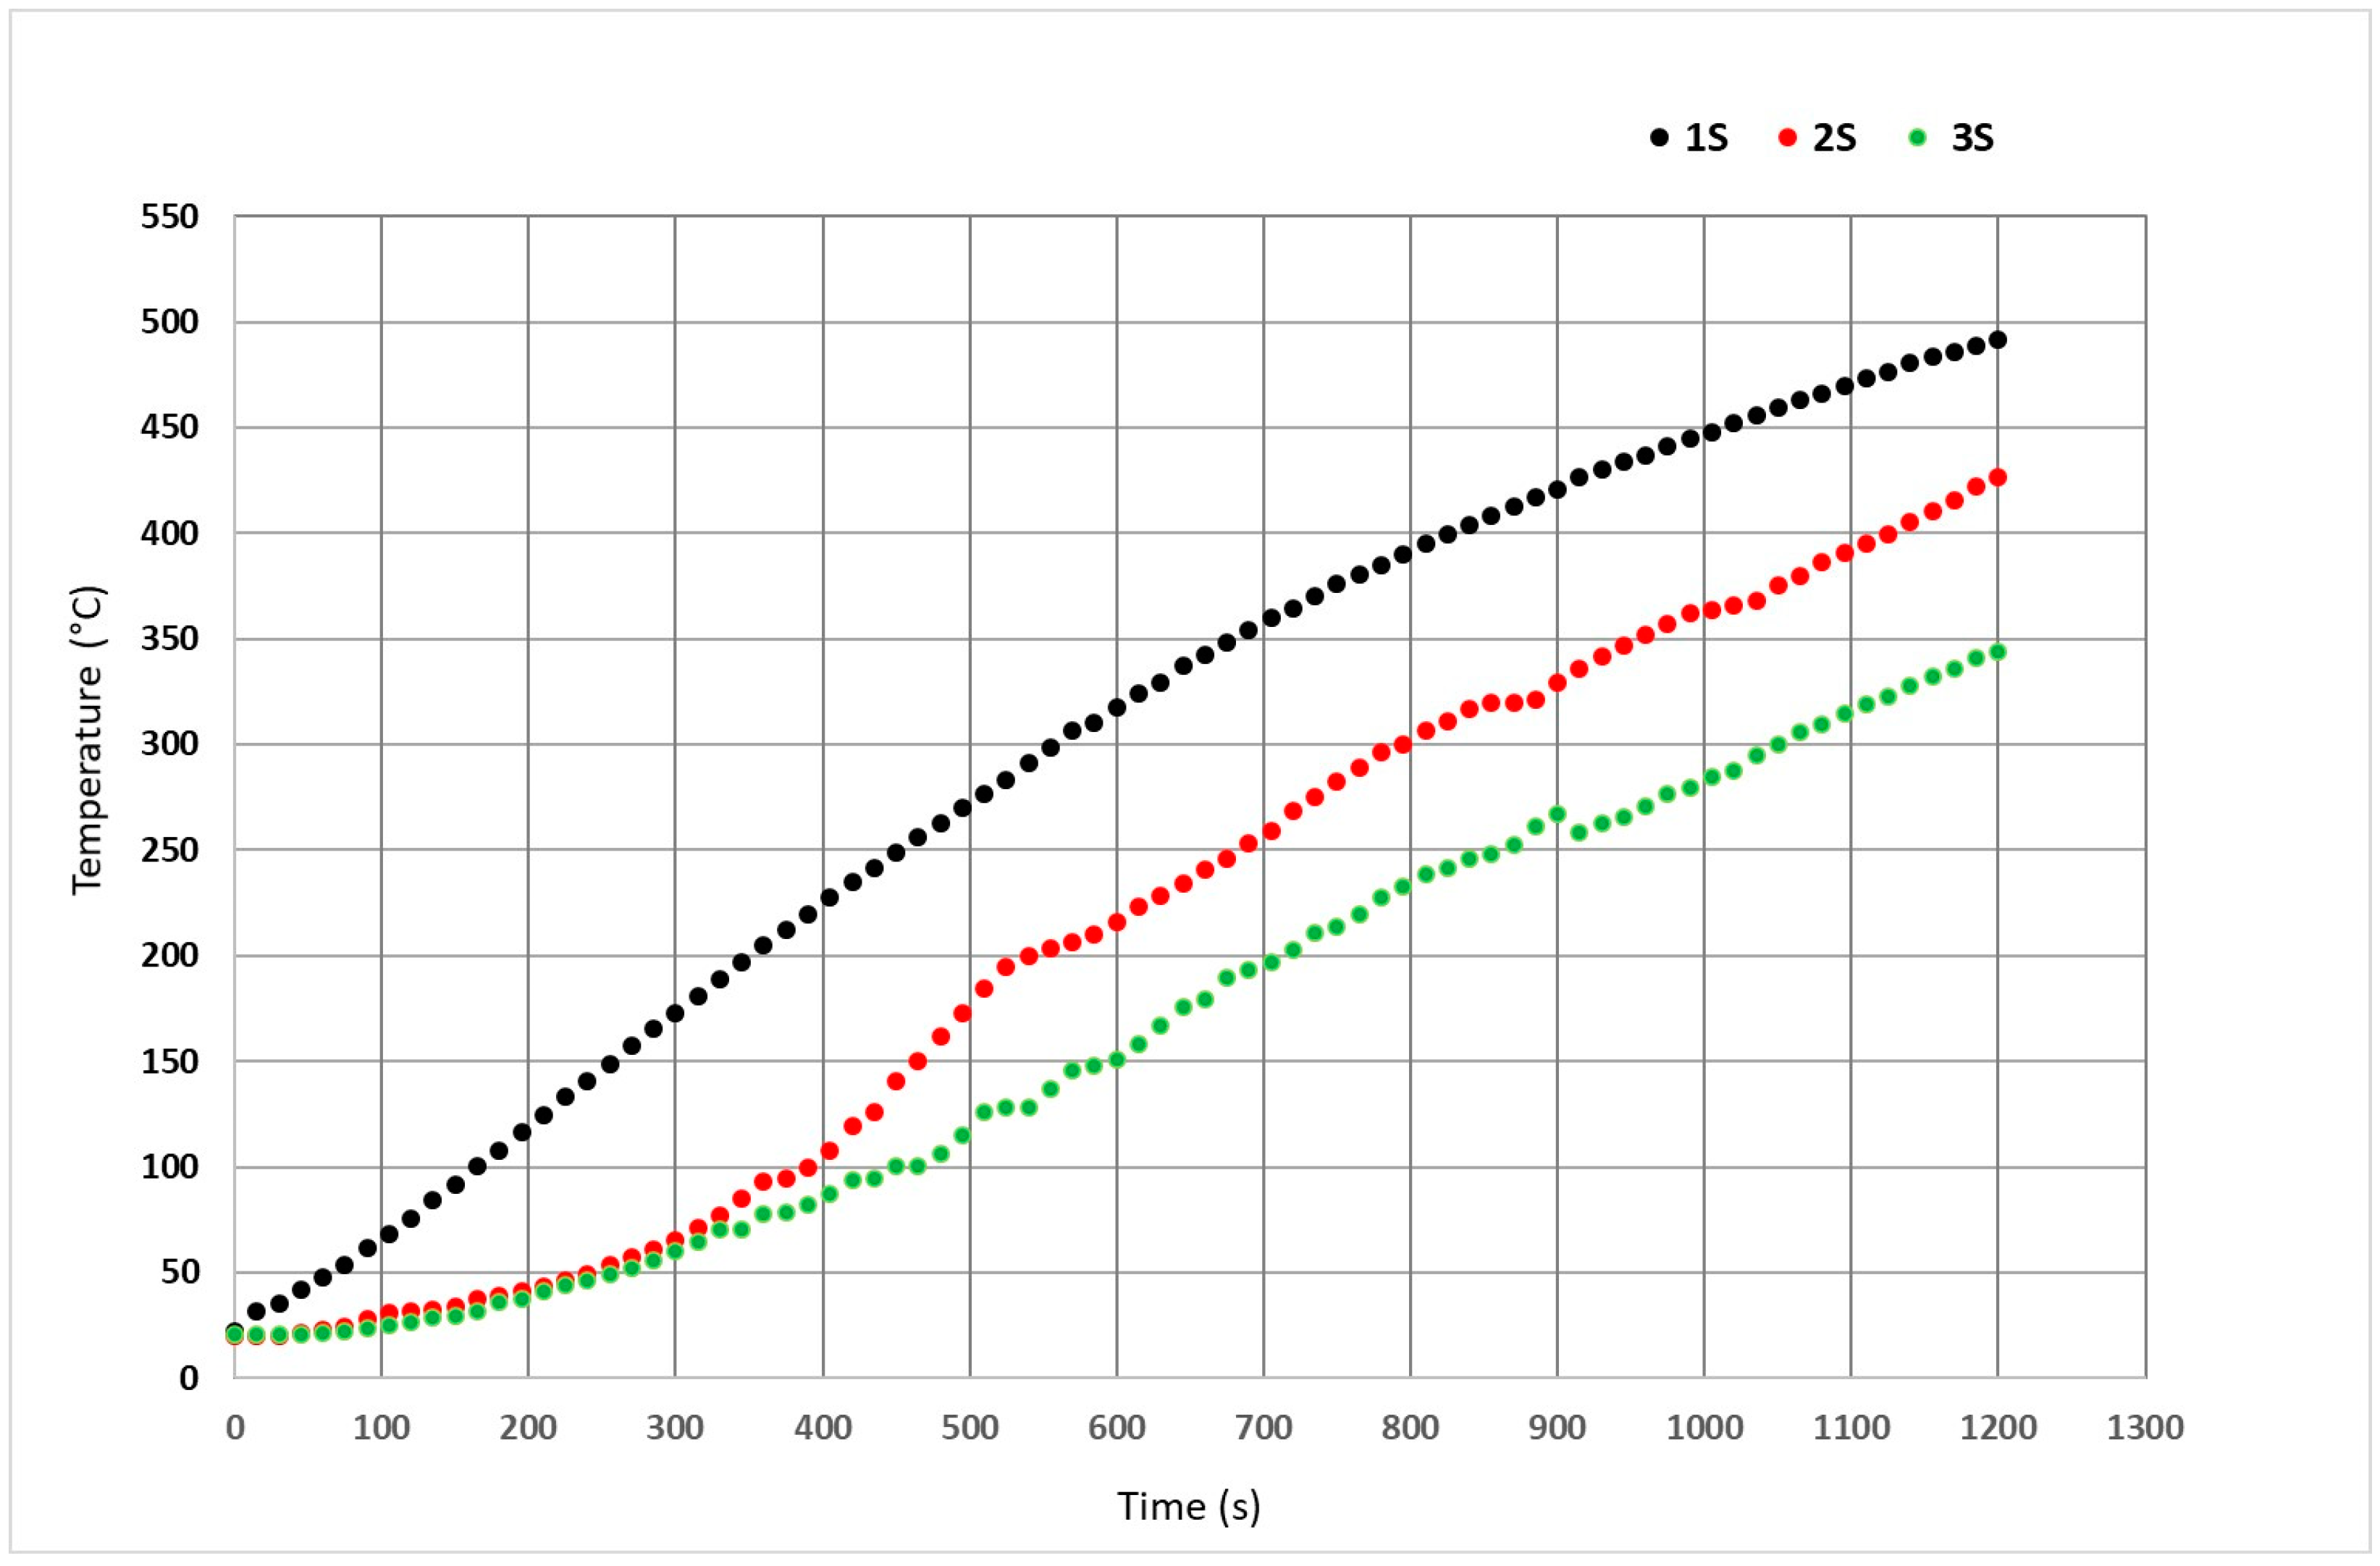
From the measured values, a temperature curve was constructed for all spruce wood samples (Figure 4). The colored highlighted points represent the monitored processes (smoking, cracks, thermal degradation, and bending). Sample 1S showed a constant temperature rise without fluctuations as a function of time. For samples 2S and 3S, the temperature fluctuations caused by lifting the sample off the plate to observe the thermal degradation processes are visible. Samples 2S and 3S, which were placed on the metal ring further away from the radiant heat source, have the same temperature history up to approximately 400 s. The consequent temperature differences correspond depending on their distance from the source.
Luptaková et al. [59] wrote that thermal treatment at temperatures below 200 °C does not influence the fire safety of an important class of wooden products. The first thermal changes in sample 1S were above the temperature of 227.6 °C at a time of 405 s.
The sample of spruce wood even at a distance of 32 mm shows thermal degradation. Previously, Kmetova et al. [60] reported that spruce wood is more susceptible to heat load independent of the distance from the source, because it has a lower density. In their experiment, they observed the highest mass loss of spruce wood, which was due to the high resin content. The results of the present study are consistent. Higher mass losses in conifers (including spruce wood) were also confirmed by Gašpercová et al. [61]

5. Results of Red Spruce Thermal Degradation by Thermal Loading

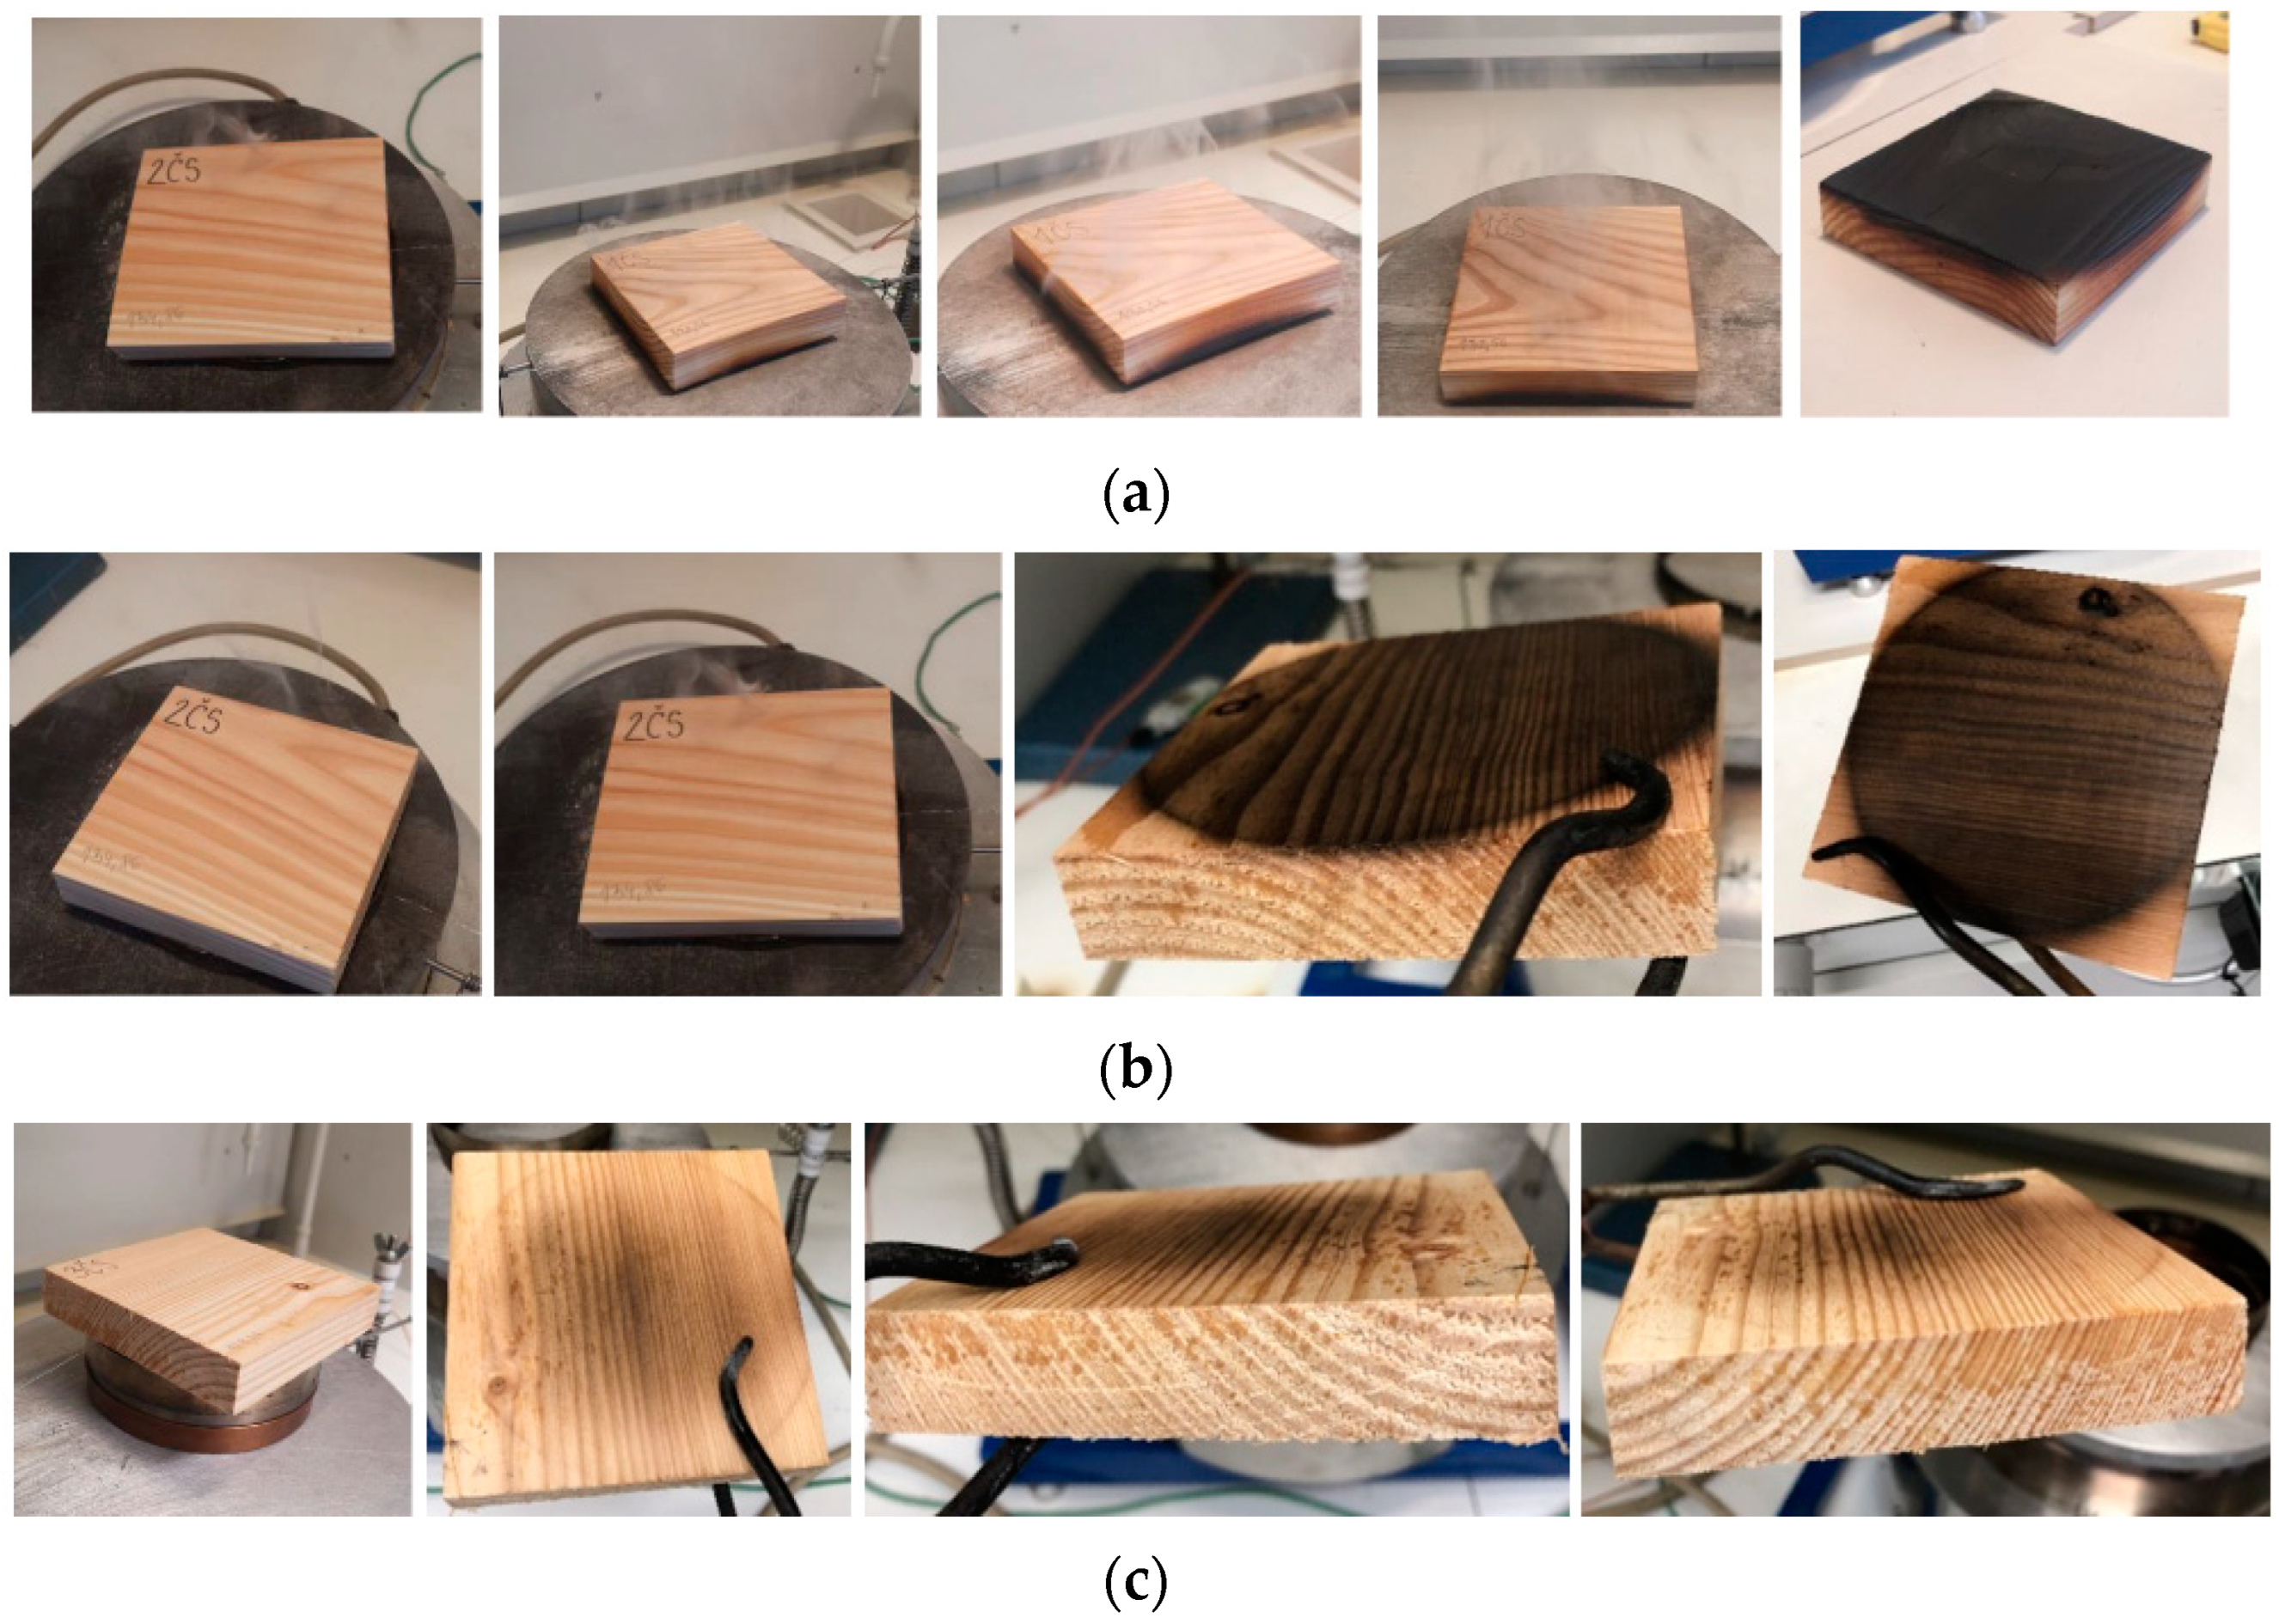
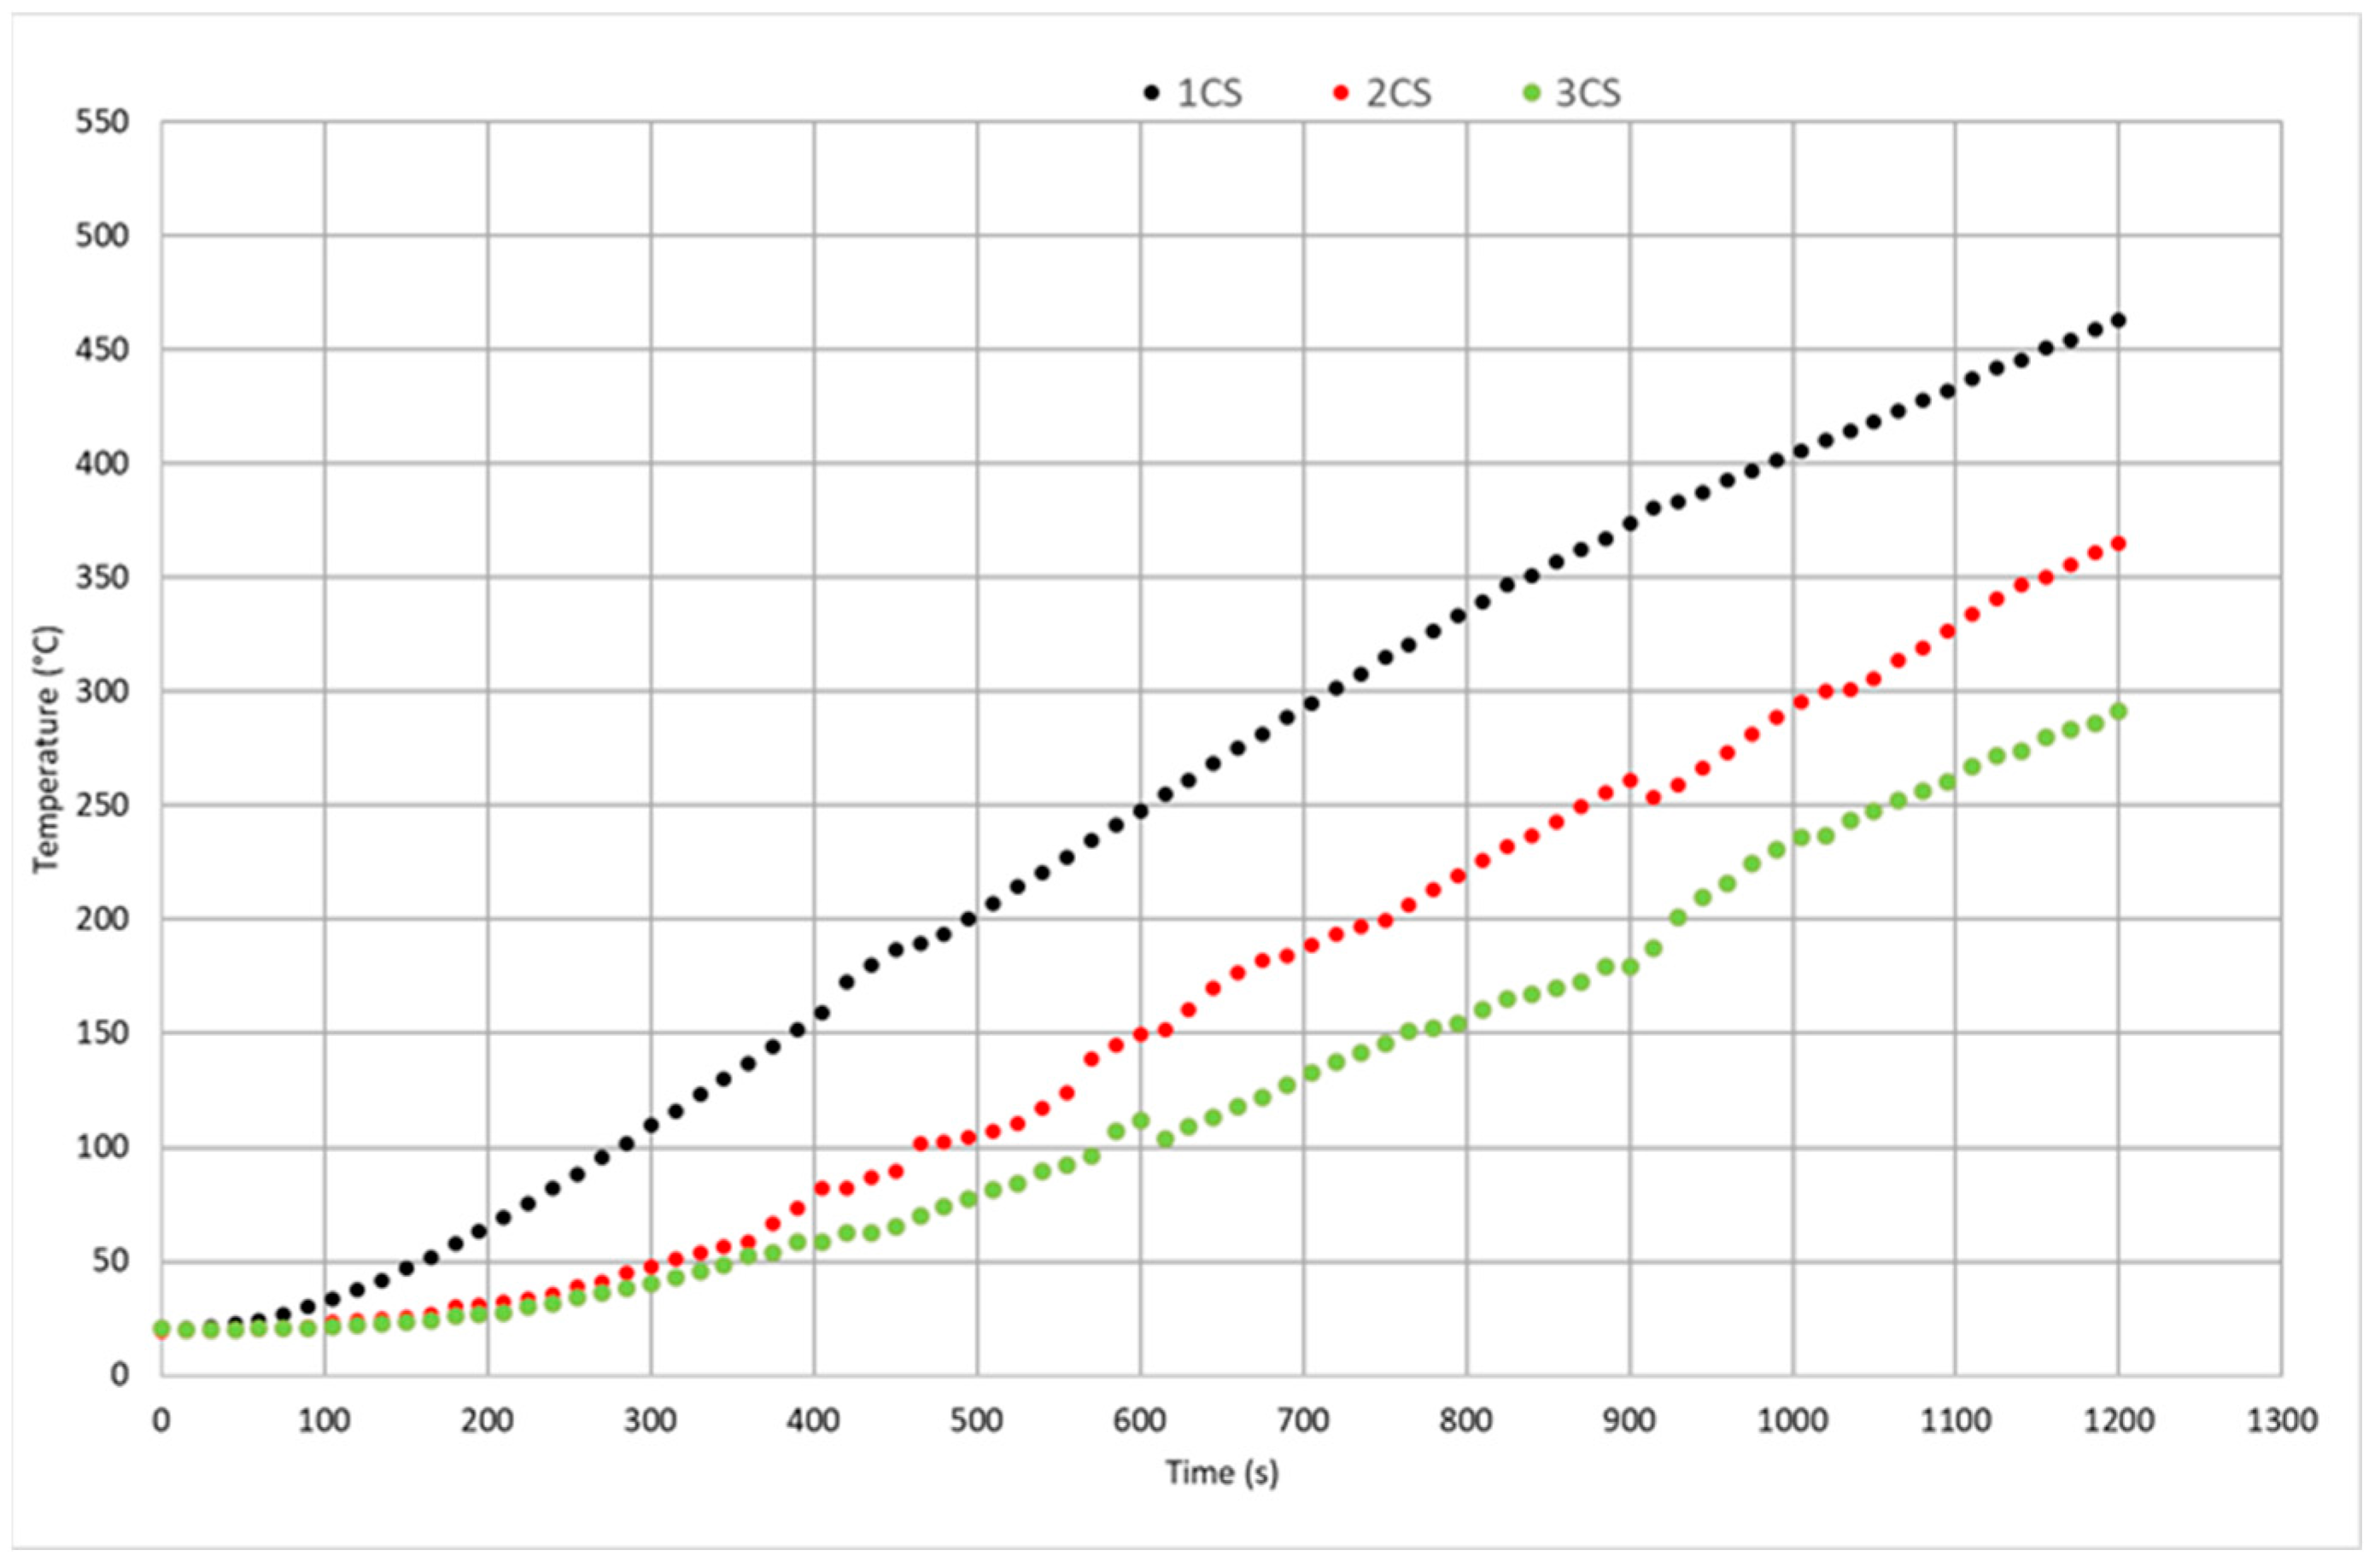
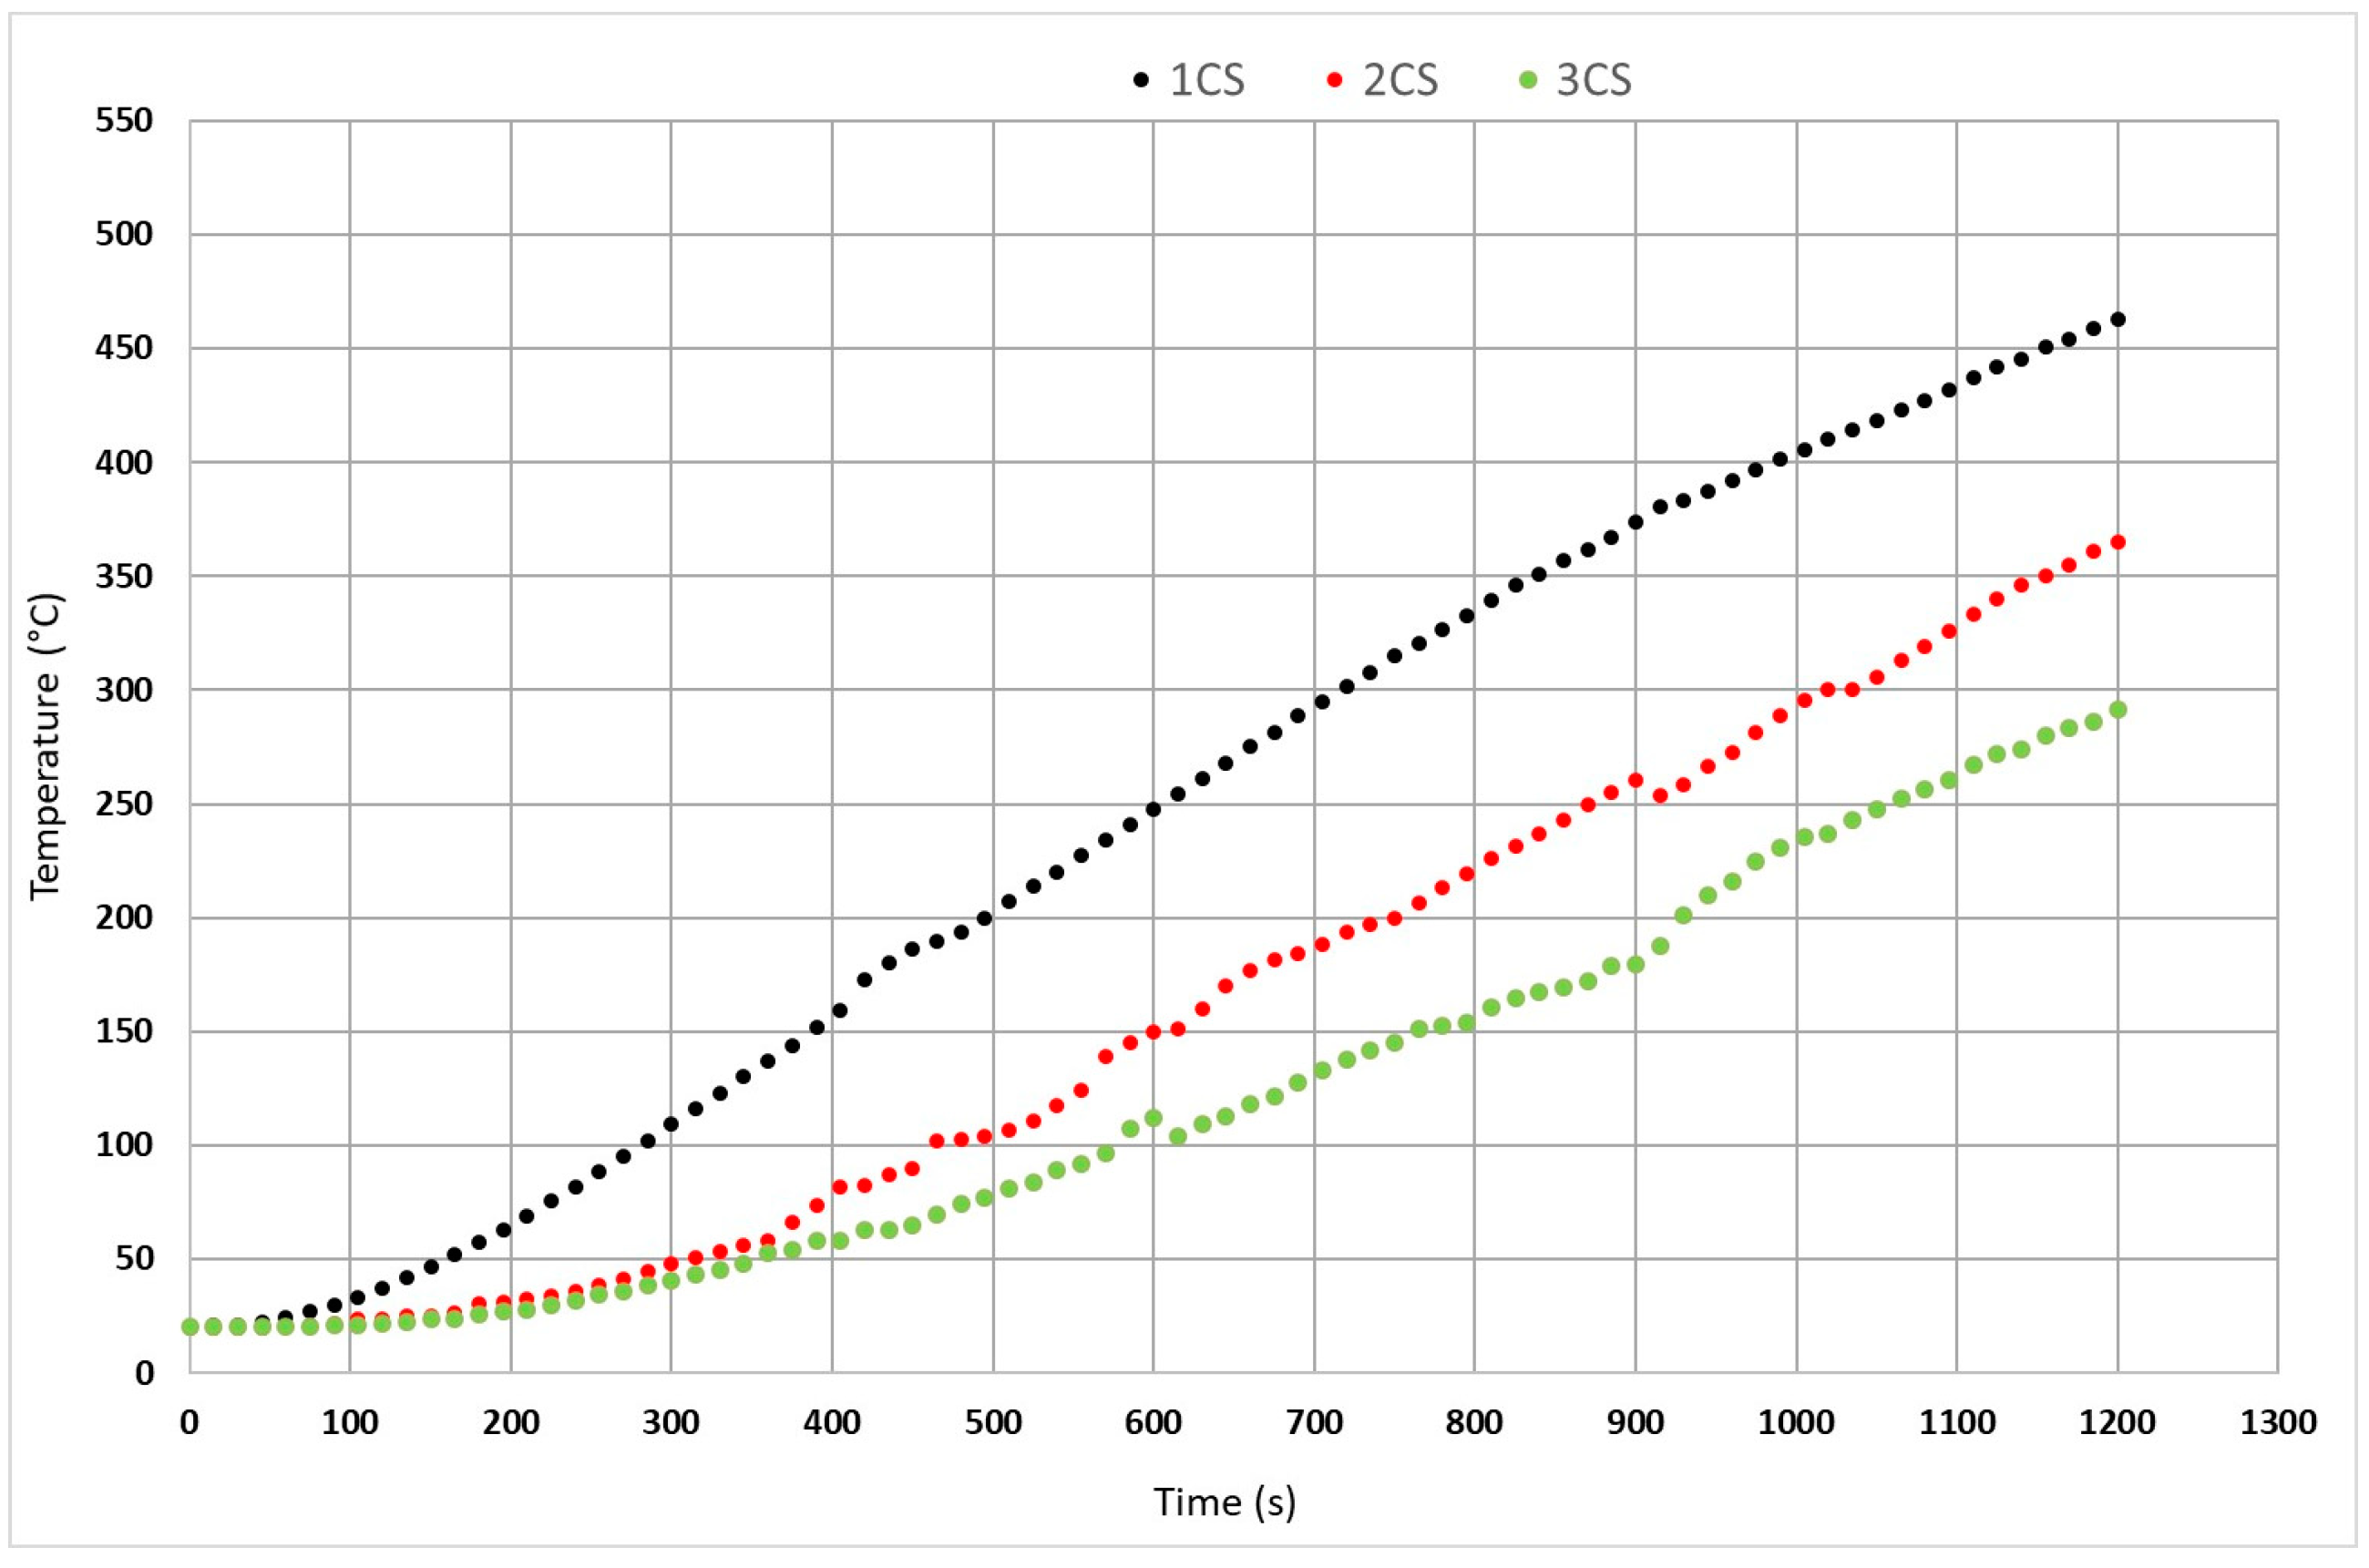
The results of thermal degradation of red spruce are different. Red spruce is a resin-rich wood [45]. The result was also reflected in the behavior of red spruce when exposed to radiant heat (Figure 5 and Figure 6).
Of all the distances tested, sample 1CS was the most charred because it was placed directly on the plate. The bottom part of this sample was also charred and slightly cracked across its entire surface. Sample 2CS exhibited slight charring at the point where the metal ring was placed. The final sample, tested at a distance of 32 mm, showed predominant charring in the middle section, with visible raised resin spots on the surface.

6. Results of Cherry Thermal Degradation by Thermal Loading

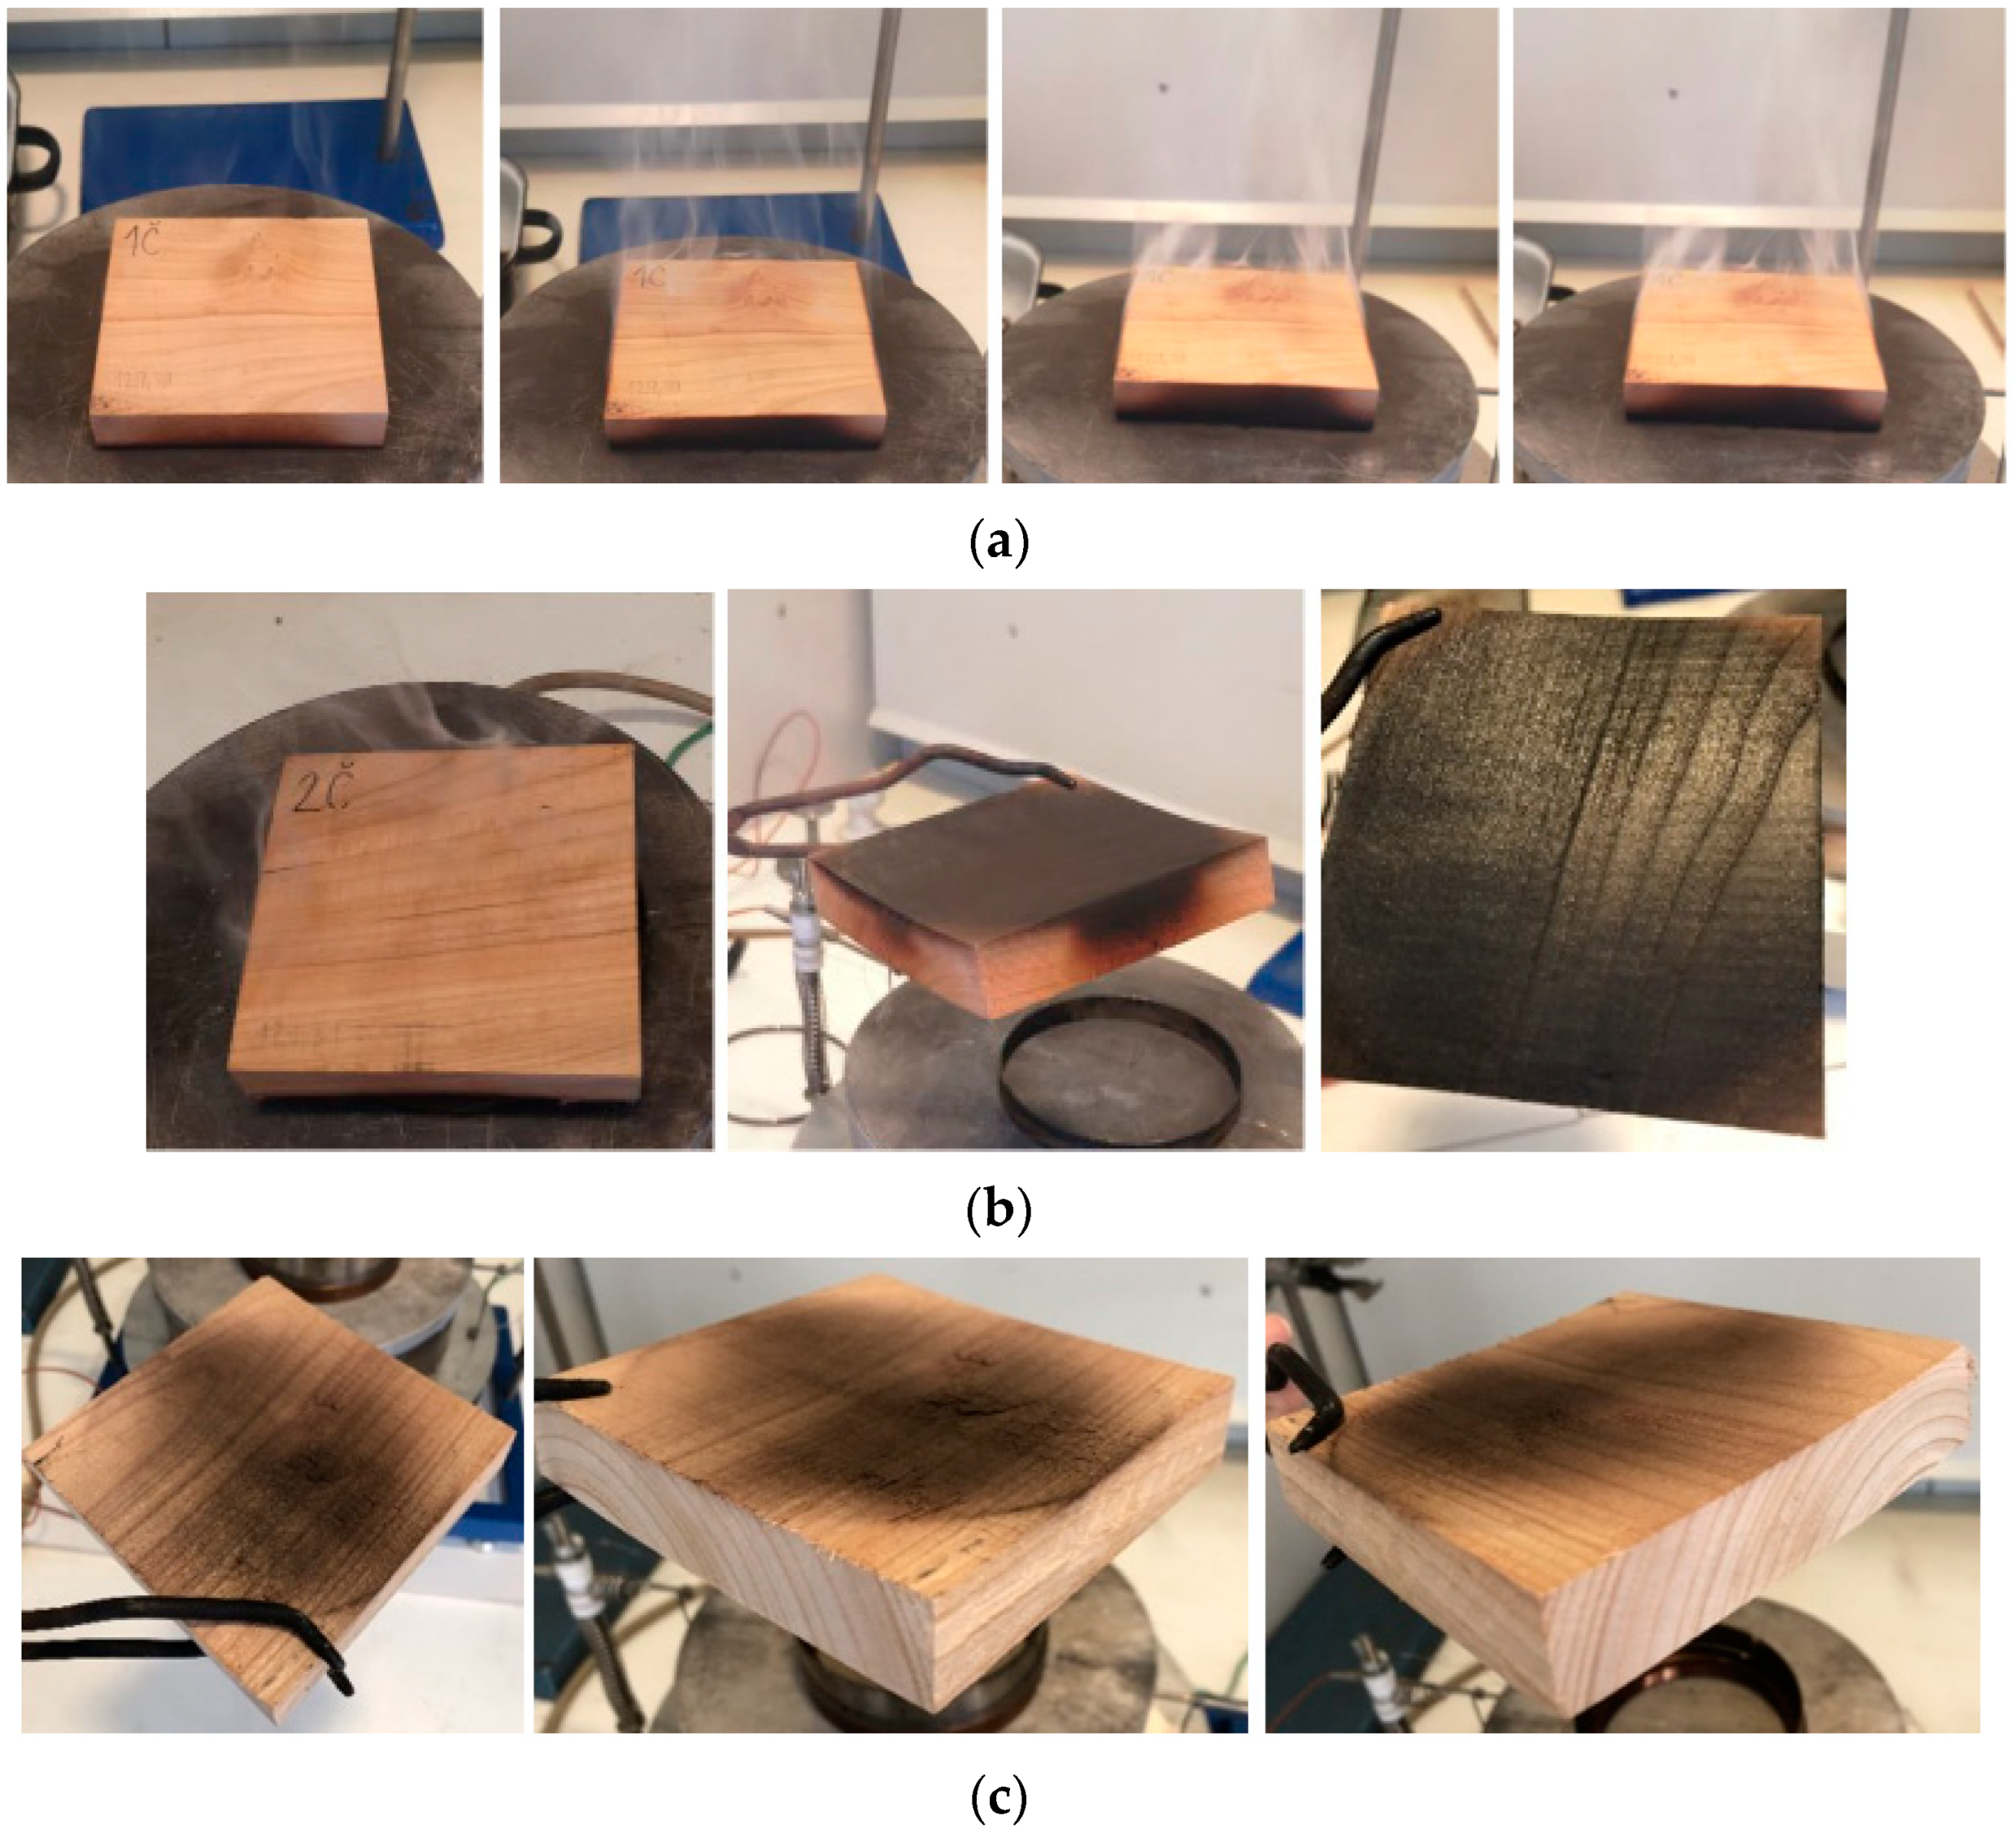
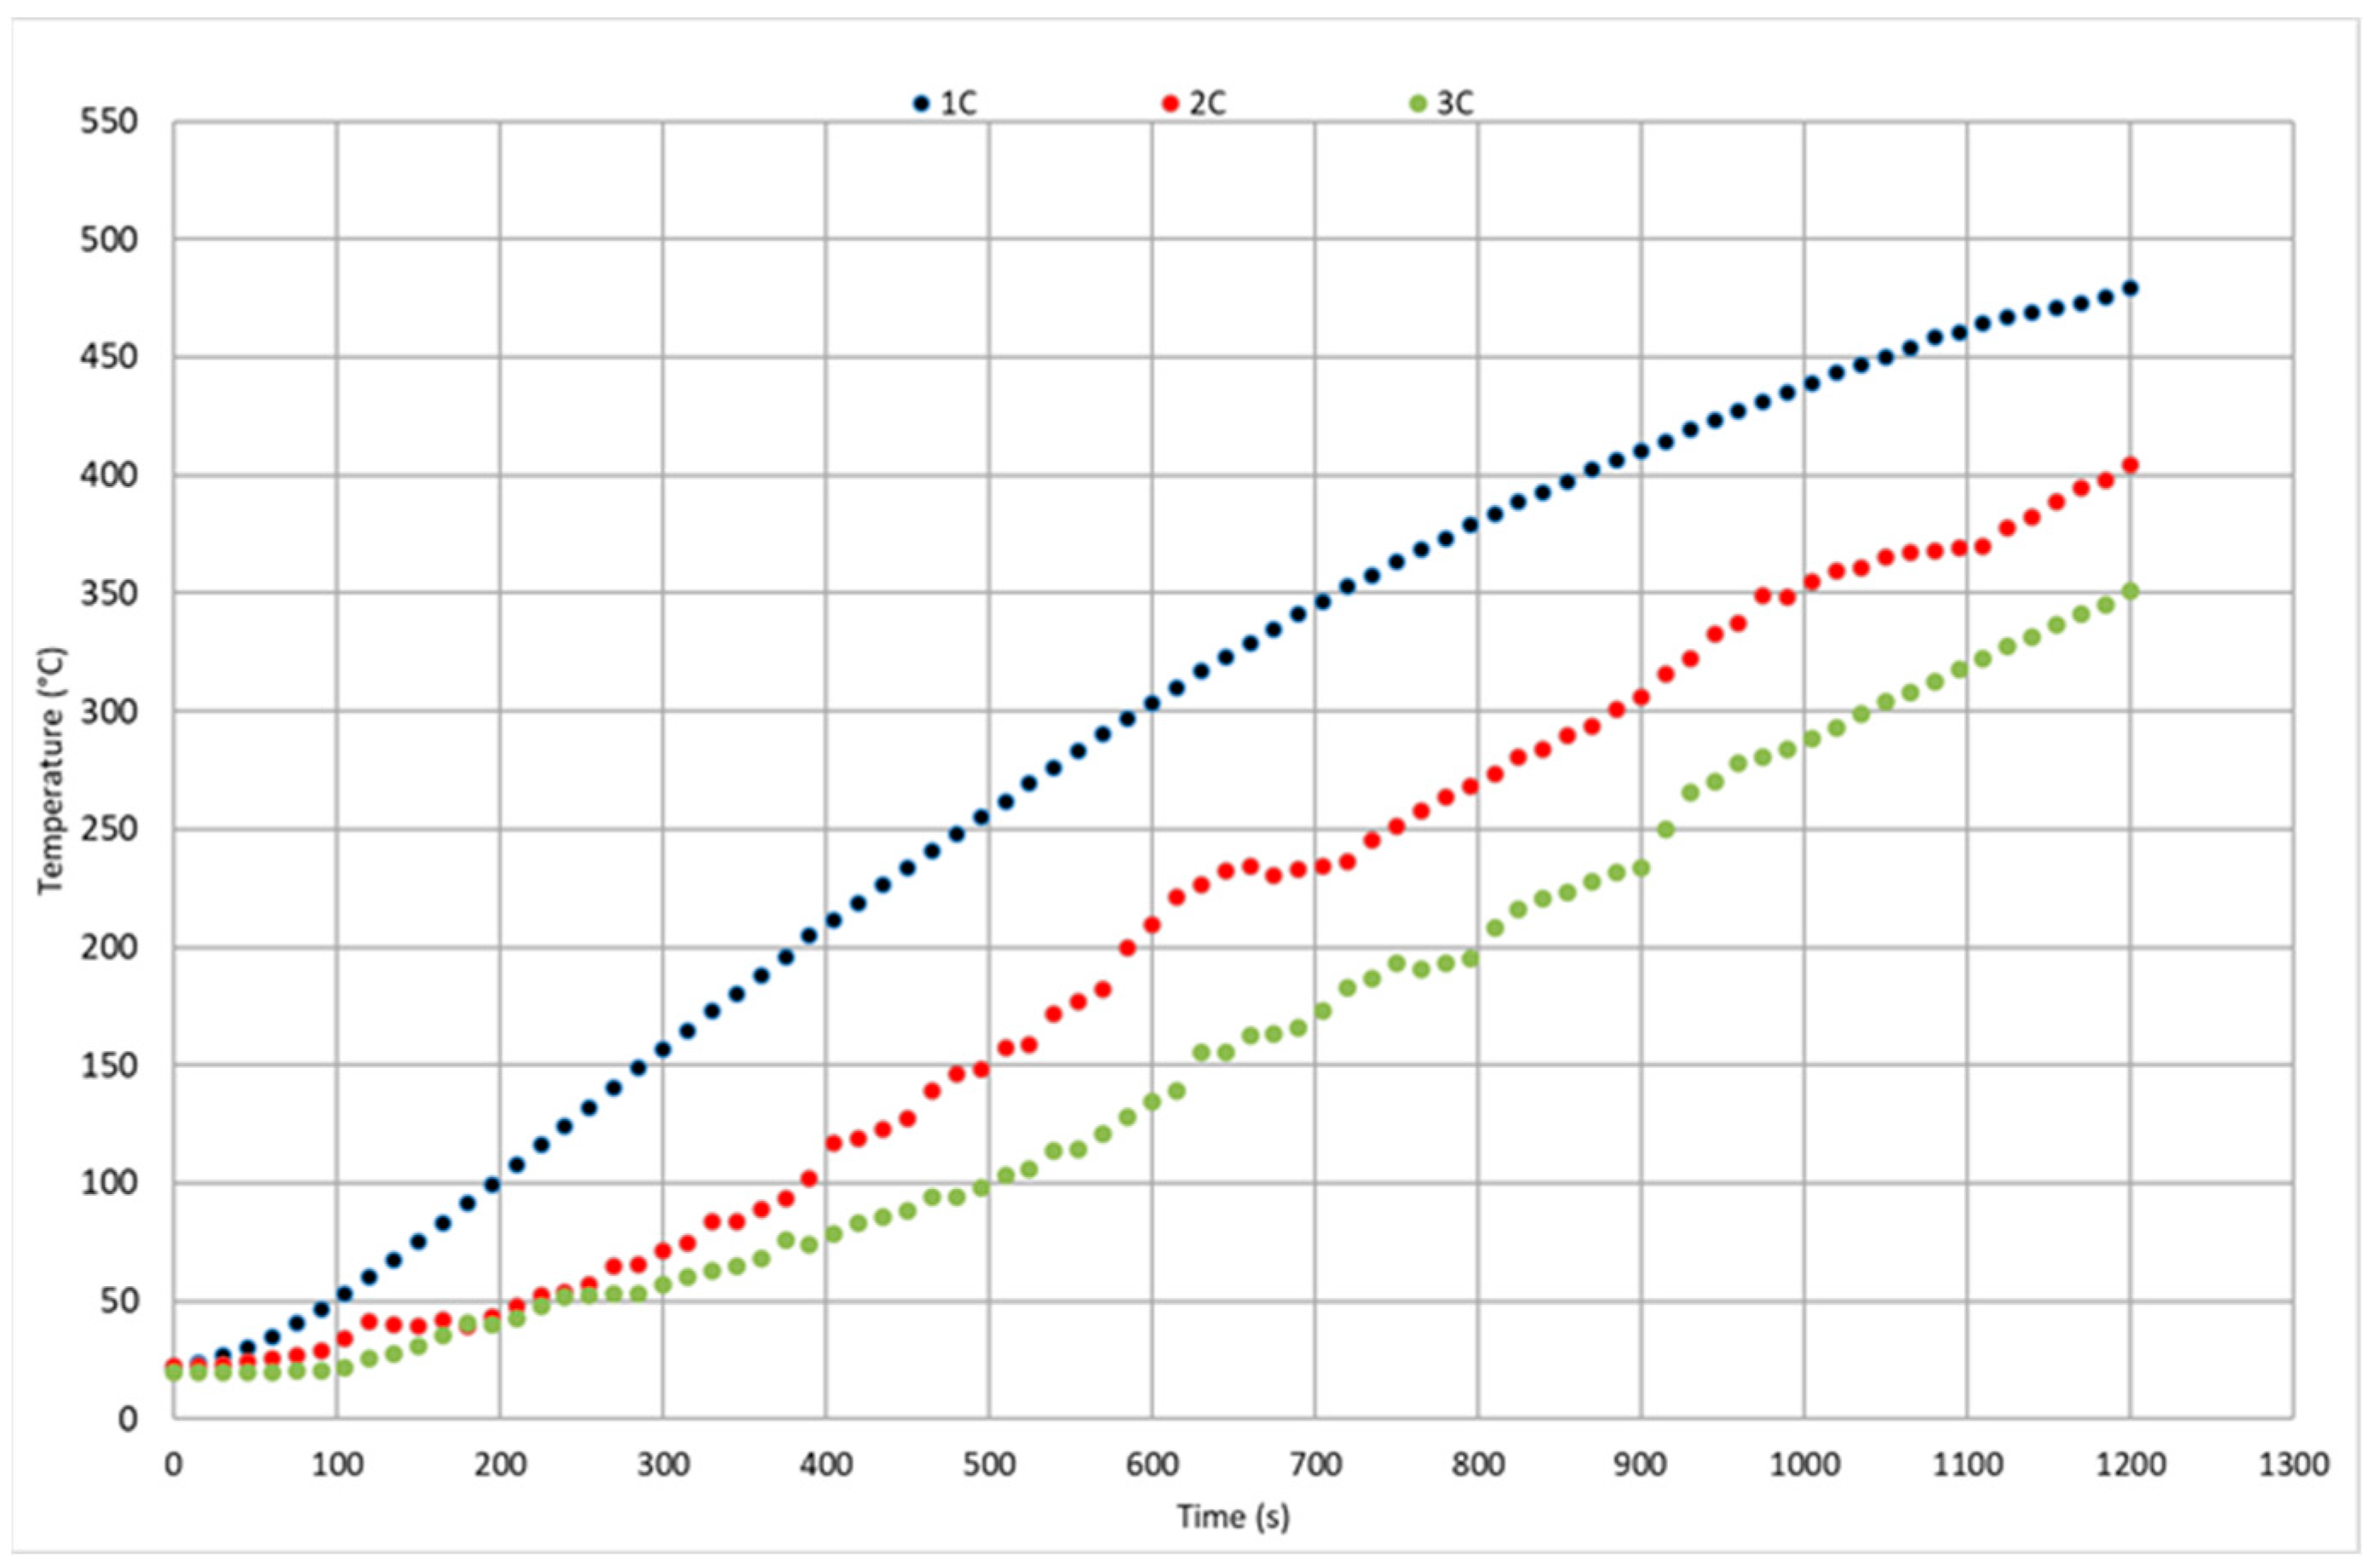
A summary of the results obtained from thermal loading of cherry wood samples, along with commentary on the observed phenomena, is presented in Figure 7. The temperature profiles on the surfaces exposed to heat for each sample are presented in Figure 8.
Cesprini et al. [62] analyzed debarked cherry (Prunus avium L.) wood chips at 10% moisture content and isolated tannin extracts from them. The cherry extract was found to be the poorest in phenolics, which mainly consisted of pyrogallol-type flavonoids strongly interconnected with significant amounts of polysaccharides. Several similar studies have been conducted on cherry tannin extract. Cesprini et al. [62] and Engozogho Anris et al. [63] employed TGA analysis and DSC to investigate its thermal stability. Their findings indicate that the thermal decomposition of the extract begins at 219.55 °C.

7. Results of Oak Thermal Degradation by Thermal Loading

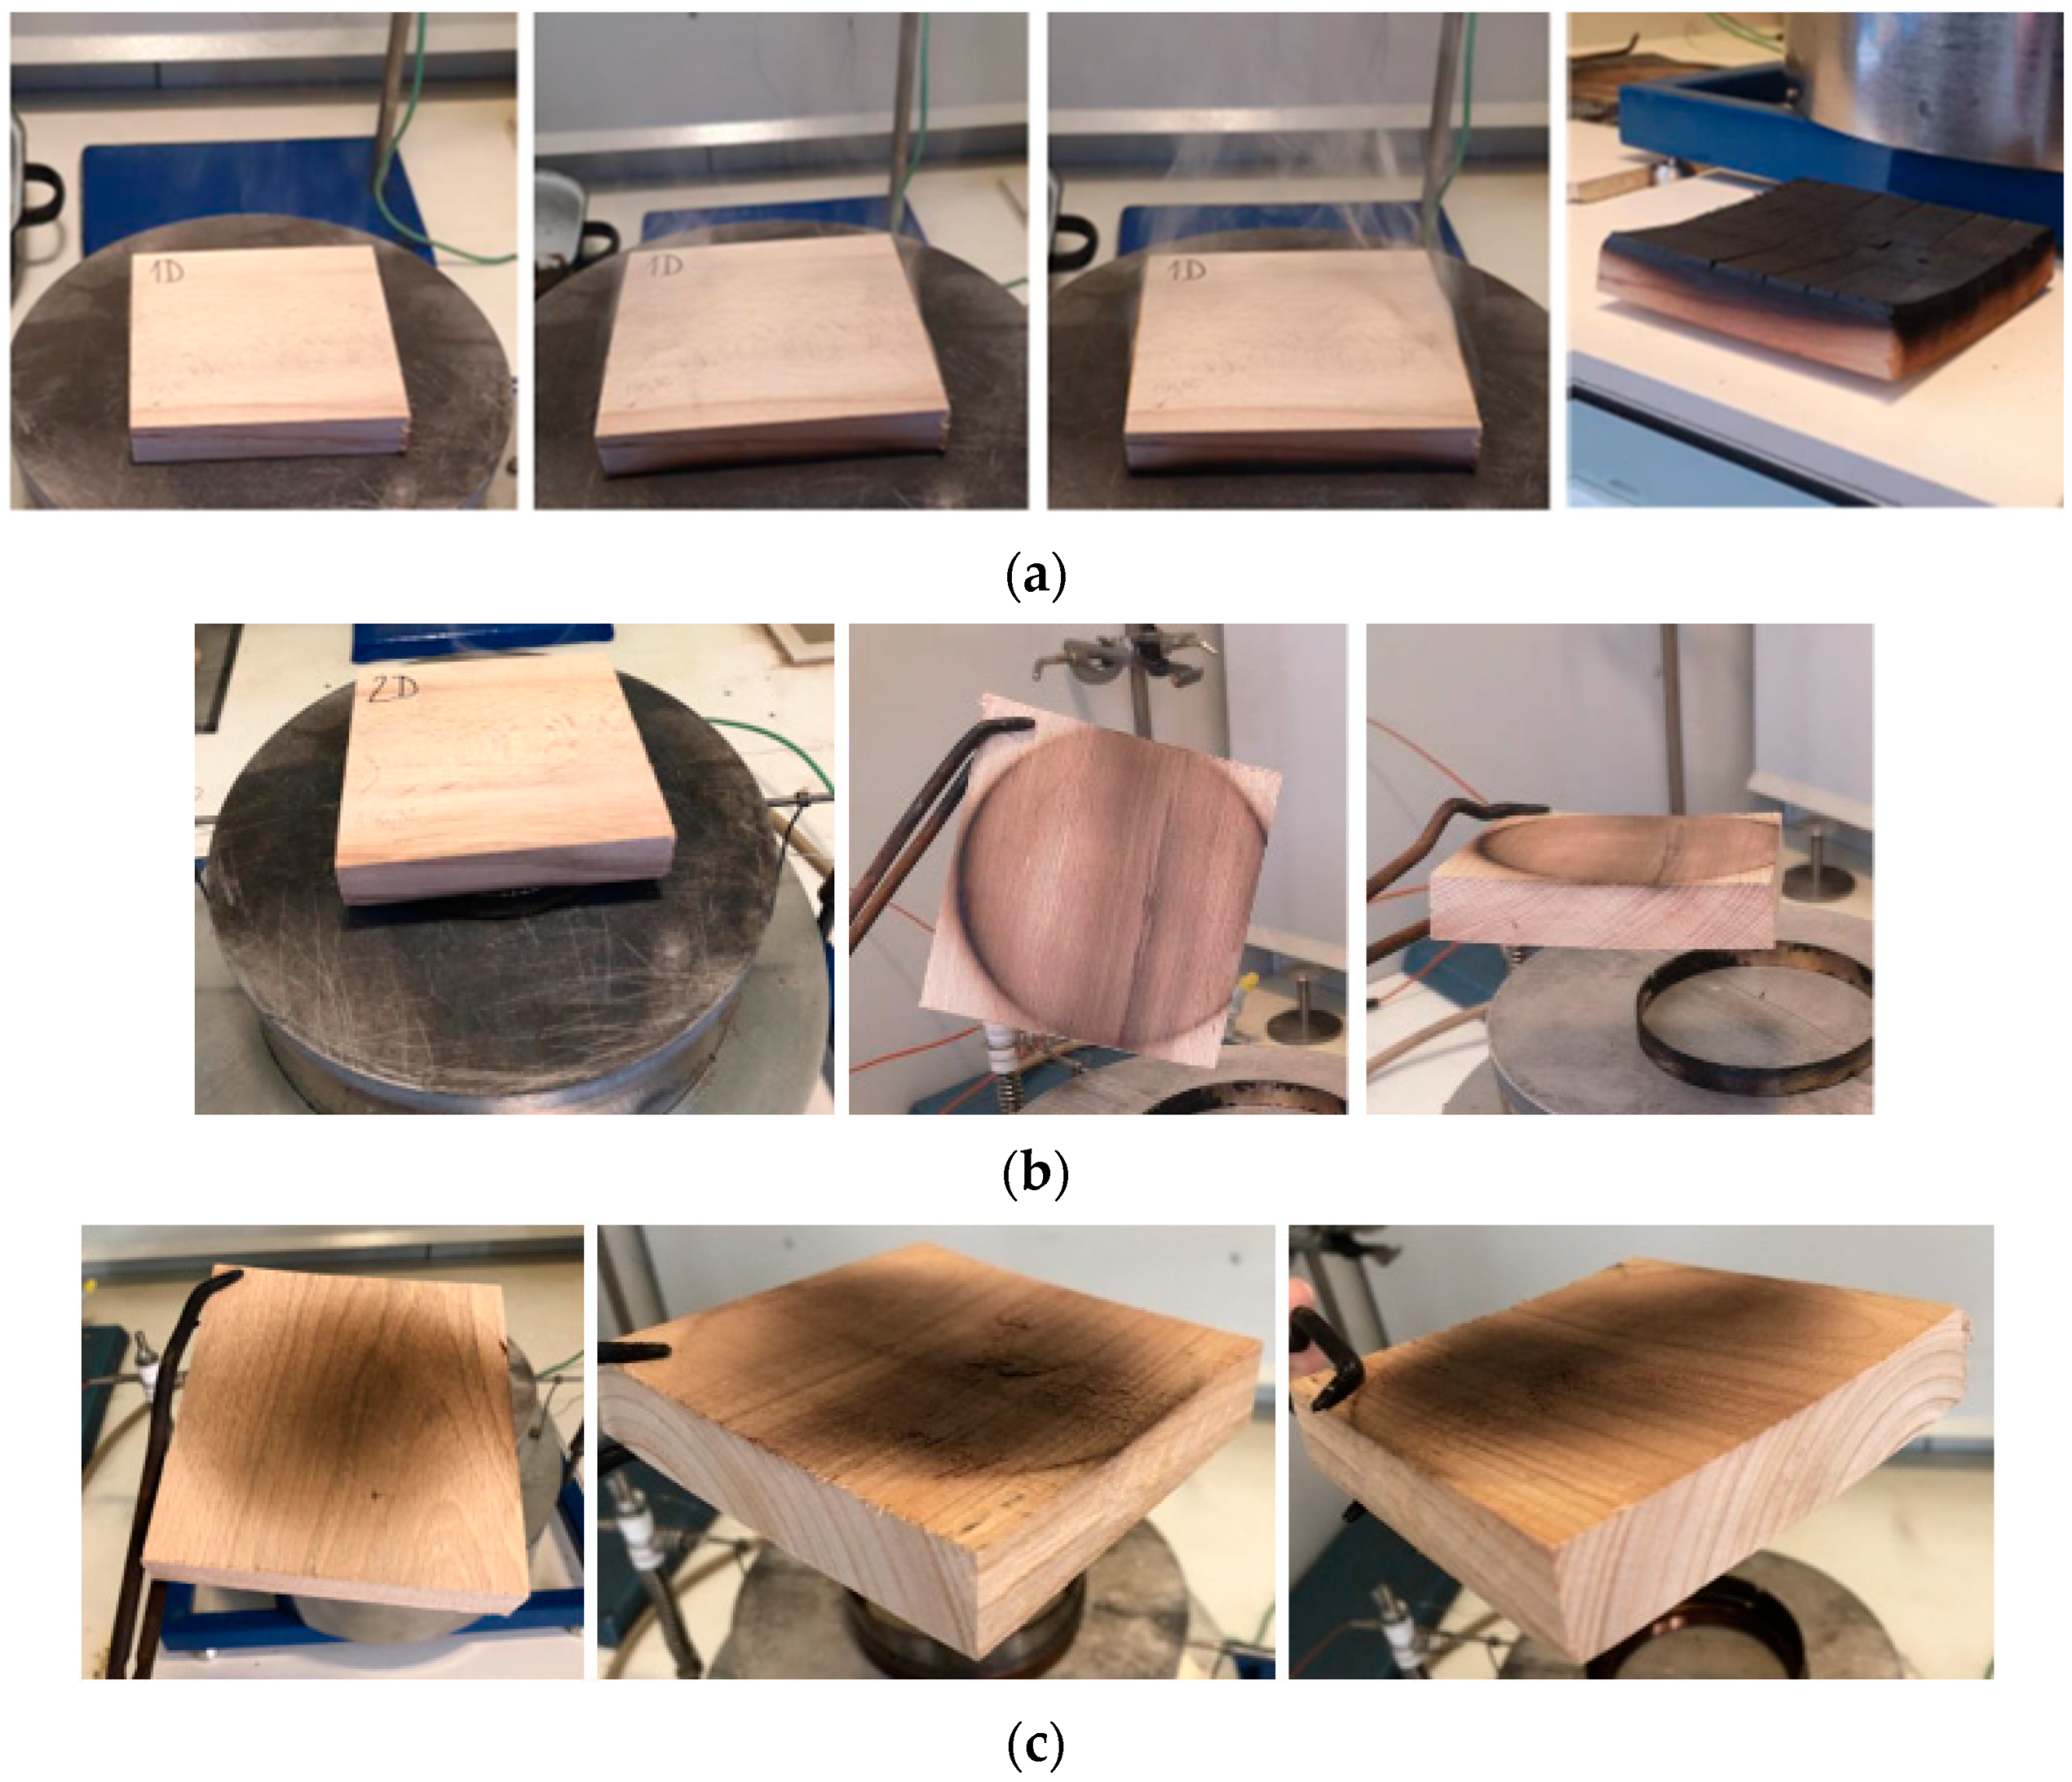
As a hardwood, oak begins to degrade thermally at significantly higher temperatures (Figure 9 and Figure 10). During the experiment, sample 3D exhibited negligible signs of smoldering or other indications of combustion. Oak is a popular material for producing thermally modified wood [64]. Hrčka et al. [65] studied the correlations between the chemical composition and physical properties of oak wood treated at of 20, 160, 180, 210, and 240 °C. They observed significant effects of temperature on the chemical compounds in these samples.
Aydin [66] investigated the effects of temperature on elasticity moduli, compression strength, and Young’s moduli of oak wood (Quercus petraea Liebl.) by axial compression test and ultrasonic measurements. Slight increases in these properties were observed at moderate temperatures (up to 150 °C). However, with further treatment at temperatures up to 210 °C for 8 h, all measured properties significantly decreased [66]. Kubovský et al. [67] conducted a similar study, exposing wood samples to 160, 180, and 210 °C. They confirmed changes in the chemical composition due to the reduction of hemicelluloses, as supported by Shapchenkova et al. [68]. Cullent et al. [69] investigated the thermal degradation and heterogeneous combustion of tobacco products and their respective emissions. They provided values for the gasification of various wood samples and reported oak “bubbling” at temperatures between 750 and 850 °C. Gerandi et al. [70] studied oak samples with dry densities of 630 kg·m−3 and 750 kg·m−3. This research focused on the thermal degradation of thin wood plates using thermoanalytical methods (TGA and DTG), confirming that the degradation of oak begins above 450 °C.
The mutual comparison of selected samples in terms of their thermal degradation is based on the obtained time–temperature curves (Figure 11) and the following parameters: weight loss of the sample (%) after thermal degradation, the highest temperature reached in the sample (°C), and the thickness of the charred layer (mm).
The comparison of the time–temperature curves for the samples indicates no significant differences (Figure 11). When comparing samples placed directly on the plate, they are virtually identical (Figure 11a). The only notable difference is observed in the red spruce sample, which exhibits atypical behavior compared to the other samples (Figure 11a–c). For clarity, the curve from Figure 2 is inserted into Figure 11. The differences are minimal. The variations in spacing distances clearly show the time shift of the temperature increase compared to the hot-plate curve.
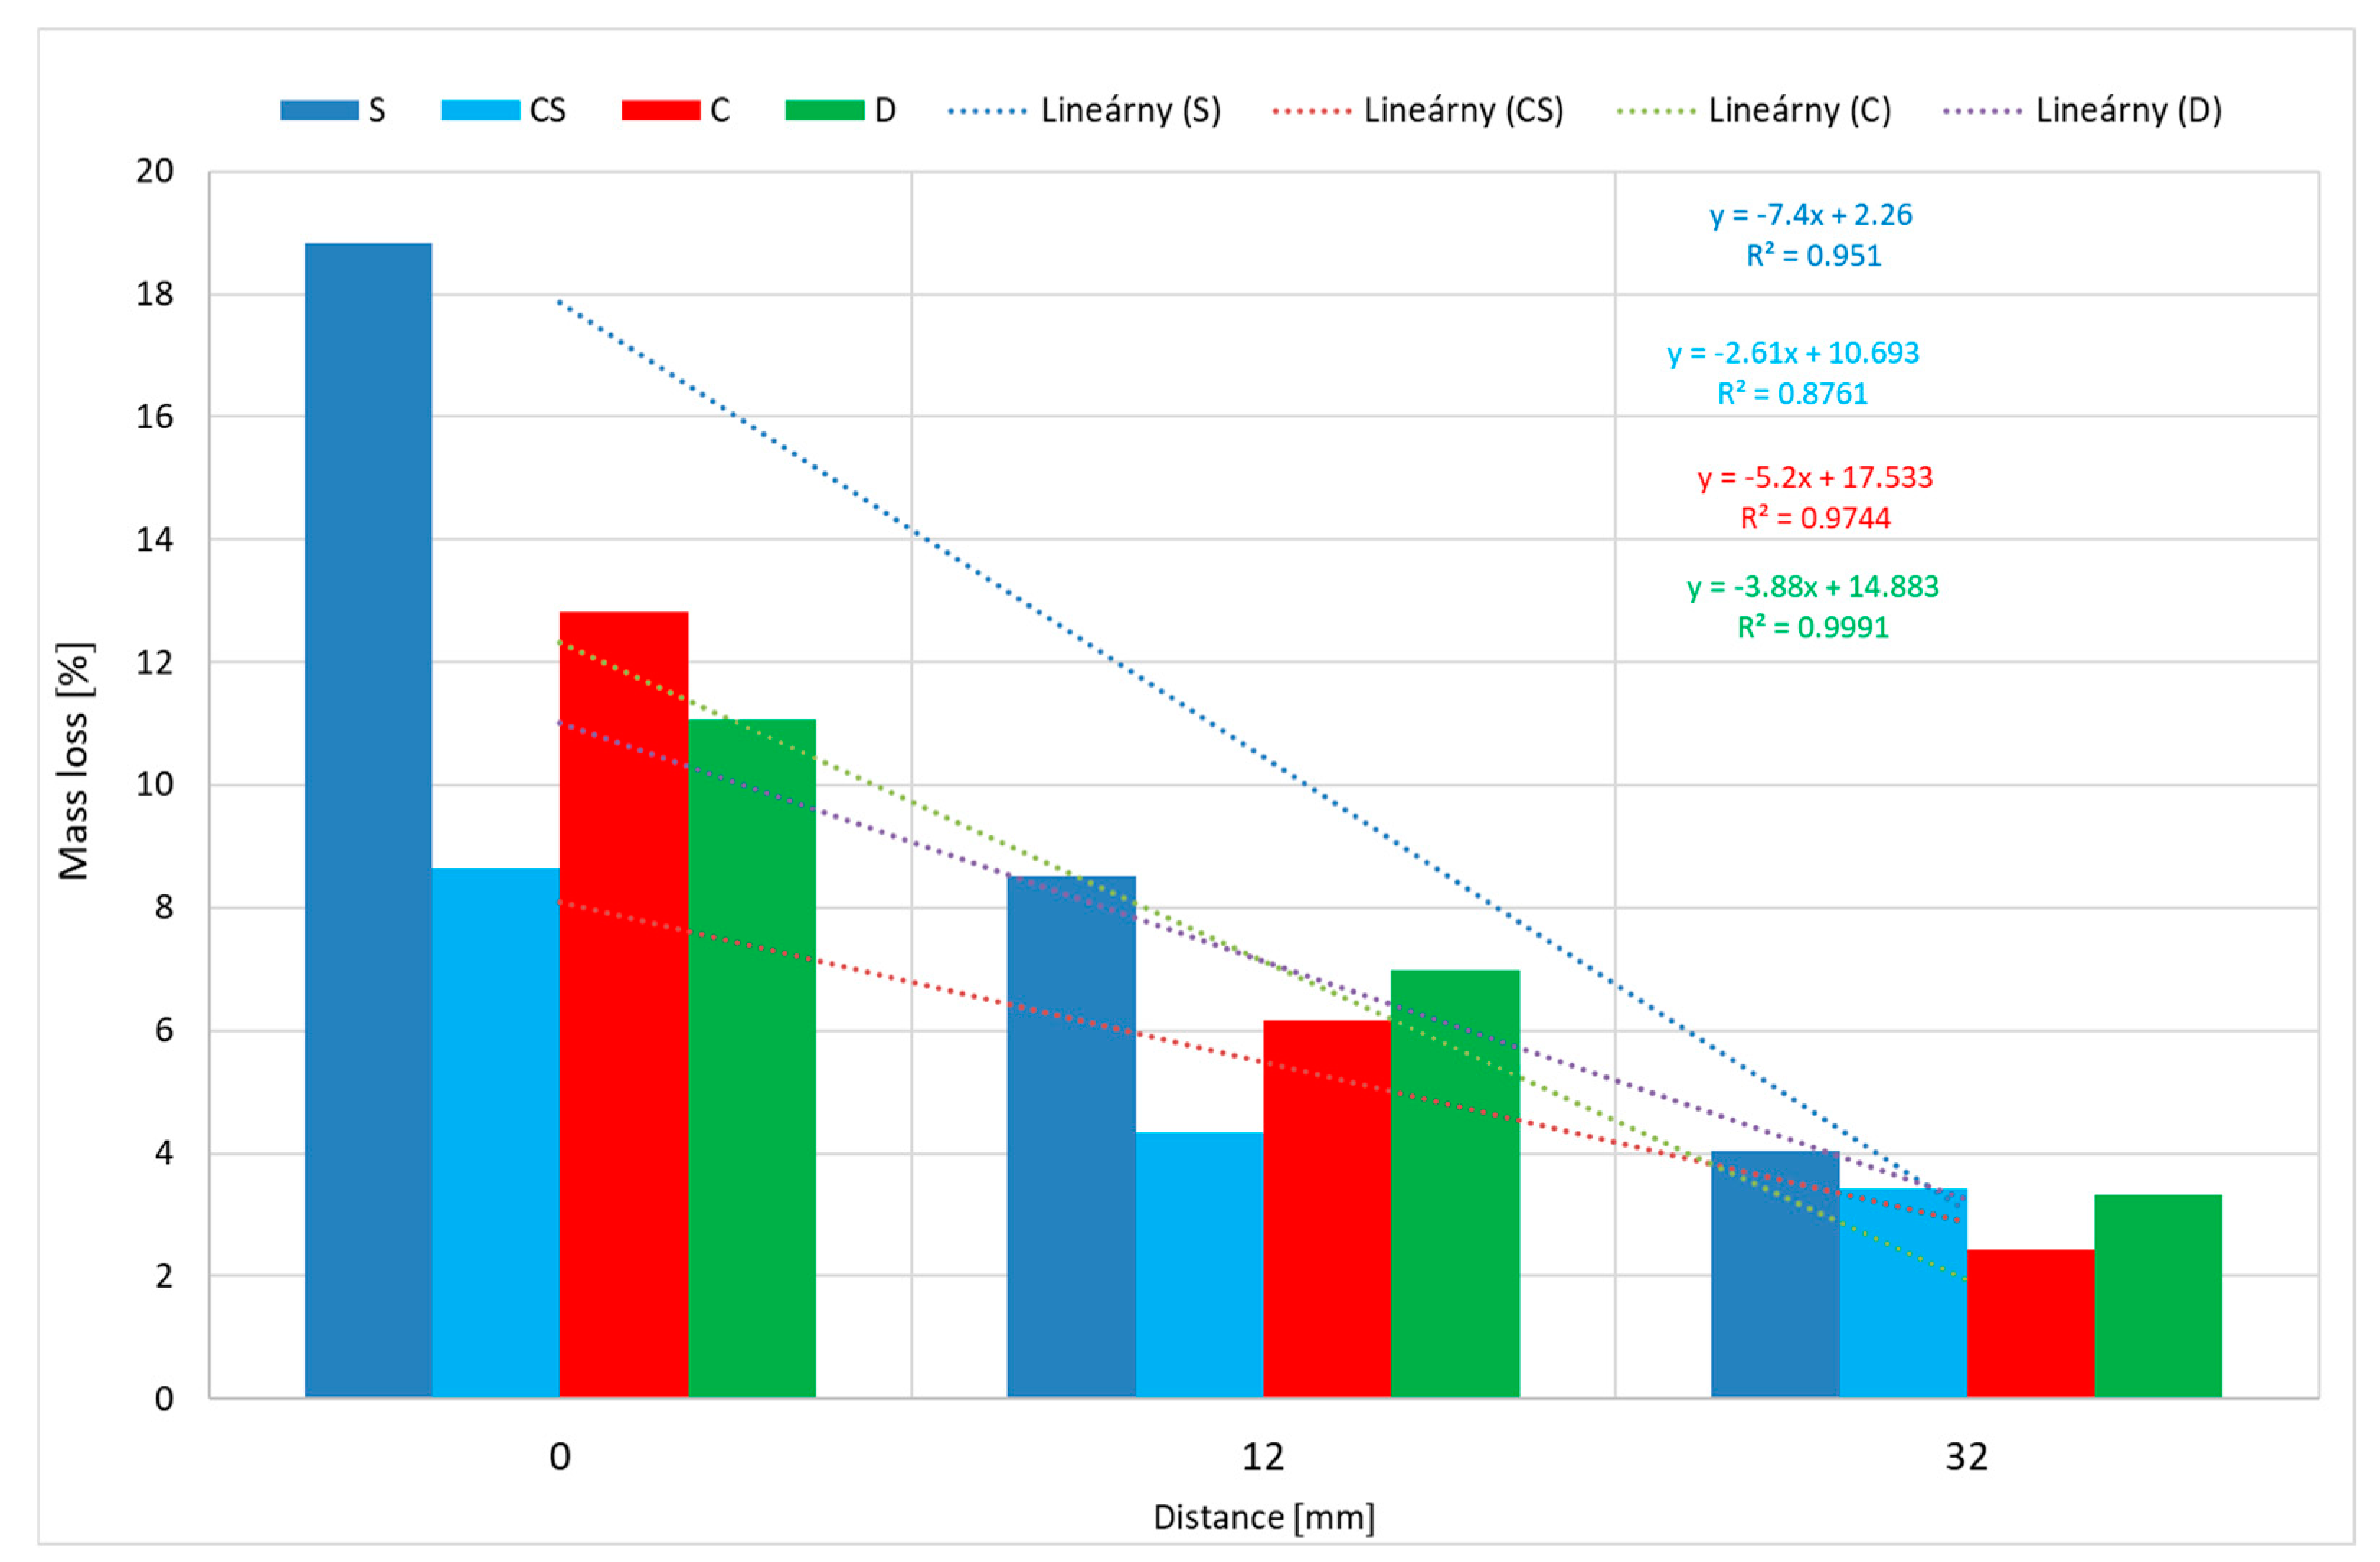
The greatest weight loss was observed in spruce, which reached 18.83%. This result suggests that spruce wood is more vulnerable to heat and may undergo more significant decomposition [31]. During the measurement, sample 1S also recorded the highest temperature, reaching 491.3 °C. Compared to the other tested samples, the highest charred-layer thickness was observed in samples 1S and 1C. Conversely, the smallest weight loss was recorded in samples placed farthest from the radiant heat source. Specifically, cherry wood exhibited the smallest weight loss, at 2.42%. These results demonstrate the impact of distance from the heat source on the thermal degradation of wood. Based on data analysis in Excel (Figure 12), it can be concluded that as the distance from the source increases, the weight loss decreases linearly.
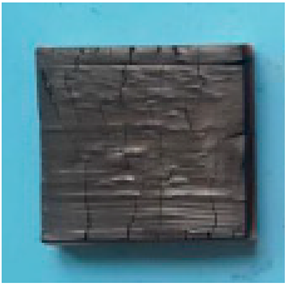
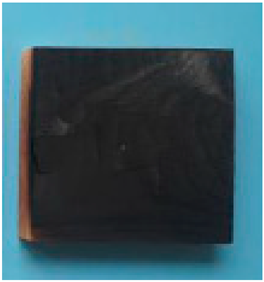
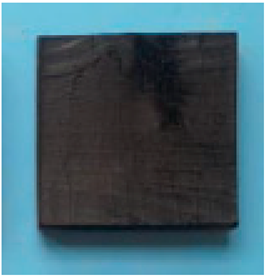
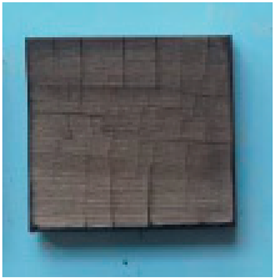
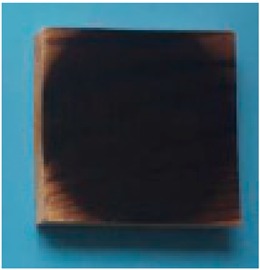
The experiment also produced samples with a charred layer (Table 3). Visual observation reveals significant changes, which are also reflected in the quantified thickness of the charred layer. The lowest charred-layer thickness was recorded in samples 3CS, 3C, and 3D, all showing a value of 0 mm. This issue was also addressed by Kmeťová et al. [60], who compared the thermal resistance of selected hardwoods and softwoods (spruce, fir, oak, and pine) under radiant heat exposure. In their experiment, samples were exposed to a thermal infrared emitter with a power of 1000 W for 600 s, at a distance of 30 mm. The criterion for evaluating the experiment was the relative weight loss of the tested samples. According to their results, oak samples demonstrated higher resistance to radiant heat effects and maintained a more intact shape after measurement. They observed a significant difference in weight loss for oak samples, as the weight loss occurred considerably later compared to softwoods. Upon comparing weight losses, oak samples demonstrated the lowest weight loss. These results are consistent with the measured values. The measured value for sample 1D indicates that oak was the second best-performing wood, with a weight loss of 11.07%. Additionally, the thickness of the charred layer was the smallest for all three oak samples. This suggests that wood density significantly influences resistance to thermal stress, with oak’s higher density providing better resistance to thermal loads. Reference [71] also noted that the poorest results were observed in pine and spruce samples, which showed the greatest weight loss. They attribute this phenomenon to the high resin content. These samples also had the lowest density among all tested samples, aligning with the results of the experiment.
Spruce samples exhibited the greatest weight loss among all tested samples (Figure 12), a result which may be attributed to a combination of factors, such as their composition and structure [72].
Spruce wood naturally has a lower density [73], which may lead to greater susceptibility to thermal stress and subsequent weight loss. This observation is consistent with the charred-layer thickness, which was found to be greatest in the spruce samples. Red spruce showed the lowest weight loss (Figure 10), indicating its resistance to environmental factors such as moisture [74].
Makovická Osvaldová [75] conducted a similar experiment with samples of pine, spruce, fir, and larch, with a moisture content of 8 ± 2% and dimensions of 10 × 12 × 150 mm. An electromagnetic radiation source was used as the initiator. The samples were positioned 30 mm from the initiator (with the identified temperature at this distance being 130 °C). The experimental time was 15 min. The obtained results demonstrated an approximate mass loss of 20%.
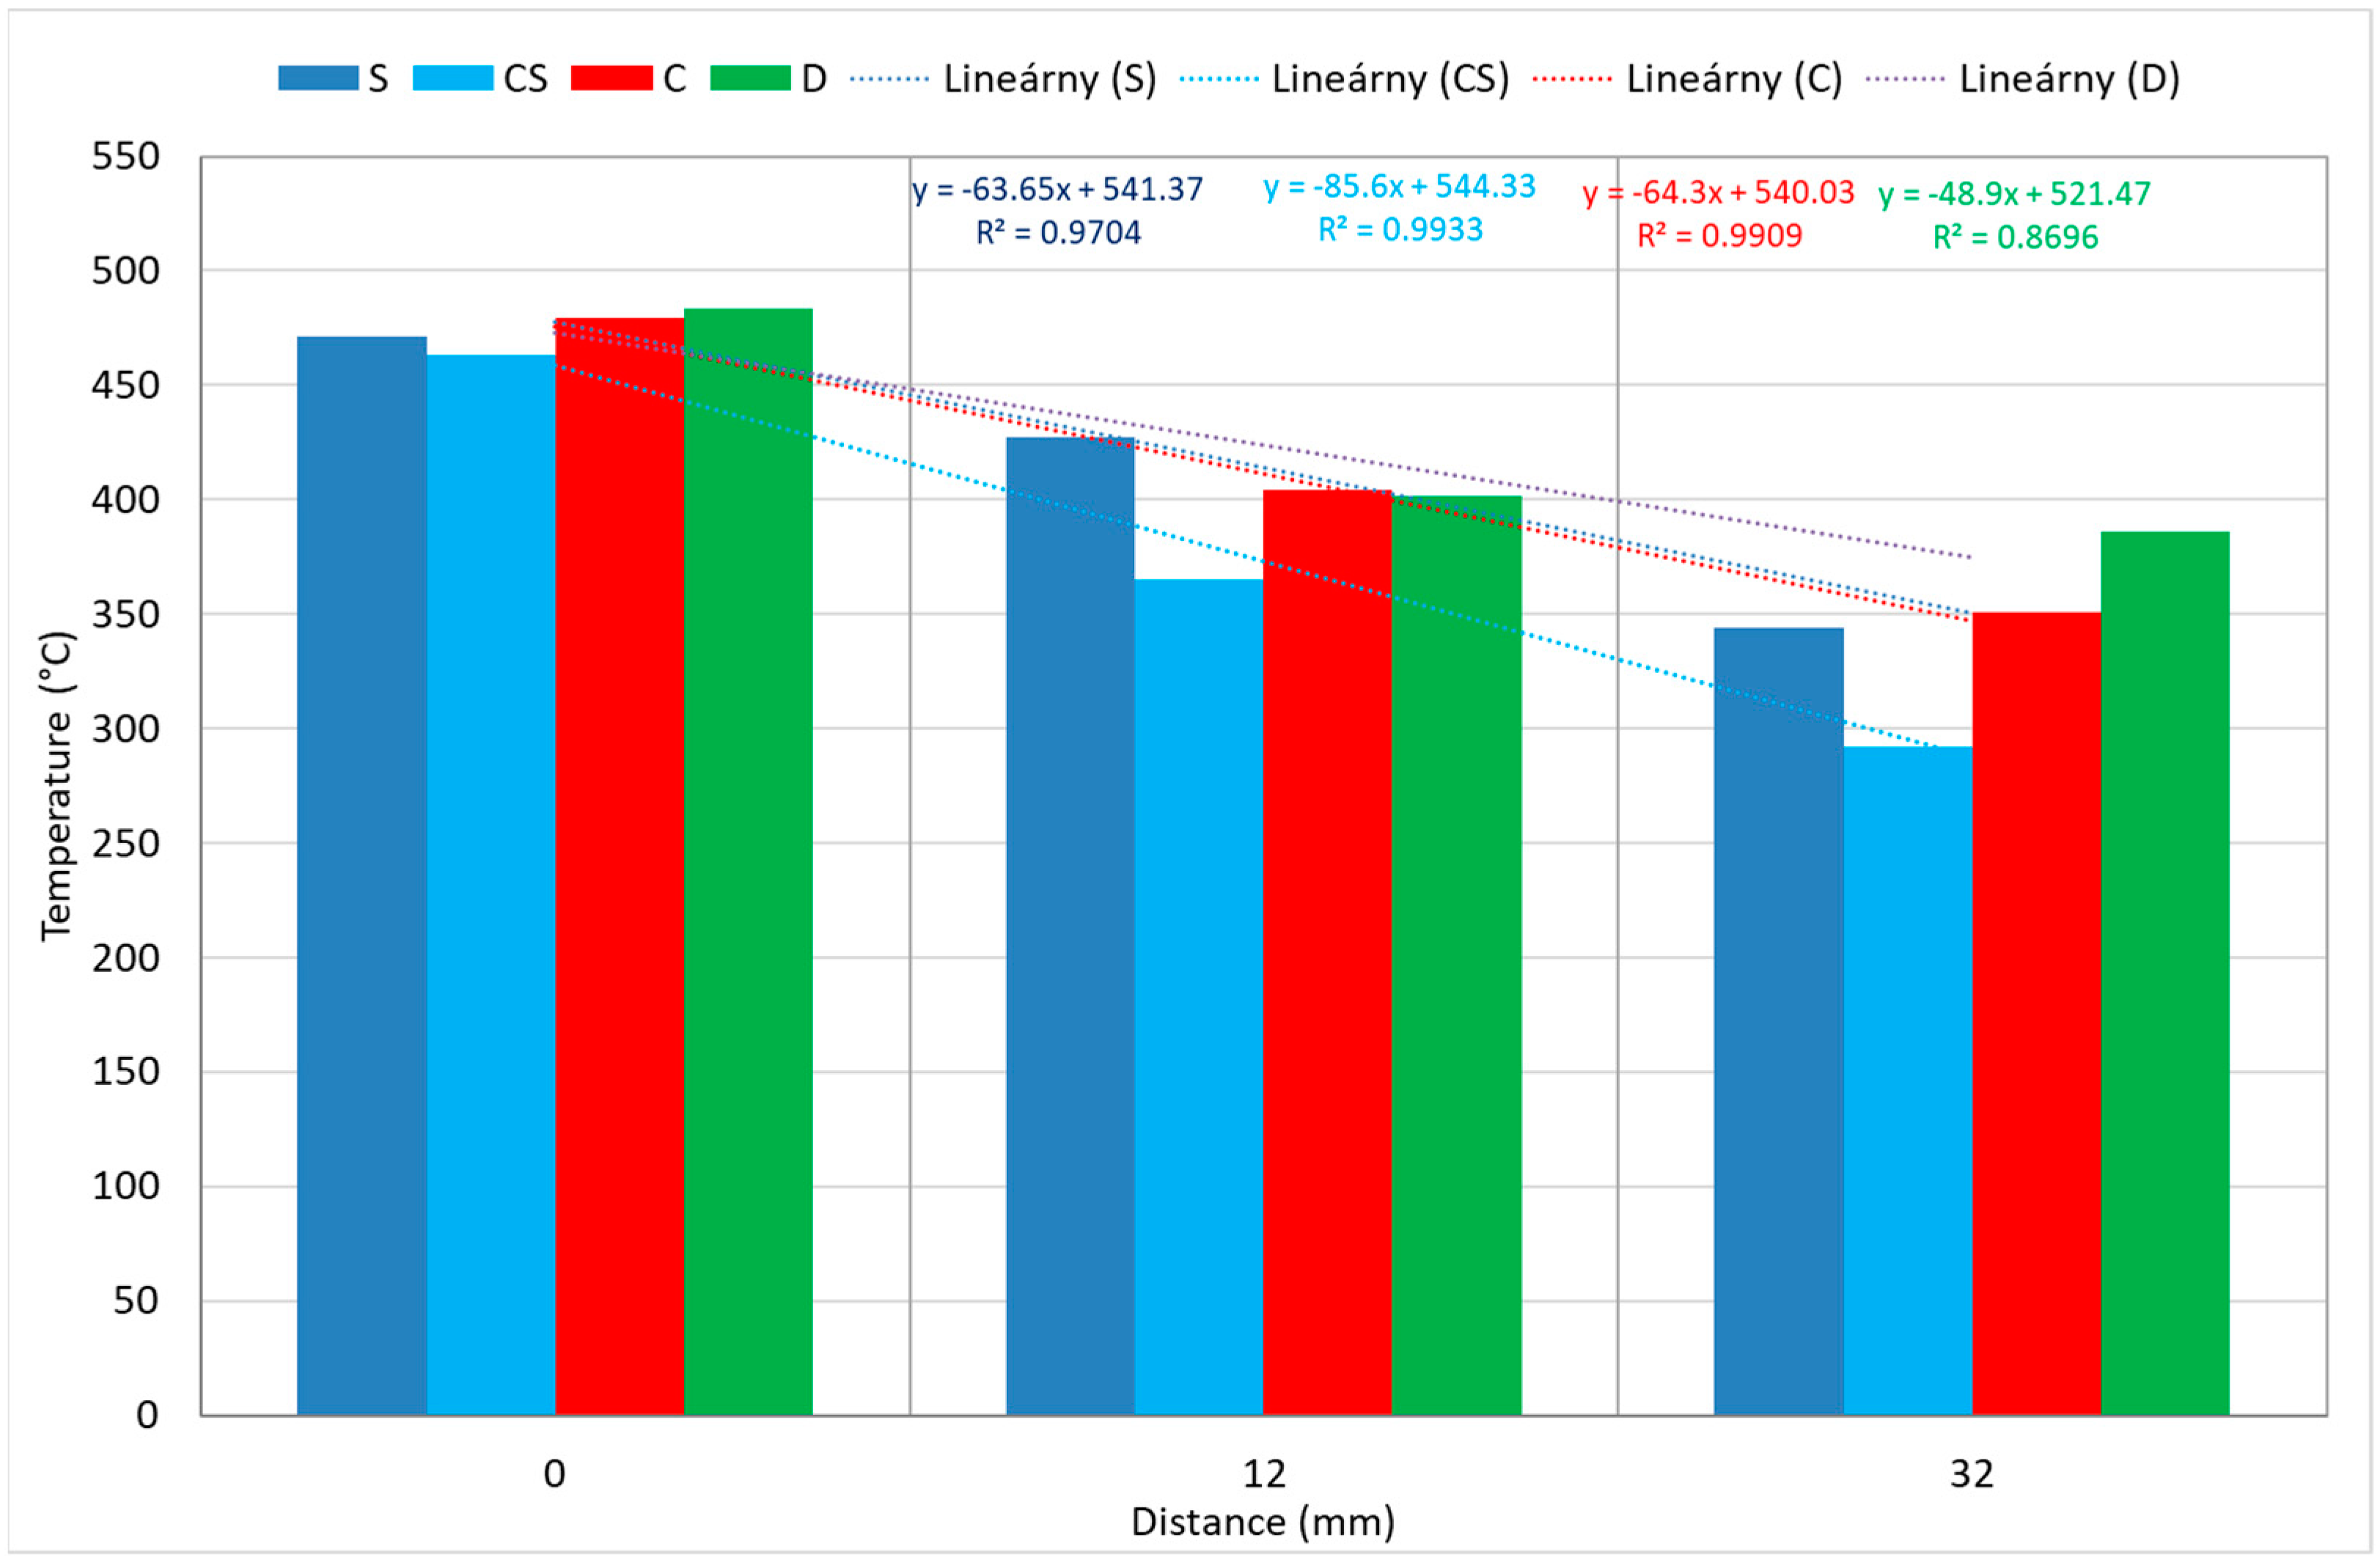
The comparison of the maximum temperatures reached in the samples during the experiment yielded noteworthy results (Figure 13). For spruce, red spruce, and cherry samples, it can be observed that as the distance increases, the maximum temperature decreases linearly.
Among the examined wood samples, oak (sample 1D) reached the highest temperature, at 483.5 °C (Figure 13). Shapchenkova et al. [68] also reported the highest temperature of thermal oxidation and the lowest charred-layer thickness in oak samples and lignin isolated from oak.
Because the time–temperature curves followed similar patterns (Figure 11), it was necessary to determine an appropriate method to quantify the observed differences. Figure 14 illustrates the comparison of experimental parameters mass loss (Figure 14a), maximal temperatures (Figure 14b), and charring layers (Figure 14c) with sample densities.
The results of the experiments are that CS exhibits typical behavior towards other investigated woods. In all of them, the temperature curves of CS were with the lowest values, so the temperature increase was the lowest, so it confirms the thermal stability. The mentioned wood species is not commonly used indoors.
Cherry is a softwood. Its results are in agreement with spruce, which is also a softwood. The obtained temperature curves S and C have a higher temperature course than the samples of hardwoods.
It is possible to assume that the mentioned woods are more intensively influenced by heat and reach higher temperature values on the surface compared to hardwoods (CS and D).
Overall, cherry exhibited the shortest smoldering time (indicating the onset of thermal degradation) (Figure 7a). Spruce showed temperatures approximately 100 °C higher than cherry. Smoldering in oak began at 525 s (Figure 9c).
Samples with lower density exhibit a significantly higher rate of weight loss. Mitrenga et al. [73] conducted research to investigate the effect of spruce wood density on weight loss and the rate of weight loss. Their study revealed that sample density influenced the rate of fire spread. They attributed the variability in mass loss primarily to the density of the spruce wood samples. The findings here indicate that, in addition to sample density, the distance from the initiating source also affects mass loss and the layer of charring.

8. Conclusions

(1) Spruce, red spruce, cherry, and oak samples, when subjected to radiant heat from a hot plate for 1200 s, underwent thermal degradation but did not ignite into flames.
(2) During the experiment, the sample positions were varied at distances of 0, 12, and 32 mm. For spruce, red spruce, and cherry samples, it was observed that the maximum temperature decreased linearly with increasing distance from the heat source. Among the wood samples examined, oak (sample 1D) reached the highest temperature of 483.5 °C, while red spruce (sample 3CS) demonstrated the lowest temperature of 291.6 °C.
(3) As the distance from the heat source increased, the weight loss of the samples decreased exponentially, except for the red spruce sample. The highest weight loss was observed in spruce (sample 1S) at 18.83%, while cherry (sample 3C) exhibited the lowest weight loss at 3.43%.
The aim of this study was to bring more knowledge about the reaction of wood samples to heat. The presented research is the first step of the research task of monitoring the behavior of wood exposed to radiant heat. However, there are many other types of wood and initiators. In future work, the degradation of the samples due to flame action will be studied to identify the limits of the wood and better understand the connections and differences in the behavior of the wood samples. Separate attention will be paid to the application of protective coatings.

Author Contributions

Conceptualization, I.M., J.J. and S.G; methodology, I.M. and J.J.; software, I.M. and S.G.; validation, I.M., J.J. and D.B.; formal analysis, S.G. and D.B.; investigation, I.M. and S.G.; resources, I.M., J.J. and D.B.; data curation, J.J. and S.G.; writing—original draft preparation, I.M., J.J., S.G. and D.B.; writing—review and editing, I.M., J.J. and S.G.; visualization, I.M. and D.B.; supervision, I.M.; project administration, I.M.; funding acquisition, I.M. and S.G. All authors have read and agreed to the published version of the manuscript.

Funding

The authors are grateful for the support of the Ministry of Education Slovak Republic, Grant No. VEGA 1/0628/22 and Grant UNIZA 12716.

Institutional Review Board Statement

The study did not require ethical approval.

Informed Consent Statement

Not applicable.

Data Availability Statement

The raw data supporting the conclusions of this article will be made available by the authors on request.

Conflicts of Interest

The authors declare no conflict of interest.

References

  1. Zelinka, S.L.; Altgen, M.; Emmerich, L.; Guigo, N.; Keplinger, T.; Kymäläinen, M.; Thybring, E.E.; Thygesen, L.G. Review of wood modification and wood functionalization technologies. Forests 2022, 13, 1004. [Google Scholar] [CrossRef]
  2. Properties of Wood. Vlastnosti Dřeva a Dřevostaveb. Stavba Dřeva—Část 1/2. [Properties of Wood and Wooden Buildings. Wood Construction—Part 1/2]. Available online: https://www.mezistromy.cz/vlastnosti-dreva-a-drevostaveb/stavba-dreva-cast-1-2/odborny (accessed on 12 February 2024). (In Sczech).
  3. Sergeev, M.; Rimshin, V.; Lukin, M.; Zdralovic, N. Multi-span composite beam. IOP Conf. Ser. Mater. Sci. Eng. 2020, 896, 012058. [Google Scholar] [CrossRef]
  4. Kristak, L.; Kubovský, I.; Réh, R. New challenges in wood and wood-based materials. Polymers 2021, 13, 2538. [Google Scholar] [CrossRef] [PubMed]
  5. Zhu, J.L.; Shi, Y.; Fang, L.Q.; Liu, X.E.; Ji, C.J. Patterns and determinants of wood physical and mechanical properties across major tree species in China. Sci. China-Life Sci. 2015, 58, 602–612. [Google Scholar] [CrossRef]
  6. Wimmer, R.; Johansson, M. Effects of reaction wood on the performance of wood and wood-based products. In The Biology of Reaction Wood; Gardiner, B., Barnett, J., Saranpaa, P., Gril, J., Eds.; Springer Series in Wood Science; Springer: Berlin/Heidelberg, Germany, 2014. [Google Scholar] [CrossRef]
  7. Cabrera, F.C.; Job, A.E. Natural rubber/wood composite foam: Thermal insulation and acoustic isolation materials for construction. Cell. Polym. 2023, 42, 55–72. [Google Scholar] [CrossRef]
  8. Ranefjärd, O.; Strandberg-de Bruijn, P.; Wadsö, L. Hygrothermal properties and performance of bio-based insulation materials locally sourced in Sweden. Materials 2024, 17, 2021. [Google Scholar] [CrossRef]
  9. Salonvaara, M.; Desjarlais, A. Impact of insulation strategies of cross-laminated timber assemblies on energy use, peak demand, and carbon emissions. Buildings 2024, 14, 1089. [Google Scholar] [CrossRef]
  10. Asyraf, M.R.M.; Ishak, M.R.S.; Sapuan, M.; Yidris, N.; Ilyas, R.A. Woods and composites cantilever beam: A comprehensive review of experimental and numerical creep methodologies. J. Mater. Res. Technol. 2020, 9, 6759–6776. [Google Scholar] [CrossRef]
  11. Hrebenárová, E.; Wald, F. Comparison of mechanical properties of the eldest larch wood construction with oak wood and spruce wood. Wood Res. 2022, 67, 612–624. [Google Scholar] [CrossRef]
  12. Bianco, I.; Thiébat, F.; Carbonaro, C.; Pagliolico, S.; Blengini, G.A.; Comino, E. Life Cycle Assessment (LCA)-based tools for the eco-design of wooden furniture. J. Clean. Prod. 2021, 324, 129249. [Google Scholar] [CrossRef]
  13. Abu, F.; Saman, M.Z.M.; Garza-Reyes, J.A.; Gholami, H.; Zakuan, N. Challenges in the implementation of lean manufacturing in the wood and furniture industry. J. Manuf. Technol. Manag. 2022, 33, 103–123. [Google Scholar] [CrossRef]
  14. Suandi, M.E.M.; Amlus, M.H.; Hemdi, A.R.; Abd Rahim, S.Z.; Ghazali, M.F.; Rahim, N.L. A review on sustainability characteristics development for wooden furniture design. Sustainability 2022, 14, 8748. [Google Scholar] [CrossRef]
  15. Grexa, O.; Horvathova, E.; Osvald, A. Cone calorimeter studies of wood species. Proc. Korea Inst. Fire Sci. Eng. Conf. 1997, 11a, 77–84. [Google Scholar]
  16. Košík, M.; Luzáková, V.; Reiser, V.; Blažej, A. Thermal degradation and flammability of cellulosics. Fire Mater. 1976, 1, 19–23. [Google Scholar] [CrossRef]
  17. Košík, M.; Reiser, V.; Blažej, A. Thermoanalytical studies of combustion of cellulosics and activity of fire retardants. J. Therm. Anal. Calorim. 1982, 23, 51–64. [Google Scholar] [CrossRef]
  18. Terrill, T.B.; Montgomery, R.R.; Reinhardta, C.F. Toxic gases from fires. Science 1978, 200, 1343–1347. [Google Scholar] [CrossRef]
  19. Babrauskas, V.; Krasny, J. Fire Behavior of Upholstered Furniture (NBS Monograph 173). In NIST Interagency/Internal Report (NISTIR); National Institute of Standards and Technology: Gaithersburg, MD, USA, 1985. [Google Scholar]
  20. Babrauskas, V.; Lawson, J.; Walton, W.; Twilley, W. Upholstered Furniture Heat Release Rates Measured with a Furniture Calorimeter. In NIST Interagency/Internal Report (NISTIR); National Institute of Standards and Technology: Gaithersburg, MD, USA, 1982. [Google Scholar]
  21. Réh, R.; Osvald, A. Contribution to the fire retardant treatment of flax board panels. Folia For. Pol. Ser. B 1996, 27, 79–83. Available online: https://ffp.matlibhax.com/pdf/27/Folia%20Forestalia%20Pol%2027-9%20Reh%20Osvald.pdf (accessed on 10 May 1996).
  22. Balog, K.; Košík, Š.; Košík, M.; Reiser, V.; Šimek, I. Application df thermal analysis procedures to the study pyrolytic and flammability of some polymers. Thermochim. Acta 1985, 93, 167–170. [Google Scholar] [CrossRef]
  23. Bučko, J.; Osvald, A. Rozklad Dreva Teplom A Ohňom [Wood Degradation by Heat and Fire]; Technical University in Zvolen: Zvolen, Slovakia, 1998. (In Slovak) [Google Scholar]
  24. Takashi, H.; Yoshinori, H.; Hidetoshi, T.; Shuji, Y. Thermal degradation of wood and its constituents on smoldering combustion in oxygen atmosphere. Fire Sci. Technol. 1985, 5, 55–68. [Google Scholar] [CrossRef]
  25. Šimkovic, I.; Balog, K.; Csomorová, K. Thermal degradation and thermooxidation of O-Acetyl-(4-O-methyl-D-glucurono)-D-xylan and related derivatives. Holzforschung 1995, 49, 512–516. [Google Scholar] [CrossRef]
  26. Madyaratri, E.W.; Ridho, M.R.; Iswanto, A.H.; Osvaldová, L.M.; Lee, S.H.; Antov, P. Effect of lignin or lignosulfonate addition on the fire resistance of areca (Areca catechu) particleboards bonded with ultra-low-emitting urea-formaldehyde resin. Fire 2023, 6, 299. [Google Scholar] [CrossRef]
  27. Vavrčík, H. Anatomická Stavba Dřeva [Anatomical Structure of Wood]; Mendel University in Brno: Brno, Czech Republic, 2017. (In Czech) [Google Scholar]
  28. Gašparík, M.; Rezaei, F.; Karami, E.; Das, S.; Kytka, T.; Vlk, L.; Corleto, R.; Ditommaso, G. Vplyv striedania mrazu a vysokých teplôt na pevnosť v ťahu lepeného smreka nórskeho (Picea abies (L.) H. Karst.) a smrekovec európsky (Larix decidua Mill.). [Effect of alternation of frost and high temperatures on the tensile strength of glued Norway spruce (Picea abies (L.) H. Karst.) and European larch (Larix decidua Mill.)]. Európsky Vestník Dreva A Drevených Výrobkov. [Eur. J. Wood Wood Prod.] 2020, 80, 1343–1350. [Google Scholar]
  29. Gašparík, M.; Karami, E.; Rezaei, F.; Kytka, T.; Das, S.; Lesáková, D. Vplyv striedania nižších a vyšších teplôt na ohybové vlastnosti lepeného smreka nórskeho (Picea abies (L.) H. Karst.) a smrekovca európskeho (Larix decidua Mill.) [The effect of alternation of lower and higher temperatures on the bending properties of glued Norway spruce (Picea abies (L.) H. Karst.) and European larch (Larix decidua Mill.)]. Lesy [Forests] 2022, 13, 364. [Google Scholar]
  30. Zachar, M.; Čabalová, I.; Kačíková, D.; Zacharová, L. Vplyv tepelného toku na požiarnotechnické a chemické vlastnosti smrekového dreva (Picea abies L.) [Effect of heat flow on the fire-technical and chemical properties of spruce wood (Picea abies L.)]. Materiály [Materials] 2021, 14, 4989. [Google Scholar]
  31. Čabalová, I.; Zachar, M.; Kačík, F.; Tribulová, T. Impact of thermal loading on selected chemical and morphological properties of spruce ThermoWood. BioResources 2019, 14, 387–400. [Google Scholar] [CrossRef]
  32. Cziegler, A.; Kaschnitz, E. Thermophysical properties of beech wood in the range from room Ttmperature to 900 °C. Int. J. Thermophys. 2024, 45, 26. [Google Scholar] [CrossRef]
  33. Maeda, K.; Tsunetsugu, Y.; Miyamoto, K.; Shibusawa, T. Thermal properties of wood measured by the hot-disk method: Comparison with thermal properties measured by the steady-state method. J. Wood Sci. 2021, 67, 20. [Google Scholar] [CrossRef]
  34. Harangozó, J.; Tureková, I.; Marková, I.; Hašková, A.; Králik, R. Study of the influence of heat flow on the time to ignition of spruce and beech wood. Appl. Sci. 2024, 14, 4237. [Google Scholar] [CrossRef]
  35. Fire Statistics in Slovakia. Štatistika Požiarovosti na Slovensku. Available online: https://www.minv.sk/?statistika-poziarovosti-na-slovensku-2 (accessed on 9 December 2024). (In Slovak).
  36. Oreňák, M.; Vido, J.; Hríbik, M.; Bartik, M. Interception process of spruce in the phase of disintegration in the Western Tatras. Rep. For. Res. 2013, 58, 360–369. [Google Scholar]
  37. Caboun, V. Draft of strategy, adaptation and mitigation measures from the viewpoint of climate change impact on Norway spruce tree in Slovakia. Cent. Eur. For. J. 2009, 55, 215–238. [Google Scholar]
  38. Jaloviar, P.; Kýpeťová, M.; Kucbel, S.; Vencurik, J.; Pittner, J. Density and height structure of natural regeneration in mountain spruce forest of the Polana (Slovakia). Rep. For. Res. 2017, 62, 7–15. [Google Scholar]
  39. Tudor, E.M.; Dettendorfer, A.; Kain, G.; Barbu, M.C.; Réh, R.; Krišťák, Ľ. Sound-absorption coefficient of bark-based insulation panels. Polymers 2020, 12, 1012. [Google Scholar] [CrossRef] [PubMed]
  40. Jaďuďová, J.; Hroncová Vicianová, J. IMS Tools in selected Slovak paper-pulp and pulp enterprises in the context of CSR. Acta Univ. Matthiae Belii Ser. Environ. Manage. 2017, 19, 55–62. [Google Scholar] [CrossRef]
  41. Koo, K.A.; Madden, M.; Patten, B.C. Projection of red spruce (Picea rubens Sargent) habitat suitability and distribution in the Southern Appalachian Mountains, USA. Ecol. Model. 2014, 293, 91–101. [Google Scholar] [CrossRef]
  42. Li, W.; Kershaw, J.A.; Costanza, K.K.I.; Taylor, A.R. Evaluating the potential of red spruce (Picea rubens Sarg.) to persist under climate change using historic provenance trials in eastern Canada. For. Ecol. Manag. 2020, 466, 118139. [Google Scholar] [CrossRef]
  43. White, H.M.; Resler, L.M.; Carroll, D. Characteristics of red spruce (Picea rubens Sarg.) encroachment at two central Appalachian heathland study areas. Int. J. Appl. Geospat. Res. 2021, 12, 18–37. [Google Scholar] [CrossRef]
  44. Brown, C.H.; Griscom, H.P. Assessing red spruce (Picea rubens Sarg.) restoration potential under current and future predicted climate change in Virginia. Restor. Ecol. 2023, 31, e14034. [Google Scholar] [CrossRef]
  45. Smoleňák, M. Červený Smrek—Najtvrdšia Ihličnatá Drevina [Red Spruce—The Hardest Conifer]. Available online: https://www.kunaj.com/prispevky/cerveny-smrek---najtvrdsia-ihlicnata-drevina (accessed on 12 March 2024). (In Slovak).
  46. Bystriansky, S. Výberkový hospodársky spôsob. [Selective economic method]. In Konferencia Sliacke Poobhliadnutie 2018. [Sliač Tour Conference 2018], Sliač, Slovakia, 3–4 October 2018; Technical University in Zvolen: Zvolen, Slovakia, 2018. (In Slovak) [Google Scholar]
  47. Krokusová, J.; Urbanová, Š. Biogeografická analýza drevín pri prícestných krížoch v okrese Vranov nad Topľou. [Biogeographic analysis of woody plants at crosses in the district Vranov nad Topľou]. Mlad. Veda [Young Sci.] 2021, 9, 26–49. (In Slovak) [Google Scholar]
  48. Ortega-Vidal, J.; Cobo, A.; Ortega-Morente, E.; Gálvez, A.; Alejo-Armijo, A.; Salido, S.; Altarejos, J. Antimicrobial and antioxidant activities of flavonoids isolated from wood of sweet cherry tree (Prunus avium L.). J. Wood Chem. Technol. 2021, 41, 104–117. [Google Scholar] [CrossRef]
  49. Szilágyi, S.; Horváth-Kupi, T.; Desiderio, F.; Bekefi, Z. Evaluation of sweet cherry (Prunus avium L.) cultivars for fruit size by FW_G2a QTL analysis and phenotypic characterization. Sci. Hortic. 2022, 29, 56–61. [Google Scholar] [CrossRef]
  50. Hrotko, K.; Németh-Csigai, K.; Magyar, L.; Ficzek, G. Growth and productivity of sweet cherry varieties on Hungarian clonal Prunus mahaleb (L.) rootstocks. Horticulturae 2023, 9, 198. [Google Scholar] [CrossRef]
  51. Shahini, S.; Drobitko, S.; Sharata, N.; Rybachuk, V.; Ivanova, I. Analysis of modern technologies for growing cherry varieties in temperate climates. Sci. Horiz. 2023, 26, 62–71. [Google Scholar] [CrossRef]
  52. Petráš, R.; Mecko, J.; Krupová, D.; Pažitný, A. Aboveground biomass basic Density of hardwoods tree species. Wood Res. 2020, 65, 1001–1012. [Google Scholar] [CrossRef]
  53. Slávik, M. Využitie introdukovaných drevín v lesoch Slovenska (The use of introduced trees in the forests of Slovakia) [The use of introduced trees in the forests of Slovakia]. In Nlc Outputs for Forestry Practice IV; National Forestry Center: Zvolen, Slovakia, 2022. [Google Scholar]
  54. Carmona Uzcategui, M.G.; Seale, R.D.; Nistal França, F.J. Physical and mechanical properties of clear wood from red oak and white oak. BioResources 2020, 15, 4960–4971. [Google Scholar] [CrossRef]
  55. Mračková, E.; Schmidtová, J.; Marková, I.; Jaďuďová, J.; Tureková, I.; Hitka, M. Fire parameters of spruce (Picea abies Karst. (L.)) dust layer from different wood technologies Slovak case study. Appl. Sci. 2022, 12, 548. [Google Scholar] [CrossRef]
  56. Marková, I.; Giertlová, Z.; Jaďuďová, J.; Tureková, I. Ignition of hay and straw by radiant heat. Processes 2023, 11, 2741. [Google Scholar] [CrossRef]
  57. Jaďuďová, J.; Marková, I.; Šťastná, M.; Giertlová, Z. The evaluation of the fire safety of the digestate as an alternative bedding material. Processes 2023, 11, 2609. [Google Scholar] [CrossRef]
  58. Harušincová, N. Monitoring of Thermal Degradation of Selected Wood Species. Master’s Thesis, University of Žilina, Žilina, Slovakia, 2023. [Google Scholar]
  59. Luptáková, J.; Kačík, F.; Mitterová, I.; Zachar, M. Influence of temperature of thermal modification on the fire-technical characteristics of spruce wood. BioResources 2019, 14, 3795–3807. [Google Scholar] [CrossRef]
  60. Kmeťová, E.; Mitterová, I.; Kačíková, D. Evaluation of selected coniferous and deciduous trees species after radiant heat loading by the method of mass loss. Delta Fire Prot. Saf. Sci. J. 2020, 14, 16–29. [Google Scholar] [CrossRef]
  61. Gašpercová, S.; Marková, I.; Vandlíčková, M.; Makovická Osvaldová, L.; Svetlík, J. Effect of protective coatings on wooden elements exposed to a small ignition initiator. Appl. Sci. 2023, 13, 3371. [Google Scholar] [CrossRef]
  62. Cesprini, E.; De Iseppi, A.; Giovando, S.; Tarabra, E.; Zanetti, M.; Šketi, P.; Marangon, M.; Tondi, G. Chemical characterization of cherry (Prunus avium) extract in comparison with commercial mimosa and chestnut tannins. Wood Sci. Technol. 2022, 56, 1455–1473. [Google Scholar] [CrossRef]
  63. Engozogho Anris, S.P.; Bi Athomo, A.B.; Safou Tchiama, R.; Santiago-Medina, F.J.; Cabaret, T.; Pizzi, A.; Charrier, B. The condensed tannins of Okoume (Aucoumea klaineana Pierre): A molecular structure and thermal stability study. Sci. Rep. 2020, 10, 1773. [Google Scholar] [CrossRef] [PubMed]
  64. Laskowska, A.; Marchwicka, M.; Boruszewski, P.; Wyszyńska, J. Chemical composition and selected physical properties of oak wood (Quercus robur L.) modified by cyclic thermo-mechanical treatment. BioResources 2018, 13, 9005–9019. [Google Scholar] [CrossRef]
  65. Hrčka, R.; Kučerová, V.; Hýrošová, T. Correlations between oak wood properties. BioResources 2018, 13, 8885–8898. [Google Scholar] [CrossRef]
  66. Aydin, T.Y. Ultrasonic evaluation of time and temperature-dependent orthotropic compression properties of oak wood. J. Mater. Res. Technol. 2020, 9, 6028–6036. [Google Scholar] [CrossRef]
  67. Kubovský, I.; Kačíková, D.; Kačík, F. Structural changes of oak wood main components caused by thermal modification. Polymers 2020, 12, 485. [Google Scholar] [CrossRef]
  68. Shapchenkova, O.; Loskutov, S.; Aniskina, A.; Börsök, Z.; Pászory, Z. Thermal characterization of wood of nine European tree thermogravimetry and differential scanning calorimetry in an air atmosphere. Eur. J. Wood Prod. 2022, 80, 409–417. [Google Scholar] [CrossRef]
  69. Cullen, C.T.; Kärkelä, T.; Tapper, U. Signatures that differentiate thermal degradation and heterogeneous combustion of tobacco products and their respective emissions. J. Anal. Appl. Pyrolysis 2024, 24, 106478. [Google Scholar] [CrossRef]
  70. Gerandi, G.; Tihay-Felicelli, V.; Santoni, P.A.; Leroy-Camcellieri, V.; Cancellieri, D. Multi-scale modeling of the degradation of thermally thin wood plates. Fire Saf. J. 2019, 108, 102823. [Google Scholar] [CrossRef]
  71. Párničanová, A.; Zachar, M. Laboratory Investigation of Sessile Oak Wood Thermal Degradation. Delta 2022, 16, 63–70. [Google Scholar]
  72. Čekovská, H.; Gaff, M.; Osvald, A.; Kačík, F.; Kubš, J.; Kaplan, L. Fire resistance of thermally modified spruce wood. BioResources 2017, 12, 947–959. [Google Scholar] [CrossRef]
  73. Mitrenga, P.; Makovická Osvaldová, L.; Konárik, M. Effect of spruce wood density on selected fire-technical parameters during thermal loading. Appl. Sci. 2024, 14, 170. [Google Scholar] [CrossRef]
  74. Dumais, D.; Prévost, M. Management for red spruce conservation in Québec: The importance of some physiological and ecological characteristics—A review. For. Chron. 2007, 83, 378–391. [Google Scholar] [CrossRef]
  75. Makovická Osvaldová, L.; Osvald, A.; Kačíková, D. Char layer of various tree parts from selected coniferous wood. Adv. Mater. Res. 2014, 1001, 276–281. [Google Scholar] [CrossRef]
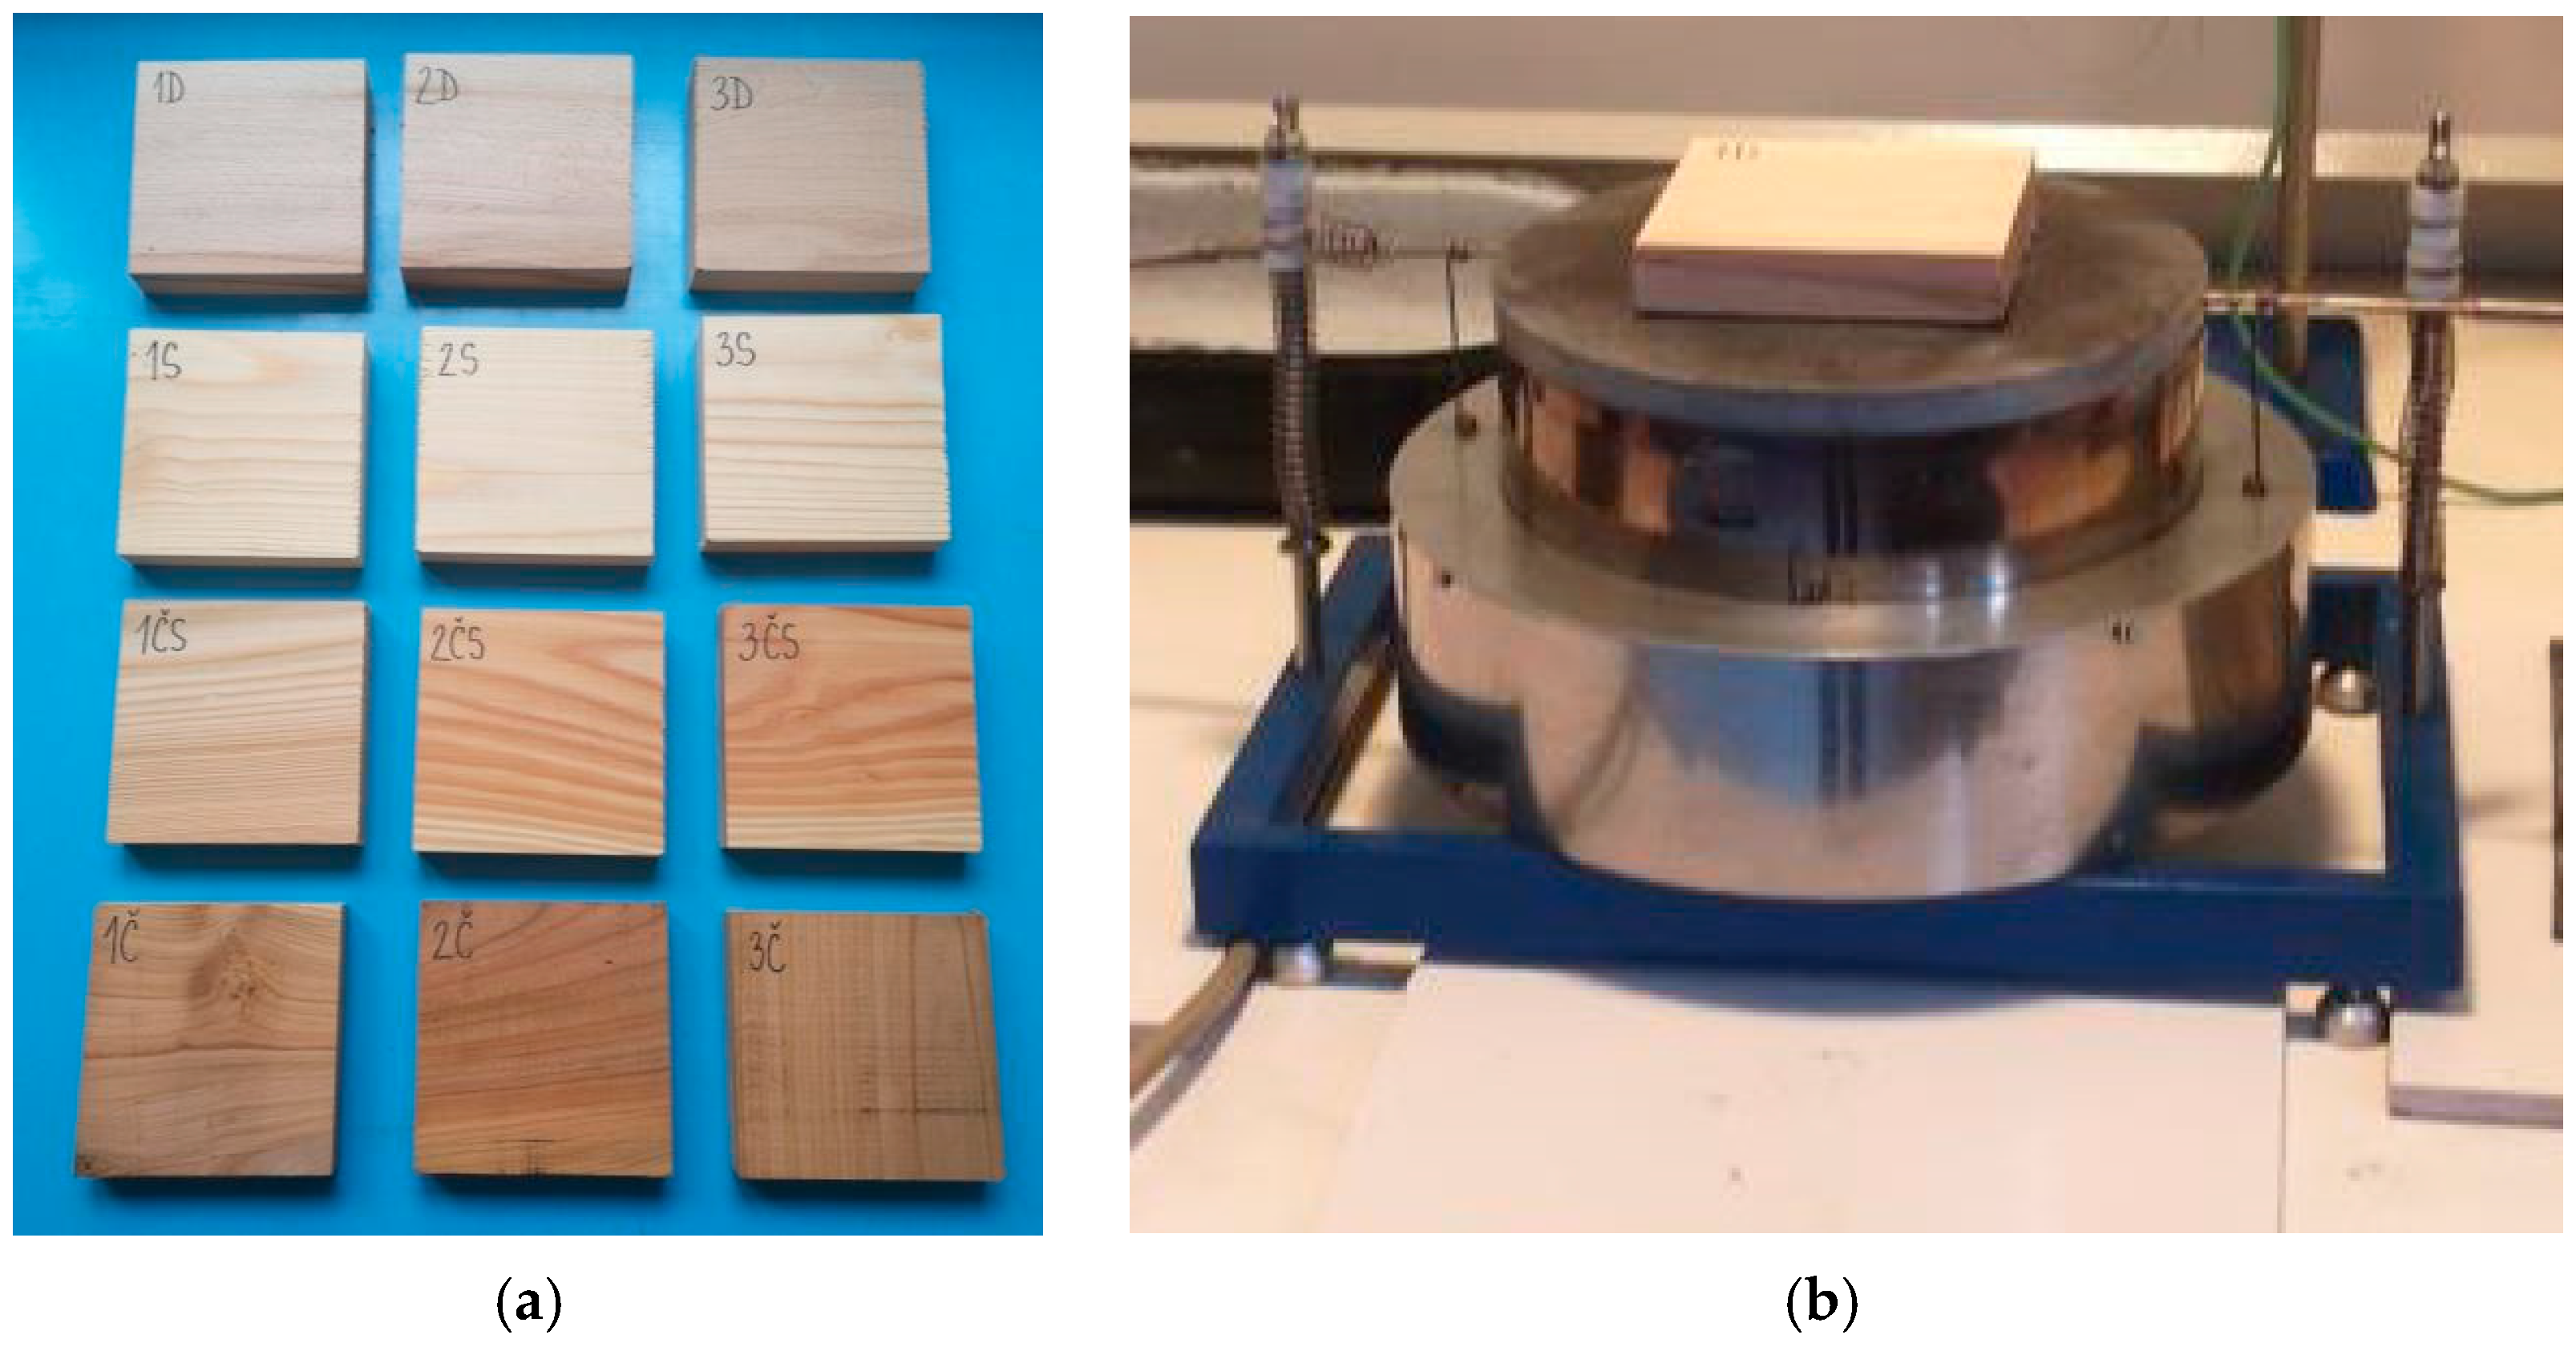
Figure 1. (a) Experimental samples of oak (1D, 2D, 3D); of spruce (1S, 2S, 3S); of red spruce (1CS, 2CS, 3CS) and cherry (1C, 2C, 3C) be front of experiment; (b) hot-plate device.
Applsci 15 02065 g001
Figure 2. Expression of exposure time and temperature development on the surface of the hot plate [55]. Legend: blue curve is from experimental values, red points curve is trend line from experimental values.
Applsci 15 02065 g002
Figure 3. Photo-documentation from spruce experiments. (a) The 1st picture shows the start of the smoking process for 291.2 °C and at 540 s, and the 2nd picture shows the charring layer. (b) The 1st picture presents the start of the smoking process for 228.2 °C and at 630 s; the 2nd picture presents the start of the smoking process for 351.6 °C at 1020 s; and the 3rd picture presents acrid cracks, smoking, and thermal degradation (for 410.4 °C and at 1155 s). (c) Pictures for 3S samples without charring layer.
Applsci 15 02065 g003
Figure 4. Temperature curve for spruce wood samples at different distances (1S, 2S, and 3S) from the radiant heat source.
Applsci 15 02065 g004
Figure 5. Photo-documentation of red spruce. (a) The 1st picture demonstrates slight smoldering (for 200 °C and at 495 s); the 2nd picture shows pronounced smoldering (for 247.7 °C and at 600 s); the 3rd shows charring of the bottom part of the sample (for 373.5 °C and at 900 s); the 4th picture depicts charring of the side part of the sample (for 431.9 °C and at 1095 s); and the 5th picture shows cracking, slight bending, and charring of the bottom and middle part of the sample (for 462.8 °C and 1200 s). (b) The 1st picture shows the onset of degradation development (for 252.5 °C and at 840 s); the 2nd picture depicts smoldering (for 283.7 °C and at 960 s); and the 3rd and 4th pictures present a burned circular area on the bottom part of the sample, as well as significant resin stains on the side part of the sample (for 360.3 °C and at 1200 s). (c) The 1st picture shows the sample 3CS before the experiment; the 2nd picture depicts the beginning of smoldering (for 23.18 °C and at 1035 s); the 3rd picture shows leaking resin on the sample sides (for 271.8 °C and at 1125 s); and the 4th picture depicts a weakly burned circle at the bottom part of the sample, as well as resin stains on the sample sides (for 291.6 °C and at 1200 s).
Applsci 15 02065 g005
Figure 6. Temperature curve for red spruce wood samples at different distances (1CS, 2CS, and 3CS) from the radiant heat source.
Applsci 15 02065 g006
Figure 7. Photo-documentation from cherry wood experiments. (a) The 1st picture shows slight smoldering (for 316.9 °C and at 345 s); the 2nd picture shows intense charring of side parts, and at the same time, the height of the charring reached half the height of the sample (for 397.5 °C and at 855 s); the 3rd picture shows significant smoldering, with the sample bending in the middle (for 414.5 °C and at 915s); and the 4th picture depicts sample cracking, and charring of the lower and side parts of the sample (for 479.3 °C and at 1200 s). (b) The 1st picture shows the onset of thermal degradation (for 349.2 °C and at 975 s), the 2nd picture shows slight sample bending, and the 3rd picture demonstrates charring (for 404.3 °C and at 1200 s). (c) Sample 3C: Occurrence of slight and insignificant scorching of the bottom sample part, without charring of the side parts (for 350.7 °C and at 1200 s).
Applsci 15 02065 g007
Figure 8. Temperature curve for cherry wood samples at different distances (1C, 2C and 3C) from the radiant heat source.
Applsci 15 02065 g008
Figure 9. Photo-documentation from oak experiments. (a) The 1st picture shows smoldering (for 273.1 °C and at 525 s), the 2nd picture shows significant smoldering (for 299.8 °C and at 585 s), the 3rd depicts charring of the side sample parts (for 353.9 °C and at 720 s), and the 4th picture shows slight sample bending (for 411.1 °C and at 900 s). (b) The 1st picture is the sample before the experiment; the 2nd picture shows smell development and a faint circular imprint on the bottom part (for 249 °C and at 780 s); and the 3rd picture presents slight sample bending, as well as charring of the bottom and side sample parts (for 401.8 °C and at 1200 s). (c) The 1st picture depicts sample 3D (for 90.5 °C and at 459 s); and the 2nd and 3rd pictures depict slight scorching on the bottom part of the sample, with negligible effects of radiant heat on the surface of the sample (for 285.7 °C and at 1200 s).
Applsci 15 02065 g009
Figure 10. Temperature curve for oak wood samples at different distances (1D, 2D, and 3D) from the radiant heat source.
Applsci 15 02065 g010
Figure 11. Mutual comparison of temperature curves for wood samples from the radiant heat source: (a) at distance 0 mm (1S, 1CS, 1C, and 1D); (b) at distance 12 mm (2S, 2CS, 2C, and 2D); and (c) at distance 32 mm (3S, 3CS, 3C, and 3D).
Applsci 15 02065 g011aApplsci 15 02065 g011b
Figure 12. Mutual comparison of mass loss wood samples from the various distances of radiant heat source. Legend: dark blue is spruce, light blue is red spruce, red is cherry, and green is oak.
Applsci 15 02065 g012
Figure 13. Mutual comparison of maximal temperature in wood samples from the various distances of radiant heat source. Legend: dark blue is spruce, light blue is red spruce, red is cherry, and green is oak.
Applsci 15 02065 g013
Figure 14. Mutual comparison of experimental parameters: mass loss (a), maximal temperatures (b), and charring layers (c), with sample densities of wood samples from the various distance of radiant heat source.
Applsci 15 02065 g014
Table 1. Basic parameters of experimental wood samples.
ParametersSoft WoodHard Wood
Spruce Red SpruceCherryOak
Mass (g)84.19 ± 3.22130.05 ± 1.81121.11 ± 7.24131.37 ± 3.17
Moisture (%)6.64 ± 0.787.24 ± 0.557.10 ± 2.177.51 ± 0.69
Density (kg·m−3)421 ± 15.89650 ± 8.64605.67 ± 30.93656.67 ± 15.32
Table 2. Designation of the experimental wood samples.
Distance Sample from InitiatorSpruce Red SpruceCherryOak
0 mm (contact with hot-plate surface)1S1CS1C1D
12 mm2S2CS2C2D
32 mm3S3CS3C3D
Table 3. Visual comparison of the samples and the height of the charred layer in the samples after the experiment (mm).
Distance from InitiatorHeight of the Charred Layer (mm)
SpruceRed SpruceCherryOak
0 mmApplsci 15 02065 i001
12
Applsci 15 02065 i002
10
Applsci 15 02065 i003
12
Applsci 15 02065 i004
8
12 mmApplsci 15 02065 i005
5
Applsci 15 02065 i006
6
Applsci 15 02065 i007
2
Applsci 15 02065 i008
1
32 mmApplsci 15 02065 i009
2
Applsci 15 02065 i010
0
Applsci 15 02065 i011
0
Applsci 15 02065 i012
0
Disclaimer/Publisher’s Note: The statements, opinions and data contained in all publications are solely those of the individual author(s) and contributor(s) and not of MDPI and/or the editor(s). MDPI and/or the editor(s) disclaim responsibility for any injury to people or property resulting from any ideas, methods, instructions or products referred to in the content.