Article

Using Neutrosophic Cognitive Maps to Support Group Decisions About Modeling and Analyzing Smart Port Performance

Information Systems and eBusiness (ISEB) Laboratory, Department of Applied Informatics, School of Information Sciences, University of Macedonia, 54636 Thessaloniki, Greece
*
Author to whom correspondence should be addressed.
Appl. Sci. 2025, 15(4), 1981; https://doi.org/10.3390/app15041981
Submission received: 14 January 2025 / Revised: 7 February 2025 / Accepted: 9 February 2025 / Published: 13 February 2025
(This article belongs to the Special Issue Intelligent Logistics and Supply Chain Systems)

Abstract

:
Contemporary ports are facing a variety of challenges due to technological advancements, economic pressures, and changing policies. Key issues include the effects of globalization, rapid advancements in information and communication technologies (ICTs), and the changing nature of port services. In order to tackle these challenges and achieve operational excellence, adapt to the shifting of activities, and meet new business demands, smart ports have been proposed as a comprehensive solution. These challenges arise because port success is often measured by traditional metrics such as port size and performance. To accurately assess the intelligence of a port, there is a need for a systematic and scientifically sound smart port evaluation method. This paper provides an overview of the concept of a smart port and develops a multi-criteria assessment framework of port smartness based on neutrosophic cognitive maps (NCMs). The unique and valuable characteristic of NCMs lies in their ability to manage the uncertainty associated with the relationship between two concepts, indicating their effects on each other in neutral states. This structure enables the NCM to provide results with a greater degree of sensitivity than fuzzy cognitive maps (FCMs) and allows for a greater degree of freedom of intuition for an expert to express not only the potential impacts but also the uncertainty associated with those impacts. Our methodology can make decisions using incomplete, uncertain, and inconsistent data during the assessment process, providing a rigorous quantitative framework for the assessment of port “smartness”. The proposed solution has the potential to act as a valuable tool in a group decision support environment and can be used to accelerate an organization’s development, improve productivity, and reinforce efforts to achieve strategic and sustainability objectives. To achieve this, an appropriate framework for such a methodology is demonstrated through an illustrative example offering actionable insights for improving port operations.

1. Introduction

The concept of smart ports was introduced as a solution to various port challenges, including achieving operational excellence, relocating activities, and meeting new business requirements. Smart ports utilize modern technology to transform traditional port services into interactive and dynamic systems, aiming to enhance efficiency and transparency. Key features of smart ports include supply chain integration and the automation of port operations and equipment. These features of integration and automation help improve the port’s overall competitiveness [1]. Smart ports use data analytics and Internet of Things (IoT) technology to enable real-time decision-making and predictive maintenance of infrastructure. These innovations assist in reducing operational risks and downtime [2]. The use of green and sustainable technologies, such as renewable energy systems and pollution monitoring, guarantees that smart ports meet worldwide environmental requirements, rendering them resilient and socially responsible [3]. Additionally, smart ports save time and money in terms of document management and human resources, while also improving monitoring, traffic management, congestion reduction, and productivity. This results in added value and customer satisfaction [4]. Recent research has highlighted the role of digital transformation in maritime logistics, especially in relation to sustainability and artificial intelligence-driven decision-making [5]. Furthermore, deep learning approaches have been explored as a means of improving maritime surveillance and operational efficiency [6]. These advancements align with the growing focus on smart port technology and underscore the need for advanced decision-making frameworks like NCMs to manage the intricate interconnections within port operations.
For port authorities and industry stakeholders, assessing smart port performance is crucial for making strategic decisions about infrastructure expenditure, regulatory regulations, and operational changes. A thorough performance review enables stakeholders to uncover inefficiencies, optimize resource allocation, and improve service quality, ensuring competitiveness in the increasingly digitalized and automated marine industry. Performance indicators not only assist in comparing against global standards but also in ensuring regulatory compliance, sustainability goals, and economic efficiency.
Despite the advances made, current research on smart port performance evaluation has several shortcomings. One fundamental limitation is the absence of a systematic and scientifically rigorous methodology for accurately assessing a port’s level of intelligence while considering dynamic interdependence and uncertainty [7]. Traditional evaluation models often rely on predetermined criteria and struggle to incorporate changing data sources and real-time updates [8]. Additionally, they do not simultaneously consider degrees of truth, falsehood, and indeterminacy, which are essential for modeling complex and dynamic scenarios.
Conducting an effective performance evaluation is very helpful for realizing the potential of smart ports. Performance measurement provides a systematic approach for determining how well a smart port achieves its operational, economic, and environmental objectives. The growing interest in performance measurement has resulted in the development of various frameworks that organizations use to identify the metrics they should use to evaluate their performance [9,10,11].
Researchers have conducted extensive studies to optimize ports and establish a model for smart ports. These studies involve optimizing logistics and supply chains, enhancing port services, reducing environmental impact, and minimizing equipment usage [12,13,14,15,16]. However, researchers in a study by [17] suggest that the decision-making process is complex and challenging to quantitatively model, due to limited numerical data, the unstructured nature of the problem, and reliance on verbal communication.
According to [18], a model based on stakeholder knowledge and perceptions could be useful for addressing various challenges, especially those involving stakeholder opinions. Many studies have utilized multi-criteria decision-making methods such as AHP, ANP, TOPSIS, ELECTRE, and SWOT analysis [19,20,21]. However, these decision-making models often overlook the interconnectedness of various smart port strategies, such as operational, financial, technical, socio-environmental, and security strategies. They mainly focus on comparing strategies based on individual criteria. For example, AHP and TOPSIS provide structured methodologies for ranking alternatives based on predefined criteria, but they lack the ability to model causal relationships and dynamic feedback loops between factors, limiting their applicability in complex, evolving environments like smart ports. Additionally, AHP breaks down complex problems into hierarchical components but suffers from subjectivity in expert judgments and lacks the ability to model dynamic interactions between the criteria [22]. TOPSIS ranks alternatives based on their proximity to an ideal solution but assumes that criteria weights remain constant over time, limiting its adaptability in dynamic port environments [22]. Lastly, ELECTRE is effective in handling conflicting criteria but struggles with computational complexity and a lack of clear interpretability in results [23].
To overcome these limitations, especially the last one, there is a growing emphasis on collaborative decision-making frameworks that integrate diverse stakeholder perspectives. Effective decision-making in a smart port environment requires input from various stakeholders, including port authorities, logistics companies, environmental regulators, and technology suppliers. Recent research emphasizes the need for collaborative frameworks capable of collecting and reconciling diverse expert perspectives critical for strategic alignment and long-term success in smart port operations [24]. Historically, managerial choices were mainly based on subjective judgments and human competence to address diverse issues. However, in actual project circumstances, human experience often contains inherent uncertainties and ambiguity necessitating systematic approaches that leverage stakeholder input for strategic alignment and sustainable outcomes.
Fuzzy cognitive maps (FCMs) have been utilized to describe and model the behavior of a system in decision analysis and operational research. They serve as a symbolic representation for the description and modeling of a complex system. In this context, the scholars in [25] propose a framework that uses FCMs to model and analyze business performance metrics from both an internal and external organizational perspective, while acknowledging the strategic potential of information technology (IT). Business metrics are crucial as they offer insights into business performance and suggest IT solutions to enhance operations. For instance, by measuring key performance indicators (KPIs) such as revenue, profitability, customer satisfaction, and operational efficiency, companies can pinpoint areas for improvement. They can also leverage IT solutions to improve operations, optimize resource allocation, and overall performance. Furthermore, metrics play a vital role in risk management, customer experience management, and driving continuous improvement projects, all of which contribute to the organization’s long-term performance and competitiveness in a dynamic business environment.
While FCMs have been widely used for modeling complex systems, they have significant limitations. One key disadvantage is their reliance on expert knowledge without accurately measuring the degree of influence across factors, which can result in biases and inconsistencies in decision-making [26]. Furthermore, FCMs struggle to capture dynamic interactions over time, limiting their ability to provide long-term strategic insights [27]. Additionally, their structure lacks the capacity to incorporate changing data sources and real-time updates [28], making them ineffective in highly dynamic contexts such as smart ports.
By utilizing neutrosophic cognitive maps (NCMs), this study introduces a methodological framework capable of handling the uncertainty and complexity inherent in smart port performance evaluations [29]. They combine FCMs and neutrosophic sets, providing a more comprehensive and flexible approach to modeling complex systems. “Indeterminacy” is a fundamental factor in real-life situations, as demonstrated by previous research [30,31]. This inherent indeterminacy creates obstacles for decision-makers as it renders outcomes uncertain and difficult to forecast with certainty. In this context, NCMs have been successfully applied in various research disciplines, such as analyzing criminal behavior, traffic congestion, organic farming, and healthcare (e.g., regarding COVID-19) [32,33,34,35]. Interested readers are referred to [36] which offers a comprehensive literature review of previous studies that have utilized NCMs, highlighting the diverse purposes and application areas in which they have been employed.
By utilizing NCMs, our framework enables a more comprehensive examination of multiple variables and their interactions, ultimately enhancing decision-making processes in smart port management. While NCMs have been applied in fields such as healthcare and environmental management, their potential in evaluating smart port performance remains largely unexplored. This study aims to fill that gap by introducing an NCM framework for assessing smart port metrics in a collaborative decision-making setting, tackling the sector’s unique challenges of unpredictability and interdependency.
Our methodology introduces a new computational modeling tool to navigate the intricate dynamics of smart port metrics. NCMs effectively manage the complexity and uncertainty of port operations through neutrosophic logic, providing a more realistic representation of causal relationships. This approach is highly adaptable, allowing for the integration of diverse stakeholder perspectives and inputs. By encouraging active participation and facilitating the exploration of various scenarios, our strategy empowers decision-makers to develop a deeper understanding of the factors influencing smart port performance.

1.1. Contributions of Article

  • In this paper, we propose a novel framework that utilizes NCMs to understand how business strategies and objectives interact with each other and determine which nodes are most impactful. To the best of our knowledge, it is the first time in related literature that a soft computing method such as NCMs has been used to evaluate smart port performance.
  • The combination of static and dynamic analysis allows decision-makers to predict possible obstacles and facilitates what-if scenarios, thus prioritizing development areas with more confidence. In this way, stakeholders gain insights into the immediate impacts (static analysis) and evolving outcomes (dynamic analysis) of strategies (e.g., operational, financial, environmental). This dual approach not only solves current gaps in performance evaluation approaches but also delivers actionable insights for long-term competitiveness and innovation in the marine sector.
  • In contrast to relying exclusively on FCMs, our model utilizes NCMs due to the increased capabilities of neutrosophic theory in efficiently handling the inherent uncertainty associated with expert judgments. By using neutrosophic logic, our suggested model offers a comprehensive approach for navigating the intricacies of smart port management, ensuring that the analysis accurately represents the various and sometimes contradictory viewpoints of stakeholders.
  • To validate the usefulness, reliability, and objectivity of the proposed method, an illustrative example of smart port performance evaluation under group decision support environment is introduced. This example serves as a proof-of-concept to demonstrate the practicality of the suggested method. The findings show that NCMs may successfully model complex interrelationships between performance factors, giving useful insights for decision-making in real-world smart port management. This enhanced framework, which can increase the reliability of an NCM by incorporating the opinions of more than one domain experts, has the potential to reform decision-making processes in the smart port management field, offering stakeholders a stronger and more informed basis for strategic planning and operational optimization.
  • Unlike traditional MCDM models, which often overlook the numerous linkages between strategies, our work introduces a new method that delves deeper into understanding these interrelationships. Traditional MCDM models typically evaluate factors affecting port performance using set criteria, but our proposed technique conducts a more in-depth analysis by considering the dynamic interactions between strategies. By adopting this innovative approach, we aim to illuminate the subtle interactions and dependencies between the various techniques, offering valuable insights into their overall impact on port performance.

1.2. Structure of Article

The current paper is divided as follows: Section 2 summarizes the basic concepts needed to keep our article self-contained and provides a synopsis of our conceptual framework. Section 3 introduces the methodological framework, detailing the integration of NCMs for evaluating smart port performance. Section 4 presents the application of an NCM method in the solution of the case of smart port performance, determining KPIs proposed in literature—e.g., [37]—as an illustrative example. It should be noted that we examine the problem with two distinct methods: NCMs can be used for static and dynamic analysis, thus providing a comprehensive approach for policy analyses and decision support. Furthermore, we conduct a comparative analysis with well-established fuzzy based methods within the context of evaluating smart port performance in order to prove the robustness of the proposed method. Finally, conclusions are drawn and an outline of future research work on the application of NCMs is proposed (Section 5).

2. Materials and Methods

In this section, we briefly review the general definitions and methodological aspects used in this article to provide the reader with the fundamental principles underlying our approach. At the end of the section, we discuss our proposed conceptual framework for smart port performance. An NCM can be employed for a domain-wide static analysis to determine (1) the relative significance of concepts, as well as (2) the indirect and ultimate causal relationships between concept nodes, as argued in [38]. Dynamic analysis, on the other hand, focuses on the development over time of a simulated system and its components.

2.1. Basic Definitions

Definition 1
([39]). A digraph consists of two types of elements: vertices and arcs. Each arc connects two vertices in a certain direction.
For example, the digraph below (Figure 1) contains three vertices {a, b, c} and three arcs {1, 2, 3}. Arcs 1 and 2 connect vertices a and b, while arc 3 connects vertices c and a.
Definition 2
([39]). Let D be a digraph with n vertices (1, 2, 3, etc.). The adjacency or connection matrix A(D) of D is an   n × n   matrix with entries in row i and column j representing the number of arcs from vertex i to vertex j.
For example, given the digraph shown above in Figure 1 with three labelled vertices, we obtain the following matrix with three rows and three columns. The numbers appearing in the matrix refer to the number of arcs joining the corresponding vertices in the digraph (Figure 2).
Definition 3
([29]). In neutrosophic logic, each logical variable x is described by an ordered triple   x = ( T ,   I ,   F ) , where T is the degree of truth, F is the degree of falsehood, and I is the level of indeterminacy.
Definition 4
([29]). A neutrosophic graph is one in which at least one edge is an indeterminacy, indicated by dotted lines.
For example, the following are neutrosophic graphs (Figure 3):
Definition 5
([29]). A neutrosophic directed graph extends a neutrosophic graph by ensuring that at least one edge is not only indeterminate but also directed, meaning it captures both uncertainty and a directional relationship between nodes.
Definition 6
([29]). An NCM is a neutrosophic directed graph with nodes representing policies, occurrences, and so on, and edges representing causalities or indeterminates. It expresses the causal link between ideas.
Let C i and C j represent the two nodes of the NCM. The directed edge from C i to C j represents the causation of C i on C j , also known as the link. Each edge in the NCM is weighted with a number from the set {−1, 0, 1, I}. Let e i j represent the weight of the directed edge   C i C j , where e i j ∈ {−1, 0, 1, I}. If C i has no influence on C j , then e i j = 0, (ii) e i j = 1 if an increase (or decrease) in C i produces an increase (or decrease) in C j ; (iii) e i j = −1 if an increase (or decrease) in C i causes a decrease (or increase) in C j ; and (iv) e i j = I if the relationship or impact of C i on C j is unclear [29].
Definition 7
([29]). Let G denote a neutrosophic graph. The adjacency matrix of G with entries from the set (I, 0, 1) is known as the graph’s neutrosophic adjacency matrix (Figure 4).
Definition 8
([29]). (Synthesizing of different NCMs). A finite number of NCMs can be combined together to produce the joint effect of all NCMs. If N(E1), N(E2),…, N(Ep) be the neutrosophic adjacency matrices of an NCM with nodes C1, C2,., Cn then the combined NCM is obtained by adding all the neutrosophic adjacency matrices N(E1),., N(Ep). We denote the combined NCMs adjacency neutrosophic matrix by the following
N(E) = N(E1) + N(E2) + … + N(Ep)

2.2. Analyzing NCMs for Decision Support

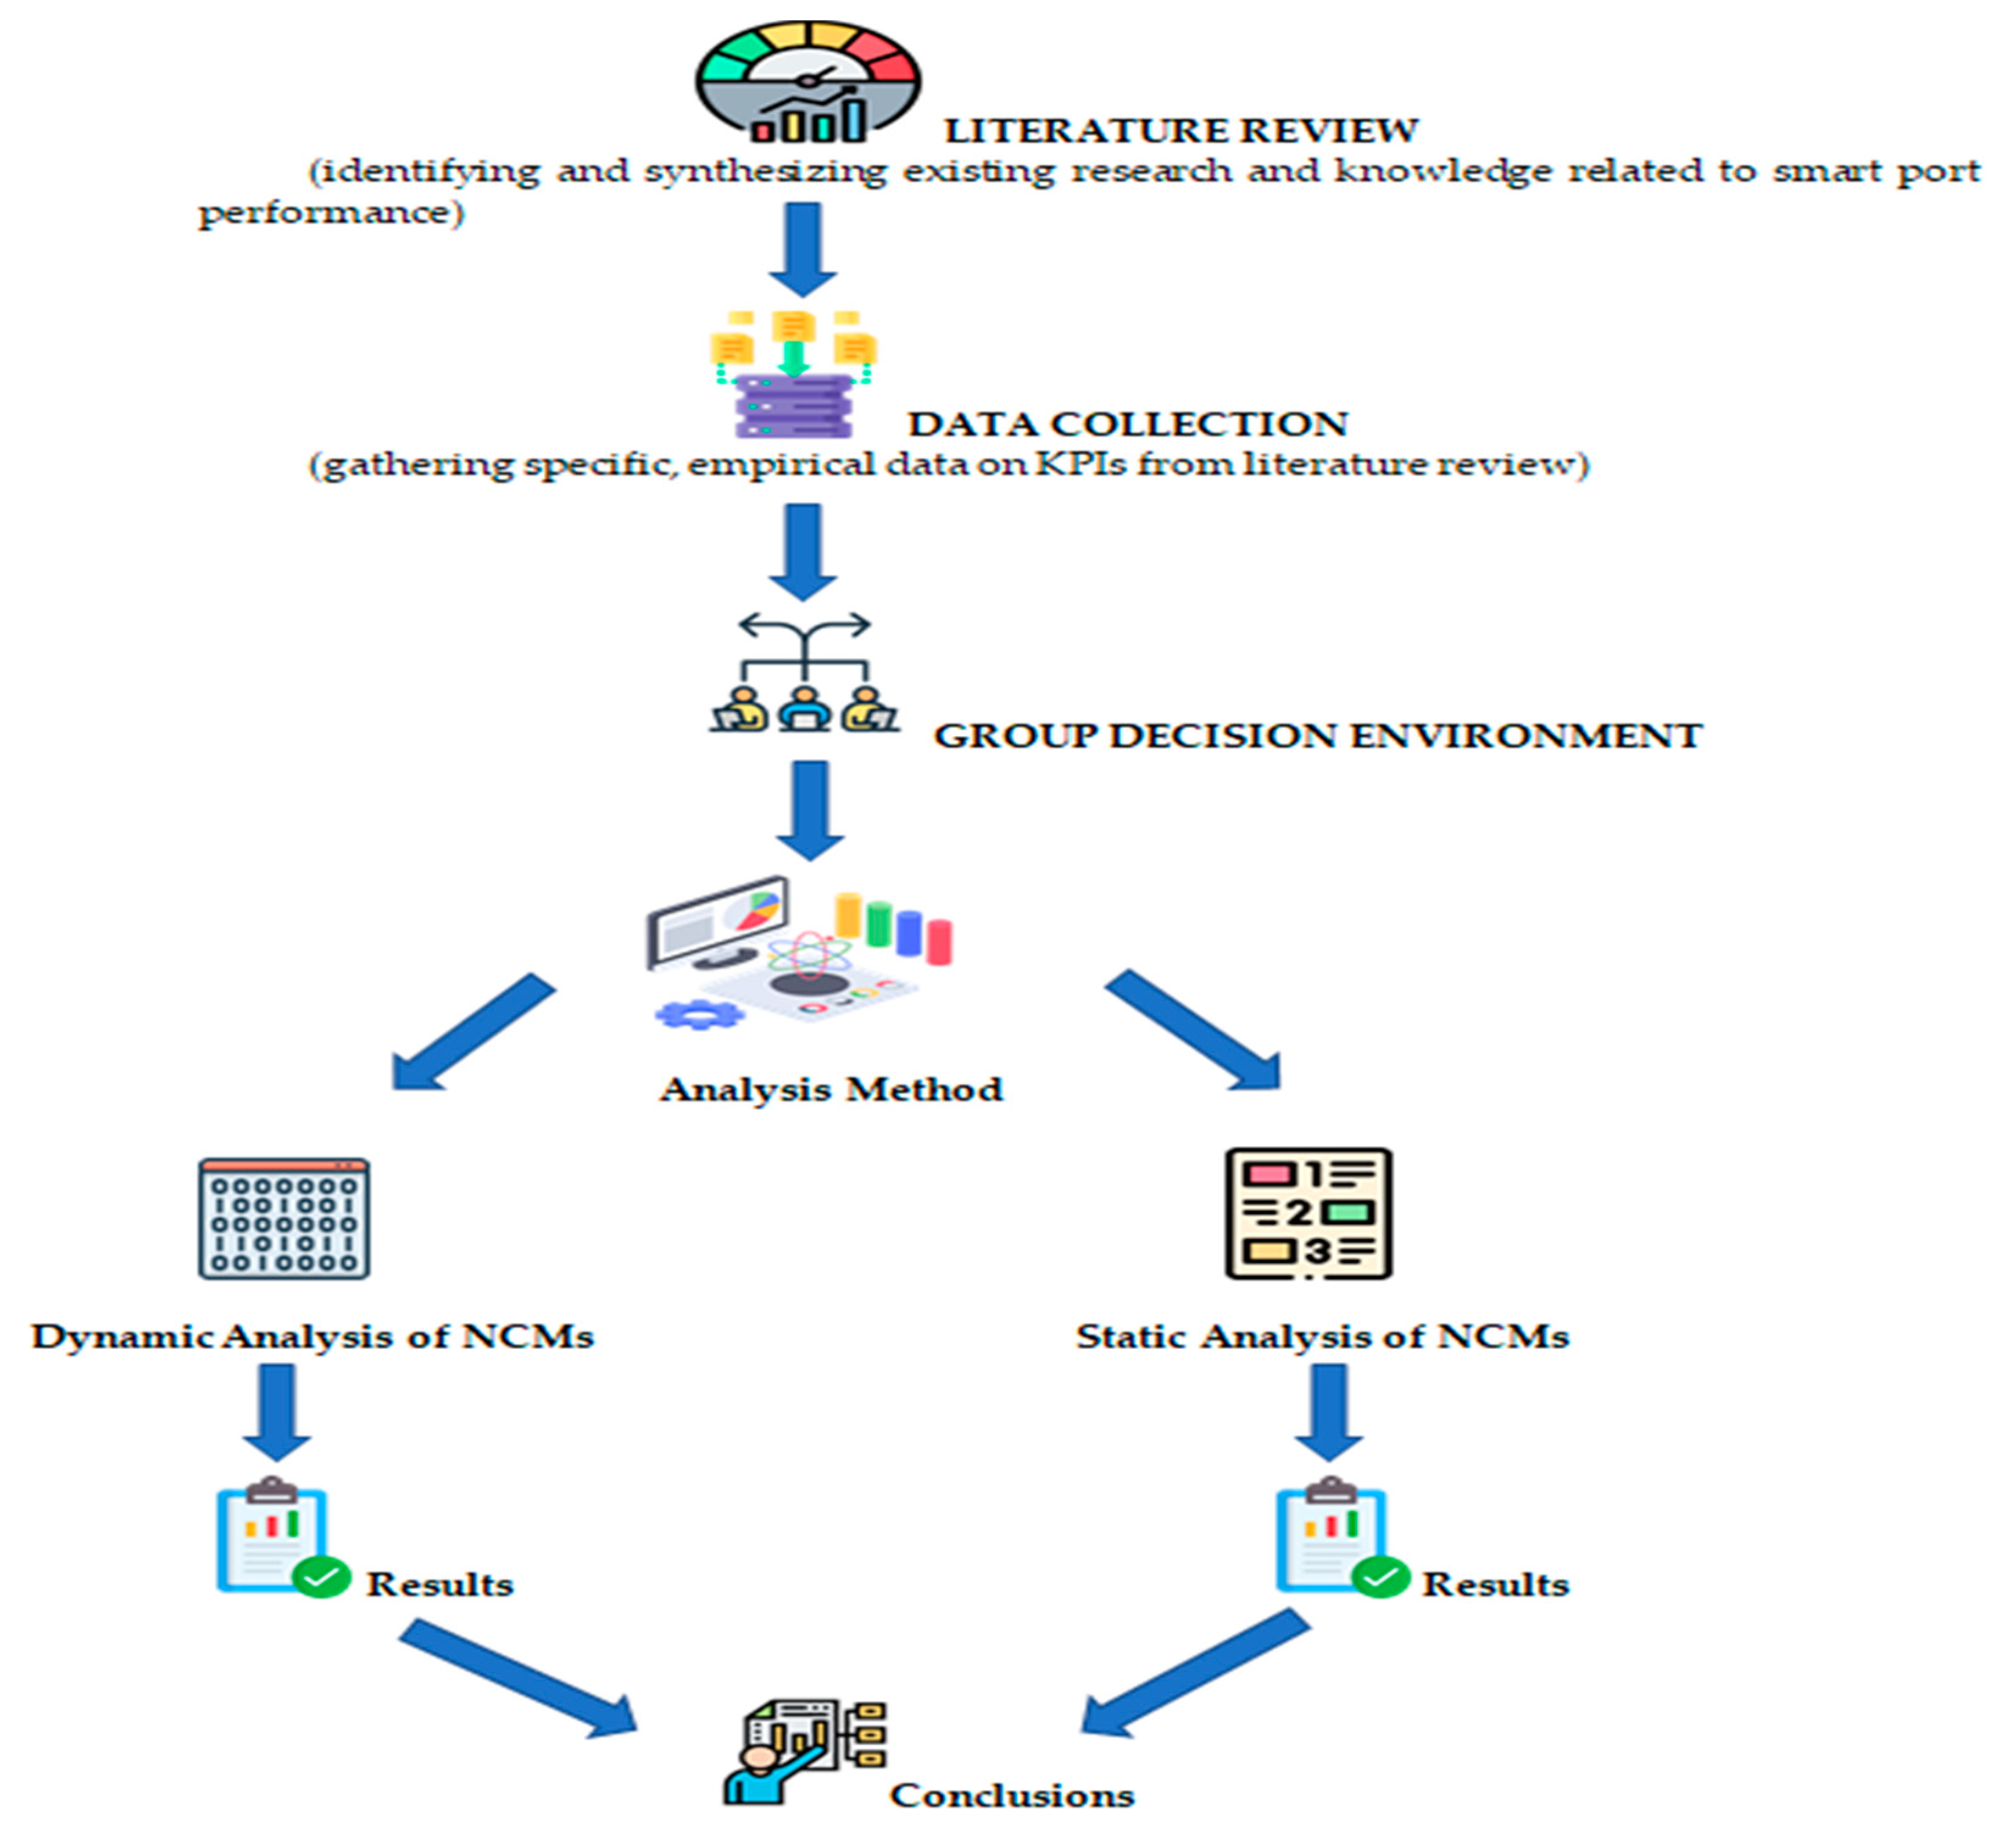
2.2.1. Static Analysis of NCMs

The static analysis of an NCM includes some features that can give us important information about the map model. According to [40], centrality is a measure of the importance of nodes in an FCM. Centrality shows how much the node is linked to other nodes and what the cumulative strength of these links is. The centrality of a node ( C j ) in an NCM is the sum of (the number of nodes that directly or indirectly cause C j ) and the number of nodes that cause or induce C j . These numbers are calculated from the number of nodes on the pathways that flow into (and out) of C j . The number and strength of nodes in an FCM are as follows.
Concept centrality ( C i ) = IN( C i ) + OUT( C i ), where IN( C i ) is the total of weights of causal connections comprising all pathways linking nodes C j , ij, to Ci and OUT( C i ) is the sum of weights of causal links constituting all paths connecting node C i to all nodes C j , ij.
Absolute values are used in summing causal weights to give the same weight to positive and negative causes. Concepts with a high centrality value deserve special consideration in any analysis to support decision-making.
The suggested framework employs the measurements mentioned above, which are based on the absolute values of the neutrosophic adjacency matrix [41]:
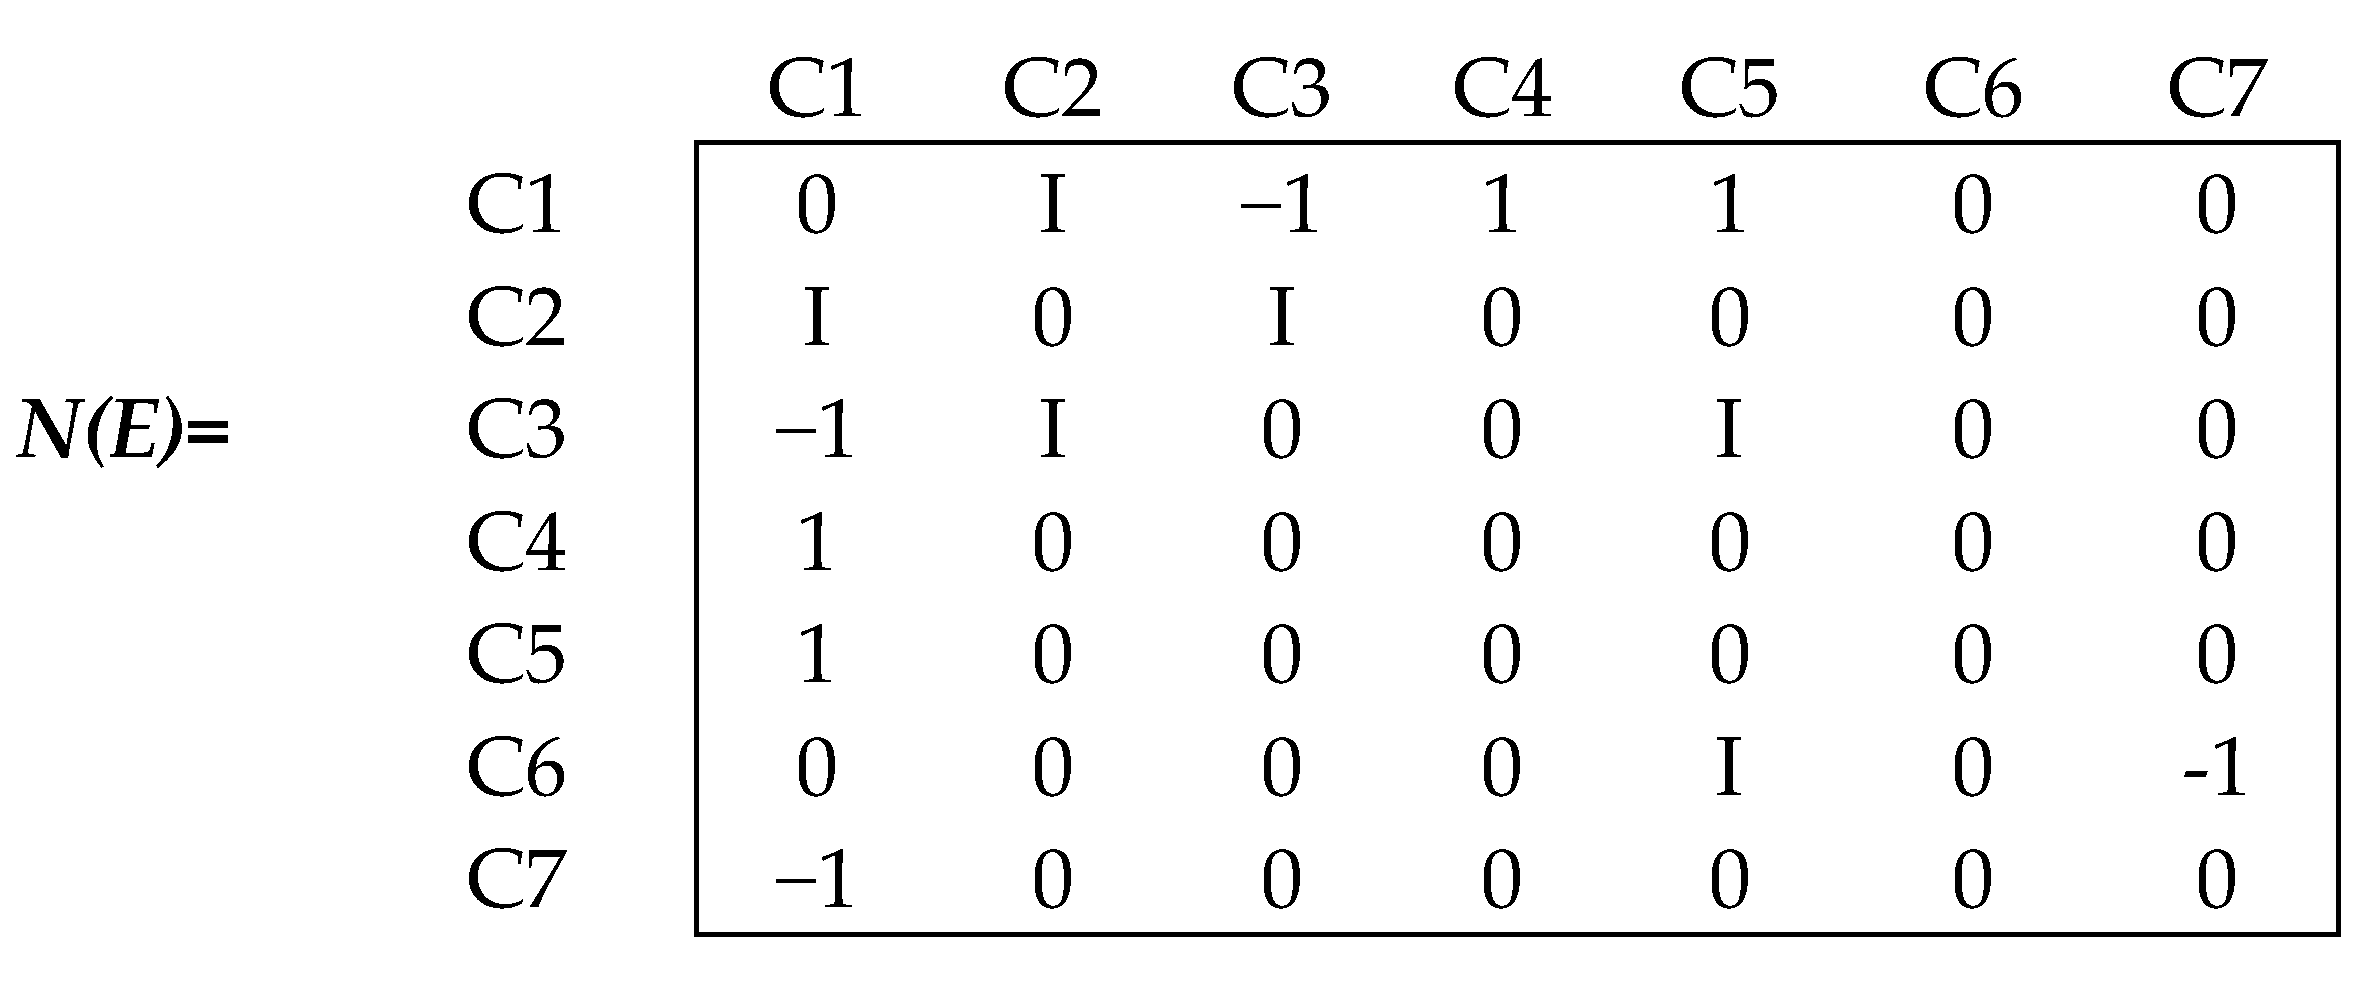
  • Outdegree is the sum of the row elements in the neutrosophic adjacency matrix and represents the strength of the variable’s outward connections ( c i j ). It actually indicates the cumulative strengths of connections (Cij). It is a measure of how much a given variable influences other variables.
o d ( v i ) = i = 1 n c i j
  • Indegree is the sum of the column components in the neutrosophic adjacency matrix, and it represents the strength of the connections ( c i j ) that stem from the variable and shows the cumulative strength of variables entering the unit.
i d ( v i ) = i = 1 n c j i
  • Total centrality is calculated by summing the variable’s indegree and outdegree.
t d ( v i ) = i d ( v i ) + o d ( v i )
The adjacency matrix is used for static analysis, with the weights’ absolute values taken into account [42]. Static analysis in NCMs includes the neutrosophic number (a + bI, where I represents indetermination) [43]. Then, it applies a procedure known as de-neutrophication, in which I ∈ [0, 1] is replaced by their lowest and maximum values [44].
Finally, we will require the following equations to deal with the average of the extreme values that are beneficial in our research to generate a single result, as described in [44]. This number is used to select which parameters will be included in our case study.
λ [ ( a 1 ,   a 2 ] ) = a 1 + a 2 2  
Then,
A > B  ⇔  a 1 + a 2 2 > b 1 + b 2 2

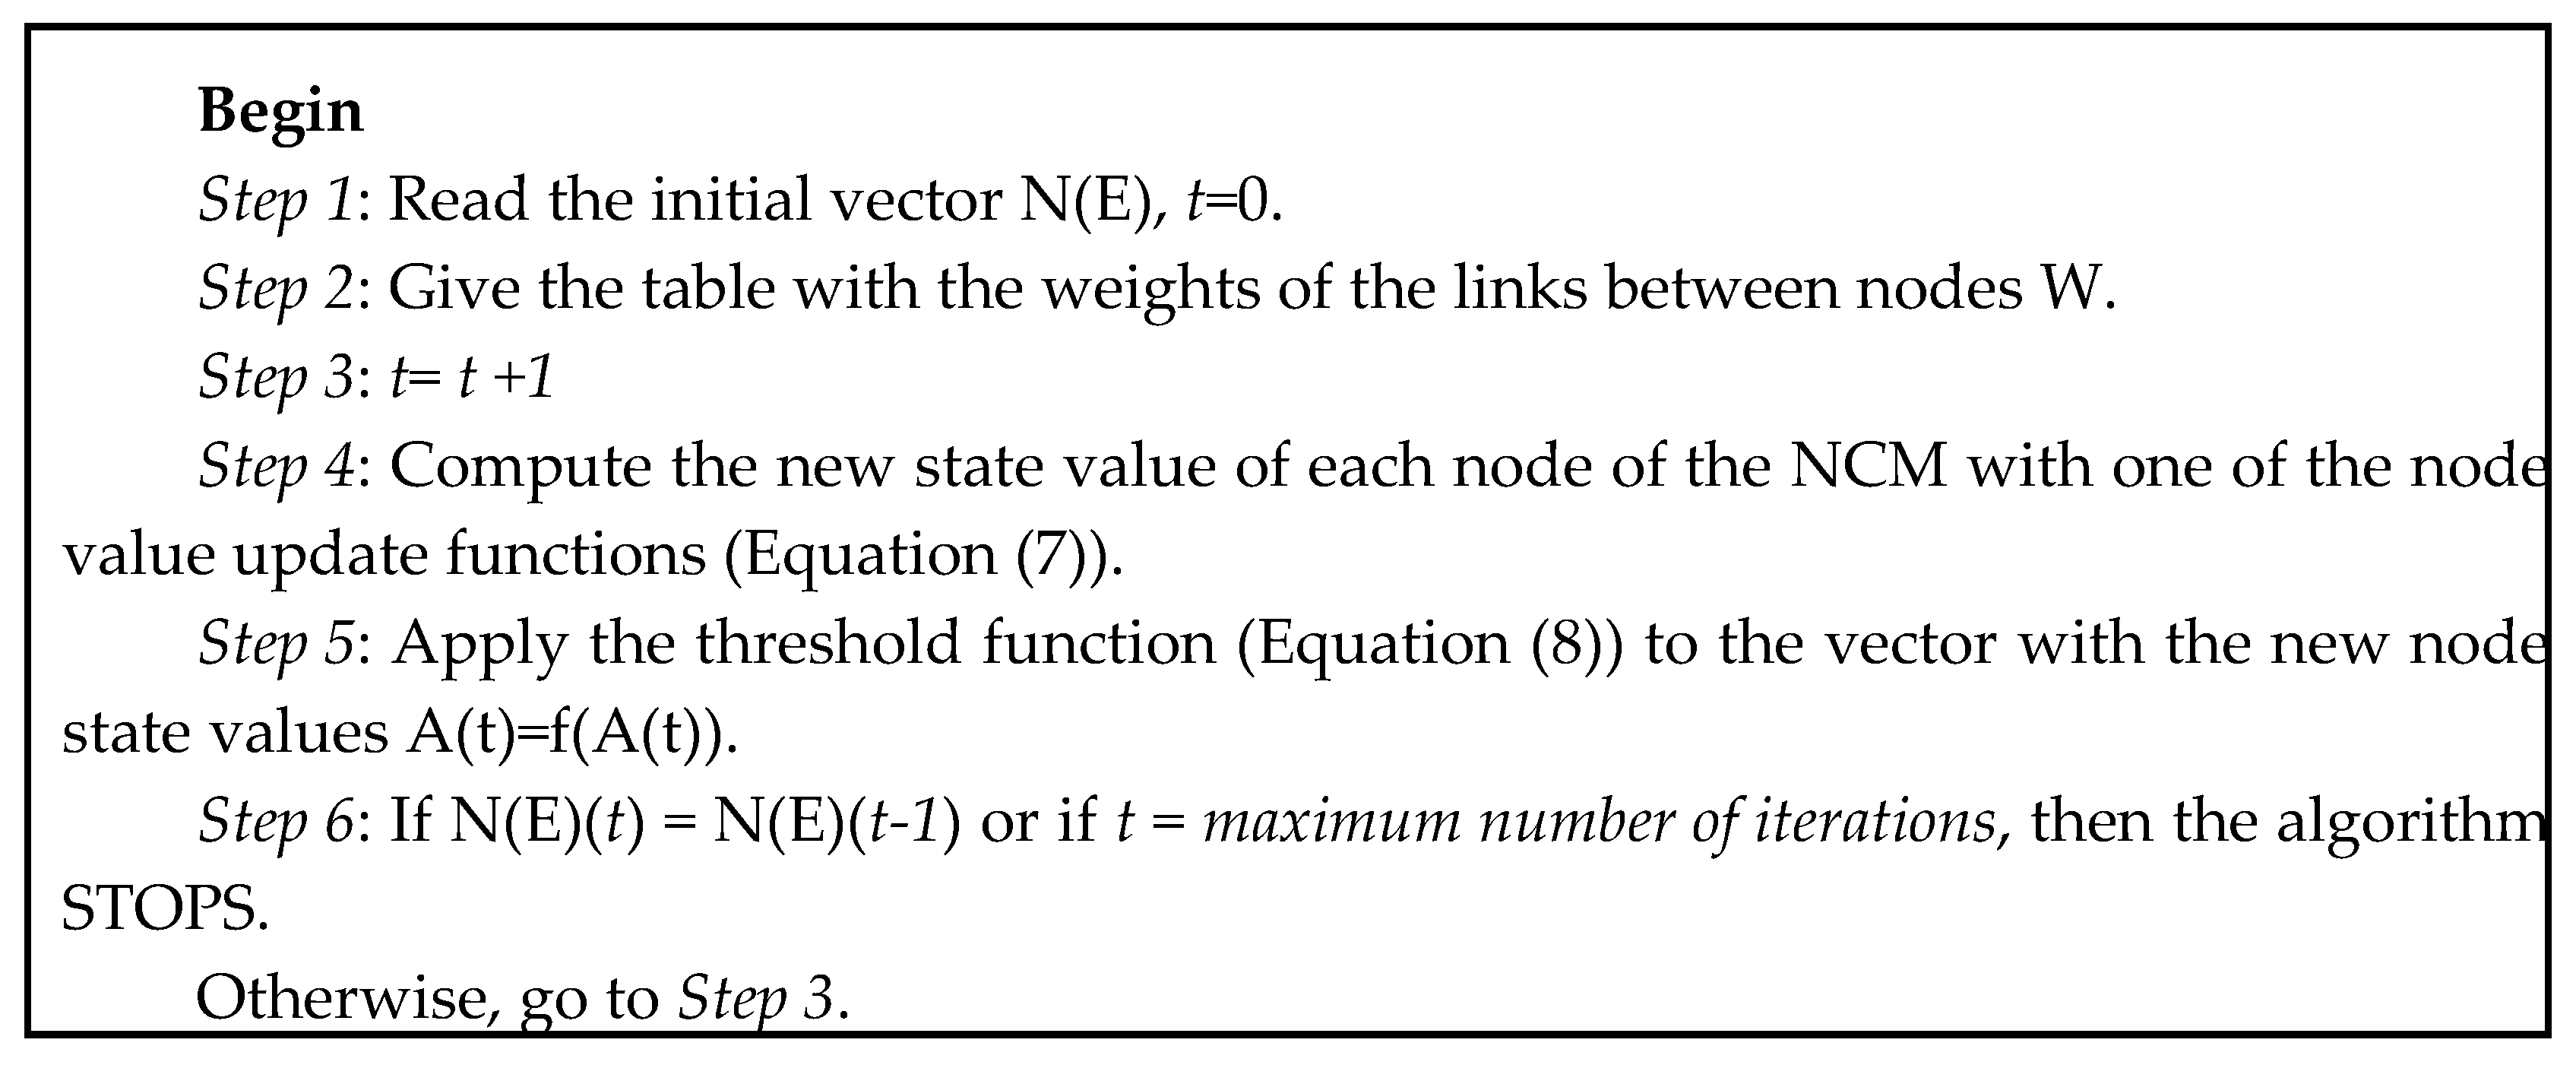
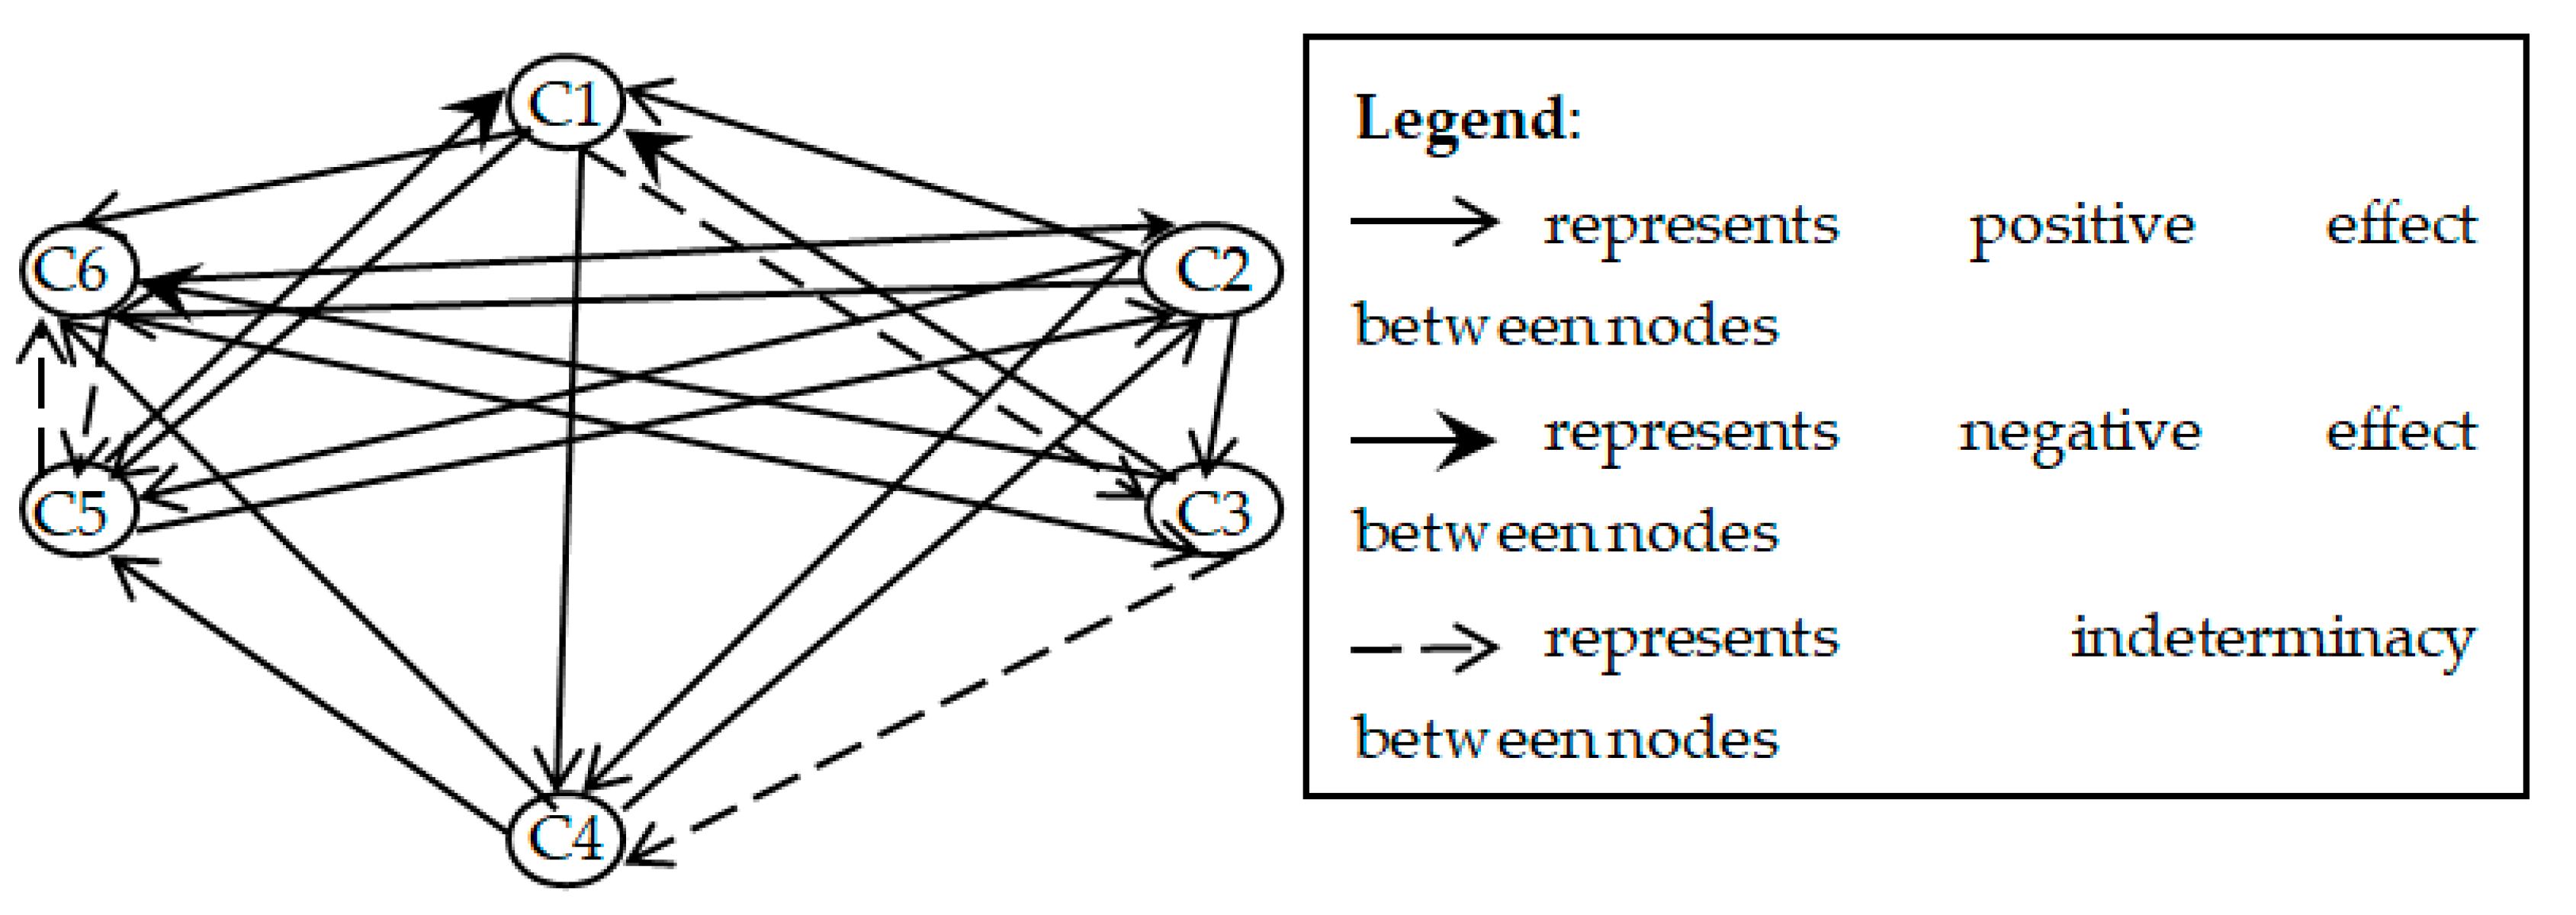
2.2.2. Dynamic Analysis of NCMs

Neutrosophic cognitive representations are a valuable tool for both decision-making and for predicting future situations. With the dynamic analysis of an NCM (Figure 5), we can see the effects and changes brought about by the interactions of the nodes of a system at each step of the process. A dynamic study of an NCM can be used to monitor and evaluate the impact of changes within the decision domain over time. By using the connection matrix and an initial state vector, which represents the input stimulus reflecting the initial conditions or activations of the system’s concepts, the resulting state can reveal critical insights into the potential consequences of any alterations made to the system represented by the NCM. These adjustments can be made, for example, by turning a certain notion “on” to answer a “what-if” inquiry.
The algorithm used by the NCM for dynamic analysis is as follows:
To better comprehend the dynamic analysis procedure, let us first discuss the structure and functioning of a basic NCM.
We recall that concept values C i take values in { 0,1 , I } ( I is the indeterminate state) and that causal edges take values in { 1 ,   0 ,   1 ,   I }. The values −1 and 1 indicate complete negative and full positive causality, respectively. Zero indicates no causal effects, I indicates indeterminate causality, and all other values correspond to different neutrosophic degrees. An NCM with   n concept nodes is characterized by an n × n connection matrix, E, which contains the causal link strengths (or weights).
The previously presented Figure 4 depicted a basic NCM with five concept nodes, while Figure 6 shows the connection or adjacency matrix E in the form of causal linkages between nodes.
The i t h row shows the connection strength of the edges e i k pointed away from the causal concept   C i . The j t h   column lists the edges e k i that lead into C i . We say that C i causes C k to grow if e i k > 0, to decrease if e i k < 0, to have no impact if e i k = 0, and to have an undetermined effect on   C k if e i k = I . In this way, we observe that the causal concept C 5 enhances concepts C 3 and C 4 , but has no effect on concept C 2 and an uncertain effect on concept C 1 .
Definition 9
([29]). Assume   C 1 ,   C 2 ,… n to be the NCM’s nodes. Let A = ( a 1 , a 2 ,… a n ) with   a i ∈ {0, 1, I}. A is known as the instantaneous state neutrosophic vector, and it represents the node’s on, off, or indeterminate state position at a given moment, i.e.,
  • a i = 0 if a i   is off (no effect)
  • a i = 1 if a i   is on (has effect)
  • a i = I if a i   is indeterminate (effect cannot be determined)
  • for i = 1, 2, …, n.
The state vector of an NCM at any time represents a snapshot of the concept values or events in the scenario being modelled. For example, in the NCM depicted in Figure 4, node C 2 represents the second component of the state vector. The state [0 1 0 0 0 0] signifies that the notion or concept C 2 is active. This state vector may be used as an input value to monitor the impact on every concept over time. The new value for every concept is derived based on the present values of the concepts that impact it through causal relationships.
NCMs reach equilibrium when the dynamic system stabilizes. Basic inference criteria for NCMs involve matrix-vector multiplication, as outlined in [45,46]. The state vectors C n cycle through the NCM adjacency matrix E: C 1 → Ε → C 2 → Ε → C 3 …. The system nonlinearly transforms the weighted input to each node C i , as follows:
C i ( t n + 1 ) = f k = 1 N e k i t n C k ( t n )
The summation term k = 1 N e k i C k is known as the activation of the concept node. The nonlinear function, f, can be a simple thresholding operation with a threshold value T, where the output, Cj, is given by the following:
C j = O   i f   a c t i v a t i o n j   T 1   i f   a c t i v a t i o n j   T   I   i f   C j   i s   n o t   a n   i n t e g e r  
A thresholding function such as the one shown above results in binary concept values and is used in our study.
Definition 10
([29]). A fixed point is a dynamical system’s equilibrium state that is represented by a single state vector. Consider the NCM with   C 1 , C 2 C n   as its nodes. For example, let us start the dynamical system by turning on   C 1   . Assume the NCM settles with   C 1   and   C n   on, i.e., the state vector remains (1, 0,., 1); this neutrosophic state vector (1, 0,., 0, 1) is referred to as the fixed point.
Definition 11
([29]). If the NCM settles with a neutrosophic state vector repeating in the pattern   A 1 A 2 →. …→ A i A 1 , this equilibrium is termed the NCM limit cycle.
NCMs work in the following way. The activation values of the nodes represent different concepts in the problem domain. These activation values are set according to the current state of the problem domain. The value of each node depends on the information available about the concept that it represents.
The NCM nodes are then allowed to interact with one another. According to [47], this interaction lasts until one of the following:
  • The NCM stabilizes to a stable state (the fixed-point attractor), with certain ideas “on” and others not.
  • The NCM repeatedly cycles through the same set of output states (limit cycle).
  • The NCM shows unstable behavior (chaotic attractor), shifting states instead of stabilizing as in (1) and (2) above.
Simple threshold NCMs quickly reach stable limit cycles or fixed points [44]. These limit cycles reveal “hidden patterns” within the causal network of the NCM. Consider the following neutrosophic digraph (Figure 7).
The neutrosophic adjacency matrix N(E) for the directed graph (Figure 7) is shown below (Figure 8).
Let us assume that we take the state vector C1 = (1 0 0 0 0 0 0). We will now examine the effect of C1 on N(E).
C 1 N(E) = (0 I −1 1 1 0 0) → (1 I 0 1 1 0 0) = C 2
C 2 N(E) = (I + 2, I, −1 + I, 1 1 0 0) → (1 I 0 1 1 0 0) = C 3 = C 2
Thus, C 2 = (1 I 0 1 1 0 0) is a fixed point, indicating that the activation or ON state of concept 1 positively influences concepts 4 and 5. However, other factors, such as concept 2, remain indeterminate in their relationship to concept 1.
Let us note some important rules that apply when using the usual operators in neutrosophic matrices. An element of a neutrosophic matrix can take the form of a + b I , where a and b are real numbers and I represents the indeterminacy factor. Factor   I then satisfies the following properties [25]: I 2 = I ,   I + I + + I = n I ,   0 × I = 0 and if k   K (the ring of real numbers), then k × I = k I .

2.3. Overview of the Proposed Model

Figure 9 depicts the proposed framework that outlines its various phases, from data collection to conclusions.
Phase 1: Data collection. Data were collected from expert responses to a questionnaire designed to assess the amount of “smartness” of a port. Port and marine experts were selected from academia and business.
Phase 2: Neutrosophic cognitive maps. The expert’s results were reinforced by a directed neutrosophic graph that depicted the links between the various techniques. The study of smart ports’ KPIs from the relevant literature led to the identification of six types of strategies: (i) operational efficiency, (ii) financial, (iii) technological advancements, (iv) environmental sustainability, (v) customer centricity, and (vi) safety and security, as detailed in Section 3.
Phase 3: Group decision support environment. The matrix structure of NCMs facilitates the process of gathering information from multiple experts, enabling the rapid creation of a shared knowledge base for group decision analysis and support. In order to calculate the combined NCM, we simply add the neutrosophic adjacency matrices N ( E 1 ), N ( E 2 ),…,   N ( E p ), of an NCM with nodes.
C 1 ,   C 2 C n ,   i . e . ,   N ( E ) = N ( E 1 ) + N ( E 2 ) + . . + N ( E p )
If analysis method 1 is selected:
Phase 4: Dynamical systems of the NCMs. The NCM dynamic systems were created using the neutrosophic graphs given by the experts. Subsequently, each node was turned on and interacted with to reveal the hidden pattern.
Phase 5: Finding hidden patterns for each dimension/factor. The NCM model discovered a hidden pattern for each approach, which was then aggregated and ranked.
Phase 6: Ranking of dimensions/factors and arriving at conclusions. Based on expert opinions, the hidden pattern results were collated and utilized to establish the most successful techniques.
If analysis method 2 is selected:
Phase 4: Static systems of the NCMs. Each member of the decision group establishes causal linkages between the topics they have discovered. Each group member then communicates the strength of the causal relationships between concepts by assigning numerical weights to them.
Phase 5: Finding total centrality. When aggregating causal weights, absolute values are used to lend equal weight to positive and negative factors.
Phase 6: Ranking of dimensions/factors and arriving at conclusions. Based on the experts’ perspectives and the findings of phase 4, ideas with high centrality should be given particular attention in any analysis designed to enhance decision-making.

3. Smart Port Performance Indicators

Understanding performance requires identifying a causal model that specifies how current activities might impact future results. A performance measure is a leading indicator of performance only if the organization understands and masters its causal links and can replicate the outcome in the future. While not all measurements are quantitative, it is usually necessary to use quantitative measures for comparison purposes, as qualitative measures can be subject to different interpretations. This concern can be addressed within our framework. NCMs address the challenge of using qualitative measures by converting expert opinions and qualitative inputs into quantitative values, allowing for structured comparison. NCMs handle the subjectivity of qualitative data through the concept of indeterminacy, assigning specific values to uncertain relationships. This enables both static and dynamic analyses to use quantifiable metrics, ensuring that even subjective inputs are comparable in a more objective, data-driven framework. As a result, NCMs facilitate consistent decision-making, even when dealing with ambiguous or qualitative information.
In the context of ports, globalization and technical improvements have had a considerable influence on port facility design and operation, as well as organizational and institutional connections among port community members [48,49]. The economic structure and administration of ports are defined by the needs and technology of the port services provided. The pursuit of efficiency in marine transport demands systems that encourage internal competition in port services, leading to competition from other ports and port terminals.
The concept of smart ports aims to integrate cutting-edge information technology and automated, intelligent equipment into daily port management. This automation helps streamline port production and operation, as well as the entire port logistics supply chain process. It also facilitates port financial trade and streamlines port energy and emissions reduction efforts. Smart ports offer seamless connections and synergy between boats, ships, staff, cargo, and a port’s systems, ultimately improving everyday operating performance and advantages.
KPIs are becoming a primary port management tool used to monitor productivity and efficiency in contemporary port management and the shipping sector. KPIs allow port authorities to establish and assess their degree of growth in achieving business objectives. Setting goals is an important aspect of performance management. KPIs also evaluate a port’s optimal allocation of resources by tracking and assessing all input/output parameters and operations, influencing the chance and rate at which a port will reach its objectives [50].
After reviewing related studies in the port and maritime industry, we identified six main areas that help measure smart port performance against specific goals and objectives: operational efficiency, financial performance, technological advancements, environmental sustainability, customer-centric, and safety and security.
The identified dimensions can be defined as below:
  • Operational efficiency [51,52,53,54,55,56,57,58]: Smart ports prioritize operational efficiency by aiming to optimize procedures, decrease costs, and increase productivity through leveraging digital technology and data-driven solutions. In fact, smart ports achieve operational efficiency by combining automation, digitalization, predictive analytics, real-time monitoring, and optimal supply chain integration.
  • Financial [54,55,56]: Financial performance metrics are crucial in determining the economic health, efficiency, and profitability of smart ports. These metrics provide information on income growth, expense management, and overall financial sustainability. Financial performance indicators help smart ports monitor their financial health, identify areas for development, make informed investment decisions, and ensure long-term financial growth in a changing marine sector landscape.
  • Technological advancement [59,60,61]: Technological advancements play a crucial role in enhancing the performance of smart ports. Ongoing breakthroughs in technology, such as blockchain, 5G connectivity, and self-driving vehicles, create opportunities for innovation and advancement in port operations. An agile and adaptable IT infrastructure enables smart ports to quickly adapt to shifting market demands, regulatory requirements, and emerging technologies, ensuring long-term competitiveness and sustainability. These advancements encompass a range of innovations that revolutionize operations, boost efficiency, and foster sustainability in port settings. Technological breakthroughs facilitate innovation, efficiency, and sustainability in smart port ecosystems, enabling ports to meet the evolving demands of global trade and logistics. Strategic integration of these technologies can enhance port operations, improve competitiveness, and contribute to the development of a more robust and efficient maritime sector.
  • Environmental sustainability [62,63,64,65,66,67]: Environmental sustainability is a critical focus for smart ports, as they aim to decrease their ecological impact and help create a more environmentally friendly future. Key performance indicators (KPIs) for environmental sustainability in smart ports help to monitor and measure progress towards sustainability goals. These KPIs also offer valuable data for stakeholders, authorities, and the public to assess a port’s environmental performance and support ongoing improvement efforts.
  • Customer-centric orientation [68,69,70]: Customer-centric performance at smart ports focuses on providing excellent services, increasing transparency, and optimizing operations to meet the requirements and expectations of port users, such as shipping firms, cargo owners, and other stakeholders. Metrics such as customer satisfaction, service reliability, transparency, communication, customization, personalization, feedback, and continuous improvement can help focus on customer needs, foster collaboration, leverage technology, and constantly improve services. By aligning key performance indicators (KPIs) with customer-centric goals, smart ports can generate customer satisfaction, loyalty, and a competitive edge in the marine sector.
  • Safety and security [71,72,73]: Smart port performance prioritizes safety and security to safeguard assets, staff, and cargo while ensuring seamless operations. By implementing robust safety and security measures, smart ports contribute to a secure and reliable marine ecosystem, protecting assets, maintaining operational continuity, and inspiring trust among stakeholders.
Performance indicators, as indicated above, are essential for assessing and enhancing smart port operations across multiple dimensions. They help evaluate operational efficiency, safety and security, environmental sustainability, customer satisfaction, financial performance, and technological advancement. These indicators enable port stakeholders to optimize operations, ensure compliance with global standards, reduce environmental impact, and improve service quality. By integrating advanced technologies and continuously monitoring these performance areas, smart ports can adapt to changing industry demands and maintain global competitiveness.

4. Results

In this section, we provide an illustrative example to demonstrate how our proposed methodology works in a group decision support environment. The example focuses on identifying the perspectives that have the most influence on the performance of a smart port, as described in Section 3. Our proposed group decision framework includes two distinct stages: (i) the development stage and (ii) the application stage which are outlined below.

4.1. Development Phase

During the development phase, we distributed properly designed questionnaires concerning the identified KPIs shown in Table 1 to a group of two domain experts in academia and the maritime industry, respectively. The experts were tasked with conducting pairwise comparisons based on the six categories outlined in Table 1 that impact a smart port’s performance in a neutrosophic environment. This comparison was undertaken using linguistic variables that were transformed into single value neutrosophic numbers based on a specific scale as shown in Table 2.
During this stage, perspectives affecting smart port performance were drawn as nodes of the NCM to be analyzed. Next, according to their knowledge, each decision group member specified causal links between the identified concepts. Group members use neutrosophic language phrases to represent the strength of inter-concept causal linkages, which are subsequently assigned numerical weights. It is important to recall that in NCMs, the relation between two vertices might be considered indeterminate (unknown or unidentified), marked by “I”.

4.2. Application Phase

This phase, which mainly distinguishes our method from others in related literature, includes both static and dynamic assessments. Group activities allow for immediate feedback and discussion.

4.2.1. Static Analysis of the NCMs
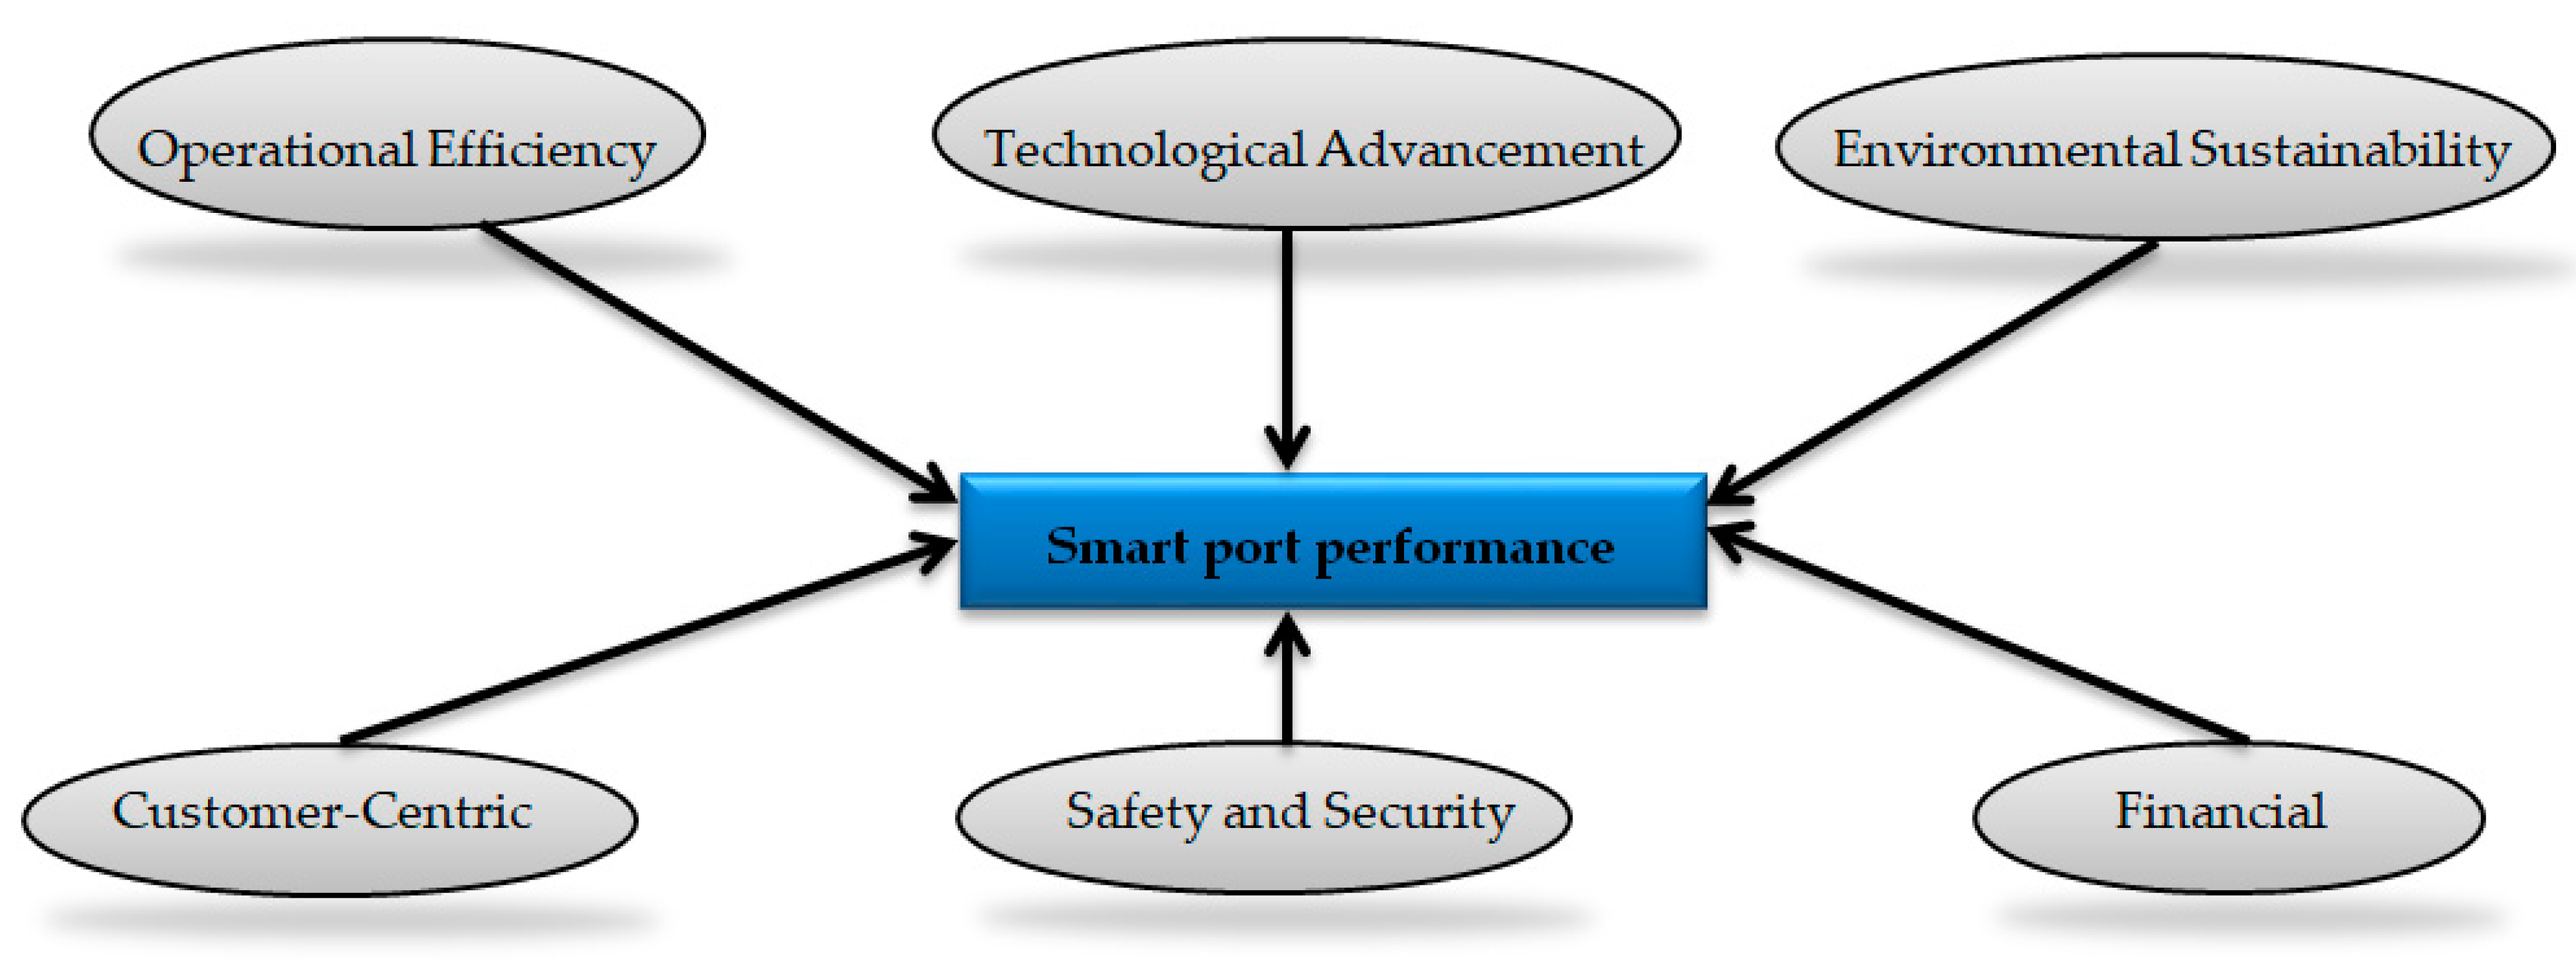
As previously stated in Section 2, a static analysis of NCMs may be utilized to determine (1) the relative relevance of concepts and (2) the indirect and total causal effects between nodes which act as estimators of the degree of influence between pairs of concepts.
In our research, we follow the steps depicted in Figure 10 to perform static analysis on NCMs.
According to [75,76], centrality is the most important metric of map complexity and is calculated by adding the indegree and outdegree of variables. Actually, centrality indicates how related a variable is to other variables and the cumulative strength of these relationships.
Figure 11 shows the pillars from which the metrics for the performance of smart ports are derived, as illustrated in Table 1.
The above six main factors for the assessment of a smart port’s performance problem were considered for our study. These were established using interviews and interaction (see Appendix A for the questionnaire used in this survey) with two experts from academia and industry in the maritime sector. Based on the aforesaid analysis, we can consider the following nodes/concepts for our study:
C0 → Smart port performanceApplsci 15 01981 i001Dimensions/factors
C1 → Operational efficiency
C2 → Technological advancement
C3 → Environmental sustainability
C4 → Customer-centric
C5 → Safety and security
C6 → Financial
As we have mentioned earlier, an NCM expresses the presence or absence of relationships between concepts and shows indeterminate relations between the concepts.
In Figure 12 and Figure 13, we give the directed graph as well as the connection square matrix N(E) of the first expert’s opinion.
The connection square matrix N(E1) to the above directed graph is given below (Figure 13).
In Figure 14 and Figure 15, we give the directed graph as well as the connection square matrix N(E2) of the second expert’s opinion. The symbols used are the same as in Figure 11 (refer to the Legend).
Next, we apply Equation (9) to obtain the aggregated matrix of the combined opinions of the experts which are depicted in Table 3.
The measures of centrality are calculated using the outdegree measures and indegree, using Equations (2) and (3); the results are shown in Table 4.
Once the measures of centrality were calculated, the nodes of the NCM were classified. This classification is shown in Table 5 and was utilized in order to understand and analyze the dynamics of the system being modeled. More specifically, transmitter nodes indicate those nodes of the NCM that influence other nodes but are not significantly influenced themselves. On the other hand receiver nodes are those nodes of the graph that are heavily influenced by other nodes but exert little influence on others. Lastly, ordinary nodes represent intermediary processes or factors without playing an extreme role in the system being modelled by the NCM. This classification enables decision-makers to focus on critical aspects of the system for effective intervention and optimization.
The total centrality (total degree, td (vi)), is calculated using Equation (4) and the results are shown in Table 6.
Next, the process of de-neutrosophication is applied as it is referred to in [34]. I ∈ [0, 1] is replaced by values maximum and minimum. Finally, the interval values are displayed in Table 7.
Based on Equation (5), the means of the extreme values are obtained to analyze the characteristics to be attended to according to the factors obtained and are shown in Table 8.
Then, the final priorities of the static analysis of the NCM of our case study can be ordered as follows: TA ≻ OE ≻ F ≻ CC∼SS ≻ ES.
It is shown that in order to enhance smart port performance, customer-centricity, safety and security and environmental factors must be addressed since they showcase the lowest total centrality values and thus extra attention must be taken by decision-makers.

4.2.2. Dynamic Analysis of the NCMs

Using artificial intelligent techniques, the dynamics of a fuzzy cognitive map can be traced analytically through a specific inference and simulation process. Dynamic NCM analysis can be used to explore the behavior of the simulated system over time. As mentioned earlier, the system may stabilize to a fixed state, enter a limit cycle, or form a chaotic attractor. Each of these possible outcomes can provide valuable data to assist in decision-making.
Figure 16 represents the process taken in order to perform dynamic analysis of an NCM.
Simulations can analyze various aspects of NCMs, including concept activation levels at the end of the simulation, changes/trends in activation levels over time, and cycle discovery (intervals and activation levels within a cycle). This style of study investigates “what-if” situations by running simulations of a particular model with various beginning state vectors. After an NCM is exposed to an initial stimulus, the subsequent stable state or cycle of states may be studied to acquire insight into the system’s behavior. The work of [77] suggests that simulations can provide insight into a system’s dynamic behavior, aiding decision-making and predicting future outcomes.
In Section 2, we previously outlined the general algorithm of dynamic analysis in NCMs as a generic representation of the analysis process. In the specific context of smart port performance, Figure 17 provides a contextualization of the general steps (Figure 5) with domain-specific elements such as the role of the smart port performance node and the thresholding operation for practical application.
Next, the following figures (Figure 18 and Figure 19) depict the experts’ opinions in the form of adjacency matrices, expressing the relationships between the concepts identified in Figure 11. The only difference this time, compared to the static analysis of NCM, is that the main concept/node (smart port performance) is included in the construction of the respective adjacency matrices.
Now, based on the above matrices, we will evaluate howthe concept of smart port performance is influencedbyother nodes of NCM. This is achieved by performing the steps of the algorithm explained in Figure 17 in the following way:
(1) For the first expert:
We set the effect of node C0 (smart port performance) to be in the ON state and all other nodes in OFF state, i.e., we define the vector A1 = (1,0,0,0,0,0,0) (step 3).
We multiply the vector A1 with the adjacency matrix as defined from first expert, i.e.,
A1 N(E1) = (0,1,1,1, I, 1,1) (1,1,1,1,I,1,1) = A2 (say) (step 4)
(“ ”symbol denotes the updating and thresholding of the state vector).
The operation where the factor is in the ON state in the initial vector A1 should remain in the ON state till the end. This method of replacing in the ON state if it is zero or OFF is called the updating operation. The threshold operation in these models is carried out using Equation (8), (here, with T = 1).
The resultant state vector A2’s effect on N(E1) gives the following:
A2 N(E1) = (5+I, 3+I, 4+I, 2, I−1, 1, 2) (1,1,1,1,0,1,1) = A3 (step 5)
(3 + I, 4+I is replaced by 1 as the real part is greater than the indeterminate part while I-1 is replaced by 0 as the real part is less than the indeterminate part).
A3N(E1) = (5,3,4,2,I−1,1+I,2+I) (1,1,1,1,0,1,1) = A4 = A3 (step 5hidden pattern or limit cycle)
Thus, according to the expert’s opinion, if C0 (smart port performance) is in the ON state then the nodes C1, C2, C3, C4, and C6, are in the ON state, whereas the node C5 is in the OFF state. In other words, the previous result indicates that the concept of smart port performance is strongly linked and affected by factors such as operational efficiency, technological advancement, environmental sustainability, safety and security and financial. In contrast, the OFF state of the customer-centric factor indicates that this factor is not currently contributing to overall performance or has been deprioritized.
Next we proceed with the judgements of the second expert. We follow the exact same algorithmic procedure as with the first expert.
(2) For the second expert:
We set the effect of node C0 (smart port performance) to be in the ON state and all other nodes in OFF state, i.e., we define the vector A1 = (1,0,0,0,0,0,0) (step 3).
We multiply the vector A1 with the adjacency matrix as defined from first expert, i.e.,
A1 N(E2) = (I,1,1,1, I, I,I) (1,1,1,1,I,I,I) = A2 (say) (step 4)
The resultant state vector A2’s effect on N(E2) gives:
A2 N(E2) = (3+3I, 2+2I, 3+2I,3−I,0,I,2) (1,1,1,1,0,I,1) = A3 (step 5)
A3 N(E2)= (4+I,3,3+I,2,I−1,2I,2+I) (1,1,1,1,0,I,1) = A4 = A3 (step 5hidden pattern or limit cycle)
Based on the judgement of the second expert, smart port performance is affected and influenced by the factors operational efficiency, technological advancement, environmental sustainability, and financial. The OFF state of the customer-centric factor indicates that this factor is not currently contributing to overall performance or has been deprioritized. Furthermore, in this case, we observe that we have the dimension of safety and security to act as an indeterminate factor to the main concept of smart port performance.

4.3. Discussion of Results and Implications on Smart Port Management

The results of our analysis provide significant insights into smart port performance by highlighting key dimensions that influence operational effectiveness and long-term strategic sustainability. Using NCMs, our methodology effectively modeled the interdependent factors influencing smart port operations, capturing the inherent uncertainty in expert decision-making processes.
Our findings indicate that technological advancement (TA) is the most important of the six performance variables studied. This shows that investments in digitalization, automation, and smart infrastructure are critical for improving port operations. The ranking’s emphasis on TA reinforces current research that highlights the revolutionary influence of emerging technologies such as Blockchain, Internet of Things (IoT), and AI-driven decision-making tools on port efficiency.
Operational efficiency (OE) emerged as the second most significant factor, highlighting its importance in optimizing logistics and minimizing vessel turnaround times. Ports that use smart technology in their operations may dramatically increase berth utilization and cargo processing times, decreasing congestion and increasing service delivery.
The results obtained also indicate that the financial (F) dimension, while important, is significantly influenced by the operational and technological dimensions. This demonstrates that financial sustainability in smart ports is more than just a revenue function, it is also about how effectively resources are allocated and operational costs are handled using smart solutions.
Environmental sustainability (ES), safety and security (SS), and customer-centric (CC) orientation, on the other hand, had relatively lower total centrality scores, indicating that, while important, these factors are more dependent on the implementation of technological and operational improvements than on serving as primary drivers of port performance.

4.4. Sensitivity Analysis

A sensitivity analysis was conducted for each factor to determine its impact on smart port performance. We specifically focused on examining the influence of technological advancements (TA) because it was identified as the most significant factor affecting smart port performance in our case study. Using the aggregated matrix presented in Table 3 as a baseline, we recalculated the total centrality of the nodes under two scenarios: a 20% increase in the outgoing weights of the TA node and a 20% decrease in the outgoing weights of the same node.
In the first scenario, we obtain the following indegree (Id), outdegree (Od) and total centrality (Td) results (Table 9).
The interval values are displayed in Table 10 after applying deneutrosophication in which Ι ∈ [0, 1] is replaced by their lowest and maximum values.
Based on Equation (5), the means of the extreme values are obtained to analyze the characteristics to be attended according to the factors obtained and are shown in Table 11.
Then, the final priorities of the static analysis of the NCM of our case study can be ordered as follows: TA ≻ OE ≻ F ≻ CC∼SS ≻ ES.
Following the same calculation steps for the second scenario (20% decrease in the outgoing weights of the TA node) we have the following results as shown in Table 12.
In this scenario, the final priorities, of the static analysis of the NCM of our case study, can be ordered as follows: TA ≻ OE ≻ SS ≻ F ≻ CC ≻ ES.
The sensitivity analysis highlights the pivotal role of technological advancement (TA) in smart port performance, consistently ranking as the top priority. Increasing TA’s impact strengthens its position but may overshadow other essential factors such as safety and security (SS) and customer-centricity (CC). In contrast, diminishing TA’s influence strengthens SS, emphasizing its relevance in scenarios with limited technology investments. Operational efficiency (OE) remains a top priority in all settings, highlighting its critical importance.

4.5. Comparison to Other MCDM Methods

A comparison of the proposed model with other existing MCDM models based on FCMs is provided in Table 13. Two existing MCDM models that utilize FCM analysis are used for comparison based on the ranking of dimensions/factors, the capture of indeterminacy present in the real world, the analysis of the influence of one dimension/factor on others and its capacity to capture dynamic behavior efficiently. It is worth noting that we did not find any research study that applies the NCM approach in the context of smart port performance, adding novelty to our proposed method.
Method 1 [78]. The study uses fuzzy ANP (analytic network process) to choose the optimum container port while taking into account the interdependence of various port performance indicators. Fuzzy logic is used to deal with ambiguity and imprecision in expert judgement, as well as to evaluate the relevance of various factors.
Method 2 [79]. This study uses fuzzy DEA (data envelopment analysis) to assess the effectiveness of cargo ports. The approach evaluates the relative efficiency of ports using input–output models and fuzzy logic to handle unclear or ambiguous data.
The above table demonstrates that the suggested approach is better suited to handle real-world data with human experts using multi-criteria decision-making as it offers a more flexible, dynamic and customizable approach to smart port performance evaluation. It addresses the key limitations of existing FCM-based methods while introducing dynamic, uncertain, and stakeholder-driven perspectives. This flexibility makes it better suited to address the complex and interdependent nature of smart port performance factors.
While this study presents an illustrative situation, further research might further validate the method through real-world port decision-making. Collaborations with port authorities or logistics businesses could provide empirical data to test and enhance the model under realistic settings.

5. Conclusions and Future Work

5.1. Concluding Remarks

The MCDM problems involving dependence and feedback effects are challenging for decision-makers to make the correct decisions. This challenge primarily arises due to the non-linear and interconnected nature of such systems. To address these issues, decision-makers often rely on advanced decision support systems capable of modeling and simulating various situations, including system dynamics, and employing optimization approaches that consider multiple criteria and their interactions.
Within this context, cognitive maps have been widely used in policy analysis and decision-making support [80,81]. NCMs offer a potential framework for capturing and analyzing complex, uncertain, and conflicting information, making them a useful tool for decision-making and problem-solving in ambiguous and imprecise circumstances. Their ability to capture vague information and incorporate uncertainty provides decision-makers with a more comprehensive understanding of the systems they are dealing with, ultimately leading to better-informed decisions. The use of NCMs in decision-making has been studied in various fields, such as environmental management and corporate strategy [82]. Additionally, NCMs have been applied in project portfolio management to analyze interdependencies and evaluate risks through the use of neutrosophic logic and NCMs. This approach highlights the advantages of managing uncertainty and facilitating expert knowledge elicitation [83].
This article offers an overview of the NCM structure and operation, along with an illustrative example of its use in a decision-support application. Additionally, it introduces group NCMs and a framework for supporting group decision-making in the context of a smart port’s performance evaluation under a neutrosophic environment. This approach could be considered as a valuable asset in the managerial toolbox, as group NCMs facilitate collaboration between multiple stakeholders or decision-makers. Each member can contribute their unique perspectives and expertise on the interrelationships and dynamics of the smart port’s various components. The methodology’s adaptability ensures it can be tailored to specific ports, addressing unique operational, technological, and ecological challenges. To the best of our knowledge, analysis of the influence of one dimension/factor over others, that is, whether they positively or negatively influence each other, is not conducted in related literature. To analyze the interconnections between the smart port performance dimensions, we have proposed a new framework that utilizes NCMs.
More specifically, in this paper, we utilized an innovative method with NCMs to add a new dimension to cognitive maps by incorporating dynamic feedback analysis and analyzing interconnections between various critical dimensions that affect the evaluation of a smart port’s performance. While the theory behind NCMs is well developed [29], their application to decision support is limited. The proposed model uses NCMs because neutrosophic logic can handle uncertainties related to experts’ opinions on vagueness, ambiguity, and inconsistency. Additionally, NCMs allow for the creation of higher-level knowledge based on system applications, addressing the need to handle uncertainty and inaccuracy associated with real-world problems.
Our methodology examines the relationships between KPIs used to identify the association between the goals and strategic orientation of the smart port in terms of its performance assessment. NCMs are considered in this analysis, taking into account the aforementioned factors, and a quantitative analysis is applied based on the static and dynamic analysis provided by the use of NCMs.
To illustrate the NCM methodology, we present an empirical application for modeling the factors that influence the performance of a smart port. We outline the key aspects of an NCM scenario aimed at gathering stakeholder perspectives on smart ports to determine the most effective strategy for improving performance. Through this process, we identify the highest priority dimension among the main pillars identified. An integrated model is developed by combining individual NCMs created by participants from academia and industry. Graph theoretical indices are calculated using the individual NCMs and the collective NCM resulting from this combination. The results demonstrate the functionality of this approach and show that NCMs are a reliable and efficient tool for this purpose.
The proposed method, which combines static and dynamic analysis of NCMs, provides a comprehensive approach to evaluating smart port performance, taking into consideration both immediate relationships and long-term system dynamics. Static analysis finds KPIs and uses centrality measures to evaluate their importance, whereas dynamic analysis simulates the changing interactions between components over time, allowing for the discovery of feedback loops and hidden patterns. This dual approach allows for a more in-depth understanding of the complex, interdependent connections that occur in smart port systems, which helps decision-makers deal with uncertainty, anticipate future challenges, and prioritize development areas. This capability bridges a critical gap in the literature by addressing the interplay between short-term decisions and long-term operational objectives. Finally, the method creates a flexible, adaptable, and robust framework for the continuous optimization of smart port operations.
A comparison with existing MCDM approaches based on fuzzy ANP and fuzzy DEA reveals the suggested method’s strengths. Unlike existing methods that struggle with indeterminacy and do not integrate dynamic behavior, the suggested NCM-based method excels in addressing uncertainty and causal factors, giving a more flexible, dynamic, and customizable framework for evaluating smart port performance.
In summary, we believe that the proposed technique represents a significant advancement in the field of smart port performance evaluation, providing a powerful, adaptable, and comprehensive decision-making tool that can be easily tailored to unique demands and situations. This method’s dynamic and static analytic capabilities, as well as its incorporation of indeterminacy, make it an excellent tool for decision-makers looking to optimize port operations in the face of uncertainty and complex interdependencies across performance measures. The case study illustrates how the suggested approach may provide actionable information to support the development and enhancement of smart ports, helping to achieve the overarching goal of improving port efficiency and sustainability in an increasingly complex global marine environment.

5.2. Future Work

Combining expert perspectives has its advantages and disadvantages. Specifically, when multiple experts weigh in on a topic, the law of large numbers can lead to a more validated solution. However, conflicting views may negate each other and ultimately have no impact on the system. In order to address the latter, our method tackles the issue of conflicting expert opinions by modeling uncertainty and ambiguity through degrees of truth, falsity, and indeterminacy. This allows diverse opinions to coexist without canceling each other out. Furthermore, to enhance our method in this direction, a possible solution could be to assign weights to expert contributions based on their credibility, ensuring more reliable insights influence the final outcome. By visualizing these interactions, our method could provide a clearer, more robust decision-making process for assessing smart port performance.
The presented framework needs further testing. One possible future endeavor could be to integrate our method with the sustainable balanced scorecard (SBSC) [84,85,86], a popular management tool. The SBSC employs performance metrics from financial, customer, business processes, technology, and socio-environmental perspectives, introducing a new performance measurement framework for smart ports. In such a hybrid method, the perspectives described in the SBSC model would act as the concepts in the NCMs. This would allow us to examine the relationship between the concepts and address the inherent vagueness and indeterminacy in decision-making due to human judgment. Scholars in [87] have already taken a step in this direction by proposing a hybrid method that integrates the neutrosophic AHP method with the SBSC model to assess smart port performance, albeit only theoretically.
Several extensions of FCMs have been proposed by researchers in the last decade [88]. A potential future study could involve constructing a hybrid method based on grey system theory and NCMs. A similar work is described in [89], but it is applied to FCMs. We propose this extension to the aforementioned application because we believe that the theories of neutrosophic sets (NS) and grey systems are more consistent models of uncertainty. These models can provide significant advantages for decision-making compared to fuzzy sets, which are considered less reliable in demonstrating indeterminate relationships between concepts.
Another extension that could be applied in NCMs is to incorporate the concept of time lag that may occur between the relationships of nodes. Causal strength over time units has not been previously studied in the field of NCMs. A preliminary attempt in the field of FCMs is discussed in [90], followed by related works in [91,92,93,94] proposing advancements in “traditional” FCMs considering time. The concept of time could simulate the impact, in time units, of one presynaptic node on the postsynaptic node. From this perspective, we could analyze a system’s behavior based on time by examining the change of causalities among factors over a discrete period t. A different approach is described in [36] where scholars utilize neutrosophic temporal logic in NCMs using Kripke structures to represent the nodes of the NCM. The accessibility relations in Kripke structures are modified to represent the degrees of indeterminacy or uncertainty between conceivable worlds, allowing for a comprehensive analysis of information flow and truth values across different worlds.
Lastly, we mention prescriptive modeling, a category of business analytics that aims to prescribe operations within a system to achieve a specific goal [95]. It is an area that has garnered academic interest in recent years as it provides crucial support to decision-makers [96]. NCMs have previously been used to generate descriptive and predictive models. In this context, it would be promising and innovative to develop an NCM-based methodological framework for generating prescriptive models based on system and prescriptive concepts to assist decision-making in various study domains.
Future research in the context of group decision NCMs could focus on the following: (i) testing the group NCM-based decision tool in various field environments, and (ii) comparing and contrasting the group NCM approach with other dynamic feedback system analysis methods, such as system dynamics [97]. In this regard, while the proposed NCM-based methodology provides a strong foundation for evaluating smart port performance, its applicability to other ports and sectors requires careful consideration of contextual factors such as data availability, stakeholder engagement, and sector-specific challenges. With appropriate adjustments and pilot testing, the framework may be generalized and efficiently implemented across a wide range of areas.

Author Contributions

Conceptualization, A.P., M.M. and Y.N.; methodology, A.P., M.M. and Y.N.; validation, A.P., M.M. and Y.N.; formal analysis, A.P.; investigation, A.P.; data curation, A.P.; writing—original draft preparation, A.P.; writing—review and editing, A.P., M.M. and Y.N.; visualization, A.P.; supervision, M.M. and Y.N.; project administration, M.M. and Y.N. All authors have read and agreed to the published version of the manuscript.

Funding

This work has received no external funding.

Institutional Review Board Statement

Not applicable.

Informed Consent Statement

Not applicable.

Data Availability Statement

Dataset available on request from the authors.

Conflicts of Interest

The authors declare no conflicts of interest.

Appendix A

Question:In what way do you think that there exists (if any or if known) an effect between the clusters mentioned in the table below within the context of smart port performance? Along with your answer the corresponding drawing of NCM should be given.
Table A1. Assessment decision matrix.
DIMENSIONSOETAESCCSSF
OE0
TA 0
ES 0
CC 0
SS 0
F 0
OE: operational efficiency, TA: port technological advancement, ES: environmental sustainability, CC: customer-centricity, SS: safety and security, F: financial.
Notes:
Please make use of the assessment scale below (Table A2) and the proper use of the signs “+” or “−” in order to fill in Table A1.
Table A2. Scale of linguistic variables.
Intensity of ImportanceDefinition
(+) 1.0Extreme effect
0.0No effect
(−) 1.0Extremely negative effect
INot known or not identified effect
Use the sign “+” if between two clusters/nodes there exists a positive effect, i.e., if increase (or decrease) of a concept/node causes increase (or decrease) to a connected concept/node.
Use the sign “−” if between two clusters/nodes there exists a negative effect, i.e., if increase (or decrease) of a concept/node causes decrease (or increase) to a connected concept/node.

References

  1. Chiang, C.H.; Hwang, C.C. Competitiveness of container ports in a region with cooperation and integration. J. Soc. Transp. Traffic Stud. 2009, 1, 77–91. [Google Scholar]
  2. Yau, K.L.A.; Peng, S.; Qadir, J.; Low, Y.C.; Ling, M.H. Towards smart port infrastructures: Enhancing port activities using information and communications technology. IEEE Access 2020, 8, 83387–83404. [Google Scholar] [CrossRef]
  3. Lin, C.Y.; Dai, G.L.; Wang, S.; Fu, X.M. The evolution of green port research: A knowledge mapping analysis. Sustainability 2022, 14, 11857. [Google Scholar] [CrossRef]
  4. Douaioui, K.; Fri, M.; Mabrouki, C. Smart port: Design and perspectives. In Proceedings of the 2018 4th International Conference on Logistics Operations Management (GOL), Le Havre, France, 10–12 April 2018; pp. 1–6. [Google Scholar] [CrossRef]
  5. Xiao, G.; Pan, L.; Lai, F. Application, opportunities, and challenges of digital technologies in the decarbonizing shipping industry: A bibliometric analysis. Front. Mar. Sci. 2025, 12, 1523267. [Google Scholar] [CrossRef]
  6. Chen, X.; Wu, H.; Han, B.; Liu, W.; Montewka, J.; Liu, R.W. Orientation-aware ship detection via a rotation feature decoupling supported deep learning approach. Eng. Appl. Artif. Intell. 2023, 125, 106686. [Google Scholar] [CrossRef]
  7. Rodrigues, T.D.A.; Ojiako, U.; Mota, C.M.D.M.; Marshall, A.; Chipulu, M.; Dweiri, F. Assessing risk dimensions in dry port projects: Prioritization, interdependence and heterogeneity. Marit. Bus. Rev. 2024, 9, 311–330. [Google Scholar] [CrossRef]
  8. Yang, W.; Bao, X.; Zheng, Y.; Zhang, L.; Zhang, Z.; Li, L. A digital twin framework for large comprehensive ports and a case study of Qingdao Port. Int. J. Adv. Manuf. Technol. 2024, 131, 5571–5588. [Google Scholar] [CrossRef]
  9. Kaplan, R.; Norton, D. Putting the Balanced Scorecard to Work; Harvard Business Review: Brighton, MA, USA, 1993. [Google Scholar]
  10. Kaplan, R.; Norton, D. The Balanced Scorecard—Measures that Drive Performance; Harvard Business Review: Brighton, MA, USA, 1992. [Google Scholar]
  11. Kaplan, R.; Norton, D. Using the Balanced Scorecard as a Strategic Management System; Harvard Business Review: Brighton, MA, USA, 1996. [Google Scholar]
  12. Tongzon, J. Efficiency measurement of selected Australian and other international ports using data envelopment analysis. Transp. Res. Part A Policy A Pract. 2001, 35, 107–122. [Google Scholar] [CrossRef]
  13. Niu, B.; Dong, J.; Wang, H. Smart port vs port integration to mitigate congestion: ESG performance and data validation. Transp. Res. Part E: Logist. Transp. Rev. 2024, 191, 103741. [Google Scholar] [CrossRef]
  14. Cullinane, K.; Song, D.W.; Gray, R. A stochastic frontier model of the efficiency of major container terminals in Asia: Assessing the influence of administrative and ownership structures. Transp. Res. Part A Policy Pract. 2002, 36, 743–762. [Google Scholar] [CrossRef]
  15. Coto-Millan, P.; Baños-Pino, J.; Rodríguez-Alvarez, A. Economic efficiency in Spanish ports: Some empirical evidence. Marit. Manag. 2000, 27, 169–174. [Google Scholar] [CrossRef]
  16. Tongzon, J. Systematizing international benchmarking for ports. Marit. Manag. 1995, 22, 171–177. [Google Scholar] [CrossRef]
  17. Khan, M.S.; Quaddus, M. Group decision support using fuzzy cognitive maps for causal reasoning. Group Decis. Negot. 2004, 13, 463–480. [Google Scholar] [CrossRef]
  18. Özesmi, U.; Özesmi, S.L. Ecological models based on people’s knowledge: A multi-step fuzzy cognitive mapping approach. Ecol. Model. 2004, 176, 43–64. [Google Scholar] [CrossRef]
  19. AbdelMouty, A.M. Decision making model for strategy choice in higher education under neutrosophic environment. J. Neutrosophic Fuzzy Syst. 2023, 1, 99–106. [Google Scholar] [CrossRef]
  20. Mahmood, A.; Abbas, M.; Murtaza, G. Multi-Valued Multi-Polar Neutrosophic Sets with an application in Multi-Criteria Decision-Making. Neutrosophic Sets Syst. 2023, 53, 32. [Google Scholar]
  21. Zaher, M.A.; Eldakhly, N.M. Integrated multi-criteria decision making via trapezoidal neutrosophic sets to evaluate the risks of failure mode. J. Neutrosophic Fuzzy Syst. 2023, 5, 23–29. [Google Scholar] [CrossRef]
  22. Hanine, M.; Boutkhoum, O.; Tikniouine, A.; Agouti, T. Application of an integrated multi-criteria decision making AHP-TOPSIS methodology for ETL software selection. SpringerPlus 2016, 5, 263. [Google Scholar] [CrossRef]
  23. Hanin, N.; Zaria, D.; Dhandio, D.J.; Kusnandar, D. Implementation Of AHP-TOPSIS As A Support For Making Decisions On Micro Business Funding In Sambas Regency. Int. J. Econ. Bus. Account. Res. (IJEBAR) 2023, 7, 394–410. [Google Scholar]
  24. Paraskevas, A.; Madas, M.; Zeimpekis, V.; Fouskas, K. Smart Ports in Industry 4.0: A Systematic Literature Review. Logistics 2024, 8, 28. [Google Scholar] [CrossRef]
  25. Kardaras, D.; Mentzas, G. Using fuzzy cognitive maps to model and analyze business performance assessment. Adv. Ind. Eng. Appl. Pract. II 1997, 2, 63–68. [Google Scholar]
  26. Nápoles, G.; Grau, I.; Bello, R.; Grau, R. Two-steps learning of Fuzzy Cognitive Maps for prediction and knowledge discovery on the HIV-1 drug resistance. Expert Syst. Appl. 2014, 41, 821–830. [Google Scholar] [CrossRef]
  27. Al Farsi, A.; Petrovic, D.; Doctor, F. A non-iterative reasoning algorithm for fuzzy cognitive maps based on type 2 fuzzy sets. Inf. Sci. 2023, 622, 319–336. [Google Scholar] [CrossRef]
  28. Mehryar, S.; Schwarz, N.; Sliuzas, R.; van Maarseveen, M. Making use of fuzzy cognitive maps in agent-based modeling. In Advances in Social Simulation: Looking in the Mirror; Springer International Publishing: Berlin/Heidelberg, Germany, 2020; pp. 307–313. [Google Scholar]
  29. Kandasamy, W.V.; Smarandache, F. Fuzzy Cognitive Maps and Neutrosophic Cognitive Maps; Infinite Study: Harlesden, UK, 2003. [Google Scholar]
  30. Jousselme, A.L.; Maupin, P. Neutrosophy in situation analysis. In Proceedings of Fusion; International Society of Information Fusion: Mountain View, CA, USA, 2004; pp. 400–406. [Google Scholar]
  31. Zafar, A.; Wajid, M.A. Neutrosophic Cognitive Maps for Situation Analysis; Infinite Study: Harlesden, UK, 2019. [Google Scholar]
  32. Ramalingam, S.; Govindan, K.; Kandasamy, W.V.; Broumi, S. An Approach for Study of Traffic Congestion Problem Using Fuzzy Cognitive Maps and Neutrosophic Cognitive Maps—The Case of Indian Traffic; Infinite Study: Harlesden, UK, 2019. [Google Scholar]
  33. Obbineni, J.; Kandasamy, I.; Vasantha, W.B.; Smarandache, F. Combining SWOT analysis and neutrosophic cognitive maps for multi-criteria decision making: A case study of organic agriculture in India. Soft Comput. 2023, 27, 18311–18332. [Google Scholar] [CrossRef]
  34. Shakil, M.T.A.; Ubaid, S.; Sohail, S.S.; Alam, M.A. A Neutrosophic cognitive map based approach to explore the health deterioration factors. Neutrosophic Sets Syst. 2021, 41, 198. [Google Scholar]
  35. Murugesan, R.; Parthiban, Y.; Devi, R.; Mohan, K.R.; Kumarave, S.K. A Comparative Study of Fuzzy Cognitive Maps and Neutrosophic Cognitive Maps on Covid Variants. Neutrosophic Sets Syst. 2023, 55, 20. [Google Scholar]
  36. Paraskevas, A.; Madas, M. Neutrosophic Cognitive Maps: Theoretical and Mathematical Formulations, Literature Review and Applications. In Soft Computing & Machine Learning: A Fuzzy and Neutrosophic View of Reality; Taylor and Francis Group: Boca Raton, FL, USA, in press.
  37. Chen, J.; Xue, K.; Ye, J.; Huang, T.; Tian, Y.; Hua, C.; Zhu, Y. Simplified neutrosophic exponential similarity measures for evaluation of smart port development. Symmetry 2019, 11, 485. [Google Scholar] [CrossRef]
  38. Vera, P.J.M.; Delgado, C.F.M.; Vera, S.P.C.; Alava, M.V.; Gónzales, M.P. Static analysis in neutrosophic cognitive maps. Neutrosophic Sets Syst. 2016, 14, 61–64. [Google Scholar]
  39. Aldous, J.M.; Wilson, R.J. Graphs and Applications: An Introductory Approach; Springer Science & Business Media: New York, NY, USA, 2003. [Google Scholar]
  40. Kosko, B. Fuzzy Cognitive Maps. Int. J. Man-Mach. Stud. 1986, 24, 65–75. [Google Scholar] [CrossRef]
  41. Salmeron, J.L.; Smarandache, F. Redesigning Decision Matrix Method with an indeterminacy-based inference process. Int. J. Appl. Math. Stat. 2008, 13, 4–11. [Google Scholar]
  42. Stach, W. Learning and Aggregation of Fuzzy Cognitive Maps. An Evolutionary Approach. Ph.D. Thesis, University of Alberta, Edmonton, AB, Canada, 2011. [Google Scholar]
  43. Smarandache, F. Refined literal indeterminacy and the multiplication law of sub-indeterminacies. Neutrosophic Sets Syst. 2015, 9, 58–63. [Google Scholar]
  44. De la Rosa, C.B.; Bolaños, B.C.; Echeverría, H.C.; Padilla, R.C.; Ruilova, G.S. PESTEL Analysis with Neutrosophic Cognitive Maps to Determine the Factors That Affect Rural Sustainability. Case Study of the South-Eastern Plain of the Province of Pinar del Río; Infinite Study: Harlesden, UK, 2019. [Google Scholar]
  45. Kosko, B. Hidden patterns in combined and adaptive knowledge networks. Int. J. Approx. Reason. 1988, 2, 377–393. [Google Scholar] [CrossRef]
  46. Kosko, B. Bidirectional associative memories. IEEE Trans. Syst. Man Cybern. 1988, 18, 49–60. [Google Scholar] [CrossRef]
  47. Smarandache, F.; Neutrosophic systems and neutrosophic dynamic systems. In Collected Papers. Volume VIII: On Neutrosophic Theory and Applications; 2022; p. 50. Available online: https://books.google.co.jp/books?hl=en&lr=&id=vWOjEAAAQBAJ&oi=fnd&pg=PA50&dq=Neutrosophic+systems+and+neutrosophic+dynamic+systems.+&ots=nJYXMrcOc7&sig=7Xnj2RqjjxRwXcvcs94ttukFtD0#v=onepage&q=Neutrosophic%20systems%20and%20neutrosophic%20dynamic%20systems.&f=false (accessed on 8 February 2025).
  48. Haezendonck, E.; Dooms, M.; Verbeke, A. A new governance perspective on port–hinterland relationships: The Port Hinterland Impact (PHI) Matrix. Marit. Econ. Logist. 2014, 16, 229–249. [Google Scholar] [CrossRef]
  49. Burns, M. Port Management and Operations; CRC Press: Boca Raton, FL, USA, 2015; pp. 265–266. [Google Scholar]
  50. 6 Key Primary Indicators (KPIs) That Port Terminals Should Closely Track. Available online: https://medium.com/@octopi_tos/6-key-primary-indicators-kpis-that-port-terminals-should-closely-track-433cb25e1ac6 (accessed on 20 November 2023).
  51. Belmoukari, B.; Audy, J.F.; Forget, P. Smart port: A systematic literature review. Eur. Transp. Res. Rev. 2023, 15, 4. [Google Scholar] [CrossRef]
  52. Pham, T.Y. A smart port development: Systematic literature and bibliometric analysis. Asian J. Shipp. Logist. 2023, 39, 57–62. [Google Scholar] [CrossRef]
  53. Hsu, C.T.; Chou, M.T.; Ding, J.F. Key factors for the success of smart ports during the post-pandemic era. Ocean. Coast. Manag. 2023, 233, 106455. [Google Scholar] [CrossRef]
  54. Makkawan, K.; Muangpan, T. Developing Smart Port with Crucial Domains and Indicators in the Thai Port Case: A Confirmatory Factor Analysis. Trans. Marit. Sci. 2023, 12, 7. [Google Scholar] [CrossRef]
  55. Makkawan, K.; Muangpan, T. A conceptual model of smart port performance and smart port indicators in Thailand. J. Int. Logist. Trade 2021, 19, 133–146. [Google Scholar] [CrossRef]
  56. Liu, C.; Zhan, S.; Heng, L. Evaluation of smart port development level based on entropy weight TOPSIS method. In International Conference on Frontiers of Traffic and Transportation Engineering; SPIE: Bellingham, WA, USA, 2022; Volume 12340, pp. 368–375. [Google Scholar]
  57. Molavi, A.; Lim, G.J.; Race, B. A framework for building a smart port and smart port index. Int. J. Sustain. Transp. 2020, 14, 686–700. [Google Scholar] [CrossRef]
  58. Zhao, D.; Wang, T.; Han, H. Approach towards sustainable and smart coal port development: The case of Huanghua port in China. Sustainability 2020, 12, 3924. [Google Scholar] [CrossRef]
  59. González, A.R.; González-Cancelas, N.; Serrano, B.M.; Orive, A.C. Smart ports: Ranking of Spanish port system. World Sci. News 2020, 144, 1–12. [Google Scholar]
  60. Lakhmas, K.; Sedqui, P.A. Toward a smart port congestion optimizing model. In Proceedings of the 2020 IEEE 13th International Colloquium of Logistics and Supply Chain Management (LOGISTIQUA), Fez, Morocco, 2–4 December 2020; pp. 1–5. [Google Scholar]
  61. Rodrigo González, A.; González-Cancelas, N.; Molina Serrano, B.; Orive, A.C. Preparation of a smart port indicator and calculation of a ranking for the Spanish port system. Logistics 2019, 4, 9. [Google Scholar] [CrossRef]
  62. Angeloudis, P.; Bell, M.G. An uncertainty-aware AGV assignment algorithm for automated container terminals. Transp. Res. E Logist. Transp. Rev. 2010, 46, 354–366. [Google Scholar] [CrossRef]
  63. Luo, S.; Ren, B. The Monitoring and Managing Application of Cloud Computing Based on Internet of Things; Elsevier North-Holland, Inc.: New York, NY, USA, 2016. [Google Scholar]
  64. Gu, S.; Hua, J.; Lv, T. Evaluation of customer satisfaction of “Door-to-Door” whole-process logistic service with interval-valued intuitionistic fuzzy information. J. Intell. Fuzzy Syst. 2016, 30, 2487–2495. [Google Scholar] [CrossRef]
  65. Zhang, Y.; Zou, D.; Zheng, J.; Fang, X.; Luo, H. Formation mechanism of quick emergency response capability for urban rail transit: Inter-organizational collaboration perspective. Adv. Mech. Eng. 2016, 8, 1687814016647881. [Google Scholar] [CrossRef]
  66. Cho, H.; Choi, H.; Lee, W.; Jung, Y.; Baek, Y. LITeTag: Design and implementation of an RFID system for IT-based port logistics. J. Commun. 2006, 1, 48–57. [Google Scholar] [CrossRef]
  67. Wang, L. Study on Port Logistics Marketing under the Environment of Supply Chain. Int. J. Bus. Manag. 2011, 6, 267. [Google Scholar] [CrossRef]
  68. Rudjanakanoknad, J.; Suksirivoraboot, W.; Sukdanont, S. Evaluation of International Ports in Thailand through Trade Facilitation Indices from Freight Forwarders. Procedia—Soc. Behav. Sci. 2014, 111, 1073–1082. [Google Scholar] [CrossRef]
  69. Lai, G.; Debo, L.G.; Sycara, K. Sharing inventory risk in supply chain: The implication of financial constraint. Omega 2009, 37, 811–825. [Google Scholar] [CrossRef]
  70. Peris-Mora, E.; Diez Orejas, J.M.; Subirats, A.; Ibáñez, S.; Alvarez, P. Development of a system of indicators for sustainable port management. Mar. Pollut. Bull. 2005, 50, 1649–1660. [Google Scholar] [CrossRef] [PubMed]
  71. Zhao, M.; Zhang, Y.; Ma, W.; Fu, Q.; Yang, X.; Li, C.; Zhou, B.; Yu, Q.; Chen, L. Characteristics and ship traffic source identification of air pollutants in China’s largest port. Atmos. Environ. 2013, 64, 277–286. [Google Scholar] [CrossRef]
  72. Chen, J.; Wan, Z.; Zhang, F.; Park, N.-K.; Zheng, A.; Zhao, J. Evaluation and comparison of the development performances of typical free trade port zones in China. Transp. Res. Part A Policy Pract. 2018, 118, 506–526. [Google Scholar] [CrossRef]
  73. Chen, J.; Huang, T.; Xie, X.; Lee, P.T.-W.; Hua, C. Constructing Governance Framework of a Green and Smart Port. J. Mar. Sci. Eng. 2019, 7, 83. [Google Scholar] [CrossRef]
  74. Squicciarini, M.; Dernis, H.; Criscuolo, C. Measuring Patent Quality: Indicators of Technological and Economic Value. In OECD Science, Technology and Industry Working Papers; No. 2013/03; OECD Publishing: Paris, France, 2013. [Google Scholar] [CrossRef]
  75. Bougon, M.; Weick, K.; Binkhorst, D. Cognition in organizations: An analysis of the Utrecht jazz orchestra. Adm. Sci. Q. 1977, 22, 606–639. [Google Scholar] [CrossRef]
  76. Eden, C.; Ackermann, F.; Cropper, S. The analysis of cause maps. J. Manag. Stud. 1992, 29, 309–324. [Google Scholar] [CrossRef]
  77. Stach, W.; Kurgan, L.A.; Pedrycz, W. Expert-based and Computational Methods for Developing Fuzzy Cognitive Maps, In Fuzzy Cognitive Maps: Advances in Theory, Methodologies and Applications; Glykas, M., Ed.; Springer: Berlin/Heidelberg, Germany, 2010; ISBN -10: 36-42032-19-2. [Google Scholar]
  78. Onut, S.; Tuzkaya, U.R.; Torun, E. Selecting container port via a fuzzy ANP-based approach: A case study in the Marmara Region, Turkey. Transp. Policy 2011, 18, 182–193. [Google Scholar] [CrossRef]
  79. Wang, Y.J.; Han, T.C. Efficiency measurement for international container ports of Taiwan and surrounding areas by fuzzy data envelopment analysis. J. Mar. Sci. Technol. 2018, 26, 6. [Google Scholar]
  80. Eden, C. Strategic thinking with computers. Long Range Plan. 1990, 23, 35–43. [Google Scholar] [CrossRef]
  81. Eden, C.; Ackermann, F. Making Strategy: The Journey of Strategic Management; Sage: Newcastle, UK, 1998. [Google Scholar]
  82. Das, S.; Roy, B.K.; Kar, M.B.; Kar, S.; Pamučar, D. Neutrosophic fuzzy set and its application in decision making. J. Ambient. Intell. Humaniz. Comput. 2020, 11, 5017–5029. [Google Scholar] [CrossRef]
  83. Betancourt-Vázquez, A.; Leyva-Vázquez, M.; Perez-Teruel, K. Neutrosophic cognitive maps for modeling project portfolio interdependencies. Crit. Rev. 2015, 10, 40–44. [Google Scholar]
  84. Bieker, T.; Waxenberger, B. Sustainability Balanced Scorecard and Business Ethicas. Developing a Balanced Scorecard for Integrity Management. In Proceedings of the 10th Conference of the Greening of Industry Network, Göteborg, Sweden, 23–26 June 2002. [Google Scholar]
  85. Figge, F.; Hahn, T.; Schaltegger, S.; Wagner, M. Value-Based Sustainability Management with the Balanced Scorecard; Center for Sustainability Management (CSM): Lüneburg, Germany, 2001. [Google Scholar]
  86. Figge, F.; Hahn, T.; Schaltegger, S.; Wagner, M. The Sustainability Balanced Scorecard—Linking Sustainability management to Business Strategy. Bus. Strategy Environ. 2002, 11, 269–284. [Google Scholar] [CrossRef]
  87. Paraskevas, A.; Madas, M. An integrated framework of Sustainability Balanced Scorecard with neutrosophic AHP for smart port performance evaluation. In Proceedings of the 9th International Symposium and 31st National Conference on Operational Research (HELORS 2023), Athens, Greece, 29 June–July 2023. [Google Scholar]
  88. Papageorgiou, E.I.; Salmeron, J.L. A review of fuzzy cognitive maps research during the last decade. IEEE Trans. Fuzzy Syst. 2012, 21, 66–79. [Google Scholar] [CrossRef]
  89. Salmeron, J.L. Modelling grey uncertainty with fuzzy grey cognitive maps. Expert Syst. Appl. 2010, 37, 7581–7588. [Google Scholar] [CrossRef]
  90. Park, K.S.; Kim, S.H. Fuzzy cognitive maps considering time relationships. Int. J. Human-Comput. Stud. 1995, 42, 157–168. [Google Scholar] [CrossRef]
  91. Zhong, M.; Miao, C.; Shen, Z.; Feng, Y. Temporal fuzzy cognitive maps. In Proceedings of the 2008 IEEE International Conference on Fuzzy Systems (IEEE World Congress on Computational Intelligence), Hong Kong, China, 1–6 June 2008; pp. 1831–1840. [Google Scholar]
  92. Bourgani, E.; Stylios, C.D.; Manis, G.; Georgopoulos, V.C. Integrated approach for developing timed fuzzy cognitive maps. In Proceedings of the 7th IEEE International Conference Intelligent Systems IS’2014; Warsaw, Poland, 24–26 September 2014, Volume 1: Mathematical Foundations, Theory, Analyses; Angelov, K., Atanassov, L., Doukovska, M., Hadjiski, V., Jotsov, J., Kacprzyk, N., Kasabov, S., Sotirov, E., Zadrożny, S., Eds.; Springer International Publishing: Cham, Switzerland, 2015; pp. 193–204. [Google Scholar]
  93. Hagiwara, M. Extended fuzzy cognitive maps. In 1992 Proceedings IEEE International Conference on Fuzzy Systems; IEEE: Piscataway, NJ, USA, 1992; pp. 795–801. [Google Scholar]
  94. Nair, A.; Reckien, D.; van Maarseveen, M.F. Generalised fuzzy cognitive maps: Considering the time dynamics between a cause and an effect. Appl. Soft Comput. 2020, 92, 106309. [Google Scholar] [CrossRef]
  95. Poornima, S.; Pushpalatha, M. A survey on various applications of prescriptive analytics. Int. J. Intell. Netw. 2020, 1, 76–84. [Google Scholar] [CrossRef]
  96. Lepenioti, K.; Bousdekis, A.; Apostolou, D.; Mentzas, G. Prescriptive analytics: Literature review and research challenges. Int. J. Inf. Manag. 2020, 50, 57–70. [Google Scholar] [CrossRef]
  97. Forrester, J.W. Principles of Systems; Wright Allen Press: Cambridge, MA, USA, 1968. [Google Scholar]
Figure 1. A simple digraph.
Applsci 15 01981 g001
Figure 2. A simple adjacency matrix A(D).
Applsci 15 01981 g002
Figure 3. Simple neutrosophic graphs.
Applsci 15 01981 g003
Figure 4. Neutrosophic graph and its adjacency matrix [27].
Applsci 15 01981 g004
Figure 5. Algorithm for simulating the interactions of dynamic analysis in an NCM.
Applsci 15 01981 g005
Figure 6. Adjacency matrix of NCM in Figure 4.
Applsci 15 01981 g006
Figure 7. Simple NCM digraph.
Applsci 15 01981 g007
Figure 8. Adjacency matrix of NCM in Figure 7.
Applsci 15 01981 g008
Figure 9. Proposed methodology for smart port performance evaluation using NCMs.
Applsci 15 01981 g009
Figure 10. Steps for static analysis of NCM.
Applsci 15 01981 g010
Figure 11. Smart port performance dimensions.
Applsci 15 01981 g011
Figure 12. NCM of first expert’s opinion.
Applsci 15 01981 g012
Figure 13. Adjacency matrix of first expert’s opinion.
Applsci 15 01981 g013
Figure 14. NCM of second expert’s opinion.
Applsci 15 01981 g014
Figure 15. Adjacency matrix of second expert’s opinion.
Applsci 15 01981 g015
Figure 16. Steps for dynamic analysis of NCM.
Applsci 15 01981 g016
Figure 17. Algorithm for dynamic analysis of NCM within suggested framework.
Applsci 15 01981 g017
Figure 18. Adjacency matrix of first expert’s opinion.
Applsci 15 01981 g018
Figure 19. Adjacency matrix of second expert’s opinion.
Applsci 15 01981 g019
Table 1. Classification of smart port evaluation indicators.
PerspectiveEvaluation IndicatorReference
Operational efficiency (OE)Vessel turnaround time: the time taken for a ship to dock, unload/load cargo, and depart the port[51,52,53,54,55]
Dwell time: the duration cargo spends at the port, including storage and processing times[54,55]
Berth utilization: the effectiveness of berth allocation and utilization, measured as a percentage of total available time[56,57,58]
Financial (F)Revenue and profitability: financial metrics such as revenue, profit, and return on investment, e.g.,
Total revenue = revenue from port operations + revenue from ancillary services
Net profit = total revenue − total expenses
ROI = (net profit/total investment) * 100%
Profit margin = (net profit/total revenue) * 100%
Revenue growth rate = ((current year revenue − previous year revenue)/previous year revenue) * 100%
Operating expense ratio = (total operating expenses/total revenue) * 100%
[54,55,56]
Cost efficiency: cost per unit of cargo handled or cost per vessel serviced[55,56,57,58]
Technological advancement (TA)Digitalization rate: the extent to which digital technologies are integrated into port operations, e.g.,
Digitalization rate = (number of digitalized processes or operations/total number of processes or operations) * 100%
[59,60]
Automation effectiveness: impact and performance of automated systems on efficiency and accuracy, e.g.,
Automation effectiveness = ((improved efficiency + improved accuracy)/2) * 100%
[61,74]
Technology investment ROI: return on investment for technology upgrades and innovations[74]
Environmental sustainability (ES)Carbon emissions: measurement of greenhouse gas emissions from port activities, e.g.,
Emissions intensity = (total carbon emissions/total cargo handled) * 1000
[62,63,64,65]
Energy efficiency: the efficient use of energy within port operations, e.g.,
Energy efficiency ratio = total energy consumption/total cargo handled
[66]
Waste management: metrics related to waste reduction, recycling, and proper disposal, e.g.,
Waste reduction rate = ((initial waste generation rate − final waste generation rate)/initial waste generation rate) * 100%
Waste management cost per unit =
Total waste management costs/total cargo handled
[66,67]
Customer-centric (CC)Customer feedback: surveys or feedback mechanisms from port users, reflecting their satisfaction levels[68]
Service quality metrics: timeliness, accuracy, and reliability of port services, e.g.,
On-time performance (OTP) = (number of services completed on time/total number of services) * 100%,
Service reliability index (SRI) = (number of successful service instances/total number of service instances) * 100%
[69,70]
Safety and security (SS)Safety incident rate: the number of accidents or safety incidents within the port, e.g.,
Safety incident rate = (number of safety incidents/total hours worked or total operations) * 1,000,000
[71,72]
Security compliance: adherence to security protocols and regulations, e.g.,
regulatory compliance rate = (number of security regulations adhered to/total number of applicable security regulations) * 100%
[73]
Table 2. Scale of linguistic variables.
Intensity of ImportanceDefinition
(+)1.0Extreme effect
0.0No effect
(−)1.0Extremely negative effect
INot known or not identified effect
Table 3. Aggregated neutrosophic matrix.
DIMENSIONSOETAESCCSSF
OE001+I2I2
TA202221
ES010I0−2
CC−120010
SS−220−102I
F120−12I0
Table 4. Measures of centrality, outdegree and indegree.
NodeIdOd
OE05+2I
TA79
ES3+II−1
CC2+I2
SS3+3I2I−1
F2I+12+2I
Table 5. Classification of the nodes.
NodeTransmitterReceiverOrdinary
OEx
TAx
ES x
CC x
SS x
Fx
Table 6. Total centrality.
NodeTotal Centrality
OE5+2I
TA16
ES2+2I
CC4+I
SS2+5I
F3+4I
Table 7. Deneutrosophication process of the values of total centrality.
NodeTotal Centrality
OE[5, 7]
TA16
ES[2, 4]
CC[4, 5]
SS[2, 7]
F[3, 7]
Table 8. Median of the extremes values.
NodeTotal Centrality
OE6
TA16
ES3
CC4.5
SS4.5
F5
Table 9. Measures of centrality, outdegree and indegree in the first scenario.
NodeIdOdTd
OE1.25.4+2I6.6+2I
TA7.413.220.6
ES4.4+II−1.23.2+2I
CC3.4+I2.45.8+I
SS4.4+3I3I−0.83.6+6I
F3.2I+1.23.2+3.2I4.4+6.4I
Table 10. Deneutrosophication process of the values of total centrality.
NodeTotal Centrality
OE[6.6, 8.6]
TA20.6
ES[3.2, 5.2]
CC[5.8, 6.8]
SS[3.6, 9.6]
F[4.4, 10.8]
Table 11. Median of the extremes values in the first scenario.
NodeTotal Centrality
OE7.6
TA20.6
ES4.2
CC6.3
SS6.6
F7.6
Table 12. Median of the extremes values in the second scenario.
NodeTotal Centrality
OE6.1
TA11.4
ES2.8
CC3.7
SS4.4
F4.1
Table 13. Comparison table of proposed model with existing FCM-based MCDM models.
MethodProposed Method-NCMFuzzy ANPFuzzy DEA
Criteria
Ranking of alternativesYesYesYes
Handling of indeterminacyYesNoNo
Influence of one factor over other factorsYesNoNo
Dynamic behaviorYesNoNo
Stakeholder integrationYesLimitedLimited
Flexibility of applicationYesLimitedLimited
Disclaimer/Publisher’s Note: The statements, opinions and data contained in all publications are solely those of the individual author(s) and contributor(s) and not of MDPI and/or the editor(s). MDPI and/or the editor(s) disclaim responsibility for any injury to people or property resulting from any ideas, methods, instructions or products referred to in the content.

