Article

Damage Characteristics and Fracture Patterns of Sandstone Under the Coupled Effects of Blasting Stress and In Situ Stress

1
School of Civil and Resource Engineering, University of Science and Technology Beijing, Beijing 100083, China
2
Panzhihua Iron and Steel Group Mining Co., Ltd., Panzhihua 617000, China
3
School of Mechanics and Civil Engineering, China University of Mining and Technology (Beijing), Beijing 100083, China
*
Authors to whom correspondence should be addressed.
Appl. Sci. 2025, 15(4), 1819; https://doi.org/10.3390/app15041819
Submission received: 22 November 2024 / Revised: 23 December 2024 / Accepted: 17 January 2025 / Published: 11 February 2025

Abstract

:
To investigate the influence of the in situ stress on the damage characteristics and fracture patterns of sandstone, this study designed a confining pressure loading device that simulates a deep high in situ stress environment. It allows for the coupled loading of blasting stress and in situ stress on rock specimens. Based on this, experimental research on three-dimensional rock blasting was conducted. A segmental analysis method was then applied, dividing the sandstone into stemming, charge, and bottom segments to refine the study. Using CT scanning, three-dimensional reconstruction, multifractal methods, and SEM scanning technology, the damage characteristics and failure modes of sandstone under the coupling of blasting stress and in situ stress were investigated from macroscopic, mesoscopic, and microscopic perspectives. The experimental research indicates that, under in situ stress, the rock’s ability to resist the effects of blasting stress waves and blasting gas is enhanced. With increasing in situ stress, the overall damage level of sandstone specimens gradually decreases and the damage characteristics in different segments of the specimen show significant variation. Under the same in situ stress, the damage level of the sandstone specimen decreases as the axial position shifts from the stemming segment to the charge segment, and then to the bottom segment. Additionally, with increasing in situ stress, shear fractures increase, the blasting fracture surfaces become progressively rougher, and the microscopic fractures in the sandstone transition from brittle cleavage fractures to brittle–plastic quasi-cleavage fractures. In some areas, the energy is insufficient to penetrate the grain boundaries, leading to a transition from transgranular fractures to coupled fractures and intergranular fractures.

1. Introduction

With the gradual depletion of shallow mineral resources, resource development is increasingly moving deeper, and the mining of deep resources within 2000 m will gradually become a new trend in resource development [1,2]. The high in situ stress and complex geological conditions of deep rock masses significantly impact the extraction of mineral resources [3,4]. The drilling and blasting method is the primary technique for deep mining construction and mineral resource development, achieving efficient rock fragmentation through drilling holes and detonating explosives in the rock. Compared to shallow mineral resources, deep mineral resources are under high in situ stress conditions, which significantly affect the blasting fragmentation effectiveness [5]. The blasting extraction of deep rock masses requires theoretical and experimental investigations that are distinct from those of shallow rock blasting.
The blasting fracture of rock is a process of crack initiation, propagation, connection, and the formation of a network of fractures. The study of crack propagation characteristics is fundamental to understanding the mechanisms of rock blasting fractures. Researchers have made certain progress and achieved results in the study of blast-induced cracks in deep high in situ stress rock masses. Relevant experimental studies have shown that the maximum principal stress of the in situ stress field has a guiding effect on the propagation of blast-induced cracks [6]. In a two-dimensional plane, when the magnitudes of in situ stress are the same in all directions, the in situ stress field suppresses both the number and the length of blast-induced crack propagation, particularly significantly affecting the extension of radial blast-induced cracks; when the magnitudes of in situ stress are not equal, radial cracks primarily propagate along the direction of the principal stress [7]. As the principal stress differential in the in situ stress field increases, the propagation direction of the primary blast-induced crack gradually deflects toward the direction of the maximum principal stress [8]. Furthermore, Yang et al. [9] investigated the effects of in csitu stress on the directional crack propagation of a slit charge through theoretical analysis and caustics experiments. They found that the initiation and early propagation of cracks are primarily influenced by the stress distribution around the borehole and the action of the blasting gas, while the later propagation of cracks is mainly affected by the in situ stress field.
In the study of the blasting fracture mechanisms of deep rock masses, clarifying the effects of in situ stress on the propagation characteristics of blast-induced cracks is essential. Revealing the three-dimensional damage characteristics and fracture patterns will form the core content of the experimental research. The results of this research will have a direct guiding significance for engineering practice. X-ray computed tomography (CT scanning) technology has significant advantages in studying the internal microcharacteristics of rock masses, such as pore structures and fracture geometries [10]. Its advantages include continuity and non-destructiveness. Therefore, CT scanning has increasingly been applied to studying the damage characteristics of rock masses. Duan et al. [11] prepared a series of cylindrical samples for uniaxial compression tests, reconstructed three-dimensional views from CT scan images for analysis, qualitatively determined the fracture evolution process of Longmaxi Shale, and obtained the quantitative distribution of crack areas during loading. Ding et al. [12] combined CT scanning with three-dimensional reconstruction techniques to study the fracture mechanism of rock with air-decked charges and the effect of the initiation point location on rock fracture characteristics, analyzing the distribution patterns and fracture features of blasting damage in rock samples. Thus, the application of CT scanning technology plays an essential role in understanding the three-dimensional macroscopic fracture characteristics of rock. Additionally, the three-dimensional rock fracture mechanism under blasting loading requires further study and analysis from a microscopic perspective. In recent years, many researchers have utilized scanning electron microscopy (SEM) and other testing instruments to investigate the relationship between the microscopic fracture and macroscopic failure of rock under various loading conditions. Among them, Li et al. [13] were the first to use SEM to study the failure characteristics of rock fracture surfaces under different loading conditions. Zhang et al. [14] used SEM to examine the microstructure and mineral composition of shallow rocks from different geological formations, and analyzed their effects on macroscopic mechanical properties. Yang et al. [15] utilized SEM to analyze the fracture surface morphology of blast-induced cracks in marble under slit charge blasting loading, exploring the directional fracture mechanism of rock under dynamic loads from a microscopic perspective. Wang et al. [16] studied the microscopic morphological characteristics of rock at various locations during blasting using SEM, obtaining the evolution process of internal crack propagation and fracture patterns in blasted rock.
It can be seen that the research on the mechanism of blast-induced crack propagation in rock under deep high in situ stress conditions has become relatively advanced. However, the related studies mainly focus on the independent propagation of single or limited numbers of cracks. Studies on the distribution characteristics of crack networks and the damage properties under high in situ stress conditions are still relatively limited, especially in terms of experimental research on three-dimensional rock blasting. CT, SEM, and other testing technologies have been widely applied in analyzing rock blasting damage and fracture patterns. Applying these to the experimental analyses of blasting mechanisms in high in situ stress rock masses can facilitate a clearer understanding of the effects of in situ stress on rock blasting damage and fracture patterns. Based on this, this paper designs a coupled loading device capable of applying both blast-induced stress and in situ stress to three-dimensional rock specimens, simulating model experiments of rock blasting under varying in situ stress conditions. The study conducts a segmental analysis of sandstone, dividing it into stemming, charge, and bottom segments, and investigates the crack propagation and failure modes of sandstone under different in situ stress conditions from macroscopic, mesoscopic, and microscopic perspectives. At the macroscopic level, CT scanning and three-dimensional reconstruction technologies are used to obtain three-dimensional damage images of sandstone cracks under varying in situ stress conditions, providing qualitative insights into crack propagation. At the mesoscopic level, CT scanning combined with multifractal methods is employed to study the relative damage of different segments of sandstone under different stress conditions, yielding quantitative results on the damage patterns of the sandstone. At the microscopic level, scanning electron microscopy (SEM) is applied to examine the failure modes of sandstone under different in situ stress conditions, further revealing the microstructural effects of blasting.

2. Blasting Experiment Design

To study the damage characteristics and fracture patterns of rock blasting under deep high in situ stress conditions, it is first necessary to achieve the coupled loading of blast-induced stress and in situ stress. The blast-induced stress is generated by detonating explosives within the borehole of the test specimen. To simulate the in situ stress state of deep rock masses, a loading device capable of applying different confining pressures to the specimen, as shown in Figure 1, was designed. The confining pressure loading device consists of an outer frame, four spacer blocks, and two sets of jacks. The outer frame measures 250 mm on the outer edge, 180 mm on the inner edge, and has a height of 100 mm. Each spacer block is derived by taking a rectangular solid measuring 132 mm in side length and 110 mm in height, removing a cylinder of 92 mm diameter and 110 mm height from the center, and then splitting it into four equal parts along the diagonal. Considering the pressure gradient required for loading, FPY-5 jacks with a range of 5 tons, a height of 42 mm, and a stroke of 8 mm were used, along with a hydraulic pump equipped with an electronic pressure gauge to apply pressure more accurately.
The red sandstone used in the experiments was sourced from Ju County, Rizhao City, Shandong Province, China. The mineral composition of the sandstone consists of approximately 22.7% quartz (syn) and 77.3% albite low. The porosity of the sandstone is approximately 6%, and its uniaxial compressive strength is around 70 MPa. As shown in Figure 2, the red sandstone was processed into cylindrical specimens with a diameter of 90 mm and a height of 110 mm, with a borehole of a 4 mm diameter and 70 mm depth drilled in the center. As shown in Figure 3, nickel hydrazine nitrate was used as the explosive material. To ensure the uniform explosive density in the charge segment, 100 mg of explosive was first loaded into a transparent quartz tube with a length of 45 mm and an inner diameter of 2.5 mm, with a detonating cord inserted, and both ends of the quartz tube were sealed to prevent explosive leakage. The detonating cord consists of two copper wires with insulating coatings. First, one end of each copper wire was polished smooth and temporarily short-circuited. The other ends of the wires were then twisted together while ensuring that the insulating coatings remained intact. The ends of the twisted wires were then trimmed to ensure that the wire cores did not make contact, but the distance between the two ends is extremely small. This end of the copper wire was then inserted into the explosive material. Next, the quartz tube containing the explosive was placed in the borehole, and the borehole was sealed using a mixture of quartz sand and glue. Once the preparation was complete, as shown in Figure 4, the red sandstone specimen was wrapped in a film and placed in the confining pressure loading device. Afterward, the short circuit was removed, and the wires were connected to the positive and negative terminals of the detonator. Once the detonator was fully charged, it was activated, generating a voltage greater than 2500 V. The high voltage caused a spark at the ends of the wires, which, in turn, triggered the detonation of the explosive. The confining pressure loading device was then used to apply a preset pressure to the specimen to simulate the high in situ stress conditions of deep rock masses. And the explosive in the borehole was detonated using a high-voltage electric initiation method to apply blasting loading to the specimen.
To investigate the effect of the in situ stress magnitude on the rock blasting performance, five sets of blasting model experiments with different in situ stress gradients were designed, with stress levels of 0 MPa, 0.5 MPa, 1 MPa, 2 MPa, and 3 MPa. As shown in Figure 5, the specimen can be divided along the borehole axis into the following three segments: the stemming segment, the charge segment, and the bottom segment. Under the influence of the blasting loading, there are differences in the damage and fracture characteristics of the rock in these three segments. Therefore, the subsequent analysis focused on the comparative analysis of the damage characteristics and fracture patterns of the rock in the aforementioned three segments under different in situ stress conditions.

3. Analysis of Rock Damage Characteristics

CT scanning has significant advantages in studying the internal damage characteristics of rock masses. The CT device used in these experiments was a 450 KV Industrial CT Non-Destructive Testing System, with the following measurement parameters: a tube voltage of 430 kV, a tube current of 3.4 mA, 720 projections, and an exposure time of 150 ms per frame.
After blasting, CT scans were performed on the five groups of specimens, with a scan interval of 0.100 mm and 1100 slice images per specimen. The slice position at the lower surface of the blasted sandstone specimen was marked as h = 0 mm, and the upper surface was marked as h = 110 mm. The bottom segment ranged from h = 0 to 40 mm, the charge segment ranged from h = 40 to 85 mm, and the stemming segment ranged from h = 85 to 110 mm.
At the macroscopic level, CT scan images were combined with three-dimensional reconstruction technology to obtain three-dimensional images of the damage to the sandstone after blasting under different in situ stress conditions, thereby qualitatively characterizing the post-blasting damage properties of the sandstone. At the mesoscopic level, the CT scan images were integrated with multifractal methods to derive the numerical values of the relative damage to the sandstone after blasting under different in situ stress conditions, thus quantitatively characterizing the post-blasting damage properties of the sandstone.

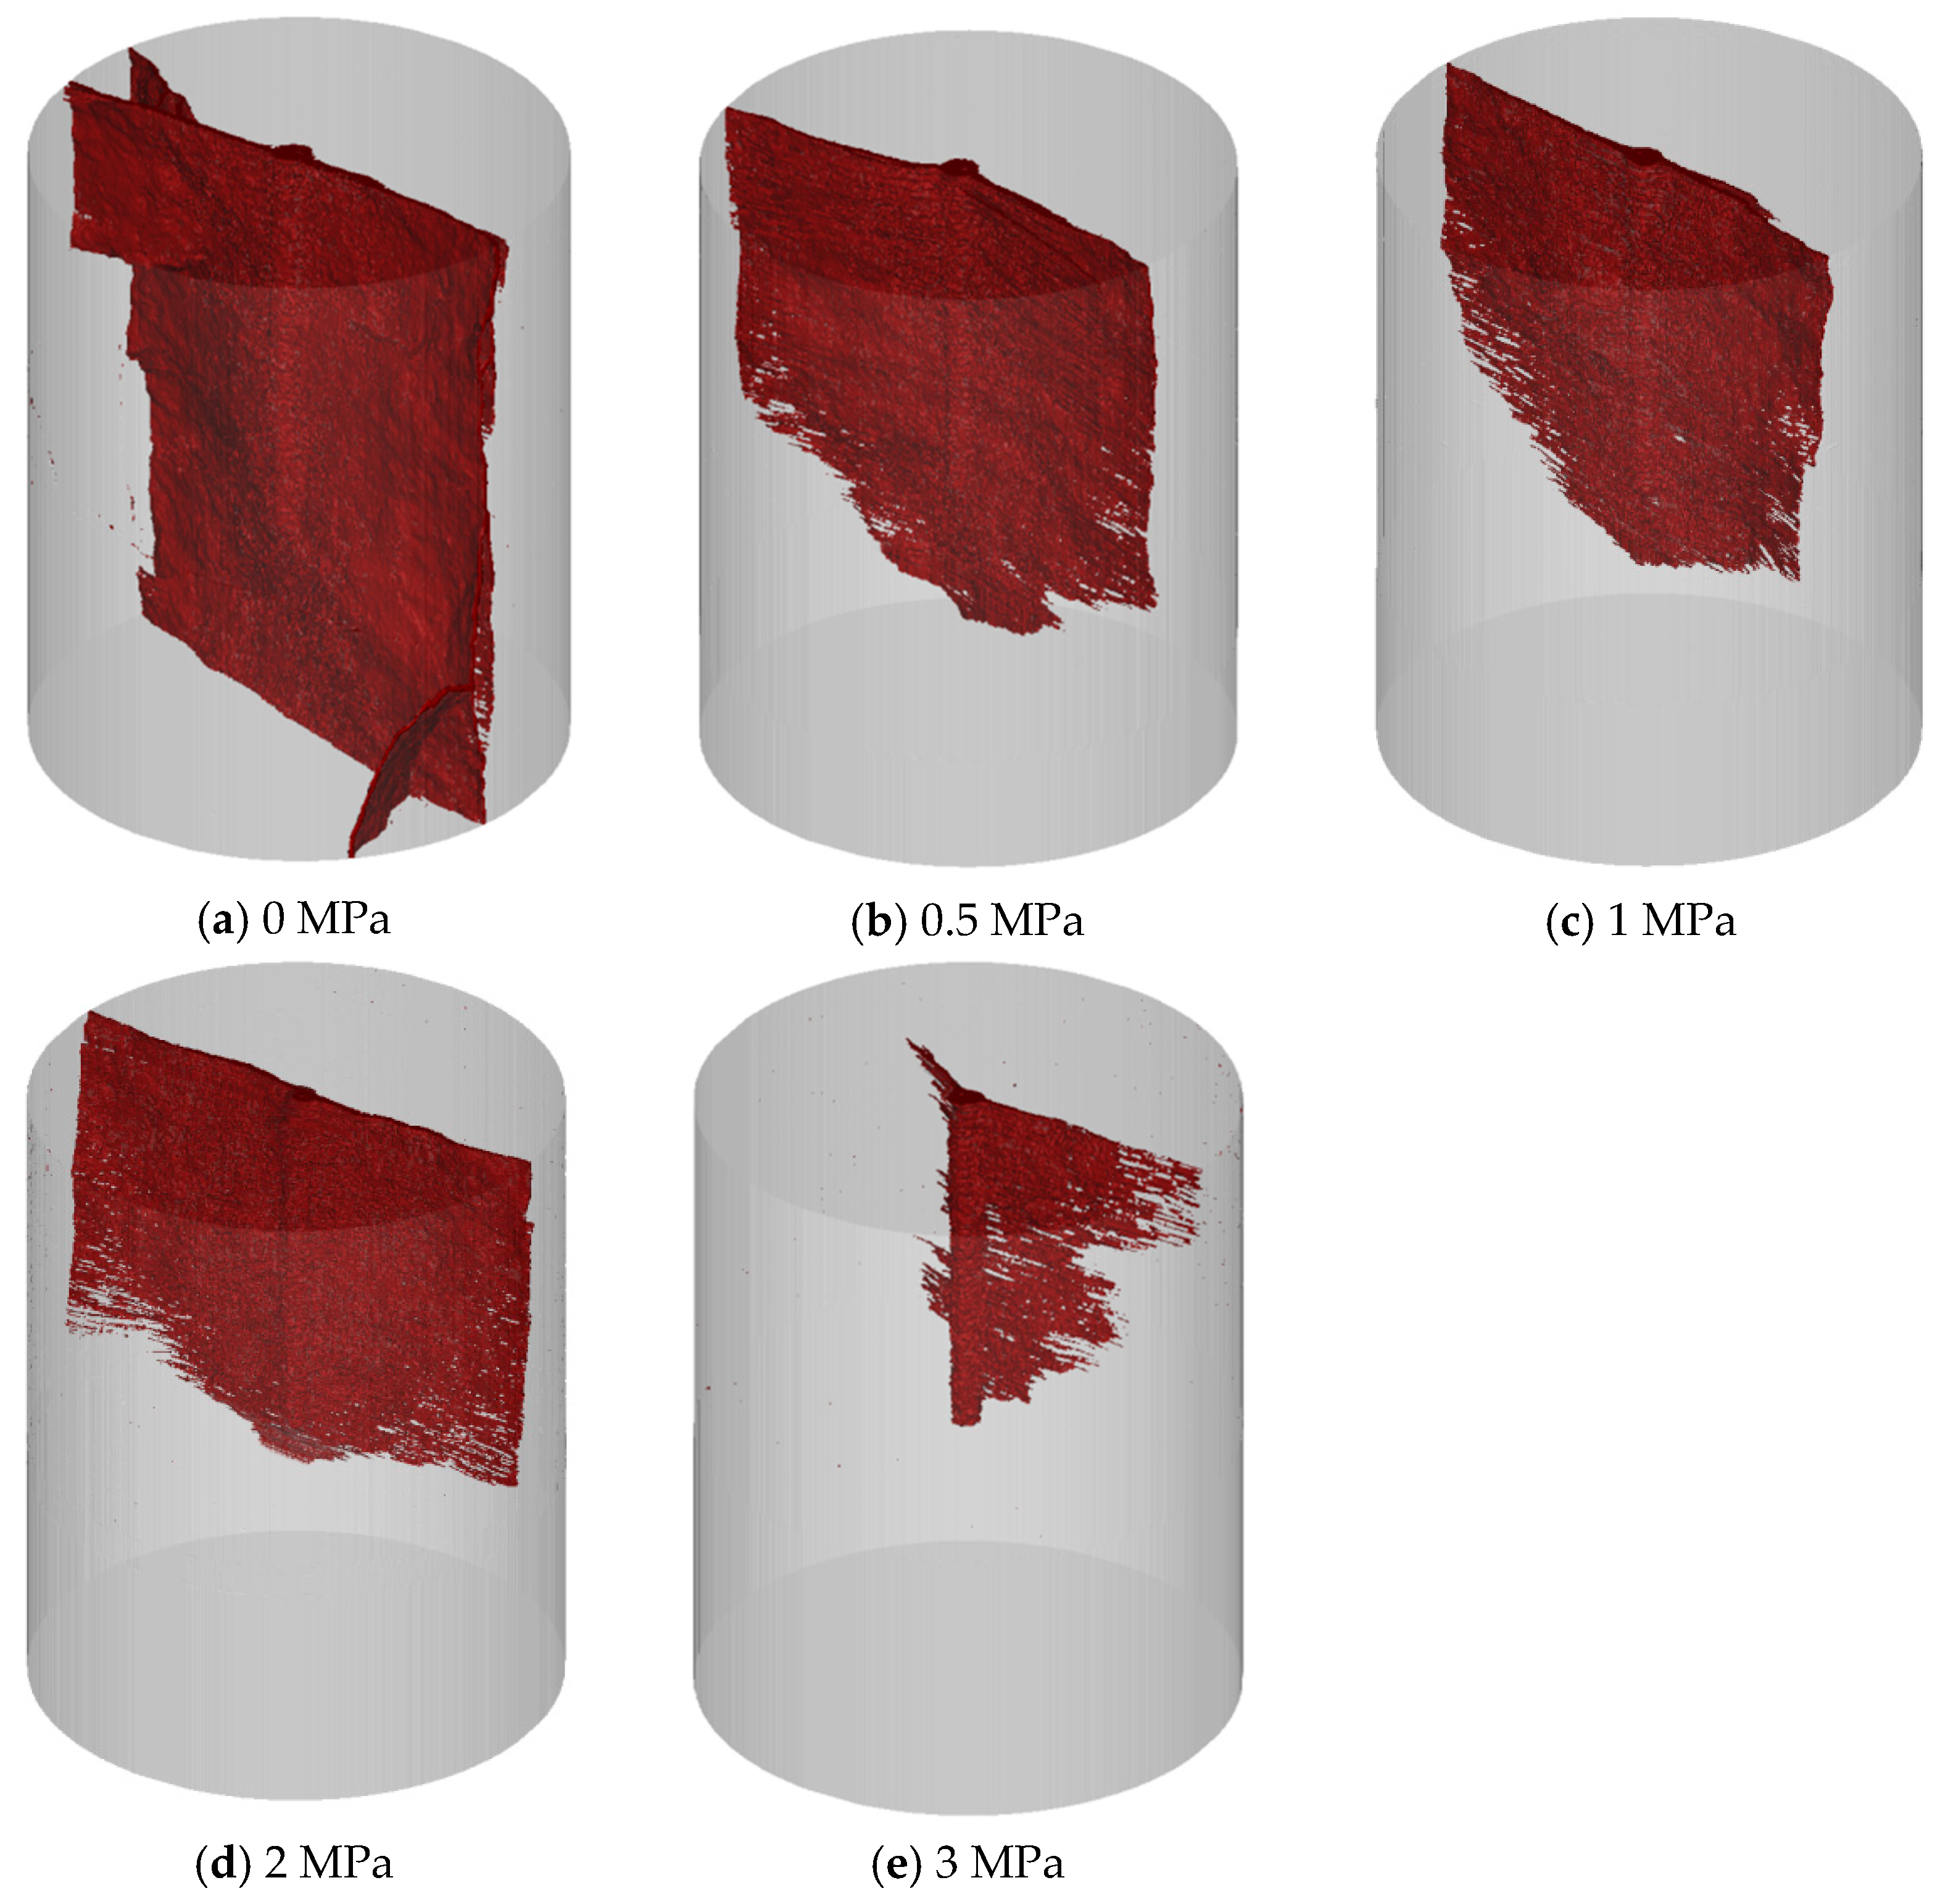
3.1. Macroscopic Analysis of Rock Damage Characteristics

The CT scan images were imported into ImageJ software (1.54-win-java8) and cropped to the appropriate size. The following steps were then applied. First, Image → Type → 8-bit was used to convert the image to 8-bit format. Then, Image → Adjust → Threshold was applied, with the threshold set to a range from 0 to 160, resulting in the rock portion appearing white and the cracks appearing black. Next, Process → Math → Subtract was used with a threshold value of 100, followed by Edit → Invert to reverse the colors. Finally, any noise in the image was manually erased to obtain the image shown in Figure 6, where the white portion represents the cracks generated by the blasting and the gray portion represents the rock mass. These images were used for the three-dimensional reconstruction.
The processed segmentation images were reconstructed into three-dimensional images using Mimics software (19.0), converting the two-dimensional images into three-dimensional models. This resulted in the three-dimensional reconstruction of the crack distribution within the specimen after blasting, as shown in Figure 7. It can be observed from the figure that, under 0 Mpa in situ stress conditions, the specimen exhibited full-penetration fractures and severe damage. Under 0.5 Mpa, 1 Mpa, and 2 Mpa in situ stress conditions, the upper part of the specimen (the stemming and charge segments) showed full-penetration fracture characteristics, while the bottom segment was not penetrated and exhibited minimal damage. Under 3 Mpa in situ stress conditions, although the upper part of the specimen fractured, no full-penetration cracks formed, and the bottom segment showed no significant damage. Overall, as in situ stress increased, the propagation and distribution of the blast-induced cracks were suppressed, and the extent of the damage and fracturing gradually decreased.

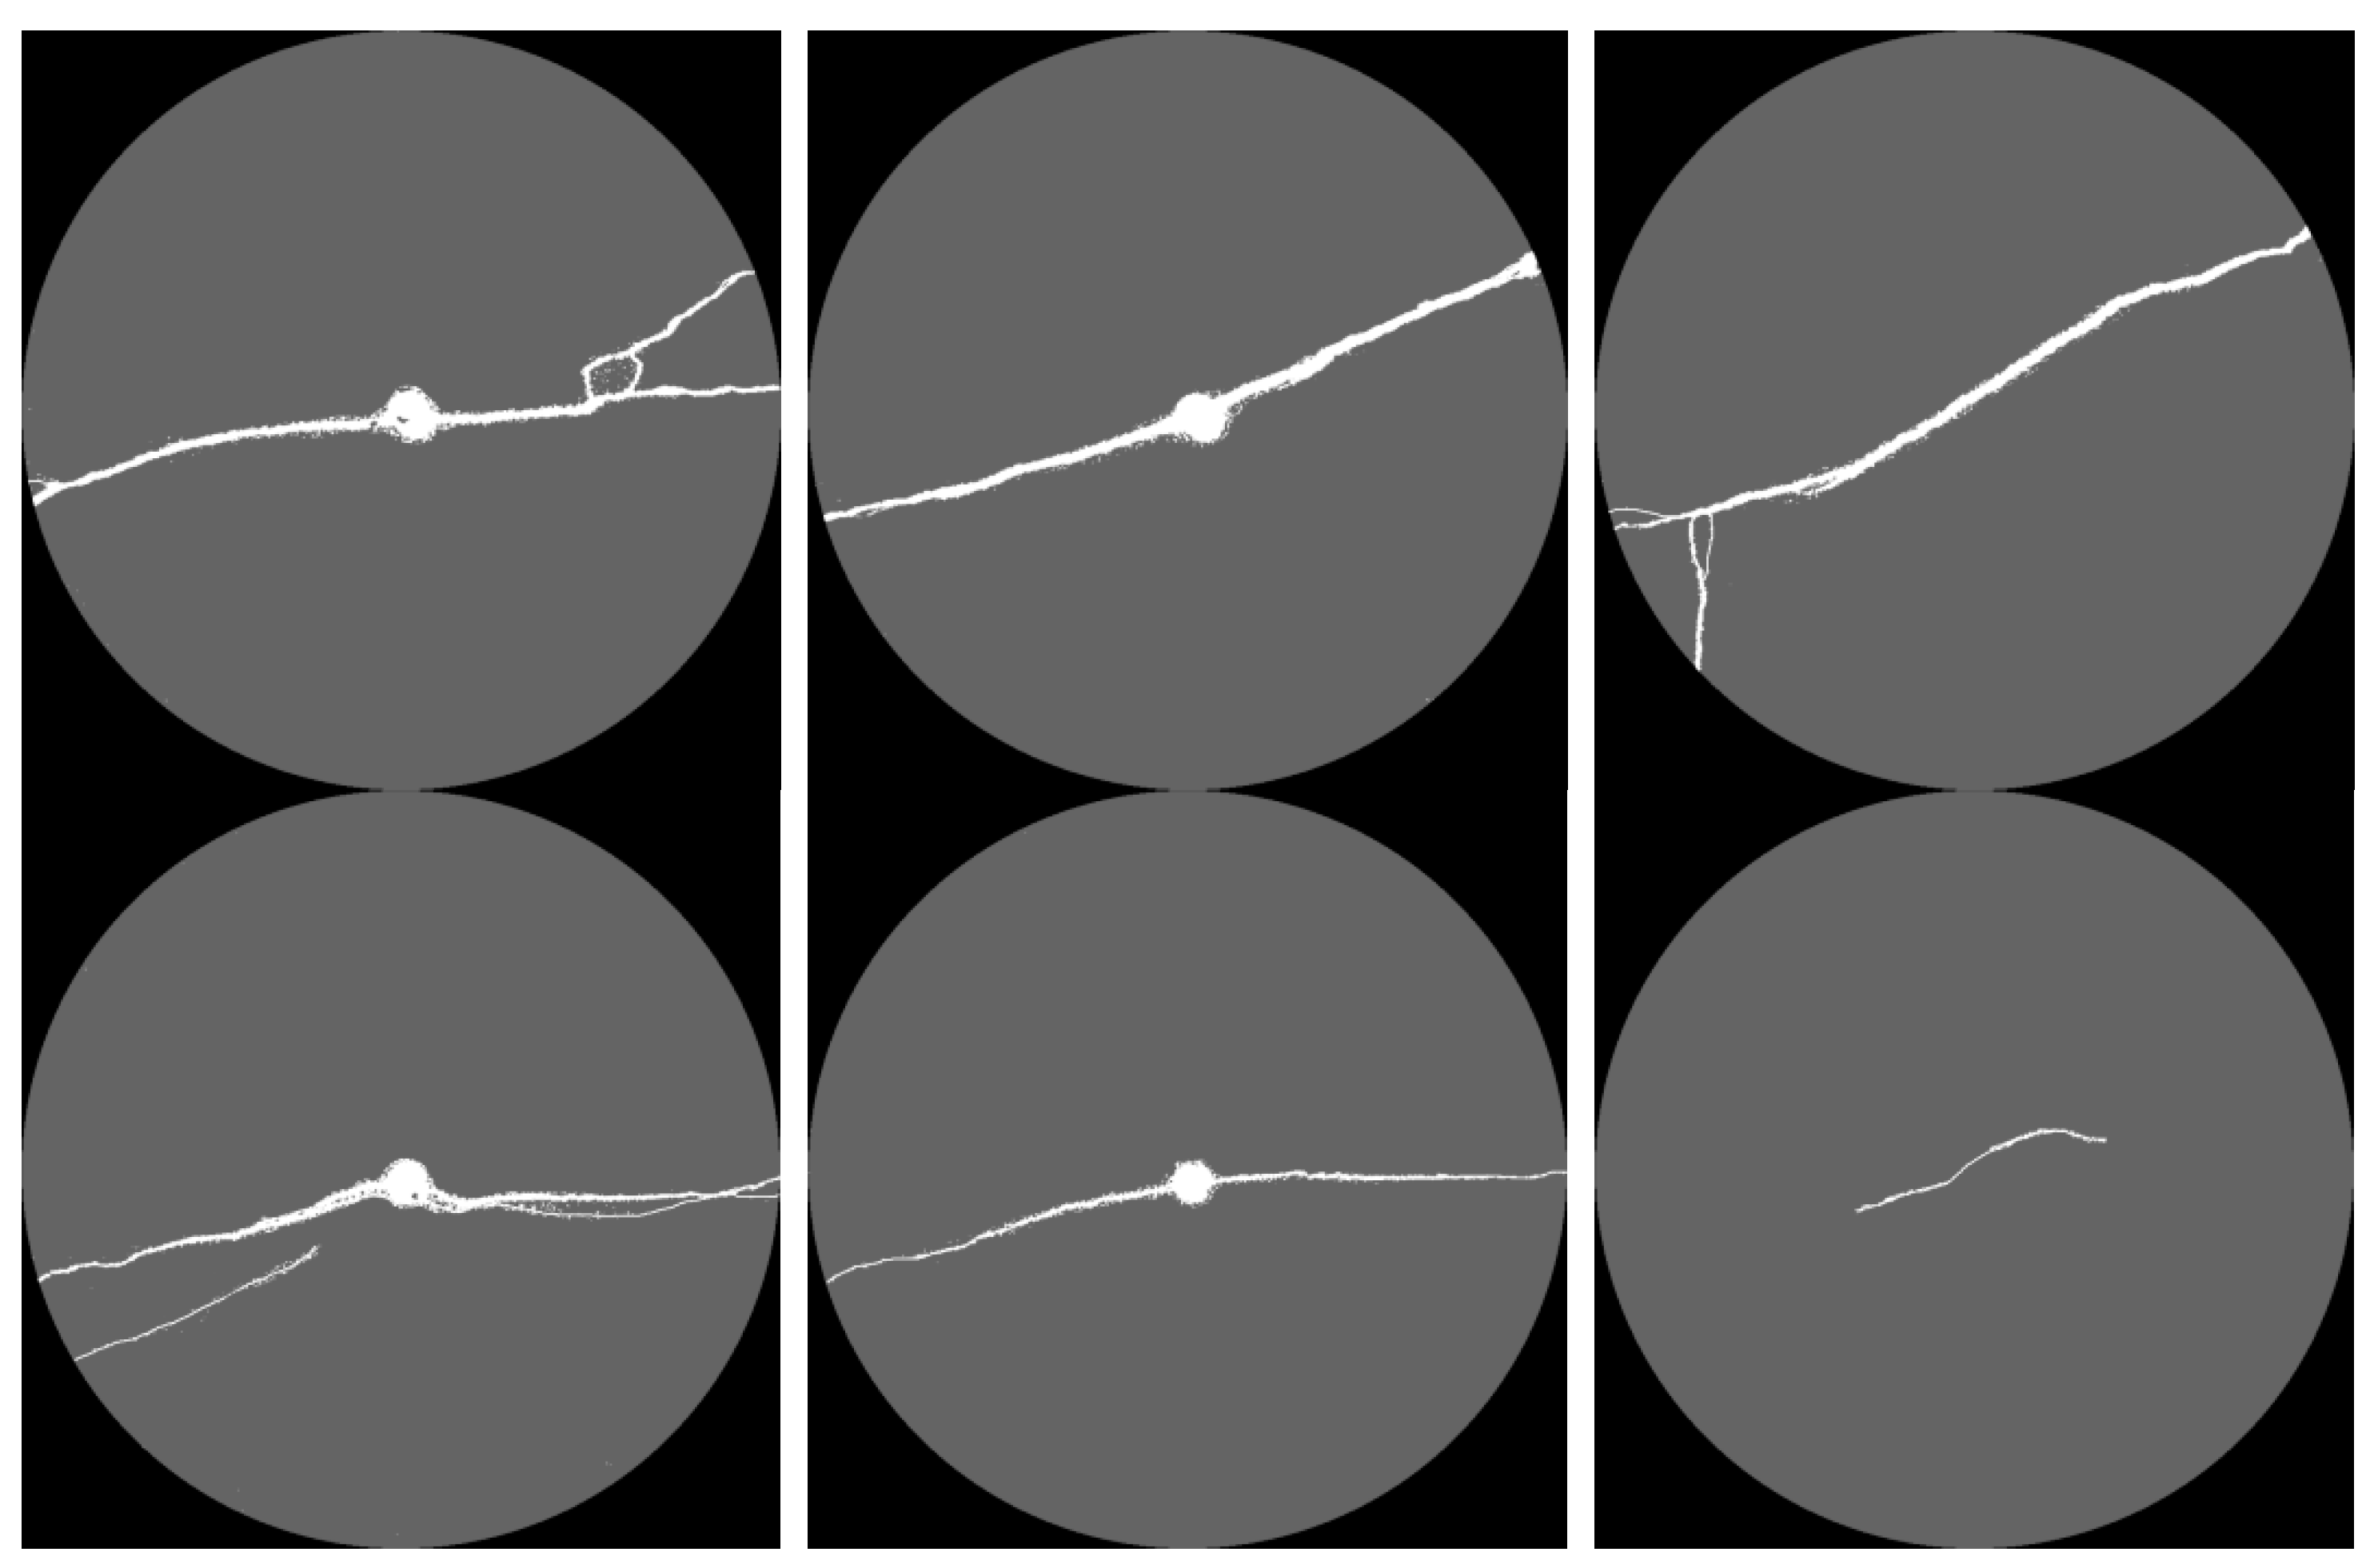
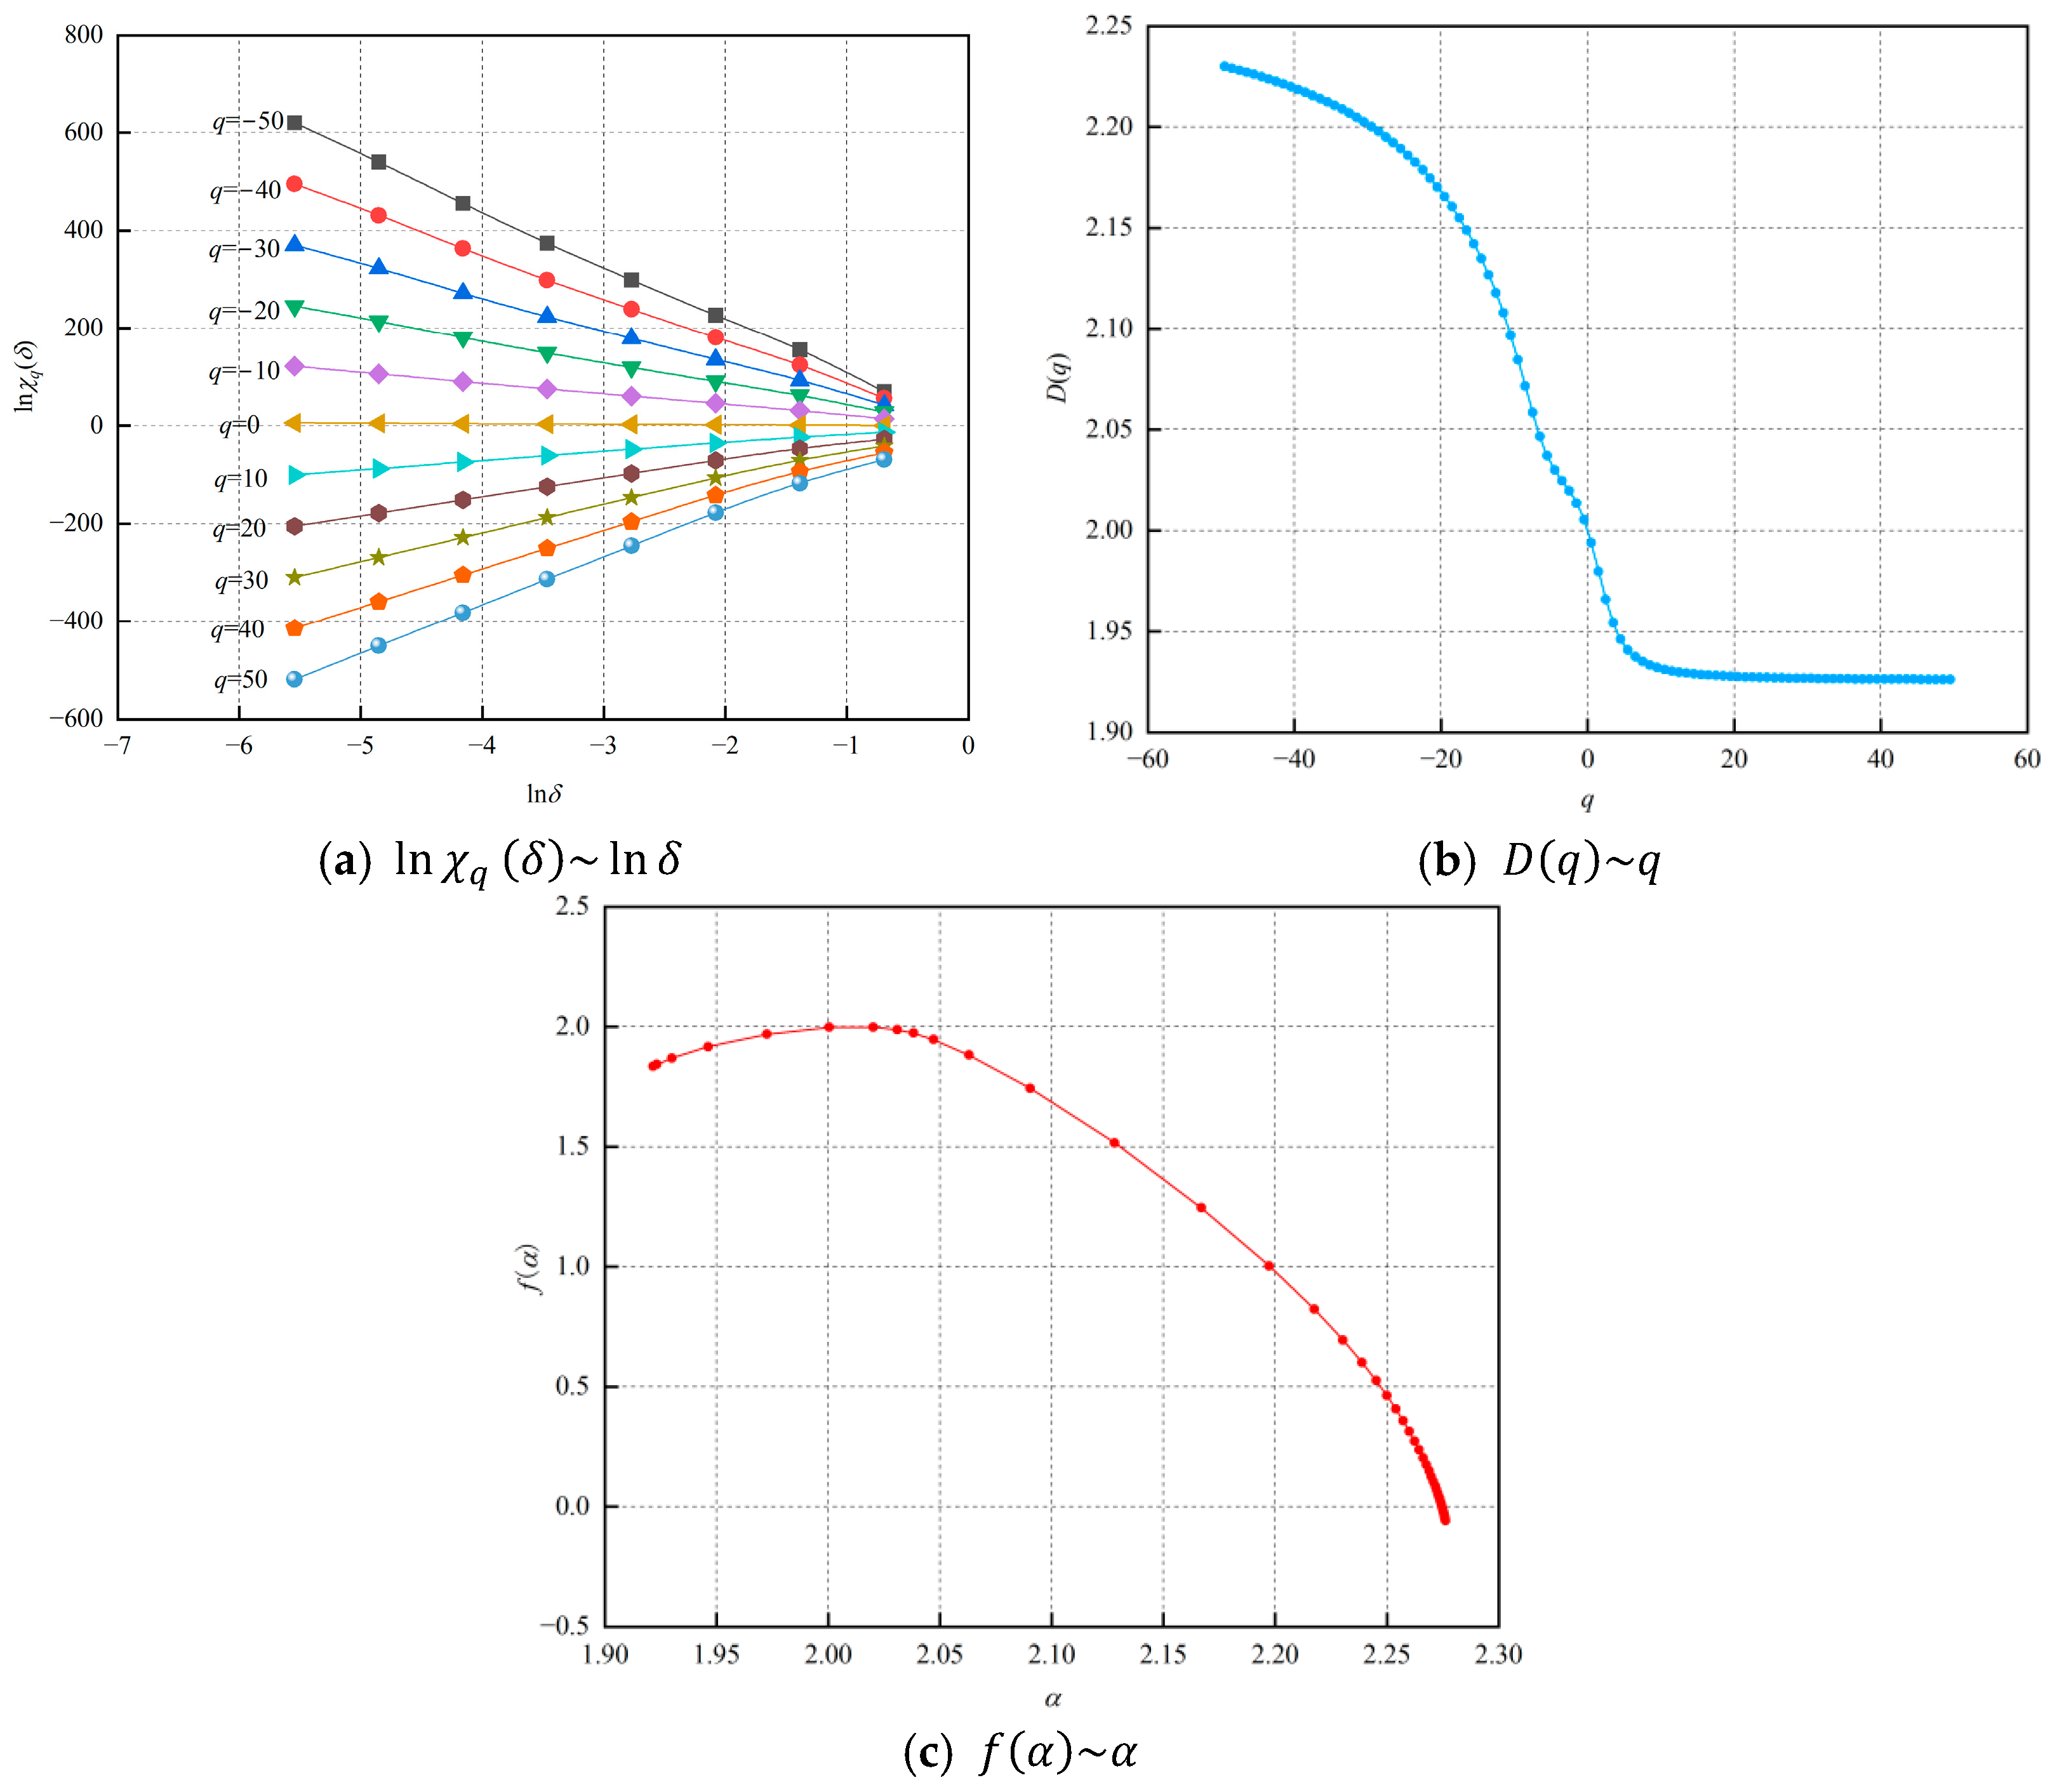
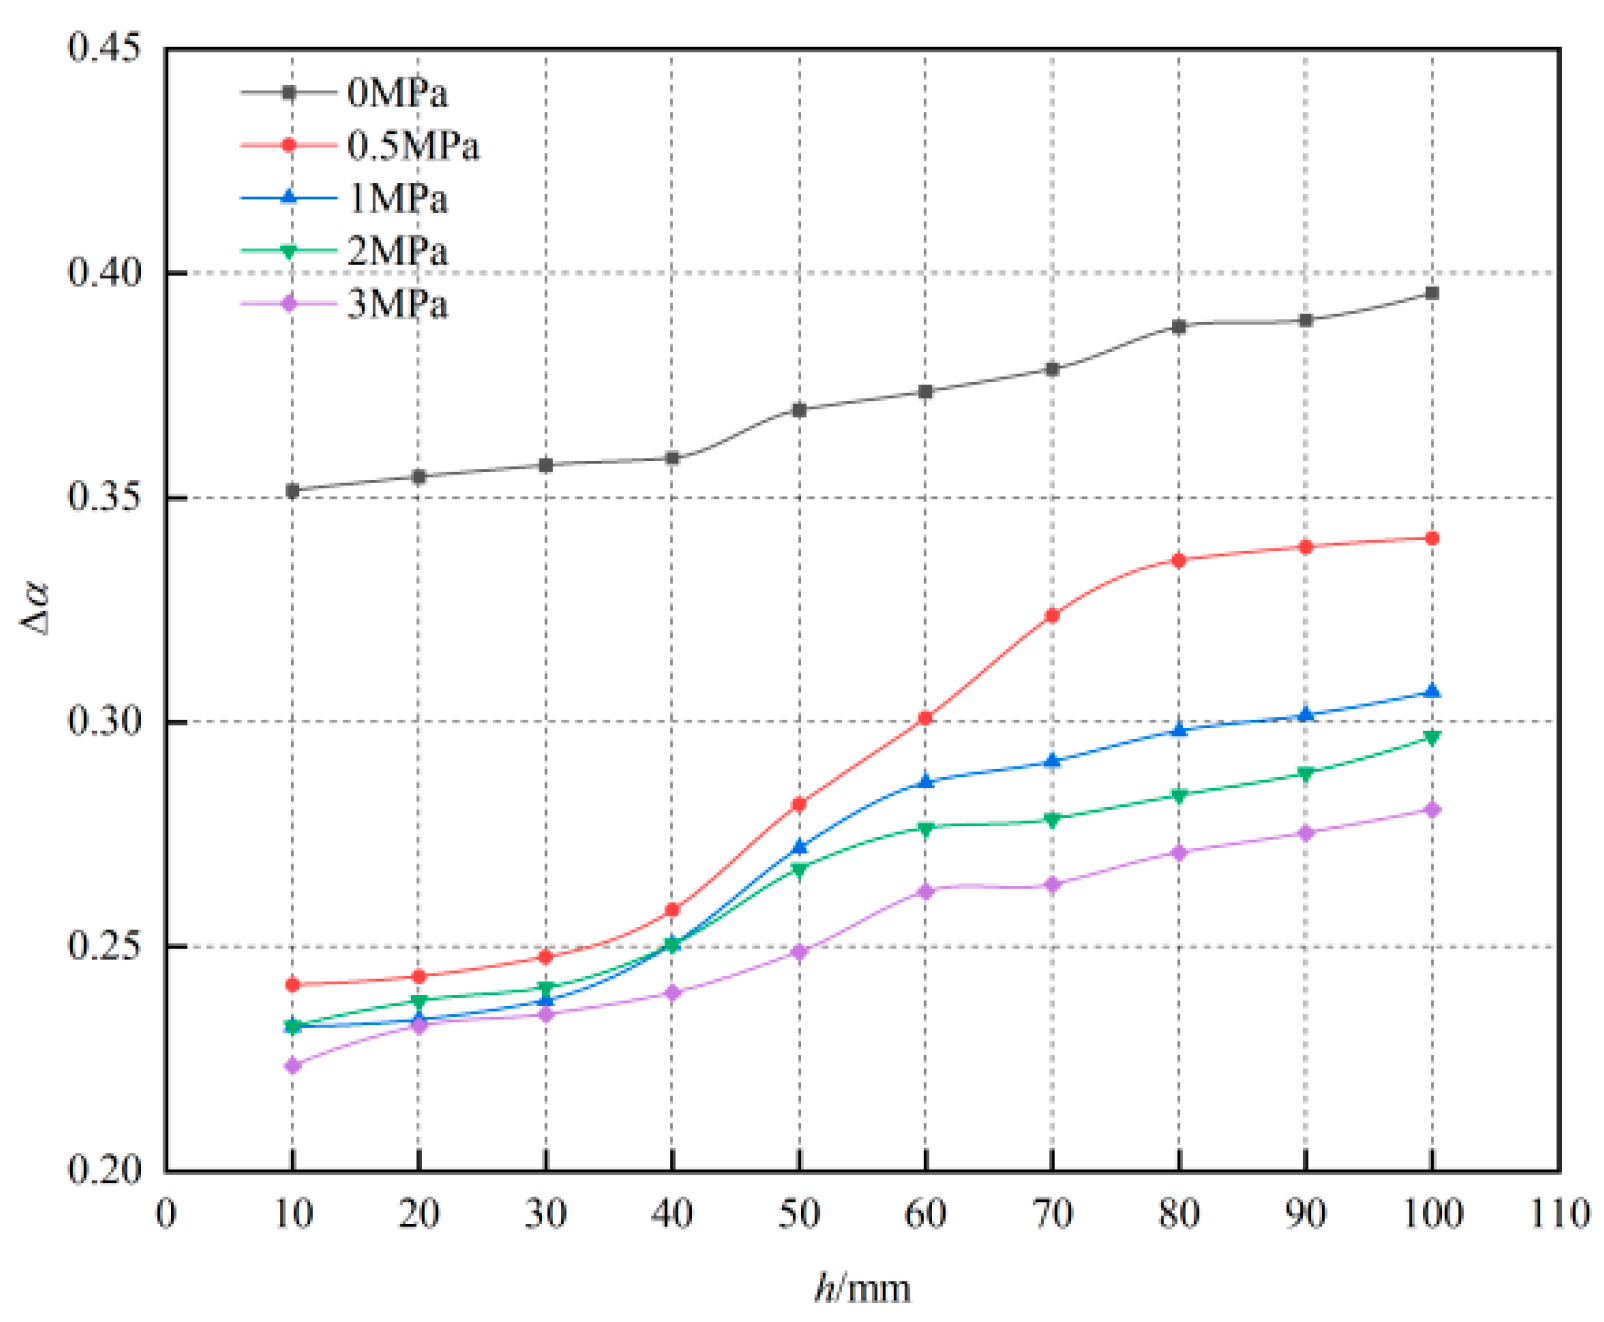
3.2. Mesoscopic Analysis of Rock Damage Characteristics

Rock masses contain both macroscopic and mesoscopic fractures [17]. Taking the CT image at h = 20 mm under 0 MPa in situ stress as an example, the CT scan images after segmentation only contain two colors, gray and white, with considerable noise, making it difficult to distinguish whether the white pixels around the cracks are noise or meso-cracks (Figure 8b). During the denoising process, there is a risk of misclassifying noise as meso-cracks or vice versa, which could affect the accuracy of the fractal calculations (Figure 8c). In contrast, using pseudo-color images enhances the visualization of the cracks and allows for a clearer distinction between meso-cracks and noise based on the color gradient (Figure 8d). This facilitates a more accurate denoising process, where noise can be easily separated from the cracks. Additionally, the variation in color intensity in the pseudo-color images reflects the differences in the material density around the cracks, providing further insight into the crack characteristics and improving the accuracy of the quantitative analyses.
The calculation of the conventional fractal dimension typically uses segmented images after denoising. However, as mentioned earlier, the denoising process of segmented images may introduce certain errors, which could result in the calculated data not accurately reflecting the actual situation. In this study, the method used is based on the multifractal dimension of grayscale images [18]. Pseudo-color images, after manual denoising, can be converted back into grayscale images while retaining the details of meso-cracks, which reduces some of the errors. Additionally, the multifractal calculation method extends the representation of complex geometric images from a single fractal dimension to multiple fractal dimensions [19]. This approach facilitates a comprehensive analysis of the macroscopic and mesoscopic damage in the rock masses, and characterizes the probability weights of the different parts of the image [20].
In conclusion, this study adopts the multifractal calculation method to investigate the mesoscopic damage characteristics of rocks. There has been substantial research on methods for calculating multifractal dimensions. This study adopts the multifractal calculation methods proposed by Rolph [21], Zhang [22], and Qiu [23] for the calculation and analysis.
First, to demonstrate that the blasting damage images of the sandstone specimens conform to multifractal theory, Figure 9 presents the multifractal spectrum of a randomly selected CT image from the stemming segment of the sandstone after blasting under 0 MPa in situ stress. If the δ in the partition function χ q δ is scale-independent, the mass function D q has a nonlinear relationship with q , and the multifractal spectrum function f α forms a unimodal curve, then the image conforms to multifractal theory.
From Figure 9a, it can be observed that ln χ q δ and ln δ exhibit a linear relationship, indicating that δ is scale-independent. From Figure 9b, the mass function is nonlinear. From Figure 9c, the multifractal spectrum function f α forms a unimodal curve. Thus, the image conforms to multifractal theory, and the blasting damage of the sandstone can be analyzed using multifractal theory.
The multifractal spectrum function f α characterizes the complexity of the fractal structure. When f α ’s slope is maximal on the left end, the corresponding horizontal coordinate is defined as the maximum fluctuation singularity index α m a x . When f α ’s slope is minimal on the right end, the corresponding horizontal coordinate is defined as the minimum fluctuation singularity index α m i n . The width of the multifractal spectrum Δ α , defined as the difference between α m i n and α m a x , represents the curve’s opening size and quantitatively characterizes the heterogeneity of the probability measure of the fractal structure. The larger the value of Δ α , the more pronounced the multifractal characteristics of the image, and the greater the heterogeneity of the probability measure.
Figure 10 shows the multifractal spectra of CT scan images for the different slice positions of the sandstone after blasting under 0 MPa in situ stress. Slice images were taken at h = 10 mm, h = 20 mm, h = 30 mm, …, h = 100 mm. The difference between the x-coordinates of α at the two ends represents Δ α , which can be used to characterize the damage of the sandstone specimens. The larger the value of Δ α , the greater the relative damage.
Using the aforementioned method, Δ α values at different positions of sandstone after blasting under various in situ stress conditions were calculated, resulting in the curves of Δ α variation with slice positions under different in situ stress conditions, as shown in the figure below.
Table 1 lists the Δ α values at different slice positions under various in situ stress conditions. From Table 1 and Figure 11, it can be seen that the slice position significantly affects the blasting damage. Regardless of the in situ stress, Δ α reaches its maximum value at h = 100 mm (located in the stemming segment), indicating the highest damage, and its minimum value at h = 10 mm (located at the bottom segment), indicating the lowest damage. Under zero in situ stress, Δ α decreases from 0.3956 at h = 100 mm (the stemming segment) to 0.3736 at h = 60 mm (the charge segment), and finally to 0.3516 at h = 10 mm (the bottom segment). Under 0.5 MPa in situ stress, Δ α decreases from 0.3410 at h = 100 mm to 0.3010 at h = 60 mm, and finally to 0.2415 at h = 10 mm. Similarly, under 1 MPa in situ stress, Δ α decreases from 0.3067 to 0.2865, and finally to 0.2322. Under 2 MPa in situ stress, Δ α decreases from 0.2967 to 0.2764, and finally to 0.2322. Under 3 MPa in situ stress, Δ α decreases from 0.2806 to 0.2622, and finally to 0.2235.
The curves of Δ α at different slice positions under varying in situ stress conditions are shown below. From Table 1 and Figure 12, it is evident that the in situ stress significantly affects the blasting damage. For the charge segment and stemming segment, Δ α for different specimens decreases with increasing in situ stress, indicating that a higher in situ stress results in less damage. At the bottom segment, h = 20 mm, as the in situ stress increases from 0 MPa to 3 MPa, Δ α decreases from 0.3546 to 0.2323. At the bottom segment, h = 40 mm, as the in situ stress increases from 0 MPa to 3 MPa, Δ α decreases from 0.3588 to 0.2398. Similarly, at h = 60 mm in the charge segment, Δ α decreases from 0.3736 to 0.2622. At h = 80 mm in the charge segment, Δ α decreases from 0.3881 to 0.2710. At h = 100 mm in the stemming segment, Δ α decreases from 0.3956 to 0.2806. Under in situ stress conditions of 1 MPa, 2 MPa, and 3 MPa, the Δ α values at h = 10 mm, h = 20 mm, and h = 30 mm are very close and do not decrease with increasing in situ stress. This is primarily because, under these in situ stress conditions, the rock in the range of h = 0~30 mm (located at the bottom segment) does not exhibit significant macroscopic damage caused by blasting. The differences in Δ α values are mostly attributed to the initial damage of the rock or errors in the CT scanning.
Under the action of blasting loading, rock forms a crushed zone, a fractured zone, and an elastic vibration zone extending outward from the borehole. The development and connectivity of the fractured zone leads to macroscopic rock failure. Under in situ stress, the rock’s ability to resist the effects of blasting stress waves and blasting gas is enhanced. Therefore, in the experiments, the overall damage level of the sandstone specimens gradually decreases with increasing in situ stress. Additionally, the experiment uses hole-bottom blasting, with a shorter stemming segment. Due to the reflection of blasting stress waves [24], in the same sandstone specimen, the damage level is the highest in the stemming segment, followed by the charge segment, and the lowest in the bottom segment. With increasing in situ stress, the damage levels in all three segments gradually decrease, and the cracks in the bottom segment disappear first, thus maintaining better integrity.

4. Analysis of Rock Fracture Patterns

4.1. Crack Fracture Morphology

The macroscopic fracture of rock is closely related to its internal micro-defects and microstructure. By conducting a microanalysis of the fracture surfaces, the relationship between the rock fracture, morphology, and microstructure can be studied, thus explaining the formation of defects and the composition of the microstructure. This analysis of the microscopic mechanisms of rock fracture ultimately builds a bridge between the understanding of microscopic damage mechanisms and macroscopic fracture analysis, carrying profound theoretical significance and practical value [19]. Scanning electron microscopy (SEM) is an essential method and tool for investigating the morphology of rock fracture surfaces at the micro-scale. Under a 3 MPa in situ stress condition, the fracture surfaces of the sandstone specimens post-blasting were not clear, making the SEM analysis of the fracture morphology unsuitable. Therefore, the fracture morphology analysis was only conducted on sandstone specimens blasted under in situ stress conditions of 0 MPa, 0.5 MPa, 1 MPa, and 2 MPa. Specifically, the SEM samples in the shape of 10 mm square by 6 mm thick rectangular blocks were cut from positions approximately 20 mm from the borehole center in the stemming, charge, and bottom segments of each sandstone specimen group. The selected SEM samples were cleaned, gold-coated, and prepared for electron microscopy observation. However, due to the absence of clear fracture surfaces at the corresponding positions in the bottom segments of the sandstone specimens blasted under 1 MPa and 2 MPa in situ stress conditions, no sampling analysis was conducted for these conditions.
By performing electron microscope scanning on the selected SEM samples, the SEM images of the fracture morphologies were obtained, and the representative images were analyzed as follows. The fracture morphology of different segments of sandstone specimens after blasting under 0 MPa in situ stress is shown in Figure 13, Figure 14 and Figure 15. The fracture morphology in the stemming segment exhibited stepped patterns, mist zone patterns, herringbone patterns, and river patterns. In addition to having similar morphologies as the stemming segment, the charge segment also displayed parallel slip patterns, serpentine slip patterns, and dimple patterns. The fracture morphology of the bottom segment was essentially the same as that of the charge segment, but coupled fractures with both intergranular and transgranular cracking were observed in the bottom segment.
The fracture morphology of different segments of the sandstone specimens after blasting under 0.5 MPa in situ stress is shown in Figure 16, Figure 17 and Figure 18. The fracture surface in the stemming segment showed stepped patterns, mist zone patterns, dimple patterns, and slip patterns. In the charge segment, in addition to the aforementioned morphologies, partial coupled fractures were observed. Due to the presence of developed layered planes within the sandstone, which are relatively weak between layers, and the application of in situ stress, an imbalance between the vertical and horizontal stresses occurred, causing interlayer tearing during the crack propagation, resulting in layered tearing. The fracture morphology types in the bottom segment were not significantly different from those in the charge segment, but intergranular fractures were observed.
The fracture morphology of the stemming segment of the sandstone specimen after blasting under 1 MPa in situ stress is shown in Figure 19, displaying intergranular and coupled fractures, rough stepped patterns, dimple patterns, mist zone patterns, slip patterns, and layered tearing. Based on these types of morphologies, the fracture surface of the charge segment became increasingly uneven, with numerous irregular particles appearing, and the transgranular fractures were largely replaced by intergranular and coupled fractures.
The fracture morphology of the stemming segment of the sandstone specimen after blasting under 2 MPa in situ stress is shown in Figure 20, featuring rough stepped patterns with slip patterns, layered tearing, dimple patterns, mist zone patterns, intergranular fractures, and coupled fractures. The fracture morphology of the charge segment was similar to that of the stemming segment, but the occurrence of dimple patterns increased, indicating a transition from brittle fracture to brittle–plastic fracture, and the probability of observing intergranular and coupled fractures increased in the SEM images.

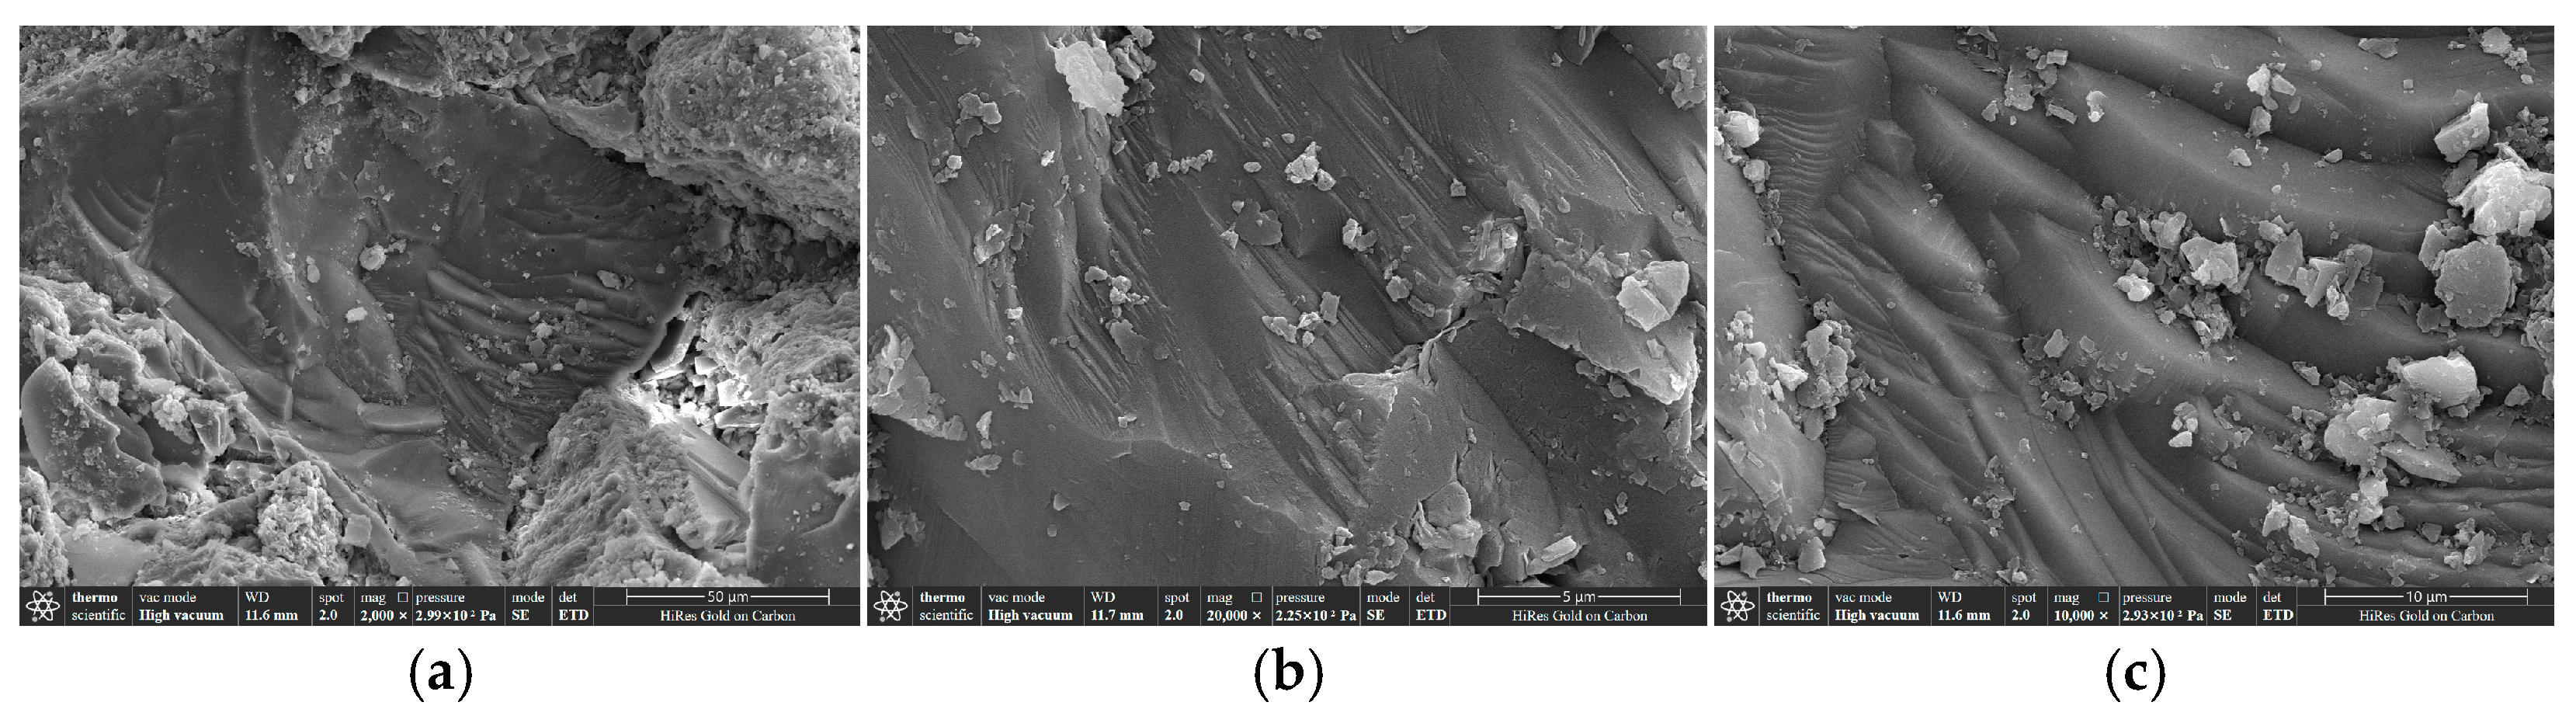
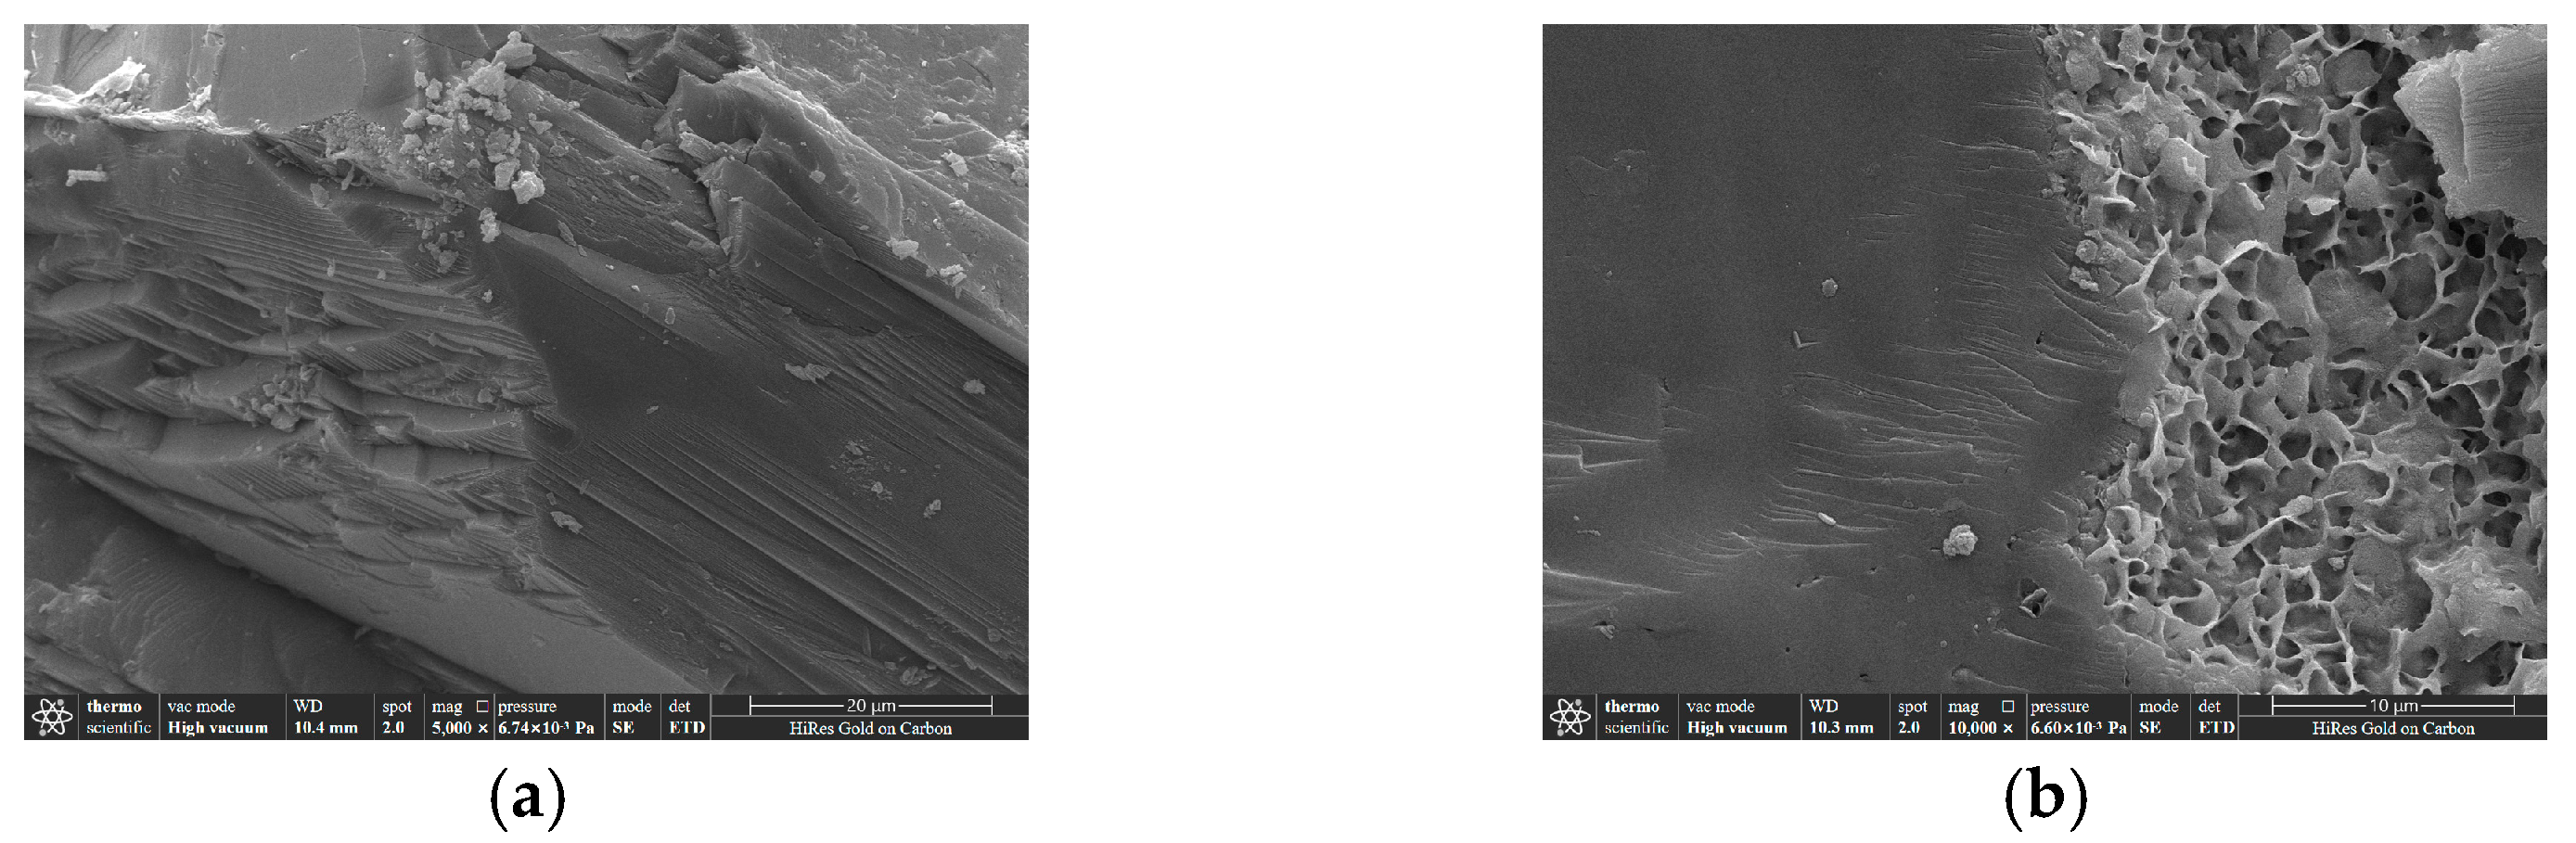
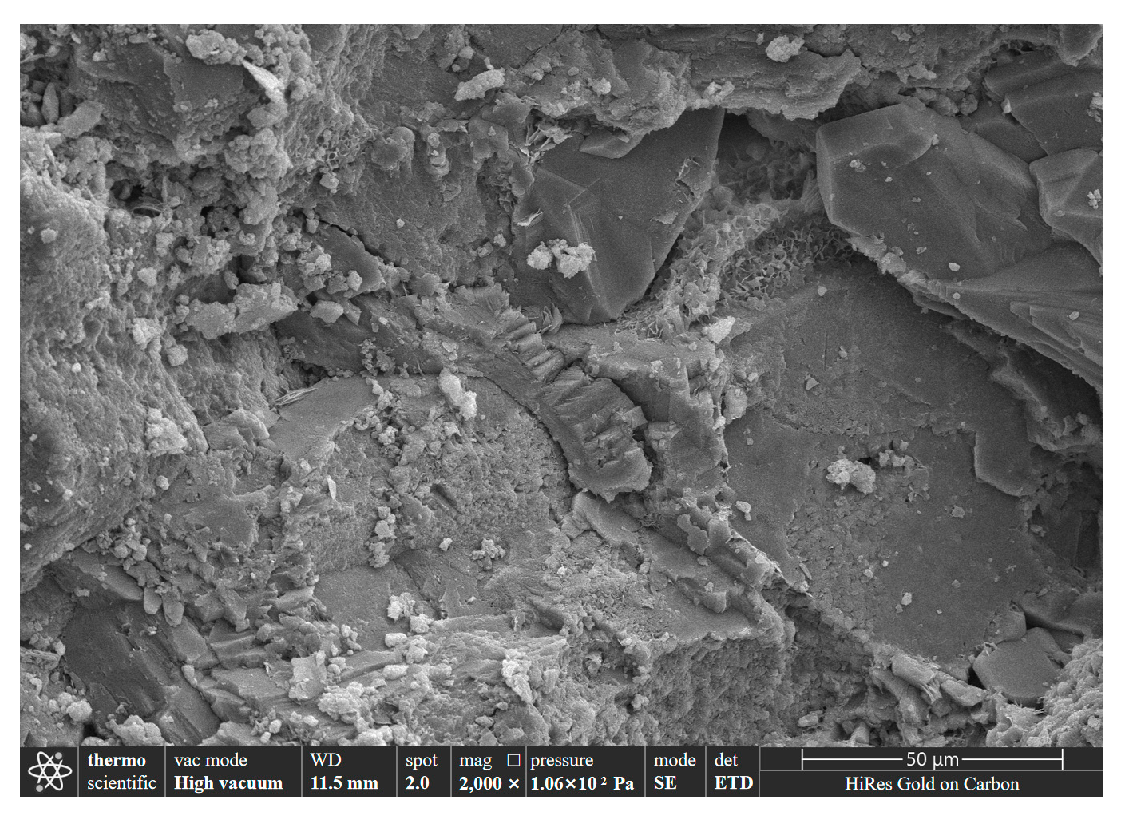
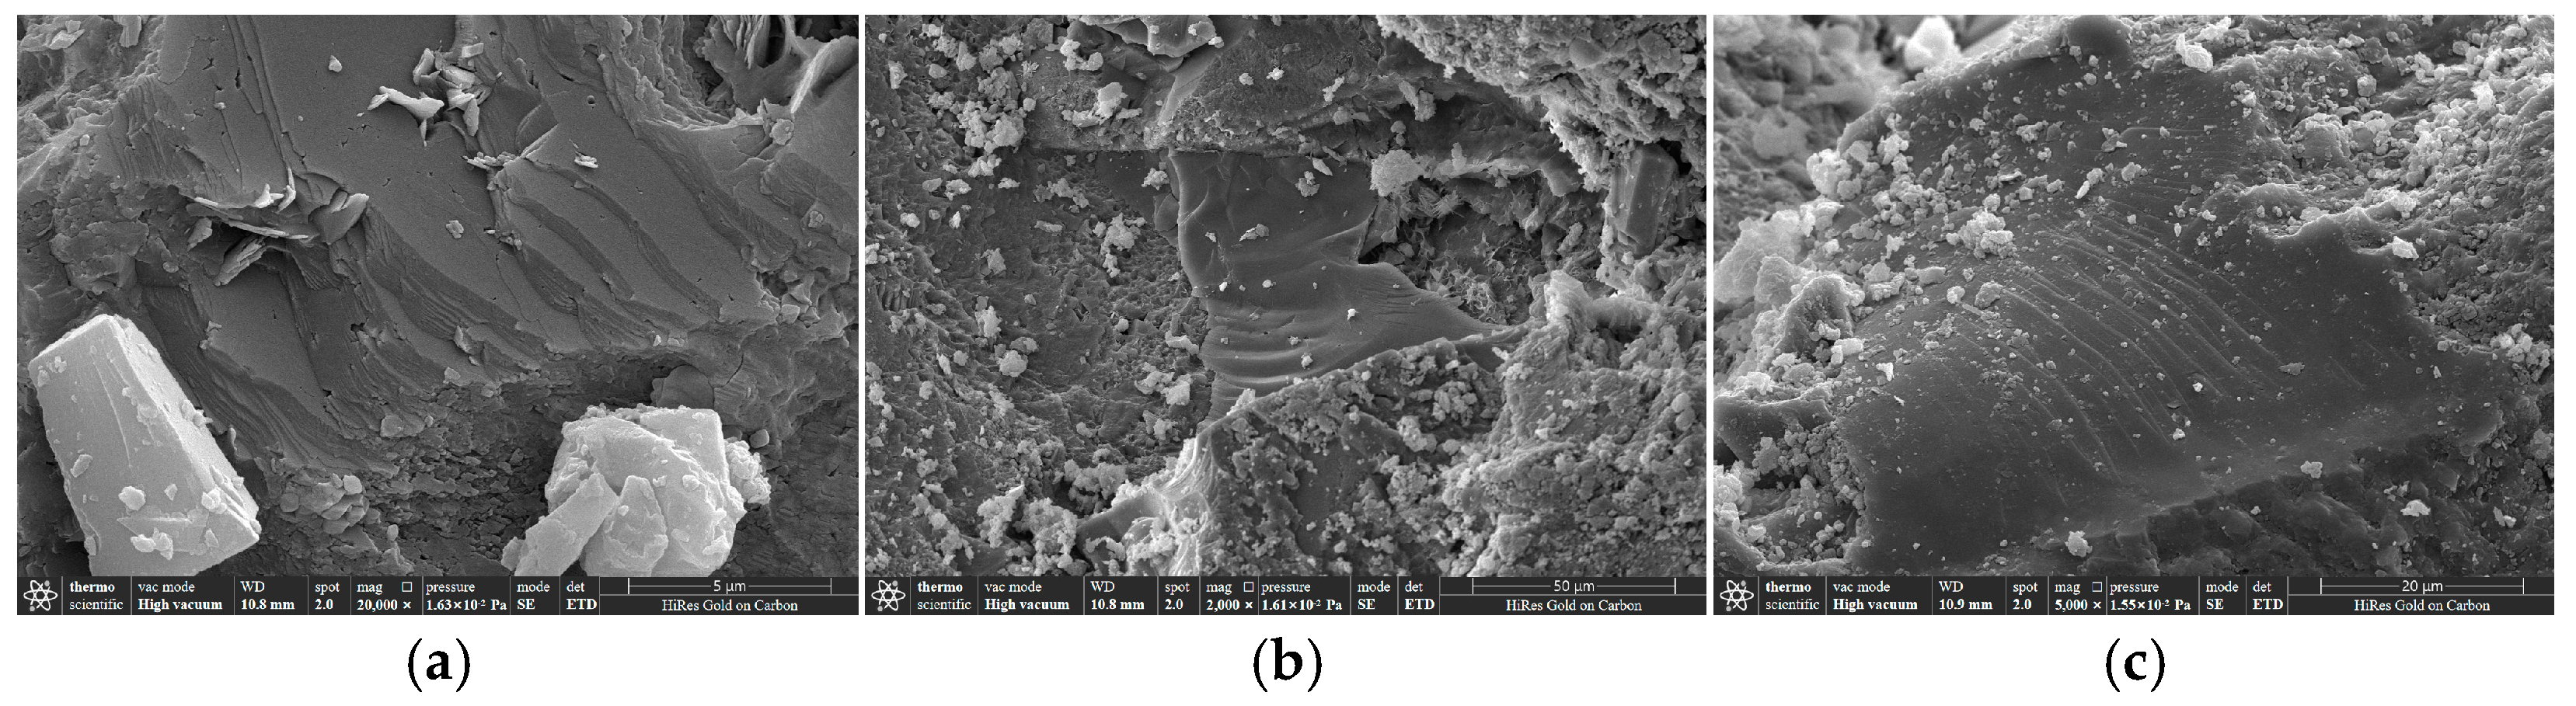
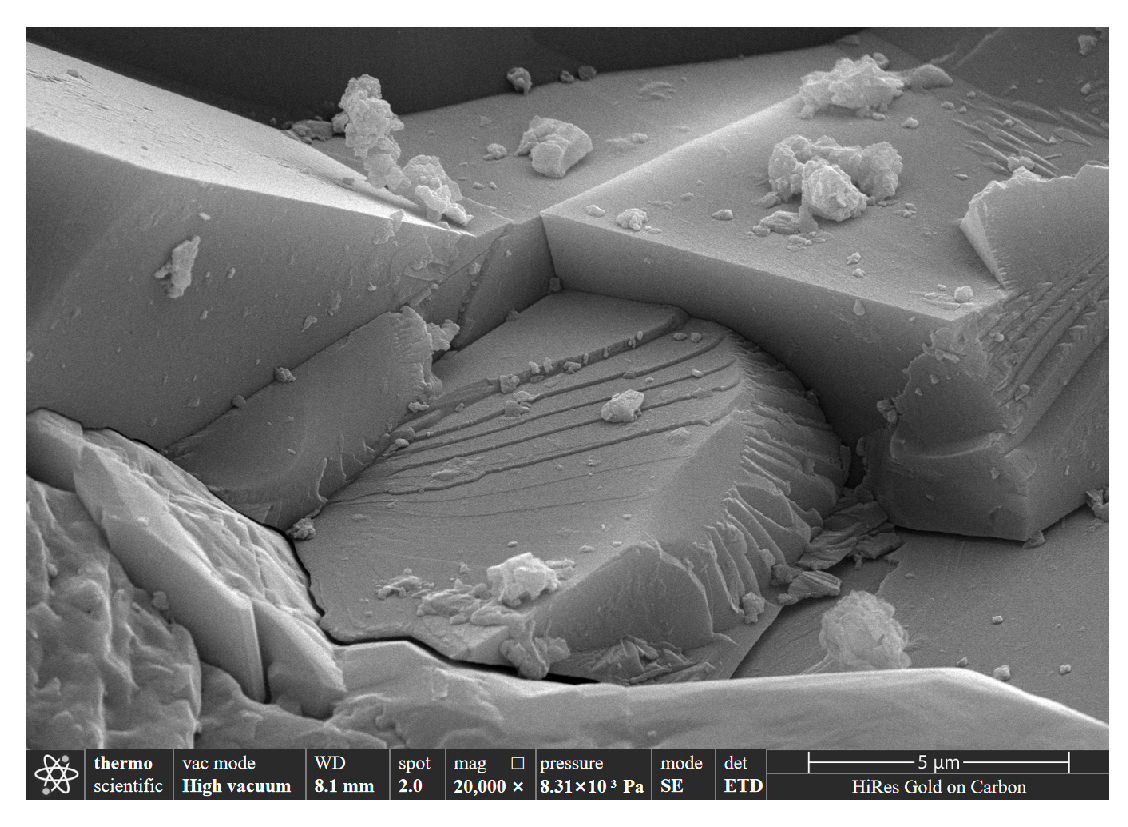
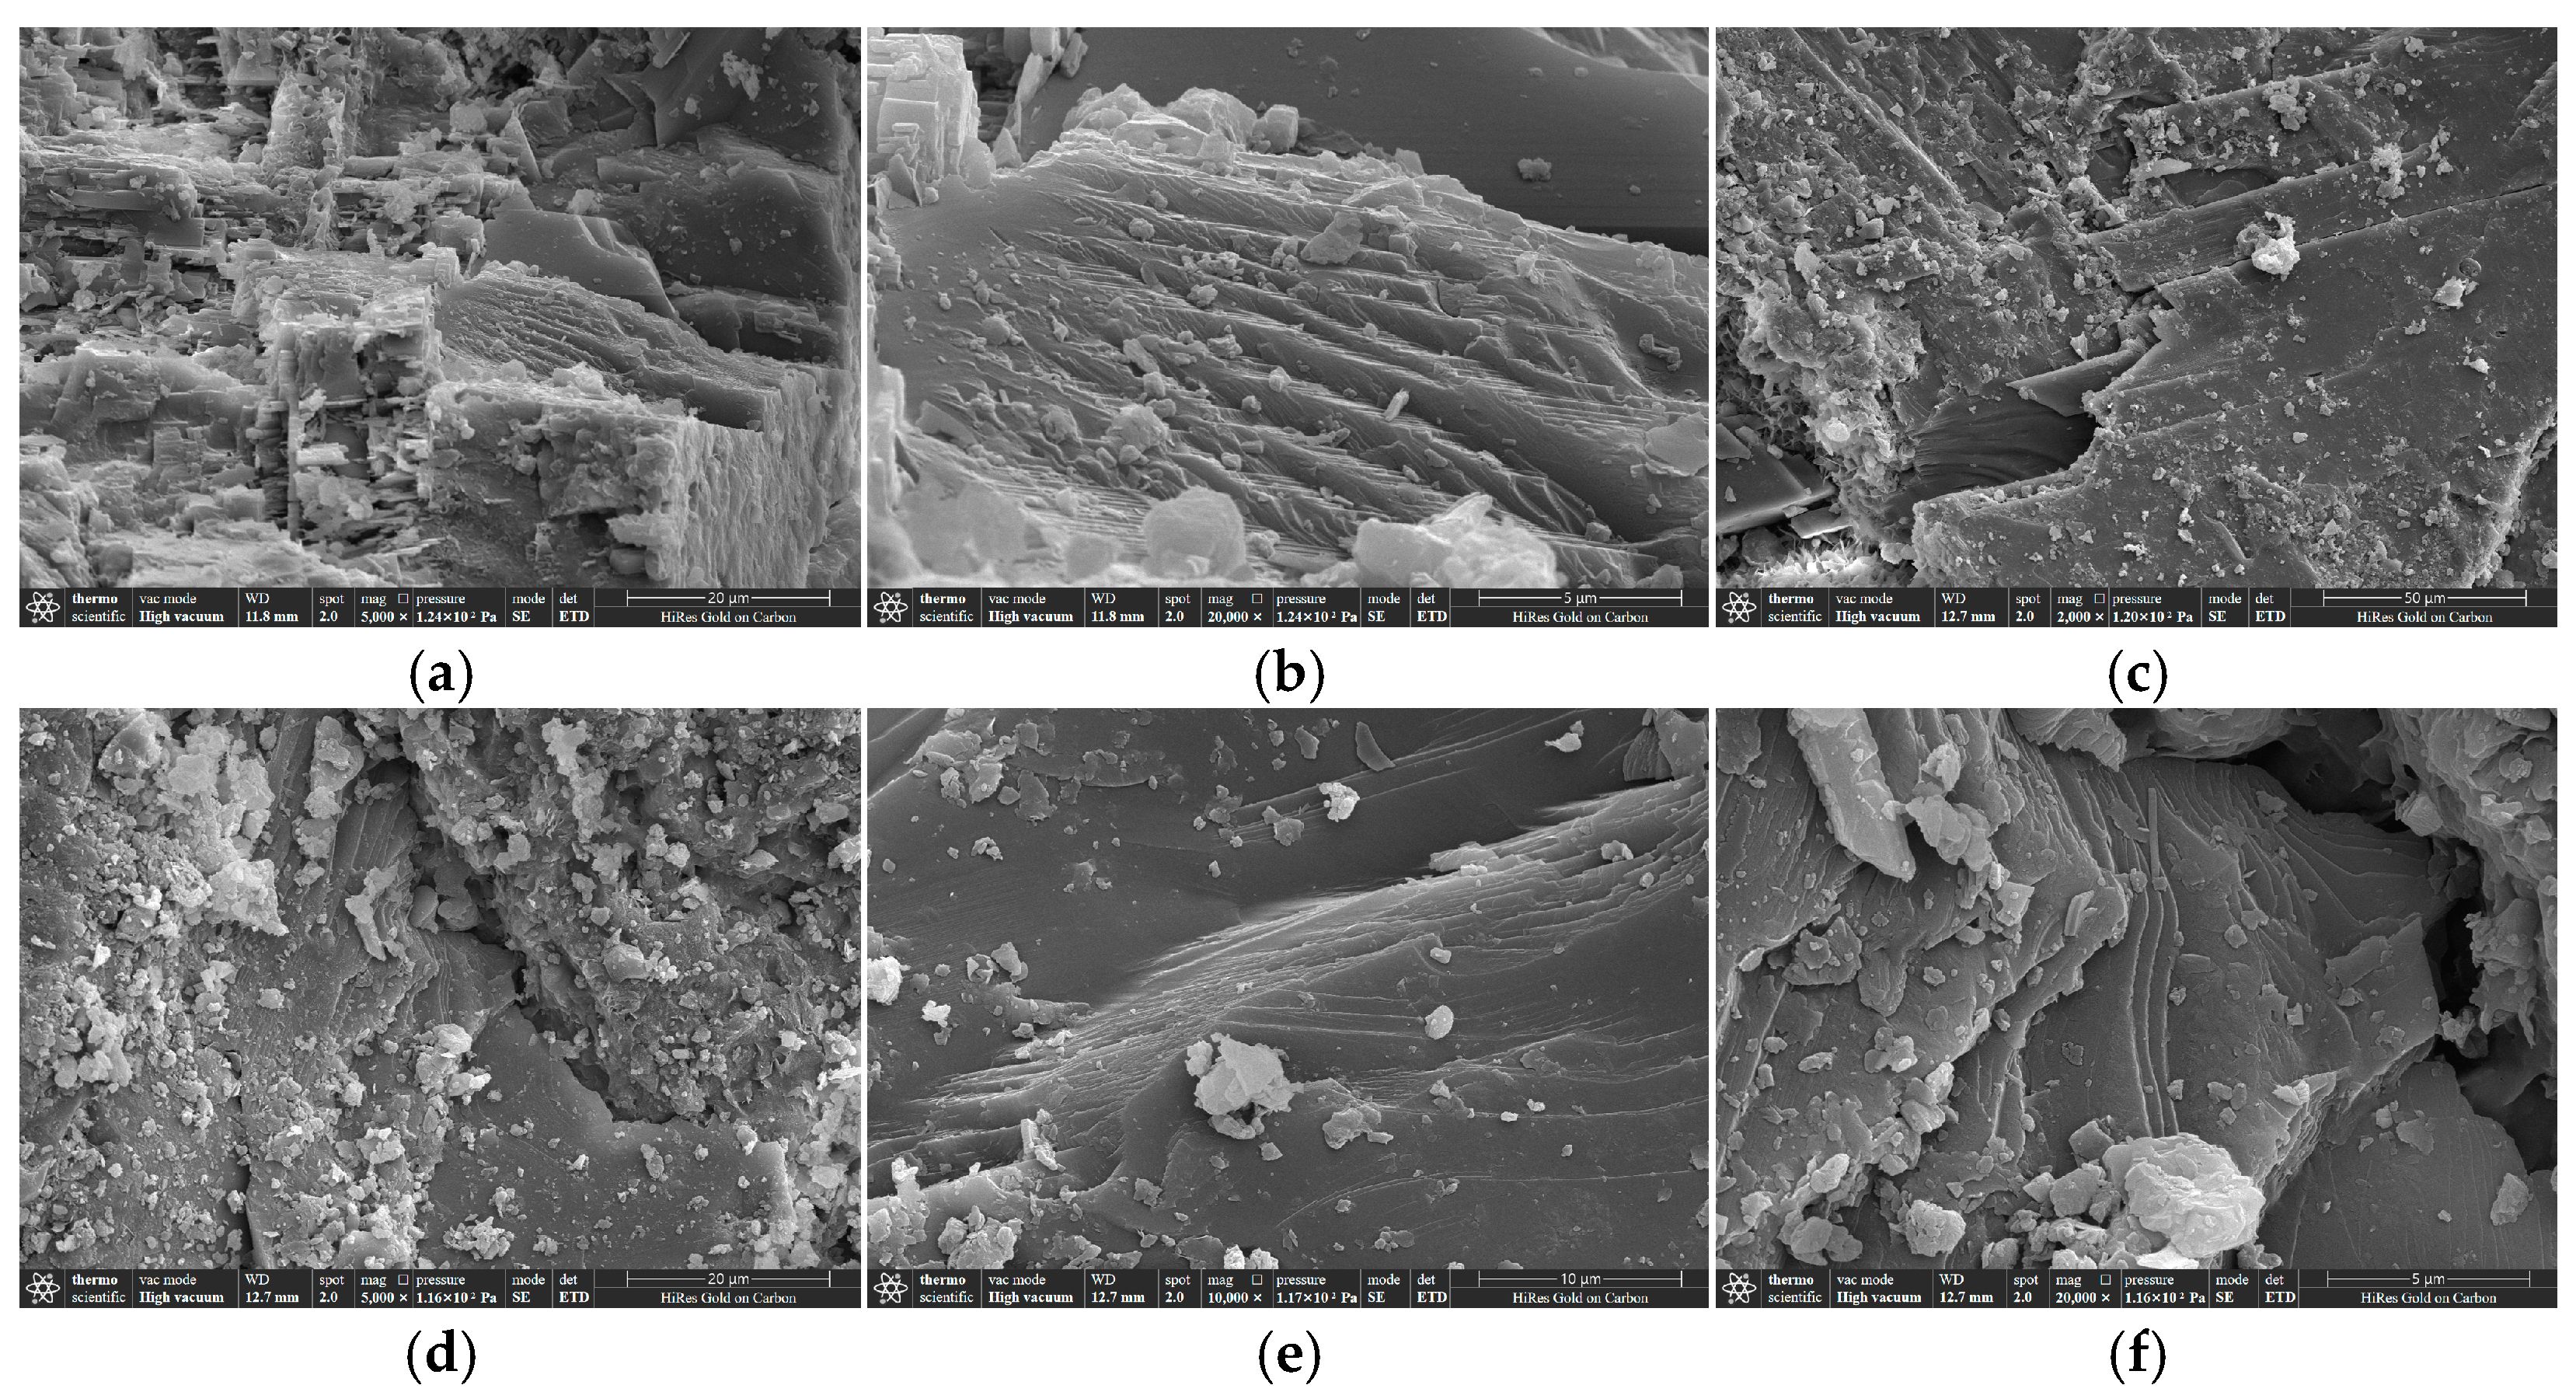
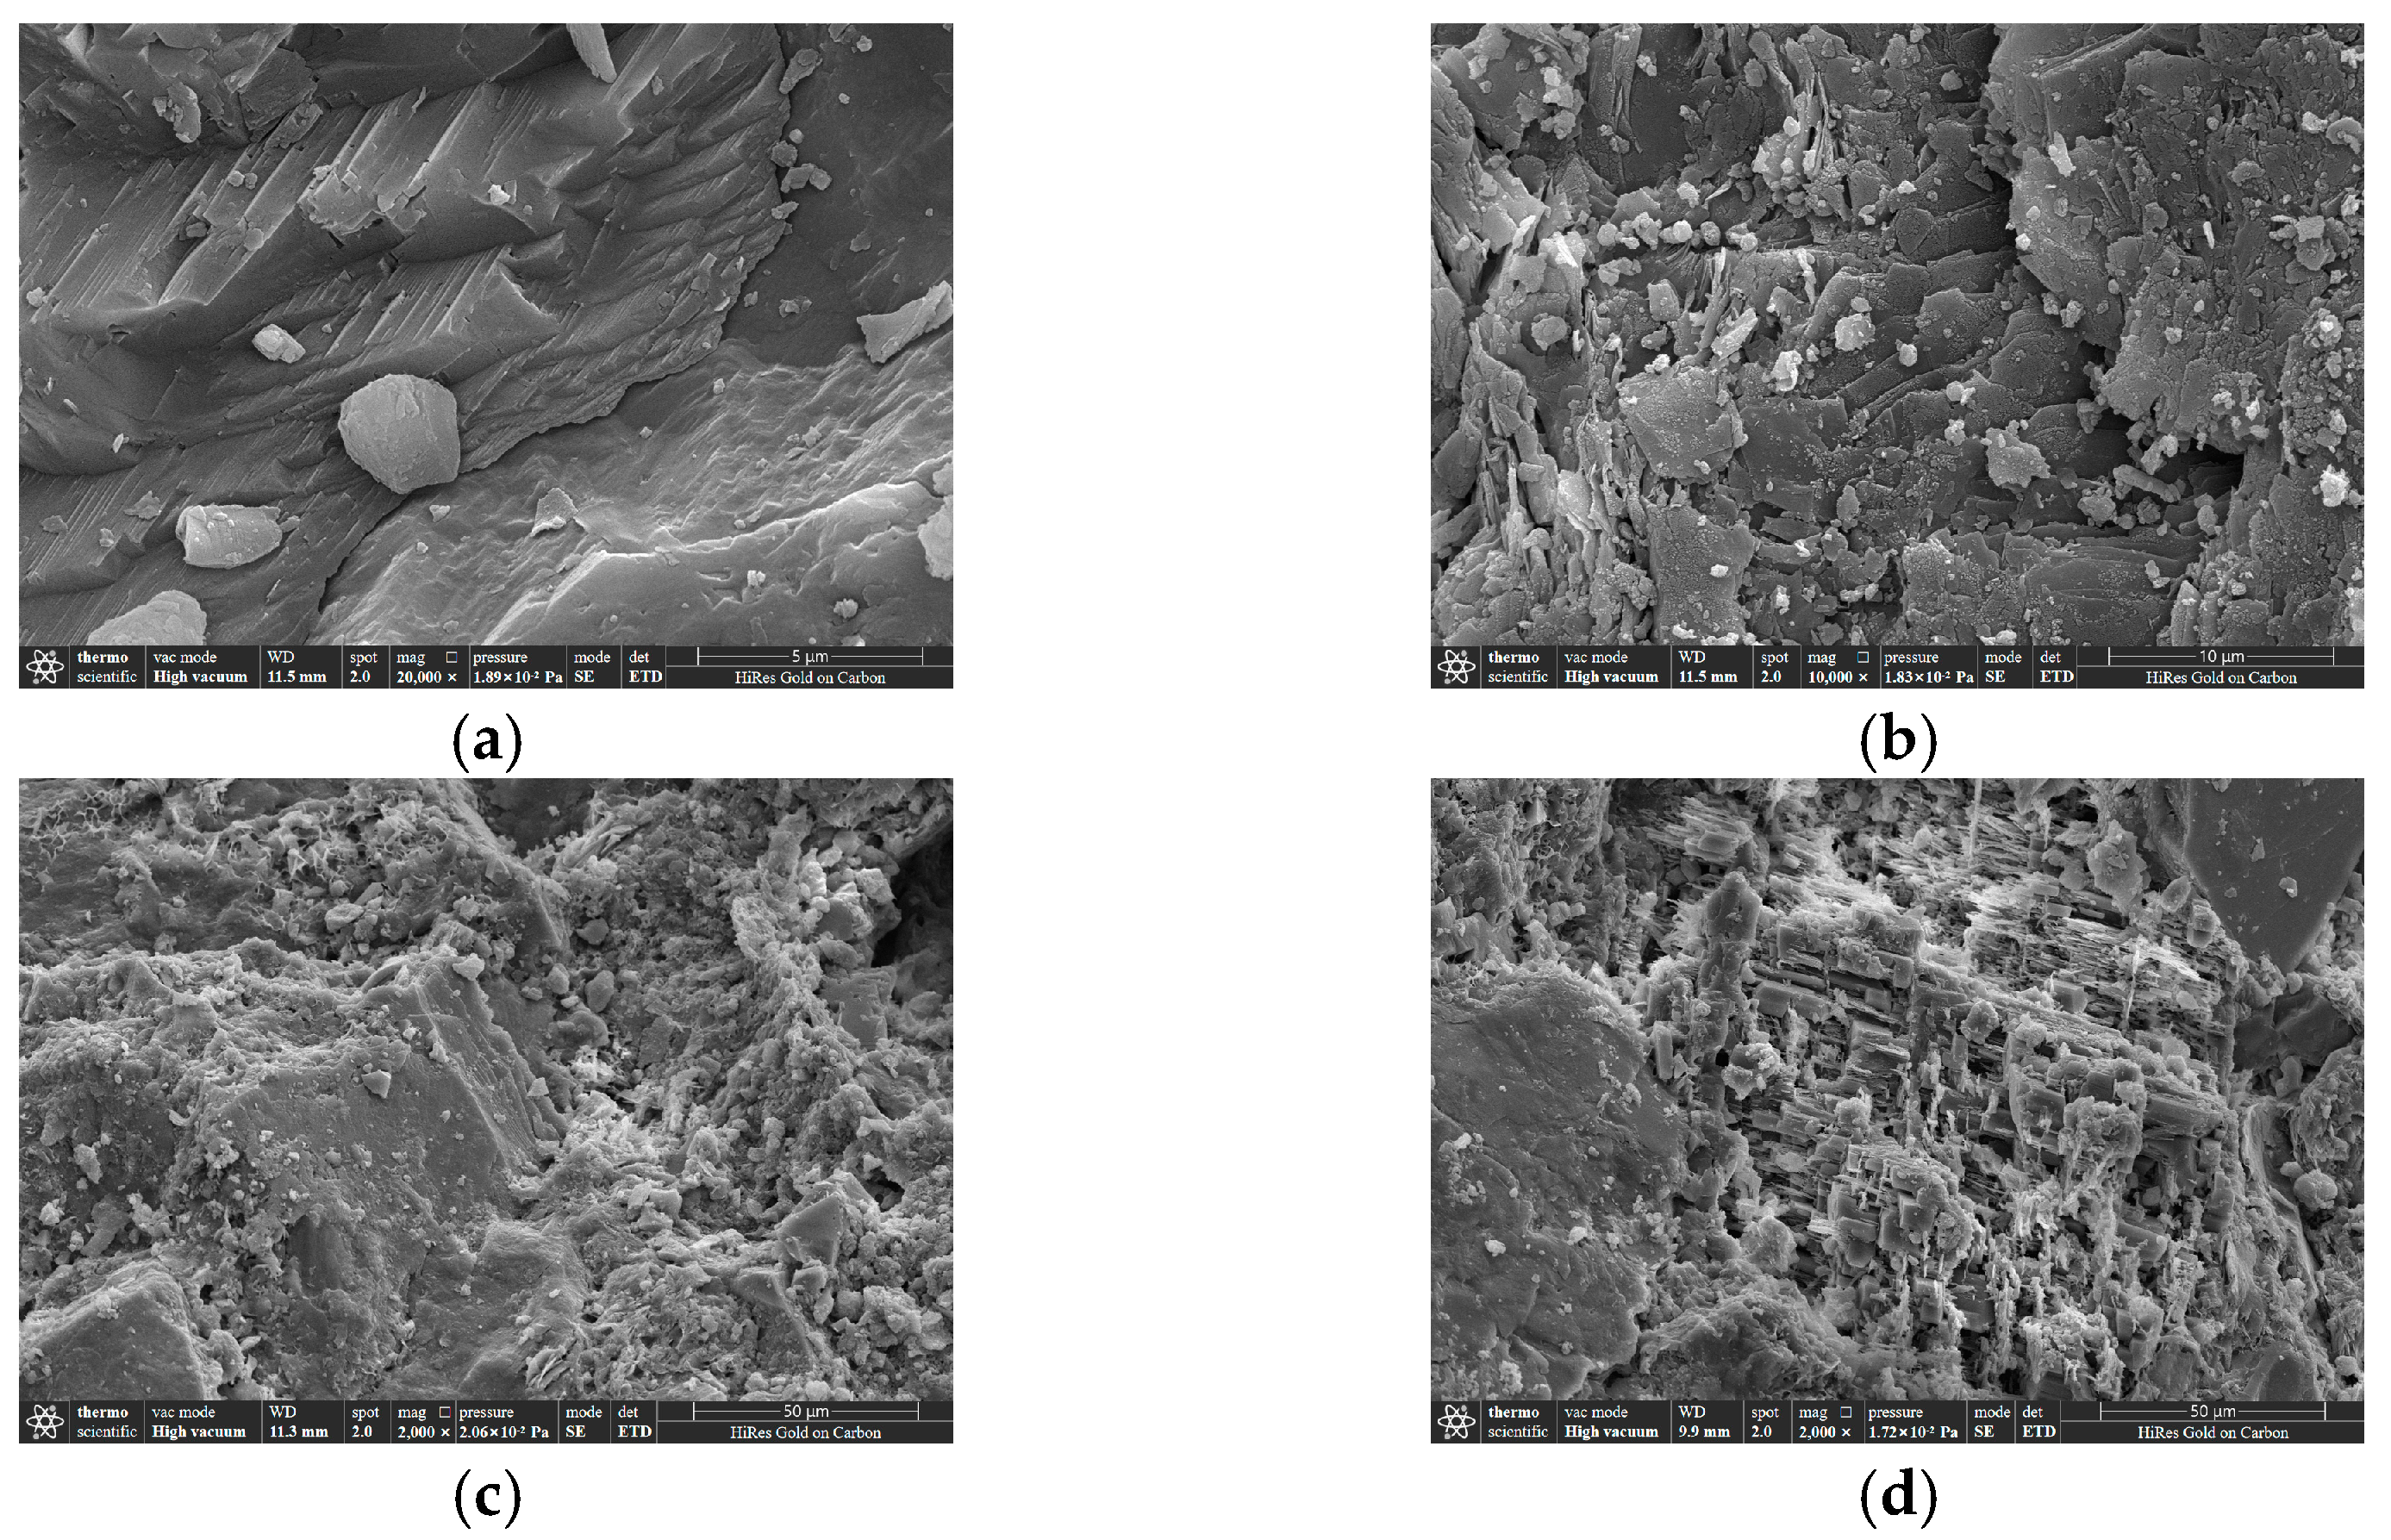
4.2. Microscopic Analysis of Blasting Fracture Modes

Sandstone is composed of various minerals, with numerous fractures between mineral crystals. After blasting, the complexity of the stress wave propagation and the uncertainty of the internal material structure resulted in a complicated rock fracture morphology. The fracture mechanism of the sandstone under the coupling action of blasting stress and in situ stress can generally be classified into tensile fractures and shear fractures. Tensile fractures are caused by tensile stress and can be categorized into transgranular fractures, intergranular fractures, and their mixed forms based on the fracture path. Shear fractures are induced by shear stress, where the relative sliding causes friction marks on the crystal planes or cleavage surfaces, or large displacements along the grain boundaries. Depending on the deformation type, fractures can be classified into cleavage fractures, quasi-cleavage fractures, and ductile fractures, with rock-like mineral materials under blasting loading mainly exhibiting cleavage or quasi-cleavage fractures. Based on the macroscopic plastic deformation before the fracture, the types can be divided into brittle fractures, brittle–plastic fractures, and plastic fractures. The SEM sample fracture morphologies primarily featured tensile fractures, brittle cleavage fractures, and transgranular fractures, with shear fractures, brittle–plastic quasi-cleavage fractures, coupled fractures, and intergranular fractures being less common.
Under 0 MPa in situ stress, the blasted fracture surface was influenced by both tensile and shear stresses, with the stemming segment showing a predominantly tensile fracture morphology (stepped patterns, river patterns, herringbone patterns, etc.), while the charge and bottom segments exhibited some shear fracture features (slip patterns). A small amount of brittle–plastic quasi-cleavage fractures (dimple patterns) appeared in the charge and bottom segments, with brittle cleavage fractures predominating. A few coupled fractures appeared in the bottom segment, primarily transgranular fractures. In the stemming segment, the accumulation and rapid release of blasting energy, coupled with high-strain-rate tensile stress, caused the rock to fracture swiftly along the micro-voids, resulting in smooth tensile fracture surfaces that are characteristic of brittle cleavage fractures. The charge and bottom segments were subjected to both tensile and shear stresses, and, due to the weakening of the blasting energy, brittle cleavage and transgranular fractures were dominant, though quasi-cleavage and coupled fractures were also present. Under 0.5 MPa in situ stress, the blasted fracture surface was influenced by both tensile and shear stresses, with brittle cleavage fractures being predominant, accompanied by some brittle–cplastic quasi-cleavage fractures, primarily transgranular. Coupled fractures appeared in the charge segment, and, in addition to the coupled fractures, intergranular fractures appeared in the bottom segment. The in situ stress made the rock more difficult to fracture, reducing the effective breaking energy in the bottom segment, with more fractures being driven by blasting gases, resulting in intergranular fractures. Under 1 MPa in situ stress, the overall fracture types of the blasted surface showed no significant difference in the mechanism and deformation forms compared to those under 0.5 MPa in situ stress. However, in the fracture path, in addition to transgranular fractures, a few coupled and intergranular fractures appeared. The charge segment was less smooth compared to the stemming segment, with numerous irregular particles, and transgranular fractures were increasingly replaced by intergranular and coupled fractures. With the increase in the in situ stress, the fracture surface under 2 MPa in situ stress showed more pronounced coupled and intergranular fractures compared to that under 1 MPa in situ stress. In the charge segment, compared to the stemming segment, dimple patterns gradually increased, indicating a transition from brittle to brittle–plastic fractures, with a significant increase in the intergranular and coupled fractures.
Additionally, under the same in situ stress condition, as the position shifted from the stemming segment to the charge segment, and then to the bottom segment, the fracture mechanism remained primarily dominated by tensile stress, but the proportion of shear stress influence gradually increased. The deformation form of the fracture, predominantly brittle cleavage, gradually transitioned to brittle–plastic quasi-cleavage fracture. The fracture path, mainly transgranular, was progressively replaced by intergranular and coupled fractures. In the absence of in situ stress, the stemming segment accumulated and released blasting energy quickly, causing rapid tensile stress at high strain rates that fractured the rock along the micro-voids, resulting in smooth tensile fracture surfaces. This made the stemming segment’s fracture morphology predominantly tensile and brittle cleavage, with shear fractures and brittle–plastic quasi-cleavage fractures rarely observed. Under in situ stress, part of the blasting energy was used to counteract the constraint effect of the in situ stress, resulting in reduced stress peaks and strain rates. Consequently, in the stemming segment under 0.5 MPa in situ stress, the fracture morphology showed not only tensile and brittle cleavage fractures but also a small amount of shear and brittle–plastic quasi-cleavage fractures. With increasing in situ stress, the stress peaks and strain rates further decreased, leading to more shear and brittle–plastic quasi-cleavage fractures. Furthermore, as the in situ stress increased, the blasting energy available for rock fracturing gradually decreased, resulting in an increase in coupled fractures and intergranular fractures in the plugged section starting at an in situ stress of 1 MPa. Similarly, the charge segment already showed a small amount of shear and brittle–plastic quasi-cleavage fractures without in situ stress, and, as the in situ stress increased, the occurrence of these fracture types became more prevalent. Coupled fractures began to appear in the charge segment under 0.5 MPa in situ stress, and intergranular fractures appeared under 1 MPa in situ stress, with both types becoming more common as the in situ stress increased. In the bottom segment, the blasting energy available for rock fracturing had decreased to a certain level, leading to the appearance of a small amount of shear, brittle–plastic quasi-cleavage, and coupled fractures even without in situ stress. Intergranular fractures started appearing at 0.5 MPa in situ stress. At the same location, no fractures were observed under the 1 MPa and 2 MPa in situ stress conditions.
As the in situ stress increased, the blasting energy available for rock fracturing decreased, resulting in a lower peak blasting stress and strain rate. This led to fracture morphologies influenced by both tensile and shear stress, producing increasingly rough fracture surfaces and brittle–plastic quasi-cleavage fractures. In some areas, the insufficient energy to penetrate grain boundaries resulted in coupled and intergranular fractures. As the position shifted from the stemming segment to the charge segment, and then to the bottom segment, the diminishing blasting energy caused the microfractures in the rock to become increasingly rough and disordered, leading to more irregular fracture surfaces.

5. Conclusions

This study utilized CT scanning combined with three-dimensional reconstruction technology and multifractal theory to examine the impact of in situ stress on the blasting damage characteristics of rock, and employed SEM electron microscopy and fracture morphology analysis to investigate the influence of in situ stress on rock fracture patterns during blasting. The main conclusions are as follows:
(1) From the macroscopic and mesoscopic perspective, in situ stress has a significant impact on the blasting damage characteristics of rock. Experimental research indicates that, under in situ stress, the rock’s ability to resist the effects of blasting stress waves and blasting gas is enhanced. With the increase in the in situ stress, the overall damage level of the sandstone specimens gradually decreases. As the in situ stress increases from 0 MPa to 3 MPa, the relative damage Δ α value in the bottom segment (at h = 20 mm) decreases from 0.3546 to 0.2323; in the charge segment (at h = 60 mm), it decreases from 0.3736 to 0.2622; in the stemming segment (at h = 100 mm), it decreases from 0.3956 to 0.2806.
(2) From both the macroscopic and microscopic perspectives, the damage characteristics of the different rock segments vary. The experiment uses hole-bottom blasting, with a shorter stemming segment. Due to the reflection of blasting stress waves and boundary effects, in the same sandstone specimen, the damage level of the stemming segment is highest, followed by the charge segment, with the bottom segment exhibiting the lowest damage level. Under an in situ stress of 0 MPa, the relative damage Δ α value decreases from 0.3956 at h = 100 mm (the stemming segment) to 0.3736 at h = 60 mm (the charge segment), and finally to 0.3516 at h = 10 mm (the bottom segment). As the in situ stress increases, the damage levels in all three segments gradually decrease, with the cracks in the bottom segment disappearing first, thus maintaining better integrity. Under an in situ stress of 3 MPa, the relative damage Δ α value decreases from 0.2806 at h = 100 mm (the stemming segment) to 0.2622 at h = 60 mm (the charge segment), and finally to 0.2235 at h = 10 mm (the bottom segment).
(3) From the microscopic perspective, in situ stress significantly influences the fracture patterns of rock during blasting. Under blasting loading, the microscopic fracture morphology of the rock mainly exhibits tensile fractures, brittle cleavage fractures, and transgranular fractures. Increasing the in situ stress reduces the blasting energy acting on rock fragmentation, lowering the peak blasting stress and strain rate, and leading to an increase in shear fractures. The blasting fracture surfaces become progressively rougher, and the microscopic fractures in the sandstone gradually transition from brittle cleavage fractures to brittle–plastic quasi-cleavage fractures. In some of the regions, the energy is insufficient to penetrate the grain boundaries, resulting in a transition from transgranular fractures to coupled fractures and intergranular fractures.

Author Contributions

Conceptualization, C.D., J.X. and D.Z.; methodology, C.D. and D.Z.; software, C.D.; validation, J.X.; formal analysis, X.G.; investigation, X.G. and Z.S.; resources, Y.Y.; data curation, C.D.; writing—original draft preparation, X.G.; writing—review and editing, X.G. and D.Z.; visualization, X.G.; supervision, C.D.; project administration, C.D.; funding acquisition, C.D. All authors have read and agreed to the published version of the manuscript.

Funding

This research was supported by (1) the National Natural Science Foundation of China (52474123) and (2) the National Natural Science Foundation of China (52227805).

Institutional Review Board Statement

Not applicable.

Informed Consent Statement

Not applicable.

Data Availability Statement

The data are not publicly available due to privacy restrictions.

Conflicts of Interest

Author Jiye Xu was employed by the company Panzhihua Iron and Steel Group Mining Co., Ltd. The remaining authors declare that the research was conducted in the absence of any commercial or financial relationships that could be construed as a potential conflict of interest.

References

  1. Xie, H.P. Research review of the state key research development program of China: Deep rock mechanics and mining theory. J. China Coal Soc. 2019, 44, 1283–1305. [Google Scholar]
  2. Charles, F. Some Challenges of Deep Mining. Engineering 2017, 3, 527–537. [Google Scholar]
  3. Li, P.; Cai, M.F. Challenges and new insights for exploitation of deep underground metal mineral resources. Trans. Nonferrous Met. Soc. China 2021, 31, 3478–3505. [Google Scholar] [CrossRef]
  4. He, M.C.; Wu, Y.Y.; Gao, Y.B.; Tao, Z.G. Research progress of rock mechanics in deep mining. J. China Coal Soc. 2024, 49, 75–99. [Google Scholar]
  5. Ma, S.Z.; Liu, K.W.; Yang, J.C.; Li, X.D.; Guo, T.F. Blast-induced damage characteristics and fracture mechanism of rock mass under initial stress. Explos. Shock Waves 2023, 43, 105201. [Google Scholar]
  6. Fan, Z.F.; Cai, J.H. Effects of Unidirectional In Situ Stress on Crack Propagation of a Jointed Rock Mass Subjected to Stress Wave. Shock Vib. 2021, 2021, 5529540. [Google Scholar] [CrossRef]
  7. Ge, J.J.; Xu, Y.; Huang, W.; Wang, H.B.; Yang, R.Z.; Zhang, Z.Y. Experimental Study on Crack Propagation of Rock by Blasting under Bidirectional Equal Confining Pressure Load. Nat. Sustain. 2021, 13, 12093. [Google Scholar] [CrossRef]
  8. Ge, J.J.; Xu, Y. Test and mechanism analysis for crack propagation by blasting in rock under the condition of unidirectional load. J. Vibroeng. 2022, 24, 885–903. [Google Scholar] [CrossRef]
  9. Yang, R.S.; Ding, C.X.; Li, Y.L.; Yang, L.Y.; Zhao, Y. Crack propagation behavior in slit charge blasting under high static stress conditions. Int. J. Rock Mech. Min. 2019, 119, 117–123. [Google Scholar] [CrossRef]
  10. Gupta, N.; Mishra, B.; Crandall, D.M. A New Workflow of X-ray CT Image Processing and Data Analysis of Structural Features in Rock Using Open-Source Software. Min. Metall. Explor. 2022, 39, 2011–2024. [Google Scholar] [CrossRef]
  11. Duan, Y.T.; Li, X.; Zheng, B.; He, J.M.; Hao, J. Cracking Evolution and Failure Characteristics of Longmaxi Shale Under Uniaxial Compression Using Real-Time Computed Tomography Scanning. Rock Mech. Rock Eng. 2019, 52, 3003–3015. [Google Scholar] [CrossRef]
  12. Ding, C.X.; Yang, R.S.; Zhu, X.G.; Feng, C.; Zhou, J. Rock fracture mechanism of air-deck charge blasting considering the action effect of blasting gas. Tunn. Undergr. Space Technol. 2023, 142, 105420. [Google Scholar] [CrossRef]
  13. Li, X.W.; Lan, Y.R.; Zou, J.X. A study of rock fractures. J. China Univ. Min. Technol. 1983, 12, 15–21. [Google Scholar]
  14. Zhang, M.; Ning, J.G.; Zhang, H.B.; Liu, X.S. Study on Microscopic Structure and Mineral Composition of Shallow Rock Using SEM. Appl. Mech. Mater. 2013, 2308, 2552–2558. [Google Scholar] [CrossRef]
  15. Yang, R.S.; Wang, Y.B.; Xue, H.J.; Liu, K. SEM experiment of rock crack cross section morphology after explosion fracturing with slotted cartridge. J. China Univ. Min. Technol. 2013, 42, 337–341. [Google Scholar]
  16. Wang, Y.B.; Wang, Z.Y.; Fu, D.R.; Luo, L. Visualization and quantitative characterization methods of post-blast rock fracture. J. China Coal Soc. 2024, 49, 1388–1402. [Google Scholar]
  17. Kirk, S. Shock Compression and Dynamic Fragmentation of Geological Materials. Doctoral Dissertation, University of Cambridge, Cambridge, UK, 2014. [Google Scholar]
  18. Xiao, C.L.; Yang, R.S.; Ding, C.X.; You, Y.Y.; Tang, W.D. Multi-Scale Research on Blasting Damage of Rock Based on Fractal Theory. Rock Mech. Rock Eng. 2024, 57, 5899–5911. [Google Scholar] [CrossRef]
  19. Paggi, M.; Carpinteri, A. Fractal and multifractal approaches for the analysis of cracksize dependent scaling laws in fatigue. Chaos Soliton Fractals 2007, 40, 1136–1145. [Google Scholar] [CrossRef]
  20. Xie, H.P.; Wang, J.A. Multifractal behaviors of fracture surfaces in rocks. Acta Mech. Sin. 1998, 30, 314–320. [Google Scholar]
  21. Rolph, S. Fractal geometry: Mathematical foundations and applications. Math. Gaz. 1990, 74, 288–317. [Google Scholar]
  22. Zhang, R.; Liu, J.; Sa, Z.; Sa, Z.Y.; Wang, Z.Q.; Lu, S.Q.; Wang, C.F. Experimental investigation on multi-fractal characteristics of acoustic emission of coal samples subjected to true triaxial loading-unloading. Fractals 2020, 28, 2050092. [Google Scholar] [CrossRef]
  23. Qiu, L.M.; Song, D.Z.; He, X.Q.; Wang, E.Y.; Li, Z.L.; Yin, S.; Wei, M.H.; Liu, Y. Multifractal of electromagnetic waveform and spectrum about coal rock samples subjected to uniaxial compression. Fractals 2020, 28, 2050061. [Google Scholar] [CrossRef]
  24. Zhu, X.G.; Ding, C.X.; Sui, Z.; Su, H.; Guo, X. Rock fracture mechanism of buffer blasting with cushion layer at the borehole bottom. Int. J. Miner. Metall. Mater. 2025, 32, 325–334. [Google Scholar] [CrossRef]
Figure 1. Confining pressure loading device for simulating deep high in situ stress conditions.
Applsci 15 01819 g001
Figure 2. Red sandstone specimen.
Applsci 15 01819 g002
Figure 3. Explosive in quartz tube.
Applsci 15 01819 g003
Figure 4. Specimen in confining pressure loading device.
Applsci 15 01819 g004
Figure 5. Schematic diagram of the different segment divisions of the red sandstone specimen.
Applsci 15 01819 g005
Figure 6. The processed segmentation images of the post-blast sandstone from different sections under varying in situ stress conditions (The figures in each row from top to bottom represent in situ stresses of 0 MPa, 0.5 Mpa, 1 Mpa, 2 Mpa, and 3 Mpa, respectively). (a) Central slice of the stemming segment (h = 97.5 mm); (b) Central slice of the charge segment (h = 62.5 mm); (c) Central slice of the bottom segment (h = 20 mm).
Applsci 15 01819 g006aApplsci 15 01819 g006b
Figure 7. Three-dimensional reconstruction diagram of the internal fracture distribution of the specimens after blasting.
Applsci 15 01819 g007
Figure 8. Comparison of meso-cracks between pseudo-color images (bule) and denoised segmented images (white). (a) CT scan original image; (b) Segmentation image before denoising; (c) Segmentation image after denoising; (d) Pseudo-colored image.
Applsci 15 01819 g008
Figure 9. Multifractal spectrum curve.
Applsci 15 01819 g009
Figure 10. Multifractal spectra at different slice positions of the sandstone specimens under 0 MPa in situ stress.
Applsci 15 01819 g010
Figure 11. Curves of variation with slice positions under different in csitu stress conditions.
Applsci 15 01819 g011
Figure 12. Curves of Δ α variation with in situ stress at different positions.
Applsci 15 01819 g012
Figure 13. Fracture morphology of the stemming segment of the specimen after blasting under 0 MPa in situ stress conditions. (a) stepped pattern and mist zone pattern; (b) herringbone pattern; (c) river pattern.
Applsci 15 01819 g013
Figure 14. Fracture morphology of the charge segment of the specimen after blasting under 0 MPa in situ stress conditions. (a) stepped pattern and parallel slip pattern; (b) serpentine slip pattern and dimple pattern.
Applsci 15 01819 g014
Figure 15. Fracture morphology of the bottom segment of the specimen after blasting under 0 MPa in situ stress conditions.
Applsci 15 01819 g015
Figure 16. Fracture morphology of the stemming segment of the specimen after blasting under 0.5 MPa in situ stress conditions. (a) stepped pattern; (b) mist zone pattern and dimple pattern; (c) slip pattern.
Applsci 15 01819 g016
Figure 17. Fracture morphology of the charge segment of the specimen after blasting under 0.5 MPa in situ stress conditions. (a) coupled fracture; (b) layered tearing.
Applsci 15 01819 g017
Figure 18. Fracture morphology of the bottom segment of the specimen after blasting under 0.5 MPa in situ stress conditions.
Applsci 15 01819 g018
Figure 19. Fracture morphology of the stemming segment of the specimen after blasting under 1 MPa in situ stress conditions. (a) intergranular fracture and coupled fracture; (b) stepped pattern; (c) dimple pattern; (d) mist zone pattern; (e) slip pattern; (f) layered tearing.
Applsci 15 01819 g019
Figure 20. Fracture morphology of the stemming segment of the specimen after blasting under 2 MPa in situ stress conditions. (a) stepped pattern; (b) layered tearing; (c) dimple pattern and mist zone pattern; (d) intergranular fracture and coupled fracture.
Applsci 15 01819 g020
Table 1. The Δ α values at different slice positions of sandstone specimens under various in situ stress conditions.
Slice Position/hBottom SegmentCharge SegmentStemming Segment
10 mm20 mm30 mm40 mm50 mm60 mm70 mm80 mm90 mm100 mm
0 MPa0.35160.35460.35720.35880.36950.37360.37860.38810.38950.3956
0.5 MPa0.24150.24340.24770.25820.28170.30100.32370.33600.33900.3410
1 MPa0.23220.23370.23810.25050.27210.28650.29130.29800.30150.3067
2 MPa0.23220.23790.24090.25040.26730.27640.27840.28370.28860.2967
3 MPa0.22350.23230.23490.23980.24890.26220.26390.27100.27530.2806
Disclaimer/Publisher’s Note: The statements, opinions and data contained in all publications are solely those of the individual author(s) and contributor(s) and not of MDPI and/or the editor(s). MDPI and/or the editor(s) disclaim responsibility for any injury to people or property resulting from any ideas, methods, instructions or products referred to in the content.

