Abstract
In July 2023, 19 continuous days of very hot days in Hong Kong brought inconvenience to citizens and disasters to society. This long-lasting heat wave event is closely linked to the atmospheric variability on the quasi-biweekly to intraseasonal timescales. While extreme weather has aroused the attention of scientists and society, limited studies focus on quasi-biweekly to intraseasonal extreme (QBIE) weather. Thus, to address this issue, this study aims at examining the climatology and long-term variability of these QBIE events in Hong Kong. This study serves as one of the very few fundamental works that construct a century-long record of QBIE temperature events, based on in situ observation in Hong Kong, and further examines the climatology, diversity, and variability of these QBIE temperature events. A total of 382 QBIE heat waves and 510 QBIE cold surges are identified from 1885 to 2022, exhibiting various characteristics in their occurring time and seasonality. Based on ARIMA model and time series analyses, we find that while apparent interannual variability exists in QBIE heat wave and cold surge activity, short-term climate prediction of QBIE temperature events based on past patterns or common climate indices is largely unfeasible. This research provides a valuable historical reference for understanding QBIE weather in the Guangdong–Hong Kong–Macau Greater Bay Area and highlights the need for further studies on the predictability of QBIE weather in the future.
1. Introduction
Extreme weather events, especially extreme temperatures, are natural disasters that significantly impact human life and society [1,2,3,4,5]. These extreme events have negative effects on humans and society, including loss of life [6], increased financial risk in the energy sector [7], and substantial impacts on crop growth [8] and health of newborns [9]. Evidence suggests that anthropogenic global warming has increased the probability of extreme events such as heat waves and cold spells, droughts, floods, and tropical cyclones [10,11,12,13,14,15,16].
The quasi-biweekly oscillation (QBWO) and intraseasonal oscillation (ISO) play a predominant role in influencing extreme weathers in East Asia [17,18,19,20,21]. For example, the QBWO and boreal summer ISO (BSISO) modulate the probability of extreme temperature events that coincide with extreme precipitation events over the South China and Southeast China regions, including the Guangdong–Hong Kong–Macau Greater Bay Area [20]. It is also reported that extreme heat waves can be induced by 5–25- and 30–90-day oscillations associated with anomalous cyclones in the tropical western Pacific [22].
Despite numerous studies on the QBWO and ISO in South China and Hong Kong, there has been limited attention paid to quasi-biweekly to intraseasonal extreme (QBIE) temperature events in this region. Most research on temperature extremes has focused on the synoptic timescale rather than on the biweekly and intraseasonal timescales [23,24,25]. However, temperature extremes are also observed on these timescales. For example, Qin et al. [26] documented that ISOs increase the mean temperature by 1.93 degrees Celsius during compound drought and heat events in the Yangtze River basin. Additional direct evidence is the long-duration heat wave that occurred in July 2023, during which Hong Kong recorded 19 consecutive days with daily maximum air temperatures exceeding 33 °C. During this long-lived heat event, the maximum air temperature reached 36.1 °C on 27 July 2023, setting a new record for July that was also approximately 1.5 °C higher than pre-industrial averages. Thus, it is of great importance to study temperature extremes in the QBWO and ISO timescales.
Due to the lower degree of freedom of the intraseasonal signals, long historical data can help reduce the uncertainty in analysis results. However, the study periods of most publications were limited to recent decades due to limited data records. Aimed at addressing this gap, this study constructed a century-long QBIE temperature extreme dataset based on meteorological station records in Hong Kong dating back to 1885. This study thoroughly investigates the climatology, diversity, long-term variability, and predictability of QBIE events in the past century, with a particular focus on QBIE temperature events. The remaining of this paper is organized as follow: Section 2 introduces the data employed in this study, Section 3 explains how we define and identify the historical QBIE temperature events, Section 4 examines the climatology and diversity of these extreme events, Section 5 discusses the long-term variability and predictability of QBIE temperature events in the past decades, and finally, conclusions and discussion are given in Section 6.
2. Data
In this study, we employ temperature observation of 14 weather stations provided by the Hong Kong Observatory (Figure 1 and Table 1). The Hong Kong Observatory operates a total of 89 automatic weather stations across Hong Kong Island, the Kowloon Peninsula, the New Territories, and surrounding islands. These stations collect data of hourly prevailing wind direction, mean wind speed, maximum gust, relative humidity, rainfall, mean sea level pressure, and temperature, as well as daily data of all variables mentioned above. Of the 89 stations, 61 measure air pressure, wind speed, and temperature, while 12 measure wind only, and 16 stations measure rainfall. Among these stations, the station located at the Hong Kong Observatory (hereafter HKO station), in operation since 1884, provides the longest historical record. Note that the abbreviation HKO only refers to the HKO station in the following context.
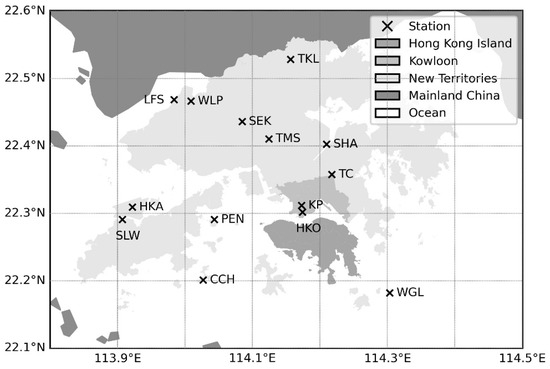
Figure 1.
Distribution of the 14 weather stations whose data were used in this study, including the Hong Kong Observatory (HKO), Hong Kong International Airport (HKA), Cheung Chau (CCH), King’s Park (KP), Lau Fau Shan (LFS), Peng Chau (PEN), Shek Kong (SEK), Sha Tin (SHA), Sha Lo Wan (SLW), Tate’s Cairn, Ta Kwu Ling (TKL), Tai Mo Shan (TMS), Waglan Island (WGL), and Wetland Park (WLP) stations.

Table 1.
Information of 14 weather stations of which daily observation data were employed in this study.
In this study, we utilized data from 14 stations that provide all the variables mentioned above. Table 1 lists the information about these 14 stations. Most of the data are continuous, except for some missing data due to reasons such as instrument malfunction, maintenance, and the outbreak of war. In the following analyses, the observed daily mean, maximum, and minimum temperatures of these 14 stations were used to define the historical QBIE temperature events in Hong Kong. In the following analyses, the estimation of climatological features of station data (Section 3) was carried based on data from 2006 to 2022, the common period with available data from all 14 stations (Table 1). The analyses about the long-term variability of QBIE events (Section 4 and Section 5.1) were based on the HKO station data from 1885 to 2022. Lastly, the ARIMA analyses (Section 5.2) were carried out based on the HKO station data from 1950 to 2022 to reduce impacts from the missing values from 1940 to 1946. Except for the data gap from 1940 to 1946 of the HKO station, all missing data were filled by simple linear interpolation in the following analyses.
3. Identification of QBIE Temperature Events
This section introduces the procedures of how we define QBIE temperature events in Hong Kong. Although the procedures were applied to all 14 stations, the description and results presented here focus only on the HKO station, the only station that provides century-long observation records. The whole procedure generally includes three parts: (1) removing the climatology of observations, (2) extracting QBWO and ISO signals, and (3) defining QBIE events. Note that the procedures can apply to any type of QBIE events in any location.
3.1. Removing Seasonal Cycle of Observation
As Hong Kong is located in the East Asia monsoon region, apparent seasonality exists in the observed daily mean, maximum, and minimum temperature series. This seasonal variability was first removed from the weather station data at the very first step. Given the relatively short data records for some stations, we defined the daily climatology of the temperature time series by taking averages over 2006–2022, instead of 1981–2010 as carried out in most climate research [27,28]. A 31-day running mean was applied when estimating daily climatology in order to reduce uncertainties caused by the small sample size for Equation (1).
where y and d denote year and calendar date, respectively, and N indicates the total number of samples. By subtracting the daily climatology from the original input, a daily anomaly series that does not exhibit seasonal cycles was obtained from Equation (2).
3.2. Extracting QBWO and ISO Signals
The next step is to identify the dominant QBWO and ISO signals of temperature variability in Hong Kong. We first applied wavelet spectral analyses to detect the dominating periodic signals of QBWO and ISO of temperature variability in Hong Kong. Analyses were carried out to data of all 14 weather stations. The results, as shown in Figure 2, indicate that the most dominant period of QBWO and ISO signals range from 10 to 25 days, while some individual cases are featured with longer periodic signals of up to 30–60 days. This suggests that, on the intraseasonal timescales, temperature variability in Hong Kong is primarily driven by QBWOs. While ISO signals overall play a lesser role, they may contribute to unusually long-lived QBIE events as shown later in our analyses. Although the temperature series may exhibit slight discrepancies across stations, they all show similar wavelet spectra, highlighting significant signals within the 10–60-day period.
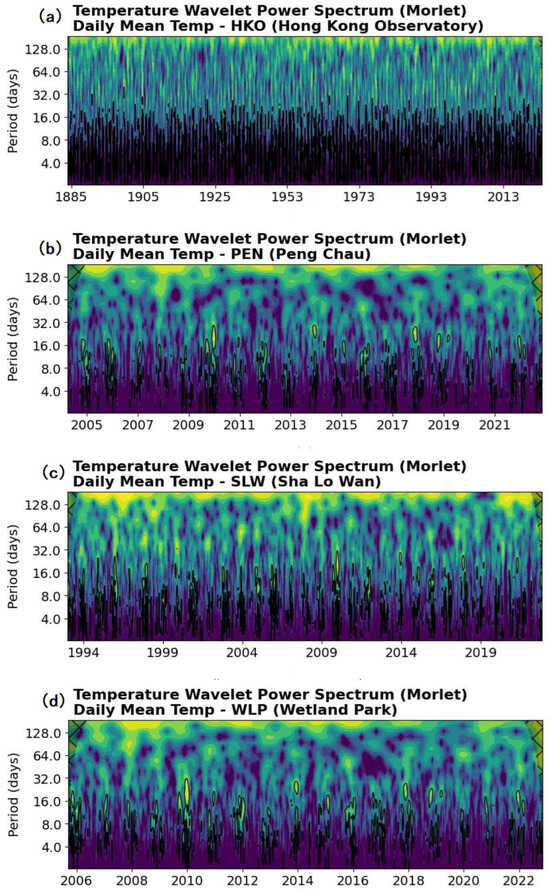
Figure 2.
Wavelet power spectra of daily mean temperature of the (a) HKO, (b) PEN, (c) SLW, and (d) WLP stations. Black contours denote the cone of influence (COI) of the spectra.
Based on these results, in order to take into account most possibilities, we take 10–60 days as the periods of interest for the QBWO and ISO signals in this study and define QBIE temperature events based on data being bandpass filtered within this range. A 121-point Lanczos bandpass filter was applied to the daily anomaly series to extract the QBWO and ISO signals. The Lanczos filter was chosen because it can reduce aliasing artificial signals well during filtering calculations and is widely used for meteorological time series, especially for extracting ISO signals [29,30,31,32].
3.3. Defining QBIE Temperature Events
A QBIE event is defined when the 10–60-day bandpass filtered anomaly exceeds two times its standard deviation (σ), as carried out in most research on climate and weather extremes [14]. It is important to note that the σ of the 10–60-day filtered anomaly varies across seasons (Figure 3). Our results indicate that, across all stations, the QBWO and ISO signals exhibit the largest variability during February and March, with σ values approximately three times larger than those in August and September. The large seasonal differences in σ suggest that a fixed σ should not be used to define QBIE temperature events.
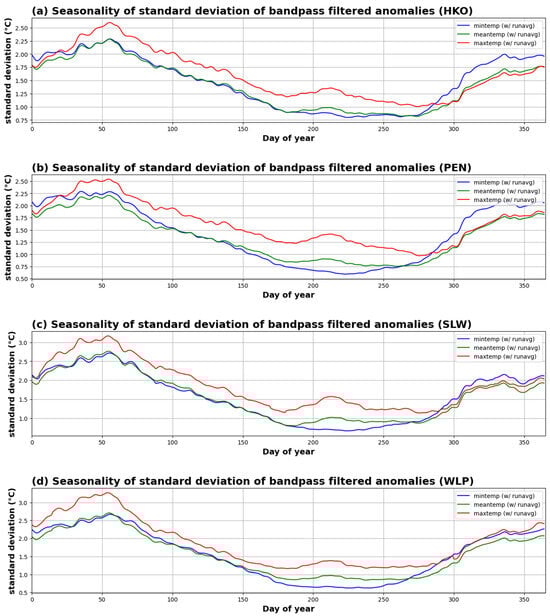
Figure 3.
Seasonality of standard deviation (σ, unit: °C) of 10–60-day bandpass filtered daily minimum (blue), mean (green), and maximum (red) temperature anomalies of (a) HKO, (b) PEN, (c) SLW, and (d) WLP stations during the period of 2006–2022.
To address this, we calculate a 31-point smoothed daily σ based on the period 2006–2022 Equation (3) and take it as the threshold for defining QBIE temperature events (Figure 3). If the filtered anomaly data are greater than +2σ, then this is classified as a positive QBIE temperature event, or a QBIE heat wave. Conversely, if the filtered anomaly is smaller than −2σ, then it is considered as a negative QBIE temperature event, or a QBIE cold surge. Finally, the starting and ending dates of a QBIE event are determined by the nearest points where the filtered anomalies cross the zero line. Below is the explicit procedure for identifying QBIE events:
Based on the above procedures, we identified all QBIE heat wave and QBIE cold surge events based on the 10–60-day bandpass filtered maximum, minimum, and mean temperature anomalies from all 14 stations. The longest record of the constructed QBIE events is derived from the HKO station observations, covering the period from 1885 to 2022. Figure 4 gives an example of six QBIE heat waves and four QBIE cold surges observed by the HKO station in 2010. For example, a QBIE heat wave started on 9 October, peaked on 21 October, then ended on 24 October (Event #9 in Figure 4).
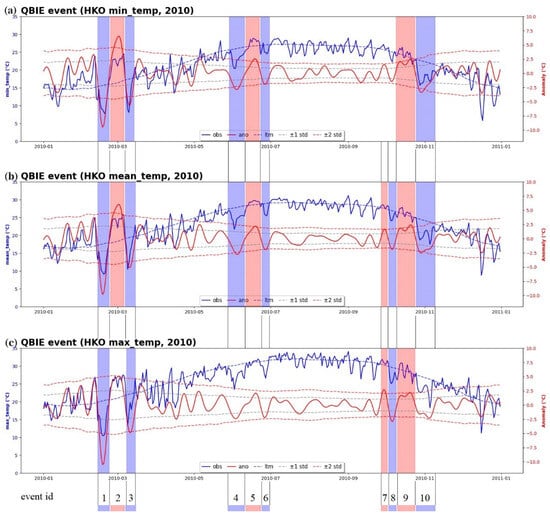
Figure 4.
Observed temperature data (blue solid lines, unit: °C) and anomaly (red solid lines, unit: °C) and their seasonal variation (dashed lines, unit: °C) of (a) minimum, (b) mean, and (c) maximum temperature of HKO in 2010. Gray and red dashed lines denote ±1 and ±2 standard deviations, respectively. Red and blue shaded areas are the identified QBIE heat waves and cold surges, respectively.
3.4. Metrics of QBIE Temperature Events
In the following analyses, a few fundamental metrics will be discussed, including (1) annual event count, (2) average event intensity, (3) average event duration, and (4) annual event days. The annual event count refers to the average number of QBIE events per year. To derive the average event intensity, we first calculate the average intensity of each QBIE event, which is equal to the mean value of filtered temperature anomalies within the QBIE event. Then, the average event intensity is calculated by taking the average over all events. Similarly, the average event duration is the arithmetic mean of durations of all QBIE events. Finally, the annual event days is defined as the number of days that are affected by QBIE events in a year.
4. Climatology and Diversity of Hong Kong QBIE Temperature Events
According to the above procedures, we have identified all QBIE heat wave and cold surge events based on observations from the 14 weather stations in Hong Kong. In this section, we examine the climatology of the QBIE temperature events in Hong Kong and explore the types of these extreme events. As mentioned above, given the relatively lower degree of freedom of quasi-biweekly and intraseasonal signals, a longer time series is required in order to reduce uncertainties in our analyses. Thus, in the following section, we will make use of the century-long QBIE temperature event database based on the HKO station historical records, spanning from 1885 to 2002. Note that although the HKO station also includes observation data in 1884, records in this year only do not cover January–March. In addition, observations from 1940 to 1946 are not available due to the outbreak of WWII. Due to the above reasons, the following analyses are calculated based on QBIE events from 1885 to 1939 and 1947 to 2022, covering a total of 131 years.
4.1. Average Event Counts, Intensity, Duration, Extreme Days, and Event Days
Table 2 lists the climatological statistics of these QBIE events. From 1885 to 2022, the HKO station recorded a total of 392 heat waves and 513 cold surges, which is equivalent to 2.99 heat waves and 3.92 cold surges per year. In general, there are more QBIE cold surges than QBIE heat waves over the past century, regardless of whether the QBIE events are defined using daily mean, minimum, or maximum temperatures. In addition to the average event number, the number of days affected by QBIE heat waves is also greater compared to QBIE cold surges (Table 2). This indicates that the 10–60-day filtered temperature anomalies exhibit a skewed distribution, with more extreme values on the negative side.
Table 2.
Climatological statistics of QBIE events based on the HKO station records from 1885 to 2022, where data from 1940 to 1946 are not included.
The above results imply that Hong Kong is more frequently influenced by cold extremes than by hot extremes on the quasi-biweekly to intraseasonal timescale. This is also reflected in the intensities of QBIE events. The intensities of QBIE cold surges by daily minimum (−2.24 °C), mean (−2.09 °C), and maximum (−2.34 °C) temperature are on average 5–9% stronger than those of QBIE heat waves (+2.06, +1.99, and +2.21 °C). In contrast, the QBIE heat waves often last longer than QBIE cold surges. Specifically, the average durations of QBIE cold surges by daily minimum (10.67 days), mean (10.49 days), and maximum (10.08 days) temperature are 3–6% shorter than those of QBIE heat waves (10.96, 11.16, and 10.49 days).
4.2. Diversity of QBIE Events
As shown in Figure 4, the occurring frequency, duration, intensity, and peak dates of QBIE events, estimated from daily minimum, mean, and maximum temperatures, can vary significantly. These differences suggest the existence of distinct types of QBIE events, which are determined by their specific characteristics. For example, a QBIE heat wave that is identified solely from daily maximum temperature indicates that the event occurs only during daytime; conversely, an event identified only from daily minimum temperatures occurs at night only. Temperature extremes experienced during daytime and nighttime could have very different impacts on the environment and human health [33,34]. Thus, it is important to examine the diversity of QBIE temperature events and understand their climatological features. In this study, we classified all QBIE temperature events into six different categories, including (1) weak nighttime (WNT), (2) strong nighttime (SNT), (3) weak daytime (WDT), (4) strong daytime (SDT), (5) combined daytime and nighttime (CDN), and (6) other QBIE events.
Specifically, a WNT QBIE event is defined as one that is observed only in the daily minimum temperature series, but not in the daily mean and maximum temperature series. An SNT QBIE event is defined as one that appears in both the daily minimum and mean temperature series, but not in the daily maximum temperature series. Conversely, a WDT QBIE event is defined when it is observed only in the daily maximum temperature series, but not in the daily minimum and mean temperature series. An SDT QBIE event is defined if it is observed in the daily mean and maximum temperature series, but not in daily minimum temperature series. A CDN QBIE event is defined if it is observed in all the daily minimum, mean, and maximum temperature series. Events that do not fit into the above five categories are classified as other QBIE events (Table 3).
Table 3.
Six types of QBIE events. “T” represents normalized temperature anomaly ≥ ±2 standard deviations (σ), and “F” represents normalized temperature anomaly < ±2 standard deviations (σ).
Overall, CDN events are the most common type of QBIE events in Hong Kong. CDN heat waves (134 events) take up over one-third of all QBIE heat wave events (392 events), while CDN cold surges (208 events) account for 41% of all QBIE cold surge events (513 events). While WNT, SNT, and WDT events have similar event counts, SDT events occur less frequently, which suggests that nighttime events are slightly more common than daytime events (Figure 5a). This is also reflected in the comparisons of average event days among the various types of QBIE events (Figure 5d).
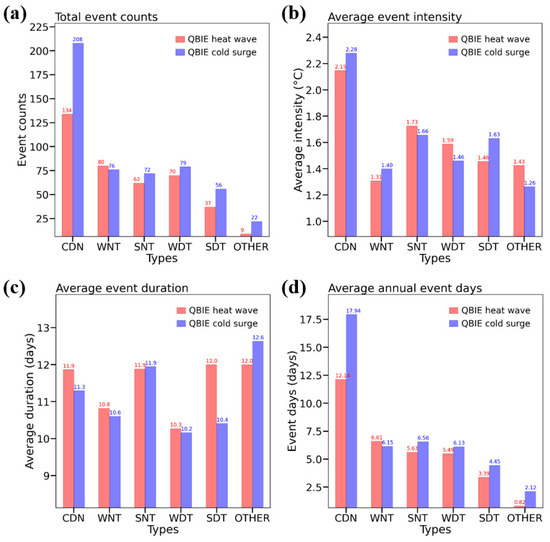
Figure 5.
Climatology of different types of QBIE events, including (a) total event counts, (b) average event intensity (unit: °C), (c) average event duration (unit: days), and (d) average number of event days (unit: days). Red and blue bars represent QBIE heat waves and cold surges, respectively.
In terms of event intensity, CDN events are, on average, stronger than all other four types, with intensities of 2.15 °C for heat waves and 2.28 °C for cold surges. WNT events (1.31 °C for heat waves and 1.40 °C for cold surges) and WDT events (1.59 °C for heat waves and 1.46 °C for cold surges) exhibit the lowest intensities, as expected (Figure 5b). Further, the average event durations appear to be approximately proportional to the event intensities (Figure 5c). Specifically, CDN, SNT, and SDT events, which have higher intensities, typically exhibit average durations longer than 11 days; on the contrary, WND and WDT events have average durations ranging from 10.2 to 10.8 days. Notably, WDT events have particularly short durations compared to other types of QBIE events. The above analyses show that different types of QBIE events are characterized by different occurrence frequency, intensity, and duration.
4.3. Seasonality of QBIE Heat Waves and Cold Surges
Apparent seasonality is observed in the activity of QBIE heat waves and cold surges. Figure 6a,b illustrate the seasonal variation in the characteristics of QBIE events. Results show that QBIE events are more frequent in autumn and winter, particularly in September, October, December, and January, compared to spring and summer. This is evident in both event counts and average annual event days (Figure 6a). In addition to occurrence frequency, the average event intensity of heat waves and cold surges also shows clear seasonality. Intensities of both heat wave and cold surge events stay high from late autumn to early spring but are relatively low in summer and early autumn (Figure 6b). These suggest that QBIE events in Hong Kong, associated with long-lasting heat waves or cold surges, tend to occur more frequently and be stronger in autumn and winter. However, no obvious seasonality is observed for average event duration (Figure 6b).
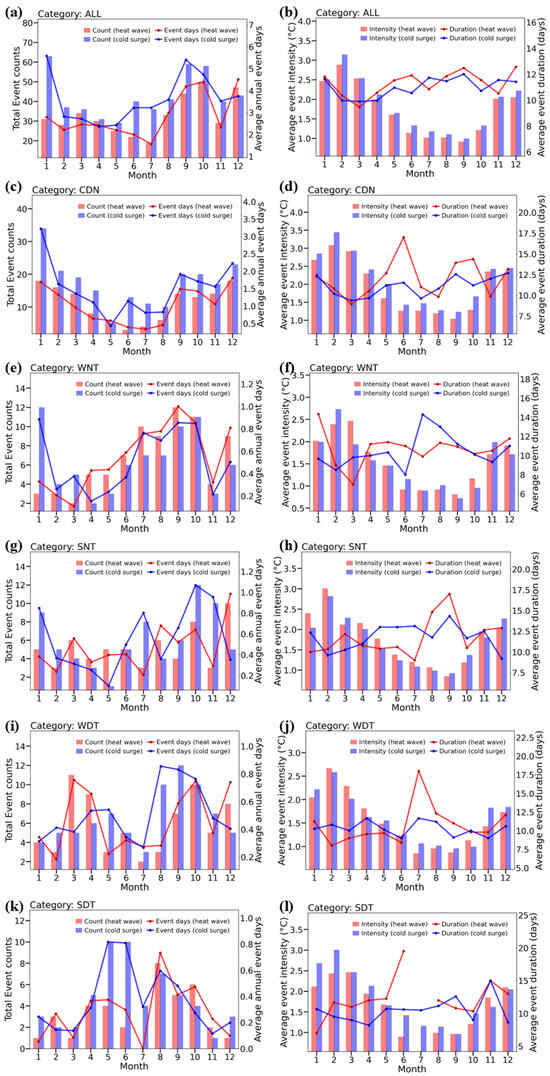
Figure 6.
Seasonal variation of (a) total event counts (bars) and average annual event days (curves, unit: days) for all QBIE heat waves (red) and cold surges (blue). (b) Same as (a) except for average event intensity (bars, unit: °C) and average event duration (curves, unit: days). (c–l) Same as (a,b) except for CDN (c,d), WNT (e,f), SNT (g,h), WDT (i,j), and SDT (k,l) events. Results are derived based on the HKO station observations from 1885 to 2022.
On the other hand, different types of QBIE events exhibit varying seasonal characteristics. For example, while CDN events occur more frequently in autumn and winter (Figure 6c), nighttime (SNT and WNT) QBIE events are more commonly observed in summer and autumn (Figure 6e,g). On the other hand, while WDT events occur more in spring and autumn (Figure 6i), SDT events do not display a clear seasonal cycle (Figure 6k). In terms of event intensity, all types of QBIE heat waves and cold surges are in general stronger in autumn and winter, reflecting the seasonality observed across all QBIE events (Figure 6b). Differently, the durations of all types of QBIE events are not featured with clear seasonal cycles (Figure 6d,f,h,j,l).
The above results indicate that the diversity in the seasonality of QBIE events is generally observed in their occurrence frequency and intensity. Our findings show that, on the quasi-biweekly and intraseasonal timescales, long-duration heat waves and cold surges are more commonly observed in autumn and winter. Additionally, these autumn and winter events are usually stronger, meaning they deviate more significantly from climatological norms, than those observed in spring and summer.
5. Variability of QBIE Temperature Events
Studies have reported the influence of climate change on the occurrence, intensity, and societal impacts of extreme weather events [1,4,5]. The long-term variability in extreme weathers has become a major concern for scientists, policymakers, and the public. In this section, we examine the long-term changes and variability in QBIE heat waves and cold surges in Hong Kong since 1885.
5.1. Long-Term Variability
We first examine the long-term variability in the occurrence frequency, intensity, and duration of QBIE heat wave and cold surge events in Hong Kong. Although a number of research studies have reported that climate change leads to more frequent and stronger extreme weather events, our results suggest that this is not entirely applicable to QBIE temperature events in Hong Kong.
When considering all types of QBIE events together, we observe statistically significant increasing trends only in the occurrence frequency (+0.11 events/decade) and the number of event days (+1.24 days/decade) of QBIE cold surges from 1885 to 2022. However, those of QBIE heat waves exhibit insignificant changes over the same period. In addition, no statistically significant trends are observed in the average intensity and duration of either QBIE heat waves or cold surges in the past 138 years (Table 4). These indicate that the overall statistics of QBIE temperature extremes in Hong Kong have not undergone substantial changes under the past anthropogenic warming climate. The only notable change is a modest increase in the occurrence of QBIE cold surge events.
Table 4.
Long-term linear trends of event count (unit: events/decade), intensity (unit: °C/decade), duration (unit: days/decade), and event days (unit: days/decade) of QBIE heat waves and cold surges from 1885 to 2022. Note that data from 1940 to 1947 were not included in the calculations. Asterisks indicate the confidence levels: 1 asterisk (*) = 90%, 2 asterisks (**) = 95%, and 3 asterisks (***) = 99%.
Similar results are observed across different types of QBIE temperature events, as most long-term trends from 1885 to 2022 are statistically insignificant (Table 4). Significant changes are observed only in specific categories and metrics of QBIE events. For example, for the number of event counts, significant increasing trends are found solely for CDN heat waves and cold surges. This indicates that while climate change has increased the likelihood of the strongest type of QBIE temperature events, it has not similarly affected other types.
However, despite the increase in CDN heat wave and cold surge events since 1885, the long-term trends in the annual average event days for these events remain statistically insignificant. This may be due to the lack of significant changes in the average event durations of CDN heat waves and cold surges. On the other hand, significant increases in average annual event days are observed for WNT (+0.46 days/decade) and SNT (+0.74 days/decade) cold surges, indicating that Hong Kong has experienced more nights affected by QBIE cold surges. Notably, the average event duration of WNT cold surges has increased significantly by 0.24 days/decade. In terms of average event intensity, a significant decreasing trend is observed only for WDT cold surges (−0.05 °C/decade), while the others exhibit insignificant trends (Table 4).
Overall, the above results indicate that most statistics of QBIE temperature events in Hong Kong do not show significant changes from 1885 to 2022. While previous studies have primarily focused on synoptic-scale extreme weathers, our findings suggest that the impacts of anthropogenic climate change may be more moderate when it comes to QBIE temperature extremes in Hong Kong. Despite a few observed significant trends, such as the more frequent QBIE cold surges, most of the statistics related to QBIE temperature events do not exhibit substantial changes over the 138-year period. These insights provide a valuable counterpoint to the existing body of research, which has tended to emphasize the impacts of climate change on synoptic-scale extreme weather.
5.2. Interannual Variability and Predictability
While long-term trends in the activity of QBIE temperature events are not significant, obvious interannual variations are observed (Figure 7a,d,g,j,m,p and Figure 8a,d,g,j,m,p). Here, we first employ the Autoregressive Integrated Moving Average (ARIMA) approach, a method commonly used in econometrics and time series analysis yet seldom applied in meteorology and climate science. This approach is particularly effective for modeling and forecasting nonstationary time series data by extracting their intrinsic temporal evolution patterns [35]. By applying the ARIMA to our century-long dataset of QBIE temperature extremes, we aim to explore the variability and predictability in these events over time.
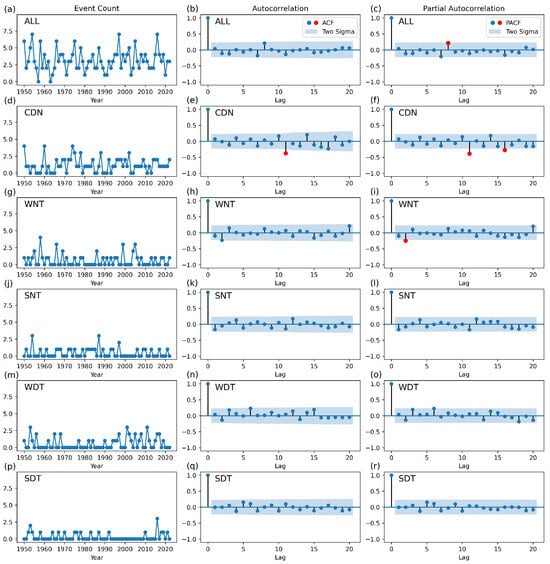
Figure 7.
The time series (a,d,g,j,m,p), autocorrelation plots (b,e,h,k,n,q), and partial autocorrelation plots (c,f,i,l,o,r) for annual event counts of six types of QBIE heat waves from 1950 to 2022. In the autocorrelation plots and partial autocorrelation plots, the blue shaded areas represent two standard deviations, with blue points indicating autocorrelation and partial autocorrelation coefficients within two standard deviations and red points indicating coefficients exceeding this range.
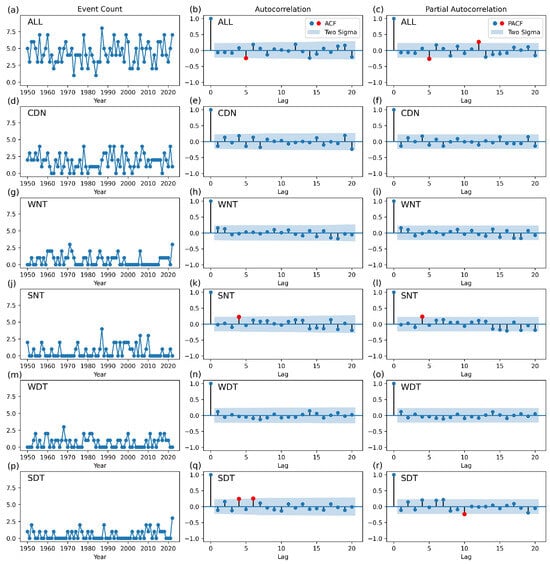
Figure 8.
Same as Figure 7, but for QBIE cold surge events. The time series (a,d,g,j,m,p), autocorrelation plots (b,e,h,k,n,q), and partial autocorrelation plots (c,f,i,l,o,r) for annual event counts of six types of QBIE cold surge from 1950 to 2022.
Through applying white noise tests (Ljung–Box Test, LB Test) [36] and ARIMA modeling analysis (Table 5) to six categories of QBIE event counts, we found that most time series could not be effectively modeled or predicted using the ARIMA model. The LB Test results indicated that eight out of twelve time series do not pass the white noise test. Only event count series of four kinds of QBIE events can be categorized as non-white-noise series, including CDN heat waves, SDT cold surges, SNT cold surges, and ALL cold surges. However, for these four non-white-noise time series, the residuals in ARIMA modeling are rather large, suggesting significant prediction errors when using the ARIMA model (Table 5).
Table 5.
ARIMA modeling results for different types of QBIE count events.
Figure 7 and Figure 8 further illustrate the lag-k autocorrelation and partial autocorrelation plots for the interannual event count variability of various types of QBIE heat waves and cold surges. In these plots, the blue shaded areas represent two standard deviations, and the blue and red points indicate autocorrelation coefficients (Figure 7b,e,h,k,n,q and Figure 8b,e,h,k,n,q) and partial autocorrelation coefficients (Figure 7c,f,i,l,o,r and Figure 8c,f,i,l,o,r). Correlation coefficients exceeding two standard deviations, shown as red points, represent significant correlations for the corresponding lags and indicate the potential for short-term climate prediction. The results show that significant correlations are generally absent across QBIE heat wave and cold surge events in six different QBIE categories. In particular, significant autocorrelation coefficients are only observed in CDN heat waves (11-year period, Figure 7e), SNT cold surges (4-year period, Figure 8k), and SDT cold surges (4- and 6-year period, Figure 8q). Meanwhile, significant partial autocorrelation coefficients are only observed in CDN heat waves (11- and 16-year period, Figure 7f), WNT heat waves (2-year period, Figure 7i), SNT cold surges (4-year period, Figure 8l), and SDT cold surges (10-year period, Figure 8r). However, these significant autocorrelations are likely results from the randomness of the time series rather than meaningful patterns, as indicated by their low correlation coefficients. In conclusion, due to the lack of substantial correlations in QBIE time series, it is challenging to model and predict QBIE events using the ARIMA model.
The above ARIMA analysis indicates that the interannual variability of QBIE temperature events in Hong Kong is generally not autocorrelated and suggests that it is almost not feasible to conduct short-term climate prediction on QBIE temperature events based on its past evolution patterns.
Hence, we further explore the potential for predicting interannual variability of Hong Kong’s QBIE heat waves and cold surges from the several dominant climate variability, including the Arctic Oscillation (AO), North Atlantic Oscillation (NAO), El Niño–Southern Oscillation (ENSO), and Indian Ocean Dipole (IOD). Specifically, we examine the correlations of the variability in annual event counts with the indices of these climate systems. Two key aspects are discussed below. First, since state-of-the-art climate models are able to partly capture the future states of these dominant climate systems, a high correlation coefficient between QBIE event counts and climate variability would help climatologists to predict interannual variability QBIE temperature events based on climate simulation products. Second, if a lead–lag correlation exists between QBIE event count and one of the dominant climate variability indices, it may be possible to predict QBIE activity based on the state of the climate system in the previous year. Thus, we particularly examine the 0-year and 1-year lead–lag correlation in the following analysis.
The analysis results show that no meaningful correlations are observed between Hong Kong’s QBIE temperature events with the above-mentioned climate variability. Although prior research has shown that tropical intraseasonal oscillations are closely related to climate systems such as AO and ENSO [37,38], we find that nearly all types of QBIE temperature events do not correlate with AO, NAO, ENSO, or IOD. The only exceptions are the relationships between IOD and the interannual variability of WNT QBIE heat waves, with a statistically significant correlation coefficient of −0.24, and between boreal winter ENSO and SDT heat waves, with a significant correlation coefficient of −0.40 (Figure 9a).
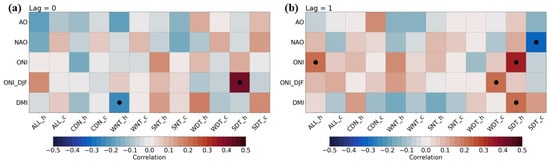
Figure 9.
Correlation coefficients of interannual variability in QBIE event counts with that in Arctic Oscillation (AO), North Atlantic Oscillation (NAO), El Niño–Southern Oscillation (ENSO, indicated by ONI and ONI_DJF), and Indian Ocean Dipole (IOD, indicated by DMI). Panels (a,b) present correlations with no time lags and 1-year time lag, respectively. On the y-axis, ONI and ONI_DJF denote the annual and boreal winter oceanic Niño index, respectively. DMI refers the Indian Ocean dipole mode index. On the x-axis, labels include prefixes that indicate the types of QBIE events and suffixes that denote heat waves (h) and cold surges (c). The black dots indicate correlation coefficients that are statistically significant at the 90% confidence level. Results are based on data from 1950 to 2022, the common period during which all climate indices are available.
Similar results are observed in the 1-year lead–lag correlation analyses, where climate variability leads QBIE event counts by 1 year. Namely, most correlation coefficients are statistically insignificant. A few statistically significant correlations are observed, such as between SDT QBIE heat waves and ENSO and between SDT QBIE cold surges and NAO; however, the highest correlation coefficient only reaches 0.34. The relatively low correlations between QBIE event counts and climate variability suggest that it is challenging to build a valid statistical model to predict the interannual variability of QBIE events in Hong Kong. Together with the findings from the ARIMA analyses, these results indicate a relatively low predictability for the interannual variability of long-lived heat waves and cold surges in Hong Kong.
6. Conclusions and Discussion
This study serves as one of the very few fundamental works focusing on the century-long record of Hong Kong QBIE events. Historical Hong Kong QBIE heat waves and cold surges from 1885 to 2022 are identified based on station observations of daily mean, minimum, and maximum temperature. According to their occurrence time, all QBIE events were categorized according to their characteristics, namely, the combined daytime and nighttime (CDN), weak nighttime (WNT), strong nighttime (SNT), weak daytime (WDT), and strong daytime (SDT) QBIE events. The climatology, seasonality, diversity, long-term variability, and predictability of these QBIE events are examined. A total of 382 QBIE heat waves and 510 QBIE cold surges are identified from 1885 to 2022, exhibiting various characteristics in their occurring time and seasonality. Based on ARIMA model and time series analyses, we find that while apparent interannual variability exists in QBIE heat wave and cold surge activity, short-term climate prediction of QBIE temperature events based on past patterns or common climate indices is largely unfeasible.
In general, there are more QBIE cold surges being observed in the past century than QBIE heat waves. The average intensity of QBIE cold surge is also overall stronger, indicating that the temperature anomalies on the quasi-biweekly to intraseasonal timescales show a rather skewed distribution, with more extreme values on the negative side. Among the different types of QBIE events, CDN events are the most commonly recorded in Hong Kong, accounting for more than 30% of all QBIE temperature events in Hong Kong. In addition, CDN events have the strongest average intensity compared to other types, followed by SNT and SDT events. The average durations of CDN, SNT, and SDT events are also longer than those of WNT and WDT events. Apparent seasonality is observed mostly on the occurrence frequency of QBIE events and the number of event days, but it shows large differences among different types of events.
Given the importance and potential impacts of extreme weather in the QBWO and ISO timescales, we further examine how climate change has influenced historical QBIE temperature events. Interestingly, our results show that there is a significant overall increase in QBIE cold surge events, although most statistics related to QBIE temperature events in Hong Kong do not exhibit significant long-term trends during the period of 1885–2022. This is, to some extent, inconsistent with previous findings that suggest climate change reduces the frequency of extreme cold surges [12]. However, it is noted that the timescales (10–60 days) of interest in this study differ from those in previous research, which mostly focuses on synoptic weather extremes (<7 days) [39,40]. This discrepancy indicates that the response of extreme weather to climate change may be dependent on the timescales of these events [41]. More importantly, it highlights the need to develop strategies to mitigate the rising risks of long-lasting cold surge events in Hong Kong under future climate change. In addition, although obvious interannual variability is observed for the QBIE event activity, we find that short-term climate prediction of QBIE temperature events based on past patterns or common climate indices is largely unfeasible. Both ARIMA and correlation analyses show that predicting the interannual variability of QBIE temperature events based on past evolution patterns or common climate indices is quite challenging, unlike previous research demonstrating the capability of the ARIMA model in climate prediction [42,43]. This suggests that interannual variability is difficult to predict using historical patterns, which poses significant challenges for short-term climate prediction of these extreme events in Hong Kong. This limitation of our study suggests the need to explore other advanced approaches for predicting interannual variation of QBIE events.
Another limitation of this study is the lack of parallel data to confirm the robustness of the results, which are mainly derived from observations at a single station, namely, the HKO station. Of course, a key reason for this limitation is that there are very limited available century-long firsthand observational data. If more extensive data are available, it would be even possible to develop a statistical model for predicting the interannual variability of QBIE events using machine learning approaches [44]. Nevertheless, despite these limitations, this study, as one of the very few fundamental works focusing on the century-long QBIE events, offers a valuable insight into the impacts of climate change on extreme events across different timescales, providing references for making suitable decisions against natural disasters, particularly those involving prolonged extreme weather events.
Author Contributions
Conceptualization, H.K., P.W.C. and J.C.-H.L.; data curation, P.W.C.; formal analysis, H.K., K.W. and J.C.-H.L.; funding acquisition, B.Z.; methodology, H.K. and J.C.-H.L.; supervision, H.K., P.W.C. and J.C.-H.L.; visualization, H.K., K.W. and J.C.-H.L.; writing—original draft, K.W. and J.C.-H.L.; writing—review and editing, H.K., P.W.C., J.L., B.Z. and J.C.-H.L. All authors have read and agreed to the published version of the manuscript.
Funding
This work is funded and supported by the Guangdong Basic and Applied Basic Research Foundation (2020A1515110275) and the Guangdong Province Introduction of Innovative R&D Team Project (2019ZT08G669).
Institutional Review Board Statement
Not applicable.
Informed Consent Statement
Not applicable.
Data Availability Statement
Restrictions apply to the availability of these data. Data were obtained from Hong Kong Observatory and are available from the authors with the permission of Hong Kong Observatory.
Conflicts of Interest
The authors declare no conflicts of interest.
References
- Franzke, C.L.E.; Torelló i Sentelles, H. Risk of Extreme High Fatalities Due to Weather and Climate Hazards and Its Connection to Large-Scale Climate Variability. Clim. Change 2020, 162, 507–525. [Google Scholar] [CrossRef]
- Jeong, J.H.; Ho, C.H.; Kim, B.M.; Kwon, W.T. Influence of the Madden-Julian Oscillation on Wintertime Surface Air Temperature and Cold Surges in East Asia. J. Geophys. Res. D Atmos. 2005, 110, D11104. [Google Scholar] [CrossRef]
- Pendergrass, A.G. What Precipitation Is Extreme? Science 2018, 360, 1072–1073. [Google Scholar] [CrossRef]
- Marx, W.; Haunschild, R.; Bornmann, L. Heat Waves: A Hot Topic in Climate Change Research. Theor. Appl. Climatol. 2021, 146, 781–800. [Google Scholar] [CrossRef]
- Miller, S.; Chua, K.; Coggins, J.; Mohtadi, H. Heat Waves, Climate Change, and Economic Output. J. Eur. Econ. Assoc. 2021, 19, 2658–2694. [Google Scholar] [CrossRef]
- Newman, R.; Noy, I. The Global Costs of Extreme Weather That Are Attributable to Climate Change. Nat. Commun. 2023, 14, 6103. [Google Scholar] [CrossRef]
- Wen, J.; Zhao, X.-X.; Chang, C.-P. The Impact of Extreme Events on Energy Price Risk. Energy Econ. 2021, 99, 105308. [Google Scholar] [CrossRef]
- Furtak, K.; Wolińska, A. The Impact of Extreme Weather Events as a Consequence of Climate Change on the Soil Moisture and on the Quality of the Soil Environment and Agriculture—A Review. Catena 2023, 231, 107378. [Google Scholar] [CrossRef]
- Chen, F.; Liu, M.; Yang, C.; Hao, X.; Chen, Z. Effect on the Health of Newborns Caused by Extreme Temperature in Guangzhou. J. Environ. Manag. 2022, 311, 114842. [Google Scholar] [CrossRef]
- Brown, S.J. Future Changes in Heatwave Severity, Duration and Frequency Due to Climate Change for the Most Populous Cities. Weather. Clim. Extrem. 2020, 30, 100278. [Google Scholar] [CrossRef]
- Huang, H.; Leung, J.C.-H.; Chan, J.C.L.; Liu, J.; Qian, W.; Zhang, B. Recent Unusual Consecutive Spring Tropical Cyclones in North Atlantic and Winter Oceanic Precursor Signals. J. Meteorol. Res. 2023, 37, 208–217. [Google Scholar] [CrossRef]
- Masson-Delmotte, V.; Zhai, P.; Pirani, A.; Connors, S.L.; Péan, C.; Berger, S.; Caud, N.; Chen, Y.; Goldfarb, L.; Gomis, M.I.; et al. IPCC, 2021: Climate Change 2021: The Physical Science Basis. Contribution of Working Group I to the Sixth Assessment Report of the Intergovernmental Panel on Climate Change; Cambridge University Press: Cambridge, UK, 2021. [Google Scholar]
- Masson-Delmotte, V.; Zhai, P.; Pörtner, H.-O.; Roberts, D.; Skea, J.; Shukla, P.R.; Pirani, A.; Moufouma-Okia, W.; Péan, C.; Pidcock, R.; et al. (Eds.) Global Warming of 1.5°C—An IPCC Special Report on the Impacts of Global Warming of 1.5°C above Pre-Industrial Levels and Related Global Greenhouse Gas Emission Pathways, in the Context of Strengthening the Global Response to the Threat of Climate Change; Intergovernmental Panel on Climate Change (IPCC): Geneva, Switzerland, 2018. [Google Scholar]
- Qian, W.; Wu, K.; Leung, J.C.-H. Three-Dimensional Structure and Long-Term Trend of Heat Wave Events in Western Eurasia Revealed with an Anomaly-Based Approach. Int. J. Climatol. 2016, 36, 4315–4326. [Google Scholar] [CrossRef]
- Utsumi, N.; Kim, H. Observed Influence of Anthropogenic Climate Change on Tropical Cyclone Heavy Rainfall. Nat. Clim. Change 2022, 12, 436–440. [Google Scholar] [CrossRef]
- Yang, X.; Zeng, G.; Zhang, G.; Iyakaremye, V.; Xu, Y. Future Projections of Winter Cold Surge Paths over East Asia from CMIP6 Models. Int. J. Climatol. 2021, 41, 1230–1245. [Google Scholar] [CrossRef]
- Li, R.C.Y.; Zhou, W. Multiscale Control of Summertime Persistent Heavy Precipitation Events over South China in Association with Synoptic, Intraseasonal, and Low-Frequency Background. Clim. Dyn. 2015, 45, 1043–1057. [Google Scholar] [CrossRef]
- Kajikawa, Y.; Yasunari, T.; Wang, B. Decadal Change in Intraseasonal Variability over the South China Sea. Geophys. Res. Lett. 2009, 36, L06810. [Google Scholar] [CrossRef]
- Chongyin, L.; Zhenxia, L.; Qingyun, Z. Strong/ Weak Summer Monsoon Activity over the South China Sea and Atmospheric Intraseasonal Oscillation. Adv. Atmos. Sci. 2001, 18, 1146–1160. [Google Scholar] [CrossRef]
- Chen, Y.; Zhai, P. Simultaneous Modulations of Precipitation and Temperature Extremes in Southern Parts of China by the Boreal Summer Intraseasonal Oscillation. Clim. Dyn. 2017, 49, 3363–3381. [Google Scholar] [CrossRef]
- Liu, F.; Zhou, J.; Wang, B.; Leung, J.C.-H.; Chen, D.; Lin, Z.; Kang, I.-S.; Chao, Q.; Ke, Z.; Fan, K.; et al. Opportunities and Barriers for Skillful Subseasonal Prediction of East Asian Summer Precipitation. Bull. Am. Meteorol. Soc. 2024, 105, E2216–E2230. [Google Scholar] [CrossRef]
- Chen, R.; Wen, Z.; Lu, R. Large-Scale Circulation Anomalies and Intraseasonal Oscillations Associated with Long-Lived Extreme Heat Events in South China. J. Clim. 2018, 31, 213–232. [Google Scholar] [CrossRef]
- Chong, M.-L.; Yeung, H.-Y.; Hon, K.-K. Study of Extreme Cold Surges in Hong Kong. Meteorology 2023, 2, 52–71. [Google Scholar] [CrossRef]
- Luo, M.; Lau, N.-C. Heat Waves in Southern China: Synoptic Behavior, Long-Term Change, and Urbanization Effects. J. Clim. 2017, 30, 703–720. [Google Scholar] [CrossRef]
- Wang, W.; Zhou, W.; Li, X.; Wang, X.; Wang, D. Synoptic-Scale Characteristics and Atmospheric Controls of Summer Heat Waves in China. Clim. Dyn. 2016, 46, 2923–2941. [Google Scholar] [CrossRef]
- Qin, Y.; Qin, Y.; Shen, Y.; Li, Y.; Xiang, B. Numerical Study on the Effects of Intraseasonal Oscillations for a Persistent Drought and Hot Event in South China Summer 2022. Remote Sens. 2023, 15, 892. [Google Scholar] [CrossRef]
- Qian, W.; Leung, J.C.-H.; Chen, Y.; Huang, S. Applying Anomaly-Based Weather Analysis to the Prediction of Low Visibility Associated with the Coastal Fog at Ningbo-Zhoushan Port in East China. Adv. Atmos. Sci. 2019, 36, 1060–1077. [Google Scholar] [CrossRef]
- Qian, W.; Du, J.; Ai, Y. A Review: Anomaly Based versus Full-Field Based Weather Analysis and Forecasting. Bull. Am. Meteorol. Soc. 2021, 102, E849–E870. [Google Scholar] [CrossRef]
- Leung, J.C.-H.; Qian, W.; Zhang, P.; Zhang, B. Geopotential-Based Multivariate MJO Index: Extending RMM-like Indices to Pre-Satellite Era. Clim. Dyn. 2022, 59, 609–631. [Google Scholar] [CrossRef]
- Gao, Y.; Hsu, P.-C.; Li, T. Effects of High-Frequency Activity on Latent Heat Flux of MJO. Clim. Dyn. 2019, 52, 1471–1485. [Google Scholar] [CrossRef]
- Duchon, C.E. Lanczos Filtering in One and Two Dimensions. J. Appl. Meteorol. Climatol. 1979, 18, 1016–1022. [Google Scholar] [CrossRef]
- Leung, J.C.-H.; Qian, W. Monitoring the Madden–Julian Oscillation with Geopotential Height. Clim. Dyn. 2017, 49, 1981–2006. [Google Scholar] [CrossRef]
- Luo, M.; Lau, N.-C.; Liu, Z. Different Mechanisms for Daytime, Nighttime, and Compound Heatwaves in Southern China. Weather Clim. Extrem. 2022, 36, 100449. [Google Scholar] [CrossRef]
- McMichael, A.J.; Lindgren, E. Climate Change: Present and Future Risks to Health, and Necessary Responses. J. Intern. Med. 2011, 270, 401–413. [Google Scholar] [CrossRef] [PubMed]
- Shumway, R.H.; Stoffer, D.S. ARIMA Models. In Time Series Analysis and Its Applications: With R Examples; Shumway, R.H., Stoffer, D.S., Eds.; Springer International Publishing: Cham, Switzerland, 2017; pp. 75–163. ISBN 978-3-319-52452-8. [Google Scholar]
- Ljung, G.M.; Box, G.E.P. On a Measure of Lack of Fit in Time Series Models. Biometrika 1978, 65, 297–303. [Google Scholar] [CrossRef]
- Roundy, P.E. On the Interpretation of EOF Analysis of ENSO, Atmospheric Kelvin Waves, and the MJO. J. Clim. 2015, 28, 1148–1165. [Google Scholar] [CrossRef]
- Garfinkel, C.I.; Benedict, J.J.; Maloney, E.D. Impact of the MJO on the Boreal Winter Extratropical Circulation. Geophys. Res. Lett. 2014, 41, 6055–6062. [Google Scholar] [CrossRef]
- Ou, T.; Chen, D.; Jeong, J.-H.; Linderholm, H.W.; Zhou, T. Changes in Winter Cold Surges over Southeast China: 1961 to 2012. Asia Pac. J. Atmos. Sci. 2015, 51, 29–37. [Google Scholar] [CrossRef]
- Park, T.-W.; Ho, C.-H.; Jeong, S.-J.; Choi, Y.-S.; Park, S.K.; Song, C.-K. Different Characteristics of Cold Day and Cold Surge Frequency over East Asia in a Global Warming Situation. J. Geophys. Res. 2011, 116, D12118. [Google Scholar] [CrossRef]
- Zhang, W.; Furtado, K.; Wu, P.; Zhou, T.; Chadwick, R.; Marzin, C.; Rostron, J.; Sexton, D. Increasing Precipitation Variability on Daily-to-Multiyear Time Scales in a Warmer World. Sci. Adv. 2021, 7, eabf8021. [Google Scholar] [CrossRef]
- Dimri, T.; Ahmad, S.; Sharif, M. Time Series Analysis of Climate Variables Using Seasonal ARIMA Approach. J. Earth Syst. Sci. 2020, 129, 149. [Google Scholar] [CrossRef]
- Rosmiati, R.; Liliasari, S.; Tjasyono, B.; Ramalis, T.R. Development of ARIMA Technique in Determining the Ocean Climate Prediction Skills for Pre-Service Teacher. J. Phys. Conf. Ser. 2021, 1731, 012072. [Google Scholar] [CrossRef]
- Chantry, M.; Bouallegue, Z.B.; Magnusson, L.; Maier-Gerber, M.; Dramsch, J. The Rise of Machine Learning in Weather Forecasting. Available online: https://www.ecmwf.int/en/about/media-centre/science-blog/2023/rise-machine-learning-weather-forecasting (accessed on 21 May 2024).
Disclaimer/Publisher’s Note: The statements, opinions and data contained in all publications are solely those of the individual author(s) and contributor(s) and not of MDPI and/or the editor(s). MDPI and/or the editor(s) disclaim responsibility for any injury to people or property resulting from any ideas, methods, instructions or products referred to in the content. |
© 2025 by the authors. Licensee MDPI, Basel, Switzerland. This article is an open access article distributed under the terms and conditions of the Creative Commons Attribution (CC BY) license (https://creativecommons.org/licenses/by/4.0/).