Article

Physical, Compressive Strength, and Microstructural Characteristics of Alkali-Activated Engineered Composites Incorporating MgO, MWCNTs, and rGO

by
Mohammad Ali Hossain
and
Khandaker M. A. Hossain
*
Department of Civil Engineering, Toronto Metropolitan University, Toronto, ON M5B 2K3, Canada
*
Author to whom correspondence should be addressed.
Appl. Sci. 2025, 15(4), 1712; https://doi.org/10.3390/app15041712
Submission received: 21 December 2024 / Revised: 31 January 2025 / Accepted: 4 February 2025 / Published: 7 February 2025
(This article belongs to the Special Issue Alkali-Activated Materials: Advances and Novel Applications)

Abstract

:

Featured Application

The developed different classes of AAECs with smart functional properties can be used as self-healing, self-sensing, piezoresistive, conductive, and 3D-prining materials, especially in bridge and building infrastructures.

Abstract

Thirty-two ambient cured alkali-activated engineered composites (AAECs) were developed by incorporating MgO, multi-walled carbon nanotubes (MWCNTs), reduced graphene oxide (rGO), and polyvinyl alcohol (PVA) fiber with a one-part dry mix technique using powder-based activators/reagents. The effects of material variables, namely binary or ternary combination source materials (fly ash C or F and ground granulated blast furnace slag ‘GGBFS’), two types of reagents with varying chemical ratios and dosages of additives (from 0 to 5% MgO and from 0 to 6% MWCNT/rGO), on the physical (slump flow, flow time, flow velocity, and density), hardness (compressive strength from 0 to 180 days and 28-day ultrasonic pulse velocity ‘UPV’), and micro-structural (SEM/EDS, XRD and FTIR) properties were evaluated. All these variables, individually or combined, influenced the properties and microstructural aspects of AAECs. Problems associated with the dispersion and agglomeration of nanomaterials, which could disrupt the microstructure and weaken its mechanical/physical properties, were avoided through the use of defined ultra-sonication with a high-shear mixing protocol. All AAECs achieved a 28-day compressive strength ranging from 26.0 MPa to 48.5 MPa and a slump flow > 800 mm, satisfying the criteria for flowable structural concrete. The addition of 5% MgO and up to 0.3% MWCNT/rGO increased the compressive strength/UPV of AAECs with MgO-MWCNT or rGO combination provided an improved strength at a higher dosage of 0.6%. A linear correlation between compressive strength and UPV was derived. As per SEM/EDS and XRD analyses, besides common C-A-S-H/N-C-A-S-H or C-A-S-H/C-S-H gels, the addition of MgO led to the formation of magnesium-aluminum hydrotalcite (Ht) and M-S-H (demonstrating self-healing potential), while the incorporation of rGO produced zeolites which densified the matrix and increased the compressive strength/UPV of the AAECs. Fourier transform infrared spectrometer (FTIR) analysis also suggested the formation of an aluminosilicate network in the AAECs, indicating a more stable structure. The increased UPV of MWCNT/rGO-incorporated AAECs indicated their better conductivity and ability of self-sensing. The developed AAECs, incorporating carbon-nano materials and MgO additive, have satisfactory properties with self-healing/-sensing potentials.

1. Introduction

The high population growth and new global standards of modern construction require more demanding and sustainable infrastructures. Statistical trends estimate an increase in global cement production from 4.3 in 2015 to nearly 6.1 billion metric tons in 2050 [1,2], which would involve demolishing reserves of limestone, increasing global CO2 emissions by around 7%, and conducting an energy-consuming process with an energy intensity of about 4.8 GJ [3]. Geopolymers, also named “alkali-activated (AA) binders”, have been introduced as a promising alternative to Portland cement with a lower environmental impact, producing 60% less energy and approximately 80–90% less greenhouse gas [4,5,6]. The mechanism of producing geopolymers is a polymerization process that involves the chemical reaction of alumina-silicate materials (such as fly ash (FA), volcanic materials, ground granulated blast furnace slag (GGBFS), metakaolin (MK), etc.) in the presence of alkaline activators (such as sodium sulphate, calcium hydroxide, sodium silicate, etc.), resulting in three-dimensional Si-O-Al chains/bonds: poly sialate (-Si-O-Al-O-), poly sialate-siloxo (Si-O-Al-O-Si-O), and poly sialate-disiloxo (Si-O-Al-O-Si-OSi-O) [1,2,7,8,9,10]. Geopolymers/AA binders provide high mechanical strength, better resistance to corrosion/fire, and lower creep/shrinkage [11]. However, one major constraint associated with the use of geopolymer mortars on a commercial scale is their low-strength development at ambient temperature curing and the need for heat curing [12]. To overcome this problem, additives such as slag, lime, and ultrafine fly ash are being added during their geo-polymerization [13,14].
Research has been conducted on the fresh state and hardened properties of AA/geopolymer materials and, to improve such properties, nanomaterials and other additives have been added [15,16,17,18]. The shrinkage deformation and cracking are more significant in geopolymer paste than in cement due to its lower porosity/pore diameter and quick curing/hardening. This elucidates the importance of improving the volume stability and durability of this material by adding shrinkage compensation compounds such as calcium oxide, calcium sulphoaluminate, and MgO [19,20,21,22]. Calcium oxide and calcium sulphoaluminate react violently in a high alkali environment and cannot achieve an excellent compensating shrinkage effect in geopolymers, suggesting the use of MgO, which can induce a self-healing ability [22,23,24].
More recently, cement-free alkali-activated engineered composites (AAECs) using polyvinyl alcohol (PVA) and other fibers that exhibit strain hardening and micro-cracking characteristics with satisfactory fresh state, strength, durability, and shrinkage characteristics have been developed as more green, sustainable alternatives to traditional engineered cementitious composites (ECCs) [1,4,25,26,27,28,29,30]. The total substitution of cement with industrial by-products in AAECs decreases the energy investment, pollution, and use of virgin materials, which facilitates infrastructure sustainability through the simultaneous enhancement of durability and material greenness [1,31]. One-part ambient-cured AAECs produced using binary combinations of fly ash class C (FA-C) and ground-granulated blast furnace slag (GGBFS) with powder-form alkaline reagents and PVA fiber exhibited higher compressive strengths and ultrasonic pulse velocities, due to the formation of a combination of reaction products (C-S-H/C-A-S-H), compared to the mixture of amorphous (N-C-A-S-H/N-A-S-H) and crystalline (C-A-S-H/C-S-H) binding phases in their ternary (FA-C + FA class F ‘FA-F’ + GGBFS) counterparts [1]. An investigation on engineered geopolymer composites (EGCs) made of fly ash, GGBFS, fine silica sand, and a 2% volume fraction of two fiber types showed a significant increase in the tensile strength with the use of steel compared to polyethylene fibers [32].
In recent years, there has been a significant increase in the use of nanomaterials in concrete to achieve enhanced properties. Nanomaterials are specifically incorporated into AA mortars and composites to improve their mechanical and durability characteristics [33,34,35]. Most of the prior studies have shown that increasing the proportion of nano-additives improves mechanical properties such as the compressive and flexural strength [18,36,37]. The addition of multi-wall 0.1 wt% carbon nanotubes (CNTs), pre-sonicated in water with a polycarboxylate-based superplasticizer, increased the compressive strength of AA slag mortars, and X-ray diffraction (XRD) and Fourier transform infrared spectroscopy (FTIS) showed that CNTs enhanced the amorphous geopolymer structure [38]. However, a higher CNT ratio resulted in its agglomeration and limited the propagation of the geopolymerization reaction, causing a negative effect on the material’s physical and mechanical properties. An increase of approximately 32% for the 28-day compressive test was observed for 0.5% multi-walled CNTs (MWCNTs) incorporated into metakaolin (MK) that was based on AA composites that had NaOH and Na2SiO3 as activators [35]. Li et al. [39] investigated the effect of adding 0.05–0.15 wt% of functionalized MWCNTs grafted by carboxyl groups, 0.5–0.25% PVA fibers, and 10–30 wt% of GGBFS on the mechanical properties of FA-based AAC. Among the three variable precursors, changes in the GGBFS followed by the MWCNTs and PVA fibers have the greatest effect on changes in the compressive strength. They also stated that the optimal value of MWCNTs was 0.1%, which resulted in a denser microstructure; however, adding more than that reduced the compressive strength significantly. Rovnaník et al. [40] declared that the addition of from 0.05 to 0.5% MWCNTs increased the compressive strength while 1% showed about a 13% decrease. XRD analysis demonstrated an increase in the amorphous phase and geopolymerization after the addition of MWCNTs to the FA-incorporated geopolymer paste, showing a dense matrix and a lower content of unreacted fly ash [41]. No noticeable influence of MWCNTs on the reaction products has been observed via XRD or Fourier transform infrared spectrometer (FTIR) analysis, even though that MWCNTs can act as nucleation sites and accelerate polymerization [35,38,42]. The effective dispersion of CNTs is crucial for maximizing their benefits in AA concrete composites, as strong attractive forces between CNT particles cause rapid clumping (agglomeration), which disrupts the microstructure and weakens the mechanical and physical properties [43]. Ultra-sonication with high-shear mixing (mechanical) [44] or the functionalization approach (chemical) of modifying the CNT surface with compatible chemicals [45] are proposed to reduce attraction and promote better dispersion.
Revathi and Jeyalakshmi [46] observed an increase in the compressive strength of two types (one hardened with phosphoric acid and the other with sodium silicate) of MK-based geopolymers with 2% reduced graphene oxide (rGO). Zhou et al. [47] added 0.7% large and small GO to MK-based geopolymers and indicated that large GO has a smaller increasing effect on the compressive and tensile strength of geopolymer due to blocking chemical reactions between geopolymer particles. Ranjbar et al. [48] reported that, when increasing the graphene nanoplatelets (GNPs) content from 0.1 to 1 wt% in FA-based geopolymer, the compressive strength steadily increased, showing the highest enhancement of 144% at 1% GNPs. On the other hand, Dong et al. [49] revealed that the compressive strength decreased steadily when the GO content was increased from 0 to 0.12% in alkali-activated slag with an alkaline activator consisting of 6 wt% NaOH. Matalkah and Soroushian [50] used from 0 to 0.3 vol% GNPs in AA concrete based on a ternary blend of FA, GGBFS, and albite, and found that the compressive strength decreased with the addition of GNPs at 0.1 and 0.3 vol and slightly increased at 0.2%. The 28-day compressive strength of fly ash geopolymer was improved by 23% with the addition of GO admixed at 0.02% by mass of fly ash, where a nuclear magnetic resonance (NMR) study showed that the GO improved the polymerization degree by increasing the total Q3 and Q4 Si-tetrahedrons, suggesting potential for improving the immobilization of heavy metals in fly ash [51]. Saafi et al. [17] investigated the mechanical properties, morphological changes, and chemical functional group changes of fly ash geopolymer composites by incorporating rGO and GO in fly ash geopolymer composites and found an increase of 134% in flexural strength, 376% in the Young’s modulus, and 56% in toughness due to the restacking of rGO as a nano filler.
The use of MgO as a shrinkage-reducing mineral additive dates back to the mid-1970s [52]. The chemical, autogenous, and drying shrinkage decrease with the addition of reactive MgO in the presence of water, as it reacts to form fine Mg(OH)2 crystals in geopolymer paste to produce uniform expansion, refine the pore size, and increase the compressive strength [53]. An increase in compressive strength of 26% at an early age was observed for AA slag (AAS) pastes with 5% MgO [54]. The effect of MgO in AAS systems has been investigated, both in terms of its varying natural content in different slag compositions [55] and its use as an additive [56]. Studies on this topic revealed that, although the main hydration product is still C–S–H gel, MgO reacts with the slag to form hydrotalcite ‘Ht’ (Mg6Al2(OH)16CO3·4H2O)-like phases whose content increases with increases in the MgO content. The formation of low-density Ht/M-S-H phase (compared to CSH) was also confirmed by X-ray diffraction (XRD), thermogravimetric analysis (TGA), and scanning electron microscopy (SEM) analyses, and was shown to cause healing for cracks resulting from the shrinkage of AAS [55,57].
The literature contains previous research on the fresh state and mechanical properties of AA/geopolymer binders but limited research on AAECs incorporating CNTs/MWCNTs, with no significant studies using rGO, MgO, or a combination of MgO-MWCNTs/rGO. Moreover, the current literature does not provide specific directives to assess changes in the complicated fresh state, mechanical, or micro-structural properties of AAECs containing nanomaterials (such as MWCNTs or rGO), self-healing agents like MgO, or their combinations. In addition, most of the currently available literature is concentrated on the performance of heat-cured AAECs using the two-part (wet mix) rather than the one-part (dry mix) technique with solution-based reagents (which are corrosive and difficult to handle) and low calcium-based systems.
This paper focuses on the development and evolution of the fresh state and mechanical properties of PVA-fiber-reinforced ambient-cured AAECs containing healing agents (such as MgO) and nanomaterials (MWCNT and rGO). The novel aspects of this study addressing the current research gaps are the use of binary and ternary combinations of FA and GGBFS as precursors, two combinations of reagents (type 1 and type 2), high-calcium-based activators/regents rather than traditional Na-based ones, and a one-part dry mix technique with ambient curing as well as a comparative performance study considering variable mix design parameters and materials. The influences of the mix ingredients, such as the combinations of reagents, binary/ternary blends, fundamental chemical ratios present in the precursors/reagents, and the MWCNT/rGO/MgO dosages, on the physical properties in terms of workability (slump flow, flow time, flow velocity, and setting times) and mechanical properties (compressive strength and ultrasonic pulse velocity ‘UPV’) of AAECs have been described with reference to micro-structural characterization using SEM/EDS, XRD, and FTIR analyses. Moreover, correlations among the fresh state and mechanical properties (compressive strength-UPV) of the studied materials are developed. The results of this study will benefit engineers and scientists in developing and characterizing green low-carbon AAECs with additional smart functional properties (such as self-healing, self-sensing, electrical conductivity, piezoresistivity, and usability in 3D-printing) compared to traditional cementitious ECC for structural applications in bridge and building infrastructures [58]. The use of MgO, MWCNTs, and rGO at small doses will increase the cost of AAECs but the induced multifunctional properties will provide cost-compensation with aided benefits during their entire life cycle.

2. Experimental Program, Materials, Mix Designs, Mix Preparation, and Test Methods
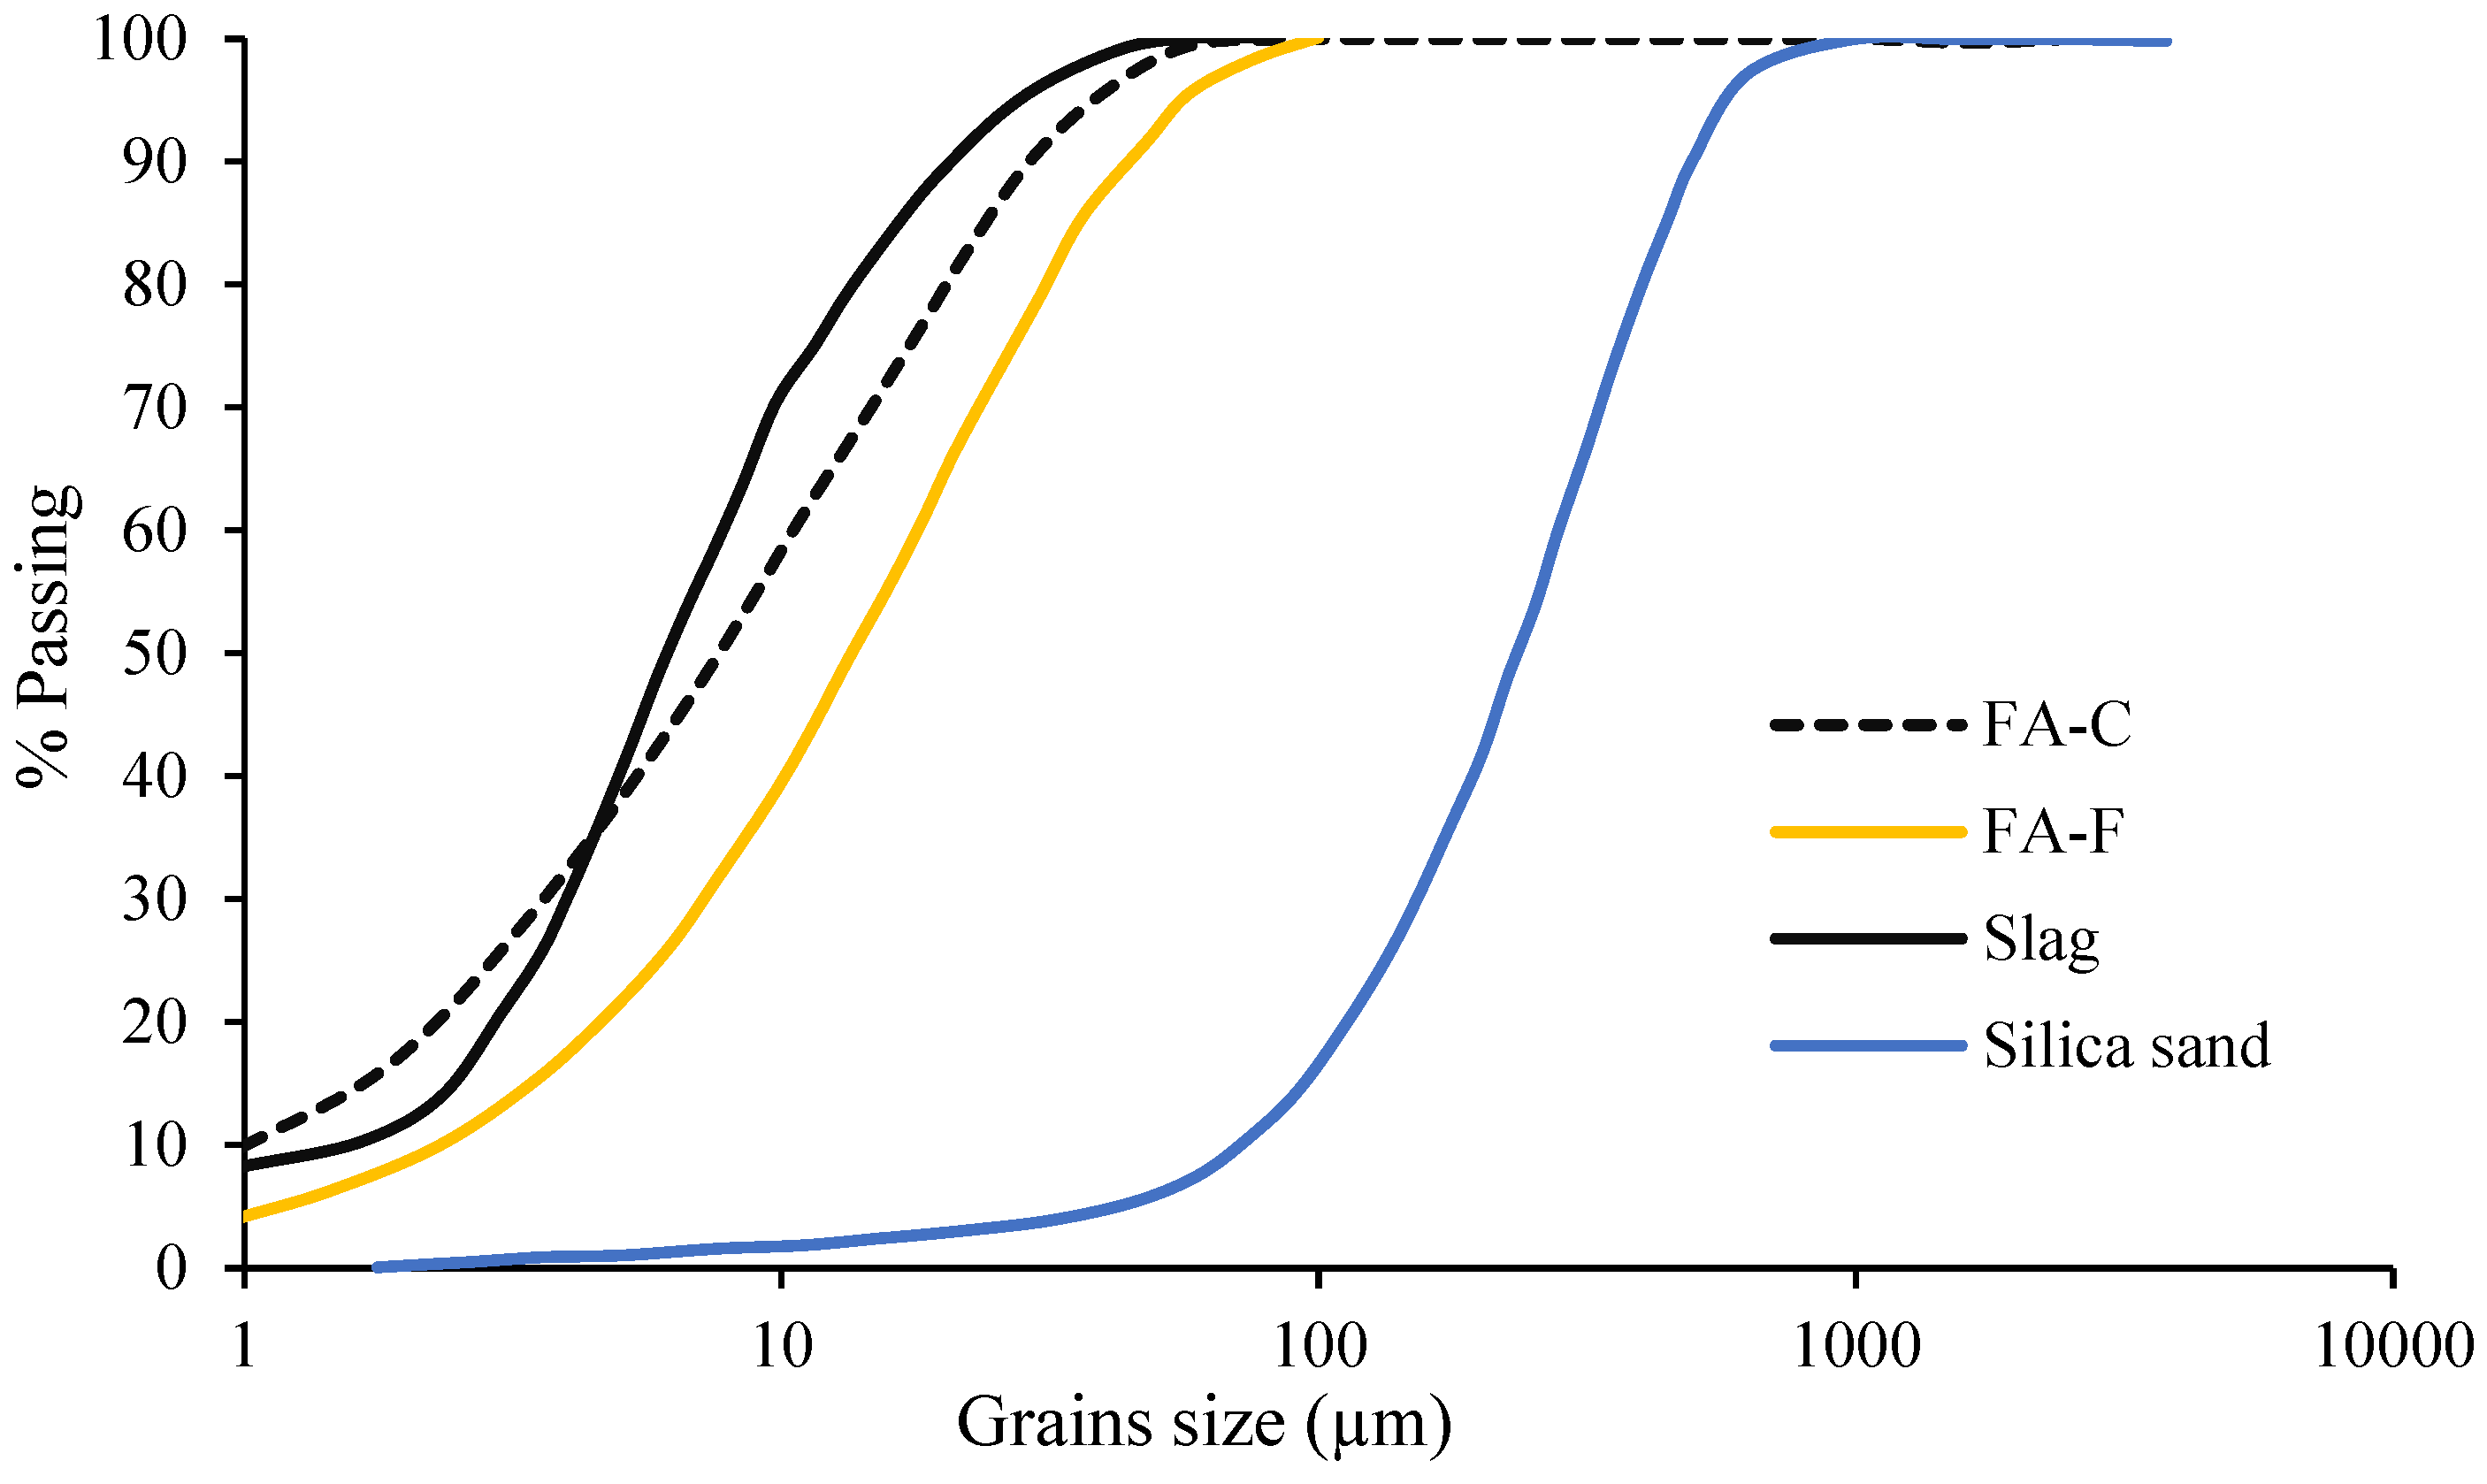
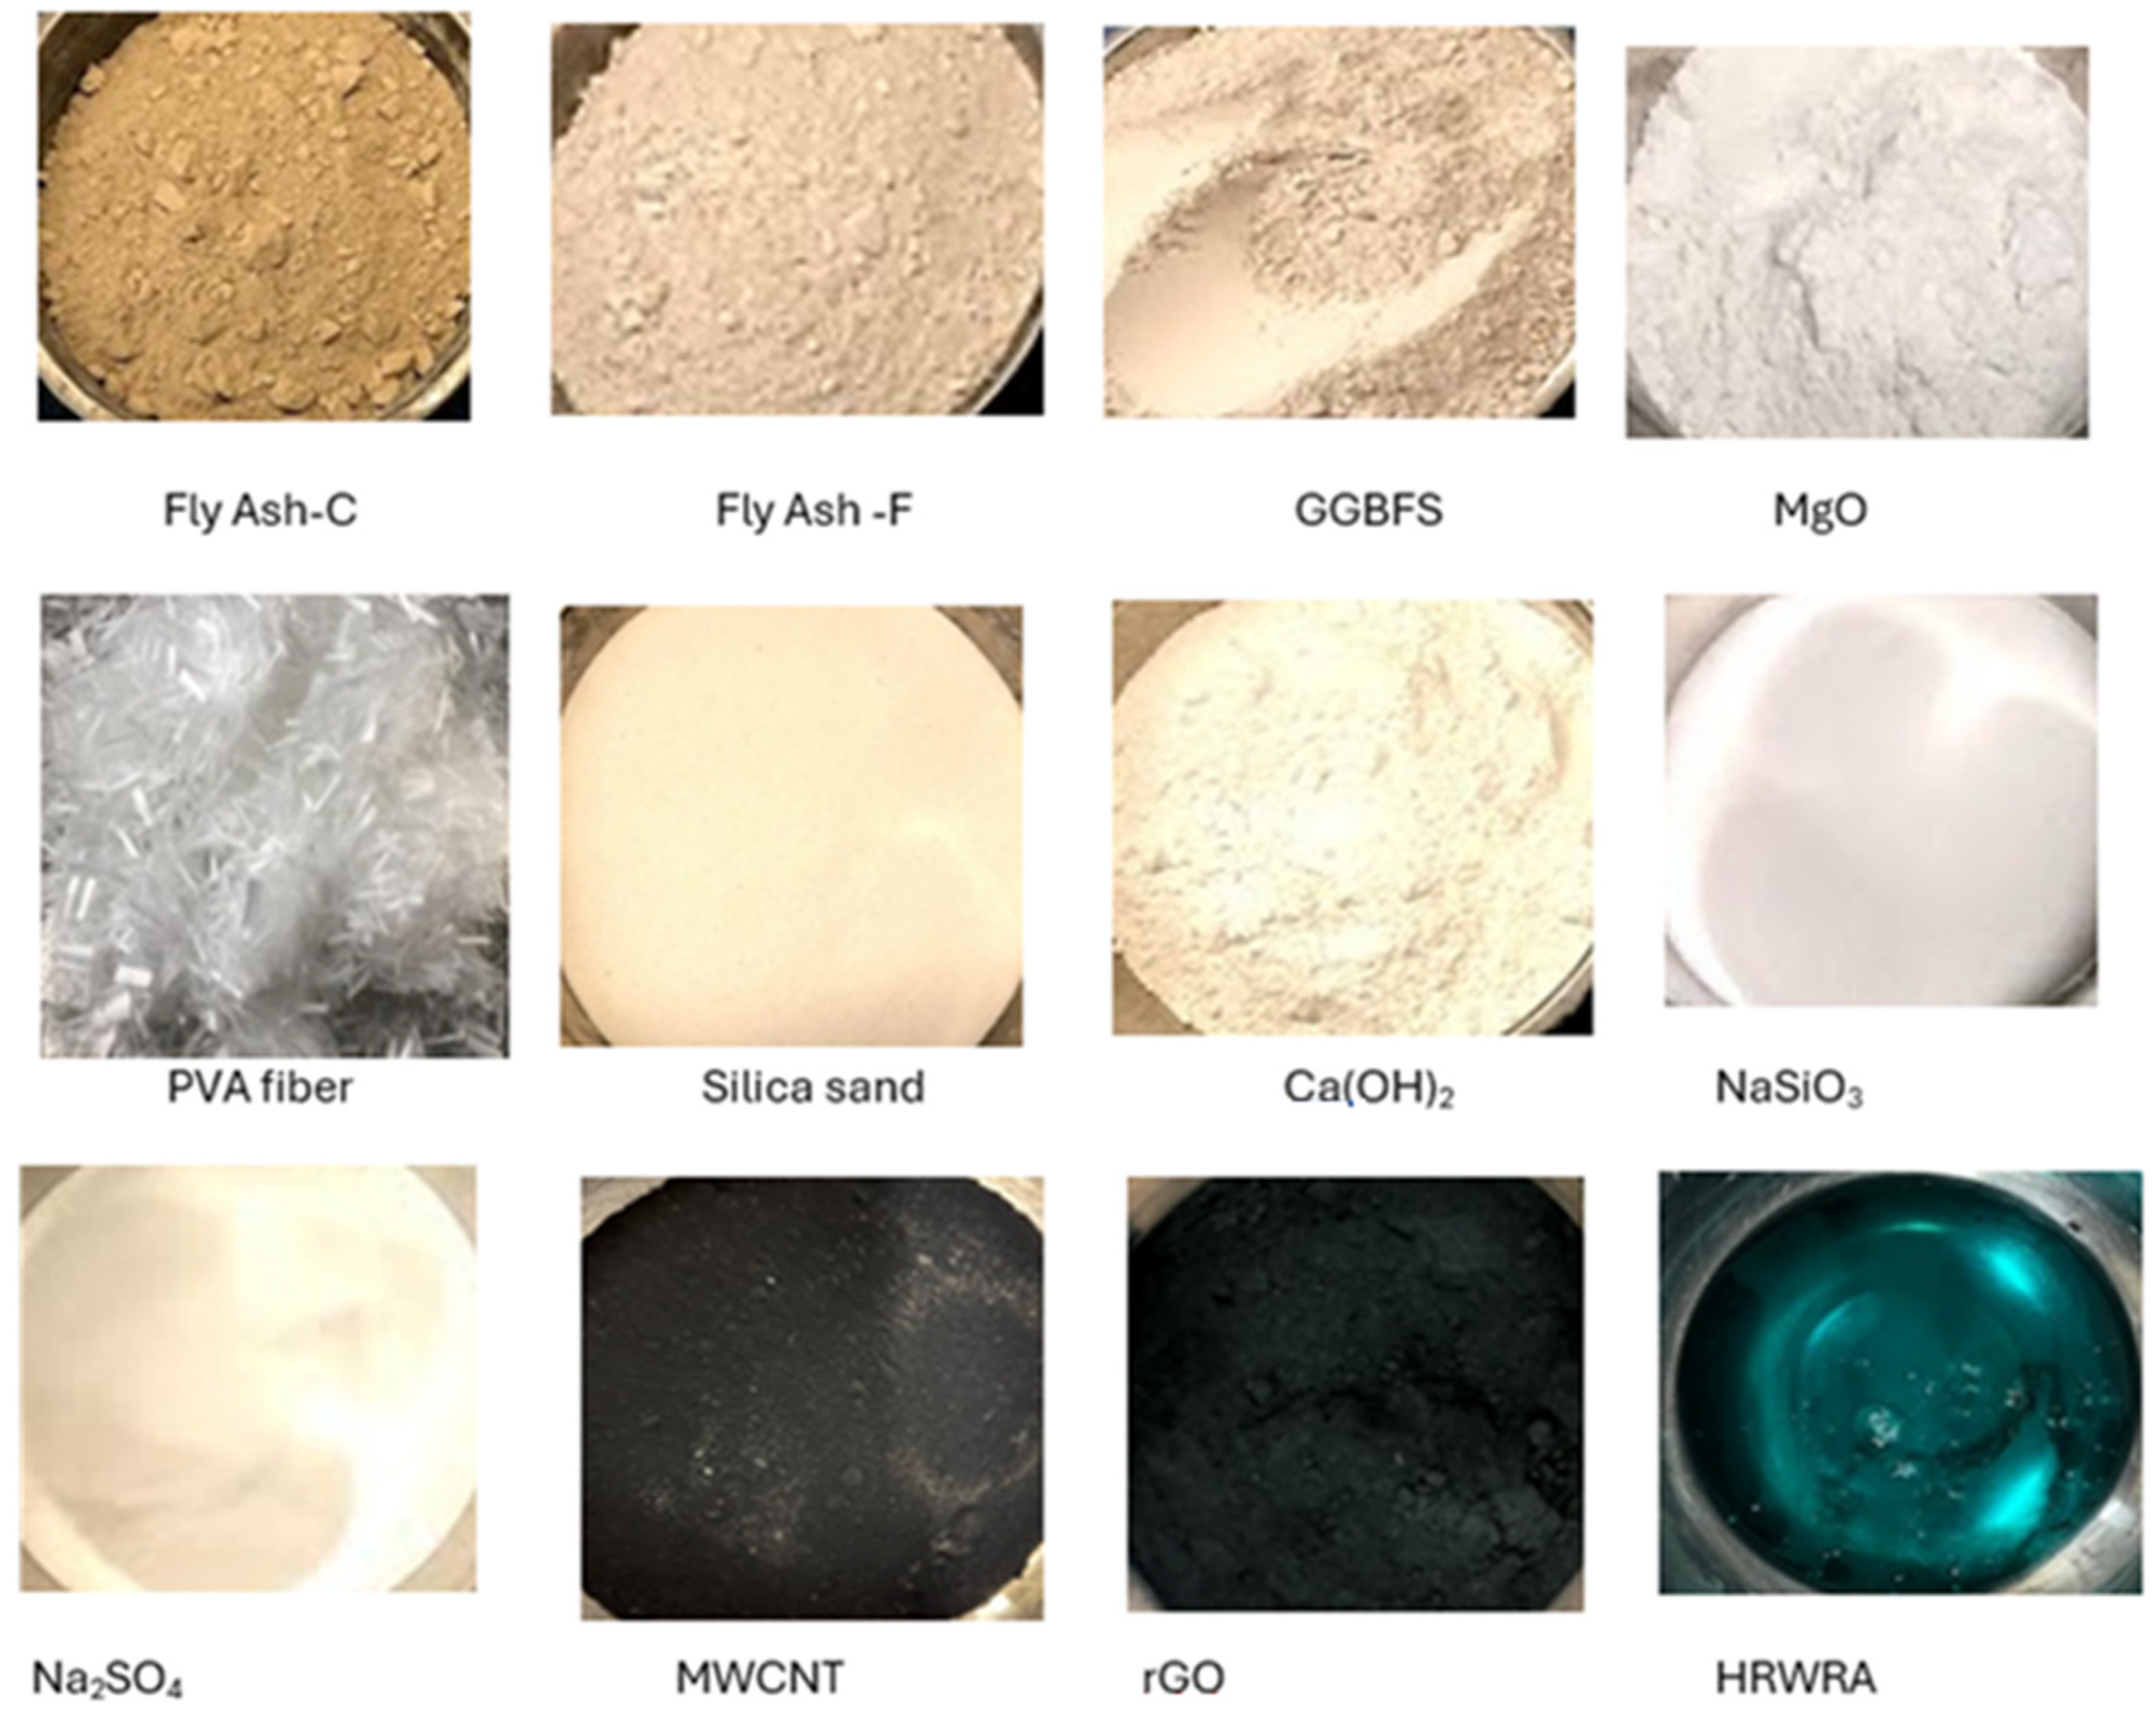
This research was conducted to develop ambient-cured AAECs with multi-functional properties based on four basic mixes developed in previous research studies [1,59] by incorporating binary/ternary blends of source materials activated with two different types (type 1 and type 2)—high-calcium powdered reagent combinations and various combinations of MgO expensive agent (for self-healing) and carbon nanomaterials (MWCNTs and rGO)—for inducing conductive and self-sensing properties. The rationale for choosing these base alkali-activated mixes is to maintain continuity with the previous research study conducted at Toronto Metropolitan University that aimed to develop alkali-activated mixes using powder reagent and ambient curing, where the chosen combinations performed better than controls. A one-part dry mix technique using powder-based reagent under ambient conditions was chosen considering its benefits of easy handling, cost-effectiveness, and environment-friendliness. A total of 32 AAECs were produced and their workability or fresh state (slump flow, slump flow with time, fresh density), hardened state (compressive strength, UPV and dry density), and microstructural characteristics were evaluated using scanning electron microscopy (SEM) coupled with energy-dispersive Spectrometer EDS, X-ray diffraction (XRD) and Fourier transform Infrared Spectroscopy (FTIR) analysis.

2.1. Materials

The AAEC mixes were prepared using two combinations of FA and GGBFS as source materials. The binary (designated as B) AAEC mixes were prepared by mixing high-calcium FA type C (FA-C) and GGBFS, whereas the ternary ones (designated as T) were developed by mixing high-calcium FA type C (FA-C), low-calcium FA type F (FA-F), and GGBFS. The rationales for selecting these industrial waste-based source materials are a reduction in CO2 emissions and an improvement in the properties of AAEC (particularly strength) due to the resulting high calcium and considerable amount of silicate contents. A high-range water reducer admixture (HRWRA) was required to ensure flowable AAM mixes. A polycarboxylate ether-based HRWRA with a solid content of 40%, pH of 6, and specific gravity of 1.06 g/cm3 was used. Silica sand with a maximum particle size of 600μ was used as the fine aggregate. The MgO used in this study was prepared by burning MgCO3 for two hours at 900 °C, and was classified as lightly burnt [22]. The AAEC mixes were prepared by reinforcement with 1.2% oil-coated polyvinyl alcohol (PVA) fibers. The PVA fibers were approximately 8 mm in length and 39 μm in diameter and could impart strain-hardening characteristics with multiple micro crack formations. The physical properties and chemical compositions (as per the X-ray fluorescence spectrometer ‘XRF’ analysis) of the FAs, GGBFS, silica sand, and MgO are presented in Table 1, with gradations shown in Figure 1.
As per the dry mix technique [60,61], two combinations of different alkaline reagents (obtained from Westlab Canada) were used in powder form to prepare two types of high-calcium-based activators to activate the source materials. Activator type 1 was prepared by mixing calcium hydroxide (CaOH2 with specific gravity = 2.24 and pH = 12.4–12.6) with sodium meta silicate (Na2SiO3·5H2O with modular ratio, SiO2/Na2O = 1, specific gravity = 0.7, pH = 11.3) in a ratio of 1:2.5 (Ca(OH)2:Na2SiO3·5H2O = 1:2.5), and the modular ratio (SiO2/Na2O) of this mixture was 3.22. Activator type 2 was prepared by combining calcium hydroxide (Ca(OH)2) and sodium sulfate (Na2SO4 with specific gravity = 2.70 and pH = 7) beads/powder in a ratio of 2.5:1 (Ca(OH)2:Na2SO4). The physical and chemical properties of both activator combinations are listed in Table 1 [59,60,61].
Two different carbon-based nanomaterials (MWCNTs and rGO) were incorporated at different dosages within the AAEC mixes as conductive and self-sensing agents. MWCNTs are hollow and cylindrically shaped carbon allotropes with high aspect ratios. They usually consist of layers of rolled concentric nanotubes and walls of multiple one-atom-thick sheets of carbon. The MWCNTs had a diameter of 20–30 nm, length of 10–30 μm, Blaine fineness of 110 m2/g, density of 1.2 g/cm3, electrical conductivity greater than 10−2 s/cm, and purity of 95% or more, containing less than 1.5% ash by weight per the supplier Cheaptubes Inc. (Grafton, VT, USA) [62]. rGO usually undergoes a reduction process, following the microwave technique, after its production. This process aids in removing functional groups, which promotes dispersion and restores the carbon structure. rGO consists of randomly aggregated sheets, corrugations, and scrolling because its 2D membrane structure becomes thermodynamically stable via blending [63,64]. rGO (black powder form with a purity of 99% or more) with 8–10 layers, a length of 1–10 μm, a thickness of 3–6 μm, a diameter of 0.5 µm, a density of 0.03 g/cm3, an electrical conductivity around 560 s/cm, and a Blaine fineness of 130 m2/g was used. The elements contained in the rGO are 91% C, <8% O2, <1% S, 2% H, and 0.4% N. Images of all aforementioned raw materials used for this study are presented in Figure 2.

2.2. Mix Proportions

The experimental study consisted of a total of 32 AAEC mixes with two types of muti-component activators (Type 1 and Type 2) and three different fillers/additive materials (MgO, MWCNT, and rGO). All AAEC mixes were prepared following either the “one part” or “dry mix” technique. The mix proportions for all 32 one-part AAEC mixes are presented in Table 2, along with their mix designations. Four control mixes (B1, B2, T1, T2) without additions of MgO, MWCNT, or rGO were produced based on previous studies [1,65,66,67,68], in addition to the other 24 AAEC mixes that contained MgO, MWCNT, and rGO. The binary (B) mixes contained the combinations of FA-C and GGBFS, whereas the ternary (T) mixes were prepared with FA-C, FA-F, and GGBFS. The FA and GGBFS contents were varied from 52% to 60% and from 38% to 45%, respectively, and the silica sand content was kept constant at 30% by mass of the total binder content. The water-to-binder ratio was varied from 0.35 to 0.4 to achieve a minimum slump flow diameter of 500 mm. The dosage of HRWRA was kept constant (0.02 wt% of binder) due to its acidic nature and to prevent the effect of its alkalinity on the varying mix proportions. The PVA fiber was used at 2% by volume for all mixes to induce strain hardening and multiple-microcracking characteristics.
The AAEC mixes incorporating MgO were prepared using 5% MgO, while those with MWCNT and rGO were prepared by incorporating 0.3% and 0.6% MWCNT and rGO by wt of binder contents. The activator/reagent components and the initial chemical ratios in the mix compositions of all AAECs are also presented in Table 2. Activator type 1 has a reagent component ratio (calcium hydroxide to sodium metasilicate) of 1:2.5, while activator type 2 has a reagent component ratio (calcium hydroxide to sodium sulfate) of 2.5:1. These ratios were chosen based on previous research studies on AABs [60,61,65]. The fundamental chemical ratios in terms of silicon oxide/aluminum oxide, sodium oxide/silicon oxide, calcium oxide/silicon oxide, and sodium oxide/aluminum oxide were evaluated based on their chemical compositions of reagents and source materials. These chemical ratios were all found to be within the acceptable range as per research studies on fly ash- and slag-based mortars [60,61,65].

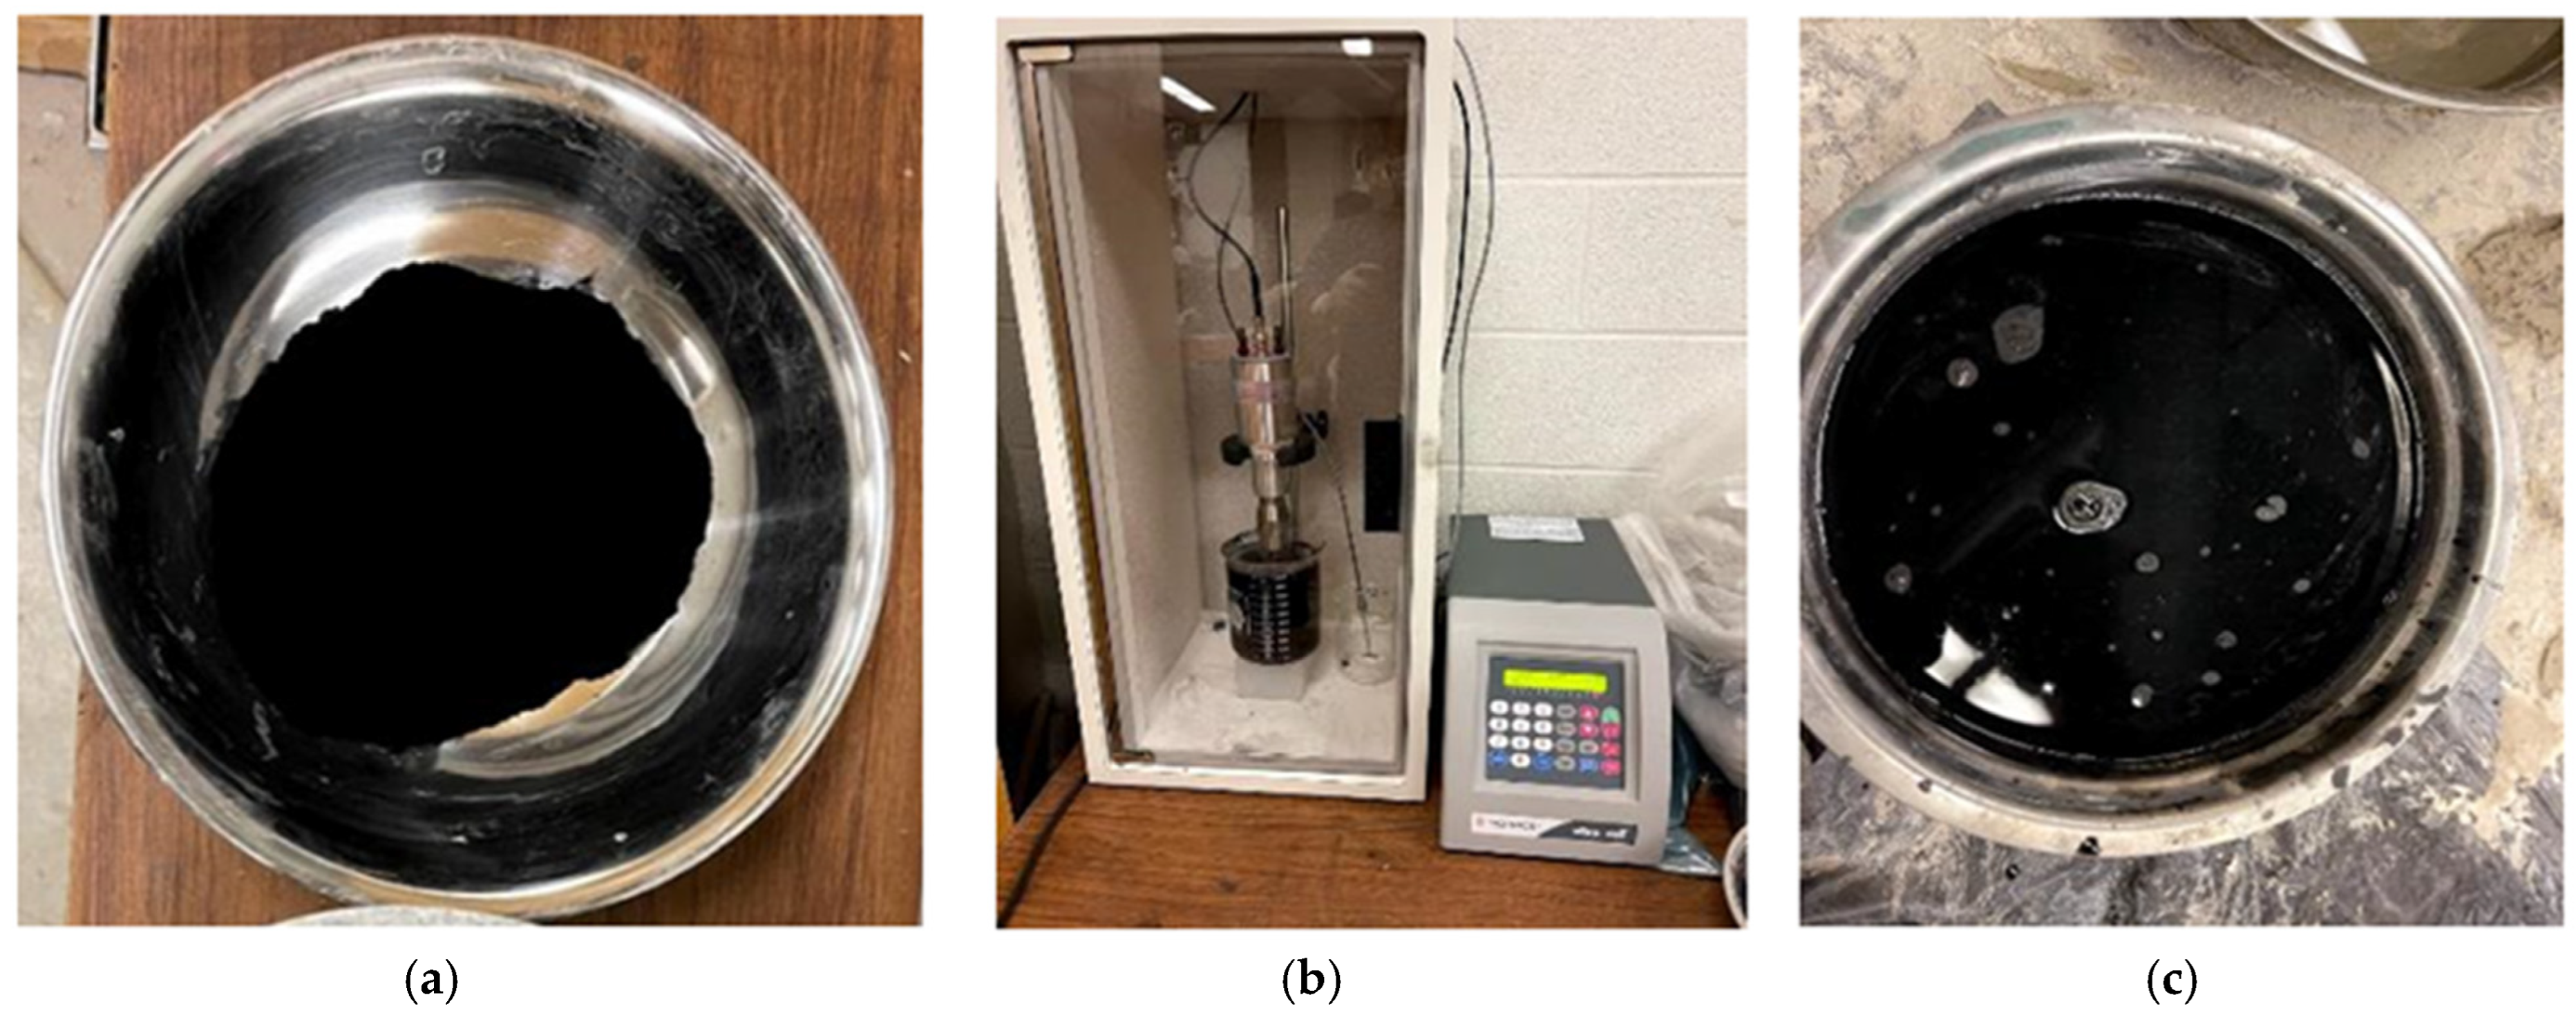
2.3. Mixing, Dispersion of MWCNT/rGO, Casting, and Curing of Specimens

The powdered reagent components were first mixed thoroughly and then added to the rigorously blended source materials (and MgO, if needed). The complete binder system was then dry mixed for about 5 min in a shear mixer before two-thirds of the required water was gradually added to the mix while mixing continued for 3–4 min. Then, HRWRA mixed with the remaining amount of water was gradually added for 4–5 min to make a flowable paste. After that, silica sand was added slowly for 3–4 min as per the proportions given in Table 2, then PVA fibers were added slowly for 3–4 min and mixed for an additional one minute to make control and MgO AAECs.
For AAEC mixes with MWCNT and rGO, two-thirds water and 50% HRWRA were mixed for 1–2 min by hand stirring in the beaker, after which MWCNT/rGO was added and hand stirred for 2–3 min. The beaker was then placed inside the sonicator, a probe was inserted into the beaker, and sonication was performed for 30–40 min. The amount of sonication energy was 50 J/mL~75 J/mL to effectively disperse MWCNT/rGO to the water [35,38,69]. The reason behind using this range of sonication energy is the shortening effect in MWCNTs for energy amounts over 75 J/mL [65]. Suave et al. [70] reported that a lower sonication energy with a longer sonication time provides better conditions than a higher sonication energy with a shorter sonication time in terms of preparing MWCNTs functionalized with carboxylic groups. However, the optimal level of sonication energy for dispersion is related to the CNT concentration. Still, when the concentration reaches a certain level, it cannot be well dispersed, requiring different technologies with different degrees of dispersion and a different optimal sonication energy. The mixture of sonicated MWCNT/rGO with water and HRWRA was then slowly added into the already-made dry mix (as explained previously in control mix preparation) for 4–5 min while mixing continued in shear mixer, after which silica sand was gradually added to prepare MWCNT/rGO-incorporated AAECs. Figure 3 shows MWCNTs before, during, and after sonication and the sonication device. The use of the dry-mixing method allowed us to avoid the handling of solution-based corrosive alkaline reagents and used less powder-based reagent (0.35 of total binder content) than the solution-based one [4,60,61]. Thus, it demonstrated its enhanced sustainability, user-friendliness, and commercial viability in developing AAECs on a large scale compared to the conventional two-part method.
The total mixing procedure lasted about 20–25 min. At least 15 cube specimens with dimensions of 50 mm × 50 mm × 50 mm were prepared for each AAEC mix. The molds/specimens were kept in the curing room at 23 ± 3 °C and 95 ± 5% relative humidity (RH). The molds were de-molded after 24 h of casting and were kept in the curing chamber until the day of testing.

2.4. Test Methods

The physical workability properties in terms of the slump flow, flow time (T50), and fresh density of AAECs with MgO and MWCNTs/rGO and MgO-MWCNTs/rGO were evaluated immediately after mixing. The slump flow and fresh density of AAECs were measured as per the ASTM C1611 [71] and ASTM C138 [72] standards, respectively. The hardened density of the AAECs was evaluated following the conventional weight and volume measurement methods. The slump flow spread characteristics of the mixes, of which a typical one is presented in Figure 4a, were assessed through a slump cone test in compliance with ASTM C1437 [73]. Additionally, the slump flow time (T50) to reach 500 mm slump flow was recorded to calculate the slump flow velocity. A compressive strength test using cube specimens (Figure 4b) at 7, 14, 28, 56, and 180 days was conducted according to ASTM C109/C109M [74] by applying a loading rate of 1 kN/s. An ultrasonic pulse velocity (UPV) test was conducted on the same cube specimens using a Portable Ultrasonic Non-Destructive Digital Indicating Tester as per ASTM C597 [75]. At least three specimens were tested at each age for the compressive and UPV tests.
SEM and EDS analyses were performed on the AAECs to determine the reaction products by taking chip specimens (approximately 10 mm × 5 mm × 5 mm) from the core of the failed compression test cubes at 180 days followed by coating them gold to make the surface conductive. The fracture surface was studied using secondary electrons (SEs) and backscattered electron (BSE) microscopy at 20 kV. The specimens’ morphologies were studied at 100× (100 μm), and the assessment of the reaction products was performed at 2000× (10 μm).
The specimen preparation for the XRD analysis consisted of grinding the specimen taken from the core of the 180-day failed compression cubes. The ground specimen was passed through a 200-mesh sieve. A Bruker D8 Endeavor diffractometer equipped with a Cu X-ray source and operating at 40 kV and 40 mA; a range of 5–70 deg θ; a step size of 0.02 deg 2°; a time per step of 0.5 s; a fixed divergence slit, an angle of 0.30; a sample rotation of one rev/s was used to identify the mineral phases using the PDF4/Minerals ICDD database.
Like the XRD analysis, the powder from the AAEC specimens was subjected to Fourier transform infrared spectroscopy (FTIR) analysis. The FTIR spectra were recorded with the Perkin Elmer Spectrum 400 spectrometer in mid-IR mode. Before beginning the analysis, rubbing alcohol was used to clean the sample platform. Approximately 5 mg of the powder specimen was decanted onto the platform for further analysis. The spectrum was obtained over a range from 4000 to 400 cm−1. FTIR measurements were performed on a Fourier transform infrared spectrophotometer (Jasco 4200 Type A, Jasco, Easton, MD, USA). The FTIR spectra were obtained within a wavenumber range from 400 to 4000 cm−1 at a resolution of 4 cm−1. The KBr pellet was used to carry out the FTIR measurements and the pellets were prepared by pressing a mixture of the sample in a die set. In FTIR analysis, the sample was irradiated with infrared light over a range of frequencies. The interaction between the infrared light and the material caused the absorption or transmission of specific wavelengths, which was detected and analyzed to identify the functional groups and chemical bonds within the material.

3. Results and Discussion

Table 3 summarizes the workability (slump flow/flow time (T50)/flow velocity/fresh density) and hardness (28-day compressive strength/density/UPV) properties of all 32 AAECs. The following subsections present the influence of the MgO, nanomaterials (MWCNT/rGO), and reagent types on the workability, compressive strength, UPV, and microstructural characteristics of the AAECs.

3.1. Physical Characteristics: Slump Flow, Flow Time, Flow Velocity and Density

The intent of this investigation was to find stable AAEC mixes with good workability considering the raw materials, curing conditions, and activator types used, as well as the optimum mix proportions [76]. Visual inspections were also conducted to observe segregation characteristics in terms of the separation between solid and liquid components of the mix. All the mixes showed stable performance with no segregation, as can be seen from the slump flow shown in Figure 4a. The fresh density of the AAECs ranged from 1911 kg/m3 to 1954 kg/m3 while the dry (hardened) density ranged from 1984 kg/m3 to 2176 kg/m3 (Table 3).
Figure 5 shows the influence of the MWCNT, rGO, and MgO content on the slump flow of the AAEC mixes. The slump flow value of the AAEC mixes decreased with an increase in MWCNT content (Figure 5a) from 0 to 0.6%, except for the binary mixes with reagent 2 (B2). The slump flow (Figure 5b) decreased with the increase in rGO content from 0 to 0.3% and then showed an increasing trend up to 0.6%, except for the binary mixes with reagent type 1 (B1). The binary and ternary mixes with 0.3% rGO content generated the minimum slump flow as compared to their control mixes (with 0% rGO or MWCNTs) and, mostly, those with 0.6% rGO content. However, for the binary and ternary mixes, the MgO content had an insignificant influence on the slump flow of the AAEC mixes, although a slight decrease in the slump flow with the addition of 5% MgO was observed (Figure 5c). Among all the mixes (Table 3), a ternary mix with 0.6% rGO (T2R6) showed the highest 800 mm slump flow while the lowest slump flow of 620 mm was recorded for the binary rGO mix (B2R6).
As per the EFNARC (2002) [75] guidelines, concrete and composites possess good filling and self-consolidating ability if their slump flow ranges between 650 mm and 800 mm. Almost all the AAEC mixes satisfied the EFNARC [77] criteria by showing a slump flow value of ≥600 mm.
In the case of control AAECs, the ternary mixes (T1 or T2) exhibited higher slump flows (Table 3) than their binary counterparts (B1 or B2) due to the replacement of FA-C by FA-F with smooth round shape particles (associated with a decrease in FA-C and GGBFS contents as per Table 2) that enhance flowability. As discussed earlier, activator type 2 results in less viscous mixes owing to a lower silica ratio and low desolation rate, and, thus, can be theorized to yield a higher slump diameter. This trend can be observed for the control mixes made with activator type 2 (B2 and T2). However, the addition of MgO/MWCNTs/rGO, in almost all cases (specifically binary mixes), showed less significant but lower or almost similar slump values for the mixes with activator type 2 compared to the mixes with activator type 1 (Table 3). The increase in the solid load, finer surface of fine particles, water affinity, and agglomeration tendency of MgO, MWCNTs, and rGO can be theorized to contribute to such variations and the reduced workability. In the case of the ternary mixes, however, the mixes with activator type 2 have a slightly higher slump flow value due to the presence of round fly ash combined with the lower colloidal formation of the low-silica-based activator type 2. An increase in the MWCNT content induces a higher solid ratio. Moreover, the agglomeration and high water affinity of MWCNT particles are also essential contributing factors. There was about a 4–5% decrease in the slump flow (or workability) for an increase in MWCNT content from 0.3% to 0.6% for the AAECs. Such a decrease in workability with the proportional increase in the MWCNT additive was reported in earlier studies [78].
During the slump flow diameter measurement, the flow time (T50) was recorded for the AAECs to spread up to a 500 mm diameter—a lesser T50 time suggests good flowability, as per EFNARC [77]. As per Table 3, the AAEC mixes achieved T50 values within a time range from 2 s to 5 s, which is considered to satisfy the criteria for good-flowability concrete [77]. A minimum slump flow time of 2 s was observed for the AAEC mix T2R6 (with activator type 2 and 0.6% rGO), whereas a maximum flow time of 5 s was observed for the binary mixes with MWCNT and MgO (Table 3).
As for the control mixes, the binary variants took more time to reach a 500 mm diameter than the ternary ones. This corresponded to their lower slump velocity compared to the ternary ones (about 26% and 46% less for binary mixes with activator type 1 and 2, respectively), due to the absence of smooth round fly ash F particles that can reduce interparticle friction, which is described as being connected to the slump flow. The reduction in slump velocity is more pronounced with the use of activator type 2 due to the presence of more colloidal particles compared to type 1. The addition of 5% MgO increased the amount of finer particles with a high water affinity and thus reduced the slump velocity by about 19~20% compared to the control mixes (Table 4). Similarly, the addition of MWCNTs/rGO and increase in their content caused a reduction in the slump velocity due to inducing a higher solid ratio in the mixes. Moreover, the agglomeration and high water affinity of the MWCNT particles were also important factors.
As can be seen, the flowability of all geopolymer binders increases with the increase in the Na2O/SiO2 ratio [60,61]. This also means that a higher alkalinity provides a higher flowability of the mixtures. The setting times of the representative mortar portions of all the AAECs without PVA fiber were also studied, where an increase in the Na2O/SiO2 ratio led to quicker setting times, meaning that the higher the alkalinity, the faster the agglomeration and poly-condensation. The same trend was observed by Gado et al. [79] and Allahverdi and Kani [80]. The addition of MgO and MWCNTs yielded comparatively lower initial and final setting times compared to the controls. The initial setting times ranged from 190 min to 311 min while the final setting times ranged from 230 min to 369 min, depending on the reagent type (type 1 and type 2) and the use of MgO/MWCNTs/rGO. Both MgO and functionalized MWCNTs have a high water affinity due to an increased surface area, which absorbs a significant quantity of water within the surface, resulting in a more viscous matrix and producing lower setting times. The lower water affinity of the rGO particles ensured a higher workability with a low viscosity, causing a lower variation in setting times.

3.2. Hardened Characteristics: Compressive Strength and UPV

This section describes the evolution of the compressive strength over the time periods of 7, 14, 28, 56, and 180 days with strength enhancement at various ages with respect to the control (summarized in Table 4) and the UPV characteristics, as well as to the co-relation between the UPV and compressive strength at 28 days. The influences of the MgO/MWCNTs/rGO and other various mix design parameters (reflecting binary and ternary combinations of source materials, reagent types, and chemical ratios) on the compressive strength and UPV are analyzed. These parameters are described to illustrate the influence of various mix design parameters, reflecting the binary and ternary combinations of SCMs as well as the types and proportions, of powder-based reagents and chemical ratios.

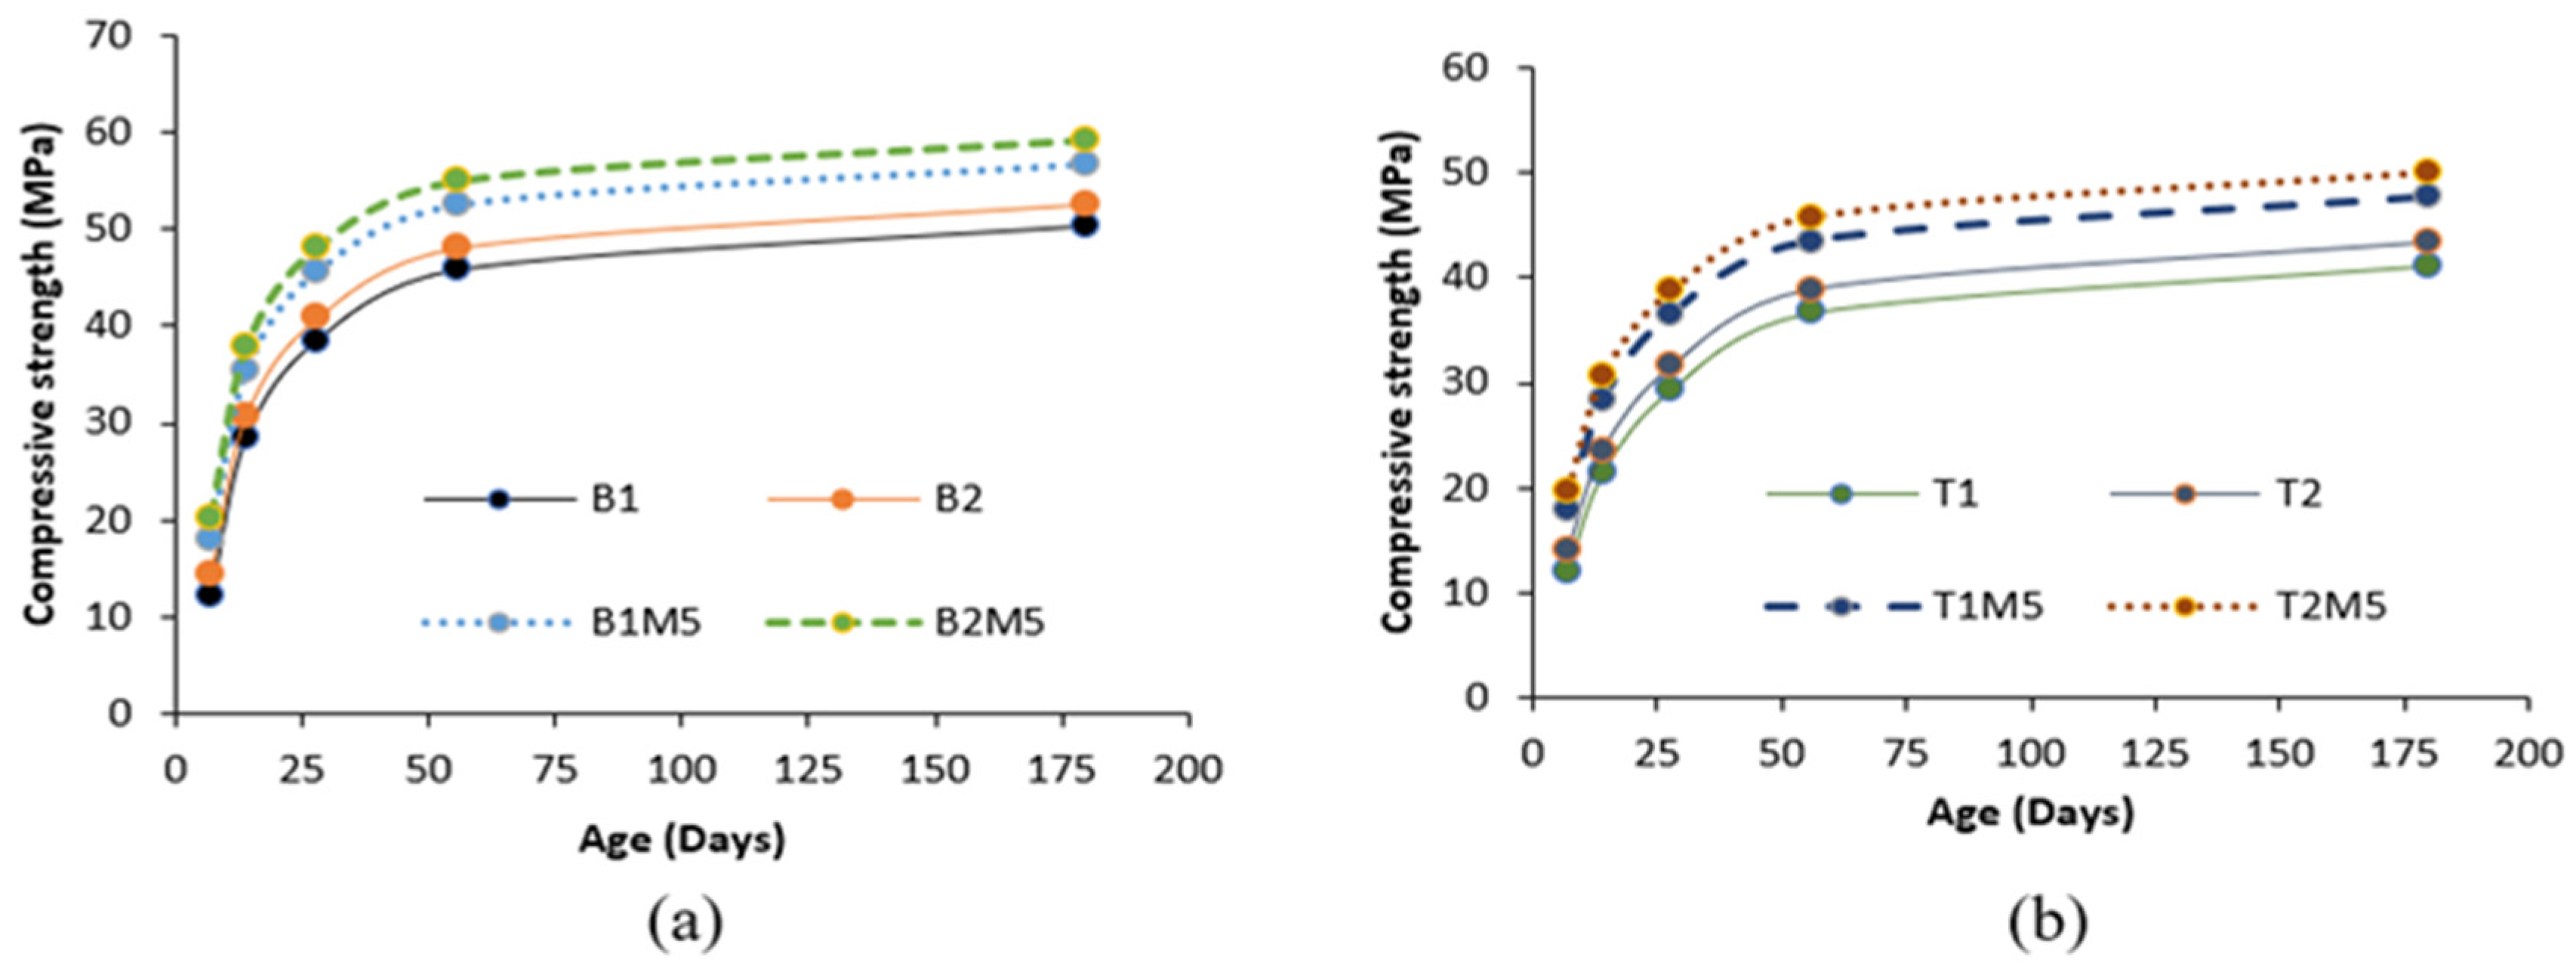
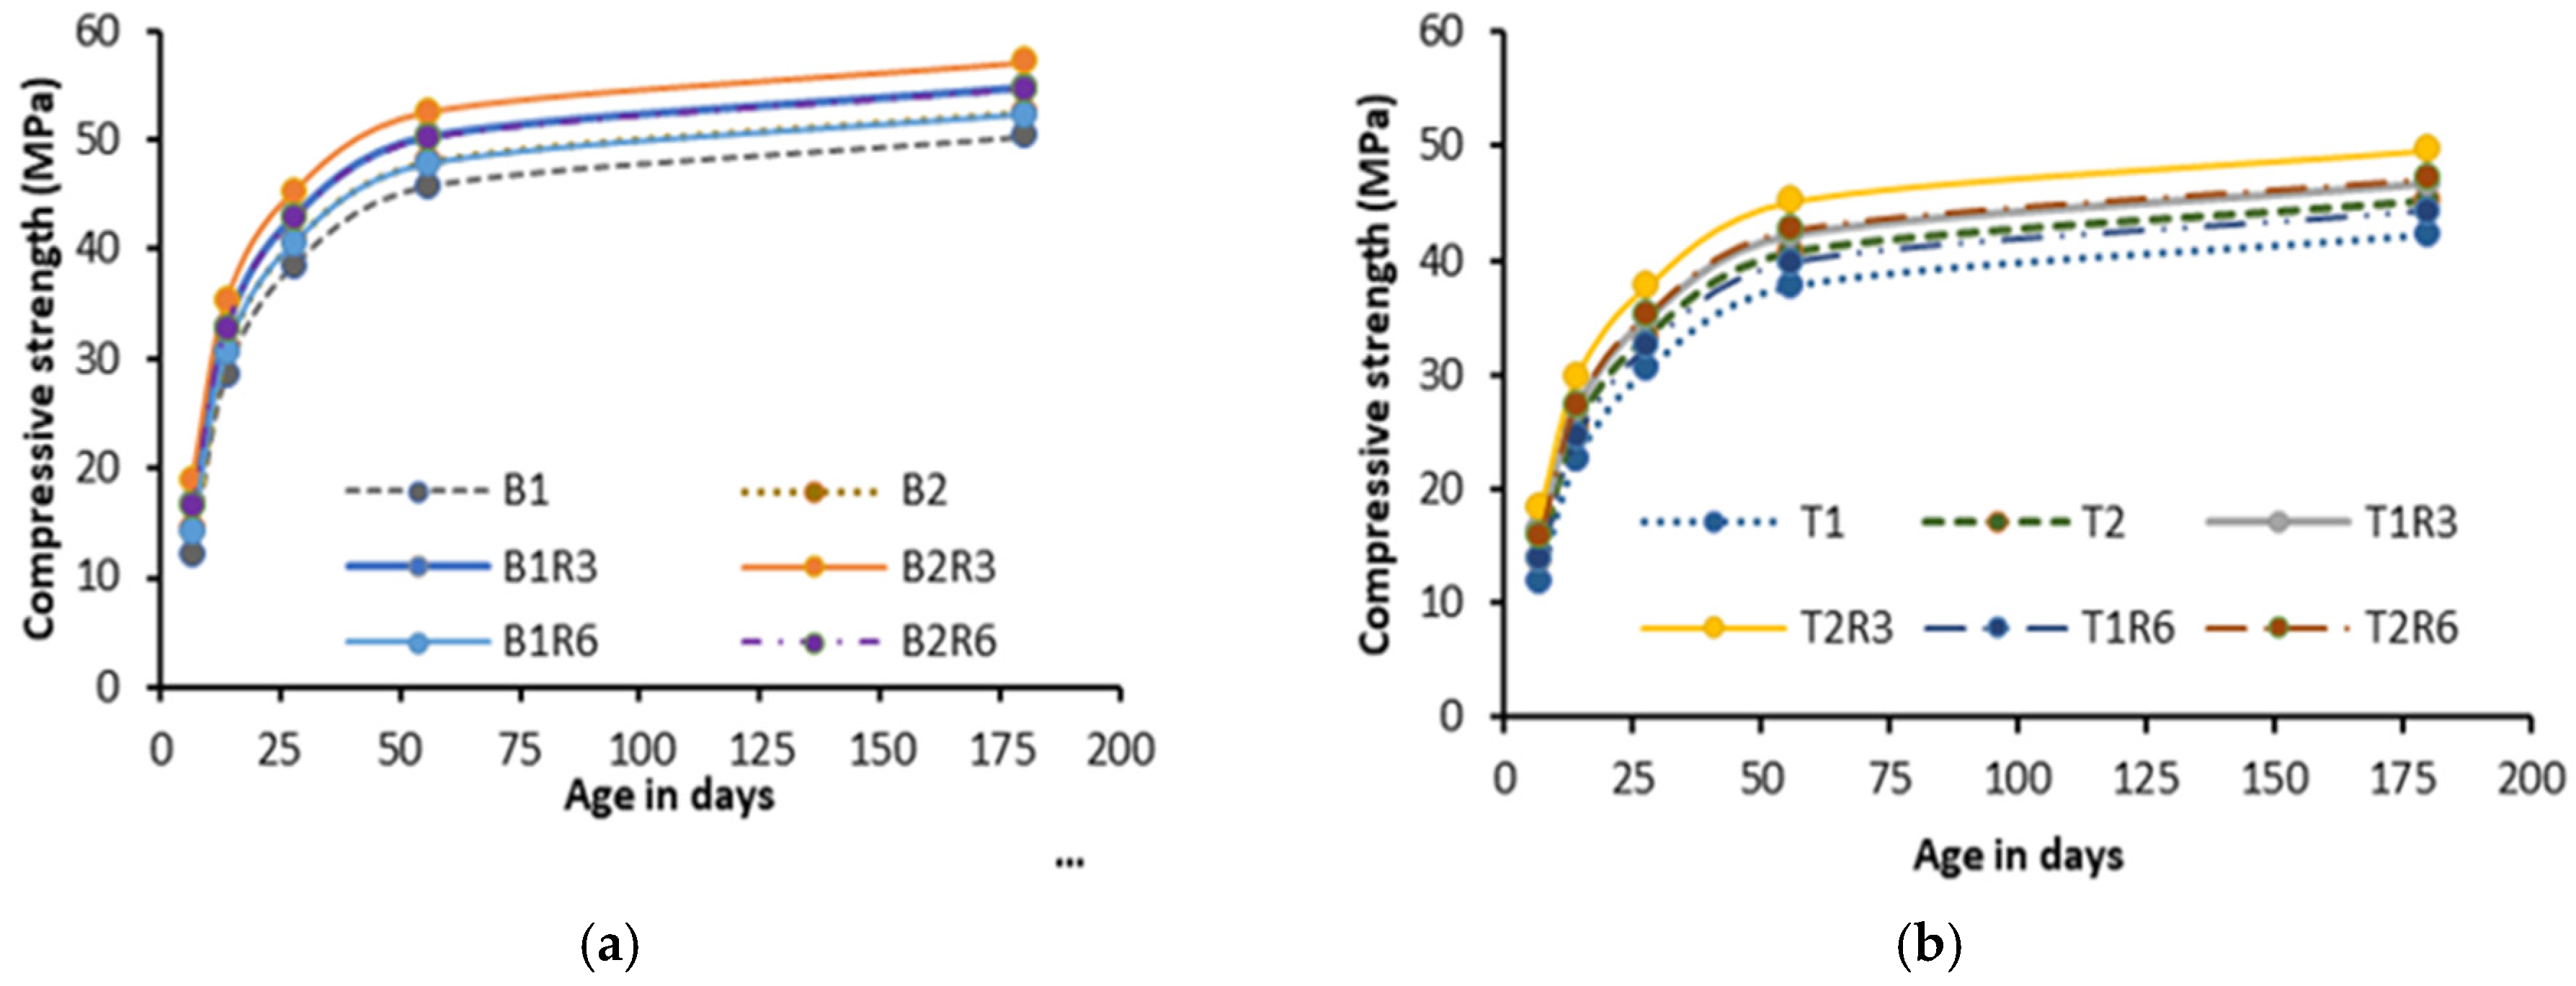
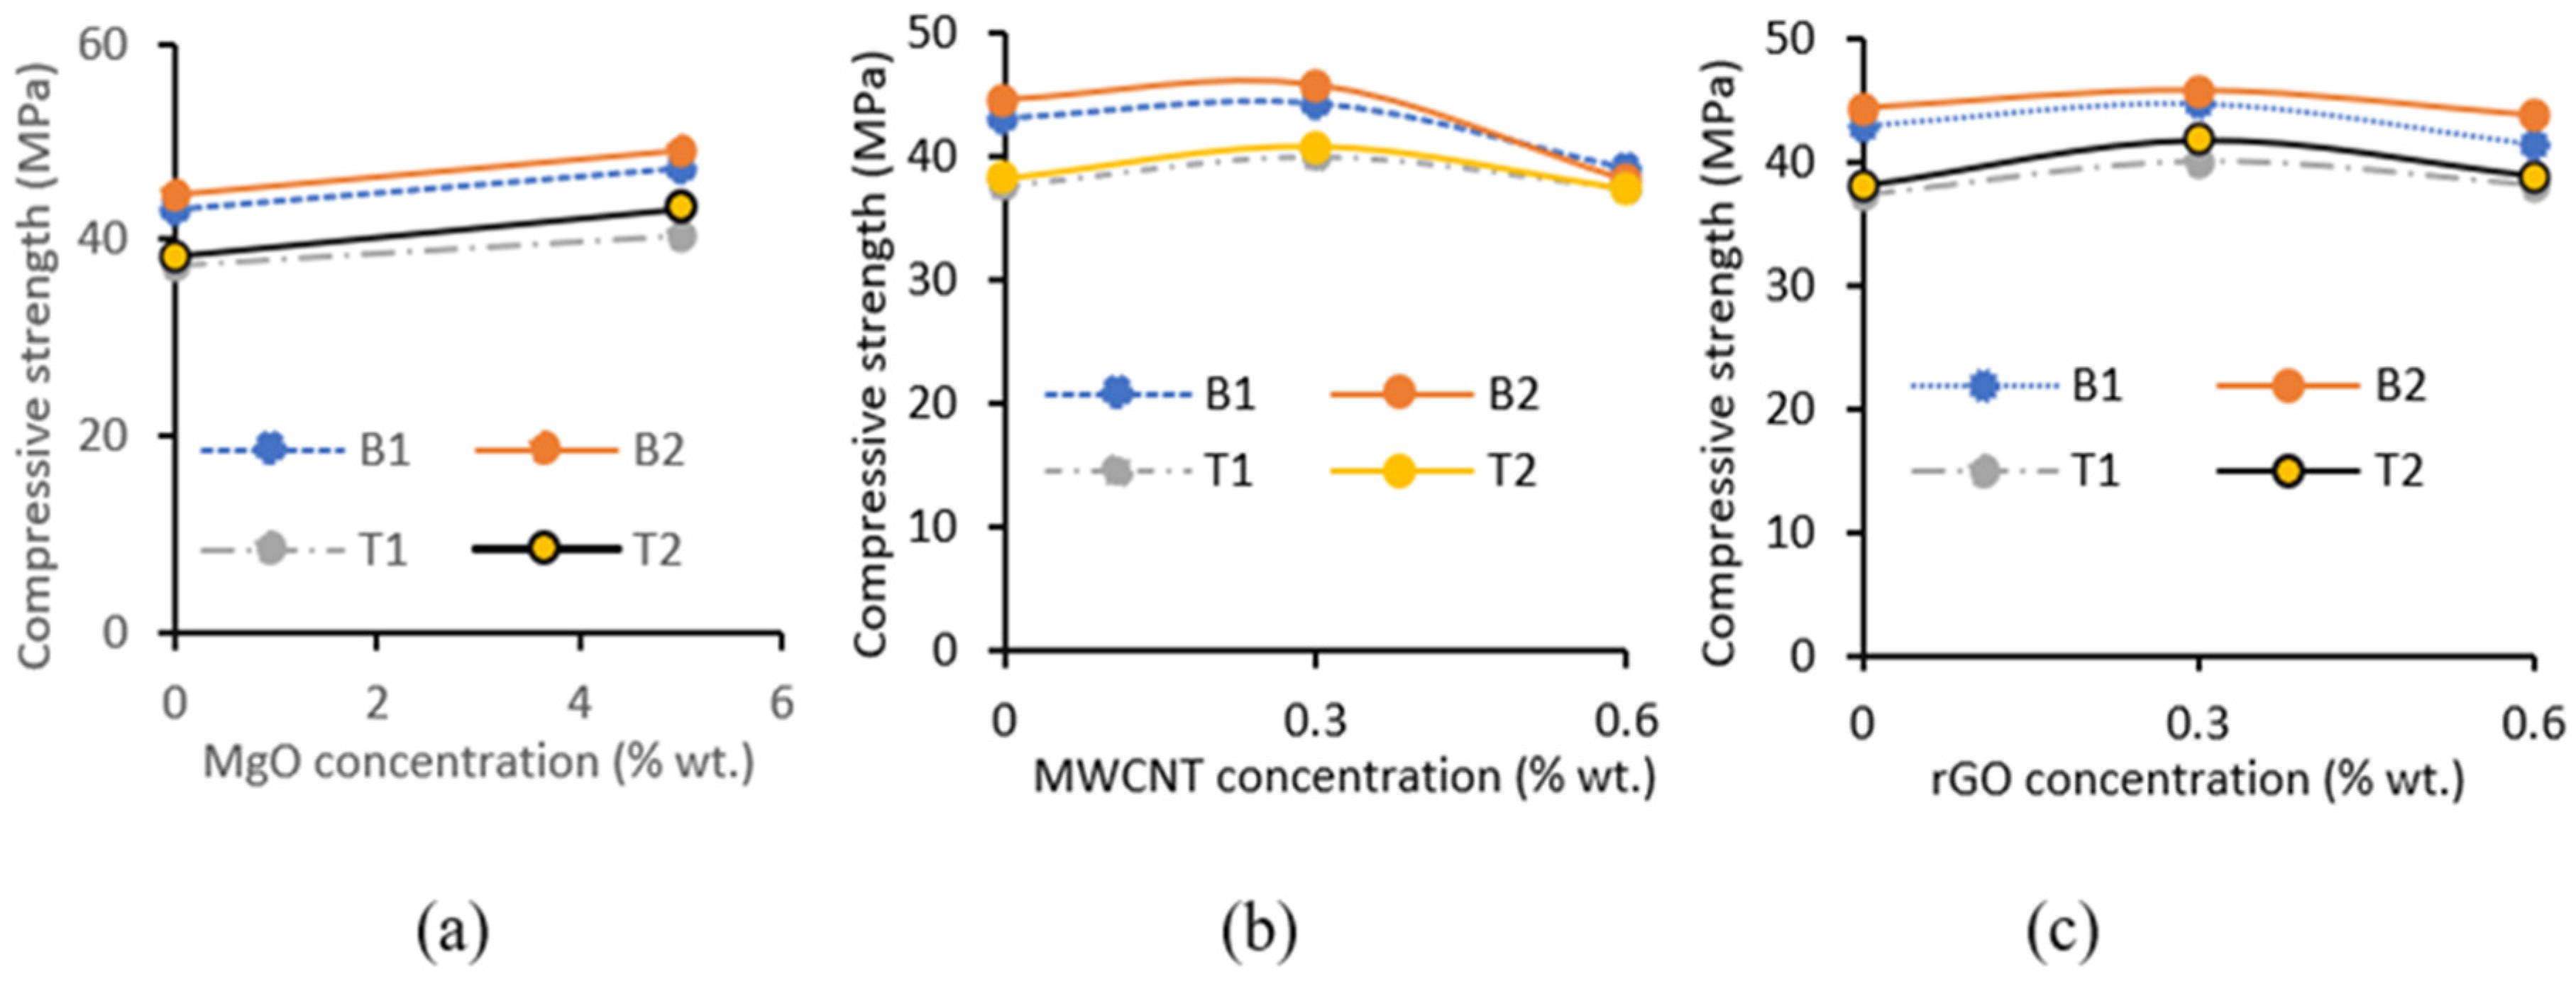
3.2.1. Influence of MgO, MWCNT and rGO on Compressive Strength Development

All AAECs achieved a 28-day compressive strength ranging from 26.0 MPa to 48.5 MPa > 18 MPa (as per Table 3 and Table 4), which is the range specified for structural concrete as per ACI 318 [81], and which is also comparable to other conventional two-part FA and GGBFS-based geopolymers [4,61]. The binary AAECs (FA-C + GGBFS designated as B) that had higher CaO/SiO2 ratios (as presented in Table 2) obtained higher compressive strengths than their ternary (FA-C + FA-F + GGBFS designated as T) counterparts (Table 3) due to the formation of additional CSH binding phases/gels with C-A-S-H/N-C-A-S-H, as is evident from the microstructural analysis (discussed later). All the mixes exhibited a ratio of Na2O/Al2O3 of less than 1 (Table 2), which prevented efflorescence, as observed in previous studies where Na2O/Al2O3 < 1 resulted in sodium consumption in the reaction process and, in turn, prevented efflorescence.
The evolution of the compressive strength with the age (0, 7,14, 28, 56, and 180 days) of control AAEC mixes (B1, B2, T1, and T2) without any MWCNTs/rGO or MgO are presented in Figure 6 and Table 4. The compressive strength increased with age, and the rate of increase was higher than that of controls up to 56 days (due to a higher rate of polymerization) and then slowed down, showing a steady increase up to 180 days (Figure 6). The compressive strength was higher for the binary mixes (B1, B2) than their ternary counterparts (T1 and T2) and, also, the reagent 1 mixes developed a lower strength than their reagent 2 counterparts throughout the aging process. Binary mix B2 with reagent 2 exhibited the highest compressive strength (with 40.8 MPa, 48.1 MPa, and 52.6 MPa at 28 days, 56 days, and 180 days, respectively) throughout the aging followed by B1, T2, and T1. Reagent 2 (Ca(OH)2:Na2SO4 = 2.5:1) performed better than reagent 1 (Ca(OH)2:Na2SiO3·5H2O = 1:2.5) in terms of its compressive strength development. The reagent 2 component ratio of Ca(OH)2:Na2SO4 = 2.5:1 was judged to be the optimal composition based on the strength results (52.6 MPa at 180 days) of binder system B2. The high alkalinity of sodium metasilicate (pH = 14) enhanced the dissolution of Si and Al ions from the FA-F, which otherwise showed low reactivity. The high-calcium precursors (GGBFS and FA-C) also formed C-A-S-H acute phases, which compacted the amorphous N-A-S-H, resulting in a dense microstructure and high compressive strengths. However, for reagent 2, a Ca(OH)2/Na2SO4 = 2.5:1 component ratio was determined to be superior, and also outperformed reagent 1, as depicted in Figure 6. The additional C-S-H gel formation from the composition with reagent 2 led to higher compressive strengths due to the high calcium levels in the system. B2 exhibited a higher strength (28% higher at 28-days) than its counterpart T2 due to its 30% higher fly ash C content. This can also be attributed to the high Ca2+ content in the matrix, coming from the FA-C, the GGBFS, and the activator Ca(OH)2 component, which formed a denser microstructure.
The MgO-incorporated AAEC mixes (B1M5, B2M5, T1M5, T2M5) exhibited higher strength development with age (Figure 7) compared to their control counterparts (B1, B2, T1, and T2). Adding 5% MgO in the AAEC mixes increased the compressive strength (for example, 19~20% and 23.1~25.2% at 28 days for the binary and ternary mixes, respectively, Table 4). Overall, compared to the control mixes, strength increases of 37.1~40.4%, 22.7~31.1%, 18.9~25.25%, 14.15~19.05%, and 12.45~15.4% were observed at 7, 14, 28, 56, and 180 days, respectively (Table 4), showing strength increases with increases in the age and that the % of strength increase decreased with increases in the age. The geopolymers solidify quickly and generate C-S-H and C-A-S-H gels, leading to considerable chemical, autogenous, and drying shrinkage at the early stage. The highly reactive MgO accelerates the early age hydration of slag as a result of fast heat release during the dissolution process of MgO, which accelerates the hydration reaction, leading to the formation of more hydration products [57]. The addition of fine reactive MgO generated a large number of well-dispersed, fine, worm-like Mg(OH)2 crystals in a high-alkalinity liquid phase environment, which did not overgrow, resulting in uniform-volume micro expansion, effectively compensating for volume shrinkage in the hardening process, matching the shrinkage process, refining the matrix pore size, and increasing the compressive strength, as observed in this study [53].
Figure 8, Figure 9 and Figure 10 show the evolution of the compressive strength of the MWCNT-, rGO-, MgO-MWCNT-, and MgO-rGO-incorporated AAECs with ages up to 180 days compared to their control counterpart. The strength increased with the increase in age and the trend of the rate of strength development was similar to those of the control and MgO-incorporated AAECs.
For the MWCNT-incorporated mixes, the compressive strength was increased (+ve value)/decreased (−ve value), respectively, with the use of 0.3% and 0.6% MWCNTs by 15.1~23.4% and 6.4~7.0% at 7 days, 7.0~15.6% and 3.2~16.9% at 14 days, 7.8~9.2% and 7.8 ~−14.8% at 28 days, 7.8~ 9.3% and −3.5~−5.8% at 56 days, and 7.1~8.3% and −3.8~−5.5% at 180 days (Table 4). The compressive strength decreased at a higher 0.6% MWCNT content at 28 days and beyond. For the rGO-incorporated mixes, the compressive strength was increased, respectively, with the use of 0.3% and 0.6% rGO by 28.8~31.5% and 12.8~14.0% at 7 days, 14.6~20% and 6.5~8.9% at 14 days, 1~14.8% and 4.9~6.6% at 28 days, 9.4~11.9% and 4.2~5.3% at 56 days, and 8.6~10.6% and 3.8~4.7% at 180 days. The rGO incorporated mixes exhibited higher compressive development than their MWCNT counterparts at all ages, showing no decrease.
For the MgO-MWCNT-incorporated mixes, the compressive strength was increased with the use of 0.3% and 0.6% MWCNTs, respectively, by 52.4~54.3% and 38.6~40.4% at 7 days; 30.5~36.8% and 23.5~28.6% at 14 days; 24.8~30.1% and 20~23.8% at 28 days; 19.1~22.5% and 14.6~17.3% at 56 days; 16.9~19.6% and 12.8~15.0% at 180 days (Table 4). For the MgO-rGO-incorporated mixes, the compressive strength was increased with the use of 0.3% and 0.6% rGO, respectively, by 24.2~25.2% and 21.7~22.2% at 7 days; 35.1~42.8% and 25.3~31.5% at 14 days; 28.2~34.6% and 20.8~26% at 28 days; 22~26.2% and 15.8~19.2% at 56 days; 19.6~22.9% and 13.9~16.6% at 180 days. The MgO-MWCNT/rGO combination significantly increased the compressive strength development, showing a higher % increase in strength at all ages for the AAECs. Moreover, the negative influence of higher dosages (>0.3%) of MWCNTs was overcome by using a 5% MgO-0.3%/0.6% MWCNT combination, changing the decrease in compressive strength to an increase.
Figure 11a–c shows the influence of the MWCNT, rGO, and MgO content on the 28-day compressive strength of AAECs. The increase in MgO content from 0 to 5% increased the 28-day compressive strength of the AAECs (Figure 11a). On the other hand, the 28-day compressive strength increased with the increase in MWCNT or rGO content to 0.3% then showed a decreasing trend up to 0.6% (Figure 11b,c). Therefore, it can be concluded that 0.3% is an optimum dose for MWCNTs/rGO to achieve better compressive strength.
These results indicate that the compressive strength was decreased by adding a higher amount (>0.3% wt) of MWCNTs/rGO, although this effect can be compensated/reversed by using MgO-MWCNT/rGO combinations. Previous studies by Rovnaník et al. [40] also confirmed the compressive strength enhancement of fly ash-based geopolymer composites with the addition of low dosages (0.2 wt%) of MWCNTs. An increase in the flexural strength, modulus of elasticity, and toughness was also observed with the use of 0.35% of rGO as a nano-filler in geopolymer composites [17]. This was attributed to the strong dispersion of rGO sheets between fly ash particles due to their malleable property causing them to fill voids and produce a denser matrix. A lower dosage of MWCNTs/rGO can be uniformly dispersed in the matrix, which in turn will improve the compressive strength, as observed in [17]. Although an appropriate amount of rGO can be evenly dispersed in the matrix, overlap and agglomeration may still occur in excess, limiting the development of compressive strength. Furthermore, the rGO with a wrinkled texture cross-linked around geopolymer particles altered the morphology and reduced the matrix’s porosity, which positively impacted its fracture toughness [17]. Also, a smaller-sized MWCNT resulted in a higher mortar compressive strength, as smaller MWCNTs were distributed at a much finer scale, filling nanopore space within the matrix more efficiently [40].

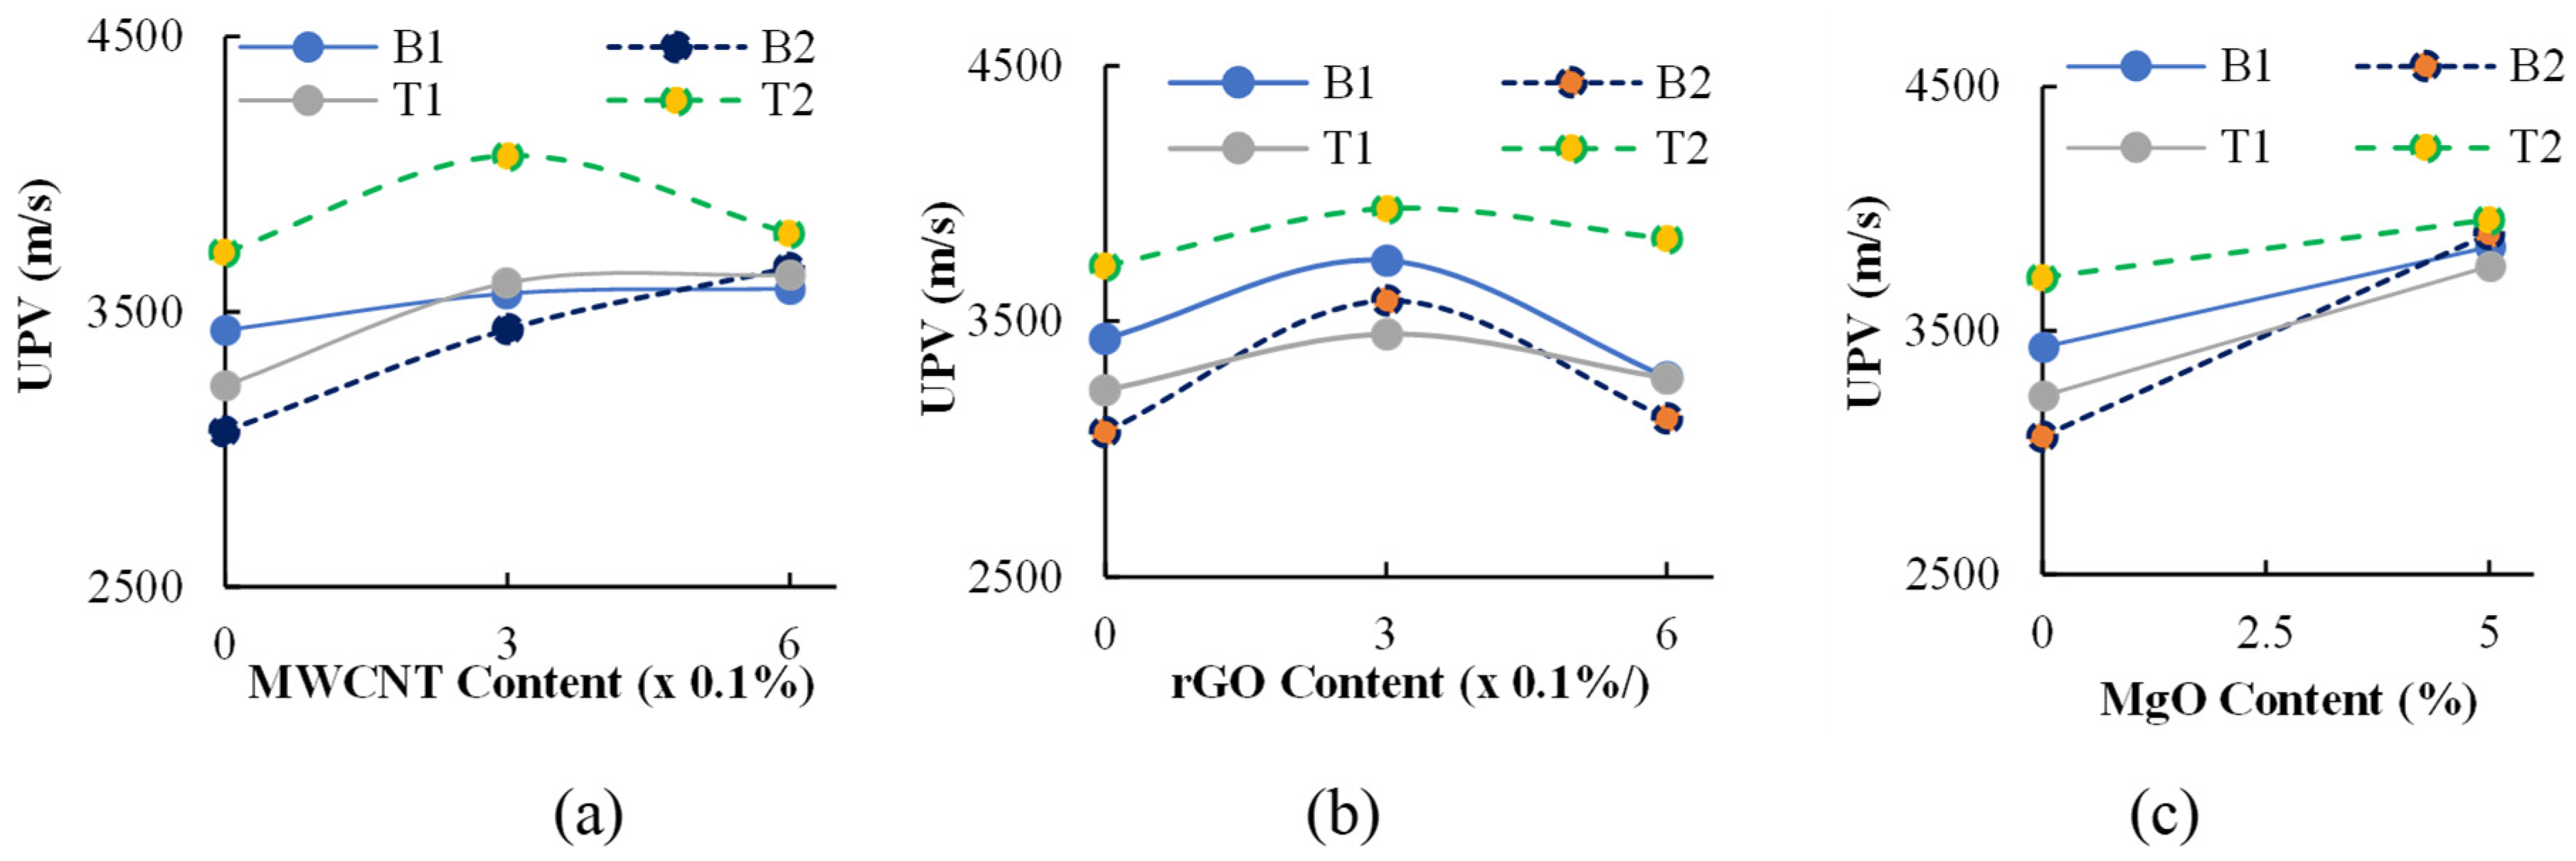
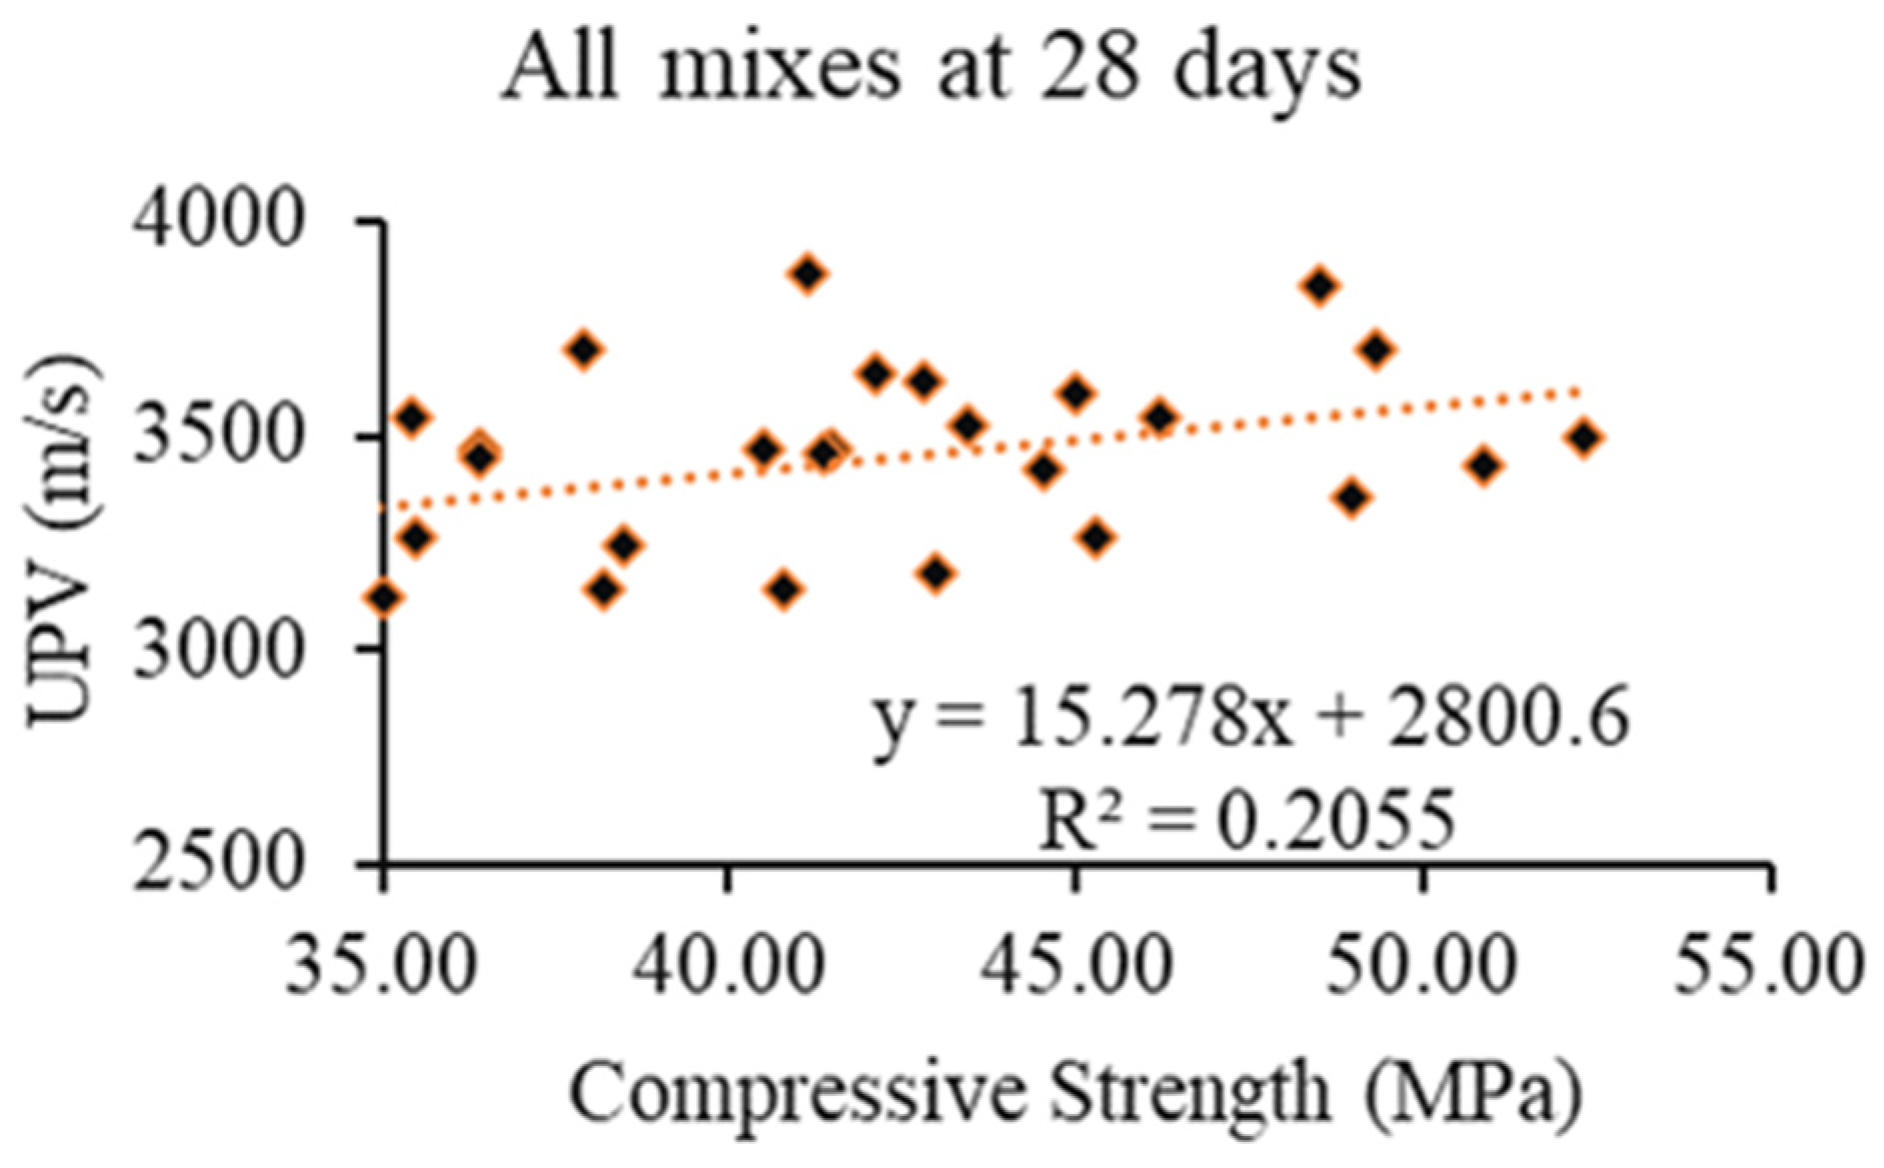
3.2.2. Influence of MgO, MWCNT, and rGO on 28-Day UPV

A UPV test was conducted to determine the quality of concrete, including detecting the presence of cavities, joints, and cracks in addition to other properties over time. A high UPV indicates a lower number of pores, that the particles are closer to each other, a higher matrix homogeneity, and a lower wave travel time. Table 3 summarizes the 28-day UPV values, which ranged between 3067 m/s and 3717 m/s, between 3762 m/s and 3954 m/s, between 3436 m/s and 4068 m/s, and between 3122 m/s and 3943 m/s for control and the MgO-, MWCNT-, and rGO-incorporated AAECs, respectively. Higher UPV values were obtained for the AAEC mixes containing MgO, MWCNTs, and rGO than their control counterparts (Table 3 and Figure 12a–c).
Figure 12a shows that, by adding 5% MgO in the AAECs, the UPV values were increased from 6.4% (T2M5) to 27% (B2M5). The reason for this improvement was due to additional reactions and extra C–A–S–H formation, which densified the matrix and reduced the time for wave transmission. In addition, the formation of Mg(OH)2 crystals produced uniform expansion and refined the pore size and pore structure, which also contributed to the higher UPV and compressive strength, as discussed earlier. These results supported the findings of previous studies by other researchers [22,82].
Figure 12b,c shows that adding 0.3% MWCNT/rGO increased the maximum UPV values up to 12% (for B2C3). This indicated CNTs’/rGO’s filling capability, whichreduces the porosity to produce a denser matrix (as discussed earlier), which in turn led to stronger UPV and conductive properties. However, the addition of 0.6% MWCNTs/rGO did not produce a linear increase in UPV; rather, it tended to produce lower UPV values, indicating that 0.3% MWCNT/rGO is the optimum concentration (as observed in the case of compressive strength), with the exception of B2C6 (showing an increase of 19% in UPV). This can happen due to the improper dispersion of MWCNTs/rGO at higher concentrations beyond the optimum doses in the AAECs. This finding supports the results of a previous study by Asil and Ranjbar [83].
Figure 13 shows a linear correlation (dotted line) between the UPV and compressive strength of AAEC mixes at 28 days. The observed trend reveals an increase in compressive strength with an increase in UPV, as expected. The increase in compressive strength often corresponds to a denser and more homogeneous concrete matrix. A denser matrix transmits ultrasonic waves more efficiently, resulting in higher UPV values [84,85].
It is important to note that, while Figure 13 provides a positive correlation, additional analysis considering influencing factors related to the mix design, MWCNT/rGO dispersion, and curing conditions needs to be conducted for a comprehensive understanding of the relationship between the UPV and compressive strength of AAECs. Nevertheless, the derived correlation suggests the potential use of UPV as a reliable non-destructive testing method for assessing the compressive strength of developed AAECs.

3.3. Microstructural Characteristics

The morphology and microstructural characteristics of the AAECs were studied by SEM analysis, while their reaction products and elemental compositions were determined and discussed using SEM/EDS, FTIR, and XRD analyses, which are detailed in the following subsections.

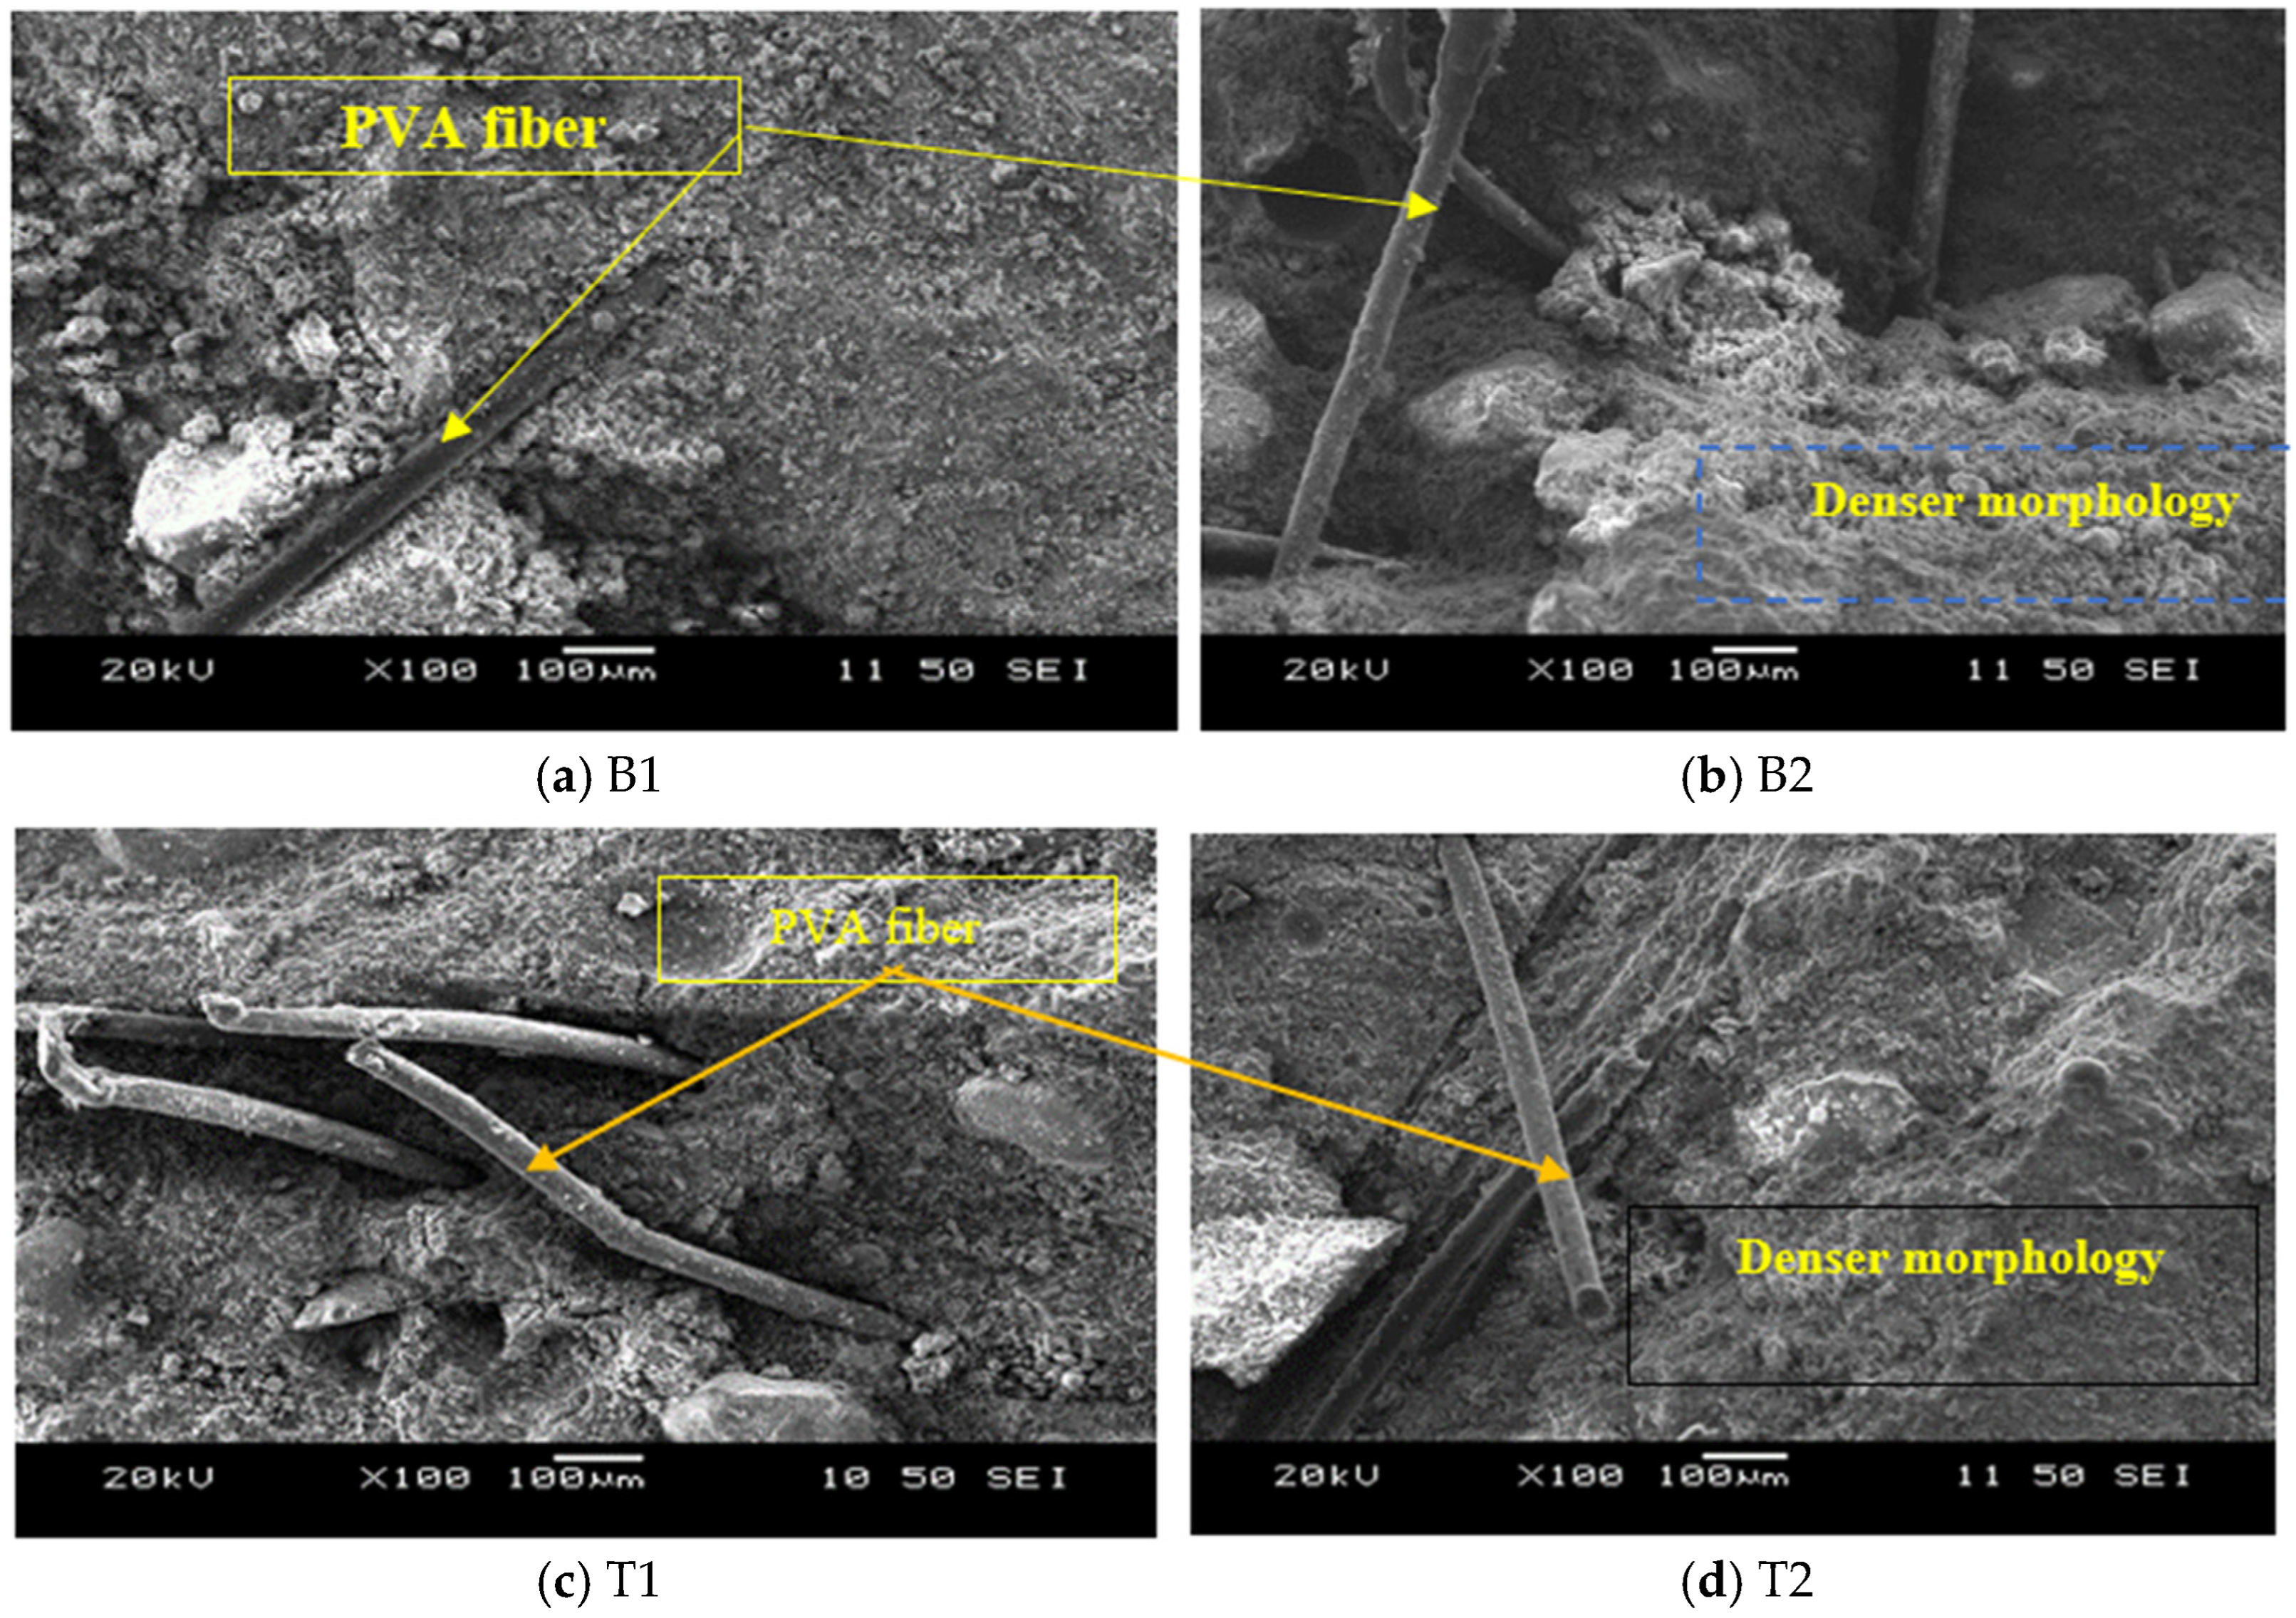
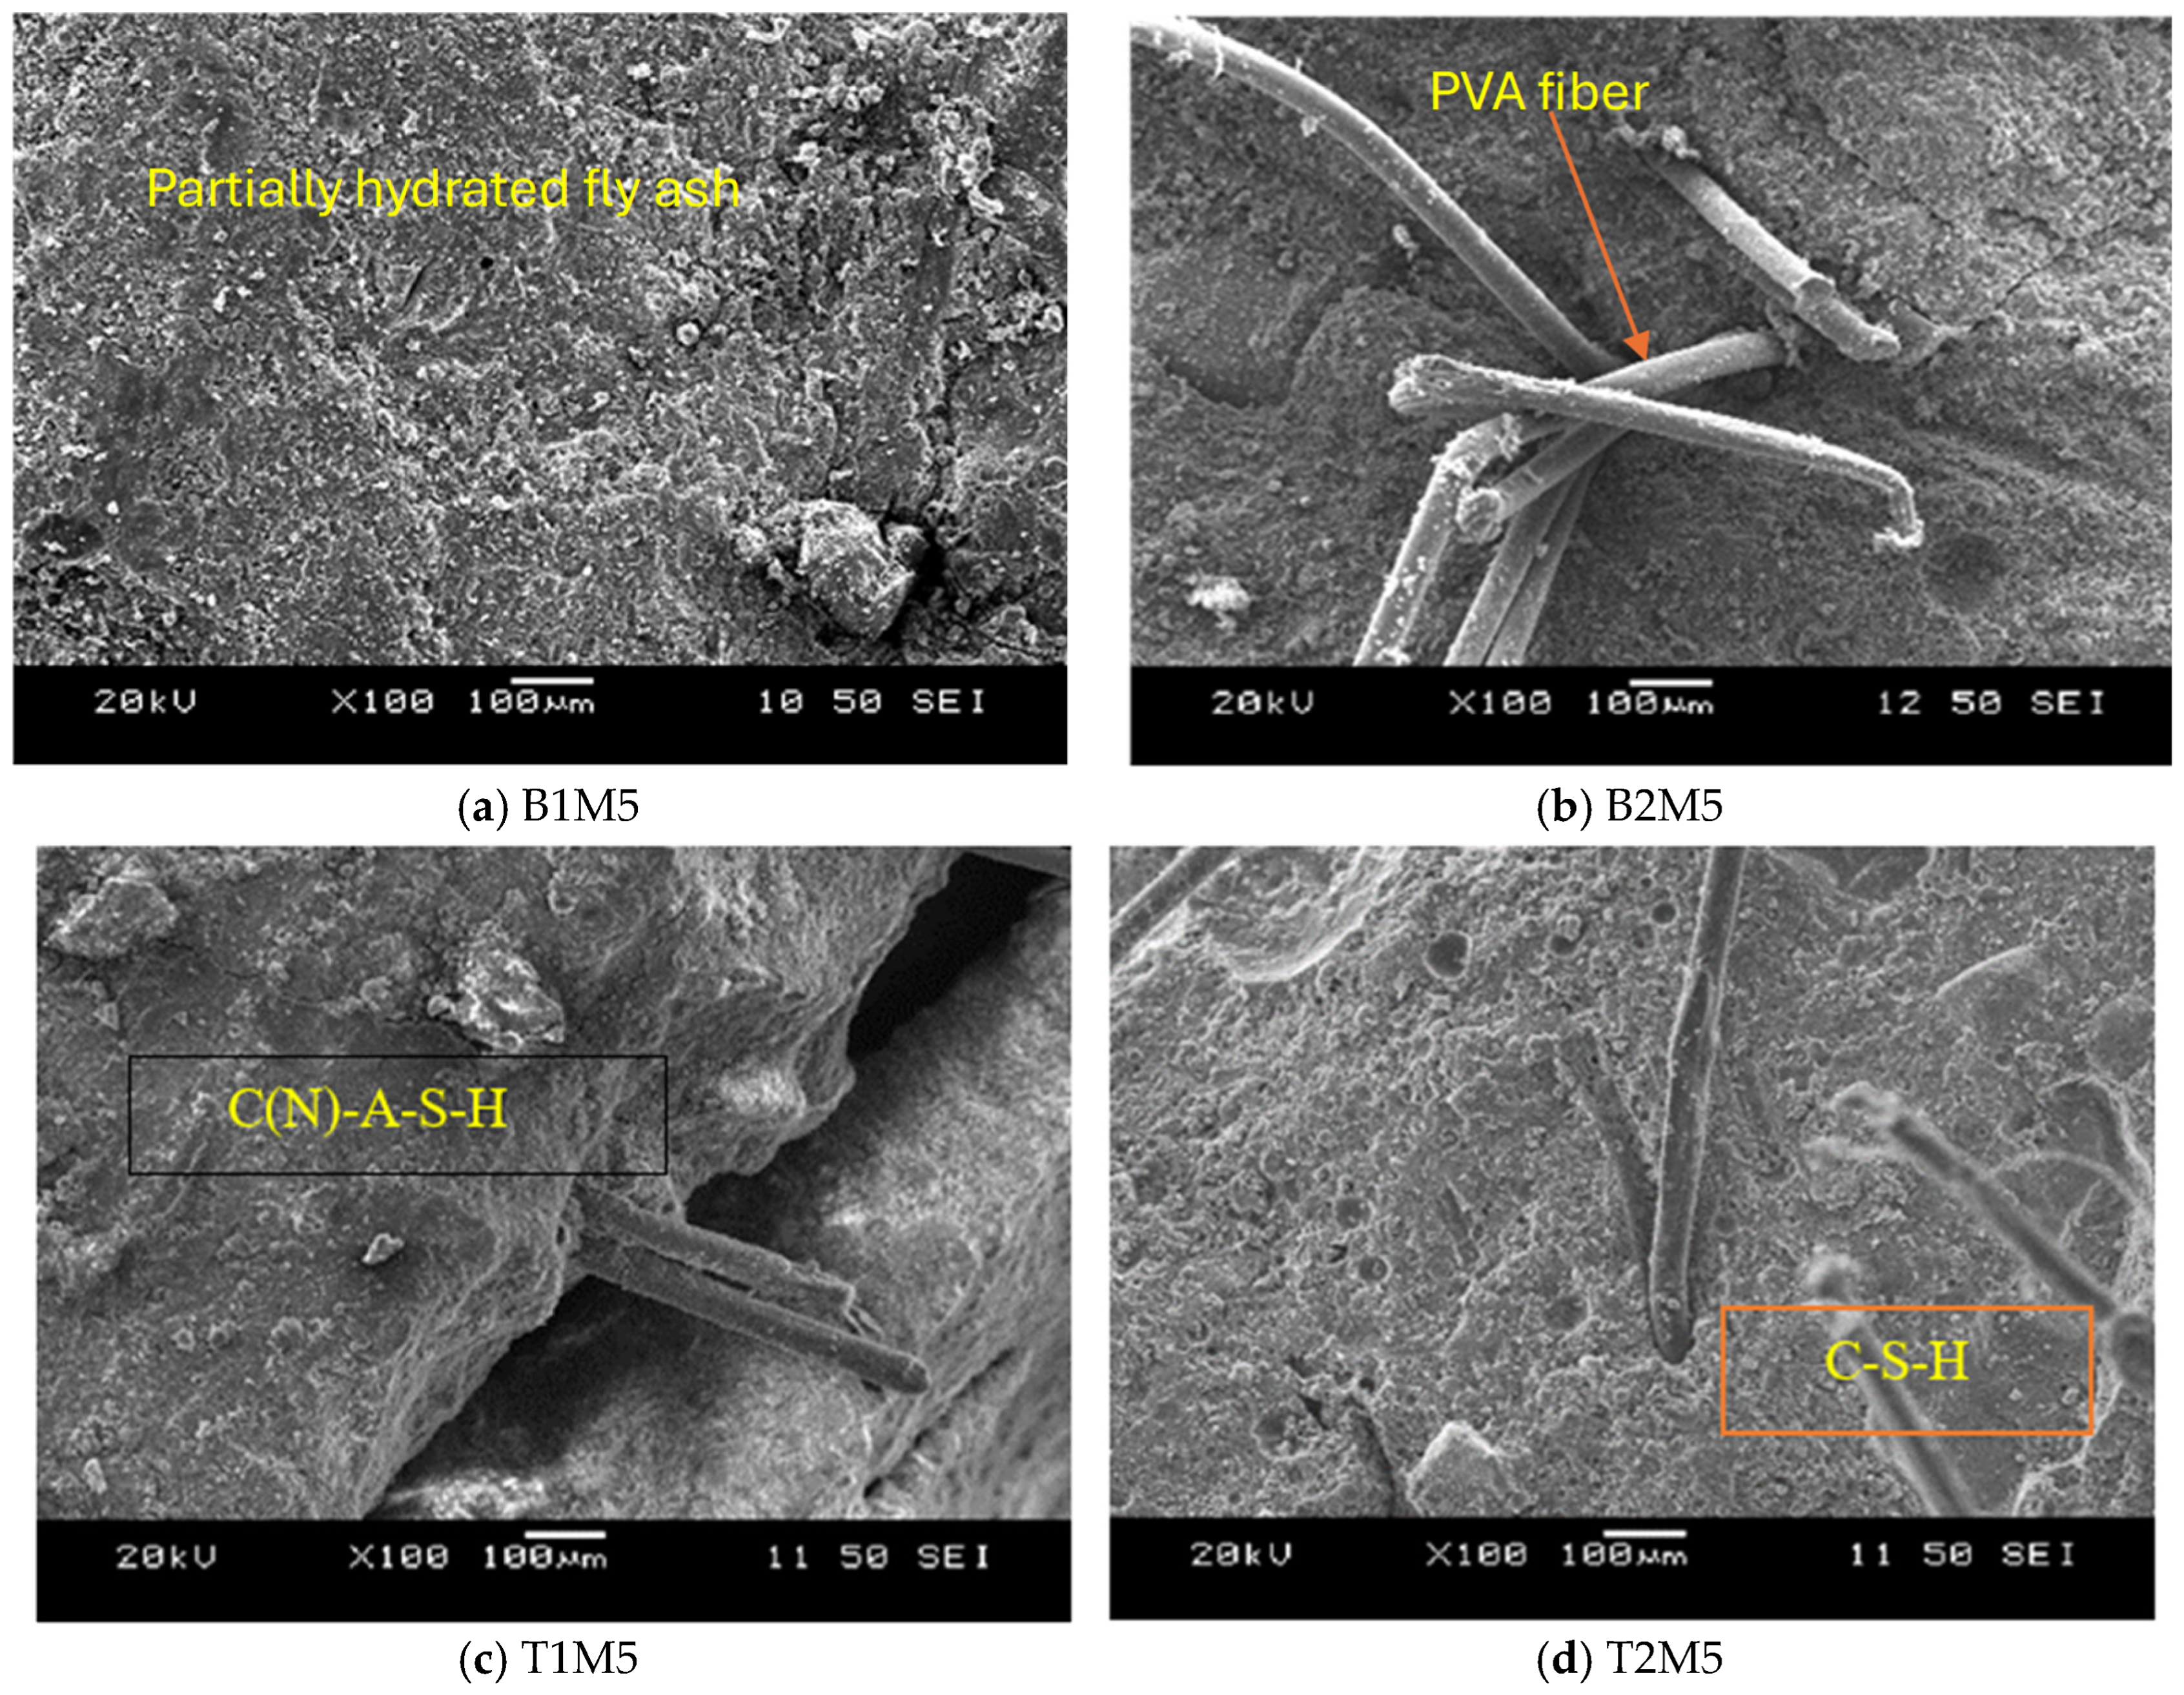
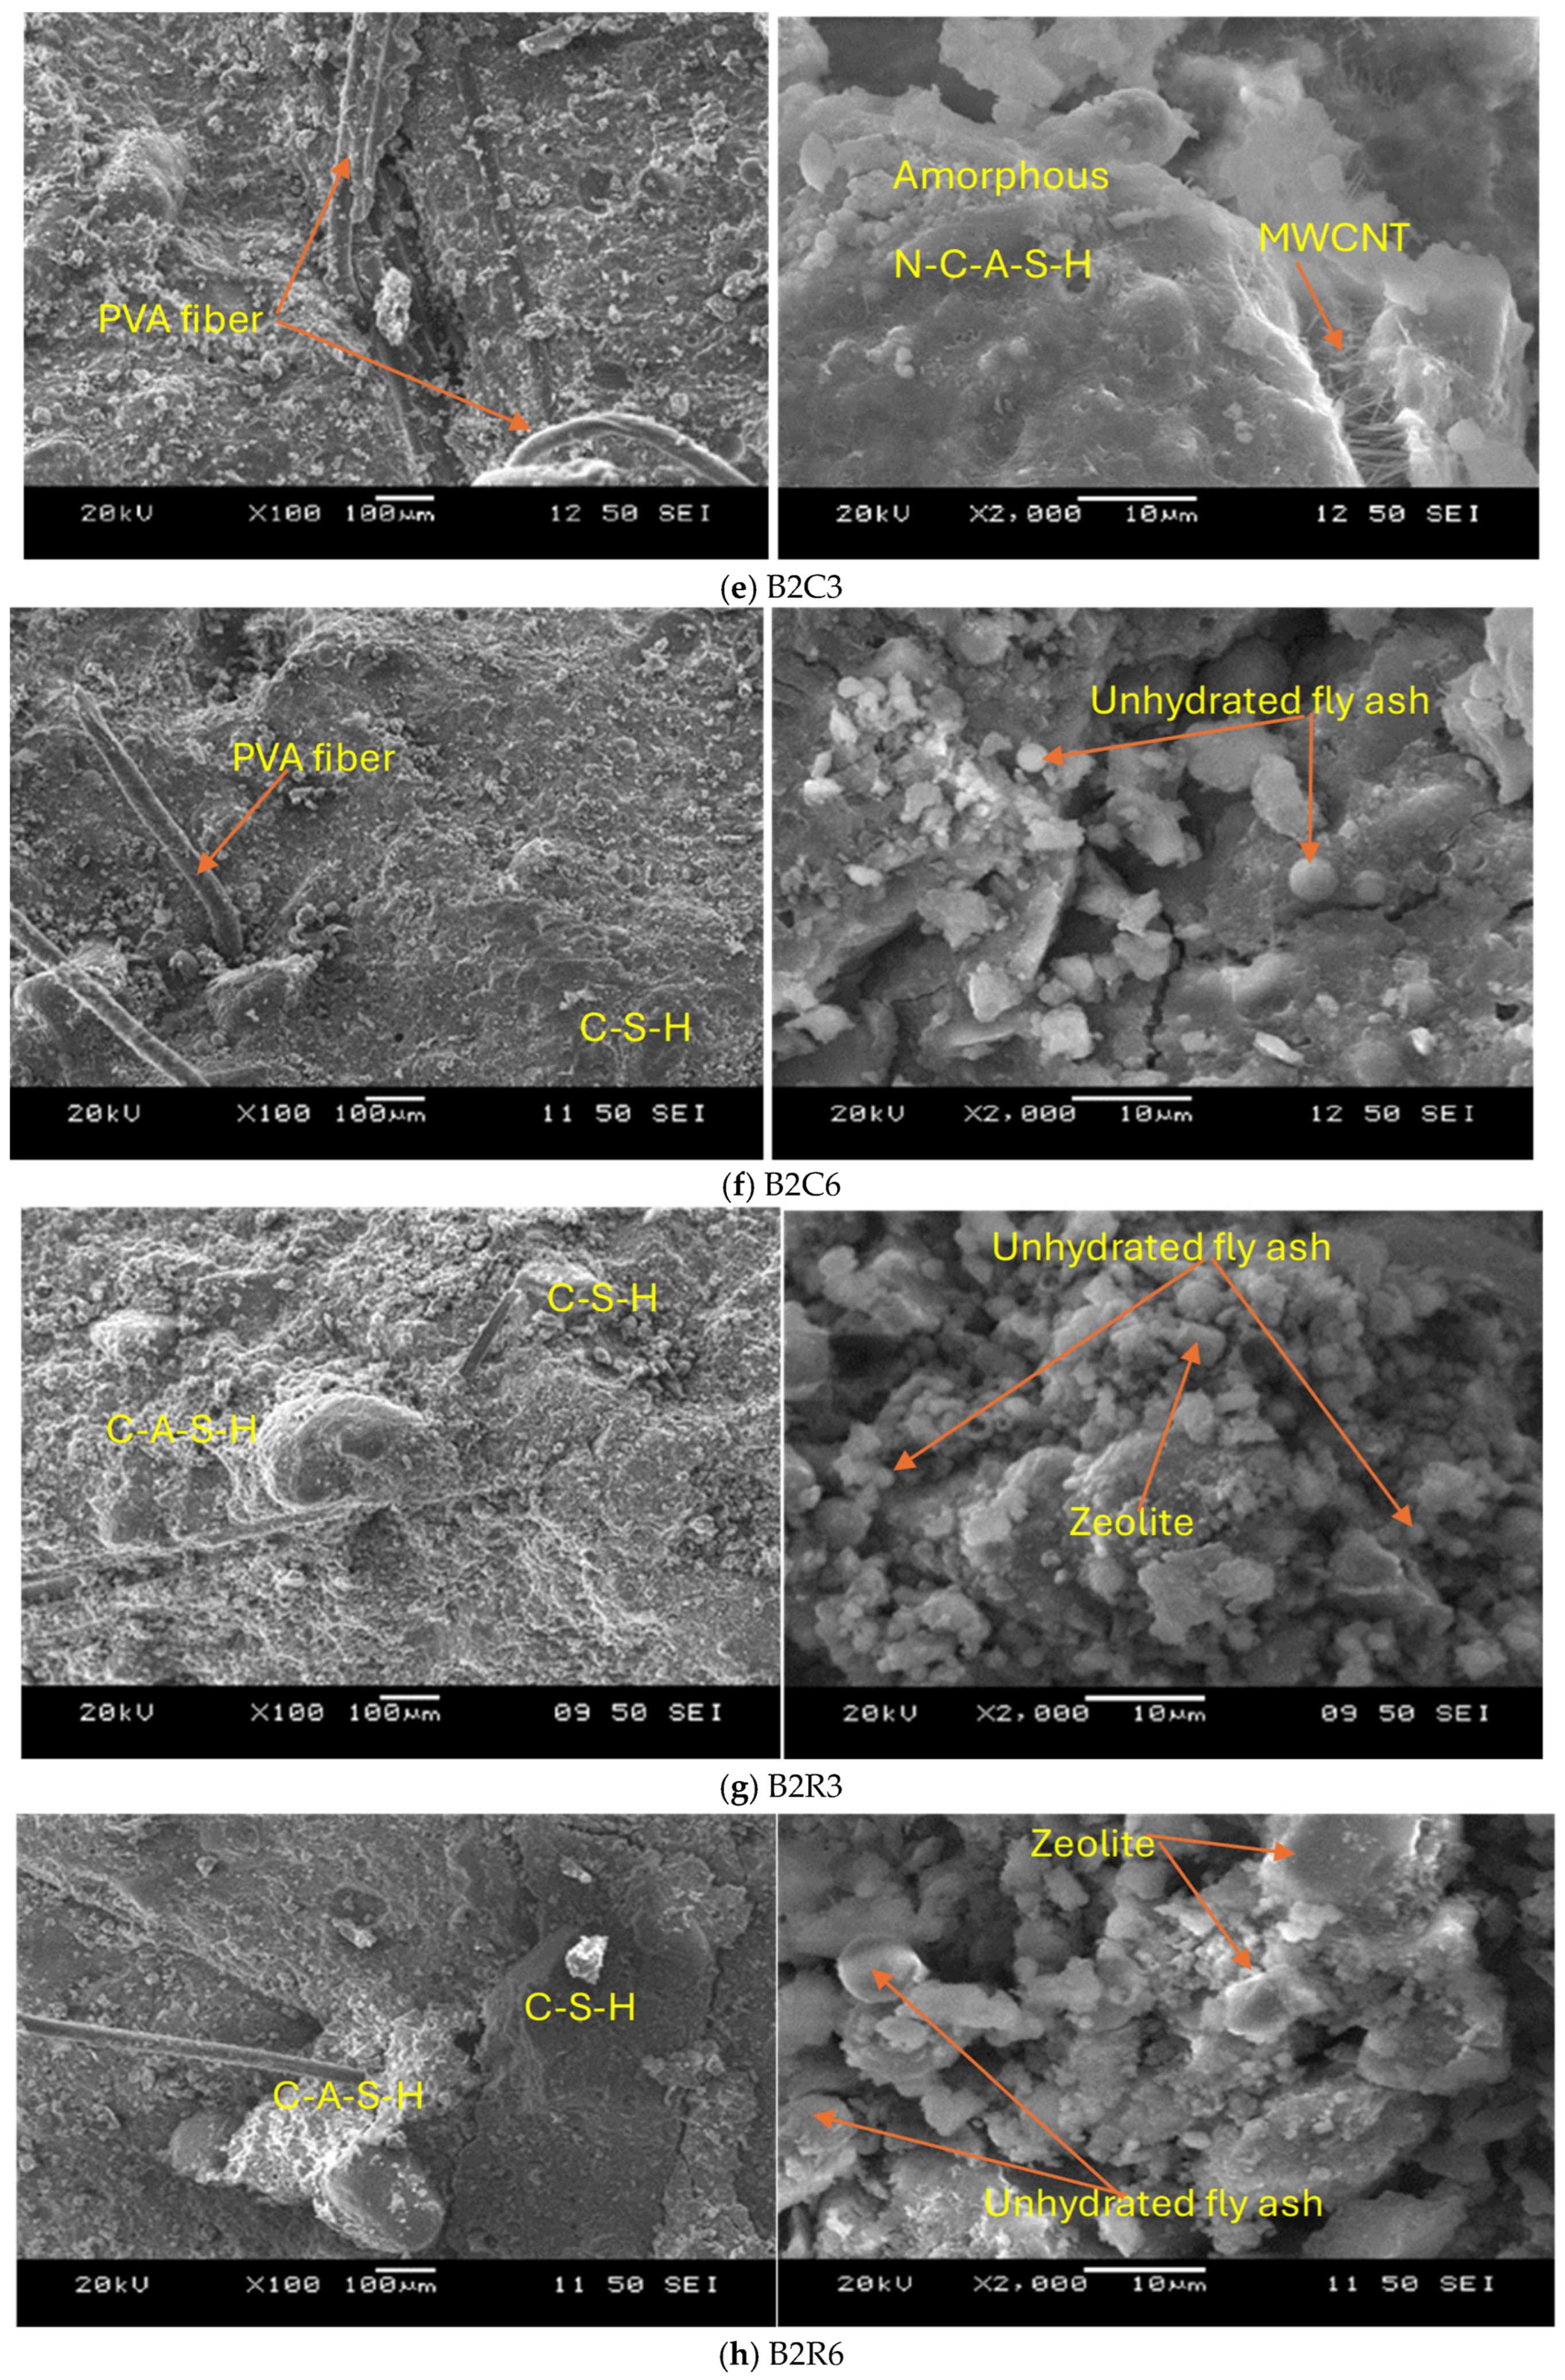
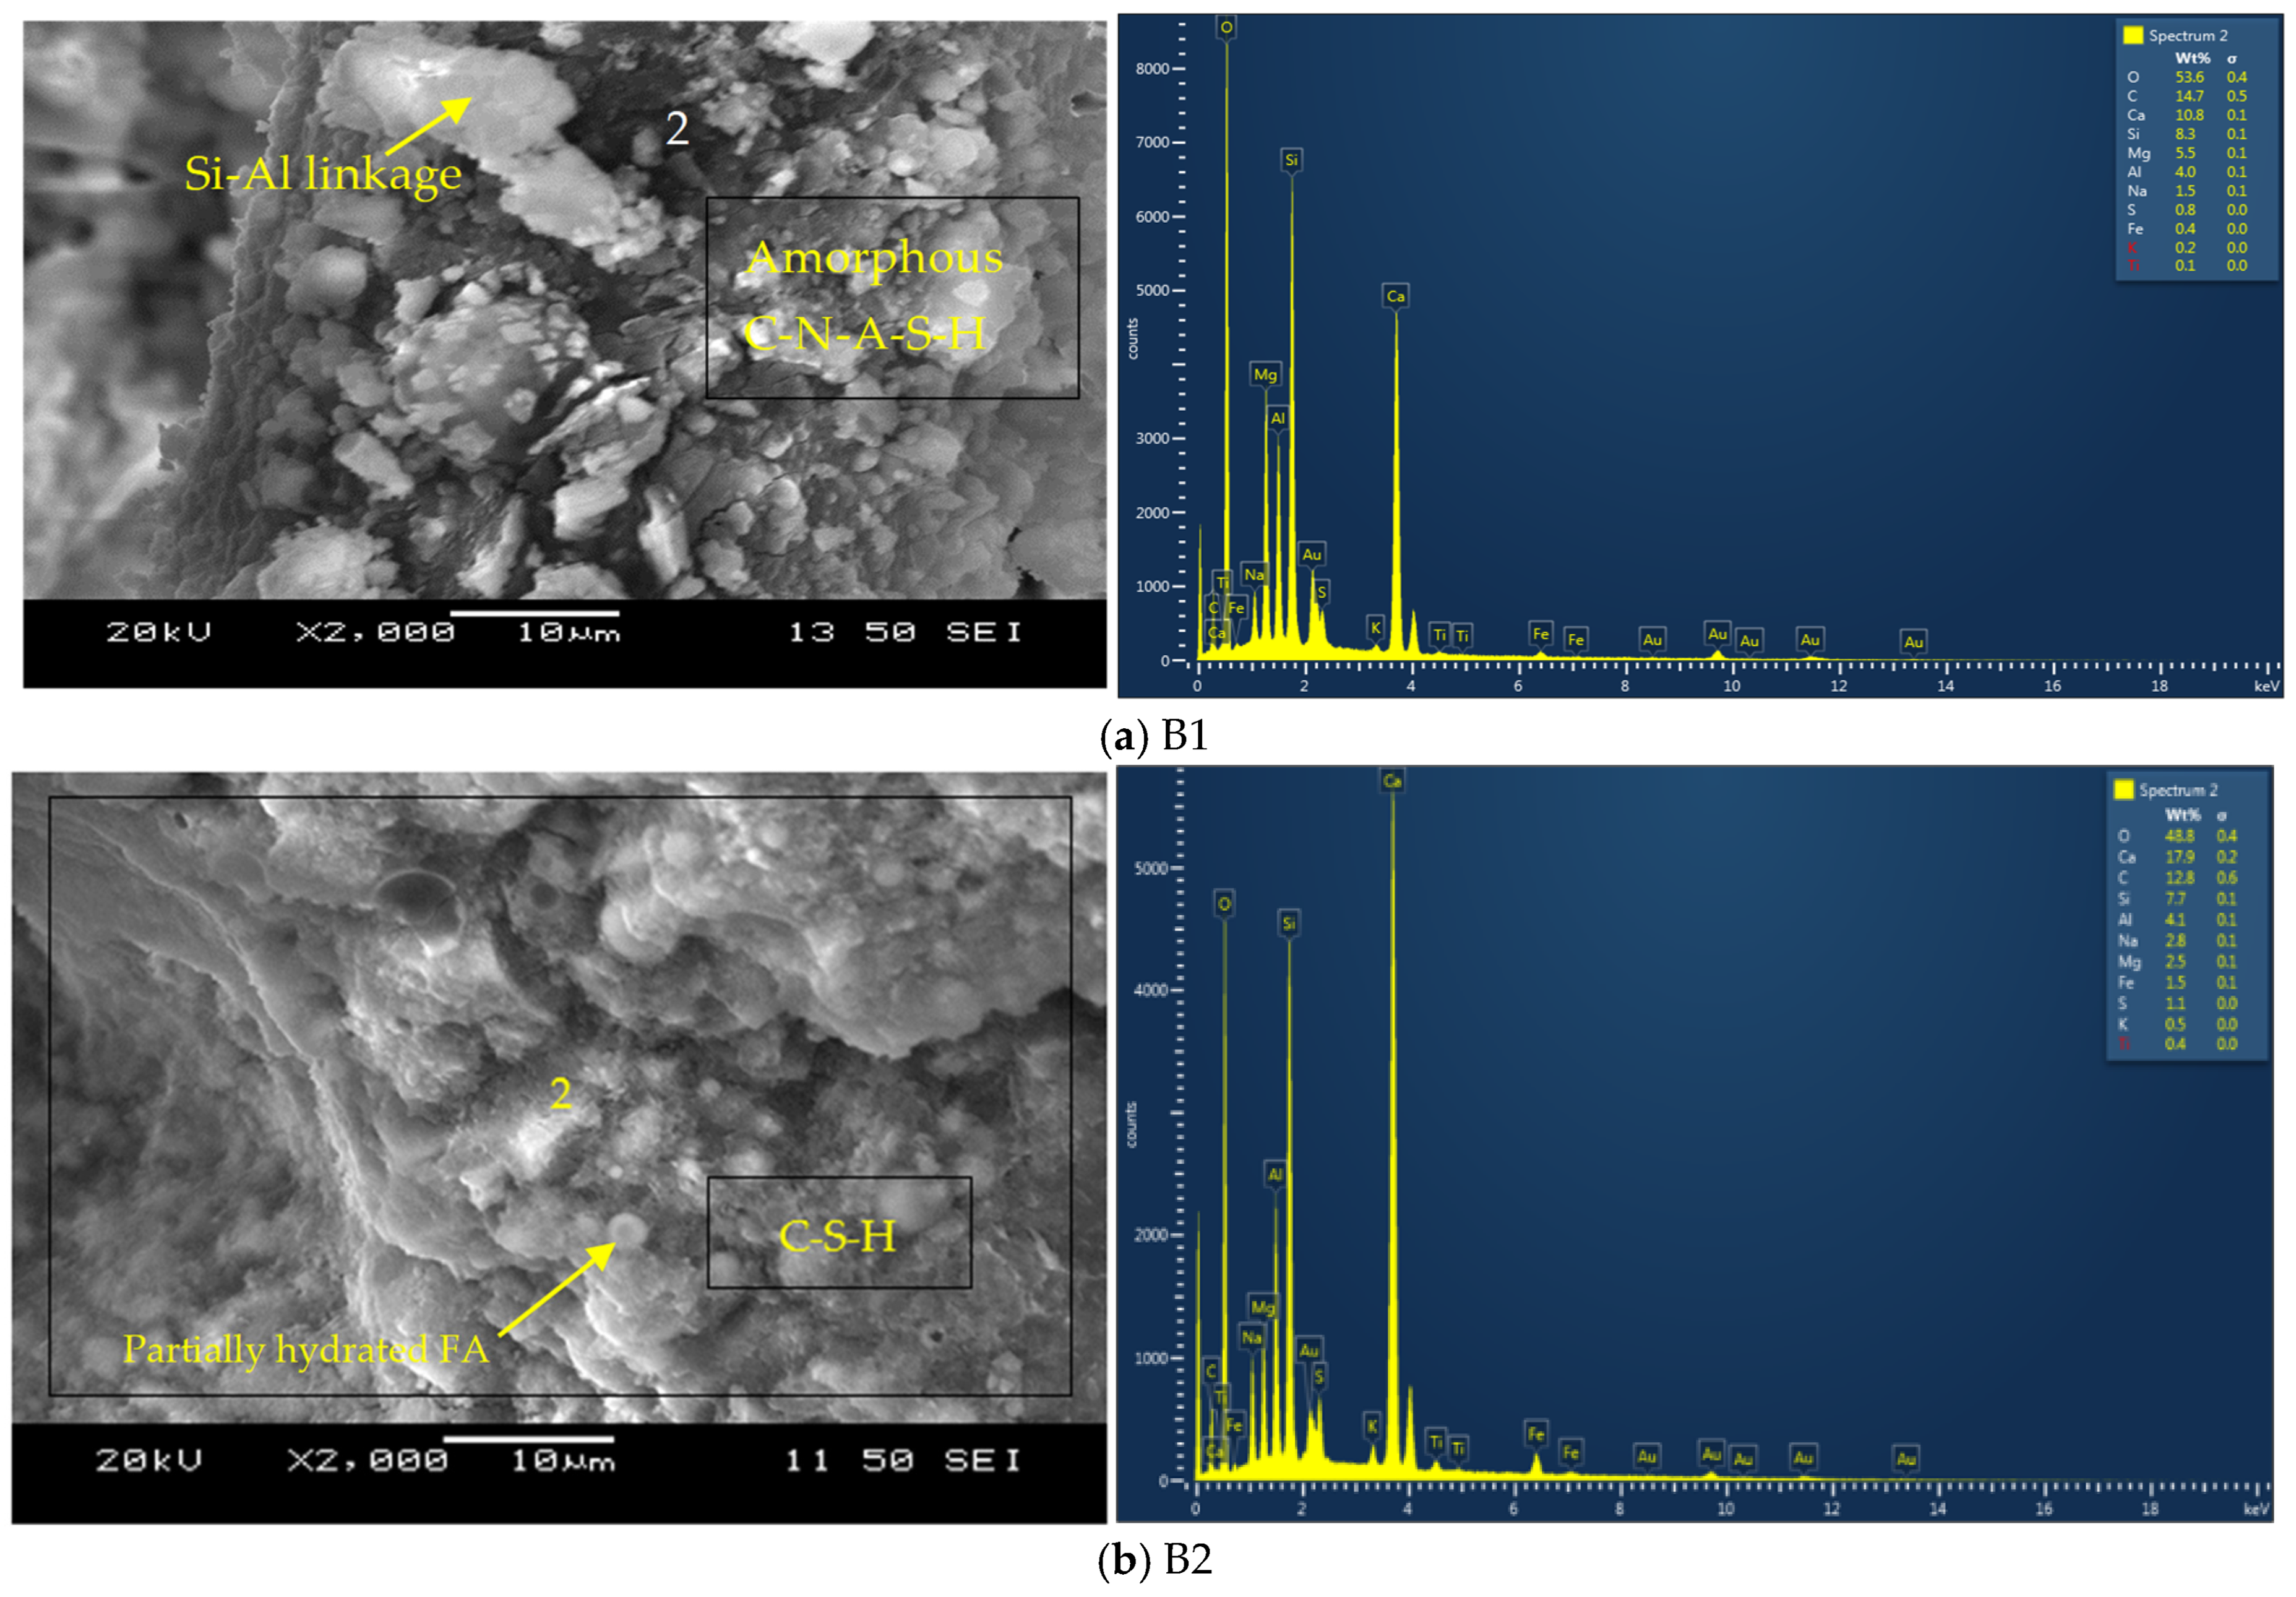
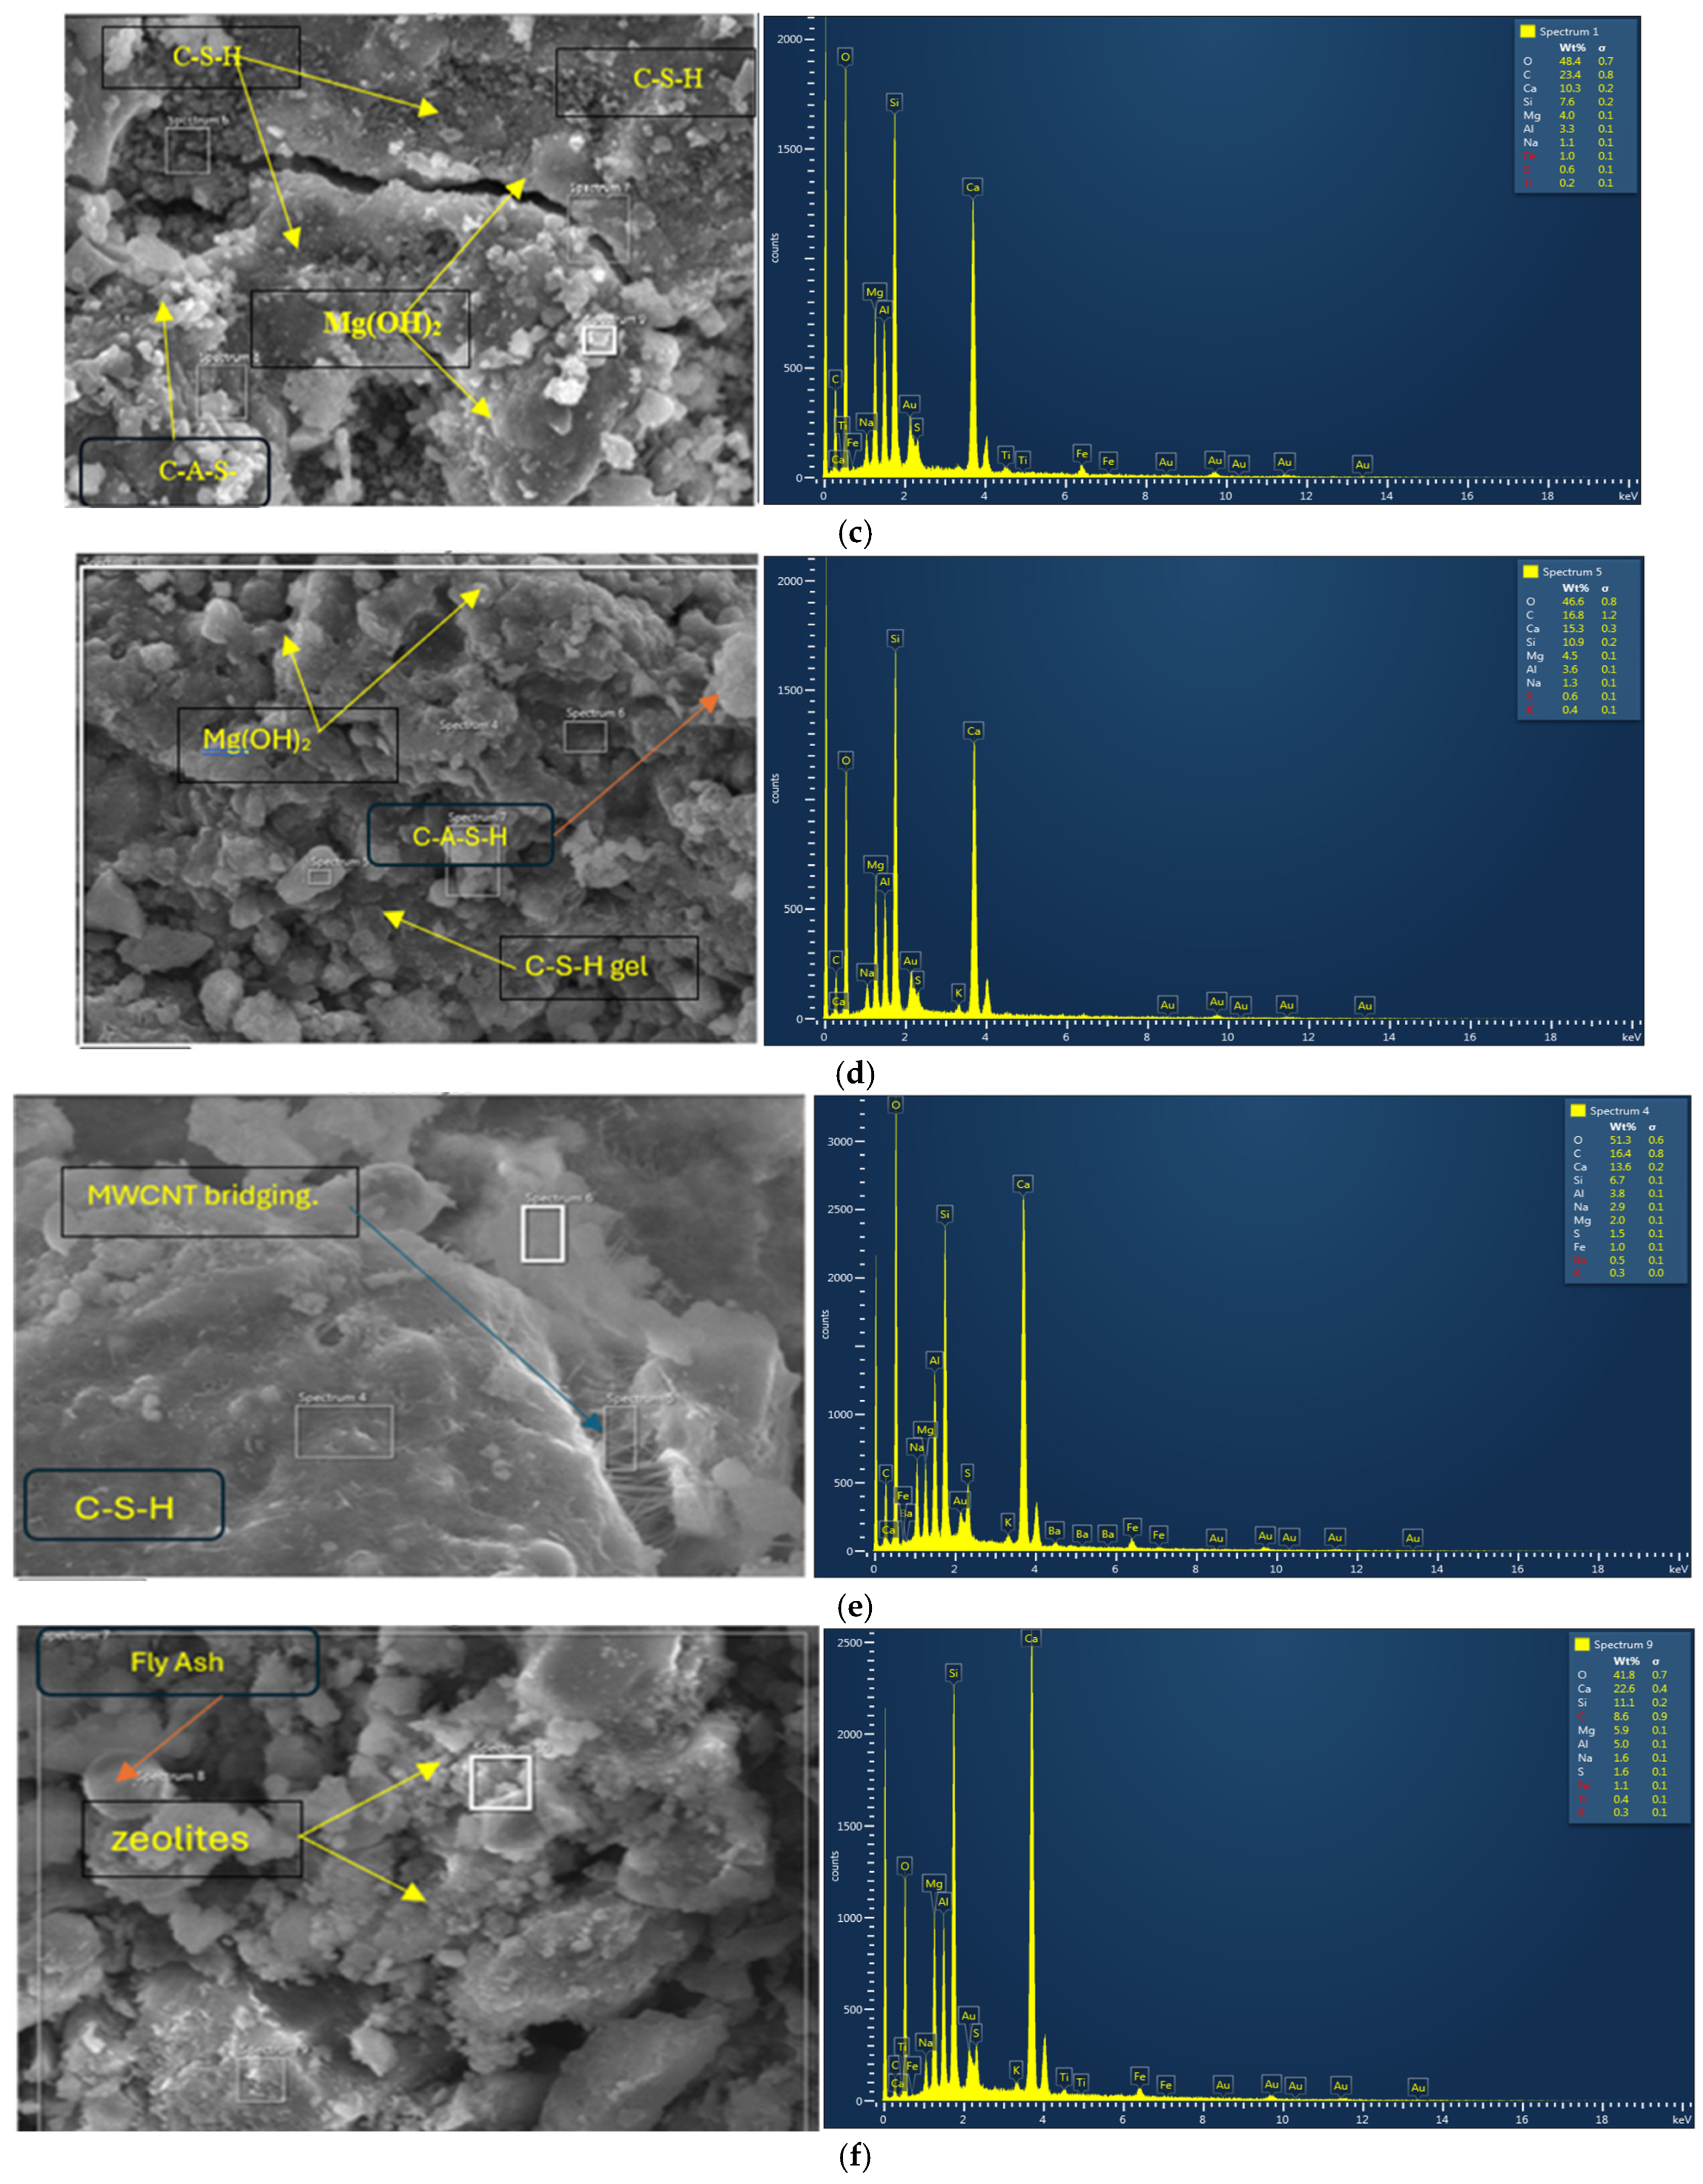
3.3.1. SEM/EDS Analyses
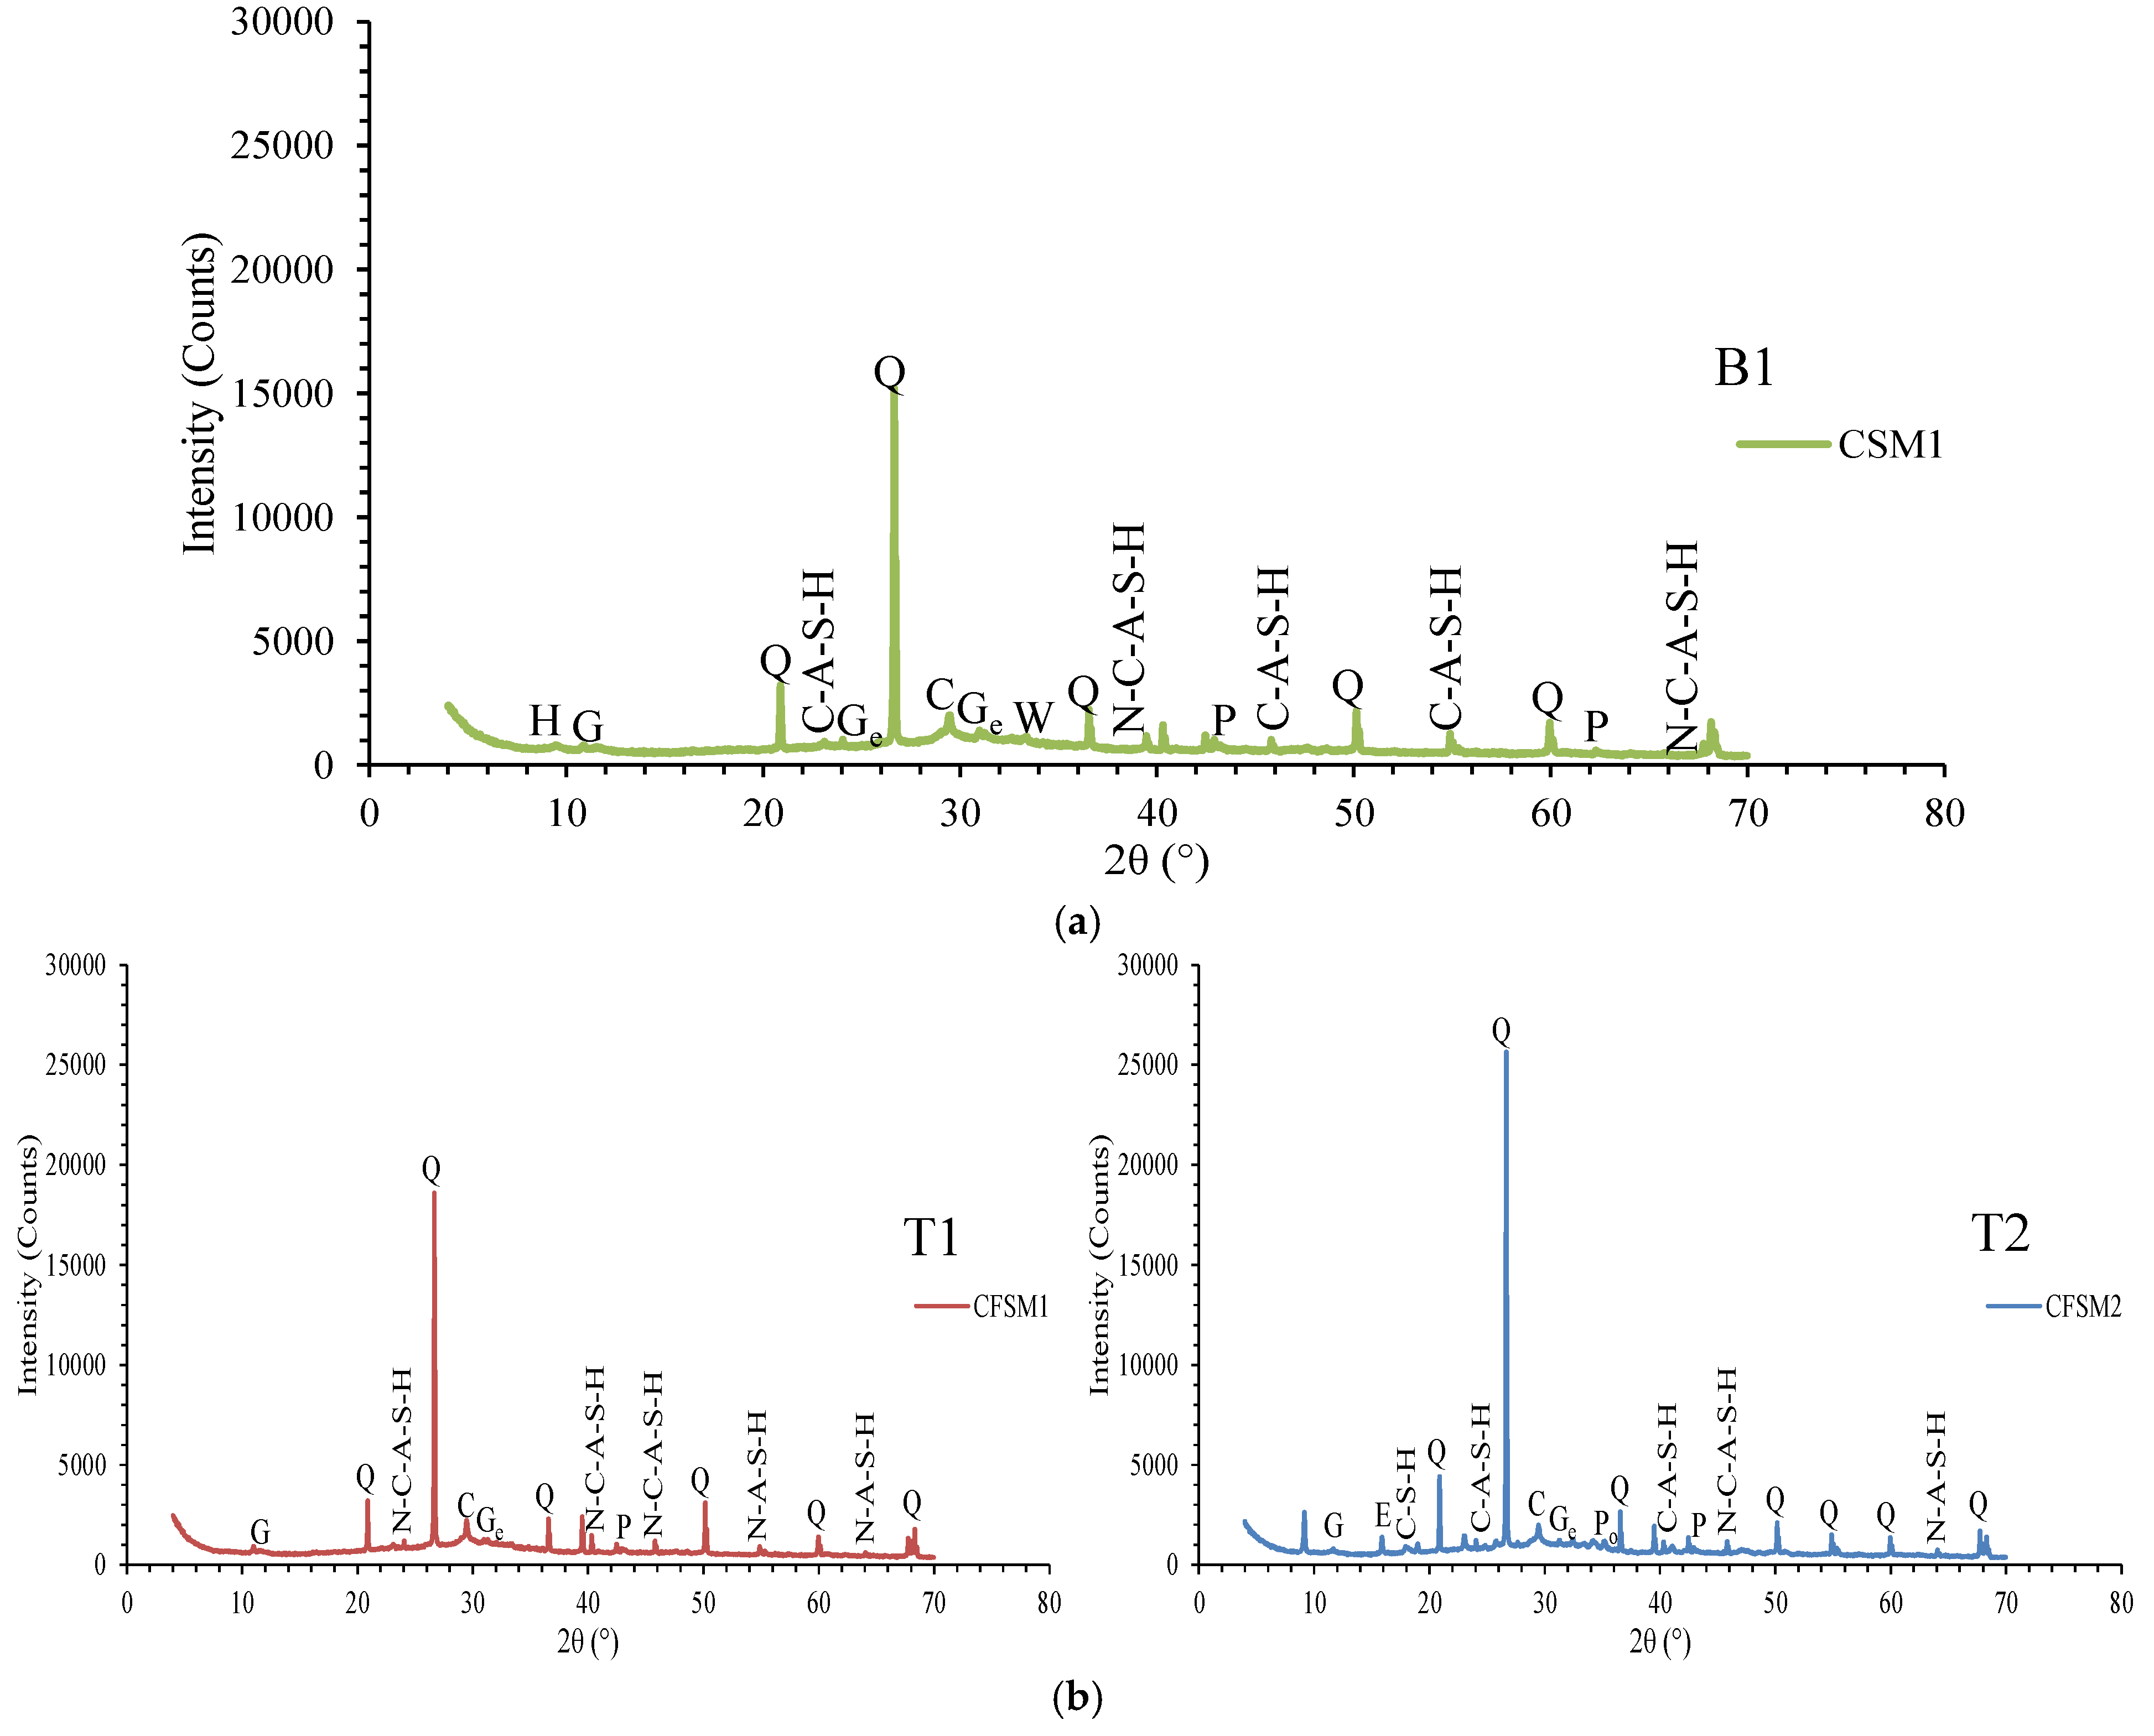
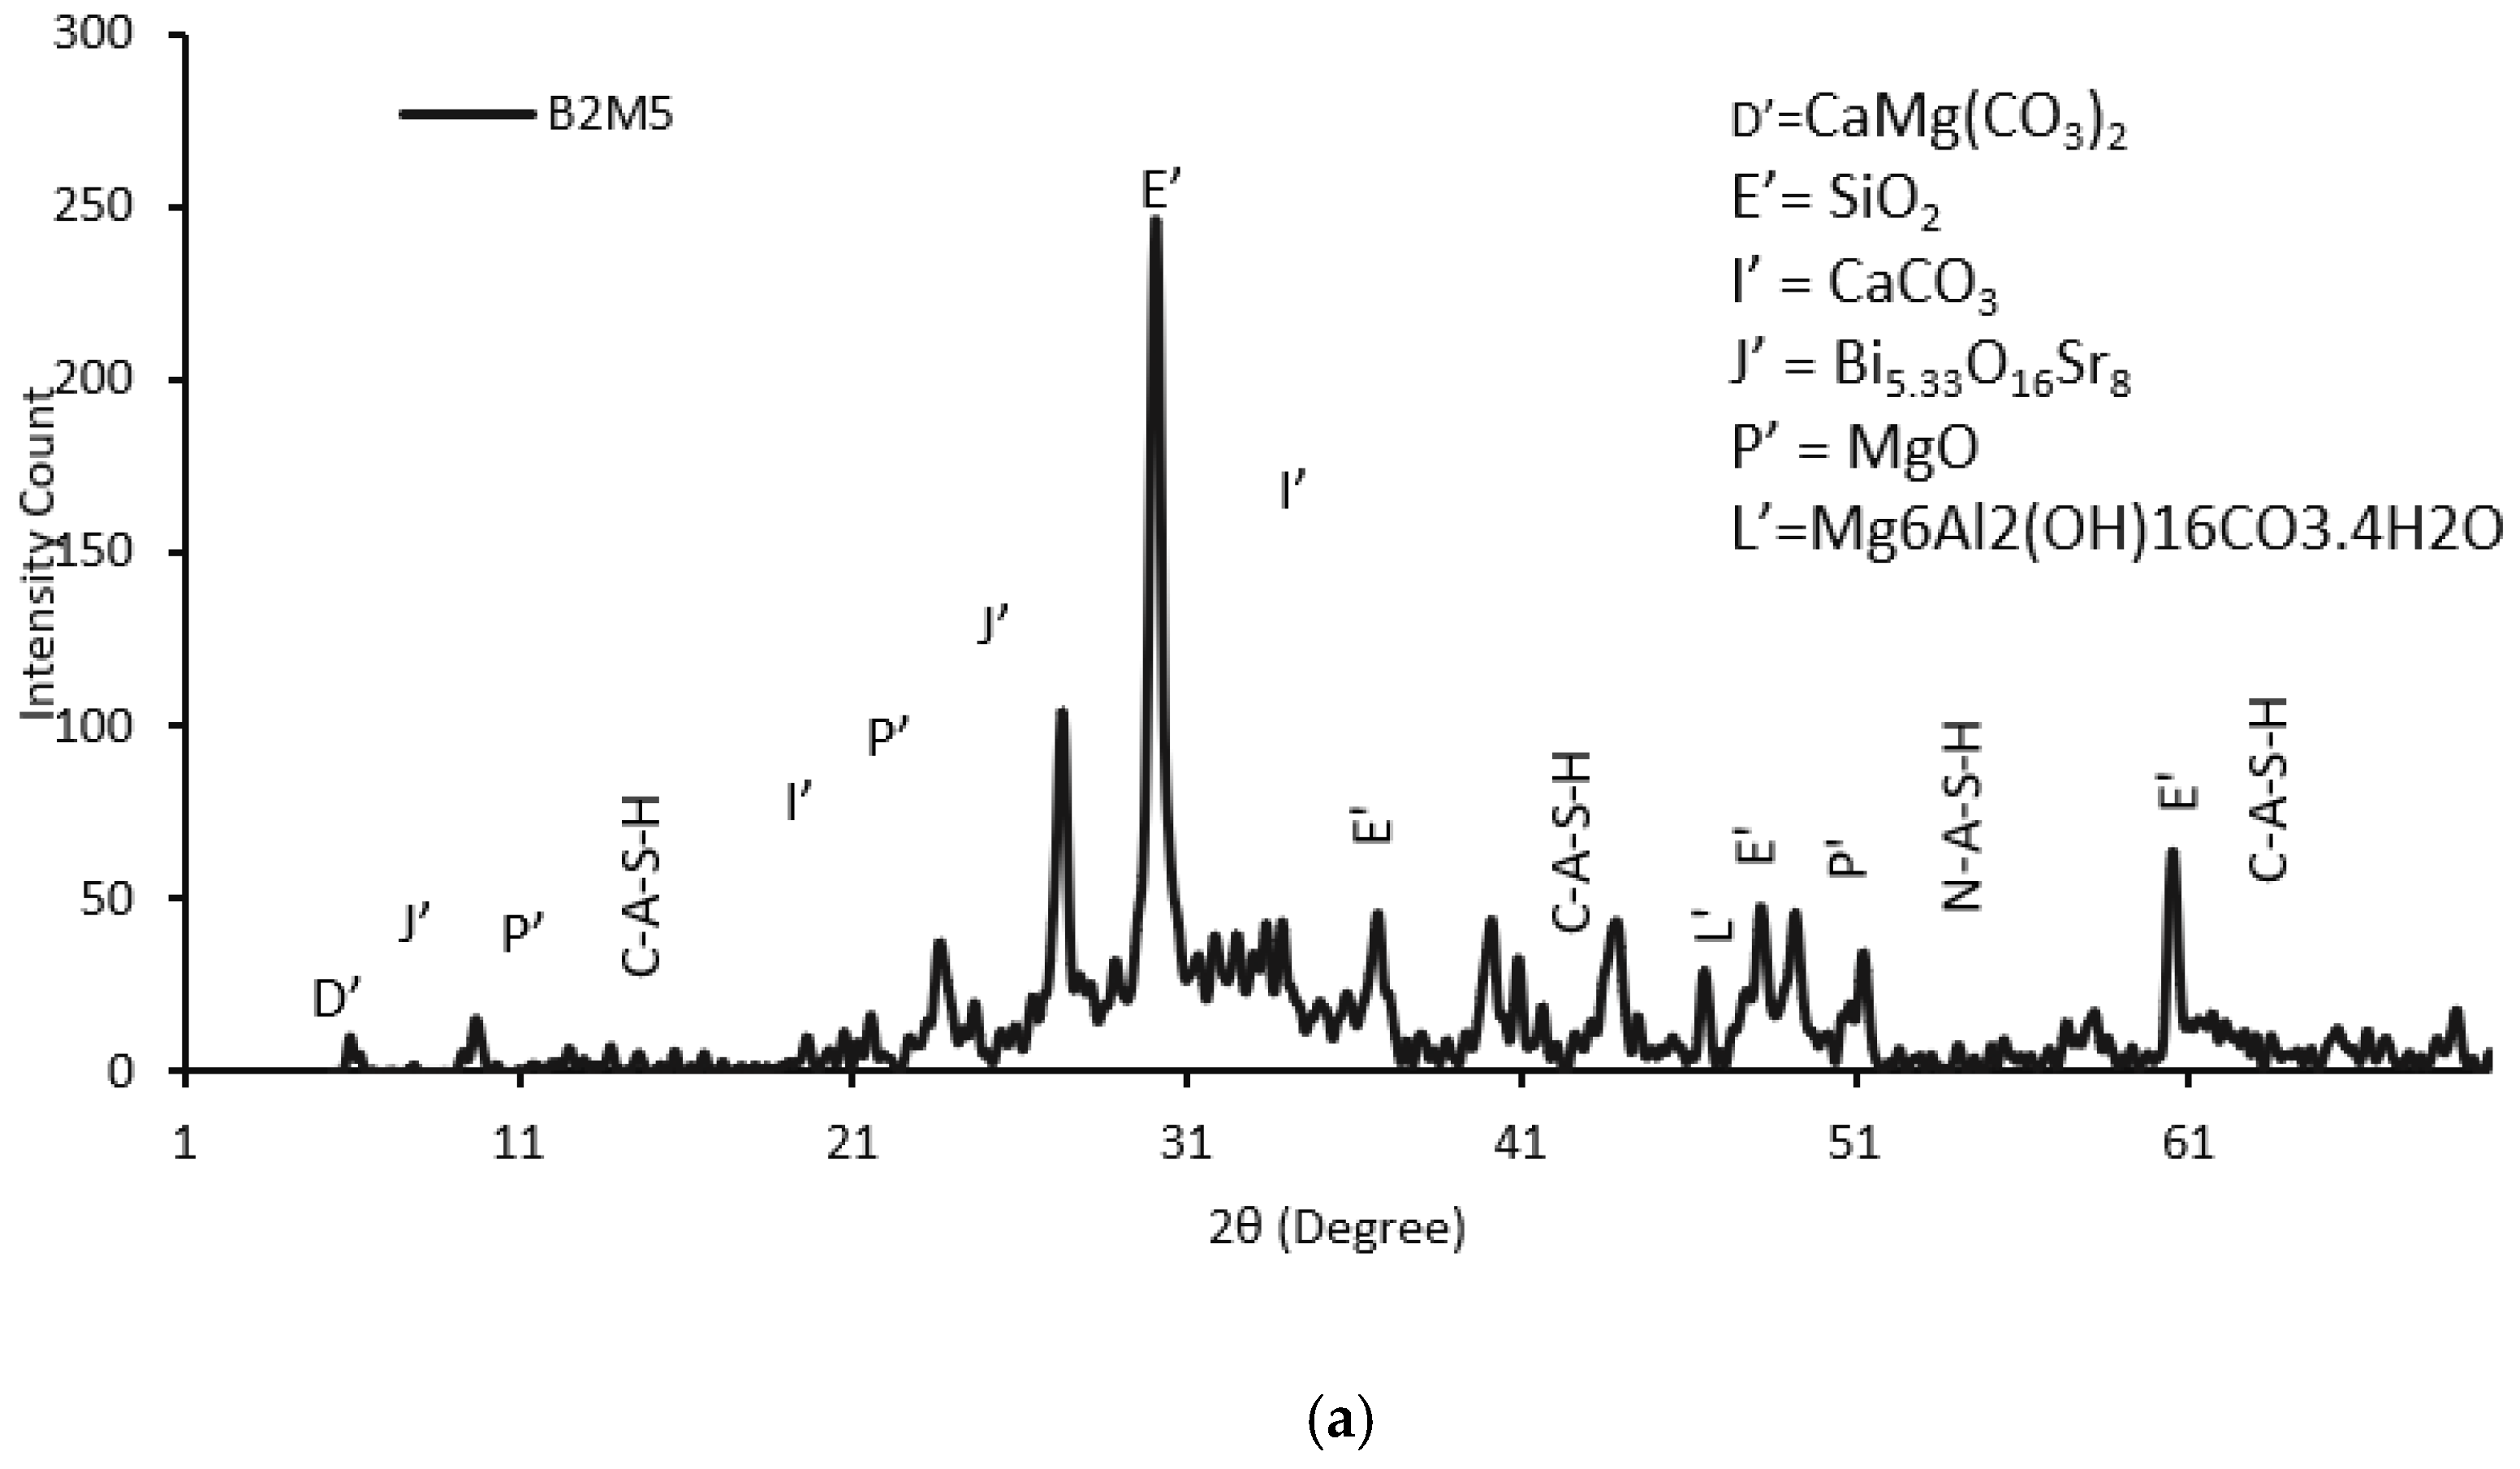
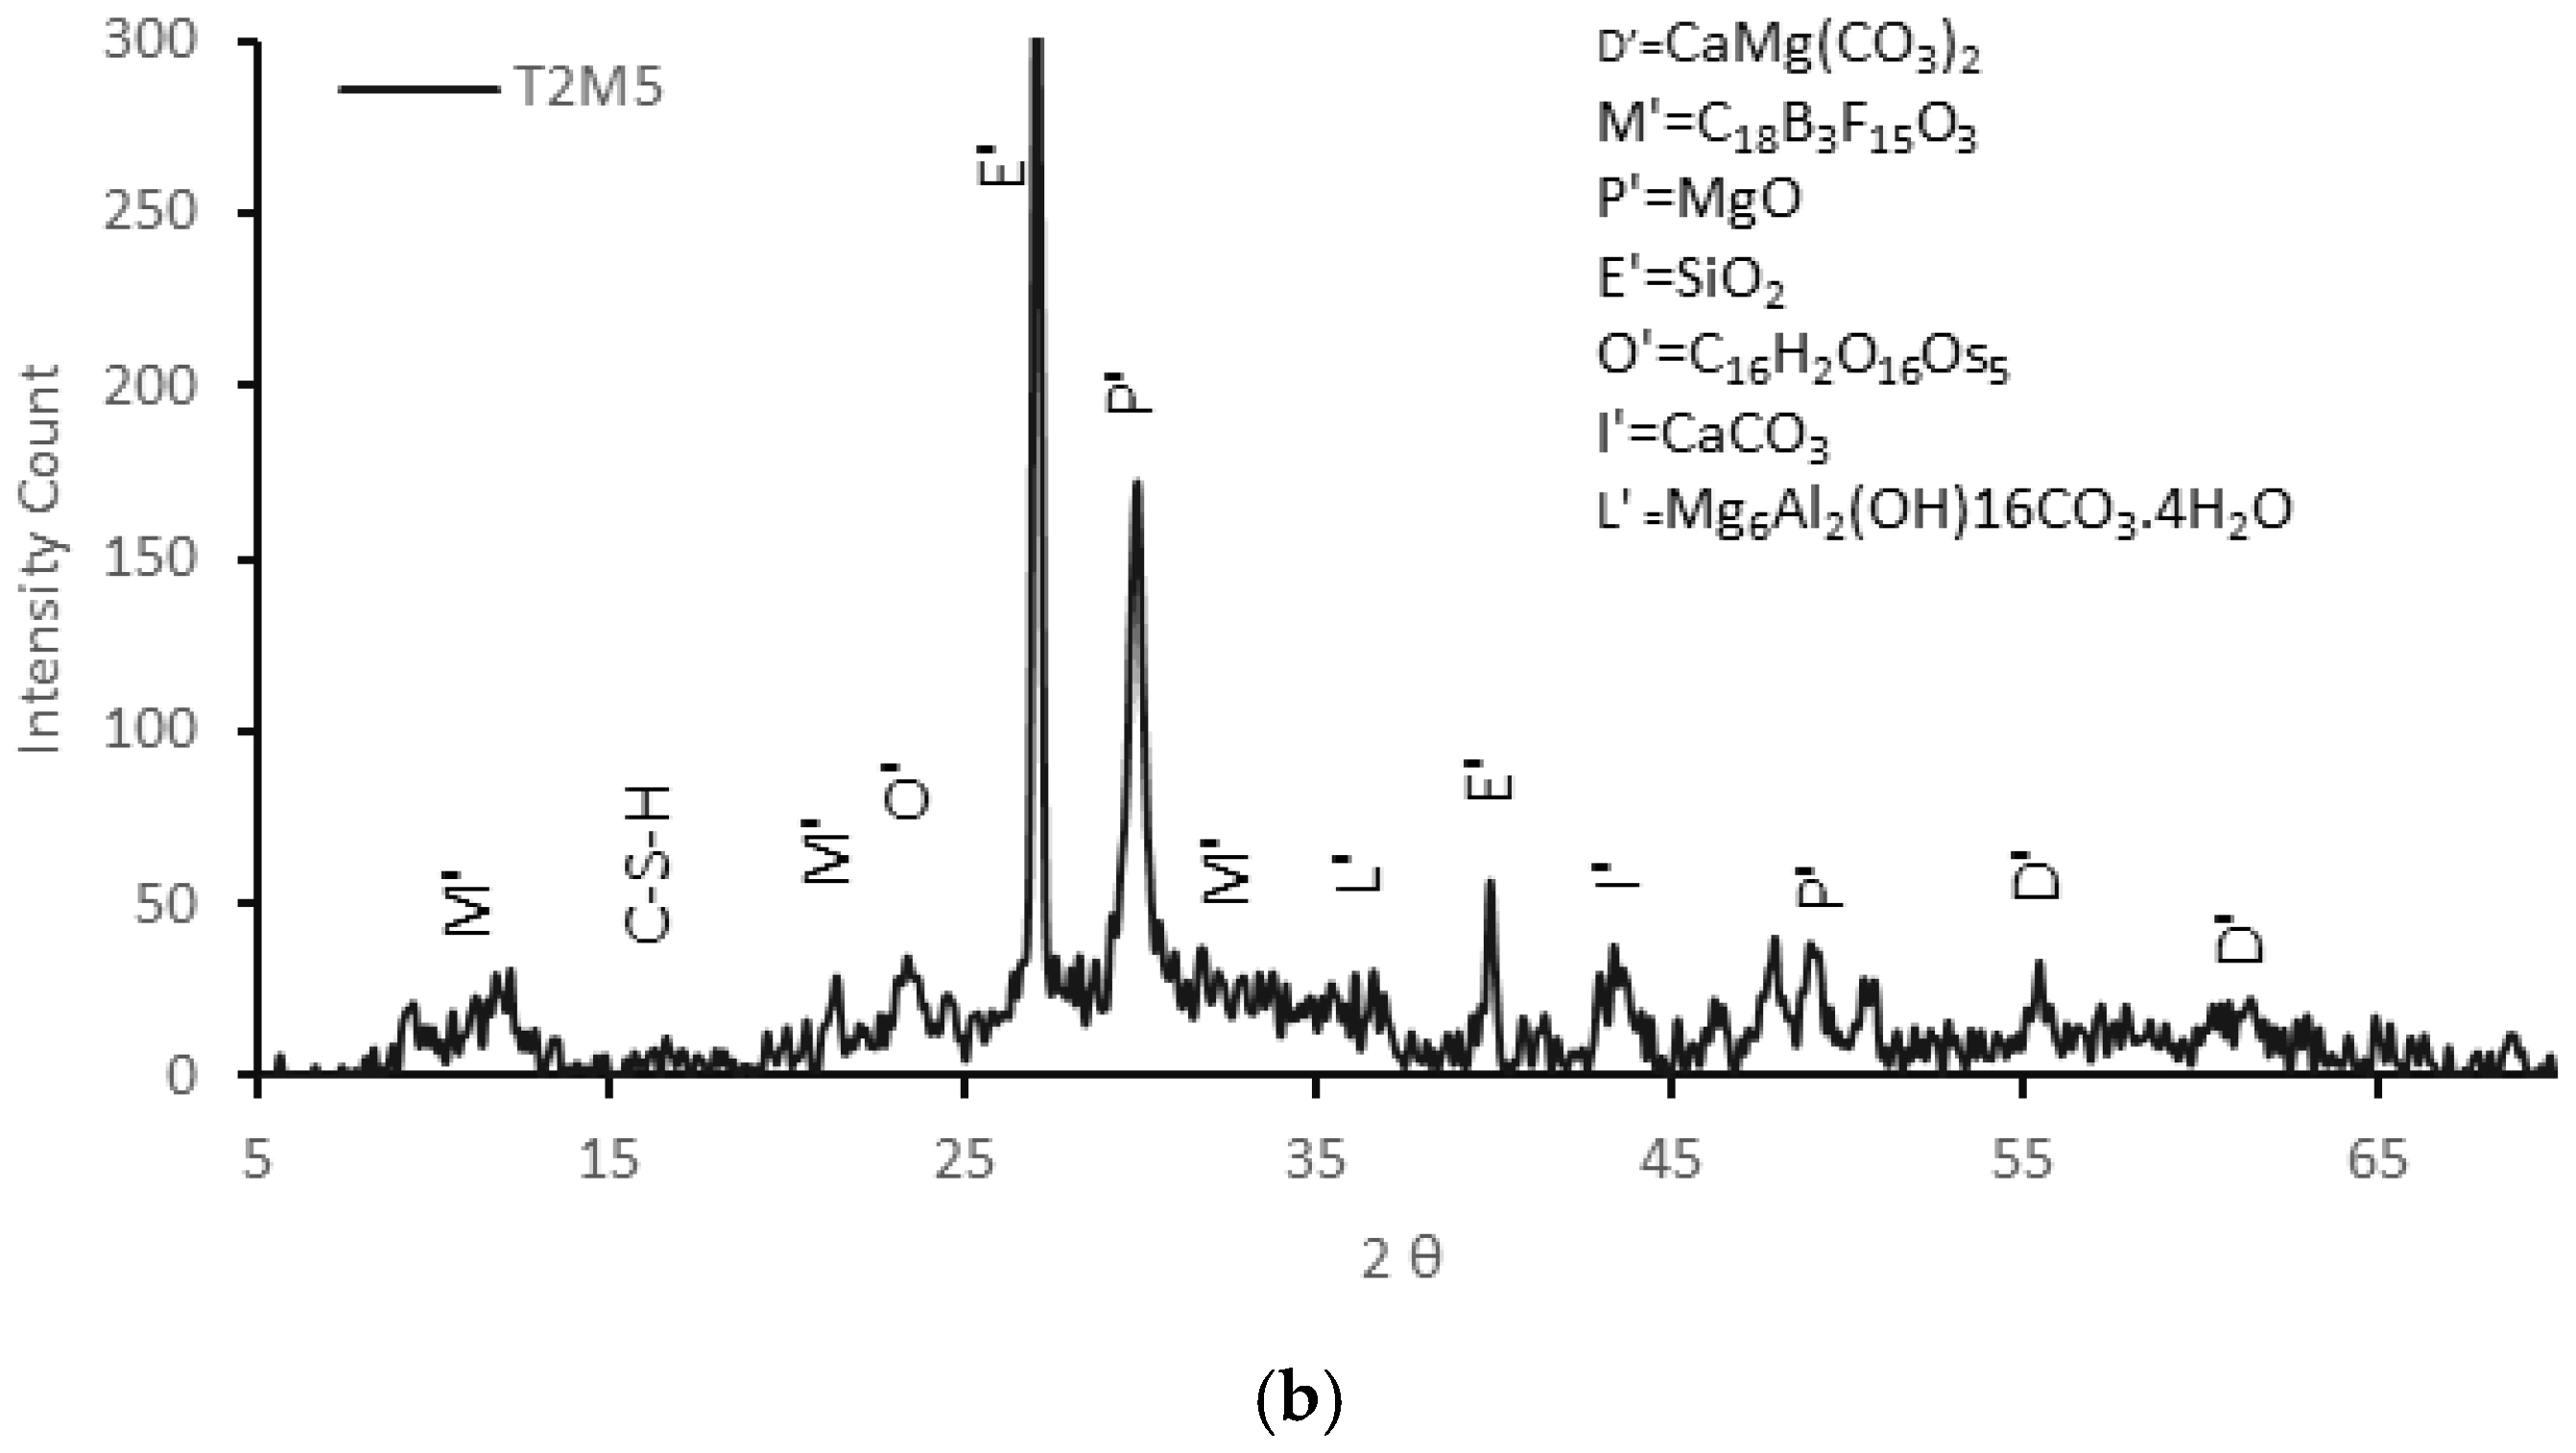
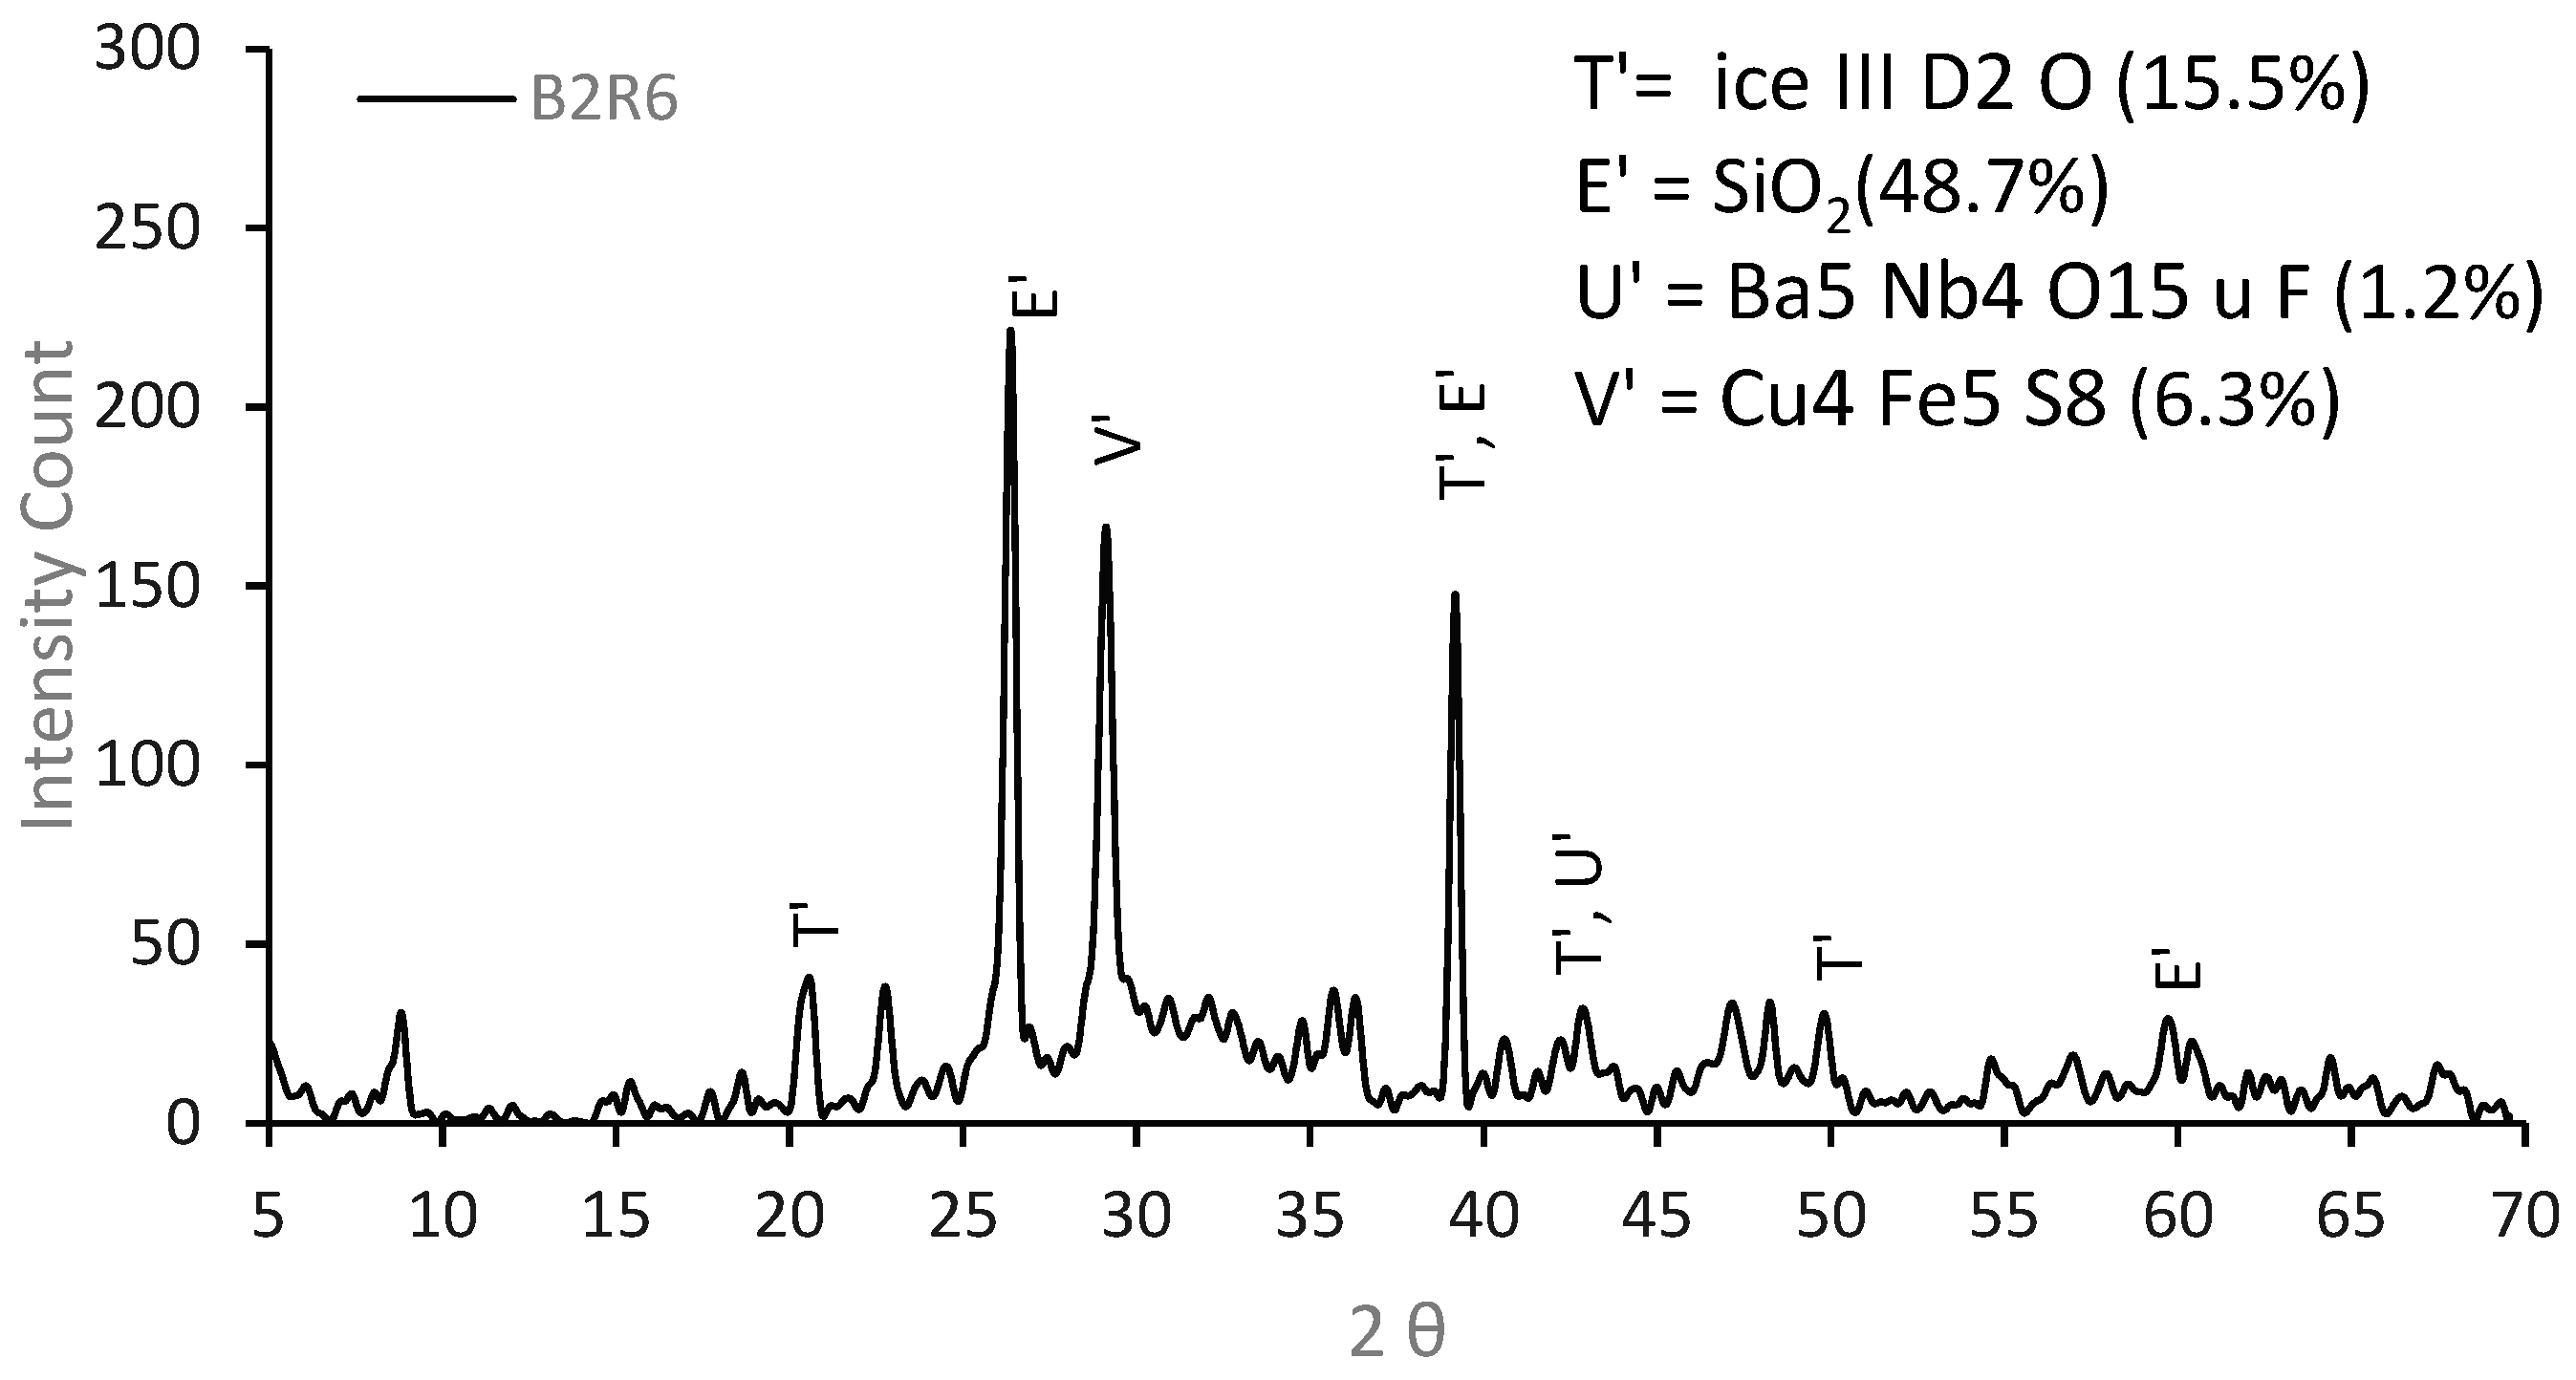
Figure 14a–d presents the morphology of the control AAECs (B1, B2, T1, and T2). As expected, the PVA fibers embedded in the AAEC matrix remained intact without any rupture or breaking in the failed cube specimens tested under compression. The morphology of the binary mixes appears to be denser, with a smaller number of un-hydrated/partially hydrated fly ash particles than their ternary counterparts, as shown in Figure 14a,c. The fly ash particles are embedded in the matrix of ternary mixes, as indicated in Figure 14b,d. This can be attributed to the relatively lower reactivity of fly ash class F particles.
The MgO-added mix exhibited the highest compressive strength (as described in the previous section, Figure 11a) and showed a denser morphology than the control mixes. The MgO-added mixes appeared to be the most compact among all the mixes, with some of the particles acting as inert material, filling up the void spaces, as noted in Figure 15a–d.
Good dispersion can be seen in Figure 15e,f, and individual MWCNTs are distributed throughout the matrix uniformly. In addition to filling pores and voids, the MWCNTs bridge hollow spaces and micro cracks. MWCNT bridging was observed, as shown in Figure 15e, in a 2000k zoom picture from the SEM test. The crack-bridging effect of MWCNTs contributes to the deacceleration of the initiation and extension of cracks [35]. The mechanical properties of MWCNT-incorporated AAEC mixes are better (especially the compressive strength and UPV for 0.3% wt. MWCNT dosage, as discussed in the previous section, Figure 11b and Figure 12a) than those of their control counterparts. The propagation of micro cracks and branching must pass the nanotubes or occur in areas with a weak matrix–MWCNT interaction bond state, which is essential to the macro properties of AAECs. The absence of a prominent interfacial layer between the MWCNTs and the geopolymer matrix, as can be inferred from the microstructure, demonstrates a healthy bond, indicating the chemical stability of MWCNTs under geopolymerization. Figure 15g,h shows the good morphology of the rGO-incorporated AAEC mixes (B2R3, B2R6) with uniform dispersion.
The main reaction product for binary mix B1 consisted of C-A-S-H and calcium-rich N-C-A-S-H acute phases with traces of MgO, as indicated in the SEM/EDS graphs presented in Figure 16a Their presence can be confirmed from the elements (Ca = 10.8%, Si = 8.3%, Al = 5.6%, C = 14.7%, Mg = 5.5%, Na = 1.5%, and O = 53.6%) noted in the EDS graph. The partially hydrated round fly ash class C and angular GGBFS particles can be observed in the SEM micrograph. The dominant reaction product for binary mix B2 consisted of C-A-S-H, as shown by the elements (Ca = 17.9%, Si = 7.7%, Al = 4.1%, C = 12.8%, O = 48.8%) with higher percentages in the EDS analysis presented in Figure 16b. An additional binding phase composed of C-S-H can be observed in the SEM micrograph because of the higher calcium content in the system (for B2 with reagent 2) than that in mix B1. The higher calcium content is attributed to the higher calcium content in reagent 2 (Ca(OH)2:Na2SO4 = 2.5:1) compared to that in reagent 1 (Ca(OH)2:Na2SiO3·5H2O = 1:2.5). The higher calcium content in reagent 2 resulted mainly in the formation of C-A-S-H/C-S-H gels and comparatively less dissolution of silicate and aluminum ions, which are responsible for polymerization/alkali activation. As a result, the reagent 1 mixes developed lower strengths than their reagent 2 counterparts. The binary and ternary mixes developed C-A-S-H, N-C-A-SH, and C-S-H reaction product combinations depending on whether they incorporated reagent type 1 or 2. However, the compressive strength was higher for the binary mixes (B1, B2) than their ternary counterparts (T1 and T2) due to the higher fly ash C content, as described earlier.
The representative SEM and EDS images of AAECs with varying levels of MgO, MWCNTs, rGO, and reagents, as shown in Figure 16c–f, exhibited a denser microstructure and almost fully reacted matrices with some unreacted chemosphere and pedosphere FA particles. It was reported that the unreacted particles do not act as filler in the mixture but lead to an increase in the strength of the matrix with age [86].
Similar reaction products and combinations (C-A-S-H, N-C-A-S-H, and C-S-H) are developed in GO-incorporated binary/ternary mixes depending on the reagent types, with the additional formation of Mg(OH)2 with traces of MgO, which can be identified from the EDS and XRD analyses shown in Figure 16c,d. The presence of these dominant reaction products/compounds can be confirmed from the elements in the binary B1M5 (Ca = 10.3%, Si = 7.6%, Al = 3.3%, Mg = 4.0%, C = 23.4%, and O = 48.4%; Figure 16c) and in binary B2M5 (Ca = 15.3%, Si = 10.9%, Al = 3.6%, Mg = 4.5%, C = 16.8%, and O = 46.6%; Figure 16d) mixes, as noted in the EDS graphs. Partially hydrated round fly ash class C and angular GGBFS particles can also be observed in the SEM micrograph. Compared with the control mixes, AAEC mixes with 5% (wt%) MgO contain almost identical CaO/SiO2 but a bit higher silica and alumina contents. Moreover, the addition of fine MgO results in a higher surface area, which eventually leads to a higher water absorption on the particle surface, leaving a less porous and denser matrix. These primary factors contributed towards an increase in compressive strength up to 25.2% MPa due to the introduction of MgO as an additive to the matrix. Moreover, the resulting denser matrix with lesser porosity was also validated by the higher UPV values of the MgO-incorporated mixes, as discussed earlier. The SEM results indicated that the hydration of MgO particles, when they are combined with water, forms Mg(OH)2 crystals, which can produce self-expansive stresses on the walls of the concrete pores. Excessive nano-MgO additives will result in higher expansive stresses that push on the pore walls. Once the pores cannot locally restrain the stresses, macro cracks will occur in the matrix, limiting the dosage of MgO [87].
The presence of reaction compounds, as mentioned earlier, in the MWCNT-incorporated mixes (such as B2C3) above can be confirmed from the elements (Ca = 13.6%, Si = 7.66%, Al = 3.8%, Mg = 2.0%, C = 16.4%, and O = 51.3%) noted in the EDS graph. Figure 16e also shows some embedded MWCNT bridging in the crack area, which means that they did not react with the source materials or act in the polymerization process. The presence of MWCNTs in some areas of crack openings of the fractured surface bridging micro cracks, with the existence of good bonding between the 0.3% MWCNTs and the surrounding matrix, can be noted from the SEM images of the fractured surface of B1C3 mixes with pull-out of the MWCNTs. Such well-dispersed MWCNT bridging with good MWCNT-matrix bonding can also be attributed to the compressive strength increase (in 0.3% MWCNT mix), as well as the reaction products. This argument supports previous research [40]. As the geopolymerization proceeds, fly ash grains are dissolved in an alkaline environment, and the products diffuse into a pore solution with dispersed MWCNTs. The dissolved species then undergo polycondensation reactions to form amorphous geopolymer gel in which the nanotubes remain embedded. Some of the nanotubes are partially pulled out of the matrix during the breaking/fracture process, even though they are well bonded to the aluminosilicate matrix via hydrogen bonds of carboxymethyl cellulose [40]. MWCNTs can be distinguished in some areas in crack openings of the fractured surface in Figure 16e,f. A good bonding between the 0.3% MWCNTs and the surrounding AAEC is shown obviously in the SEM images of the fractured surface of B1C3 mixes. The images indicate the pull-out of MWCNTs and show that many MWCNTs are bridging the micro crack of the AAECs. The compressive strength increased with an increasing MWCNT concentration up to 0.3 wt%, and then subsequently dropped to a strength close to that of the cube specimens at 0.6 wt%. This indicates that a percolation threshold was achieved at 0.3 wt%, where there was no significant increase in the strength at MWCNT contents above 0.5 wt% due to agglomeration of nanotubes. The increase in strength was achieved by the cube specimens containing 0.3 wt% and 0.6% MWCNTs, with a 9.2% increase and 10.8% decrease for the B2C3 and B2C6 mixes, respectively.
The presence of the reaction compounds, as mentioned earlier, can be confirmed from the elements (Ca = 22.6%, Si = 11.1%, Al = 5.0%, Mg = 2.0%, C = 8.6%, and O = 41.8%) noted in the EDS graph (Figure 16f) for the rGO-incorporated AAEC mixes (such as B2R3). rGO reduces the porosity of the matrix by accelerating the growth of geopolymer gel and the filling of nanoscale pores with self-adsorbed zeolites (Na2Al2Si3O8·2H2O) and other materials, as shown in Figure 16f. The process of forming zeolites within the geopolymer involves the absorption of energy [88], and factors including the activation energy and mass transfer rate influence its rate. Graphene oxide (GO) is a material with high electron activity that attracts free ions in the gel and speeds up the mass transfer rate during crystal growth [16]. When GO comes in contact with the crystal nucleus, it is likely to aid in the growth of the zeolite-like phase and promote the formation of a monocrystalline layer [89]. This is also a contributing factor for the compressive strength increase of rGO-incorporated mixes, as observed in this study. Overall, as evident from the EDS analyses, the carbon content varied from 1% to 23%, showing especially higher values in the MWCNT- and rGO-incorporated AAECs, as expected.
In general, the mixes with reagent 2 exhibited a denser microstructure, as evident from the formation of crystalline C-A-S-H with additional C-S-H gels, than their counterparts with reagent 1 (developing C-A-S-H and comparatively amorphous N-C-A-S-H)d due to the higher calcium content in the mix compositions. This resulted in enhanced mechanical and durability characteristics in terms of the higher compressive strength, lower shrinkage/expansion, and better resistance to freeze–thaw cycles of mixes with reagent 2 compared to their counterparts with reagent 1 [1]. The formation of reaction products on the PVA fibers can be observed in Figure 15a–d. The primary reaction products/acute phases developed on the fibers consisted of C-A-S-H with si-al solid linkages. Similar observations were made in previous studies where the adhesion or chemical bonding of the reaction products with the fibers was improved by incorporating fly ash and slag in geopolymer composites [4].

3.3.2. XRD Analysis

The XRD patterns of the representative control binary/ternary mixes incorporating reagents 1 and 2 (B1, T1 and T2) are illustrated in Figure 17a,b. A mix of peaks and broad humps can be identified in the diffractograms for the binary and ternary mixes, signifying a combination of reaction products composed of crystalline and amorphous phases. For instance, the peak at 36.7° 2θ for all compositions consisted of multiple minerals (quartz, wadalite, gehlenite, hydrotalcite, and gypsum). The dominant crystalline phases of quartz (Q or E’) were seen for all the mix compositions, with the highest peak being seen at about 26.7° 2θ. The sharpest and highest intensity peak for the quartz phase was observed in the T2 diffractogram (indicating a dominant crystalline binding phase), which had more peaks than its counterparts (T1) and other binary (B1) mixes with reagent 1. Also, portlandite (calcium hydroxide) can be seen around 34.2° 2θ in the ternary mix T2 diffractogram because of the composition of reagent 2 and is responsible for forming additional binding phases. This peak characterization is consistent with the previous investigations on fly ash/slag binder [90]. The primary binding phases consisted of C-A-S-H and calcium-rich N-C-A-S-H for the binary mixes. In the ternary mixes, C-A-S-H and N-C-A-S-H were observed for the mixes with reagent 1, and a blend of N-A-S-H and N-C-A-S-H was identified with traces of C-S-H for the mixes with the reagent 2. The presence of these acute phases in the XRD analysis validated the SEM/EDS analysis of the binary and ternary mixes. Small reflections of ettringite were seen for ternary mix T2, with its maximum peak at 15.5° 2θ, as presented in Figure 18b. Traces of gypsum and periclase (MgO) were also determined in all compositions. The presence of gypsum prevented the flash setting of these mixes. The MgO content in the mixes is known to reduce shrinkage and facilitate the self-healing behavior of cementitious composites due to its inherent expansive characteristics.
Figure 18 shows the material compositions and phase compositions of the B2M5 and T2M5 mixes. The dominant crystalline phases of quartz (E’) were seen for all compositions. The highest peak, representing calcite, quartz, and periclase (p’), for B2M5 was identified at 29.54° 2θ, (Figure 18a). In contrast, quartz and periclase (MgO or P’) showed the highest peak for T2M5 at 27.11° and 29.49° 2θ (Figure 18b). Both mixes exhibited a dominant element phase consisting of oxygen, carbon, and silicon. They exhibited domination crestline products of calcium carbonate and silicon oxide, which enhanced the compressive strength of the MgO-incorporated AAECs (Figure 11a). The XRD analysis of T2M5 (Figure 18b) shows a 45% crestline product of tris boroxine and 25.5% silicon oxide, which help to enhance the compressive strength, and the peak count was identified at 27.11° and 29.49° 2θ. This peak characterization is consistent with the previous investigations on fly ash/slag mixes [91]. MgO impacted the XRD pattern of the AAECs, and the presence of MgO can lead to the formation of magnesium silicate phases such as forsterite (Mg2SiO4) and enstatite (MgSiO3), which can be identified by their characteristic peaks in the XRD pattern. The traces of gypsum and periclase were also found in all compositions. The XRD pattern also confirms the previous SEM/EDS result shown in Figure 16c,d. It is expected that the presence of gypsum will prevent the flash setting and MgO is expected to reduce shrinkage and facilitate the self-healing behavior of the AAECs due to its inherent expansive characteristics, as observed in previous research studies on cementitious composites [22,92]. The XRD analysis (Figure 17) also revealed the formation of magnesium-aluminum hydrotalcite (Mg6Al2(OH)16CO3·4H2O)-like phases due to the reaction of MgO with the slag in addition to C-S-H, as confirmed from previous studies by Ben Haha et al. (2011) [55] on the effect of natural MgO on alkali-activated slag. The content of these hydrotalcite (Ht or L’)-like phases increases with the dosage of MgO and is more voluminous than that of C–S–H, which results in a higher strength (as observed in the current study) and the long-term stabilization of polymers, leading to excellent performance. In general, MgO hydrolyzed on the surface either reacts with the broken Si–O or Al–O to form magnesium silicate hydrate (M–S–H) or Ht, hindering the precipitation of brucite. These findings are also confirmed by early studies that found that Mg is quickly consumed to form Ht or M–S–H in combination with silica fume or slag [93,94], although M–S–H is hard to detect with XRD [95].
For the MWCNT-incorporated AAEC mix B2C6, the highest peak representing quartz (E’) is identified at 26.43° 2θ (Figure 19), and the highest peak for quartz (E’) and penta barium tetra niobium oxide (V’) is identified at 26.43° and 29.43° 2θ, respectively, for the rGO-incorporated mix B2R6 (Figure 20). The dominant element phase consisting of oxygen, and silicon was observed for both mixes. In previous studies, XRD analysis demonstrated an increase in the amorphous phase, C-S-H, and geopolymerization with the addition of MWCNTs, exhibiting a dense matrix with a lower content of unreacted fly ash particles and an increase in the compressive strength (low dosages of 0.3% as observed) [41]. However, no influence of MWCNTs on the reaction products of AAECs has been observed via XRD even though MWCNTs can act as nucleation sites and accelerate polymerization, similar to the effects observed in previous studies [35,38,42]. This can be attributed to the minimal dosages of MWCNTs which cannot effectively be detected and the hindrance of deep and quantitative analyses due to the highly amorphous characteristics of geopolymer with coexisting terpolymeric gel (three-component monomer gel) and partially reacted or unreacted precursors. More advanced technologies are then required for further investigation.
The introduction of rGO leads to an increase in the peak intensity of quartz (E’) and zeolites within the geopolymer, representing the development of crystalline phases. FA/GGBFS compositions predominantly comprise amorphous glassy microspheres and crystalline quartz, mullite, and hatrurite. Geopolymerization is the process of dissolving the glassy phase of source materials (FA or GGBFS) in an alkaline solution to form geopolymer gels. rGO acts as a catalyst to accelerate electron/mass transfer during alkali-activation reaction and promotes the dissolution of amorphous phases of FA/GGBFS microspheres by transmitting free electrons. rGO promotes the transformation of [SiO2(OH)2]2 and Al(OH)4 to the AlSiO4 or AlSi3O8 structure and accelerates the growth of geopolymer gels [96] to produce zeolite crystals with a higher diffraction intensity (Figure 20).

3.3.3. Fourier Transform Infrared Spectroscopy (FTIR) Analysis

In FTIR spectroscopy, a sample is exposed to a beam of infrared radiation that interacts with the chemical bonds within the material. FTIR analysis provided information on the formation of geopolymeric gels and the presence of specific functional groups such as Si-O and Al-O, as well as changes in the molecular structure of the material during curing and over time. The resulting spectrum shows the absorption or transmission of radiation at different frequencies, which corresponds to specific functional groups and chemical bonds within the material. The transmittance (%) in FTIR spectroscopy is influenced by the analyzed material’s presence and the strength of different functional groups and chemical bonds within it. Different chemical bonds and functional groups absorb radiation at different frequencies, which can be identified by their characteristic absorption peaks in the FTIR spectrum. Overall, the relationship between the % of transmittance and the material composition in FTIR spectroscopy is based on the absorption or transmission of infrared radiation by specific chemical bonds and functional groups within the material, which is directly related to the molecular structure and chemical composition of the material. The % of transmittance is an important parameter in FTIR spectroscopy because it provides information about the sample’s absorption properties. A sample that absorbs a large amount of radiation will have a low % of transmittance, while a sample that absorbs very little radiation will have a high % of transmittance.
Figure 21 shows the FTIR spectrum (% transmittance vs. wavelength) of the AAEC samples at the age of 180 days, which shows major bands at 3380 cm−1, 2072 cm−1, 1423 cm−1, 957 cm−1, 875 cm−1, and 670 cm−1. The broadband of the AAEC specimen at 3297 cm−1 and 2072 cm−1 characterizes the O-H stretching and H-O-H bending vibrations, respectively. Overall, AAECs with MWCNTs showed the lowest % of transmittance (highest radiation absorbing capacity) followed by those with rGO and MgO. B2C6 had a lower % of transmittance at 3380 cm−1, which indicated a weaker bond headed by less compressive strength. These vibration modes are due to the weakly bound water molecules that were adsorbed on the surface or trapped in large cavities [88]. Water plays an important role in the process of polymerization as it is associated with the destruction of solid particles and the hydrolysis of dissolved Al3+ and Si4+ ions [97]. The absorption band at 1429 cm−1 is attributed to the presence of sodium carbonate (Na2CO3), which corresponds to the stretching vibration of the O-C-O bond [98] (Swanepoel and Strydom, 2002). Álvarez-Ayuso et al. [99] suggested that the presence of Na2CO3 is due to the atmospheric carbonation of alkaline media. The strongest band of the AAEC specimens at 958 cm−1, representing Si-O-Si and Si-O-Al, corresponds to the asymmetric stretching vibrations of Si-O-T (T = Si or Al). Moreover, the stretching modes are sensitive to the Si-Al composition of the framework and a lower frequency is obtained with an increasing number of tetrahedral aluminum atoms [100]. Muzˇek et al. [97] suggested that the amorphous aluminosilicate gel formed at this phase is due to the depolymerization and structural reorganization of the amorphous phases in geopolymer materials. Mix B2C6 exhibited a lower % of transmission at 905 wavelengths. The bands in the region between 800 cm−1 and 550 cm−1 correlate with the tetrahedral vibrations of the secondary building unit (SBU) and fragments of the aluminosilicate [9]. The bands at 957 cm−1 observed in Figure 21 are assigned to quartz as the crystalline phase in the original FA [9], whereas the band located at 566 cm−1 indicates the presence of mullite. Referring to the finding by Mollah et al. [101], the spectral band at 566 cm−1 is attributed to the symmetric stretching of Al-O-Si. The band below 550 cm−1 is an indication of the degree of amorphization of the material, since its intensity does not depend on the degree of crystallization [102,103]. The symmetrical stretching vibrations of Si-O located between 687 cm−1 and 749, as well as between 1140 cm−1 and 1192 cm−1, are linked to the existence of unreacted and/or partially reacted quartz [104]. The main band from 940 cm−1 to 970 cm−1, ascribed to the asymmetric stretching vibration of Si-O-Si and Si-O-Al (Wang et al., 2020), confirms more intensive peaks and a higher formation of the reaction products of Si-O-Si and the Si-O-Al composition [105]. This peak shifted to a higher wavenumber, revealing the substitution of Al3+ with Si4+ species and the growth of more stable Si-O-Si bonds. According to Wan et al. [106], geopolymer strengthening is enhanced when Si tetrahedrals replace Al species in Si-rich gels.

4. Conclusions

This study evaluates the effects of MgO, MWCNT, and rGO on the physical characteristics related to the workability (slump flow, flow time, and flow velocity), compressive strength, UPV, and microstructural characteristics of developed AAECs that incorporate binary and ternary combinations of source materials and two types of reagents. Based on the findings, the following conclusions are drawn:
  • The AAEC mixes satisfied the EFNARC [77] criteria for self-consolidating ability. The initial and final setting times ranged from 190 min to 311 min and from 230 min to 369 min, respectively;
  • The ternary (fly ash C ‘FA-C’ + FA-F + ground granulated blast furnace slag ‘GGBFS’) mixes exhibited higher slump flows than their binary (FA-C + GGBFS) counterparts due to having a lower FA-C/GGBFS content, while the activator/reagent 2 (calcium hydroxide: sodium sulfate = 2.5:1) mixes resulted in higher slump flows due to having lower silica ratio than the mixes that used reagent 1 (calcium hydroxide: sodium metasilicate = 1:2.5);
  • The slump flow of the AAECs decreased with an increase in the MWCNT/rGO content, with a few exceptions depending on mix/reagent types, while the addition of MgO showed a less significant decrease. The higher surface area or water affinity of MgO/MWCNTs and higher agglomeration tendency of MWCNTs/rGO were considered contributing factors;
  • All AAECs achieved a 28-day compressive strength ranging from 26.0 MPa to 48.5 MPa > 18 MPa and satisfied the criteria for structural concrete. Control binary AAECs obtained higher 28-day compressive strengths than their ternary counterparts, due to the dominant formation of C-A-S-H/C-S-H compared to the dominant formation of amorphous N-C-A-S-H/N-A-S-H in their ternary counterparts. Binary mix B2 with reagent 2 exhibited a 22% higher 28-day compressive strength than its ternary counterpart T2 due to having higher FA-C and GGBFS contents;
  • The AAECs with reagent 2 generally produced a higher compressive strength compared to their reagent 1 counterparts due to the formation of additional C-S-H gel (in addition to C-A-S-H/N-C-A-S-H or C-A-S-H/C-S-H) and more compact microstructures, as per XRD-SEM analysis, which showed the presence of sharper crystalline peaks of quartz and calcite;
  • The addition of 5% MgO increased the 28-day compressive strength (by 19~25%), and UPV exhibited potential self-healing capability due to the formation of well-dispersed fine Mg(OH)2, hydrotalcite, and M-S-H, which compensated for volume shrinkage and refined the matrix pore size, as confirmed from XRD-SEM/EDS;
  • The 28-day compressive strength increased with the increase in MWCNT/rGO content up to 0.3%, indicating it as an optimum dosage. The decrease in strength at higher dosages (>0.3% wt) of MWCNTs/rGO can be compensated for/reversed by using MgO-MWCNT/rGO combinations that show beneficial effects of MgO addition;
  • The addition of 0.3% MWCNTs and rGO increased the compressive strength by 9% and 14.8%, respectively, showing a higher effectiveness of rGO in improving strength. The increase in compressive strength and UPV was attributed to the uniform dispersion and good MWCNT-matrix bond bridging cracks (with no newly formed MWCNT-induced reaction products), while the formation of additional zeolites caused matrix densification with the addition of rGO, as confirmed from the SEM/EDS analysis. Proper dispersion of the MWCNTs/rGO is important to avoid agglomeration and negative effects on the workability, mechanical, and micro-structural properties;
  • Fourier transform infrared spectrometer (FTIR) analysis suggested the formation of an aluminosilicate network in AAECs with a higher concentration of Si-O-Si bonds, indicating a more stable structure. A lower % of transmittance at 3380 cm−1 in binary AAECs with reagent 2 and 0.6% MWCNTs (B2C6), compared to their counterpart with 5% MgO (B2M5), confirmed a weaker bond and lower compressive strength even though MWCNTs can act as nucleation sites and accelerate polymerization;
  • The UPV values ranged from 3067 m/s to 4068 m/s, showing an increase with the addition MWCNTs/rGO/MgO, with the highest values (19% higher) being observed for MWCNT-incorporated AAECs. This is an indication of a higher capacity to transmit ultrasonic waves, better conductivity, and a better self-sensing ability. A linear correlation revealed an increase in compressive strength with an increase in the UPV content of AAEC mixes at 28 days;
  • This research demonstrated the viability of producing ambient-cured powder-based AAECs, as more green and sustainable alternatives to conventional ECCs, that incorporate carbon-nano materials and MgO additives, as they have satisfactory workability, mechanical, and microstructural characteristics. The developed multi-functional AAECs have the potential to be used for structural applications and to produce high-performance resilient durable bridge-building infrastructures with self-healing/sensing and 3-D printing potentials.

Author Contributions

Conceptualization, K.M.A.H. and M.A.H.; Methodology, K.M.A.H. and M.A.H.; Formal analysis, K.M.A.H. and M.A.H.; Investigation, K.M.A.H. and M.A.H.; Resources, K.M.A.H.; Writing—original draft, K.M.A.H. and M.A.H.; Writing—review & editing, K.M.A.H.; Supervision, K.M.A.H.; Project administration, K.M.A.H.; Funding acquisition, K.M.A.H. All authors have read and agreed to the published version of the manuscript.

Funding

This research was funded by Natural Sciences and Engineering Research Council (NSERC) Canada, grant number RGPIN-5613-2019.

Institutional Review Board Statement

Not applicable.

Informed Consent Statement

Not applicable.

Data Availability Statement

The data presented in this study are available on request from the corresponding author.

Acknowledgments

The authors gratefully acknowledge the financial support provided by NSERC, Canada. Supports provided by the technical staff of Concrete and Advanced Concrete Material laboratories of Toronto Metropolitan University are also acknowledged.

Conflicts of Interest

The authors declare no conflicts of interest.

References

  1. Hossain, K.M.A.; Sood, D. The Strength and Fracture Characteristics of One-Part Strain-Hardening Green Alkali-Activated Engineered Composites. Materials 2023, 16, 5077. [Google Scholar] [CrossRef]
  2. Huseien, G.F.; Shah, K.W. Durability and life cycle evaluation of self-compacting concrete containing fly ash as GBFS replacement with alkali activation. Constr. Build. Mater. 2020, 235, 117458. [Google Scholar] [CrossRef]
  3. Naqi, A.; Jang, J.G. Recent Progress in Green Cement Technology Utilizing Low-Carbon Emission Fuels and Raw Materials: A Review. Sustainability 2019, 11, 537. [Google Scholar] [CrossRef]
  4. Nematollahi, B.; Sanjayan, J.; Shaikh, F.U.A. Tensile Strain Hardening Behavior of PVA Fiber-Reinforced Engineered Geopolymer Composite. J. Mater. Civ. Eng. 2015, 27, 0001242. [Google Scholar] [CrossRef]
  5. Samantasinghar, S.; Singh, S. Effects of curing environment on strength and microstructure of alkali-activated fly ash-slag binder. Constr. Build. Mater. 2020, 235, 117481. [Google Scholar] [CrossRef]
  6. Shah, S.F.A.; Chen, B.; Oderji, S.Y.; Haque, M.A.; Ahmad, M.R. Improvement of early strength of fly ash-slag based one-part alkali activated mortar. Constr. Build. Mater. 2020, 246, 118533. [Google Scholar] [CrossRef]
  7. Davidovits, P.J. 30 Years of Successes and Failures in Geopolymer Applications. In Proceedings of the Geopolymer 2002 Conference, Melbourne, VIC, Australia, 28–29 October 2002; pp. 1–16. [Google Scholar]
  8. Huseien, G.F.; Shah, K.W. Performance evaluation of alkali-activated mortars containing industrial wastes as surface repair materials. J. Build. Eng. 2020, 30, 101234. [Google Scholar] [CrossRef]
  9. Fernández-Jiménez, A.; Palomo, A. Mid-infrared spectroscopic studies of alkali-activated fly ash structure. Microporous Mesoporous Mater. 2005, 86, 207–214. [Google Scholar] [CrossRef]
  10. Xu, J.; Wang, X. Self-healing of concrete cracks by use of bacteria-containing low alkali cementitious material. Constr. Build. Mater. 2018, 167, 1–14. [Google Scholar] [CrossRef]
  11. Mehta, A.; Siddique, R.; Ozbakkaloglu, T.; Uddin Ahmed Shaikh, F.; Belarbi, R. Fly ash and ground granulated blast furnace slag-based alkali-activated concrete: Mechanical, transport and microstructural properties. Constr. Build. Mater. 2020, 257, 119548. [Google Scholar] [CrossRef]
  12. Khan, M. Evidence on the functional form of inflation and output growth variability relationship in European economies. Int. Econ. 2016, 146, 119548. [Google Scholar] [CrossRef]
  13. Khan, M.Z.N.; Shaikh, F.; Uddin, A.; Hao, Y.; Hao, H. Synthesis of high strength ambient cured geopolymer composite by using low calcium fly ash. Constr. Build. Mater. 2016, 125, 809–820. [Google Scholar] [CrossRef]
  14. Herbert, S.J.; Sakthieswaran, N.; Shiny, B.G. Review on geopolymer concrete with different additives. Int. J. Eng. Res. 2015, 1, 21–31. [Google Scholar]
  15. Shah, S.P.; Konsta-Gdoutos, M.S.; Metaxa, Z.S.; Mondal, P. Nanoscale Modification of Cementitious Materials. In Nanotechnology in Construction 3: Proceedings of the NICOM3; Springer: Berlin, Germany, 2009; pp. 125–130. [Google Scholar] [CrossRef]
  16. Guo, X.; Shi, H.; Dick, W.A. Compressive strength and microstructural characteristics of class C fly ash geopolymer. Cem. Concr. Compos. 2010, 32, 142–147. [Google Scholar] [CrossRef]
  17. Saafi, M.; Tang, L.; Fung, J.; Rahman, M.; Liggat, J. Enhanced properties of graphene/fly ash geopolymeric composite cement. Cem. Concr. Res. 2015, 67, 292–299. [Google Scholar] [CrossRef]
  18. Zhang, C.; Khorshidi, H.; Najafi, E.; Ghasemi, M. Fresh, mechanical and microstructural properties of alkali-activated composites incorporating nanomaterials: A comprehensive review. J. Clean. Prod. 2023, 384, 135390. [Google Scholar] [CrossRef]
  19. Abdollahnejad, Z.; Dalvand, A.; Mastali, M.; Luukkonen, T.; Illikainen, M. Effects of waste ground glass and lime on the crystallinity and strength of geopolymers. Mag. Concr. Res. 2019, 71, 1218–1231. [Google Scholar] [CrossRef]
  20. Mastali, M.; Kinnunen, P.; Dalvand, A.; Mohammadi Firouz, R.; Illikainen, M. Drying shrinkage in alkali-activated binders–A critical review. Constr. Build. Mater. 2018, 190, 533–550. [Google Scholar] [CrossRef]
  21. Kheradmand, M.; Abdollahnejad, Z.; Pacheco-Torgal, F. Shrinkage Performance of Fly Ash Alkali-activated Cement Based Binder Mortars. KSCE J. Civ. Eng. 2018, 22, 1854–1864. [Google Scholar] [CrossRef]
  22. Sherir, M.A.A.; Hossain, K.M.A.; Lachemi, M. Self-healing and expansion characteristics of cementitious composites with high volume fly ash and MgO-type expansive agent. Constr. Build. Mater. 2016, 127, 80–92. [Google Scholar] [CrossRef]
  23. MacKenzie, K.J.D.; Bolton, M.J. Electrical and mechanical properties of aluminosilicate inorganic polymer composites with carbon nanotubes. J. Mater. Sci. 2009, 44, 2851–2857. [Google Scholar] [CrossRef]
  24. Xu, J.; Zhang, D. Multifunctional structural supercapacitor based on graphene and geopolymer. Electrochim. Acta 2017, 224, 105–112. [Google Scholar] [CrossRef]
  25. Wang, S.; Li, V. Engineered Cementitious Composites with High-volume Fly Ash. ACI Mat. J. 2007, 104, 233–241. [Google Scholar]
  26. Bhutta, A.; Borges, P.H.R.; Zanotti, C.; Farooq, M.; Banthia, N. Flexural behavior of geopolymer composites reinforced with steel and polypropylene macro fibers. Cem. Concr. Compos. 2017, 80, 31–40. [Google Scholar] [CrossRef]
  27. Nematollahi, B.; Sanjayan, J.; Shaikh, F.U.A. Matrix design of strain hardening fiber reinforced engineered geopolymer composite. Compos. Part B Eng. 2016, 89, 253–265. [Google Scholar] [CrossRef]
  28. Nguyen, H.; Carvelli, V.; Adesanya, E.; Kinnunen, P.; Illikainen, M. High performance cementitious composite from alkali-activated ladle slag reinforced with polypropylene fibers. Cem. Concr. Compos. 2018, 90, 150–160. [Google Scholar] [CrossRef]
  29. Ranjbar, N.; Mehrali, M.; Mehrali, M.; Alengaram, U.J.; Jumaat, M.Z. High tensile strength fly ash based geopolymer composite using copper coated micro steel fiber. Constr. Build. Mater. 2016, 112, 629–638. [Google Scholar] [CrossRef]
  30. Shaikh, F.U.A. Deflection hardening behaviour of short fibre reinforced fly ash based geopolymer composites. Mater. Des. 2013, 50, 674–682. [Google Scholar] [CrossRef]
  31. Yu, J.; Chen, Y.; Leung, C.K.Y. Mechanical performance of Strain-Hardening Cementitious Composites (SHCC) with hybrid polyvinyl alcohol and steel fibers. Compos. Struct. 2019, 226, 111198. [Google Scholar] [CrossRef]
  32. Alrefaei, Y.; Dai, J.-G. Tensile behavior and microstructure of hybrid fiber ambient cured one-part engineered geopolymer composites. Constr. Build. Mater. 2018, 184, 419–431. [Google Scholar] [CrossRef]
  33. Bahari, A.; Sadeghi-Nik, A.; Roodbari, M.; Sadeghi-Nik, A.; Mirshafiei, E. Experimental and theoretical studies of ordinary Portland cement composites contains nano LSCO perovskite with Fokker-Planck and chemical reaction equations. Constr. Build. Mater. 2018, 163, 247–255. [Google Scholar] [CrossRef]
  34. Sadeghi-Nik, A.; Berenjian, J.; Bahari, A.; Safaei, A.S.; Dehestani, M. Modification of microstructure and mechanical properties of cement by nanoparticles through a sustainable development approach. Constr. Build. Mater. 2017, 155, 880–891. [Google Scholar] [CrossRef]
  35. Abbasi, S.M.; Ahmadi, H.; Khalaj, G.; Ghasemi, B. Microstructure and mechanical properties of a metakaolinite-based geopolymer nanocomposite reinforced with carbon nanotubes. Ceram. Int. 2016, 42, 15171–15176. [Google Scholar] [CrossRef]
  36. Nazar, S.; Yang, J.; Khan, M.S.; Quazi, M.F.; Li, H.; Rahim, A. Investigating the effects of MWCNTs on sustainable alkali-activated mortar: Physical, rheological, and mechanical analysis. Mater. Today Sustain. 2023, 24, 100519. [Google Scholar] [CrossRef]
  37. Rovnaník, P.; Šimonová, H.; Topolář, L.; Bayer, P.; Schmid, P.; Keršner, Z. Carbon nanotube reinforced alkali-activated slag mortars. Constr. Build. Mater. 2016, 119, 223–229. [Google Scholar] [CrossRef]
  38. Khater, H.M.; Abd El Gawaad, H.A. Characterization of alkali activated geopolymer mortar doped with MWCNT. Constr. Build. Mater. 2016, 102, 329–337. [Google Scholar] [CrossRef]
  39. Li, F.; Yang, Z.; Zheng, A.; Li, S. Properties of modified engineered geopolymer composites incorporating multi-walled carbon Nanotubes(MWCNTs) and granulated blast furnace Slag(GBFS). Ceram. Int. 2021, 47, 14244–14259. [Google Scholar] [CrossRef]
  40. Rovnaník, P.; Šimonová, H.; Topolář, L.; Schmid, P.; Keršner, Z. Effect of Carbon Nanotubes on the Mechanical Fracture Properties of Fly Ash Geopolymer. Procedia Eng. 2016, 151, 321–328. [Google Scholar] [CrossRef]
  41. Jittabut, P.; Horpibulsuk, S. Physical and Microstructure Properties of Geopolymer Nanocomposite Reinforced with Carbon Nanotubes. Mater. Today: Proc. 2019, 17, 1682–1692. [Google Scholar] [CrossRef]
  42. Yuan, J.; He, P.; Jia, D.; Fu, S.; Zhang, Y.; Liu, X.; Cai, D.; Yang, Z.; Duan, X.; Wang, S.; et al. In situ processing of MWCNTs/leucite composites through geopolymer precursor. J. Eur. Ceram. Soc. 2017, 37, 2219–2226. [Google Scholar] [CrossRef]
  43. Hilding, J.; Grulke, E.A.; George Zhang, Z.; Lockwood, F. Dispersion of Carbon Nanotubes in Liquids. J. Dispers. Sci. Technol. 2003, 24, 1–41. [Google Scholar] [CrossRef]
  44. Schaefer, D.W.; Brown, J.M.; Anderson, D.P.; Zhao, J.; Chokalingam, K.; Tomlin, D.; Ilavsky, J. Structure and dispersion of carbon nanotubes. J. Appl. Crystallogr. 2003, 36, 553–557. [Google Scholar] [CrossRef]
  45. Vaisman, L.; Wagner, H.D.; Marom, G. The role of surfactants in dispersion of carbon nanotubes. Adv. Colloid Interface Sci. 2006, 128–130, 37–46. [Google Scholar] [CrossRef] [PubMed]
  46. Revathi, T.; Jeyalakshmi, R. Fly ash–GGBS geopolymer in boron environment: A study on rheology and microstructure by ATR FT-IR and MAS NMR. Constr. Build. Mater. 2021, 267, 120965. [Google Scholar] [CrossRef]
  47. Zhou, G.-X.; Li, C.; Zhao, Z.; Qi, Y.-Z.; Yang, Z.-H.; Jia, D.-C.; Zhong, J.; Zhou, Y. 3D printing geopolymer nanocomposites: Graphene oxide size effects on a reactive matrix. Carbon 2020, 164, 215–223. [Google Scholar] [CrossRef]
  48. Ranjbar, N.; Mehrali, M.; Mehrali, M.; Alengaram, U.J.; Jumaat, M.Z. Graphene nanoplatelet-fly ash based geopolymer composites. Cem. Concr. Res. 2015, 76, 222–231. [Google Scholar] [CrossRef]
  49. Dong, Q.; Wan, L.; Luan, C.; Wang, J.; Du, P. Effect of Graphene Oxide on Properties of Alkali-Activated Slag. Materials 2021, 14, 6107. [Google Scholar] [CrossRef] [PubMed]
  50. Matalkah, F.; Soroushian, P. Graphene nanoplatelet for enhancement the mechanical properties and durability characteristics of alkali activated binder. Constr. Build. Mater. 2020, 249, 118773. [Google Scholar] [CrossRef]
  51. Xu, G.; Zhong, J.; Shi, X. Influence of graphene oxide in a chemically activated fly ash. Fuel 2018, 226, 644–657. [Google Scholar] [CrossRef]
  52. Gao, P.; Lu, X.; Tang, M. Shrinkage and expansive strain of concrete with fly ash and expansive agent. J. Wuhan Univ. Technol. Mater. Sci. Ed. 2009, 24, 150–153. [Google Scholar] [CrossRef]
  53. Li, Z.; Zhang, W.; Wang, R.; Chen, F.; Jia, X.; Cong, P. Effects of reactive MgO on the reaction process of geopolymer. Materials 2019, 12, 526. [Google Scholar] [CrossRef]
  54. Abdel-Gawwad, H.A.; Abd El-Aleem, S. Effect of reactive magnesium oxide on properties of alkali-activated slag geopolymer cement pastes. Res. Gate 2015, 59, 37–47. [Google Scholar]
  55. Haha, M.B.; Lothenbach, B.; Le Saout, G.; Winnefeld, F. Influence of slag chemistry on the hydration of alkali-activated blast-furnace slag—Part I: Effect of MgO. Cem. Concr. Res. 2011, 41, 955–963. [Google Scholar] [CrossRef]
  56. Shen, W.; Wang, Y.; Zhang, T.; Zhou, M.; Li, J.; Cui, X. Magnesia modification of alkali-activated slag fly ash cement. J. Wuhan Univ. Technol. Mater. Sci. Ed. 2011, 26, 121–125. [Google Scholar] [CrossRef]
  57. Jin, F.; Gu, K.; Al-Tabbaa, A. Strength and drying shrinkage of reactive MgO modified alkali-activated slag paste. Constr. Build. Mater. 2014, 51, 395–404. [Google Scholar] [CrossRef]
  58. Ružek, V.; Dostayeva, A.M.; Walter, J.; Grab, T.; Korniejenko, K. Carbon Fiber-Reinforced Geopolymer Composites: A Review. Fibers 2023, 11, 17. [Google Scholar] [CrossRef]
  59. Hossain, M.A.; Hossain, K.M.A. Rheological, Fresh State, and Strength Characteristics of Alkali-Activated Mortars Incorporating MgO and Carbon Nanoparticles. Materials 2024, 17, 5931. [Google Scholar] [CrossRef] [PubMed]
  60. Sood, D.; Hossain, K.M.A. Fresh State, Rheological and Microstructural Characteristics of Alkali-Activated Mortars Developed Using Novel Dry Mixing Technique under Ambient Conditions. Appl. Sci. 2021, 11, 8920. [Google Scholar] [CrossRef]
  61. Sood, D.; Hossain, K.M.A. Strength, Fracture and Durability Characteristics of Ambient Cured Alkali—Activated Mortars Incorporating High Calcium Industrial Wastes and Powdered Reagents. Crystals 2021, 11, 1167. [Google Scholar] [CrossRef]
  62. Cheaptubes. April 2024. Available online: https://www.cheaptubes.com/product-category/multi-walled-carbon-nanotubes/ (accessed on 22 October 2024).
  63. Yang, S.; Yue, W.; Huang, D.; Chen, C.; Lin, H.; Yang, X. A facile green strategy for rapid reduction of graphene oxide by metallic zinc. RSC Adv. 2012, 2, 8827. [Google Scholar] [CrossRef]
  64. Fan, Z.-J.; Kai, W.; Yan, J.; Wei, T.; Zhi, L.-J.; Feng, J.; Ren, Y.; Song, L.-P.; Wei, F. Facile Synthesis of Graphene Nanosheets via Fe Reduction of Exfoliated Graphite Oxide. ACS Nano 2011, 5, 191–198. [Google Scholar] [CrossRef]
  65. Chen, J.; Akono, A.-T. Influence of multi-walled carbon nanotubes on the fracture response and phase distribution of metakaolin-based potassium geopolymers. J. Mater. Sci. 2021, 56, 19403–19424. [Google Scholar] [CrossRef]
  66. Luz, G.; Gleize, P.J.P.; Batiston, E.R.; Pelisser, F. Effect of pristine and functionalized carbon nanotubes on microstructural, rheological, and mechanical behaviors of metakaolin-based geopolymer. Cem. Concr. Compos. 2019, 104, 103332. [Google Scholar] [CrossRef]
  67. Jindal, B.B.; Sharma, R. The effect of nanomaterials on properties of geopolymers derived from industrial by-products: A state-of-the-art review. Constr. Build. Mater. 2020, 252, 119028. [Google Scholar] [CrossRef]
  68. Wang, W.; Fan, C.; Wang, B.; Zhang, X.; Liu, Z. Workability, rheology, and geopolymerization of fly ash geopolymer: Role of alkali content, modulus, and water–binder ratio. Constr. Build. Mater. 2023, 367, 130357. [Google Scholar] [CrossRef]
  69. Davoodabadi, M.; Vareli, I.; Liebscher, M.; Tzounis, L.; Sgarzi, M.; Paipetis, A.; Yang, J.; Cuniberti, G.; Mechtcherine, V. Thermoelectric Energy Harvesting from Single-Walled Carbon Nanotube Alkali-Activated Nanocomposites Produced from Industrial Waste Materials. Nanomaterials 2021, 11, 1095. [Google Scholar] [CrossRef]
  70. Suave, J.; Coelho, L.A.F.; Amico, S.C.; Pezzin, S.H. Effect of sonication on thermo-mechanical properties of epoxy nanocomposites with carboxylated-SWNT. Mater. Sci. Eng. A 2009, 509, 57–62. [Google Scholar] [CrossRef]
  71. ASTM C1611; Standard Test Method for Slump Flow of Self-Consolidating Concrete. ASTM International: West Conshohocken, PA, USA, 2014; pp. 1–6.
  72. ASTM C138/C138M; Standard Test Method for Density (Unit Weight), Yield, and Air Content (Gravimetric) of Concrete. ASTM International: West Conshohocken, PA, USA, 2017.
  73. ASTM C1437; Standard Test Method for Flow of Hydraulic Cement Mortar. ASTM International: West Conshohocken, PA, USA, 2015.
  74. ASTM C109/C109M; Standard Test Method for Compressive Strength of Hydraulic Cement Mortars (Using 2-in. or [50-mm] Cube Specimens). ASTM International: West Conshohocken, PA, USA, 2016.
  75. ASTM C597-16; Standard Test Method for Pulse Velocity Through Concrete. ASTM: West Conshohocken, PA, USA, 2016.
  76. Kastiukas, G.; Ruan, S.; Liang, S.; Zhou, X. Development of precast geopolymer concrete via oven and microwave radiation curing with an environmental assessment. J. Clean. Prod. 2020, 255, 120290. [Google Scholar] [CrossRef]
  77. EFNARC Specification. Guidelines for Self-Compacting Concrete; Report from EFNARC; Association House: London, UK, 2002; p. 32. [Google Scholar]
  78. Abbas, S.; Qissab, M. Effect of Multi-Walled Carbon Nanotubes on Mechanical Properties of Concrete. Coll. Eng. J. (NUCEJ) 2016, 91, 6192–6194. [Google Scholar]
  79. Gado, R.A.; Hebda, M.; Łach, M.; Mikuła, J. Alkali Activation of Waste Clay Bricks: Influence of The Silica Modulus, SiO2/Na2O, H2O/Na2O Molar Ratio, and Liquid/Solid Ratio. Materials 2020, 13, 383. [Google Scholar] [CrossRef] [PubMed]
  80. Allahverdi, A.; Kani, E.N. Use of construction and demolition waste (CDW) for alkali-activated or geopolymer cements. In Handbook of Recycled Concrete and Demolition Waste; Elsevier: Amsterdam, The Netherlands, 2013; pp. 439–475. [Google Scholar] [CrossRef]
  81. ACI 318. Building Code Requirements for Structural Concrete; American Concrete Institute: Farmington Hills, MI, USA, 2019. [Google Scholar]
  82. Kaya, M.; Koksal, F.; Gencel, O.; Munir, M.J.; Kazmi, S.M.S. Influence of micro Fe2O3 and MgO on the physical and mechanical properties of the zeolite and kaolin based geopolymer mortar. J. Build. Eng. 2022, 52, 104443. [Google Scholar] [CrossRef]
  83. Asil, M.B.; Ranjbar, M.M. Hybrid effect of carbon nanotubes and basalt fibers on mechanical, durability, and microstructure properties of lightweight geopolymer concretes. Constr. Build. Mater. 2022, 357, 129352. [Google Scholar] [CrossRef]
  84. Ofuyatan, O.; Olowofoyeku, A.; Oluwafemi, J.; Ighalo, J. Predicting the Compressive Strength of Concrete By Ultrasonic Pulse Velocity. IOP Conf. Ser. Mater. Sci. Eng. 2021, 1036, 012053. [Google Scholar] [CrossRef]
  85. Wei, J.; Yang, Q.; Jiang, Q.; Li, X.; Liu, S.; Li, K.; Wang, Q. Mechanical properties of basalt fiber reinforced ambient-cured lightweight expanded polystyrene geopolymer concrete. J. Build. Eng. 2023, 80, 108072. [Google Scholar] [CrossRef]
  86. Ryu, G.S.; Lee, Y.B.; Koh, K.T.; Chung, Y.S. The mechanical properties of fly ash-based geopolymer concrete with alkaline activators. Constr. Build. Mater. 2013, 47, 409–418. [Google Scholar] [CrossRef]
  87. Mo, L.; Deng, M.; Wang, A. Effects of MgO-based expansive additive on compensating the shrinkage of cement paste under non-wet curing conditions. Cem. Concr. Compos. 2012, 34, 377–383. [Google Scholar] [CrossRef]
  88. Bakharev, T. Geopolymeric materials prepared using Class F fly ash and elevated temperature curing. Cem. Concr. Res. 2005, 35, 1224–1232. [Google Scholar] [CrossRef]
  89. Li, H.; Liu, X.; Qi, S.; Xu, L.; Shi, G.; Ding, Y.; Yan, X.; Huang, Y.; Geng, J. Graphene Oxide Facilitates Solvent-Free Synthesis of Well-Dispersed, Faceted Zeolite Crystals. Angew. Chem. 2017, 129, 14278–14283. [Google Scholar] [CrossRef]
  90. Hanjitsuwan, S.; Hunpratub, S.; Thongbai, P.; Maensiri, S.; Sata, V.; Chindaprasirt, P. Effects of NaOH concentrations on physical and electrical properties of high calcium fly ash geopolymer paste. Cem. Concr. Compos. 2014, 45, 9–14. [Google Scholar] [CrossRef]
  91. Pan, Z.; Tao, Z.; Cao, Y.F.; Wuhrer, R.; Murphy, T. Compressive strength and microstructure of alkali-activated fly ash/slag binders at high temperature. Cem. Concr. Compos. 2018, 86, 9–18. [Google Scholar] [CrossRef]
  92. Sherir, M.A.A.; Hossain, K.M.A.; Lachemi, M. Permeation and Transport Properties of Self-Healed Cementitious Composite Produced with MgO Expansive Agent. J. Mater. Civ. Eng. 2018, 30, 04018291. [Google Scholar] [CrossRef]
  93. Jin, F.; Abdollahzadeh, A.; Al-Tabbaa, A. Effect of Different MgO on the Hydration of MgO-Activated Granulated Ground Blastfurnace Slag Paste. 2013. Available online: http://www.claisse.info/Proceedings.htm (accessed on 22 June 2024).
  94. Zhang, T.; Cheeseman, C.R.; Vandeperre, L.J. Development of low pH cement systems forming magnesium silicate hydrate (M-S-H). Cement Concr. Res. 2011, 41, 439–442. [Google Scholar] [CrossRef]
  95. Brew, D.R.M.; Glasser, F.P. Synthesis and characterisation of magnesium silicate hydrate gels. Cem. Concr. Res. 2005, 35, 85–98. [Google Scholar] [CrossRef]
  96. Liu, X.; Wu, Y.; Li, M.; Jiang, J.; Guo, L.; Wang, W.; Zhang, W.; Zhang, Z.; Duan, P. Effects of graphene oxide on microstructure and mechanical properties of graphene oxide-geopolymer composites. Constr. Build. Mater. 2020, 247, 118544. [Google Scholar] [CrossRef]
  97. Mužek, M.N.; Zelić, J.; Jozić, D. Microstructural characteristics of geopolymers based on alkali-activated fly ash. Chem. Biochem. Eng. Q. 2012, 26, 89–95. [Google Scholar]
  98. Swanepoel, J.C.; Strydom, C.A. Utilisation of fly ash in a geopolymeric material. Appl. Geochem. 2002, 17, 1143–1148. [Google Scholar] [CrossRef]
  99. Álvarez-Ayuso, E.; Querol, X.; Plana, F.; Alastuey, A.; Moreno, N.; Izquierdo, M.; Font, O.; Moreno, T.; Diez, S.; Vázquez, E.; et al. Environmental, physical and structural characterisation of geopolymer matrixes synthesised from coal (co-) combustion fly ashes. J. Hazard. Mater. 2008, 154, 175–183. [Google Scholar] [CrossRef]
  100. Kupwade-Patil, K.; Allouche, E.N. Impact of Alkali Silica Reaction on Fly Ash-Based Geopolymer Concrete. J. Mater. Civ. Eng. 2013, 25, 131–139. [Google Scholar] [CrossRef]
  101. Mollah, M.Y.A.; Hess, T.R.; Cocke, D.L. Surface and bulk studies of leached and unleached fly ash using XPS, SEM, EDS and FTIR techniques. Cem. Concr. Res. 1994, 24, 109–118. [Google Scholar] [CrossRef]
  102. Mozgawa, W.; Sitarz, M.; Rokita, M. Spectroscopic studies of different aluminosilicate structures. J. Mol. Struct. 1999, 511–512, 251–257. [Google Scholar] [CrossRef]
  103. Sitarz, M.; Handke, M.; Mozgawa, W. Identification of silicooxygen rings in SiO2 based on IR spectra. Spectrochim. Acta Part A Mol. Biomol. Spectrosc. 2000, 56, 1819–1823. [Google Scholar] [CrossRef]
  104. Reig, L.; Soriano, L.; Borrachero, M.V.; Monzó, J.; Payá, J. Influence of calcium aluminate cement (CAC) on alkaline activation of red clay brick waste (RCBW). Cem. Concr. Compos. 2016, 65, 177–185. [Google Scholar] [CrossRef]
  105. Wang, Y.; Liu, X.; Zhang, W.; Li, Z.; Zhang, Y.; Li, Y.; Ren, Y. Effects of Si/Al ratio on the efflorescence and properties of fly ash-based geopolymer. J. Clean. Prod. 2020, 244, 118852. [Google Scholar] [CrossRef]
  106. Wan, Q.; Zhang, Y.; Zhang, R. Using mechanical activation of quartz to enhance the compressive strength of metakaolin-based geopolymers. Cem. Concr. Compos. 2020, 111, 103635. [Google Scholar] [CrossRef]
Figure 1. Grain size distributions of SCMs and silica sand.
Applsci 15 01712 g001
Figure 2. Source, sand, activator, additive, fiber, and admixture materials.
Applsci 15 01712 g002
Figure 3. MWCNT at three stages: (a) before sonication (dry), (b) during sonication, and (c) after sonication.
Applsci 15 01712 g003
Figure 4. (a) Slump flow test, (b) compressive strength test.
Applsci 15 01712 g004
Figure 5. Influence of (a) MWCNT, (b) rGO, and (c) MgO contents on slump flow characteristics.
Applsci 15 01712 g005
Figure 6. Evolution of compressive strength of AAECs (without MgO/MWCNTs/rGO) with age.
Applsci 15 01712 g006
Figure 7. Evolution of compressive strength with age for MgO-incorporated (a) binary and (b) ternary AAEC mixes with reagents 1 and 2.
Applsci 15 01712 g007
Figure 8. Evolution of compressive strength with age for MWCNT-incorporated (a) binary and (b) ternary AAEC mixes with reagents 1 and 2.
Applsci 15 01712 g008
Figure 9. Evolution of compressive strength with age for rGO-incorporated (a) binary and (b) ternary AAEC mixes with reagents 1 and 2.
Applsci 15 01712 g009
Figure 10. Evolution of compressive strength with age for MgO-MWCNT/rGO-incorporated (a) binary and (b) ternary AAEC mixes with reagents 1 and 2.
Applsci 15 01712 g010
Figure 11. (ac) Influence of (a) MgO, (b) MWCNT, and (c) rGO on 28-day compressive strength of AAEGC mixes with reagents 1 and 2.
Applsci 15 01712 g011
Figure 12. Influence of (a) MWCNTs, (b) rGO, and (c) MgO on 28-day UPV of AAEC mixes with reagents 1 and 2.
Applsci 15 01712 g012
Figure 13. Correlation between (UPV) and compressive strength at 28 days.
Applsci 15 01712 g013
Figure 14. Morphology of the control mixes: (a) B1, (b) B2, (c) T1, (d) T2.
Applsci 15 01712 g014
Figure 15. Morphology of (a) B1M5, (b) B2M5, (c) T1M5, (d) T2M5, (e) B2C3, (f) B2C6, (g) B2R3, and (h) B2R6.
Applsci 15 01712 g015aApplsci 15 01712 g015b
Figure 16. (a,b) SEM micrographs and EDS analysis: (a) B1 and (b) B2 [61]. (c) SEM micrographs and EDS analysis of the mix B1M5. (d) SEM micrographs and EDS analysis of the mix B2M5. (e) SEM micrographs and EDS analysis of the mix B2C3. (f) SEM micrographs and EDS analysis of the mix B2R3.
Applsci 15 01712 g016aApplsci 15 01712 g016b
Figure 17. XRD diffractograms: (a) B1, (b) T1 and T2; (Q—quartz, G—gypsum, E—ettringite, Ge—gehlenite, Po—portlandite, P—periclase, H—hydrotalcite, C—calcite, W—wadalite) [61].
Applsci 15 01712 g017
Figure 18. XRD diffractograms of (a) B2M5 and (b) T2M5.
Applsci 15 01712 g018aApplsci 15 01712 g018b
Figure 19. XRD analysis of MWCNT incorporated AAEC (B2C6).
Applsci 15 01712 g019
Figure 20. XRD analysis of rGO-incorporated AAEC (B2R6).
Applsci 15 01712 g020
Figure 21. FTIR infrared spectrum of 180-day powder specimens.
Applsci 15 01712 g021
Table 1. Chemical compositions and physical characteristics of materials.
Chemical
Composition
(%)
Fly Ash
Type C
(FA-C)
Fly Ash
Type F
(FA-F)
Ground Granulated Blast Furnace Slag
(GGBFS)
Silica
Sand
HRWRAMagnesium Oxide
(MgO)
SiO236.5355.6635.9799.70 2.02
Al2O318.2622.099.180.14 6.124
Fe2O35.664.260.500.016 0.94
CaO20.977.9738.610.01 2.40
MgO5.081.1610.990.01 92.26
K2O0.681.490.360.04 -
Na2O4.044.100.280.01 -
MnO0.030.030.250.00 -
TiO21.260.610.390.00 -
P2O50.960.430.010.00 -
L.O.I.2.181.050.740.00 1.14
pH 6.00
Density (g/cm3)2.612.022.872.651.063.58
Retained on 45µ, %-18.00-3.00
Blaine fineness (m2/kg)315.00306.00489.30-
Table 2. Mix proportions of 32 AAEC mixes.
AAECs
Mix ID.
Total SCMs (Binder *)MgO/MWCNT/rGOSCMsReagent
Component Ratio
R./BChemical Ratios
(SCMs + Reagent)
FA-CFA-FGGBFSSiO2/
Al2O3
Na2O/
SiO2
CaO/
SiO2
Na2O/
Al2O3
Four basic AAEC mixes (with 0% MgO/MWCNT/rGO)
B1100.5500.451:2.50.092.620.090.840.23
B2100.5500.452.5:10.122.560.141.020.35
T1100.250.350.401:2.50.092.750.080.590.22
T2100.250.350.402.5:10.122.690.120.730.32
Four AAEC mixes with 5% MgO
B1M510.050.5200.431:2.50.092.580.090.850.23
B2M510.050.5200.432.5:10.122.510.141.030.35
T1M510.050.240.330.381:2.50.092.970.050.540.14
T2M510.050.240.330.382.5:10.122.970.050.540.14
Eight AAEC mixes with 0.3% and 0.6% MWCNT
B1C310.0030.5500.451:2.50.092.620.090.840.23
B2C310.0030.5500.452.5:10.122.560.141.020.35
T1C310.0030.250.350.401:2.50.092.750.080.590.22
T2C310.0030.250.350.402.5:10.122.690.120.730.32
B1C610.0060.5500.451:2.50.092.620.090.840.23
B2C610.0060.5500.452.5:10.122.560.141.020.35
T1C610.0060.250.350.401:2.50.092.750.080.590.22
T2C610.0060.250.350.402.5:10.122.690.120.730.32
Eight AAEC mixes with 0.3% and 0.6% rGO
B1R310.0030.5500.451:2.50.092.620.090.840.23
B2R310.0030.5500.452.5:10.122.560.141.020.35
T1R310.0030.250.350.401:2.50.092.750.080.590.22
T2R310.0030.250.350.402.5:10.122.690.120.730.32
B1R610.0060.5500.451:2.50.092.620.090.840.23
B2R610.0060.5500.452.5:10.122.560.141.020.35
T1R610.0060.250.350.401:2.50.092.750.080.590.22
T2R610.0060.250.350.402.5:10.122.690.120.730.32
Eight AAEC with 5%MgO and MWCNT or rGO (0.3% or 0.6%))
B2M5C310.05/0.0030.5200.432.5:10.122.560.141.020.35
T2M5C310.05/0.0030.240.330.382.5:10.122.970.050.540.14
B2M5C610.05/0.0030.5200.432.5:10.122.560.141.020.35
T2M5C610.05/0.0030.240.330.382.5:10.122.970.050.540.14
B2M5R310.05/0.0060.5200.432.5:10.122.560.141.020.35
T2M5R310.05/0.0060.240.330.382.5:10.122.970.050.540.14
B2M5R610.05/0.0060.5200.432.5:10.122.560.141.020.35
T2M5R610.05/0.0060.240.330.382.5:10.122.970.050.540.14
* All numbers are mass ratios of binder; binder denotes source materials (SMs): supplementary cementitious materials (SCMs) such as FA-C, FA-F, GGBFS, and activator; MgO: magnesium oxide; MWCNT: multi-wall carbon nano tube; rGO: reduced graphene oxide; B1, B2: binary AAEC with activator type 1 and type 2, respectively; T1, T2: ternary AAEC with activator type 1 and type 2, respectively; M5: AAEC mixes with 5% MgO by wt. of binder, C3/C6: AAEC mixes with MWCNT content of 0.3% and 0.6% wt. of binder, R3/R6: AAEC mixes with rGO of 0.3% and 0.6% wt. of the binder.
Table 3. Physical workability and hardened properties of AAECs.
AAECMix
ID
Fresh Density (kg/m3)Slump Flow (mm)Slump Flow Time (s)Slump Flow Velocity
(mm/s)
* Hard/Dry Density
kg/m3
* 28-Day UPV (m/s)* 28-Day
Compressive
Strength (MPa)
B119217004175.02000343238.5
B219247055141.02032306740.8
T119307103236.72120323130.5
T219147503250.02064371733.4
B1M519246905138.02016384546.2
B2M519236855137.02072389648.5
T1M519277004175.01984376238.2
T2M519337054176.32056395441.1
B1C319307204180.02008356641.5
B2C319306604165.02080343644.6
T1C319037103236.72016360533.2
T2C319287253241.72096406836.4
B1C619507005140.02044358235.5
B2C619506705134.02036365936.4
T1C619356304157.51960363426.0
T2C619387104177.52168378528.6
B1R319396504162.52032373843.0
B2R319786204155.02152358245.3
T1R318826253200.02060345035.0
T2R319117203240.02096394337.9
B1R619456204155.02060328240.5
B2R619546604165.02060312242.8
T1R619537353245.02068327832.5
T2R619537802260.02176382335.4
* mean value of at least three specimens; deviation from mean: density ~± 5 kg/m3, UPV ~± 10 m/s; compressive strength ~± 0.5 MPa.
Table 4. Compressive strength changes over time of different mixes.
AAEC Mix
ID
Compressive Strength (MPa) *Strength Change with Respect to Control (%)
(+ve: Increase, −ve: Decrease)
7 Days14 Days28 Days56 Days180 Days7 Days14 Days28 Days56 Days180 Days
Control AAECs
B114.328.538.545.850.300000
B215.630.840.848.152.600000
T114.922.530.537.842.300000
T21525.433.440.745.200000
5% MgO Incorporated AAECs
B1M520.135.546.252.656.840.424.62014.812.9
B2M521.437.848.554.959.137.122.718.914.112.4
T1M520.729.538.244.648.838.931.125.21815.4
T2M520.732.441.147.551.738.627.623.116.714.4
MWCNT (0.3% and 0.6%) incorporated AAEC
B1C317.930.541.549.453.925.177.87.87.1
B2C319.434.644.651.956.42412.29.27.87.1
T1C318.42633.241.345.823.515.68.99.38.3
T2C318.528.936.444.248.723.413.898.67.7
B1C615.329.535.544.248.473.5−7.8−3.5−3.8
B2C616.631.836.445.350.36.43.2−10.8−5.8−4.4
T1C615.920.22636.240.46.7−10.2−14.8−4.2−4.5
T2C61621.128.639.142.76.7−16.9−14.4−3.9−5.5
rGO (0.3% and 0.6%) incorporated AAEC
B1R318.8334350.354.831.515.811.79.88.9
B2R320.135.345.352.657.128.814.6119.48.6
T1R319.4273542.346.830.32014.811.910.6
T2R319.529.937.945.249.730.117.713.511.110
B1R616.330.540.547.852.31475.24.44
B2R617.632.842.850.154.612.86.54.94.23.8
T1R616.924.532.539.844.313.48.96.65.34.7
T2R61727.435.442.747.213.47.964.94.4
5% MgO and MWCNT or rGO (0.3% and 0.6%) incorporated AAECs
B2M5C323.840.250.957.361.552.430.524.819.116.9
T2M5C323.134.843.549.954.154.336.830.122.519.6
B2M5C621.63848.955.159.338.623.52014.612.8
T2M5C62132.741.447.85240.428.623.817.315
B2M5R325.1841.652.358.762.961.435.128.22219.6
T2M5R324.6136.2744.9751.3755.5764.542.834.626.222.9
B2M5R622.1838.649.355.759.942.225.320.815.813.9
T2M5R621.733.442.148.552.745.331.52619.216.6
* mean value of at least three specimens (deviation from mean: ± 0.5 MPa).
Disclaimer/Publisher’s Note: The statements, opinions and data contained in all publications are solely those of the individual author(s) and contributor(s) and not of MDPI and/or the editor(s). MDPI and/or the editor(s) disclaim responsibility for any injury to people or property resulting from any ideas, methods, instructions or products referred to in the content.

