

Industry 5.0: Are We Going to Accept Robots as Co-Workers in Office Environments? An Empirical Analysis


Abstract
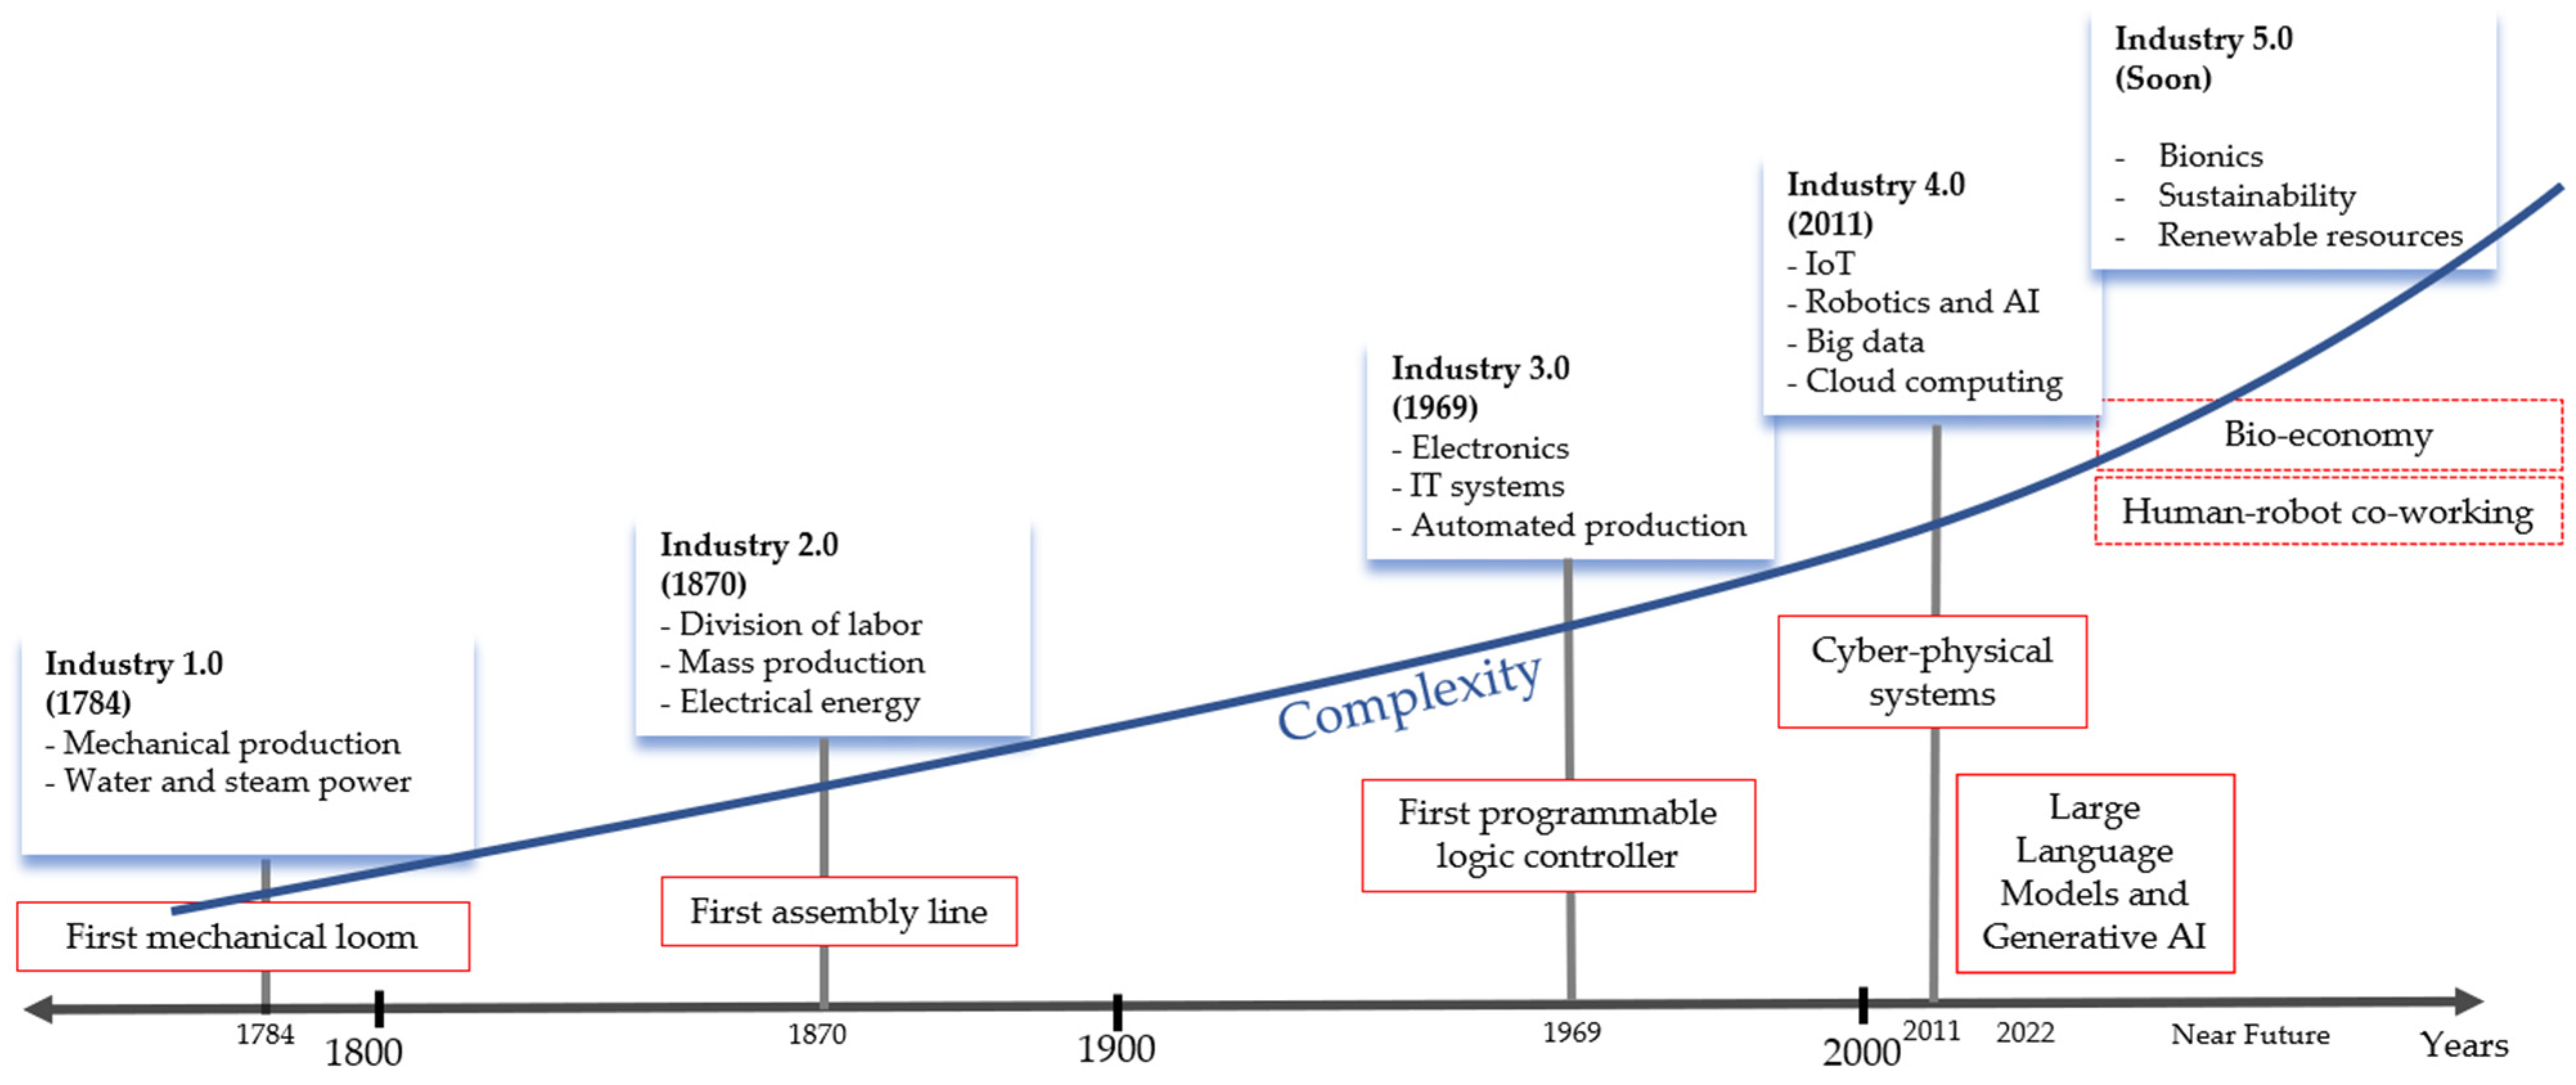
1. Introduction
Related Works
- Increasing our understanding of robot acceptance for human-robot co-working;
- Highlighting the role of perceived sociability in human–robot co-working;
- Offering cross-cultural perspectives on robot acceptance.
2. Model Constructions and Hypothesis
2.1. Critical Analysis of Theoretical Constructs
2.1.1. Performance Expectancy
2.1.2. Effort Expectancy
2.1.3. Social Influence
2.1.4. Perceived Sociability
2.2. Mathematical Definition of the Path Model
Loss Minimization in Path Analysis
3. Materials and Methods
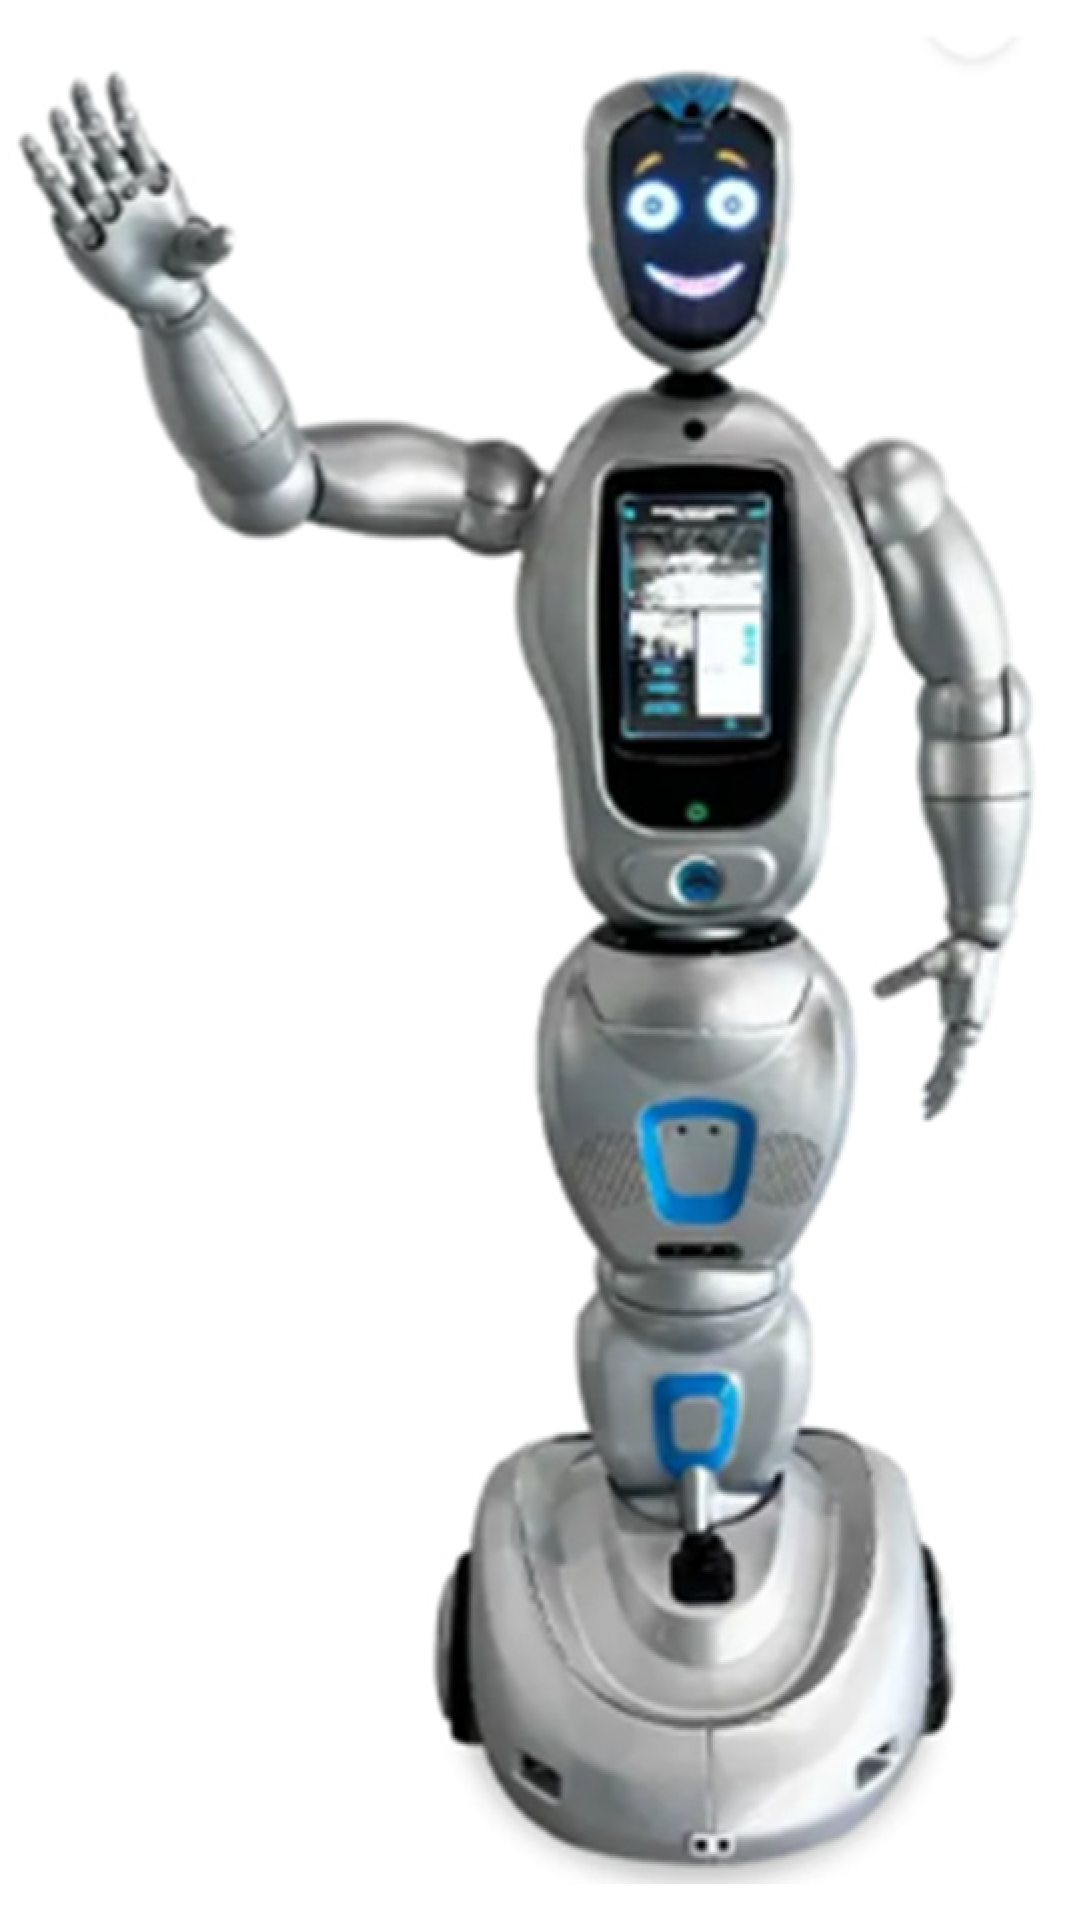
3.1. Materials
- See;
- Hear;
- Walk;
- Respond with tactile reactions;
- Reach the company’s ERP system.
3.2. Methods
3.2.1. Questionnaire Design
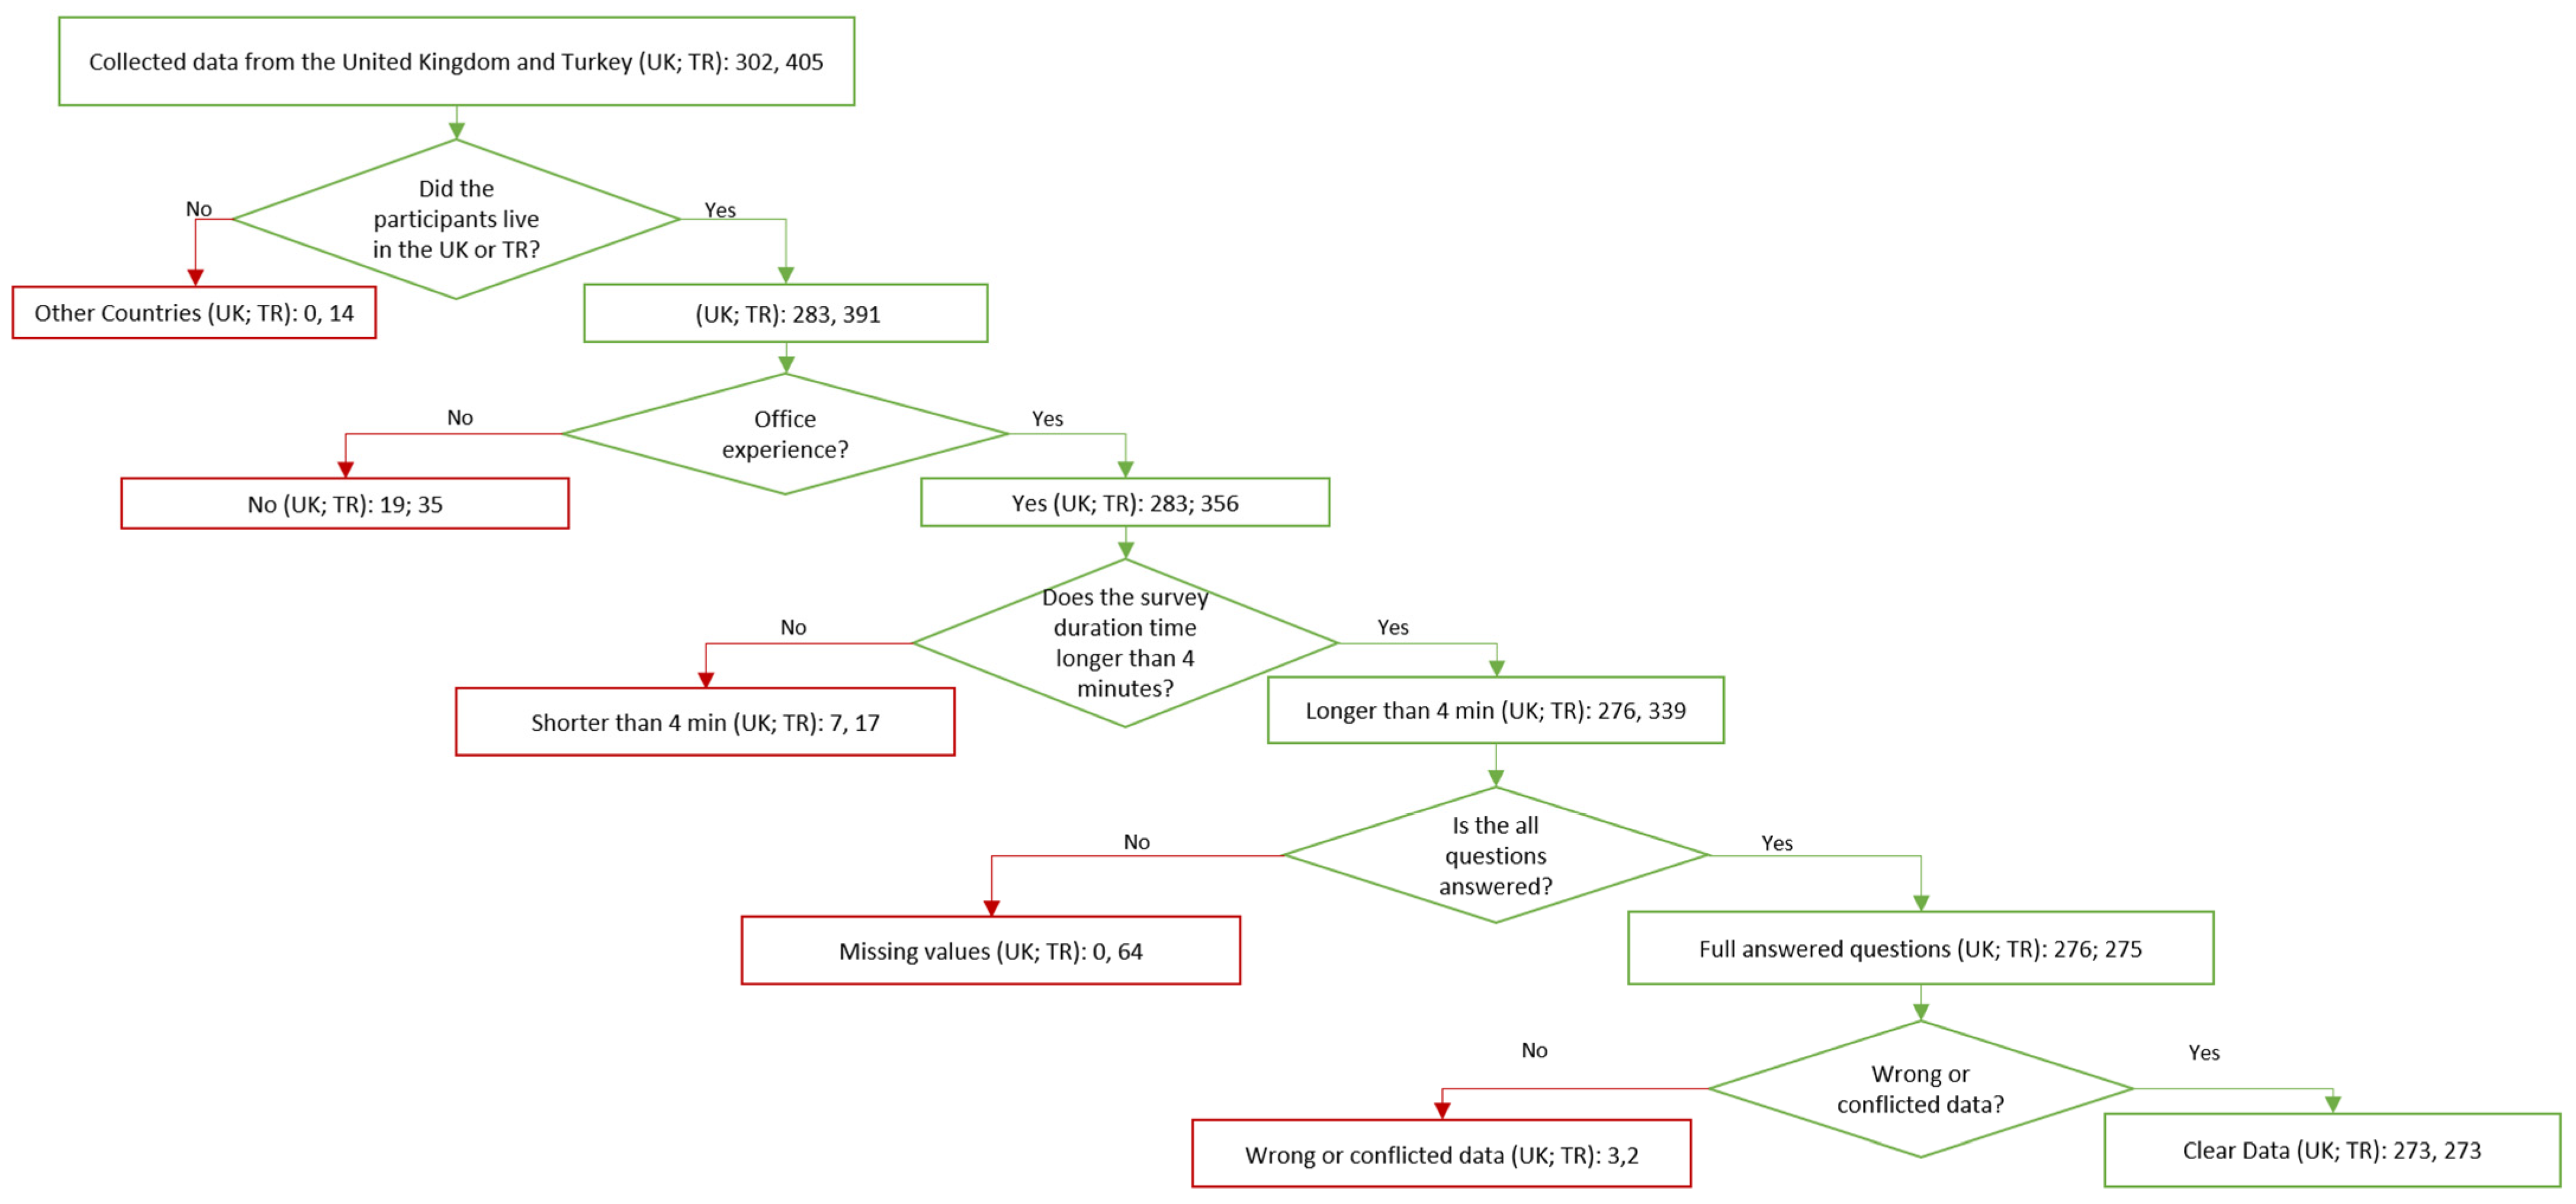
3.2.2. Data Collection and General Demographics
3.2.3. Research Methodology
4. Results and Discussion
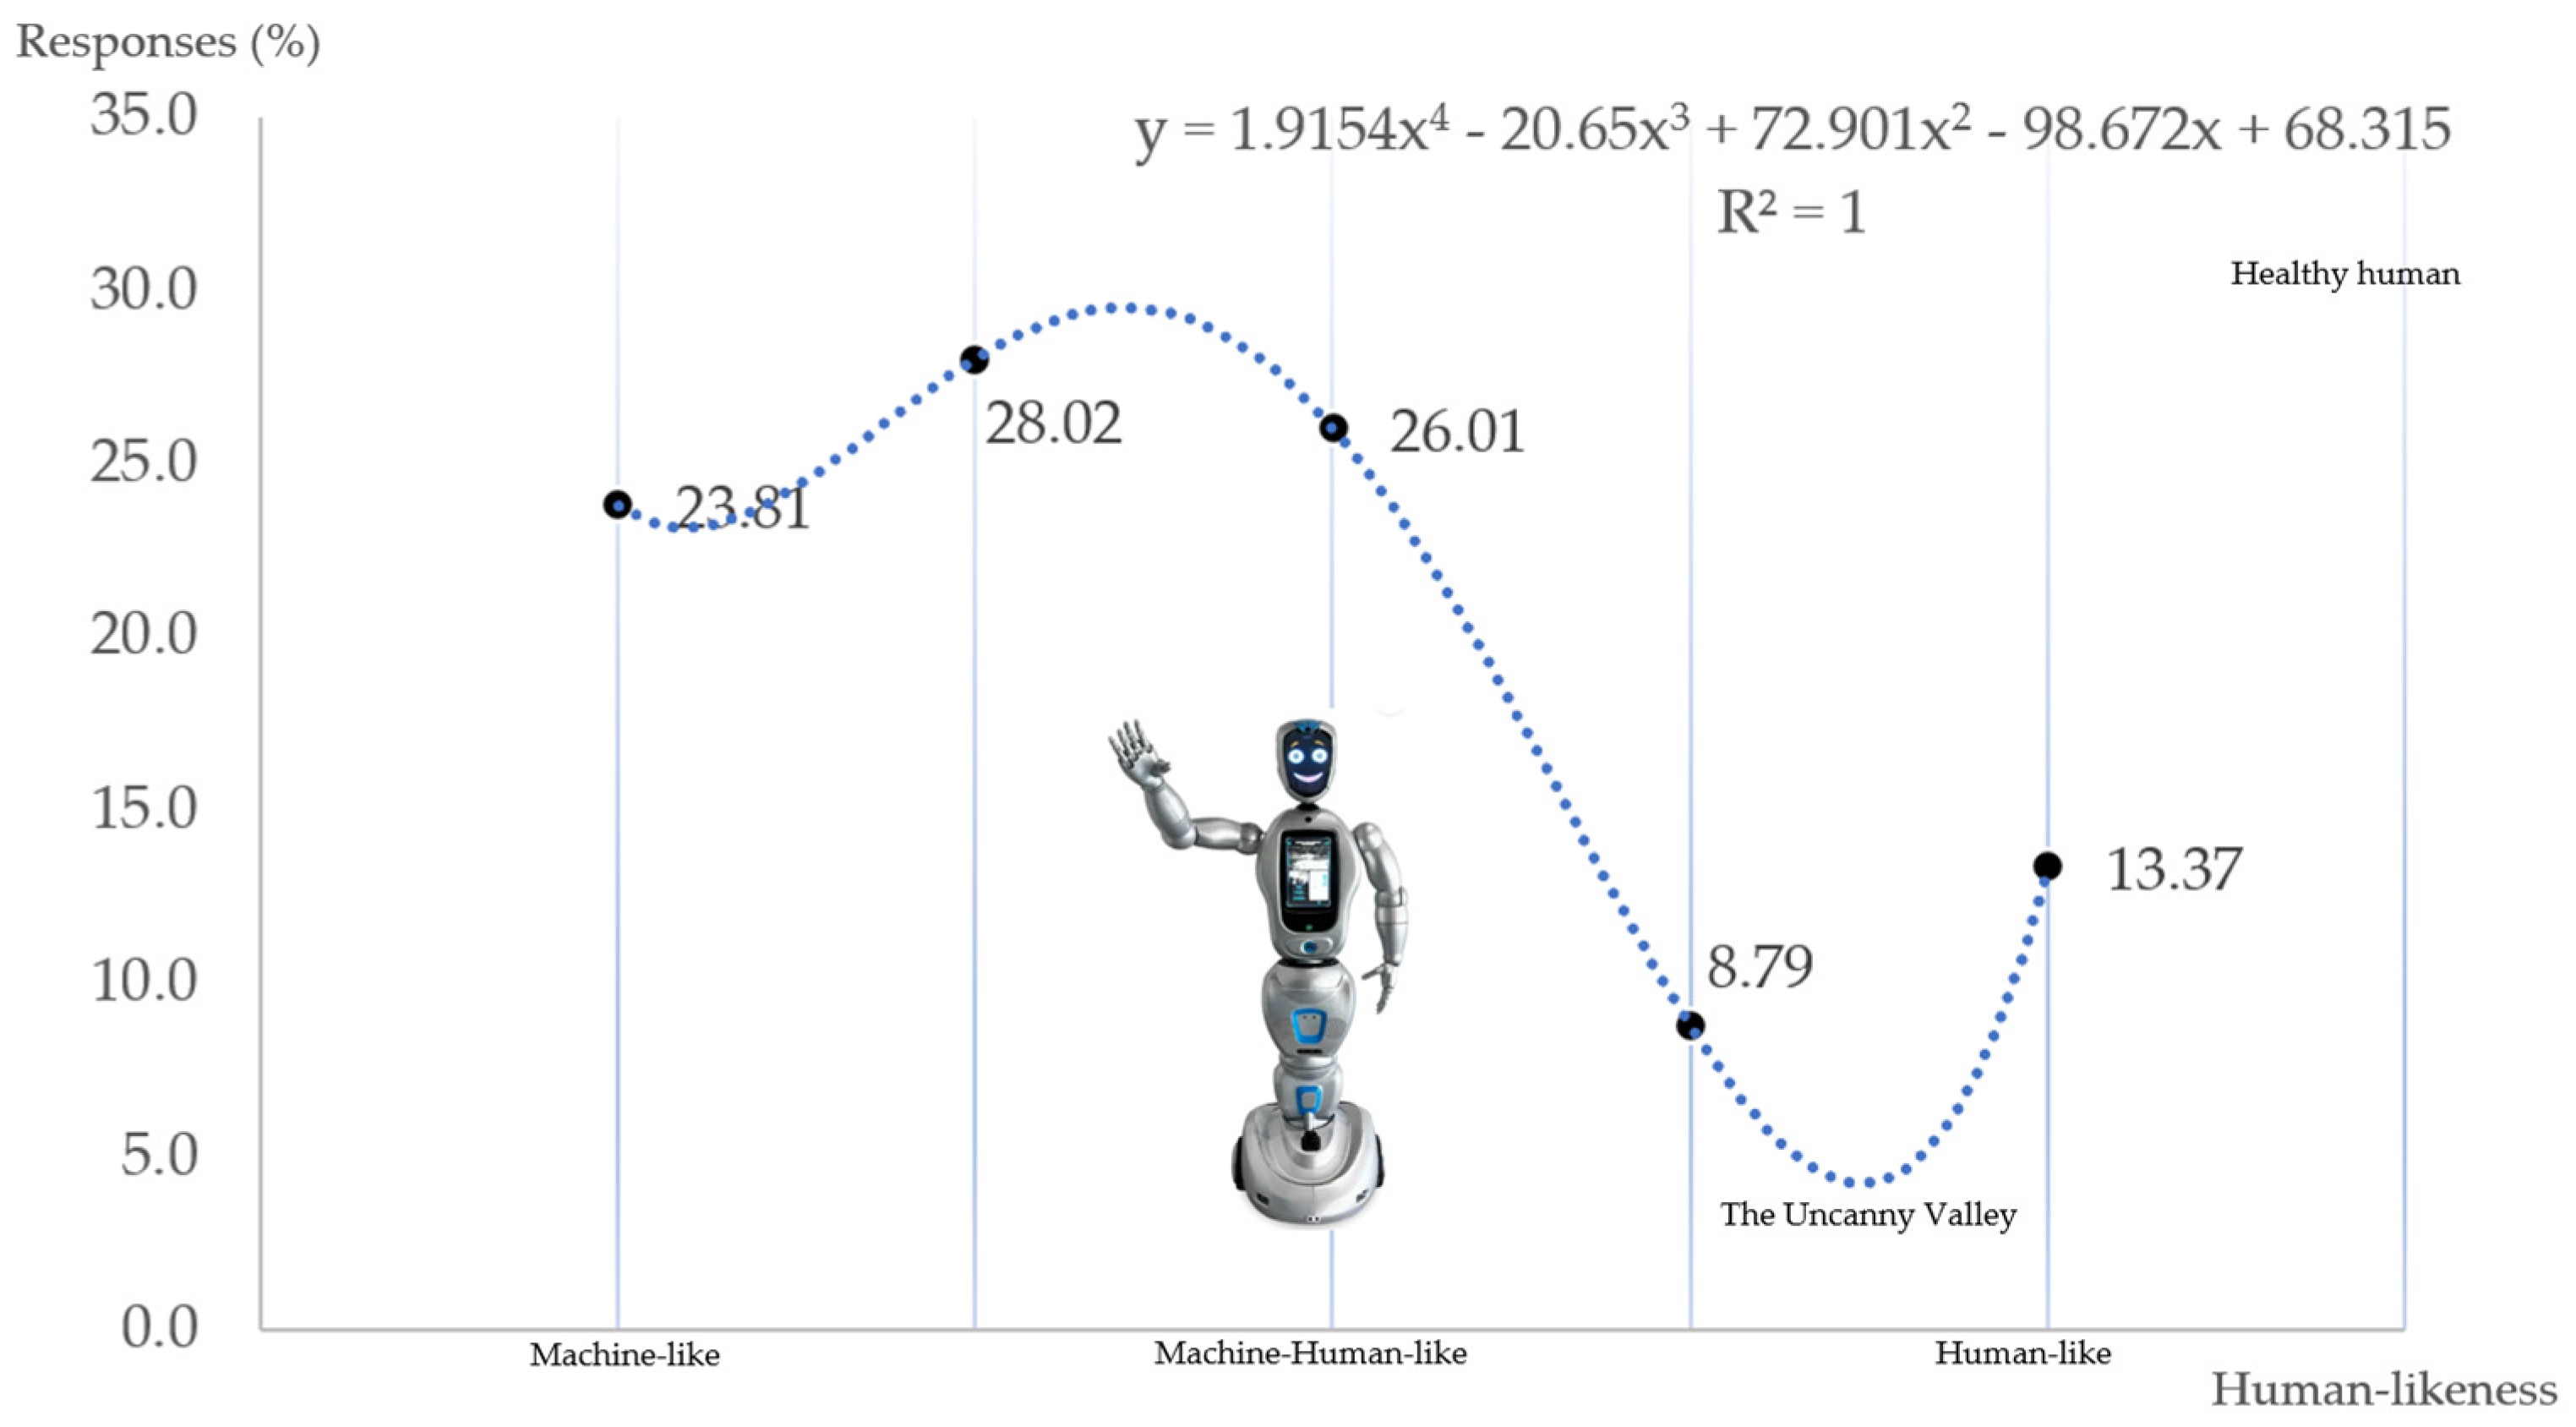
4.1. Robot Appearance
4.2. Measurement Model Analysis and Validation
- The category of absolute fit
- The root mean square error approximation (RMSEA) is less than 0.08 [65]. The root mean square error approximation (RMSEA) is a widely used index to assess the fit of a structural equation model. It evaluates how well the model approximates the data, considering the model’s complexity. Lower values indicate a better fit, with thresholds typically interpreted as follows:where
- 2.
- The category of parsimonious fit
- The CMIN/df value is less than 3 [55]. This GOF measure is a simple ratio of χ2 to the degrees of freedom for a model.
- 3.
- The category of incremental fit
- The comparative fit index (CFI) is indicative of a good fit if its value is greater than 0.95 [68]. The comparative fit index (CFI) is a widely used measure to evaluate the goodness-of-fit of a structural equation model. It compares the fit of the hypothesized model to that of an independent (null) model, where no relationships among variables are assumed. Higher values indicate a better fit, with the following thresholds commonly applied. CFI is computed as follows:where
4.3. Structural Equation Modeling (SEM) and Hypothesis Testing
4.4. Cross-Cultural Implications and Industry 5.0 Context
4.5. Theoretical and Practical Implications
4.5.1. Theoretical Implications
4.5.2. Practical Implications
4.6. Limitations and Future Research Directions
5. Conclusions
Author Contributions
Funding
Institutional Review Board Statement
Informed Consent Statement
Data Availability Statement
Acknowledgments
Conflicts of Interest
Correction Statement
Appendix A
 ;; Thank you.;
Appendix B
Appendix B.1. Addressing Data Conflicts and Rationale for Data Discarding
Appendix B.2. Justification for Data Exclusion
References
- Maddikunta, P.K.R.; Pham, Q.-V.; Prabadevi, B.; Deepa, N.; Dev, K.; Gadekallu, T.R.; Ruby, R.; Liyanage, M. Industry 5.0: A survey on enabling technologies and potential applications. J. Ind. Inf. Integr. 2022, 26, 100257. [Google Scholar] [CrossRef]
- European Commission. Industry 5.0. Available online: https://research-and-innovation.ec.europa.eu/research-area/industrial-research-and-innovation/industry-50_en (accessed on 17 November 2024).
- Demir, K.A.; Döven, G.; Sezen, B. Industry 5.0 and human-robot co-working. Procedia Comput. Sci. 2019, 158, 688–695. [Google Scholar] [CrossRef]
- Demir, K.A. Human-Robot Co-Working and Roboethics. Master’s Thesis, Gebze Technical University, Darıca, Turkey, 2019. Available online: https://scholar.google.com.sg/citations?view_op=view_citation&hl=en&user=Sop65jwAAAAJ&pagesize=80&citation_for_view=Sop65jwAAAAJ:NhqRSupF_l8C (accessed on 18 November 2024).
- Xu, X.; Lu, Y.; Vogel-Heuser, B.; Wang, L. Industry 4.0 and Industry 5.0—Inception, conception and perception. J. Manuf. Syst. 2021, 61, 530–535. [Google Scholar] [CrossRef]
- Peter, J.; Kühne, R. The new frontier in communication research: Why we should study social robots. Media Commun. 2018, 6, 73–76. [Google Scholar] [CrossRef]
- Saari, U.A.; Tossavainen, A.; Kaipainen, K.; Mäkinen, S.J. Exploring factors influencing the acceptance of social robots among early adopters and mass market representatives. Robot. Auton. Syst. 2022, 151, 104033. [Google Scholar] [CrossRef]
- Alaiad, A.; Zhou, L.; Koru, G. An Exploratory Study of Home Healthcare Robots Adoption Applying the UTAUT Model. Int. J. Healthc. Inf. Syst. Inform. 2014, 9, 44–59. [Google Scholar] [CrossRef]
- Alaiad, A.; Zhou, L. The determinants of home healthcare robots adoption: An empirical investigation. Int. J. Med. Inform. 2014, 83, 825–840. [Google Scholar] [CrossRef] [PubMed]
- Chen, N. Acceptance of Social Robots by Aging Users: Towards a Pleasure-Oriented View. In Cross-Cultural Design. Methods, Tools, and Users; Rau, P.L., Ed.; In Lecture Notes in Computer Science; Springer International Publishing: Cham, Switzerland, 2018; Volume 10911, pp. 387–397. [Google Scholar] [CrossRef]
- Vichitkraivin, P.; Naenna, T. Factors of healthcare robot adoption by medical staff in Thai government hospitals. Health Technol. 2021, 11, 139–151. [Google Scholar] [CrossRef]
- Yeoh, S.Y.; Chin, P.N. Exploring home health-care robots adoption in Malaysia: Extending the UTAUT model. Int. J. Pharm. Healthc. Mark. 2022, 16, 392–411. [Google Scholar] [CrossRef]
- Komariyah, D.; Inoue, K.; Suyama, N.; Buwana, C.; Ito, Y. The acceptance of the potential use of social robots for children with autism spectrum disorder by Indonesian occupational therapists: A mixed methods study. Disabil. Rehabil. Assist. Technol. 2024, 20, 397–407. [Google Scholar] [CrossRef]
- Zhang, L. Breaking Barriers: A Dual-Factor Model Unraveling Ageism in Socially Assistive Robot Adoption among Older Chinese Adults. Int. J. Hum.–Comput. Interact. 2024, 1–17. [Google Scholar] [CrossRef]
- Guggemos, J.; Seufert, S.; Sonderegger, S. Humanoid robots in higher education: Evaluating the acceptance of Pepper in the context of an academic writing course using the UTAUT. Br. J. Educ. Technol. 2020, 51, 1864–1883. [Google Scholar] [CrossRef]
- Abdelhakim, A.S.; Abou-Shouk, M.; Ab Rahman, N.A.F.W.; Farooq, A. The fast-food employees’ usage intention of robots: A cross-cultural study. Tour. Manag. Perspect. 2023, 45, 101049. [Google Scholar] [CrossRef]
- Pande, S.; Gupta, K.P. Indian customers’ acceptance of service robots in restaurant services. Behav. Inf. Technol. 2023, 42, 1946–1967. [Google Scholar] [CrossRef]
- Kaiser, R.; De Benedetto, S.; Planing, P.; Müller, P. What Will the Delivery Robots Bring Us Tomorrow? Int. J. Consum. Stud. 2024, 48, e13093. [Google Scholar] [CrossRef]
- Kraus, J.; Miller, L.; Klumpp, M.; Babel, F.; Scholz, D.; Merger, J.; Baumann, M. On the Role of Beliefs and Trust for the Intention to Use Service Robots: An Integrated Trustworthiness Beliefs Model for Robot Acceptance. Int. J. Soc. Robot. 2024, 16, 1223–1246. [Google Scholar] [CrossRef]
- Okafuji, Y.; Baba, J.; Nakanishi, J.; Kuramoto, I.; Ogawa, K.; Yoshikawa, Y.; Ishiguro, H. Can a humanoid robot continue to draw attention in an office environment? Adv. Robot. 2020, 34, 931–946. [Google Scholar] [CrossRef]
- Weerarathna, I.N.; Raymond, D.; Luharia, A. Human-Robot Collaboration for Healthcare: A Narrative Review. Cureus 2023, 15, e49210. [Google Scholar] [CrossRef] [PubMed]
- Demir, K.A. Smart education framework. Smart Learn. Environ. 2021, 8, 29. [Google Scholar] [CrossRef]
- OECD. OECD Digital Education Outlook 2021: Pushing the Frontiers with Artificial Intelligence, Blockchain and Robots. In OECD Digital Education Outlook; OECD: Paris, France, 2021. [Google Scholar] [CrossRef]
- Gurpinar, C.; Takir, S.; Bicer, E.; Uluer, P.; Arica, N.; Kose, H. Contrastive learning based facial action unit detection in children with hearing impairment for a socially assistive robot platform. Image Vis. Comput. 2022, 128, 104572. [Google Scholar] [CrossRef]
- Gürpınar, C.; Uluer, P.; Akalın, N.; Köse, H. Sign Recognition System for an Assistive Robot Sign Tutor for Children. Int. J. Soc. Robot. 2020, 12, 355–369. [Google Scholar] [CrossRef]
- Wirtz, J.; Patterson, P.G.; Kunz, W.H.; Gruber, T.; Lu, V.N.; Paluch, S.; Martins, A. Brave new world: Service robots in the frontline. J. Serv. Manag. 2018, 29, 907–931. [Google Scholar] [CrossRef]
- Kim, Y. Examining the Impact of Frontline Service Robots Service Competence on Hotel Frontline Employees from a Collaboration Perspective. Sustainability 2023, 15, 7563. [Google Scholar] [CrossRef]
- Cippelletti, E.; Fournier, É.; Jeoffrion, C.; Landry, A. Assessing Cobot’s Acceptability of French Workers: Proposition of a Model Integrating the TAM3, the ELSI and the Meaning of Work Scales. Int. J. Hum.–Comput. Interact. 2024, 1–13. [Google Scholar] [CrossRef]
- Tu, Y.; Liu, W.; Yang, Z. Exploring the influence of service employees’ characteristics on their willingness to work with service robots. J. Serv. Manag. 2023, 34, 1038–1063. [Google Scholar] [CrossRef]
- Liao, S.; Lin, L.; Chen, Q. Research on the acceptance of collaborative robots for the industry 5.0 era—The mediating effect of perceived competence and the moderating effect of robot use self-efficacy. Int. J. Ind. Ergon. 2023, 95, 103455. [Google Scholar] [CrossRef]
- Venkatesh, V.; Morris, M.G.; Davis, G.B.; Davis, F.D. User Acceptance of Information Technology: Toward a Unified View. MIS Q. 2003, 27, 425–478. [Google Scholar] [CrossRef]
- Heerink, M.; Kröse, B.; Evers, V.; Wielinga, B. Assessing Acceptance of Assistive Social Agent Technology by Older Adults: The Almere Model. Int. J. Soc. Robot. 2010, 2, 361–375. [Google Scholar] [CrossRef]
- Conti, D.; Di Nuovo, S.; Buono, S.; Di Nuovo, A. Robots in Education and Care of Children with Developmental Disabilities: A Study on Acceptance by Experienced and Future Professionals. Int. J. Soc. Robot. 2017, 9, 51–62. [Google Scholar] [CrossRef]
- Han, J.; Conti, D. The Use of UTAUT and Post Acceptance Models to Investigate the Attitude towards a Telepresence Robot in an Educational Setting. Robotics 2020, 9, 34. [Google Scholar] [CrossRef]
- Venkatesh, V. Adoption and use of AI tools: A research agenda grounded in UTAUT. Ann. Oper. Res. 2022, 308, 641–652. [Google Scholar] [CrossRef]
- Venkatesh, V.; Zhang, X. Unified Theory of Acceptance and Use of Technology: U.S. Vs. China. J. Glob. Inf. Technol. Manag. 2010, 13, 5–27. [Google Scholar] [CrossRef]
- Davis, F.D. Perceived Usefulness, Perceived Ease of Use, and User Acceptance of Information Technology. MIS Q. 1989, 13, 319–340. [Google Scholar] [CrossRef]
- Davis, F.D.; Bagozzi, R.P.; Warshaw, P.R. User Acceptance of Computer Technology: A Comparison of Two Theoretical Models. Manag. Sci. 1989, 35, 982–1003. [Google Scholar] [CrossRef]
- Moore, G.C.; Benbasat, I. Development of an Instrument to Measure the Perceptions of Adopting an Information Technology Innovation. Inf. Syst. Res. 1991, 2, 192–222. [Google Scholar] [CrossRef]
- Compeau, D.R.; Higgins, C.A. Computer Self-Efficacy: Development of a Measure and Initial Test. MIS Q. 1995, 19, 189–211. [Google Scholar] [CrossRef]
- Compeau, D.; Higgins, C.A.; Huff, S. Social Cognitive Theory and Individual Reactions to Computing Technology: A Longitudinal Study. MIS Q. 1999, 23, 145. [Google Scholar] [CrossRef]
- Oshlyansky, L.; Cairns, P.; Thimbleby, H. Validating the Unified Theory of Acceptance and Use of Technology (UTAUT) tool cross-culturally. In Proceedings of the HCI 2007 the 21st British HCI Group Annual Conference University of Lancaster, Lancaster, UK, 3–7 September 2007. [Google Scholar]
- Kim, H.-W.; Chan, H.C.; Chan, Y.P. A balanced thinking–feelings model of information systems continuance. Int. J. Human-Computer Stud. 2007, 65, 511–525. [Google Scholar] [CrossRef]
- Latikka, R.; Savela, N.; Oksanen, A. Perceptions of Assistive Robots at Work: An Experimental Approach to Social Influence. Int. J. Soc. Robot. 2023, 15, 1543–1555. [Google Scholar] [CrossRef]
- Ajzen, I. The Theory of planned behavior. Organ. Behav. Hum. Decis. Processes 1991, 50, 179–211. [Google Scholar] [CrossRef]
- Fishbein, M.; Ajzen, I. Belief, Attitude, Intention and Behavior: An Introduction to Theory and Research; Addison-Wesley series in social psychology; Addison-Wesley: Boston, MA, USA, 1975. [Google Scholar]
- Mathieson, K. Predicting user intentions: Comparing the technology acceptance model with the theory of planned behavior. Inf. Syst. Res. 1991, 2, 173–191. [Google Scholar] [CrossRef]
- Taylor, S.; Todd, P.A. Understanding information technology usage: A test of competing models. Inf. Syst. Res. 1995, 6, 144–176. [Google Scholar] [CrossRef]
- Taylor, S.; Todd, P. Assessing IT usage: The role of prior experience. J. MIS Q. 1995, 19, 561–570. [Google Scholar] [CrossRef]
- Thompson, R.L.; Higgins, C.A.; Howell, J.M. Personal Computing: Toward a Conceptual Model of Utilization. MIS Q. 1991, 15, 125. [Google Scholar] [CrossRef]
- Coeckelbergh, M. You, robot: On the linguistic construction of artificial others. AI Soc. 2011, 26, 61–69. [Google Scholar] [CrossRef]
- de Graaf, M.M.; Ben Allouch, S. Exploring influencing variables for the acceptance of social robots. Robot. Auton. Syst. 2013, 61, 1476–1486. [Google Scholar] [CrossRef]
- Heerink, M.; Kröse, B.; Evers, V.; Wielinga, B. The influence of social presence on acceptance of a companion robot by older people. Int. J. Comput. Vis. 2008. Available online: https://api.semanticscholar.org/CorpusID:34420104 (accessed on 10 November 2024). [CrossRef]
- Wright, S. The Method of Path Coefficients. Ann. Math. Stat. 1934, 5, 161–215. [Google Scholar] [CrossRef]
- Kline, R.B. Principles and Practice of Structural Equation Modeling. In Methodology in the Social Sciences; Guilford Publications: New York, NY, USA, 1998. [Google Scholar]
- Byrne, B.; van de Vijver, F. The maximum likelihood alignment approach to testing for approximate measurement invariance: A paradigmatic cross-cultural application. Psicothema 2017, 4, 539–551. [Google Scholar] [CrossRef] [PubMed]
- AKINROBOTICS. Social Robot ADA7. Available online: https://www.akinrobotics.com/en/social-robot-ada-7 (accessed on 30 November 2024).
- Hegel, F.; Lohse, M.; Wrede, B. Effects of visual appearance on the attribution of applications in social robotics. In Proceedings of the 18th IEEE International Symposium on Robot and Human Interactive Communication, Toyama, Japan, 27 September–2 October 2009; pp. 64–71. [Google Scholar]
- Destephe, M.; Brandao, M.; Kishi, T.; Zecca, M.; Hashimoto, K.; Takanishi, A. Walking in the uncanny valley: Importance of the attractiveness on the acceptance of a robot as a working partner. Front. Psychol. 2015, 6, 204. [Google Scholar] [CrossRef]
- Gursoy, D.; Chi, O.H.; Lu, L.; Nunkoo, R. Consumers acceptance of artificially intelligent (AI) device use in service delivery. Int. J. Inf. Manag. 2019, 49, 157–169. [Google Scholar] [CrossRef]
- Kim, S.; Chen, R.P.; Zhang, K. Anthropomorphized Helpers Undermine Autonomy and Enjoyment in Computer Games. J. Consum. Res. 2016, 43, 282–302. [Google Scholar] [CrossRef]
- Mori, M. Bukimi no tani [The uncanny valley]. Energy 1970, 7, 33. [Google Scholar]
- Murphy, J.; Gretzel, U.; Hofacker, C. Service robots in hospitality and tourism: Investigating anthropomorphism. In Proceedings of the 15th APacCHRIE Conference, Bali, Indonesia, 31 May–2 June 2017. [Google Scholar]
- Kaiser, H.F. An index of factorial simplicity. Psychometrika 1974, 39, 31–36. [Google Scholar] [CrossRef]
- Hair, J.F.; Black, W.C.; Babin, B.J.; Anderson, R.E. Multivariate Data Analysis; Cengage: Boston, MA, USA, 2019. [Google Scholar]
- Hair, J.F., Jr.; Matthews, L.M.; Matthews, R.L.; Sarstedt, M. PLS-SEM or CB-SEM: Updated guidelines on which method to use. Int. J. Multivar. Data Anal. 2017, 1, 107. [Google Scholar] [CrossRef]
- MacCallum, R.C.; Hong, S. Power Analysis in Covariance Structure Modeling Using GFI and AGFI. Multivar. Behav. Res. 1997, 32, 193–210. [Google Scholar] [CrossRef]
- Hu, L.T.; Bentler, P.M. Cutoff criteria for fit indexes in covariance structure analysis: Conventional criteria versus new alternatives. Struct. Equ. Model. Multidiscip. J. 1999, 6, 1–55. [Google Scholar] [CrossRef]
- Venkatesh, V. Paradigm changing metaverse: Future research directions in design, technology adoption and use, and impacts. Decis. Support Syst. 2025, 188, 114307. [Google Scholar] [CrossRef]
- Koshy, P.; Cabalu, H.; Valencia, V. Higher education and the importance of values: Evidence from the World Values Survey. High. Educ. 2023, 85, 1401–1426. [Google Scholar] [CrossRef]
- Nahavandi, S. Industry 5.0—A Human-Centric Solution. Sustainability 2019, 11, 4371. [Google Scholar] [CrossRef]


| Robot Type | Definitions |
|---|---|
| Industrial Robots | Industrial robots are robots utilized for industrial purposes in industrial environments. |
| Service Robots | Service robots need to perform useful tasks for humans or equipment. There are two main types of service robots:
|
| |
| Medical Robots | Medical robots are not regarded as industrial robots or service robots. Medical robots are intended to be used as medical electrical equipment or systems. |
| Country | Environment | Sample Group | Robot type as Reported by Authors | Supported Hypotheses | Acceptance Model | Source |
|---|---|---|---|---|---|---|
| Finland | Workplace | Market Representatives | Social Robots | Perceived usefulness->Behavioral intention | TAM3 | [7] |
| South Korea | Hotel | Hotel Frontline Workers | Service Robots | Perceived ease of use->Willingness to collaborate Perceived usefulness->Willingness to collaborate | TAM | [27] |
| France | Workplace | French Workers from many sectors | Industrial Robots | Usefulness of work->Perceived usefulness Subjective norm->Perceived usefulness Perceived usefulness->Behavioral intention Perceived ease of use->Behavioral intention | TAM2 and TAM3 | [28] |
| Country | Environment | Sample Group | Robot Type as Reported by Authors | PE->BI | EE->BI | EE->PE | SI->BI | Expressions Used as Dependent Variables Instead of Behavioral Intention (BI) | Cite |
|---|---|---|---|---|---|---|---|---|---|
| United States | Domestic | Patient and professionals | Home healthcare robot | Yes | No | Yes | Yes | Usage intention | [8] |
| United States | Domestic | Patient and professionals | Home healthcare robot | Yes | No | Yes | Yes | Intention to use | [9] |
| China | Domestic | Elderly people | Eldercare robot | Yes | Yes | x | Yes | User Adoption | [10] |
| Thailand | Hospital | Healthcare workers | Healthcare robot | Yes | Yes | x | Yes | Behavioral Intention | [11] |
| Malaysia | Domestic | Potential users | Home healthcare robot | Yes | No | x | Yes | Intention to Adopt | [12] |
| Indonesia | Rehabilitation clinics | Experienced occupational therapists | Social robot | Yes | No | x | Yes | Potential use | [13] |
| China | Domestic and social Environment | Older adults | Socially assistive robot (SARs) -Assistance in daily activities | Yes | No | x | no | Usage intention | [14] |
| Switzerland | Education | Higher education students | Social robot (Pepper) | Yes | Yes | x | Behavioral Intention | [15] | |
| Malaysia and Egypt | Restaurant | Fast-food employers | Service robots | Yes | Yes | x | Yes | Intention to Adopt | [16] |
| India | Restaurant | Restaurant customers | Service robot | Yes | Yes | x | x | Willingness to accept to use of service robots | [17] |
| Germany | Domestic and social environment | Pupil | Autonomous delivery robots—package and meal delivery | Yes | Yes | Yes | Yes | Behavioral Intention | [18] |
| Germany | domestic and supermarket | Random users | Service robots with different tasks | x | No | x | Yes | Intention to use | [19] |
| Variables | Survey Items (English) | Sources |
|---|---|---|
| Performance Expectancy (PE) | [31] | |
| PE1 | I would find this robot useful in my job. | |
| PE2 | Using this robot enables me to accomplish tasks more quickly. | |
| PE3 | Using this robot increases my productivity. | |
| PE4 | If I use this robot, I will increase my chances of getting a raise. | |
| Effort Expectancy (EE) | [31] | |
| EE1 | My interaction with this robot would be clear and understandable. | |
| EE2 | It would be easy for me to become skillful at using this robot. | |
| EE3 | I would find this robot easy to use. | |
| EE4 | Learning to operate this robot is easy for me. | |
| Social Influence (SI) | [31,32] | |
| SI1 | I think the staff would like me using the robot. | |
| SI2 | I think it would give a good impression if I should use the robot. | |
| SI3 | I think the senior management would be helpful in the use of the robot. | |
| SI4 | In general, the organization would support the use of the robot. | |
| Behavioral Intention (BI) | [31] | |
| BI1 | I intend to use this robot in the near future. | |
| BI2 | I predict I would use this robot in the near future. | |
| BI3 | I plan to use this robot in the near future. | |
| Perceived Sociability (PS) | [32] | |
| PS1 | I consider the robot a pleasant conversational partner. | |
| PS2 | I find the robot pleasant to interact with. | |
| PS3 | I feel the robot understands me. | |
| PS4 | I think the robot is nice. | |
| Question | Description | Complete Data | The United Kingdom | Turkey |
|---|---|---|---|---|
| Frequency Percentage (%) | Frequency Percentage (%) | Frequency Percentage (%) | ||
| Gender | Female | 298 (54.6%) | 163 (59.7%) | 135 (49.5%) |
| Male | 246 (45.1%) | 109 (39.9%) | 137 (50.2%) | |
| Prefer not to answer | 2 (0.4%) | 1 (0.4%) | 1 (0.4%) | |
| Total | 546 (100%) | 273 (100%) | 273 (100%) | |
| Age Groups and Generations | 78–95 (Silent) | 4 (0.7%) | 1 (0.4%) | 3 (1.1%) |
| 59–77 (Baby Boomer) | 62 (11.4%) | 25 (9.2%) | 37 (13.6%) | |
| 43–58 (Gen X) | 161 (29.5%) | 66 (24.2%) | 95 (34.8%) | |
| 27–42 (Gen Y) | 276 (50.5%) | 152 (55.7%) | 124 (45.4%) | |
| 18–26 (Gen Z) | 43 (7.9%) | 29 (10.6%) | 14 (5.1%) | |
| Total | 546 (100%) | 273 (100%) | 273 (100%) | |
| Education | IB/WB/ A-Level School Graduate | 63 (11.5%) | 52 (19.0%) | 11 (4.0%) |
| First-degree level qualification | 76 (13.9%) | 65 (23.8%) | 11 (4.0%) | |
| Diploma in higher education | 200 (36.6%) | 46 (16.8%) | 154 (56.4%) | |
| Higher university degree (e.g., MSc., PhD.) | 207 (37.9%) | 110 (40.3%) | 97 (35.5%) | |
| Total | 546 (100%) | 273 (100%) | 273 (100%) | |
| Employment | Employed, working full-time | 412 (75.5%) | 206 (75.5%) | 11 (4.0%) |
| Employed, working part-time | 68 (12.5%) | 55 (20.1%) | 11 (4.0%) | |
| Not employed and/or looking for work | 19 (3.5%) | 7 (2.6%) | 154 (56.4%) | |
| Retired | 47 (8.6%) | 5 (1.8%) | 97 (35.5%) | |
| Total | 546 (100%) | 273 (100%) | 273 (100%) | |
| Robot Experience | Yes, at home | 298 (54.6%) | 162 (59.3%) | 136 (49.8%) |
| Yes, at work | 53 (9.7%) | 25 (9.2%) | 28 (10.3%) | |
| Yes, elsewhere | 13 (2.4%) | 7 (2.6%) | 6 (2.2%) | |
| No | 182 (33.3%) | 79 (28.9%) | 103 (37.7%) | |
| Total | 546 (100%) | 273 (100%) | 273 (100%) | |
| Intention to Purchase a robot | Yes, within the next year | 85 (15.6%) | 48 (17.6%) | 37 (13.6%) |
| Yes, in 1 to 5 years | 161 (29.5%) | 96 (35.2%) | 65 (23.8%) | |
| Yes, in more than 5 years | 45 (8.2%) | 26 (9.5%) | 19 (7.0%) | |
| No | 102 (18.7%) | 44 (16.1%) | 58 (21.2%) | |
| I already have one | 153 (28.0%) | 59 (21.6%) | 94 (34.4%) | |
| Total | 546 (100%) | 273 (100%) | 273 (100%) | |
| Office Experience | Yes | 546 (100%) | 273 (100%) | 273 (100%) |
| Robot appearance preferences | 1 Machine-like robot | 130 (23.8%) | 52 (19.0%) | 78 (28.6%) |
| 2 | 153 (20.0%) | 102 (37.4%) | 51 (18.7%) | |
| 3 Machine–human-like robot | 142 (26.0%) | 66 (24.2%) | 76 (27.8%) | |
| 4 | 48 (8.8%) | 35 (12.8%) | 13 (4.8%) | |
| 5 Human-like robot | 73 (13.4%) | 18 (6.6%) | 55 (20.1%) | |
| Total | 546 (100%) | 273 (100%) | 273 (100%) |
| Data | Bartlett’s Test of Sphericity | KMO |
|---|---|---|
| Complete Data | χ2(171) = 4181, p < 0.001 | 0.90 |
| The United Kingdom | χ2(171) = 4790, p < 0.001 | 0.93 |
| Turkey | χ2(171) = 4481, p < 0.001 | 0.90 |
| Variable | Items | Factor Loadings | CR | Cronbach’s α | AVE |
|---|---|---|---|---|---|
| Performance Expectancy (PE) | PE1 | 0.756 | 0.823 | 0.903 | 0.540 |
| PE2 | 0.804 | ||||
| PE3 | 0.769 | ||||
| PE4 | 0.594 | ||||
| Effort Expectancy (EE) | EE1 | 0.596 | 0.875 | 0.890 | 0.640 |
| EE2 | 0.845 | ||||
| EE3 | 0.861 | ||||
| EE4 | 0.866 | ||||
| Social Influence (SI) | SI1 | 0.755 | 0.848 | 0.873 | 0.583 |
| SI2 | 0.742 | ||||
| SI3 | 0.772 | ||||
| SI4 | 0.784 | ||||
| Perceived Sociability (PS) | PS1 | 0.866 | 0.871 | 0.886 | 0.630 |
| PS2 | 0.825 | ||||
| PS3 | 0.763 | ||||
| PS4 | 0.711 | ||||
| Behavioral Intention (BI) | BI1 | 0.821 | 0.872 | 0.959 | 0.693 |
| BI2 | 0.843 | ||||
| BI3 | 0.834 |
| United Kingdom | Turkey | ||||||||
|---|---|---|---|---|---|---|---|---|---|
| Variable | Item | Loading | CR | Cronbach’s α | AVE | Loading | CR | Cronbach’s α | AVE |
| Performance Expectancy (PE) | PE1 | 0.732 | 0.799 | 0.919 | 0.554 | 0.793 | 0.799 | 0.882 | 0.554 |
| PE2 | 0.8 | 0.817 | |||||||
| PE3 | 0.79 | 0.763 | |||||||
| PE4 | 0.646 | 0.472 | |||||||
| Effort Expectancy (EE) | EE1 | 0.598 | 0.796 | 0.884 | 0.667 | 0.598 | 0.796 | 0.897 | 0.667 |
| EE2 | 0.877 | 0.877 | |||||||
| EE3 | 0.859 | 0.859 | |||||||
| EE4 | 0.896 | 0.896 | |||||||
| Social Influence (SI) | SI1 | 0.704 | 0.799 | 0.903 | 0.566 | 0.704 | 0.799 | 0.827 | 0.566 |
| SI2 | 0.689 | 0.689 | |||||||
| SI3 | 0.817 | 0.817 | |||||||
| SI4 | 0.793 | 0.793 | |||||||
| Perceived Sociability (PS) | PS1 | 0.893 | 0.797 | 0.884 | 0.62 | 0.893 | 0.797 | 0.885 | 0.620 |
| PS2 | 0.825 | 0.825 | |||||||
| PS3 | 0.805 | 0.805 | |||||||
| PS4 | 0.594 | 0.594 | |||||||
| Behavioral Intention (BI) | BI1 | 0.838 | 0.75 | 0.962 | 0.707 | 0.838 | 0.75 | 0.946 | 0.707 |
| BI2 | 0.853 | 0.853 | |||||||
| BI3 | 0.831 | 0.831 | |||||||
| Measurement Indicators | CMIN | df | CMIN/df | GFI | RMSEA | CFI |
|---|---|---|---|---|---|---|
| Complete Data | 364.886 | 139 | 2.625 | 0.936 | 0.055 | 0.974 |
| United Kingdom | 280.436 | 138 | 2.032 | 0.905 | 0.062 | 0.970 |
| Turkey | 282.006 | 137 | 2.058 | 0.904 | 0.062 | 0.965 |
| Reference Standards | .. | .. | ≤3.00 | ≥0.90 | ≤0.08 | ≥0.95 |
| Measurement Indicators | CMIN | df | CMIN/df | GFI | RMSEA | CFI |
|---|---|---|---|---|---|---|
| Complete Data | 324.781 | 138 | 2.353 | 0.942 | 0.050 | 0.979 |
| United Kingdom | 265.549 | 138 | 1.924 | 0.908 | 0.058 | 0.973 |
| Turkey | 342.294 | 139 | 2.463 | 0.887 | 0.073 | 0.951 |
| Reference Standards | .. | .. | ≤3.00 | ≥0.90 | ≤0.08 | ≥0.95 |
| Complete Data | ||||||||
| Structural Relationship | β | S.E. | t value | p | R² | Result | ||
| H1: | Behavioral Intention (BI) ← | Performance Expectancy (PE) | 0.477 | 0.095 | 5.195 | *** | 0.562 | Supported |
| H2a: | Performance Expectancy (PE) ← | Effort Expectancy (EE) | 0.853 | 0.069 | 17.734 | *** | 0.728 | Supported |
| H2b: | Behavioral Intention (BI) ← | Effort Expectancy (EE) | −0.214 | 0.196 | −1.621 | 0.105 | 0.562 | Not supported |
| H3: | Behavioral Intention (BI) ← | Social Influence (SI) | 0.423 | 0.080 | 7.160 | *** | 0.562 | Supported |
| H4: | Behavioral Intention (BI) ← | Perceived Sociability (PS) | 0.189 | 0.052 | 4.033 | *** | 0.562 | Supported |
| EE correlated SI | 0.712 | 0.037 | 10.704 | *** | ||||
| SI correlated PS | 0.518 | 0.042 | 9.277 | *** | ||||
| EE correlated PS | 0.654 | 0.043 | 10.334 | *** | ||||
| United Kingdom | ||||||||
| Structural Relationship | β | S.E. | t value | p | R² | Result | ||
| H1: | Behavioral Intention (BI) ← | Performance Expectancy (PE) | 0.434 | 0.119 | 3.700 | *** | 0.667 | Supported |
| H2a: | Performance Expectancy (PE) ← | Effort Expectancy (EE) | 0.863 | 0.095 | 13.507 | *** | 0.745 | Supported |
| H2b: | Behavioral Intention (BI) ← | Effort Expectancy (EE) | −0.202 | 0.268 | −1.142 | 0.254 | 0.667 | Not supported |
| H3: | Behavioral Intention (BI) ← | Social Influence (SI) | 0.525 | 0.108 | 6.047 | *** | 0.667 | Supported |
| H4: | Behavioral Intention (BI) ← | Perceived Sociability (PS) | 0.159 | 0.068 | 2.527 | 0.012 * | 0.667 | Supported |
| EE correlated SI | 0.788 | 0.058 | 8.420 | *** | ||||
| SI correlated PS | 0.648 | 0.071 | 7.985 | *** | ||||
| EE correlated PS | 0.708 | 0.064 | 7.905 | *** | ||||
| Turkey | ||||||||
| Structural Relationship | β | S.E. | t value | p | R² | Result | ||
| H1: | Behavioral Intention (BI) ← | Performance Expectancy (PE) | 0.372 | 0.062 | 5.929 | *** | 0.474 | Supported |
| H2a: | Performance Expectancy (PE) ← | Effort Expectancy (EE) | 0.620 | 0.077 | 9.872 | *** | 0.385 | Supported |
| H2b: | Behavioral Intention (BI) ← | Effort Expectancy (EE) | 0.001 | 0.078 | 0.018 | 0.986 | 0.474 | Not supported |
| H3: | Behavioral Intention (BI) ← | Social Influence (SI) | 0.239 | 0.134 | 3.762 | *** | 0.474 | Supported |
| H4: | Behavioral Intention (BI) ← | Perceived Sociability (PS) | 0.335 | 0.058 | 5.819 | *** | 0.474 | Supported |
| EE correlated SI | 0.419 | 0.030 | 5.043 | *** | ||||
| SI correlated PS | 0.364 | 0.036 | 4.460 | *** | ||||
| EE correlated PS | 0.393 | 0.053 | 5.713 | *** | ||||
Disclaimer/Publisher’s Note: The statements, opinions and data contained in all publications are solely those of the individual author(s) and contributor(s) and not of MDPI and/or the editor(s). MDPI and/or the editor(s) disclaim responsibility for any injury to people or property resulting from any ideas, methods, instructions or products referred to in the content. |
© 2025 by the authors. Licensee MDPI, Basel, Switzerland. This article is an open access article distributed under the terms and conditions of the Creative Commons Attribution (CC BY) license (https://creativecommons.org/licenses/by/4.0/).
Share and Cite
Doven, G.; Sezen, B.; Demir, K.A.; Balcioglu, Y.S. Industry 5.0: Are We Going to Accept Robots as Co-Workers in Office Environments? An Empirical Analysis. Appl. Sci. 2025, 15, 1591. https://doi.org/10.3390/app15031591
Doven G, Sezen B, Demir KA, Balcioglu YS. Industry 5.0: Are We Going to Accept Robots as Co-Workers in Office Environments? An Empirical Analysis. Applied Sciences. 2025; 15(3):1591. https://doi.org/10.3390/app15031591
Chicago/Turabian StyleDoven, Gozde, Bulent Sezen, Kadir Alpaslan Demir, and Yavuz Selim Balcioglu. 2025. "Industry 5.0: Are We Going to Accept Robots as Co-Workers in Office Environments? An Empirical Analysis" Applied Sciences 15, no. 3: 1591. https://doi.org/10.3390/app15031591
APA StyleDoven, G., Sezen, B., Demir, K. A., & Balcioglu, Y. S. (2025). Industry 5.0: Are We Going to Accept Robots as Co-Workers in Office Environments? An Empirical Analysis. Applied Sciences, 15(3), 1591. https://doi.org/10.3390/app15031591