1. Introduction
In traditional e-learning, teachers rely on the idea of one size fits all in delivering learning materials, which assumes all learners have the same characteristics [
1]. Learning methodologies have shifted to a student-centered model, where the instructional approaches and learning content are focused on the individual learner [
1]. A learning methodology called personalized e-learning has been employed to address the limitations of traditional e-learning and support the concept of a student-centered model by providing learning experiences tailored to meet students’ needs and requirements, resulting in an effective and efficient learning process [
2,
3]. This can be accomplished by taking into account learners’ characteristics, such as their learning styles [
4,
5] and goals [
6], as well as their background and experience [
7,
8,
9,
10,
11,
12,
13]. This study supports the learner-centered model by adapting the learning content according to the students’ performance and preferences. It expands upon recent research using Moalemy, an Arabic rule-based educational chatbot developed to offer a personalized learning experience tailored to learners’ prior knowledge and preferences [
14]. It involved a user experiment that utilized the Moalemy chatbot as the experimental platform with several personalization strategies.
In some research, as well as this research, personalized learning is also called adaptive learning [
4,
5]. Personalized e-learning can be categorized into three approaches based on who controls the personalization: the adaptive approach, the adaptable approach, and the mixed approach [
15]. These three personalization paradigms have been identified as distinct learning mechanisms in research on technology-enhanced learning. In the adaptive approach, the system takes complete control over course content, presentation, navigation, and sequencing [
16,
17]. Adaptive systems from prior research have demonstrated their ability to enhance learning efficiency and academic achievement by automatically customizing content difficulty and sequencing according to individual learner needs [
18]. In this approach, Moalemy dynamically adjusts the learning contents to match each student’s previous knowledge, as evaluated through pre-test performance [
14]. The adaptable approach, in contrast, gives learners full control over these elements, allowing them to choose learning content based on their personal needs and preferences [
15]. Learner-controlled (adaptable) personalization is linked to increased motivation and interest, as users favor more control over content selection and navigation, which fosters autonomy and ongoing engagement [
19]. According to this, Moalemy lets students choose the course content that best matches their needs and preferences. The mixed approach occupies an intermediate position, combining both methods, enabling shared control between the system and the learner [
15]. Based on this configuration, Moalemy first suggests content according to the learner’s knowledge profile (pre-test results) and subsequently allows the student to select their preferred course material. It demonstrates that shared control can foster self-regulation and preserve learner agency within adaptive frameworks [
1]. Although these approaches have the same goal of providing a personalized e-learning experience, they differ in who controls the presented learning contents: the adaptive approach is system-driven, the adaptable approach is learner-driven, and the mixed approach is collaboratively controlled [
15]. Incorporating these three paradigms, alongside a static baseline with no personalization, provides a theoretically grounded structure for comparison and allows the present study to examine how different personalization logics influence usability, engagement, and learning outcomes when delivered through the same content and rule-based instructional design within Moalemy. This comparative design addresses a gap noted in the recent literature, where studies typically investigate a single personalization mechanism in isolation rather than evaluating multiple approaches within a unified e-learning system.
To operationalize these personalization paradigms, the present study employed Moalemy, a rule-based Arabic educational chatbot [
14]. Moalemy was selected because its modular architecture and rule-driven logic enable controlled manipulation of system-, learner-, and shared-control personalization modes while keeping all other variables, including content, feedback, scoring, and interaction structure, constant. This enables a fair comparison among adaptive, adaptable, mixed, and static approaches using the same instructional content, thus isolating the effect of personalization logic on usability, learning outcomes, and engagement.
This study investigates how Moalemy, with three personalization approaches (adaptive, adaptable, and mixed) as well as a non-personalized (static) approach, affects three distinct user experience dimensions in human–computer interaction and educational systems: learning outcomes, student engagement, and system usability. Learning success is considered one of the most essential scopes in designing educational systems [
20,
21]. Student academic performance is assessed based on learning gain and relative learning gain, which indicate learning success [
22,
23]. Student performance in pre-test and post-test is used to evaluate both absolute and relative gains [
20]. Research shows a strong link between students’ academic achievement and their level of engagement [
24]. The level of student engagement during learning sessions is treated as an important factor to assess the quality of the learning process [
24]. Engagement can be defined as the resources students or organizations dedicate, like time and effort, during learning to enhance student outcomes, improve experience, and strengthen the reputation of the institution [
24]. Student engagement is generally seen as a multidimensional concept that reflects learners’ interest, motivation, attention, and persistence during instructional activities [
25]. Recent studies emphasize that students’ engagement is not just about the time they spend on learning tasks but also about how they accurately engage during learning, indicating both behavioral and cognitive involvement [
26]. Moreover, usability is considered a key metric for human–computer interaction (HCI) application design and evaluation, such as Moalemy [
27,
28,
29]. In the ISO 9241-11 [
30], the International Organization for Standardization (Geneva, Switzerland), usability refers to how well a product allows particular users to achieve specific goals within a certain context, ensuring effectiveness, efficiency, and satisfaction [
27,
28,
30]. Therefore, this study evaluates usability in terms of these three characteristics using objective performance metrics, including completeness for effectiveness and speed and accuracy to measure efficiency. As well as subjective measures using the System Usability Scale for perceived usability and a custom comparative survey for evaluating satisfaction. Overall, usability, learner engagement, and learning success are widely recognized as core dimensions of user experience in educational technologies and HCI applications [
31]. Usability reflects how effectively, efficiently, and satisfactorily learners can interact with the system, which is essential for a meaningful and accessible learning experience. Engagement and learning success were indicators of motivational involvement and knowledge acquisition. Together, these metrics provide a coherent multidimensional framework for examining how different personalization approaches affect the overall learning experience.
1.1. Problem Definition
Despite advancements in personalized e-learning, prior research has mainly examined system-driven (adaptive) approaches, with limited comparison to learner-controlled (adaptable) and mixed personalization approaches. Moreover, the effects of these approaches have not been systematically evaluated within Arabic educational chatbot systems, nor have they been analyzed across varying levels of task difficulty. This study addresses this gap by empirically comparing four learning methods (static, adaptive, adaptable, and mixed) within the same rule-based platform to determine how different learning approaches impact usability, engagement, and learning outcomes.
1.2. Study Aim and Questions
E-learning research commonly evaluates the effectiveness of the learning process through usability, learner engagement, and learning success, as these dimensions collectively reflect core aspects of the user experience in technology-enhanced learning environments [
31]. Therefore, this study aims to empirically explore the effects of four different learning approaches (static, adaptive, adaptable, and mixed) implemented within the Arabic rule-based chatbot Moalemy on these dependent metrics. A 4 × 3 within-subjects experimental design was used, in which 52 students interacted with Moalemy under the four learning approaches, one at a time, in a different order. The learning tasks varied in difficulty (easy, medium, and hard). Usability was assessed along three dimensions (effectiveness, efficiency, and satisfaction) [
27,
28]. Learner engagement was evaluated using persistence and accuracy as behavioral indicators [
24,
26]. Learning success was measured using learning gain (LG) and relative learning gain (RLG), which reflect improvements in student academic performance [
22,
23,
32]. Evaluating these multidimensional outcomes across varying task complexities allows a systematic comparison of how system-driven, learner-driven, and shared-control personalization modalities influence the quality of learning experience in an Arabic e-learning context.
Research question: What are the effects of different learning approaches on learning outcomes, student engagement, and usability across varying levels of task difficulty?
RQ1: How do different learning approaches influence student learning success?
RQ2: What are the impacts of learning approaches on student engagement and usability metrics?
RQ3: How do engagement and usability vary across the three levels of task complexity within each learning approach?
2. Background and Related Work
2.1. Background
Studies used various measures to evaluate the performance of human–computer interaction applications like chatbots. Usability is considered one of the essential measures to ensure the effectiveness, efficiency, and satisfaction of the system [
28]. The System Usability Scale is a well-known instrument used to measure the system’s perceived usability in multiple dimensions, such as effectiveness and complexity [
33]. Effectiveness is a usability trait that gauges how accurately and thoroughly specific users can achieve their goals [
29]. Several measures can be used to evaluate effectiveness, but task completion rate remains the most popular [
27]. Efficiency as a usability feature refers to the resources users employ to achieve their goals [
29]. Although the time spent completing a task is the most commonly used measure of efficiency, there are several other metrics, including error rate, response quality, and mental effort [
27]. Researchers are primarily concerned with user satisfaction, which is the most frequently assessed aspect, highlighting the importance of making sure users are satisfied [
27,
29]. User satisfaction is evaluated across various dimensions, mainly ease of use, willingness to reuse the system, and overall enjoyment [
27].
As learner disengagement is a serious issue in learning environments, student engagement is considered a key factor in assessing the efficacy and quality of tutoring [
24]. Previous studies have shown that observable behavioral actions, such as completing assigned tasks and providing accurate responses, can provide reliable evidence of engagement in technology-supported learning contexts. Research has found that the frequency of completed quizzes and assignments, as reported in LMS log data, is strongly linked to students’ academic outcomes, as research has found a significant correlation between student engagement and their academic success, emphasizing persistence as an essential component of engagement [
24,
34]. Engagement encompasses more than just persistence, where accuracy in performing tasks also reflects cognitive engagement. This indicates that students are not only active but also make cognitive effort and pay attention in participation. Previous research on MOOCs showed that accuracy in challenge questions was strongly connected to more engaged and meaningful learner participation [
35]. Expanding on these findings, recent studies argue that time-on-task by itself does not provide a complete picture of engagement. Instead, combining indicators that reflect both participation (such as task completion) and performance quality (such as accuracy) gives a more reliable representation of behavioral engagement [
26]. Student engagement is also strongly associated with learning success, which remains a key objective of technology-enhanced educational tools such as chatbots [
32]. The success of learning is commonly assessed through both absolute and relative learning gains, utilizing student results from pre-tests and post-tests that are analyzed to determine any improvements in learning outcomes [
22,
23].
2.2. Related Work
An adaptive e-learning system [
36] utilizes the VARK model to identify the learner’s style, classifying them as Visual, Aural, Read/Write, or Kinesthetic learners. Students’ engagement was evaluated by comparing the skills, participation, performance, and emotion of students using an adaptive e-learning system with those of students who use a non-adaptive system using the Dixson scale. The results indicate that students using an adaptive system tailored to their learning style achieve and engage more effectively than those in the other group. These findings support the idea that personalization can positively influence learner engagement and outcomes, which underpins the inclusion of adaptive personalization as one of the learning approaches examined in this study.
An adaptive e-learning model for open and distance education [
37] is proposed to investigate the provision of personalized content, comprising three components: learner module, content module, and adaptive module. The learner module is built using a survey to collect information about user preferences, which enables the matching of learners with preferred content using a learning algorithm. The adaptation of the model is performed at the navigation level and the content presentation level. The experiment demonstrates that student learning outcomes have improved as the failure rate decreases and the percentage of students achieving high grades increases. This evidence reinforces the educational value of adaptive content delivery and motivated comparing system-driven personalization with learner-controlled and mixed approaches to determine their influences on usability, engagement, and learning outcomes.
Detecting students’ personalities, in addition to other personal information, was the focus of the research aimed at developing a chatbot capable of collecting additional personal information about learners and utilizing it for educational recommender systems [
13]. This chatbot connects to a database that collects, stores, and updates learners’ personal information, including demographic data, culture, and personality traits, during conversations, as well as data from their prior learning experiences. A learning avatar is generated using the learner’s knowledge and characteristics. It can select relevant learning content from course materials, conduct quizzes to evaluate understanding, and offer feedback.
PMTutor [
38] is an AI-driven, personalized adaptive learning (PAL) chatbot designed to train users in project management. It adjusts to each learner’s characteristics and progress, providing tailored feedback during task-based activities. Usability and user experience were evaluated with the System Usability Scale (SUS). Additionally, it examined learner engagement and achievement through interactive tasks and feedback loops included within PMTutor. The results offer initial evidence that personalization improved both usability and learning outcomes. Learners showed a high level of satisfaction, engagement, and usability with scores between “good” and “excellent”.
An AI-supported educational chatbot was developed as an interactive learning platform to provide tailored instructional assistance and self-paced learning sessions for STEM students [
39]. The chatbot works as a conversational tutor that offers adaptive guidance, delivers explanations, and responds to learner queries in real time. To evaluate perceived usability, the System Usability Scale (SUS) was used alongside student-experience measures assessing satisfaction, ease of use, and willingness to continue using the system for academic support. The study found that the chatbot achieved satisfactory usability ratings and fostered positive user experiences, suggesting that personalized learning can enhance students’ perceptions of learning platforms. This demonstrates the relevance of usability and learner-experience metrics in evaluating personalized chatbot-based instruction.
An adaptive e-learning system was developed to enhance programming problem-solving skills among high school students by tailoring instructional activities according to learner proficiency levels [
40]. The system, named NgodingSeru.com, integrates adaptive mechanisms and gamification features to adjust the difficulty of learning tasks based on students’ progress and performance. It employed a pre-test/post-test design to measure students’ learning gains. It also used a qualitative analysis of learner perceptions and motivational experiences while using the platform. The findings showed improvements in students’ programming problem-solving skills and indicated that the adaptive, gamified environment contributed positively to learner motivation and engagement. These results highlight the pedagogical value of personalization in education, introduce the concept of tasks with varying difficulty levels, and support the use of learning outcomes and engagement in the present study.
A weighted composite metric was introduced to assess user experience in an educational chatbot called Tayseer [
31]. It evaluated the usability, engagement, efficiency, and effectiveness of three interaction modes (text-based, menu-based, and hybrid) across three levels of task complexity (simple, intermediate, and complex). Usability was measured with the Chatbot Usability Questionnaire (CUQ), engagement with the User Engagement Scale–Short Form (UES-SF), effectiveness through error rates, and efficiency with response times. These findings highlight the value of multidimensional evaluation and explicitly demonstrate that question complexity and UX dimensions should be jointly considered when assessing educational chatbots, aligning with the present study’s focus on usability, engagement, and learning success across different task difficulty levels.
A recent review analyzed empirical research on generative AI chatbots within higher education and reported that they are commonly assessed through learning-performance indicators, behavioral engagement metrics, and user-experience measures [
41]. It also showed that generative chatbots can enhance reasoning, formative assessment, and self-directed learning, but their output variability poses challenges for controlled experimentation. It further highlighted that such systems are increasingly used as conversational tutors to scaffold conceptual reasoning, provide adaptive explanations, and support problem-solving tasks in university-level courses.
Another review synthesized evidence concerning AI-based educational chatbots and indicated that the majority of these systems are employed to deliver instructional assistance, automate formative quizzes, provide contextual guidance, and support personalized learning pathways [
42]. It emphasized that learning gains, engagement indices, and satisfaction ratings are the most frequently used evaluation criteria for evaluating chatbot effectiveness. It has been reported that numerous educational chatbots integrate data-driven personalization mechanisms, and their effectiveness is frequently evaluated through improvements in post-test scores, perceived usability, and student engagement patterns.
Overall, previous studies have shown that system usability, students’ level of engagement, and their learning outcomes can be improved when instruction is tailored to individual learner characteristics. Recent evaluations of generative and large language model (LLM)-based educational chatbots consistently demonstrate that personalization remains a fundamental aspect of chatbot effectiveness, with systems commonly evaluated using metrics including learning gains, engagement indicators, satisfaction ratings, and user experience measures. However, while these studies emphasize adaptive personalization and data-driven tailoring, there remains little empirical work that systematically compares different personalization modes, particularly learner-controlled (adaptable) and hybrid (mixed) approaches, under unified experimental conditions and across varying task complexity levels. Moreover, despite a growing interest in chatbots in other languages, research on Arabic educational chatbots remains unexplored. To address these gaps, this study examines various personalization approaches (adaptive, adaptable, and mixed) and a static learning approach used by Moalemy, an Arabic rule-based educational chatbot. It explores how each learning approach impacts usability, learner engagement, and learning outcomes across varying task complexities.
The current review of the related work is non-systematic; therefore, to reduce study bias and improve the reproducibility of the findings, future research should employ a systematic methodology.
2.3. Research Gap
Despite growing interest in personalization in e-learning, prior work has mainly focused on system-driven adaptive models that automatically tailor learning content based on learner performance. Far less attention has been paid to learner-controlled (adaptable) or shared-control (mixed) approaches, which differ in how responsibility for content selection is distributed between the system and the learner. These distinctions are emphasized in personalization and educational technology frameworks, yet comparative empirical studies that examine these modes side by side remain limited. In addition, research on Arabic educational chatbots remains scarce, particularly regarding personalized learning and task-level complexity. To address these gaps, this study evaluates four learning approaches that represent progressive levels of personalization control: static (no adaptation), adaptive (system-driven targeting of weak topics), adaptable (full learner autonomy), and mixed (shared control). Implementing these approaches within Moalemy, a rule-based Arabic educational chatbot, provides a structured basis for examining how different personalization mechanisms influence usability, engagement, and learning outcomes across varying levels of task difficulty.
2.4. Research Objectives and Contributions
This study builds on previous research about the Moalemy chatbot by comparing its four versions, each representing a different learning method (static, adaptive, adaptable, and mixed). It also performs multilevel analysis of how personalization influences task complexity (easy, medium, and hard) and provides a comprehensive assessment of usability, engagement, and learning outcomes. Exploring the Arabic learning environment, which is often considered a low-resource learning environment, this study would help to enhance our understanding of the positive effects of personalization on the learning process and contribute to the design of more user-friendly Arabic educational chatbots. Furthermore, the study enhances understanding by systematically comparing system-, learner-, and shared-control personalization within a unified experimental framework.
3. Materials and Methods
To implement this study, a system called Moalemy was used as the experimental platform to perform a user experiment in which learners used the four system conditions. Each system condition presents the learning contents according to the learning methods. During the experiment, multiple variables were computed to evaluate the impacts of these four methods on learner performance and engagement, as well as system usability, across three levels of task complexity. The study methodology is represented in
Figure 1.
3.1. Moalemy Architecture
Moalemy stands for teacher in Arabic, “معلمي”, is a rule-based educational chatbot designed to deliver learning content in Arabic as tasks. The system is developed using a three-tier architecture with Next.js (v 15)for the frontend, Django (v 4.0) for the backend, and MongoDB (v 8.0.17) for the database (
Figure 2). Integrating Django and MongoDB enables the system to process pretest results and customize learning paths by applying predefined rule-based conditions to assign appropriate content. Next.js ensures that the frontend dynamically reflects these rules by displaying the course content according to the chosen learning approach. All decision and feedback processes follow predefined rule-based conditions, meaning that the system responds deterministically to the learner’s choice of the learning approach. While the number of tasks may vary across learners due to differences in topic selection or pre-test performance, the underlying rules that govern task presentation and feedback remain constant for users within the same learning condition, supporting the reproducibility of the experimental design. The complete technical design of the system was detailed in a previous publication [
14].
3.2. Database Structure
The learning content was collected from the Introduction to Computer Science course used at King Khalid University. The course is divided into topics and subtopics that cover multiple areas of computer science, including networks, e-learning, and more. Moalemy’s database is built by creating a task for each subtopic, drawing on ongoing teaching experience and consulting domain experts and faculty members. All learning tasks are stored in a structured content repository. Each task is represented by a key-value pair, where values represent the related topic, the task text, the multiple options, the correct answer, the difficulty level, and an explanation of the task. Task difficulty was determined through an expert-review process in which five domain experts and five non-experts independently categorized each item as easy, medium, or hard from their perspective using the following predefined guidelines:
Easy: Straightforward questions that require minimal mental effort and can be answered quickly without reading all multiple-choice options.
Medium: Questions that need a moderate amount of mental effort and can be answered quickly after briefly reviewing the available choices.
Hard: Questions that demand higher-level reasoning involve more complex processing and typically require more time to answer after examining the choices.
This dual review by experts and non-experts ensured that difficulty classification reflected both pedagogical expectations and perceived learner challenge.
Table 1 shows examples of three tasks with different levels of difficulty. When a learner submits a response, the system compares it with the stored corrected answer to determine whether it is correct. Then it provides feedback with an additional explanation of the task.
3.3. Tests Creation
Learner performance was assessed before and after the learning session using a pre-test and a post-test [
22,
23]. The number of questions for these tests was set at 10, considering the experimental conditions and students’ time and effort. A proportional stratified approach was used to determine the number of questions to be selected from each topic and level [
43,
44]. These ten questions were selected based on both the topic and difficulty level through expert consultation, with no formal psychometric validation.
3.4. Personalization Logic
The four learning methods examined in this study were implemented directly within Moalemy’s. Apart from how the next task is chosen, the content, feedback structure, and scoring remain identical across all conditions. The system adaptation is at the topic level, where the displayed topic’s tasks are based on the learning methods. The following are the main differences between the learning methods:
Static: Learners receive all course content tasks in the same traditional topic sequence, without adaptation.
Adaptive: The system automatically displayed only tasks of topics with low scores (weak chapters) based on the learner’s performance at the pre-test. The chapter is considered weak if the student answers at least one question incorrectly in the pre-test.
Adaptable: Learners can freely choose which course topic/topics to learn from the available list.
Mixed: The system first presents tasks of weak chapters based on learner performance in the pre-test, then the learner can select topic/topics of their interest. This method combines adaptive and adaptable methods, which creates a shared-control model between the learner and the system.
Throughout the interaction, Moalemy logs each learner’s activity, including task attempts, accuracy, completion, and time spent. These records form the basis for the metrics analyzed in the study, including learning gain, relative learning gain, efficiency, effectiveness, engagement, usability, and satisfaction.
3.5. Sample Size and Type
The user experiment involved 62 subjects; in the Moalemy development phase, 10 participants evaluated the complexity levels of learning tasks. The remaining 52 subjects participated in the user experiment after excluding three students due to missing information. All of them were female students at the diploma level of the Applied College at King Khalid University. They are from two different programs: 24 from the Technology and Engineering program and 28 from the Business and Humanities program. These programs are for students who have graduated from high school, ensuring a consistent academic background and mitigating variations in gender, age, and study level. The experiment’s constraints, such as student availability, determined the sample size rather than conducting a formal power analysis. Nevertheless, the final sample of 52 participants aligns with the standard sample sizes reported in similar studies in HCI and learning technology [
45,
46]. It was also considered appropriate for conducting within-subjects comparisons across the four experimental approaches.
3.6. Experiment Design and Procedures
The experiment took place in the girls’ section of the Applied College at King Khalid University. Each student took around one hour to complete the learning session; therefore, students are allowed to experiment at their convenience. A within-subjects design is used, with all participants using the system with the four learning methods (adaptive, adaptable, mixed, and static). The selection of this design was made for its efficiency and suitability for identifying relationships among variables with a moderate sample size [
27]. Since the same participants experienced all experimental conditions, individual differences in cognitive ability or prior experience were naturally controlled, which improved the design’s statistical sensitivity. A primary limitation of this design is the potential for carryover effects, such as practice or order effects, where experiencing initial conditions might affect student performance in later ones [
47,
48]. To reduce the carryover effect, counterbalancing was implemented by generating and randomly assigning all 24 possible permutations of the four condition orders to participants before the learning session began. This process ensures that each learning approach appears equally often in every position [
48]. These approaches were assigned to students randomly before starting the learning sessions to avoid any biases in sampling and selection procedures [
47]. Furthermore, both pre-tests and post-tests were conducted in the same experiment session, right preceding and following the tutoring session, which assists in capturing short-term learning enhancements and reducing the influence of outside factors. These procedures of counterbalancing and time-controlling helped in minimizing systematic bias and ensuring that the variations in learner performance, engagement, or usability were driven by the learning approach rather than by experimental artifacts.
3.7. Experiment Task
Participants are required to use the system for learning under all four personalization approaches, one at a time. To avoid ordering effects and maintain blinding, each student was initially assigned an alphabetical code (A, B, C, D) randomly, which determined the sequence in which they would experience the four learning methods. The letters corresponded to a version of Moalemy: A for static, B for adaptive, C for adaptable, and D for mixed. Blinding here means that students were not informed of the underlying learning method associated with each version; instead, they interacted with the system without knowing whether the tutoring process was static, adaptive, adaptable, or mixed. Students began with the first assigned approach, as shown in
Figure 3, and the learning content was delivered according to that method. After completing the learning session for one approach, participants returned to the home page and selected the next method in their assigned order, continuing until all four approaches had been completed. The interaction flow between Moalemy and the learner is illustrated in
Figure 4. This diagram summarizes the step-by-step process that is followed consistently across all four learning modes.
3.8. Evaluation Instruments
To assess user interaction across the four learning approaches, several complementary measurement instruments were used.
Moalemy automatically recorded user interaction, including login data, task completion time and status, error counts, and pre- and post-test scores.
Direct observation confirmed compliance with the assigned condition sequences and verified the accuracy of the time-based data.
A survey was conducted with 10 participants, five experts, and five students, to categorize tasks into easy, medium, and hard levels, ensuring task content validity.
Perceived usability was measured using a modified System Usability Scale (SUS) administered after each learning approach [
33]. The modified SUS includes a 10-item scale tailored to system conditions, scored on a 5-point Likert scale and using the original scoring method (0–100). Internal consistency and construct validity of the SUS items were verified using Cronbach’s alpha, the Kaiser–Meyer–Olkin (KMO) measure, Bartlett’s test of sphericity, and Exploratory Factor Analysis (EFA).
A five-item satisfaction survey was conducted after all four learning sessions to compare their perceived ease of use, effectiveness, satisfaction, efficiency, and overall preference. This survey was adapted from the SUS [
33], the Technology Acceptance Model (TAM) [
49], and comparative usability evaluation guidelines [
50]. Two faculty experts reviewed the survey to ensure content validity. Reliability and construct validity were similarly confirmed using Cronbach’s alpha, Spearman’s correlations, and EFA.
3.9. Measured Variables
In this study, each participant used all four learning approaches (static, adaptive, adaptable, and mixed), and the system recorded the relevant variables for every task completed. All learning tasks in Moalemy were pre-classified into three difficulty levels (easy, medium, hard), independent of the learning method. As students progressed through each approach, the system captured their performance data, engagement indicators, and usability-related measures for every task they attempted. During the analysis phase, these data were aggregated for each student by learning method and task difficulty.
The study, therefore, included two independent variables: (1) the four learning approaches and (2) the three levels of task complexity. The dependent variables were defined as follows:
Learning success was assessed using pre- and post-test scores to calculate both the learning gain and the relative learning gain [
22,
23]. The learning gain (LG) quantifies the direct improvement in student knowledge by comparing test scores before and after the tutoring session [
32]. It was computed using Equation (1) as a value out of 10 [
14,
23,
51]. The relative learning gain (RLG) represents the percentage of possible improvement achieved by each student, providing a normalized indicator of progress. It was calculated as shown in Equation (2), producing a value out of 100 that reflects the average proportion of learning improvement relative to each participant’s starting point [
14,
22]. These metrics quantify both the magnitude and efficiency of knowledge acquisition for each learning approach.
where
PostTest Score: The assessment results after the tutoring session.
PreTest Score: The assessment results before the tutoring session.
Maximum Score: The full score (10).
- 2.
Engagement:
Student engagement was derived from system log data, capturing the assigned tasks, completed tasks, and recorded errors. To ensure comparability across learning conditions with differing task counts, engagement was conceptualized as a combined indicator of persistence and accuracy [
14]. Persistence was measured as the proportion of completed tasks relative to those assigned (Equation (4)), while accuracy was obtained by subtracting the error rate from one, where the error rate represents the ratio of incorrect responses to total completed tasks (Equation (5)). Engagement was then computed as the multiplication of persistence and accuracy (Equation (3)), resulting in a value between 0 and 1, with higher scores indicating stronger behavioral engagement. This composite formulation captures both sustained participation and correctness, aligning with recent studies that advocate for performance-based measures of engagement rather than simple interaction frequency [
26,
34,
35].
where
Considering that engagement is theoretically associated with learning success, an initial construct validation was performed by analyzing the correlations between engagement and the two indicators of learning success utilized in this study: learning gain (LG) and relative learning gain (RLG).
- 3.
Usability:
Usability was assessed using both objective performance indicators and subjective evaluations, in accordance with ISO 9241-11 guidelines.
Effectiveness was measured as task completion rate, representing the degree to which users achieved their learning goals. Since the number of assigned tasks varied across learners due to pre-test filtering and topic selection, completion rate was used as a proportional indicator of effectiveness rather than raw task count. Equation (4) is used to evaluate effectiveness as a scale between 0 and 1, where a higher completeness rate implies higher effectiveness.
Efficiency captures the trade-off between task speed and accuracy, wherein speed is quantified by the number of completed tasks per minute, and accuracy is computed by subtracting the error rate from one (Equation (6)) [
14]. Since efficiency is about keeping resource use low, higher values indicate faster, more accurate task completion.
Satisfaction was quantified using the five-item comparative survey, producing a normalized score between 0 and 1 to reflect each approach’s perceived favorability [
14]. The total count of users’ selections per approach (ranging from 0 to 5) was calculated across the five questions, representing the number of times a given approach was preferred. Then, it is divided by 5 to obtain a rate between 0 and 1.
Perceived usability was assessed subjectively with a slightly modified version of the System Usability Scale (SUS) [
33]. The instrument comprises ten statements rated on a 5-point Likert scale ranging from 1 (Strongly Disagree) to 5 (Strongly Agree). Each participant’s responses were converted into standardized SUS scores following the conventional scoring procedure: for positively phrased items, one point was subtracted from the original rating, whereas for negatively worded items, the rating was subtracted from five. The adjusted values were then summed and multiplied by 2.5 to produce an overall score between 0 and 100 by Equation (7) [
33]. In line with established usability benchmarks, scores above 68 indicate better-than-average usability, whereas lower scores suggest potential design or interaction issues.
These metrics were selected because they collectively represent core dimensions of user experience in educational technologies, as recommended in prior HCI and learning analytics research [
31]. Learning success is widely regarded as a primary indicator of instructional effectiveness and student progress in technology-enhanced environments, commonly measured through learning gain and relative learning gain to quantify knowledge improvement [
22,
23,
32]. Usability is a foundational HCI criterion for evaluating interactive systems, including educational chatbots, and is typically examined through effectiveness, efficiency, and satisfaction to reflect the extent to which a system enables users to achieve their goals [
28,
30]. Student engagement is also recognized as a critical determinant of user experience quality, as it reflects persistence and cognitive effort during the learning process [
24,
26]. Considering these three complementary dimensions, learning success, usability, and engagement, provides a holistic user-experience perspective and enables a more comprehensive evaluation of how different personalization approaches influence both interaction quality and educational outcomes within Moalemy.
3.10. Statistical Techniques
The study utilized SPSS (version 31) and Microsoft Excel as data analysis tools. The study computed descriptive statistics, including mean, standard deviation, median, minimum, and maximum values, to evaluate all variables. After that, a 4 × 3 ANOVA was performed to test whether the differences in calculated variables across methods and levels were statistically significant. Differences in subjective measures, including SUS and satisfaction ratings, were analyzed using the Friedman test as a non-parametric alternative to repeated-measures ANOVA. When significant effects were identified, post hoc pairwise comparisons were conducted using the paired t-test. Before inferential testing, statistical assumptions were examined through the Shapiro–Wilk test for normality and Mauchly’s test for sphericity. Where violations occurred, the Greenhouse–Geisser correction or suitable non-parametric procedures were applied to ensure analytical robustness. All survey responses were automatically collected through the system or Google Forms, anonymized, and exported for analysis. Graphical techniques were also employed to improve the visualization of trends across learning conditions.
4. Results
4.1. Learning Success
First, descriptive statistics are computed to compare the means, standard deviations, medians, minimums, and maximums across the four approaches (static, adaptive, adaptable, and mixed). A repeated-measures ANOVA is conducted to test whether differences among the four methods are statistically significant. The differences in learning gain and relative learning gain across the four learning approaches are shown in
Figure 5.
4.1.1. Learning Gain
According to the descriptive statistics in
Table 2, the static method yielded the highest mean learning gain (3.00 ± 1.98), followed closely by the mixed method (2.92 ± 1.95), the adaptable method (2.67 ± 2.41), and the adaptive method (2.58 ± 2.31). Despite minor variations, all four methods shared a median of 3.00, indicating a central tendency toward moderate learning gain. The adaptable and static methods demonstrated the highest maximum (7.00), whereas the adaptive method showed the lowest minimum score (−5.00), reflecting variability in student progress.
Before performing the ANOVA, the assumptions of normality and sphericity were examined. Mauchly’s test revealed a violation of the sphericity, leading to the use of the Greenhouse–Geisser correction. Shapiro–Wilk tests showed that the learning gain deviated from normality for most methods (p < 0.05). Given the sample size (n = 52) and the balanced within-subjects design, repeated-measures ANOVA was suitable, as it remains robust despite moderate violations of normality. A repeated-measures ANOVA indicated that the learning method’s impact on performance was not statistically significant, F(2.56, 130.47) = 0.90, p = 0.429, η2p= 0.017. The small effect size suggests that only 1.7% of the variance in learning gains is driven by the tutoring method, and the differences in average performance scores among the four methods were not significant. Overall, although there are some descriptive differences, none of the methods significantly outperformed the others in terms of learning gains.
4.1.2. Relative Learning Gain
Descriptive analyses (
Table 3) revealed that the static method had the highest average RLG (63.75 ± 39.56), followed by the mixed method (60.33 ± 39.81), the adaptable method (54.40 ± 49.19), and the adaptive method (51.29 ± 56.63). Median scores also favored static (75.00) over other methods, while adaptive had the lowest minimum score (−167.00), indicating greater variability.
Before performing the ANOVA, the assumptions of normality and sphericity were examined. Mauchly’s test revealed a violation of sphericity, leading to the application of the Greenhouse–Geisser correction. Shapiro–Wilk tests showed that the relative learning gain deviated from normality. Given the sample size (n = 52) and balanced within-subjects design, repeated-measures ANOVA was performed, as it is robust to moderate violations of normality. ANOVA showed no significant effect of learning method on RLG, F(2.50, 127.58) = 1.26, p = 0.289, η2p = 0.024, suggesting a small practical difference in relative learning gain across the four learning approaches. These findings indicate that although there were observable differences in central tendency and variability, these differences were not statistically significant across methods.
It was observed that all minimum values of both LG and RLG across all methods were negative, as expected when a student achieved a lower score on the post-test than on the pre-test. These values may reflect partial guessing during the pre-test, uneven familiarity with the topics, or cognitive overload during learning sessions. Because the ANOVA results did not show statistically significant differences in LG and RLG across learning methods, negative values were interpreted as natural learner variability rather than as indicators of method weakness.
4.2. Engagement
The correlation between engagement and learning success showed significant positive correlations with LG (r = 0.350,
p < 0.001) and RLG (r = 0.404,
p < 0.001), indicating that students with higher engagement demonstrated greater learning improvement. These associations are consistent with the theoretical relationship between engagement and learning success and provide preliminary construct validity support for the behavioral engagement index. To measure engagement across four learning approaches with varying levels of task complexity, descriptive statistics are computed at two levels: the learning method level and the task level (
Table 4,
Figure 6). Afterward, a repeated-measures ANOVA is conducted to test whether any differences in engagement scores are statistically meaningful.
Descriptive results show comparable engagement across learning methods, with mean scores ranging from 0.55 (static) to 0.66 (adaptable), and moderate variability between 0.18 and 0.25. The adaptable method achieved the highest overall engagement (0.66 ± 0.21), with a median value of 0.67, indicating that learners showed slightly higher engagement levels when learning with the adaptable version. The static and adaptive methods achieved mean values of (0.55). Additionally, the mixed method reported a moderately high engagement (0.59 ± 0.22), which falls between the adaptive and adaptable methods.
Going deeper across levels, all methods exhibit comparable performance at simpler tasks; however, the adaptable method was the best with (0.78 ± 0.24), followed by the mixed method with (0.65 ± 0.22). At the medium level, performance declined slightly across methods, but adaptable (0.63 ± 0.25) and mixed (0.58 ± 0.24) remained superior, demonstrating that personalized strategies continue to support engagement and performance as task demands increase. At the hard level, all methods showed further reductions in mean scores, reflecting the increased cognitive load; nonetheless, adaptable (0.53 ± 0.35) and mixed (0.51 ± 0.28) maintained higher means than static (0.47 ± 0.22) and adaptive (0.49 ± 0.30).
The assumptions of normality and sphericity were examined before conducting the ANOVA. Shapiro–Wilk tests revealed that engagement residual distributions were normal across most conditions (all p > 0.05), except in the adaptive-hard condition (p = 0.002) and the adaptable-easy and adaptable-hard conditions (p < 0.001); therefore, a repeated-measures ANOVA was applied. Regarding sphericity, Mauchly’s test indicated that it was met for both method and level but violated for the method × level interaction; therefore, the Greenhouse–Geisser correction was applied.
A repeated-measures ANOVA showed a significant main effect of method, F(3, 153) = 6.32, p < 0.001, η2p = 0.110, indicating a moderate effect size, with engagement differing meaningfully across the four learning approaches. Bonferroni-adjusted pairwise comparisons revealed significant differences among the learning methods, with the adaptable method exhibiting higher engagement than the static and adaptive methods (p < 0.05). In contrast, no pairwise differences between methods were statistically significant (all p > 0.05). A significant main effect of level was observed, F(2, 102) = 41.15, p < 0.001, with a large effect size (η2p = 0.447), indicating that task difficulty had a strong, practically meaningful influence on engagement. Pairwise comparisons revealed that engagement was highest for easy tasks (M = 0.66), followed by medium (M = 0.57) and hard (M = 0.50), with all pairwise comparisons significant at p < 0.001, showing that engagement decreased as task difficulty increased. The method × level interaction was not statistically significant, F(4.18, 213.34) = 1.64, p = 0.162, and the small effect size (η2p = 0.031) indicates that differences in engagement across task levels did not differ meaningfully by learning method. Given that the engagement metric is a composite indicator rather than a validated scale, these differences should be interpreted as statistically detectable trends within this operational definition of engagement, rather than as evidence of broader behavioral or psychological superiority.
4.3. Usability
Subjective and objective measures were utilized to examine the three usability attributes (effectiveness, efficiency, and satisfaction).
4.3.1. Effectiveness
First, descriptive statistics are computed at the method level to compare effectiveness across the four learning methods, and then the analysis proceeds to the task level (
Table 5). Subsequently, a repeated-measures ANOVA is conducted to assess whether observed differences are statistically significant.
Descriptive analysis revealed that the static and adaptable methods achieved the highest average effectiveness with (0.97) and (0.97), respectively; the mixed (0.95 ± 0.16) and adaptive (0.93 ± 0.20) methods were slightly lower. The adaptable method also showed relatively low variability (SD = 0.15), indicating consistently strong performance across learners. The static method exhibited the lowest overall variability (SD = 0.08), suggesting high stability in learner performance across different difficulty levels.
Across all methods, effectiveness declined as task difficulty increased. All methods demonstrated high task completion rates in easy and medium tasks (mean ≥ 0.94). Easy tasks consistently produced the highest scores (0.95–0.98), medium tasks showed slightly lower performance (0.94–0.97), and hard tasks resulted in the lowest means (0.90–0.96) with increased variability. The adaptive method showed the largest drop from easy to hard tasks, whereas the static and adaptable methods demonstrated more stable performance across difficulty levels. Medians across all conditions were at or near 1.00, indicating a potential ceiling effect.
Regarding sphericity, Mauchly’s test indicated violations for all within-subjects effects; accordingly, the Greenhouse–Geisser correction was applied. Shapiro–Wilk tests showed that effectiveness residuals deviated from normality across most conditions; therefore, given the within-subjects design and sample size, and because Greenhouse–Geisser corrections were applied for sphericity violations, the repeated-measures ANOVA is considered robust.
ANOVA demonstrated no statistically significant main effect of learning method, F(2.27, 115.62) = 1.32, p = 0.271, and the very small effect size (η2p = 0.025) indicates that effectiveness did not differ meaningfully across learning methods, confirming that no approach yielded a statistically or practically superior level of task completion. In contrast, a significant main effect of task level was observed, F(1.18, 60.21) = 8.22, p = 0.004, with a moderate effect size (η2p = 0.139), indicating that effectiveness varied meaningfully across task difficulty levels. Bonferroni-adjusted pairwise comparisons revealed that medium tasks were completed significantly more effectively than hard tasks (p = 0.014), and easy tasks were also considerably more effective than hard tasks (p = 0.014). The difference between easy and medium tasks was not significant (p = 0.176). These results indicate that learners performed substantially better on easy and medium tasks compared to hard tasks, whereas performance between easy and medium tasks remained statistically comparable. The method × task-level combination was not statistically significant, F(2.80, 142.90) = 0.72, p = 0.531, η2p = 0.014, indicating a small effect size and suggesting that the impact of learning method on effectiveness did not vary across task levels. As a result, any observed differences between methods at specific task levels were interpreted as descriptive rather than statistically meaningful.
4.3.2. Efficiency
First, efficiency scores across four learning methods are compared, then across three difficulty levels within each method, using descriptive statistics (
Table 6). Subsequently, to assess whether any observed differences are statistically significant, an ANOVA is performed.
Descriptive results revealed comparable efficiency scores across the four learning methods. The mixed method recorded the highest overall efficiency (5.92 ± 3.07), followed closely by the adaptable method (5.87 ± 3.58) and the static method (5.67 ± 3.55). The adaptive method showed a slightly lower overall mean (5.54 ± 3.88). The differences between methods were minor, suggesting that all four approaches achieved relatively similar efficiency levels.
Across levels, at easy tasks, the adaptive method was the most efficient (5.68), followed by the adaptable method (5.50), indicating that personalization could enhance efficiency at simpler tasks. On medium tasks, means were increased across most methods, but the adaptable method was the most efficient (6.20), followed by the mixed method (5.97). On harder tasks, the performance of the adaptable method decreased, in contrast to other methods, where it increased, with the adaptive method achieving the highest rate of efficiency (6.97). It was observed that the standard deviations were high across both adaptive and static methods in hard tasks, indicating that as the task difficulty levels increased, the variability in student performance also increased. It was noticed that the median values along all methods consistently ranged from 2.32 to 5.75.
Before performing the ANOVA, the assumptions of normality and sphericity were examined. Mauchly’s test of sphericity revealed violations for all within-subject effects (method, level, and method × level). Accordingly, the Huynh–Feldt correction was applied for the method, while the Greenhouse–Geisser correction was used for level and method × level. Regarding normality, Shapiro–Wilk tests indicated deviations in several conditions (p < 0.05); however, with a sample size of 52 and corrections for sphericity violations, the ANOVA is considered robust to such violations.
Repeated-measures ANOVA revealed that the method main effects were not statistically significant, F(2.75, 140.13) = 0.34, p = 0.779, η2p = 0.007. The very small effect size suggests that the choice of learning method had a small practical influence on efficiency outcomes, indicating efficiency remained comparable across all four approaches. The main effect of level was significant, F(1.47, 74.99) = 3.56, p = 0.047, η2p = 0.065. The effect size was small to moderate, suggesting a measurable, though not large, influence of task difficulty on efficiency, with efficiency varying across levels of task difficulty. However, Post Hoc Bonferroni-adjusted pairwise comparisons revealed that the differences between task levels did not reach statistical significance (all p > 0.05), although a near-significant but weak trend was observed between the easy and hard levels (p = 0.096), indicating slightly lower efficiency at higher difficulty levels. Notably, the method × level interaction was also significant, F(3.64, 185.78) = 3.48, p = 0.011, with size was small to moderate (η2p = 0.064), showing that efficiency patterns varied across task levels under different learning methods. However, Bonferroni-adjusted pairwise comparisons revealed no statistically significant differences between methods at any task level (all p > 0.05). Although descriptive mean comparisons showed minor variations across methods at the hard level, where adaptive and static methods had slightly higher average efficiency scores and the adaptable method showed a lower average, these variations did not reach statistical significance. Accordingly, these observations should be interpreted solely as descriptive patterns rather than evidence that any method maintains higher efficiency under increased task difficulty.
4.3.3. Satisfaction
User satisfaction was evaluated through a within-subject survey comprising five items assessing participants’ preferences among the four learning methods. The survey items demonstrated moderate internal consistency (Cronbach’s α = 0.65). All items showed positive item–total correlations (ρ ≈ 0.40–0.60), and the inter-item correlations ranged between 0.30 and 0.65. Factor analysis indicated that all items loaded on one factor (0.55–0.73), confirming a unidimensional structure and supporting the scale’s overall validity.
First, means and standard deviations are computed to compare the four methods across the five dimensions. For each item, the frequencies and percentages of users who selected a specific method are calculated (
Table 7). Then, a Friedman test was used to examine whether there were statistically notable differences in ranked preferences across methods.
Descriptive analysis of participant preferences across five comparative survey questions showed that the adaptable, mixed, and static methods had similar average preferences at (0.25 ± 0.05), (0.25 ± 0.03), and (0.25 ± 0.07), respectively, slightly higher than the adaptive method, which was chosen in (0.23 ± 0.04) responses. These findings indicate relatively balanced preferences across all four methods. However, static and adaptable were selected more frequently on some questions, suggesting moderate variability in participants’ satisfaction across tasks or contexts. Since the satisfaction survey data were ordinal, the Friedman test, a nonparametric test, was used instead of parametric alternatives to examine whether there were significant differences in preference rankings among the four learning methods, based on combined data from five survey items. The test showed no significant differences in method preference, χ2(3) = 0.26, p = 0.97. Kendall’s W was 0.0017, indicating a small effect size and suggesting that participants did not exhibit a systematic or consistent preference for any one learning method.
Frequencies and percentages were used to provide descriptive insight into users’ selections across satisfaction dimensions. Descriptive results showed that more than 30% of users believe the adaptable method is the most efficient and easiest to use, followed by mixed methods, which showed similar levels of preference. In contrast, more than 30% of users perceive that the static method is both effective and overall preferred, while the adaptive method is seen as more satisfying, followed by the mixed method. These distributions reflect general tendencies in user choices rather than statistically significant differences, as the satisfaction items were used only to illustrate the frequency with which each method was favored across the evaluated dimensions.
4.3.4. Perceived Usability
First, the reliability and construct validity of the SUS used were examined; the results revealed a Cronbach’s alpha = 0.78, indicating good internal consistency, and item–total correlations ranging between 0.42 and 0.68. The KMO value (0.79) and Bartlett’s test (χ2(45) = 312.4, p < 0.001) verified that the data were appropriate for factor analysis. EFA produced a single-factor structure, with all items loading above 0.55, supporting the reliability and construct validity of the adapted SUS.
Descriptive statistics for the SUS are presented for the four learning methods (
Table 8). The users’ perceived usability scores are then analyzed using the Friedman test to determine whether differences across the four learning approaches are statistically significant.
Descriptive statistics revealed that the adaptable method achieved the highest average SUS score (75.24 ± 14.63), with a median of 77.50, followed by the mixed method (73.13 ± 17.01) with a median of 75.00, and then the adaptive method (69.81 ± 19.23) with a median of 71.25. The static method received the lowest usability ratings (68.37 ± 18.48) with a median of 67.50. These results suggest a practical trend toward adaptable and mixed approaches in terms of perceived usability. The Friedman test revealed that these minor differences in SUS scores across the four methods are not statistically significant, χ2(3) = 4.92, p = 0.178, with Kendall’s W = 0.032, indicating a small effect size. This suggests that participants did not rate any single learning method as significantly more effective, efficient, and satisfying than the others.
Overall usability analysis across the four learning methods (static, adaptive, adaptable, and mixed) revealed clear patterns (
Figure 7). Descriptively, the adaptable method had the highest mean SUS score and an effectiveness score comparable to that of the static method. Although the static method achieved a relatively high effectiveness, its mean efficiency score was lower. The adaptive method exhibited lower mean satisfaction and effectiveness, with moderate scores on the other metrics. The mixed method demonstrated moderate to high values across several usability dimensions, including efficiency and satisfaction. Satisfaction levels were generally similar across all methods, with only minor descriptive variations.
Crucially, these observations represent descriptive tendencies rather than statistically significant differences. Inferential analyses showed no significant differences in SUS, effectiveness, satisfaction, or efficiency across methods, and effect sizes were negligible. Accordingly, while the adaptable method exhibited a favorable descriptive usability profile, this pattern should not be interpreted as evidence of statistical superiority but rather as an exploratory indication of how users perceived the different learning methods.
4.4. Analyses Summary
The performed multidimensional evaluation compared the impacts of four learning methods across three difficulty levels on various metrics, including learning gain (LG), relative learning gain (RLG), efficiency, engagement, effectiveness, system perceived usability (SUS), and student satisfaction. The descriptive results revealed variation across methods, but inferential analyses showed that most of these differences were not statistically significant. Therefore, the following observations should be interpreted as descriptive tendencies rather than evidence of method superiority.
Descriptively, the adaptive method showed lower mean scores on several metrics, including effectiveness (0.93), efficiency (5.54), satisfaction (0.23), SUS (69.81), and engagement (0.55). These patterns suggest that the level of system-driven adaptation may not have been sufficient to support learner performance within this configuration. The adaptable method displayed a balanced profile, with the highest SUS score (75.24) and engagement value (0.66) and moderate efficiency (5.87). Considering learning success, it enhanced student LG by 2.67 and RLG by 54.40. It matched the static method in effectiveness (0.97) and the mixed and static methods in satisfaction (0.25), but exceeded them in learner engagement and system usability. The mixed approach achieved positive outcomes, with the relatively highest mean score in efficiency (5.92) moderate-to-high LG (2.92) and RLG (60.33) values. It demonstrated a good score in engagement (0.59), SUS (73.13), and satisfaction (0.25). Unfortunately, its effectiveness (0.95) was lower, particularly on hard tasks. While the non-personalized method (static) showed high descriptive effectiveness (0.97) and moderate engagement (0.55), it also had lower efficiency (5.67) and received the lowest SUS score (68.37). In terms of learning outcomes, the static method had the highest descriptive LG (3.00) and RLG (63.75) and satisfaction levels (0.25) comparable to those of the adaptable and mixed methods.
Consistent with the ANOVA results, engagement, effectiveness, and efficiency declined significantly as task difficulty increased, confirming that task level had a statistically significant impact on performance. However, within each level, differences between methods were descriptive rather than statistically supported. Across all difficulty levels, the adaptable method showed higher engagement, as indicated by descriptive data. On easy tasks, the adaptable method showed higher effectiveness values; although these differences were not statistically significant, this suggests it can encourage learners to complete more tasks. In contrast, the adaptive method demonstrated higher descriptive efficiency, with students completing tasks with minimal resources and high accuracy. On medium tasks, both the adaptable and static methods had higher effectiveness scores than the adaptive and mixed methods. In comparison, the adaptable method showed higher descriptive efficiency than other methods. As the task becomes more challenging, the adaptive method demonstrates a high score in efficiency, whereas the static method shows a high score in effectiveness. However, because none of these pairwise differences across methods reached statistical significance, these observations should be interpreted cautiously and viewed as indicative of potential trends rather than conclusive performance differences.
5. Discussion
The comparison of learning approaches using learning gain (LG) and relative learning gain (RLG) showed that the static method achieved slightly higher average gains than the other methods. However, ANOVA analysis results showed that these slight differences were not statistically significant, indicating that no single approach provided a distinct advantage in learning success. Although all methods yielded meaningful improvements, with average LG values above 2.5 points and RLG values above 50%, these improvements reflect the general learning progression associated with using an educational chatbot rather than the effect of any specific learning methods. This is consistent with prior work showing that both personalized and non-personalized chatbot-based learning approaches can support learning improvement [
22], even when the relative differences between learning methods are modest or not statistically significant [
14]. It also aligns with research demonstrating that intelligent tutoring systems and other personalized instructional methods often yield learning gains comparable to those achieved through well-designed non-adaptive approaches, with performance differences frequently small or non-significant [
52]. Collectively, these comparisons indicate that while chatbots improve learning outcomes, personalization methods alone may not produce large performance differences.
Maintaining student engagement and motivation throughout the learning process is critical to the success of e-learning environments [
24,
36]. In this study, the impact of learning approaches on learner engagement was evaluated based on persistence and accuracy indicators [
14]. The findings revealed that adaptable methods produced a significantly higher engagement than both static and adaptive methods, with no significant differences among the remaining pairwise comparisons. Although the adaptable method showed the highest mean engagement, this interpretation should remain cautious because the engagement metric is a composite indicator that has not undergone full psychometric validation. Overall, personalized methods showed slightly higher mean engagement than the static method, but only the differences involving the adaptable method were statistically supported. These results align with previous studies showing that adaptive learning systems enhance user engagement relative to traditional, non-adaptive systems [
14,
36,
53,
54]. It is also consistent with research reporting that giving learners greater control over content selection and navigation enhances behavioral engagement by increasing motivation and interest [
19].
Regarding usability, the four learning methods were assessed across three dimensions: effectiveness, efficiency, and satisfaction [
28,
30,
31]. Descriptive results showed that the adaptable method had numerically higher usability scores, including SUS, effectiveness, and efficiency, while maintaining balanced satisfaction. The mixed method followed closely in most usability metrics, suggesting that shared control between the learner and the system is associated with favorable performance and perceived usability. Although the static method showed numerically high mean effectiveness, its mean efficiency and SUS scores were lower than those of the adaptable and mixed methods. Descriptively, the adaptive method recorded the lowest mean usability values, which may reflect the reduced user control associated with fully automated personalization. However, none of these differences were statistically significant, and therefore these patterns should be interpreted as descriptive tendencies rather than evidence of usability superiority. Collectively, these results suggest that learner-controlled or shared-control approaches (adaptable and mixed) provide the most balanced usability experience, supporting prior research emphasizing the value of adaptive personalization [
14,
22,
31,
54,
55,
56].
A more granular task-level analysis revealed that student engagement varied across task difficulty levels. Descriptive statistics showed that the adaptable method demonstrated the highest engagement across all levels, particularly at the easy and medium levels, where greater autonomy in choosing content may have contributed to higher engagement. This indicates that allowing learners to have control over their learning paths is associated with higher engagement, especially when tasks are cognitively manageable. However, engagement decreased across all learning approaches as task difficulty increased, suggesting that higher cognitive load may reduce learner persistence and interaction. These findings support previous research showing that engagement tends to be stronger when tasks are straightforward, achievable, and allow learners to influence their learning process actively [
14,
31,
57].
Across various usability dimensions, performance patterns varied according to task complexity. The variations in effectiveness and efficiency at the method-level interaction were not statistically significant. Across levels, effectiveness was higher on easier tasks than on harder ones and on medium tasks than on harder ones, with no significant difference between easy and medium tasks. Regarding efficiency, a near-significant trend was observed between the easy and hard levels, with efficiency decreasing as the task level becomes harder. Descriptive statistics showed that the adaptable method achieved the highest efficiency and effectiveness at the easy level, indicating that learner-controlled personalization is associated with more accurate and resource-efficient task completion. At the medium level, the adaptable method remained relatively efficient, while both adaptable and static methods demonstrated numerically higher effectiveness than the adaptive and mixed methods. As task complexity increased, efficiency tended to increase for the adaptive method, whereas the static method showed a numerically higher effectiveness. These patterns reflect general trends in how learners responded to tasks of differing complexity, although none of the method-level interaction differences were statistically significant. Overall, usability appeared to decrease as task difficulty increased, which may reflect the higher cognitive demand associated with more complex tasks, while variations across methods should be interpreted descriptively rather than as indicative of definitive performance advantages [
14,
31,
58].
6. Threats to Validity
Despite the careful preparation and execution of this research, the subsequent challenges to validity must be recognized.
6.1. Internal Validity
The sample size (n = 52) in the user experiment was determined based on participants’ availability, without conducting a priori power analysis, which may have affected the statistical power and limited the generalizability of the results. Future research should conduct a formal power analysis to decide the optimal sample size. Although some variables did not fully meet normality assumptions, the analyses used parametric tests because they are robust in within-subjects designs with balanced samples. To reduce expectancy and bias effects, students were informed only that they would interact with four different versions of the system, without any details about personalization or the study hypotheses. Additionally, the learning methods were labeled with neutral English identifiers (A, B, C, D) rather than the name of the learning approach. Despite these precautions, complete blinding is inherently challenging in within-subject human–computer interaction studies, as exposure to multiple system versions may allow participants to notice differences. Nonetheless, to control individual variability and improve the sensitivity of statistical comparisons, the within-subjects design was chosen. To reduce the potential expectancy effects in future research, the time between the four methods should be increased, or the within-subjects and between-subjects experiment designs may be incorporated.
6.2. External Validity
The participant features, the sample size, and the selection process limited the generalizability of the study. All participants were female diploma students from a single educational institution, which restricts the extent to which the results can be applied to broader populations. Gender-specific learning preferences, cultural norms, and technology-use behaviors may influence perceptions of usability, engagement, and satisfaction, meaning that learners from mixed-gender groups or different cultural contexts may respond differently to the chatbot. Similarly, students at other academic levels or institutions may have varying levels of digital literacy or prior experience that could impact their interaction with the system. Although this relatively homogeneous sample helped reduce variability and provided a controlled environment for testing the learning approaches, it also narrows the scope of applicability of the results. In addition, the modest sample size may have reduced statistical power, making it more difficult to detect subtle differences between learning methods; therefore, non-significant results should be interpreted cautiously. Future studies should include larger, more diverse samples across multiple institutions and academic contexts to enhance representativeness and improve the external validity of the findings.
6.3. Construct Validity
The operational measures used in this study primarily capture behavioral aspects of performance and interaction, which may not fully represent the underlying cognitive or affective processes involved in learning. Metrics such as engagement, efficiency, and effectiveness reflect observable task performance but do not assess higher-order reasoning, long-term knowledge retention, or motivational dynamics that contribute to deeper learning. As a result, the measures may provide an incomplete view of the full learning experience. To strengthen construct validity, the engagement index, derived from persistence and accuracy, was examined in relation to the learning success indicators used in this study. Engagement showed significant positive correlations with both learning gain (LG) and relative learning gain (RLG). These associations are consistent with the theoretical expectation that engagement is related to learning improvement and provide preliminary construct validity support for this behavioral metric. However, the measure has not undergone full psychometric validation, and engagement findings should therefore be interpreted with caution. Future research should incorporate additional instruments to capture cognitive effort, emotional engagement, and subjective feedback, thereby providing a more comprehensive understanding of learner outcomes and enhancing construct validity.


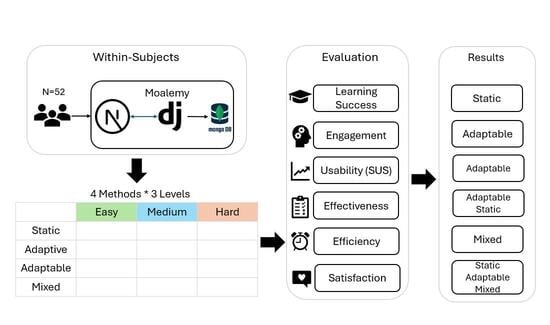


