Article

Domain Adaptation of ECG Signals Using a Fuzzy Energy–Frequency Spectrogram Network

Interdisciplinary Program in IT-Bio Convergence System, Department of Electronics Engineering, Chosun University, Gwangju 61452, Republic of Korea
*
Author to whom correspondence should be addressed.
Appl. Sci. 2025, 15(24), 12909; https://doi.org/10.3390/app152412909
Submission received: 3 November 2025 / Revised: 5 December 2025 / Accepted: 5 December 2025 / Published: 7 December 2025
(This article belongs to the Special Issue Evolutionary Computation in Biomedical Signal Processing)

Abstract

Deep learning has shown strong performance in ECG domain adaptation; however, its decision-making process remains opaque, particularly when operating on input spectrograms. Traditional fuzzy inference offers interpretability but is structurally limited to tabular or multi-channel data, making it difficult to apply directly to single-channel two-dimensional spectrograms. To address this limitation, we propose the Fuzzy Energy–Frequency Spectrogram Network (FEFSN), a new fuzzy–deep learning hybrid framework that enables direct fuzzy rule generation in the spectrogram domain. In FEFSN, the Fuzzy Rule Image Generation Module (FRIGM) decomposes an STFT-transformed ECG spectrogram into multiple energy-based channels using an Energy–density Membership Function (EMF), and then applies a Frequency Membership Function (FMF) to produce AND and OR fuzzy rule images for each energy–frequency combination. The generated rule images are subsequently normalized, activated, and combined through learned weights to form a rule-based domain-adapted spectrogram, which is then processed by a CNN. To evaluate the proposed approach, we used the PhysioNet ECG-ID dataset and compared the performance of a standard CNN with and without the FRIGM under identical training conditions. The results show that FEFSN maintains or slightly improves adaptation performance compared to the baseline CNN, despite introducing only a small number of additional parameters. More importantly, FEFSN provides ante hoc interpretability, allowing direct visualization of which energy–frequency regions were emphasized or suppressed during adaptation—an ability that conventional post hoc methods such as Grad-CAM cannot offer. Overall, FEFSN demonstrates that fuzzy logic can be effectively integrated with deep learning to achieve both reliable performance and transparent, rule-based interpretability in ECG spectrogram domain adaptation.

1. Introduction

Biosignals are electrical or chemical signals generated by the physiological activity of various organs in the human body, including the heart, muscles, and brain. These signals serve as invaluable proxy information, conveying critical health status or emotional states, such as anxiety, tension, or happiness, which are not overtly expressed by the user. In the past, the acquisition of these signals required complex procedures and expensive, specialized equipment, which consequently limited their accessibility across various industries and research fields. However, with the rapid advancements in semiconductor technology and wireless communication systems, biosignals have become readily obtainable through compact wearable devices and mobile systems [1,2]. This advancement enables continuous signal acquisition in daily environments, facilitating applications such as user intent analysis, health monitoring, and personalized healthcare [3,4]. Nevertheless, biosignals collected in real-world settings often suffer from noise contamination, leading to degraded signal quality. Consequently, studies have increasingly focused on preprocessing and deep learning-based domain adaptation methods to transform low-quality signals into high-quality representations [5,6]. Deep learning models can extract nonlinear hierarchical features through multiple layers, demonstrating outstanding performance in classification, prediction, and generation tasks. Although such models have been applied to noise reduction and biosignal domain adaptation, they suffer from limited interpretability—making it difficult to identify which frequency bands contain noise and how specific decision-making processes are carried out within the network. Fuzzy logic, on the other hand, provides rule-based interpretability, allowing the decision-making relationships among features in signal or tabular data to be explicitly understood. For this reason, recent studies have explored hybrid approaches that integrate fuzzy logic with deep learning to achieve both strong performance and explainability [7,8]. Some prior studies decomposed spectrograms into separate frequency bands and applied fuzzy rules to the statistical properties of each band, while others used CNN-extracted high-dimensional vectors as inputs to a fuzzy system. However, no previous work has directly computed pixel-level energy–frequency memberships and generated fuzzy rule images from the raw spectrogram itself. The proposed Fuzzy Energy–Frequency Spectrogram Network (FEFSN) enables such direct rule formation in the input domain, improving interpretability while maintaining (or slightly improving) performance without interfering with the deep learning adaptation process. This allows the model to reveal which energy–frequency combinations contributed to its decision, offering a level of interpretability not attainable by conventional approaches. The one-dimensional ECG (electrocardiogram) signal is first transformed into a two-dimensional time–frequency spectrogram to capture detailed frequency features. Since a single-channel spectrogram cannot generate rules directly, a set of learnable membership functions is introduced to convert it into a multi-channel energy–density representation. Frequency-band membership functions and fuzzy AND/OR operations are then applied to construct rule images, which are aggregated with weighted summation to visualize the energy–frequency regions where the model focuses. These rule-based visualizations are subsequently integrated into the deep learning domain adaptation process, enhancing both model performance and interpretability. The proposed FEFSN extends the applicability of fuzzy systems, which have been traditionally limited to single-channel or tabular data, and demonstrates its potential to improve interpretability and adaptive performance across various biosignal analysis tasks.

2. Related Work

ECG contains information that can be used for various tasks such as detection of cardiac arrhythmia, emotion recognition, and monitoring through wearable devices. Although the ECG signal learned through deep learning shows a high recognition performance, a problem of domain adaptation occurs whereby the performance of signals acquired from other environments or devices is degraded. The following paragraphs are about various studies used for this domain adaptation.
Ye [9] proposed a novel domain adaptation framework to address the performance degradation of ECG-based mental stress detection models when applied to new subjects due to inter-subject variability. Traditional Unsupervised Domain Adaptation (UDA) approaches were limited in handling target data with ambiguous stress boundaries. To overcome this issue, Ye introduced Discriminative Clustering Enhanced Adversarial Domain Adaptation (DC-ADA) and evaluated its performance using three public datasets: WESAD, Driver Stress, and SWELL-KW. The proposed method achieved higher average accuracy across all datasets, demonstrating its effectiveness in mitigating subject-related domain shifts. Li [10] proposed Adaptive ECG Signal Quality Assessment (AdapSQA) to address the performance degradation in wearable ECG monitoring systems caused by inter-patient variability. While conventional models perform well in patient-dependent scenarios, their performance drops significantly when applied to unseen subjects. The proposed method enhances feature adaptability to new patients using an Unsupervised Domain Adaptation strategy. Experiments conducted on the MIT-BIH Arrhythmia Database and MIT-BIH Noise Stress Test Database showed that AdapSQA achieved superior accuracy and efficiency with fewer parameters, making it suitable for deployment on wearable devices.
Tang [11] proposed an ECG-domain Deep Adaptation Network to tackle domain distribution discrepancies and data imbalance in subject-independent sleep stage classification. The method employs Maximum Mean Discrepancy (MMD) for domain alignment to enhance generalization performance across four sleep stages. Evaluation using SHHS1, SHHS2, MESA, and SLPDB datasets demonstrated improved accuracy and discriminative power compared to models without domain alignment. Chen [12] investigated domain adaptation issues in arrhythmia diagnosis and proposed an Unsupervised Domain Adaptation (UDA) framework to alleviate performance degradation across patients. Although deep learning-based ECG classifiers show high accuracy in patient-specific settings, they struggle to generalize to new patients. Experiments on the MIT-BIH dataset confirmed that the proposed method significantly improved prediction accuracy, F1-score, and sensitivity, mitigating data distribution mismatch. Lee [13] proposed an unsupervised and semi-supervised Cross-Domain Adaptation approach to address the sensor-induced domain shift problem in PPG-based biometric recognition. The proposed PPG-MobileNet, a lightweight version of MobileNetV2, utilized CycleGAN for cross-sensor data adaptation. Evaluations on the TROIKA and self-collected PPG datasets demonstrated improved accuracy in all categories, validating the method’s robustness across different sensor environments. Deng [14] proposed a Multi-source Unsupervised Domain Adaptation (MUDA) network to enhance the generalization performance of arrhythmia diagnosis, addressing high inter-patient variability and data imbalance. The proposed network jointly learns domain-invariant and domain-specific representations to prevent performance degradation on unseen patients or disease types. Experiments using five ECG datasets—CPSC, CPSC-Extra, Georgia, PTB-XL, and Hefei—demonstrated superior performance over baseline models. Yi [15] proposed an Attention-Enhanced Domain Adaptive Feature Fusion Network (ADAFFN) to address inter-session feature distribution variations in ECG-based biometric recognition. The model integrates a multi-branch structure, a Weighted Fusion Adaptive Attention (WFAA) mechanism, domain adaptation, and normalized Softmax loss to mitigate inconsistencies across sessions. Experiments on ECG-ID, PTB, CYBHi, and Heartprint datasets showed notable performance improvements over existing methods. Hasani [16] proposed a Multi-source Domain Generalization (MSDG) model to address multi-source heterogeneity and distribution mismatches in ECG classification for cardiovascular disease diagnosis. By integrating CNN and LSTM architectures with adversarial domain generalization, the proposed method achieved strong performance on the PhysioNet/Computing in Cardiology Challenge 2020 12-lead ECG dataset, validating its generalization capability.

3. Fuzzy Energy–Frequency Spectrogram Network

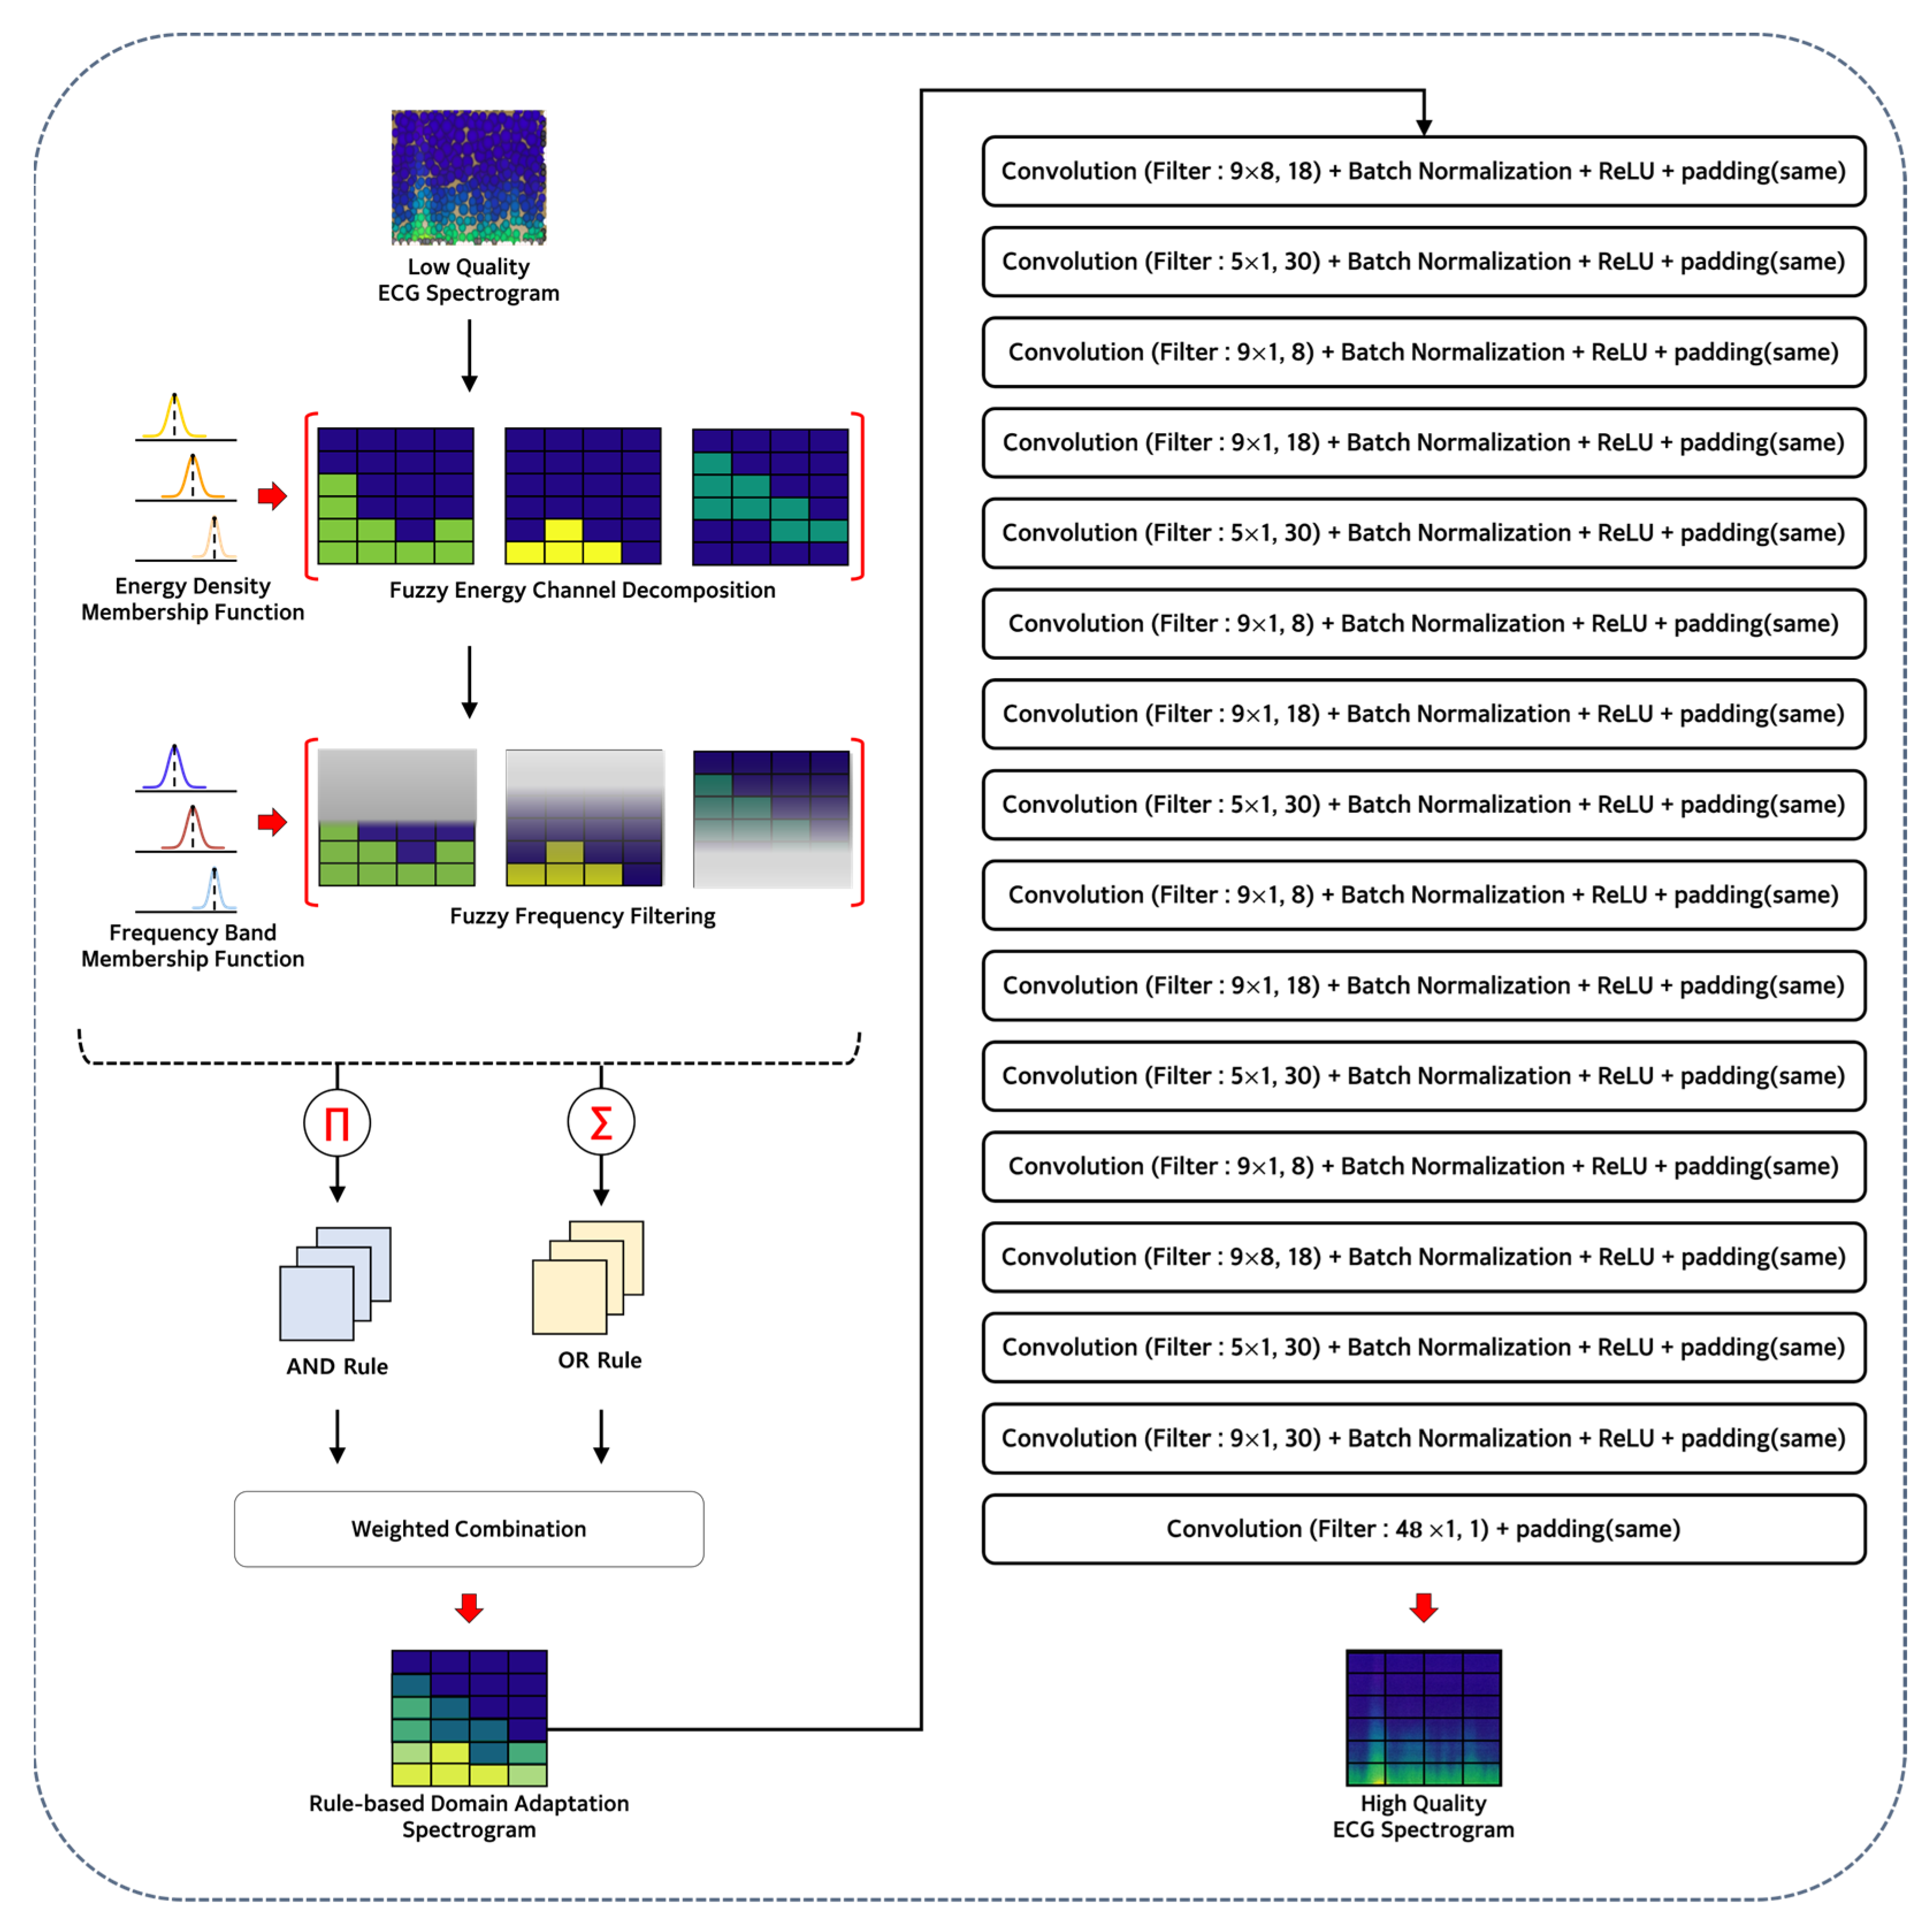
Figure 1 illustrates the process of domain adaptation, converting a low-quality spectrogram—which is a mixture of ECG and EOG signals—into a high-quality, denoised signal. The proposed method aims at addressing the limited interpretability of conventional deep learning approaches in the input domain and at demonstrating that fuzzy rules can be directly applied to spectrogram representations. To this end, we compare the performance and interpretability of a CNN-based domain adaptation model with and without the proposed fuzzy module. While deep learning provides strong predictive capability for domain adaptation tasks, its interpretability is largely restricted to post hoc visualization techniques such as Grad-CAM. In contrast, FEFSN generates rule-based representations directly from the input spectrogram, enabling the model to explain why a particular adaptation was made rather than merely indicating where it focused. In FEFSN, fuzzy rule images are constructed by applying AND and OR logical operations to the noisy input spectrogram. These rule images capture both common and comprehensive spectral characteristics, and are combined through learned weights to produce a single-channel domain-adapted spectrogram. This spectrogram is subsequently fed into a CNN model, and the effect of applying the fuzzy module is quantitatively evaluated using PSNR and MSE.
As shown in Figure 2, the proposed method begins by transforming the ECG signal into a time–frequency representation using the Short-Time Fourier Transform (STFT), expressed as S ( f , t ) . The spectrogram transformation enables the extraction of both temporal and spectral information from the input signal, making it highly effective for capturing diverse features. Conventional deep learning approaches primarily rely on automatically learning time–frequency patterns from such spectrograms. However, when applied to a fuzzy inference framework, a different input representation is required—one that structurally encodes interpretable fuzzy rules rather than raw spectrogram values. To address the inherent limitations of traditional fuzzy systems—particularly their restriction to single-channel or tabular data—we introduce two novel membership function schemes: the Energy–density Membership Function (EMF) and the Frequency Membership Function (FMF). These functions enable the probabilistic decomposition of the spectrogram into energy-dependent channels and model the inter-frequency relationships as interpretable fuzzy rules. The fuzzy rule images generated during inference are integrated into a unified rule-based adaptation spectrogram through learned weights and biases, which is then processed by the convolutional network to reconstruct a high-quality ECG spectrogram. This pipeline allows the fuzzy module to suppress noise components in advance, assisting the CNN during training, and later enables rule-level interpretability of the model’s focus without requiring additional post-processing.

3.1. Energy–Density Membership Function

The Energy–density Membership Function (EMF) maps each pixel of the spectrogram to a probabilistic energy density based on its magnitude. An EMF is first applied to convert each pixel intensity into a probabilistic energy density P E ( f , t ) , defined as
  S f , t = n = 0 L 1 x n + t H w n e j 2 π f n / N [ 0,1 ]
    P E i   f , t = exp X t , f c P i 2 2 × σ P i 2
Equation (1) describes the Short-Time Fourier Transform (STFT) process for converting the one-dimensional ECG signal x n into the time–frequency domain. This is achieved by applying a Hann window w n to a segment of the signal shifted by t H , followed by an FFT to compute the spectrum for a specific frequency component f . This transformation enables us to identify the frequency components present in the original signal over time, thereby constructing the spectrogram. Equation (2) details the decomposition process of the transformed spectrogram S f , t , which is pre-normalized between 0 and 1, into multiple energy density channels. In this process, a learned EMF is applied to each pixel of   S f , t , yielding the corresponding probabilistic membership value. The EMF is defined as a Gaussian membership function parameterized by the learnable parameters, center c P i and standard deviation σ P i . This function generates a number of channels equal to the predetermined i -th energy density channels, allowing the single-channel S f , t to be flexibly decomposed and enabling the generation of rules based on rich information.

3.2. Frequency Membership Function

A Frequency Membership Function (FMF) is introduced along the frequency axis to model how a specific frequency band contributes to characteristic ECG patterns. The FMF is implemented as a learnable membership function μ F i f , and the fuzzy-filtered representation is obtained as:
A N D F j f , t = i P E i   f , t · μ F j f
O R F j f , t = i P E i   f , t · μ F j f
μ F j f = exp X f c F j 2 2 × σ F j 2
Equations (3) and (4) describe the process of generating rule images from the energy density channels obtained by the EMF. In this step, Equation (5), with μ F i f defined by the learnable parameters c F j and σ F j , is applied to each decomposed channel. Subsequently, AND and OR operations are performed for the j established fuzzy rules to model the inter-band relationships. The AND operation emphasizes the common frequency characteristics shared across energy density channels, thereby extracting coherent frequency patterns, while the OR operation aggregates both shared and distinct components to yield a richer and more comprehensive representation. The FMF operates independently of the time domain, functioning as a frequency-domain filtering mechanism that highlights the semantic structure of dominant frequency bands in ECG signals, enabling interpretable visualization of their spectral contributions.
A N D F j ^ f , t = γ j A N D F j f , t μ j σ j 2 + β j , A N D j f , t = tanh A N D F j ^ f , t
O R F j ^ f , t = γ j O R F j f , t μ j σ j 2 + β j , O R j f , t = tanh O R F j ^ f , t
R U f , t = A N D j f , t ; O R F j f , t ,   U = 2 × j
A f , t = u = 1 U w u R u f , t + b u
Equations (6) and (7) detail the process of applying Batch Normalization and the tanh activation function to the generated AND and OR rule images. μ and σ denote the batch mean and batch standard deviation, respectively, while γ and β are the scaling factor and offset—all of which are parameters updated during training. The tanh activation function, applied after Batch Normalization, stabilizes the resulting values while retaining negative values. This is crucial for ensuring that the subsequent weighted summation can effectively remove unnecessary components. Equations (8) and (9) illustrate the final aggregation process where the normalized and activated rule images are combined via a weighted summation. The total number of output rule images, denoted by U , is twice the number of FMFs used, as they are generated as complementary pairs of AND and OR rule images. By applying the learned weight w and bias b to each of these rule images, the final composite single-channel image A f , t is formed and subsequently input into the CNN module. Through this fuzzy rule-guided representation, the network learns to suppress noise-dominant regions in the spectrogram while preserving the key spectral components of the ECG signal. This process can be interpreted as an energy–frequency adaptive feature enhancement mechanism driven by fuzzy rules, allowing the model to achieve interpretable domain adaptation while maintaining the semantic integrity of the signal.

4. Experimental Studies and Analysis

To evaluate the domain adaptation capability of the proposed FEFSN, we employed the PhysioNet ECG-ID dataset [17,18], which contains 310 ECG recordings and their corresponding EOG signals collected from 90 subjects. For experimental evaluation, data from 10 randomly selected subjects were excluded from training and used only for testing, while the remaining 80 subjects were split into training and validation sets with an 8:2 ratio. Both the clean ECG signals and the noise-contaminated signals were transformed into spectrograms using identical STFT parameters to ensure a fair comparison between FEFSN and the CNN-based model.
Each one-dimensional signal x n (10,000 samples) was normalized by dividing by the gain value (200) recorded in the header, and then converted into a time–frequency representation using an STFT configured with the following parameters: a sampling rate of 500 Hz, window length L = 250 samples, hop size H = 50 samples, FFT length N = 1024, an analysis frequency range of 0.5–150 Hz, logarithmic compression l o g ( S + 10 2 ) , and 48 uniformly spaced frequency bands. After segmentation, all signals were reshaped into spectrograms of size 48 × 100 (frequency × time).
To compare the performance and interpretability of FEFSN, we used a CNN-based model inspired by [19]. This model consists of 15 repeated Convolution–BatchNorm–ReLU blocks, followed by a final convolution layer that produces a single-channel output matching the target spectrogram. Padding was applied to all convolutional layers to maintain the spatial dimensions of the output. During convolution, the spectrogram representation of the ECG signal may become compressed, which can lead to the loss of clinically important temporal–frequency information, such as the onset of cardiac cycles or sharp transitions around the R-peak region. By preserving the spatial resolution through padding, we ensure that these critical structures remain intact and that the model can retain essential information throughout the domain adaptation process. All models were trained under identical GPU/PC environments using the Adam optimizer (learning rate = 0.001) for 200 epochs. The only architectural difference between the CNN and FEFSN is the inclusion of the FRIGM, and the total number of parameters is approximately 32 K for both models. The fuzzy module in FEFSN contains very few trainable parameters (e.g., 33 parameters for three energy bands and two rules) and thus does not significantly affect computational cost or training time. Domain adaptation performance was assessed using PSNR to quantify similarity to the target clean signal and MSE to measure reconstruction error. These metrics allowed us to evaluate the extent to which applying fuzzy rules at the input level contributes to performance improvement. Performance evaluation was carried out using two quantitative metrics: Peak Signal-to-Noise Ratio (PSNR), which measures the reconstruction quality relative to the original signal, where higher values indicate lower noise and better fidelity; and (2) Mean Square Error (MSE), which quantifies the average deviation between the reconstructed and reference signals, with lower values indicating better restoration accuracy. Table 1 and Table 2 present the performance evaluation of the proposed FEFSN using PSNR and MSE, comparing the network’s performance with and without the FRIGM, while maintaining an identical deep learning architecture.
Experiments conducted across various configurations (Table 2), manipulating the number of energy density channels and frequency bands (rules), revealed that simply increasing these counts does not guarantee a positive contribution to model performance. Based on the PSNR and MSE measurements, we confirmed through repeated experiments that the proposed FEFSN contributes to performance improvements. Although minor variations exist depending on the number of energy and frequency bands, FEFSN produced comparable or even superior results compared to the CNN baseline without the FRIGM. These findings suggest that EMF and FMF can be effectively applied to two-dimensional data and spectrogram representations—traditionally a limitation of fuzzy logic—and thus hold potential for broader applications. While decomposing the energy density into diverse regions and varying the frequency bands allows for the generation of complex rules, it simultaneously carries the risk of generating superfluous rules and inducing overfitting. Notably, for the AND rule images, increasing the number of channels can lead to the multiplication of overlapping operations, potentially diminishing meaningful information to an extreme degree. Furthermore, utilizing a limited number of rules is analytically advantageous for interpretation, providing sufficient explanatory power for the subsequent rule analysis.
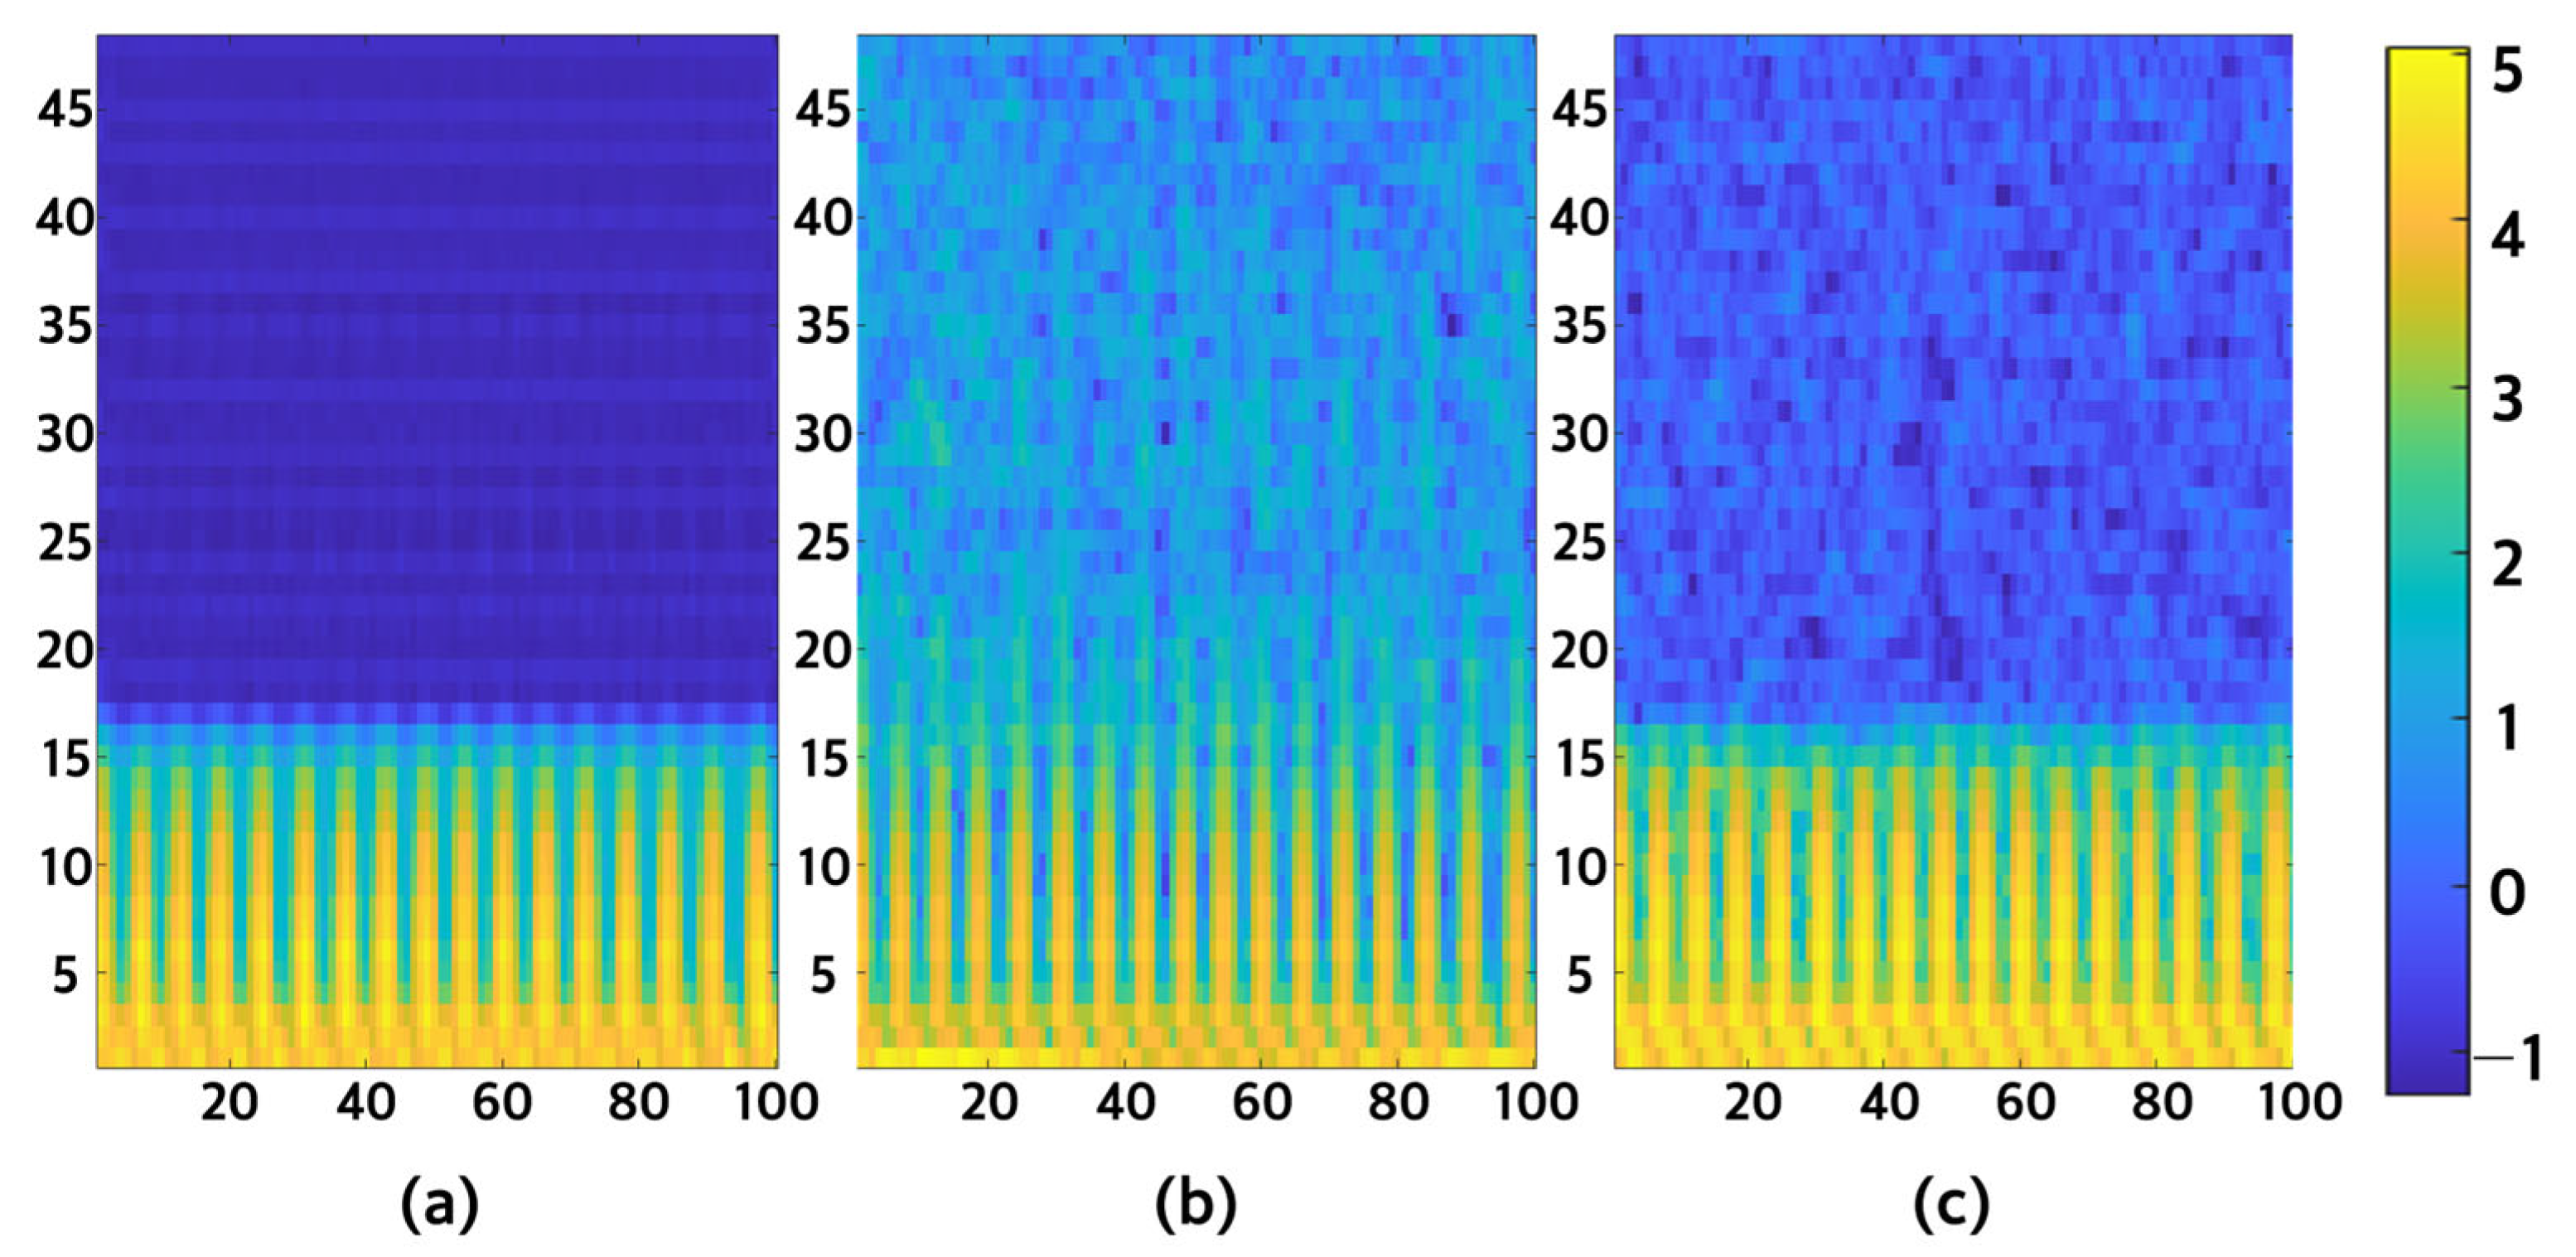
Figure 3 compares the actual ECG spectrogram with the high-quality, domain-adapted output (a) generated by FEFSN, taking the EOG-contaminated ECG spectrogram (b) as input. While the cardiac-related waveform in (b) is attenuated due to noise contamination, the domain-adapted image (a) clearly enhances the cardiac waveform compared to the original ECG signal. Although a standalone CNN baseline model exhibits similar performance, this approach remains a black-box system, unable to explain to the user which energy density or frequency bands are relevant to the objective outcome. We propose that adding the FRIGM—which extends the fuzzy concept to the CNN input layer—allows us to anticipate a higher level of performance than conventional approaches and provides a method for visualizing the model’s concentration areas instead of merely outputting results based on learned weights.

Analyzing the Explainability of Rules

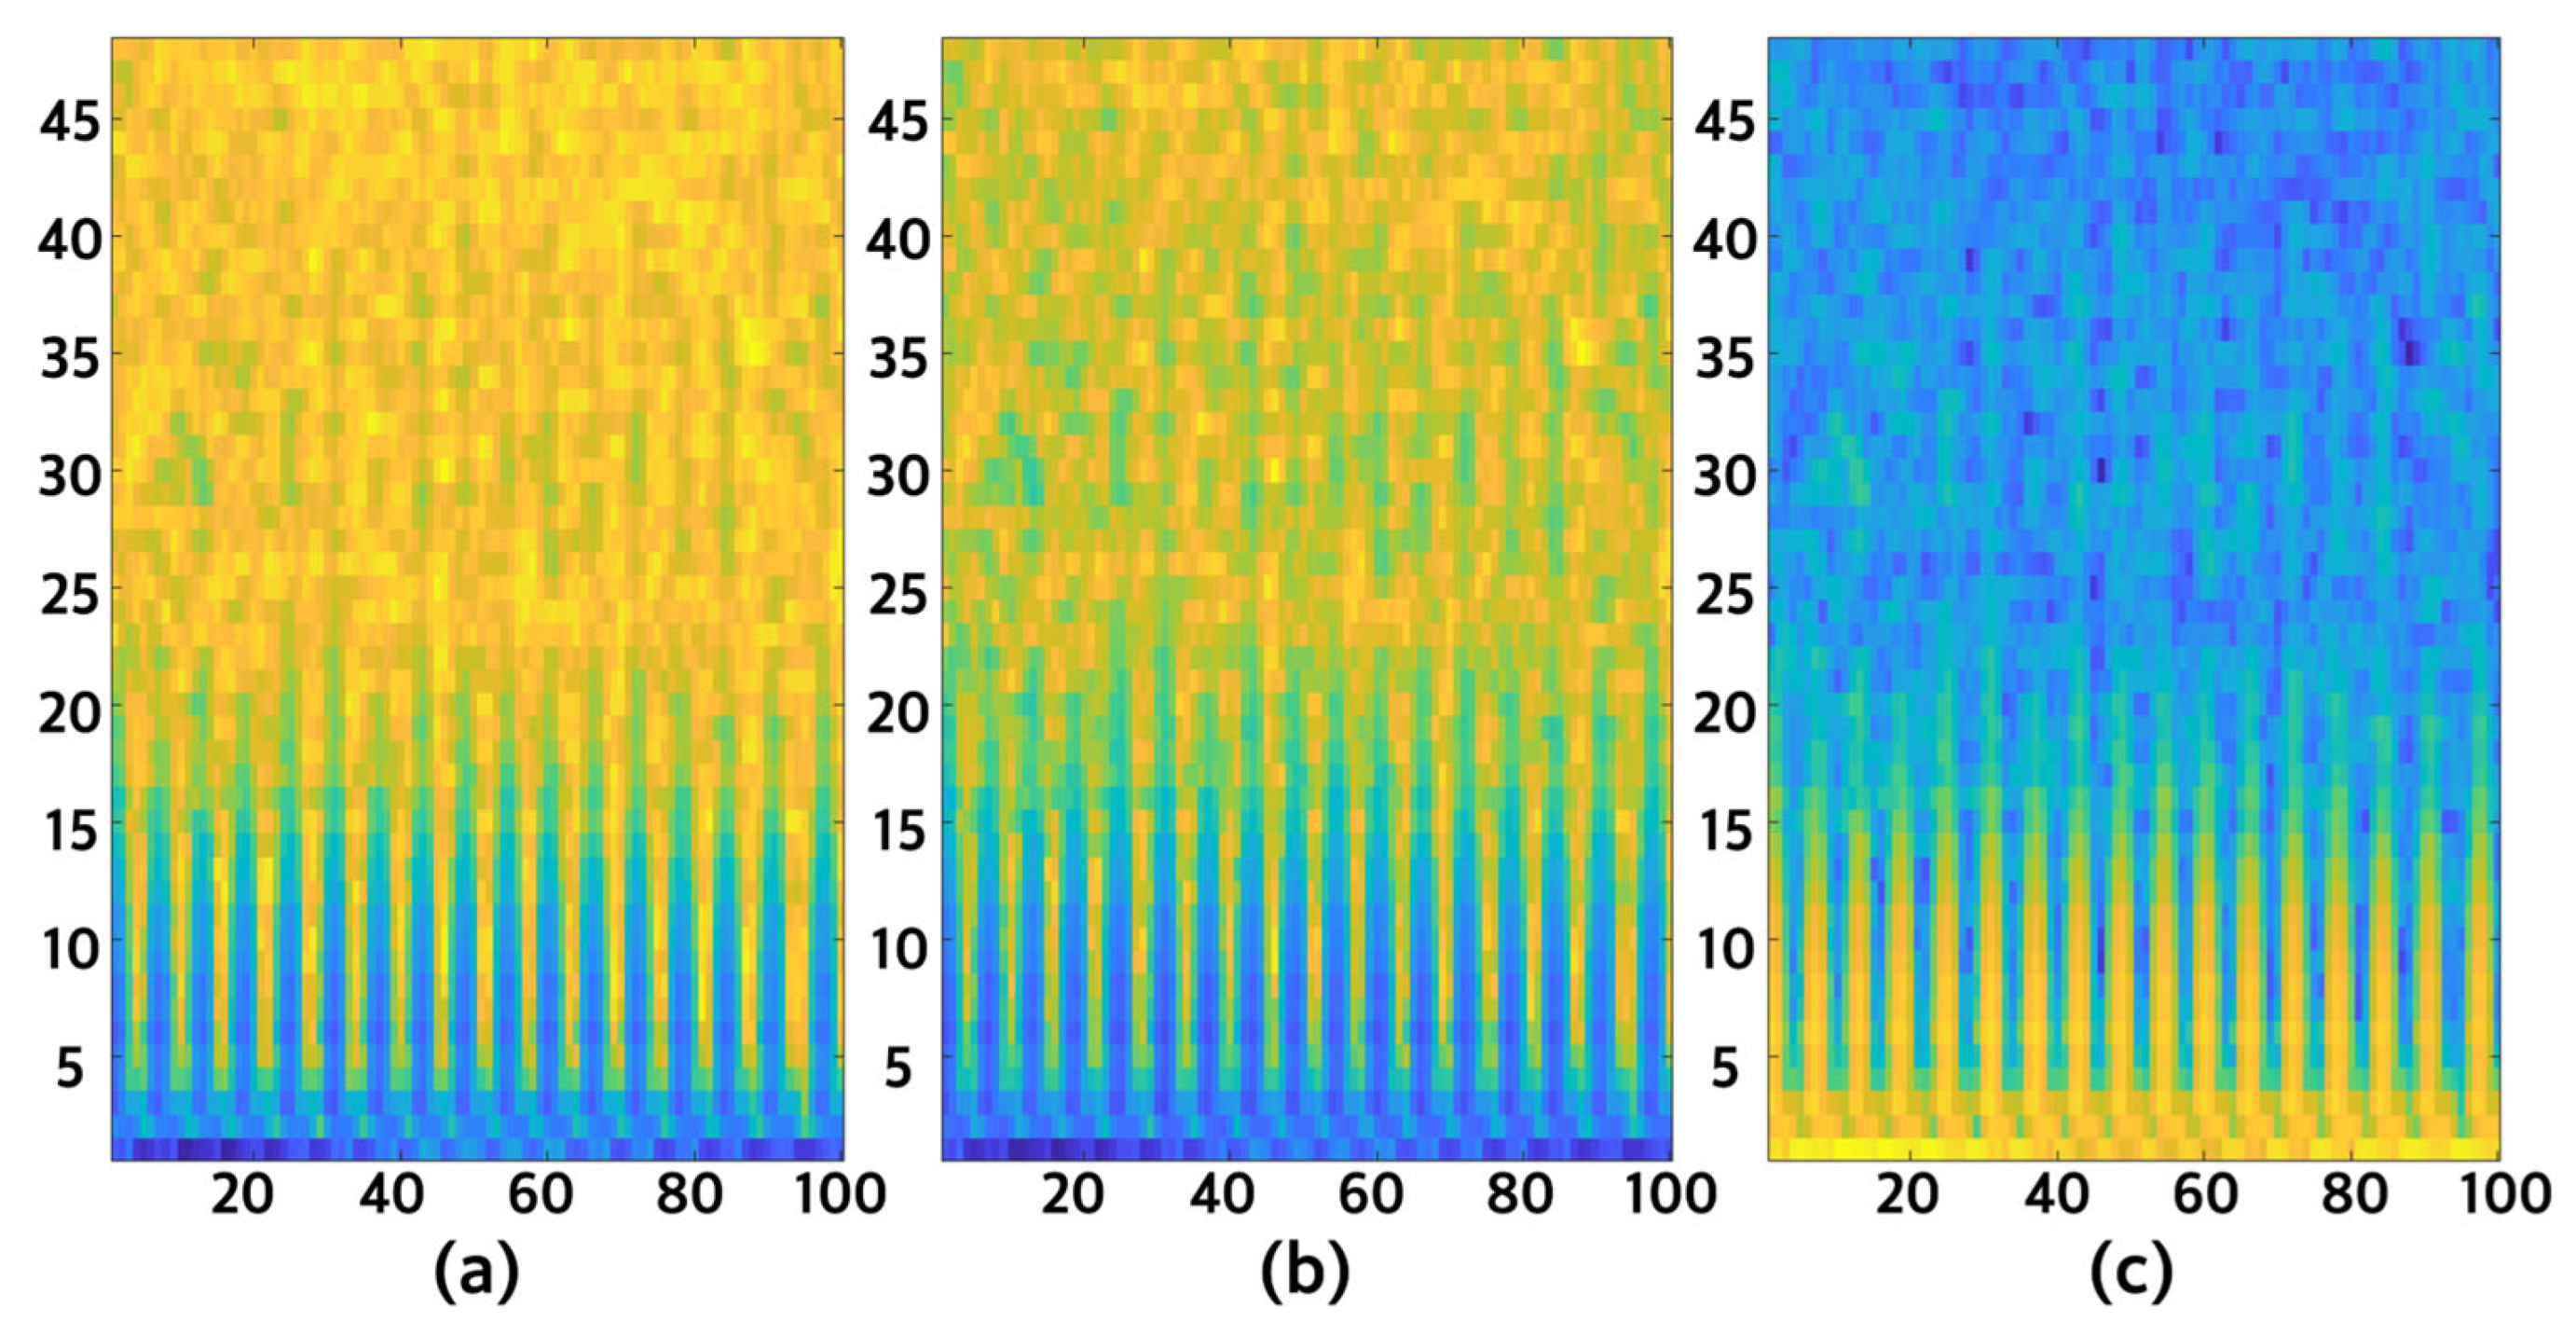
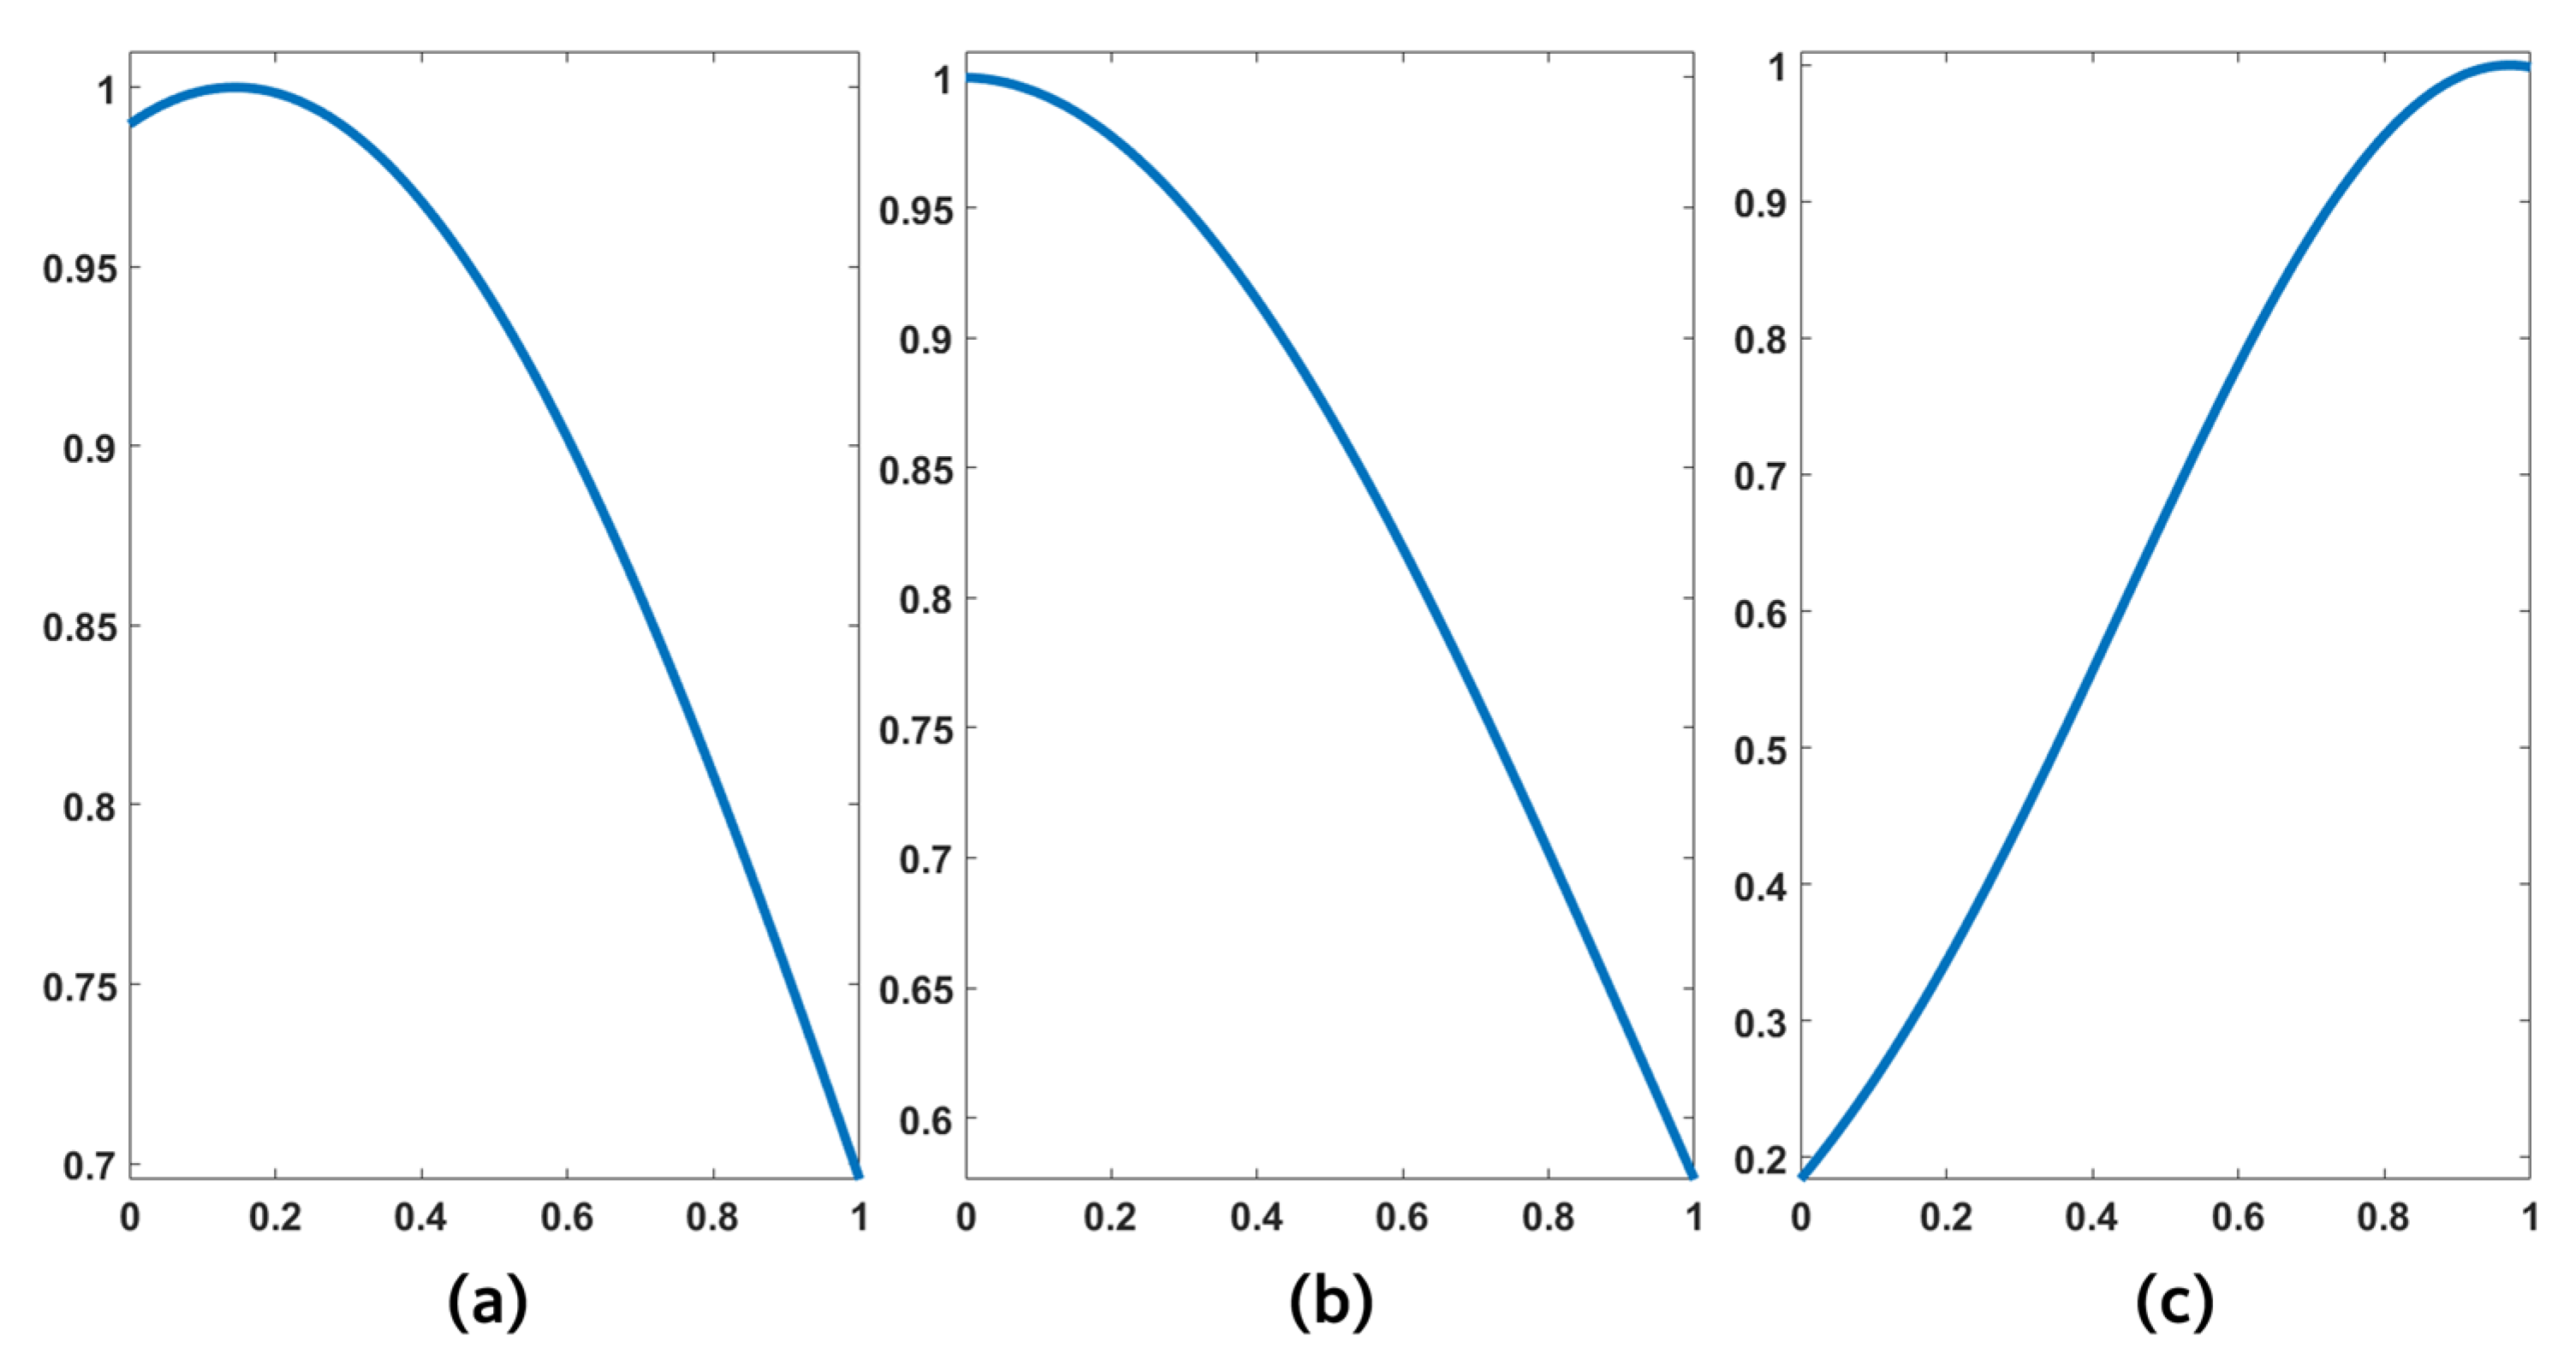
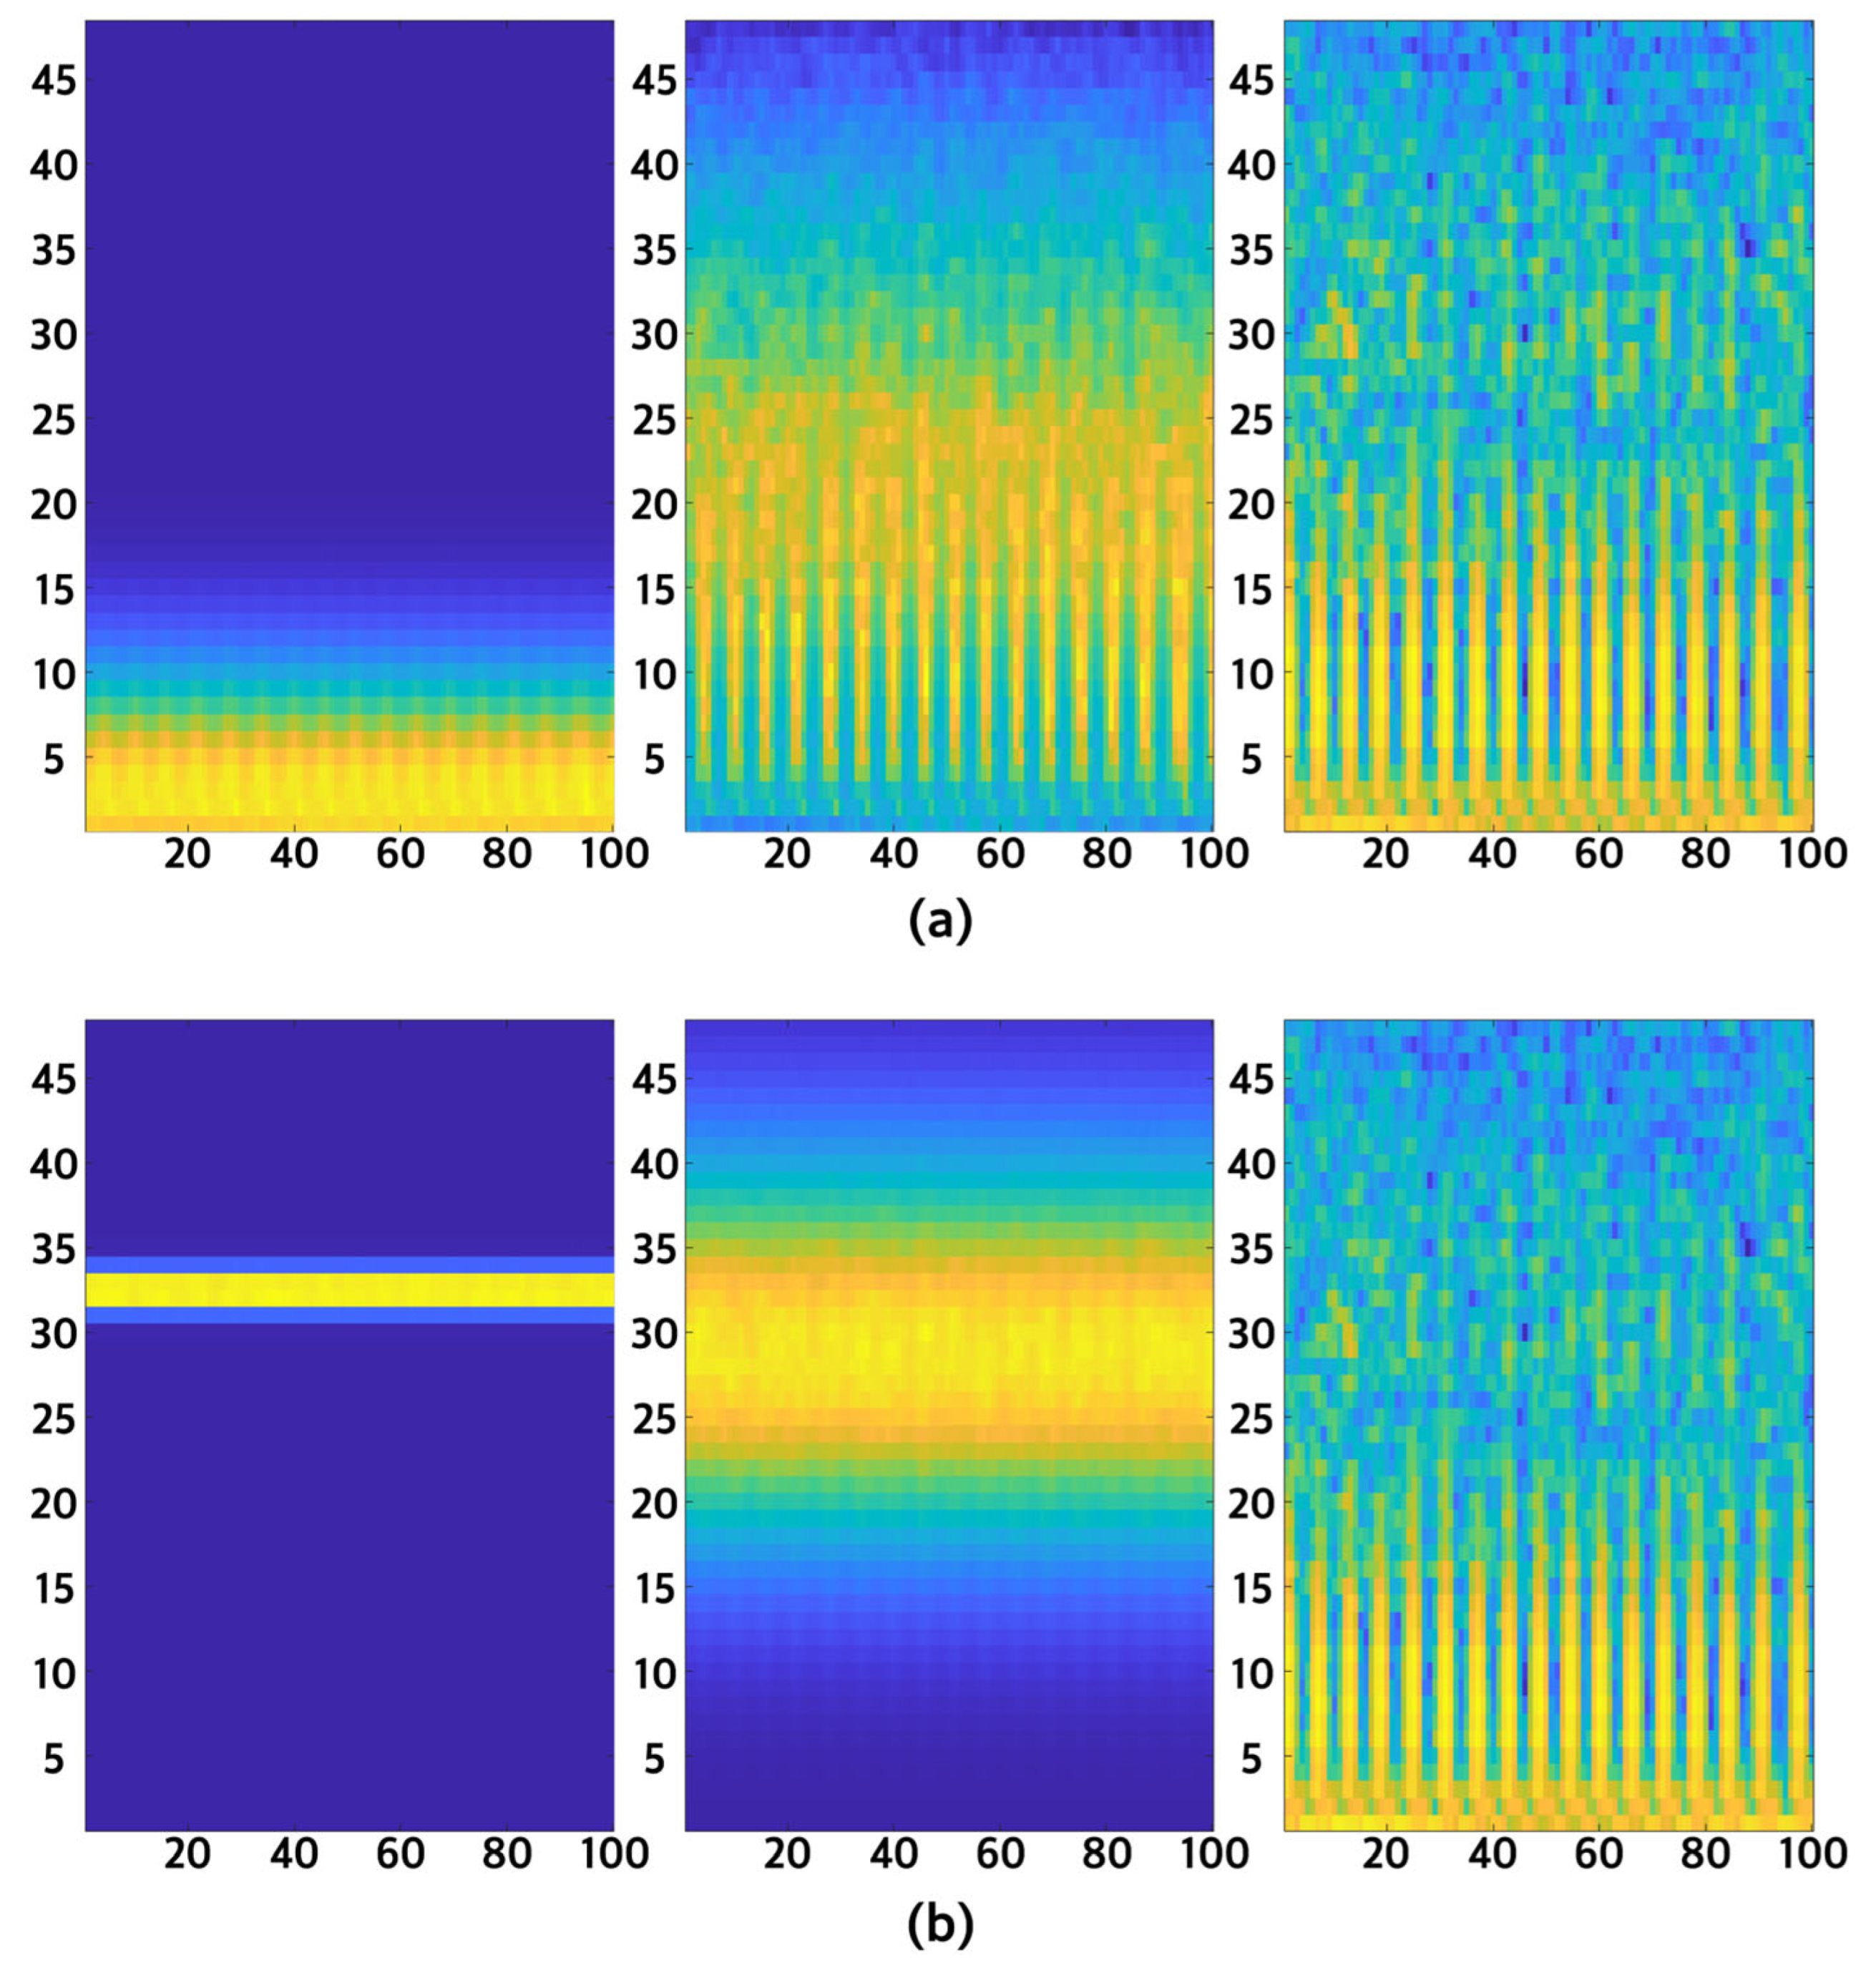
We proceed to analyze the learned Energy–density Membership Functions (EMFs) and Frequency Membership Functions (FMFs) to visually confirm the energy–density–frequency bands prioritized by the model and trace the process by which the input data is converted into rule images. Figure 4 and Figure 5 illustrate the three EMFs used to extend the fuzzy concept for spectrogram processing and the resulting images after EMF application. The application of Gaussian membership functions allows for flexible density analysis, extracting diverse information from the single-channel spectrogram and transforming it into the multi-channel format required for rule generation.
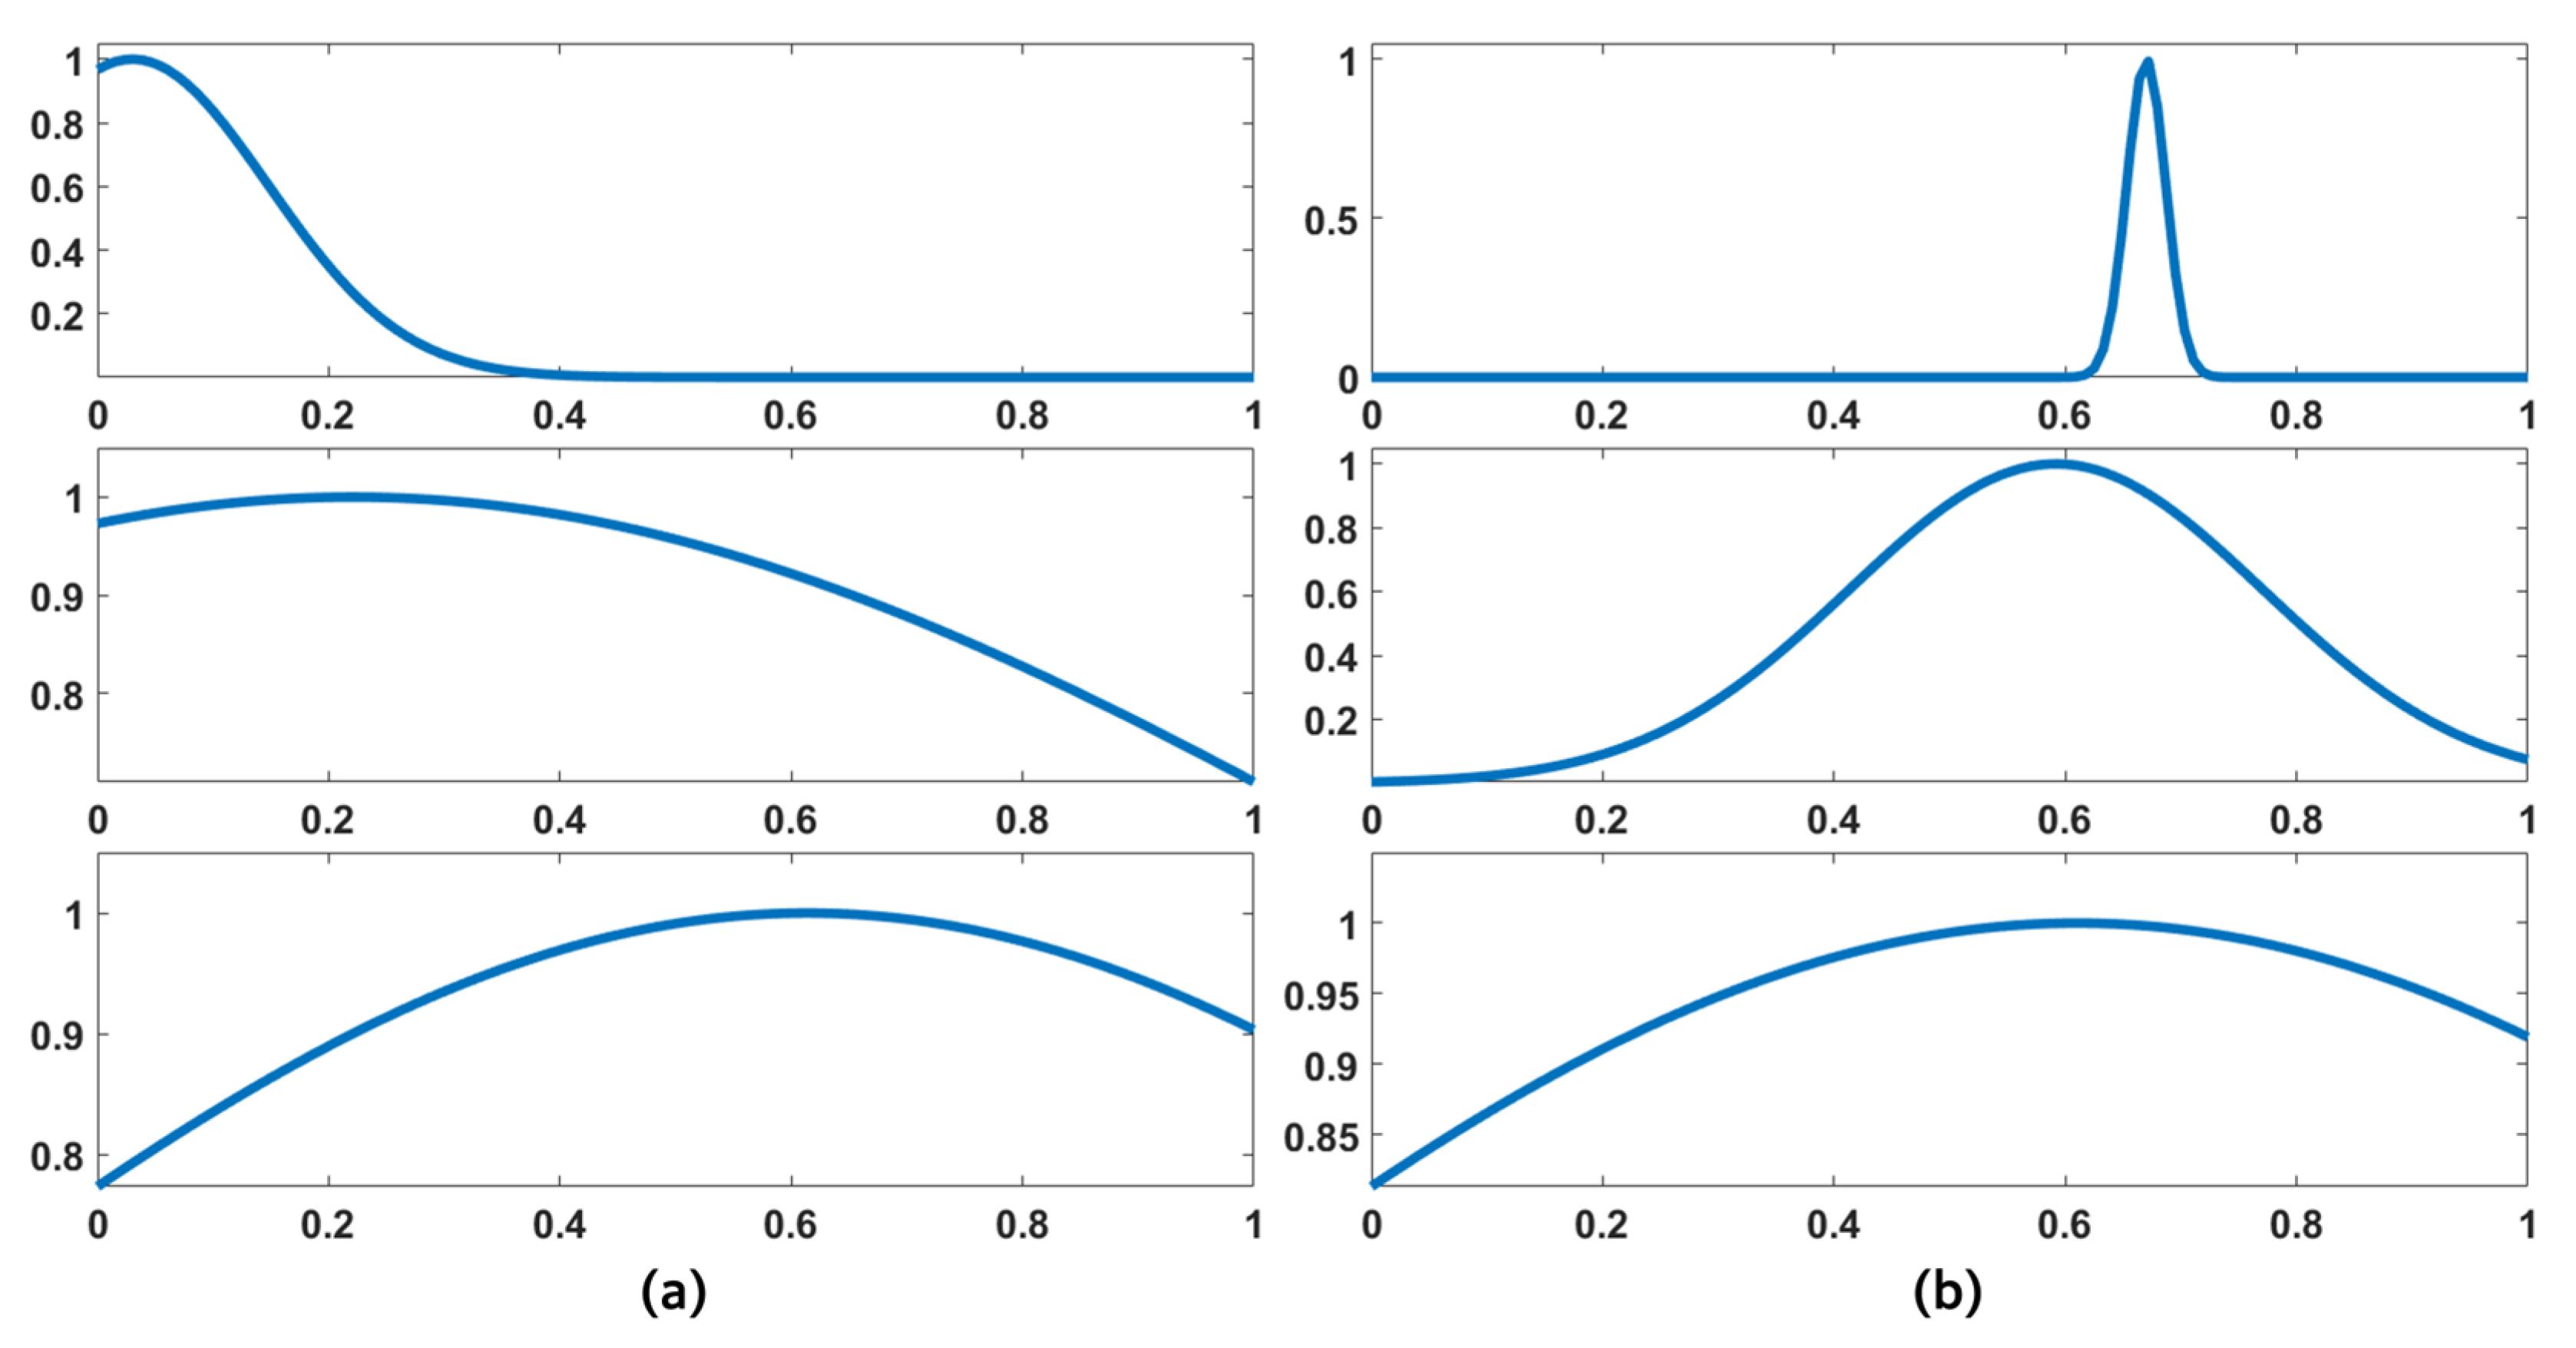
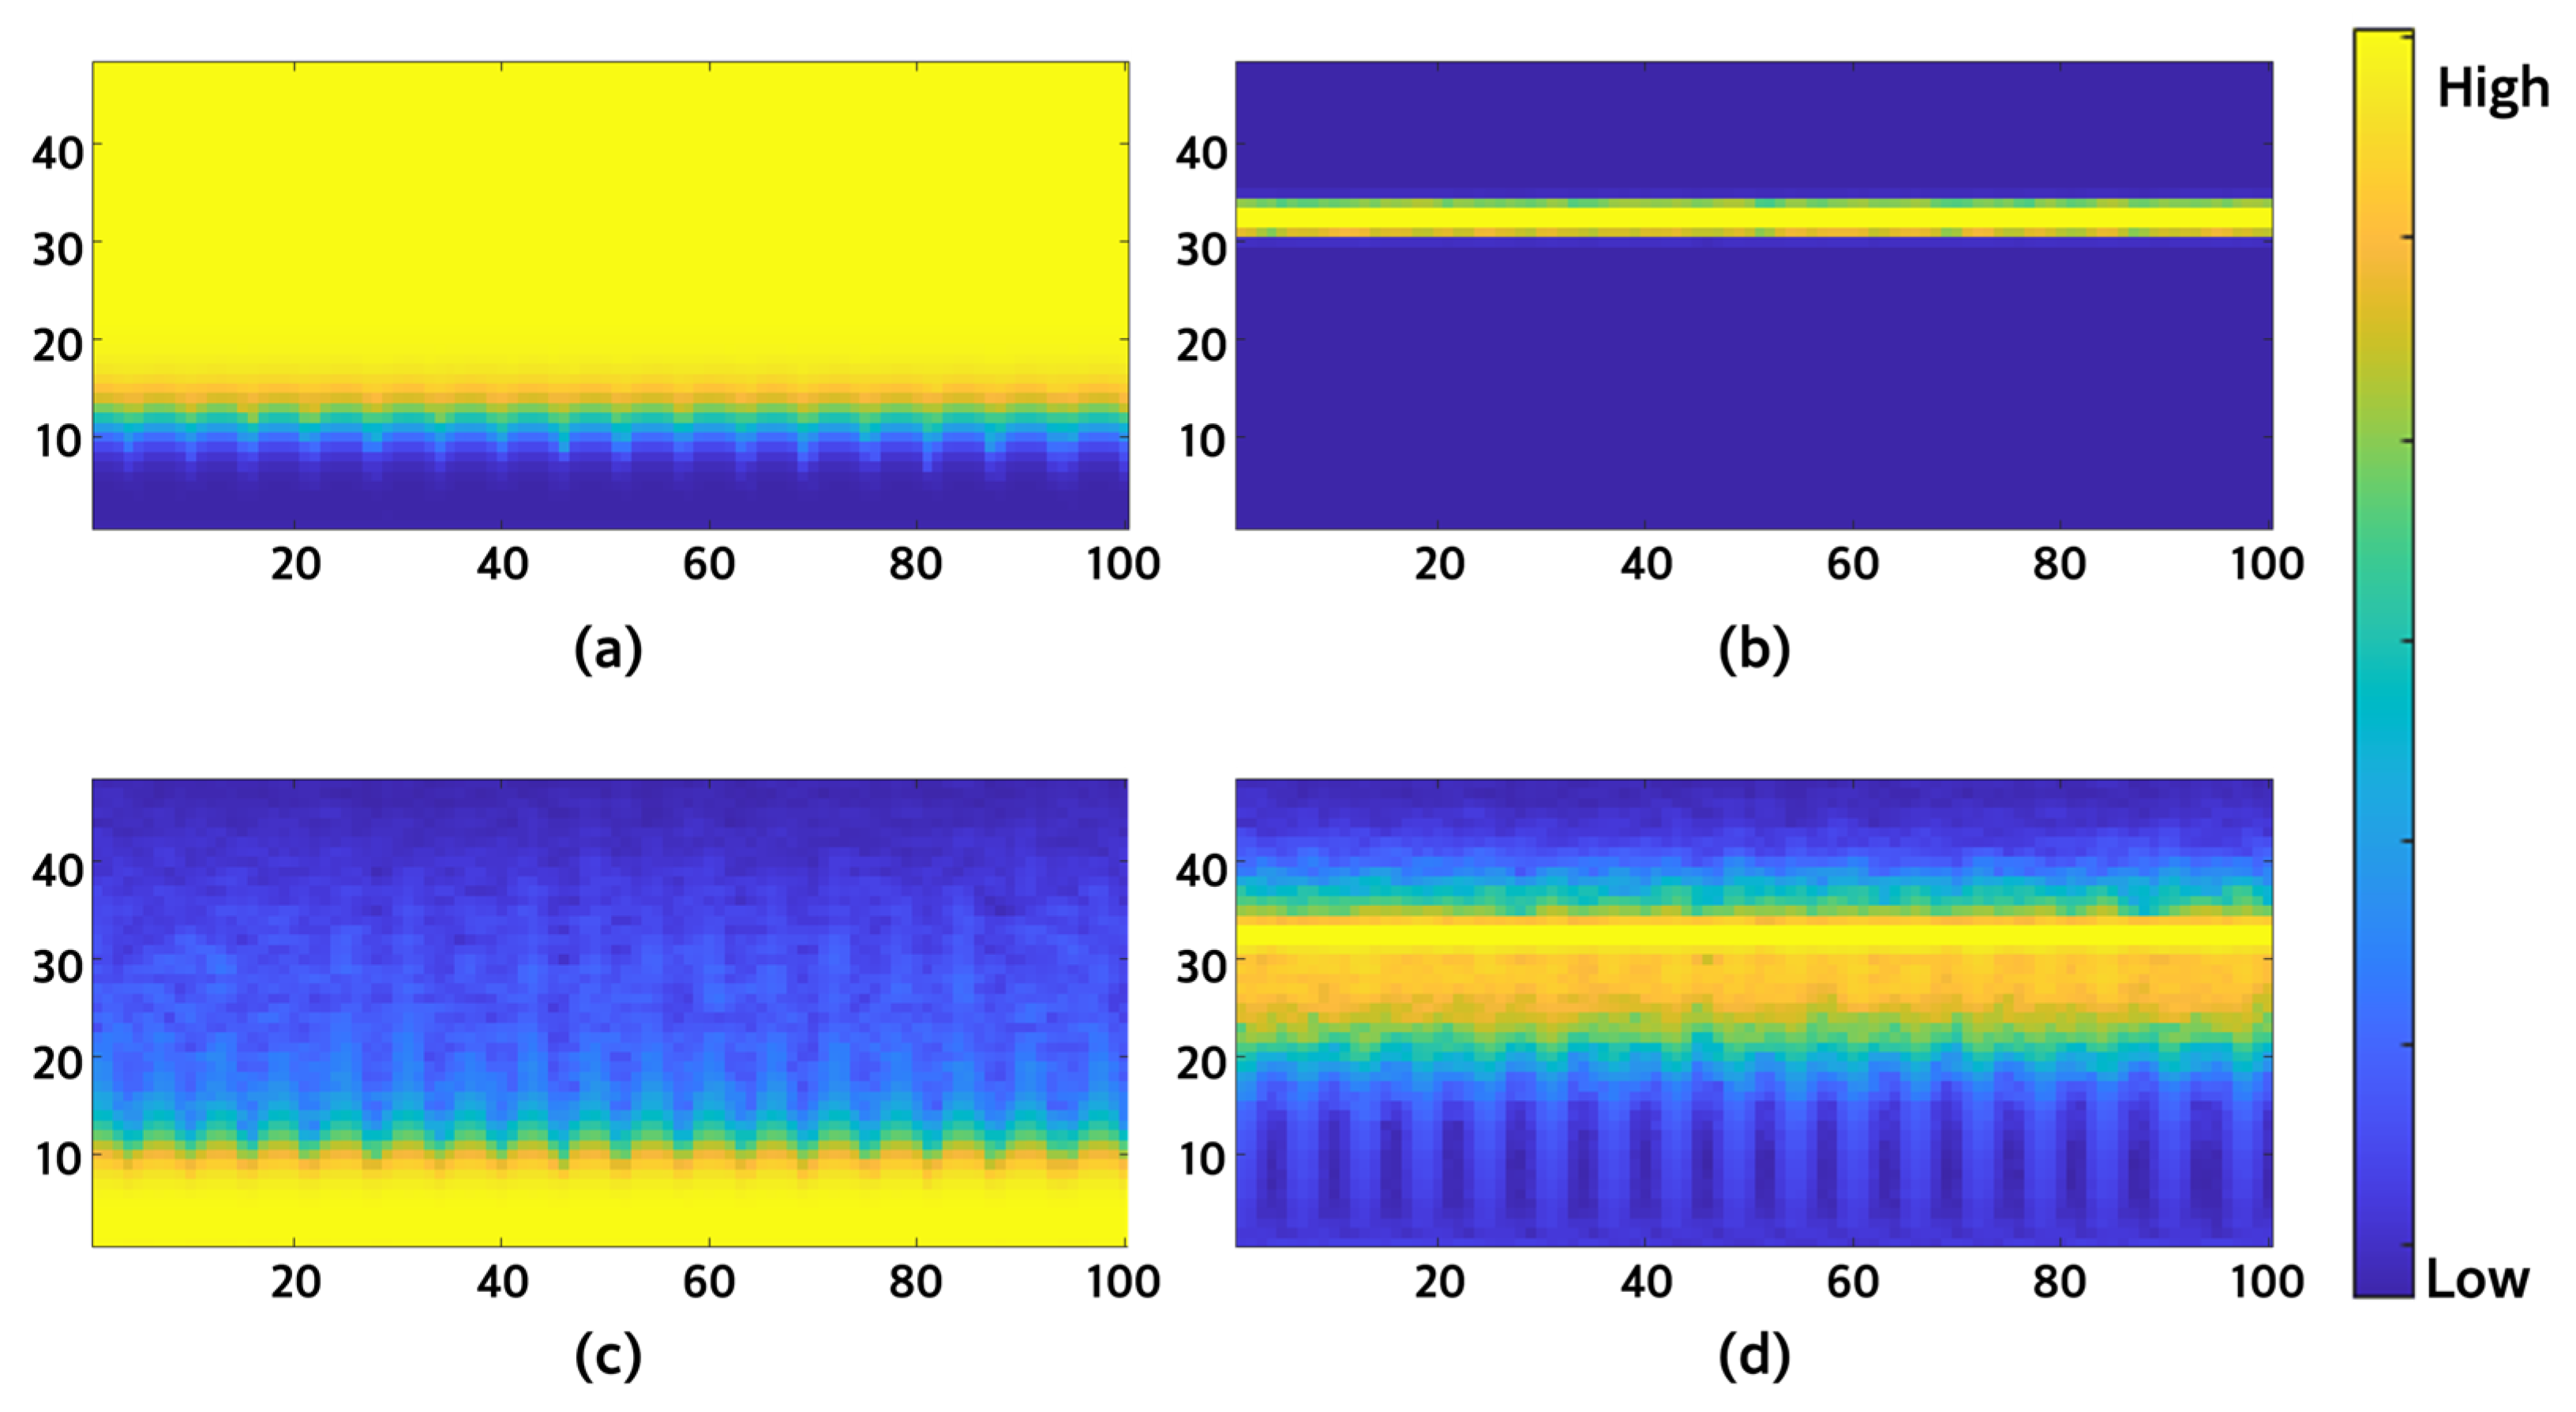
Figure 6 and Figure 7 demonstrate the application of FMF to the three-channel energy band membership images generated via EMF, revealing the relationship between energy density and frequency bands. Figure 6 show how FMF is applied to the multi-channel energy band outputs of the EMF. This process highlights different frequency bands according to the rule, enabling us to visually confirm the regions focused on by the learned model. Subsequently, AND and OR rule images are generated (Figure 7) by multiplying or summing the values in each row of the channels, resulting in the visualization shown in Figure 8. These rule images are then weighted and summed to be converted back into a single-channel spectrogram, which is subsequently passed through the CNN module for domain adaptation.
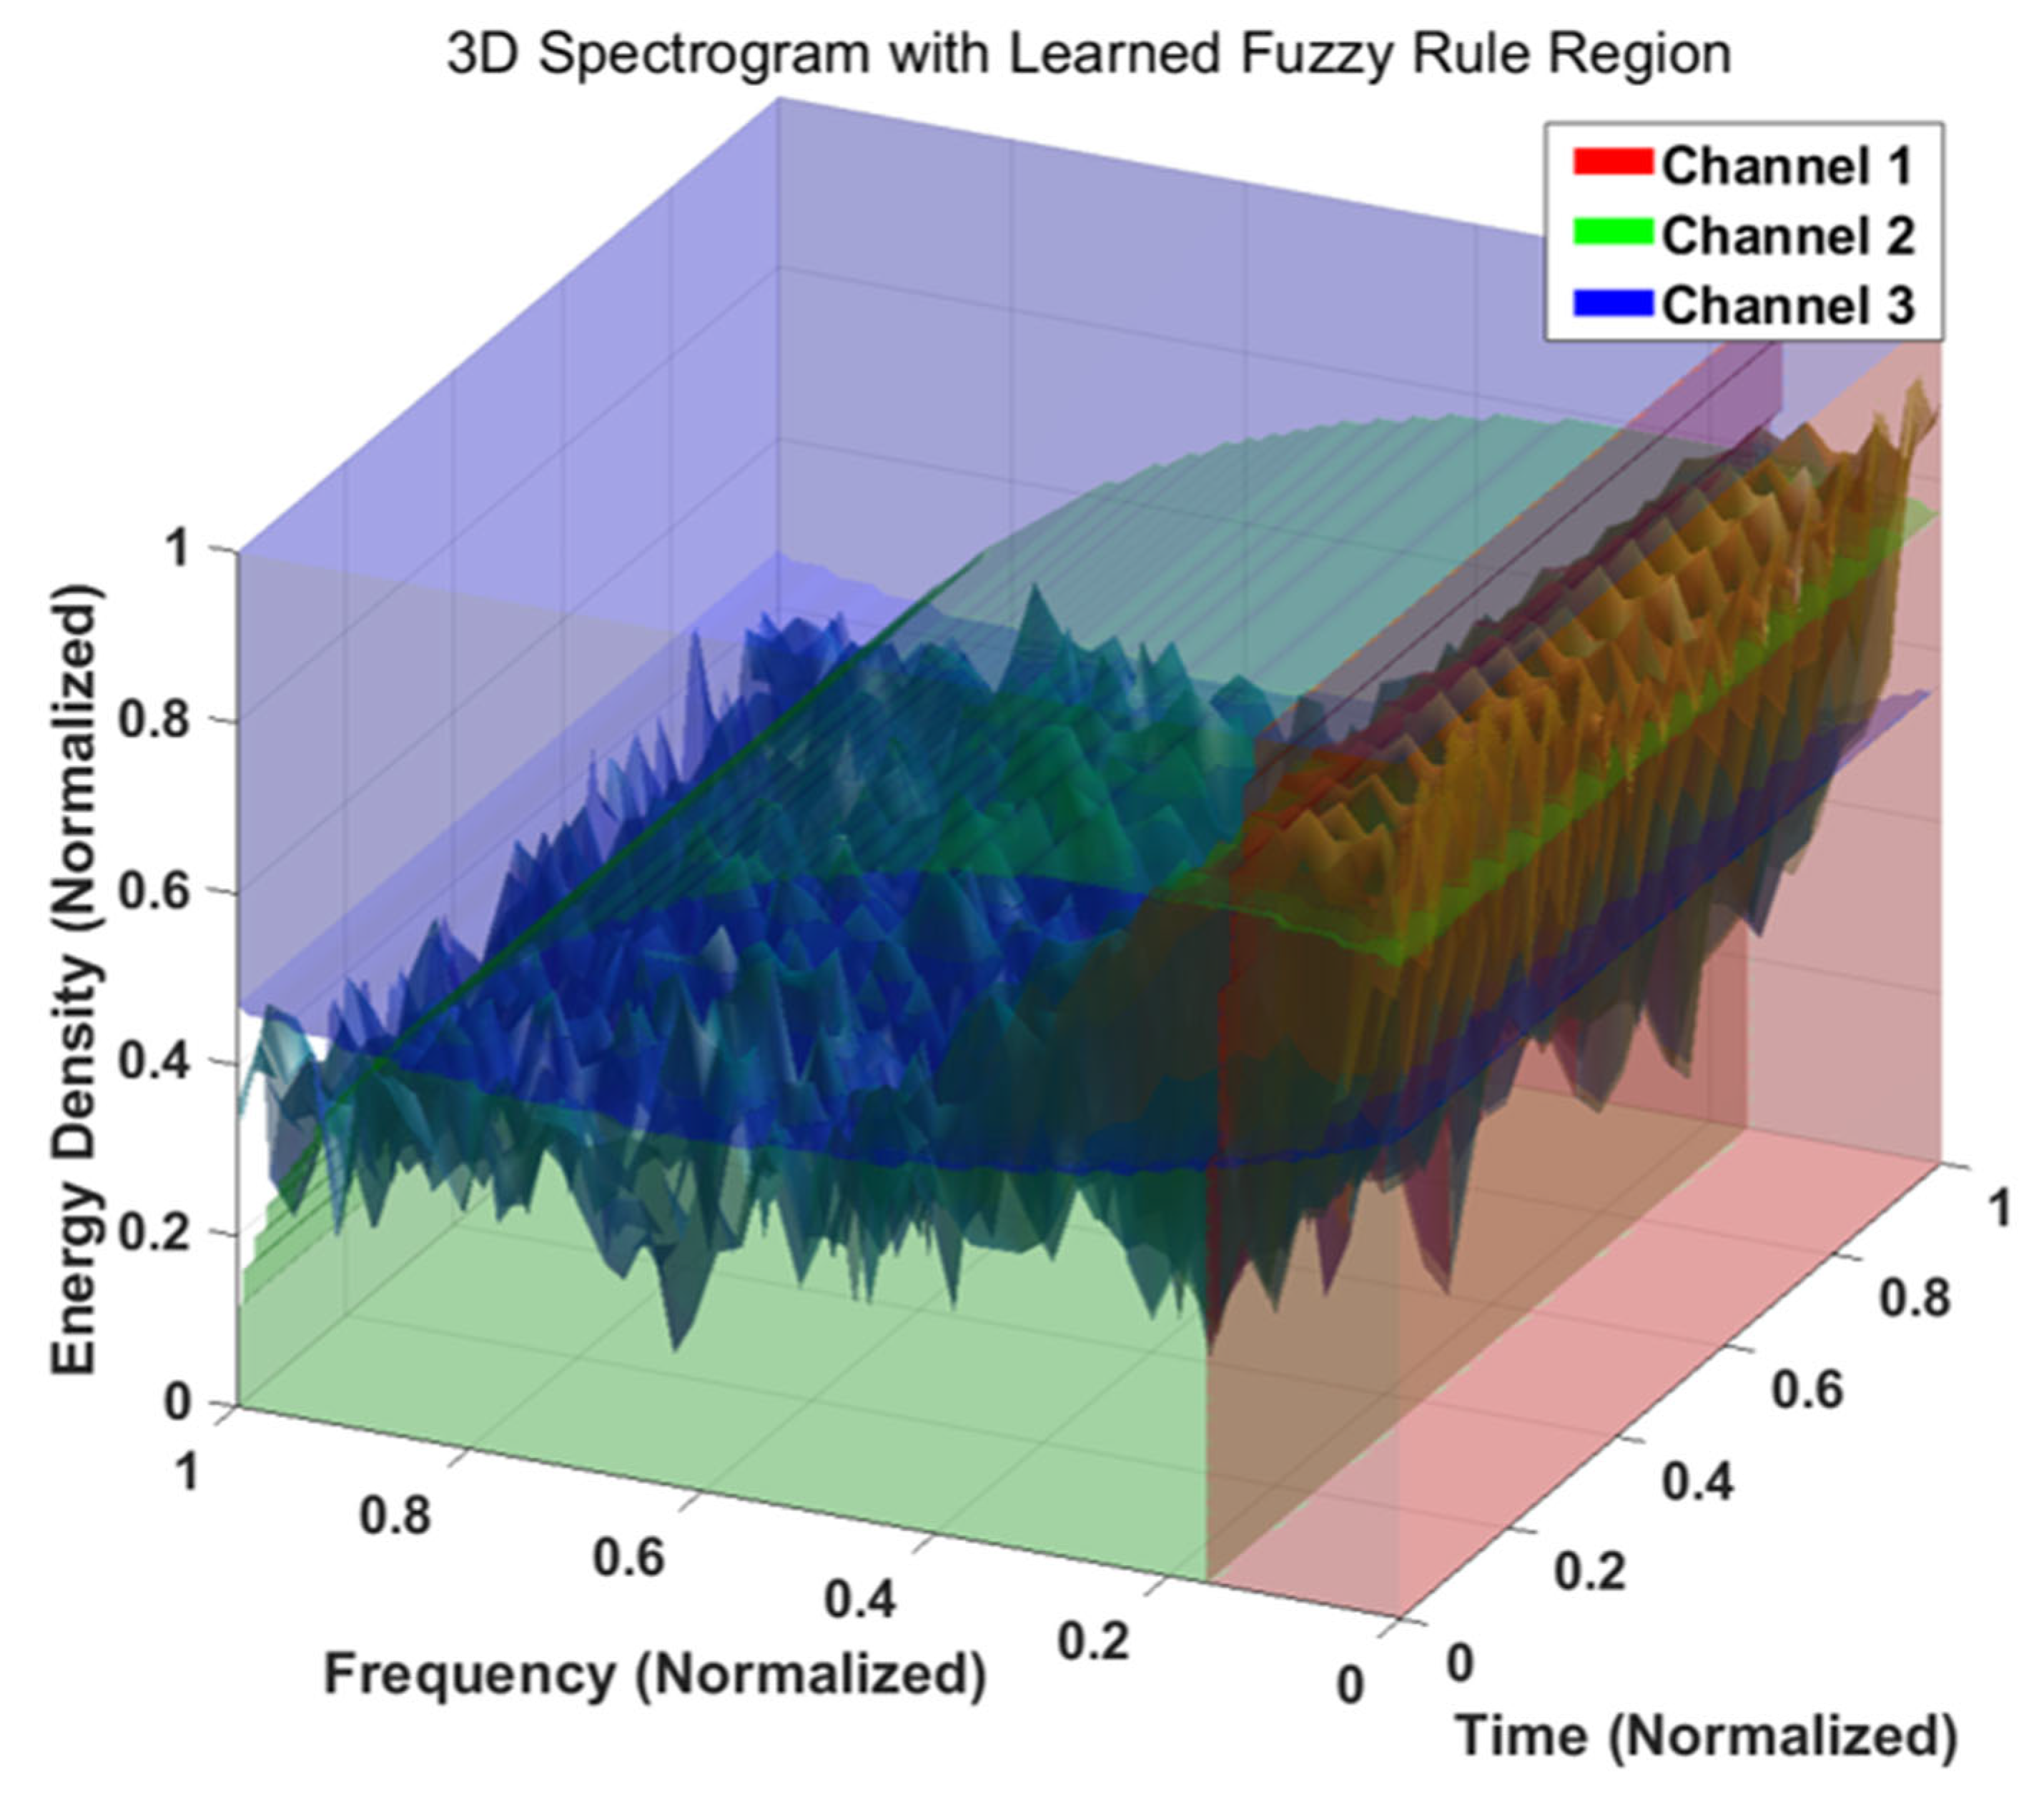
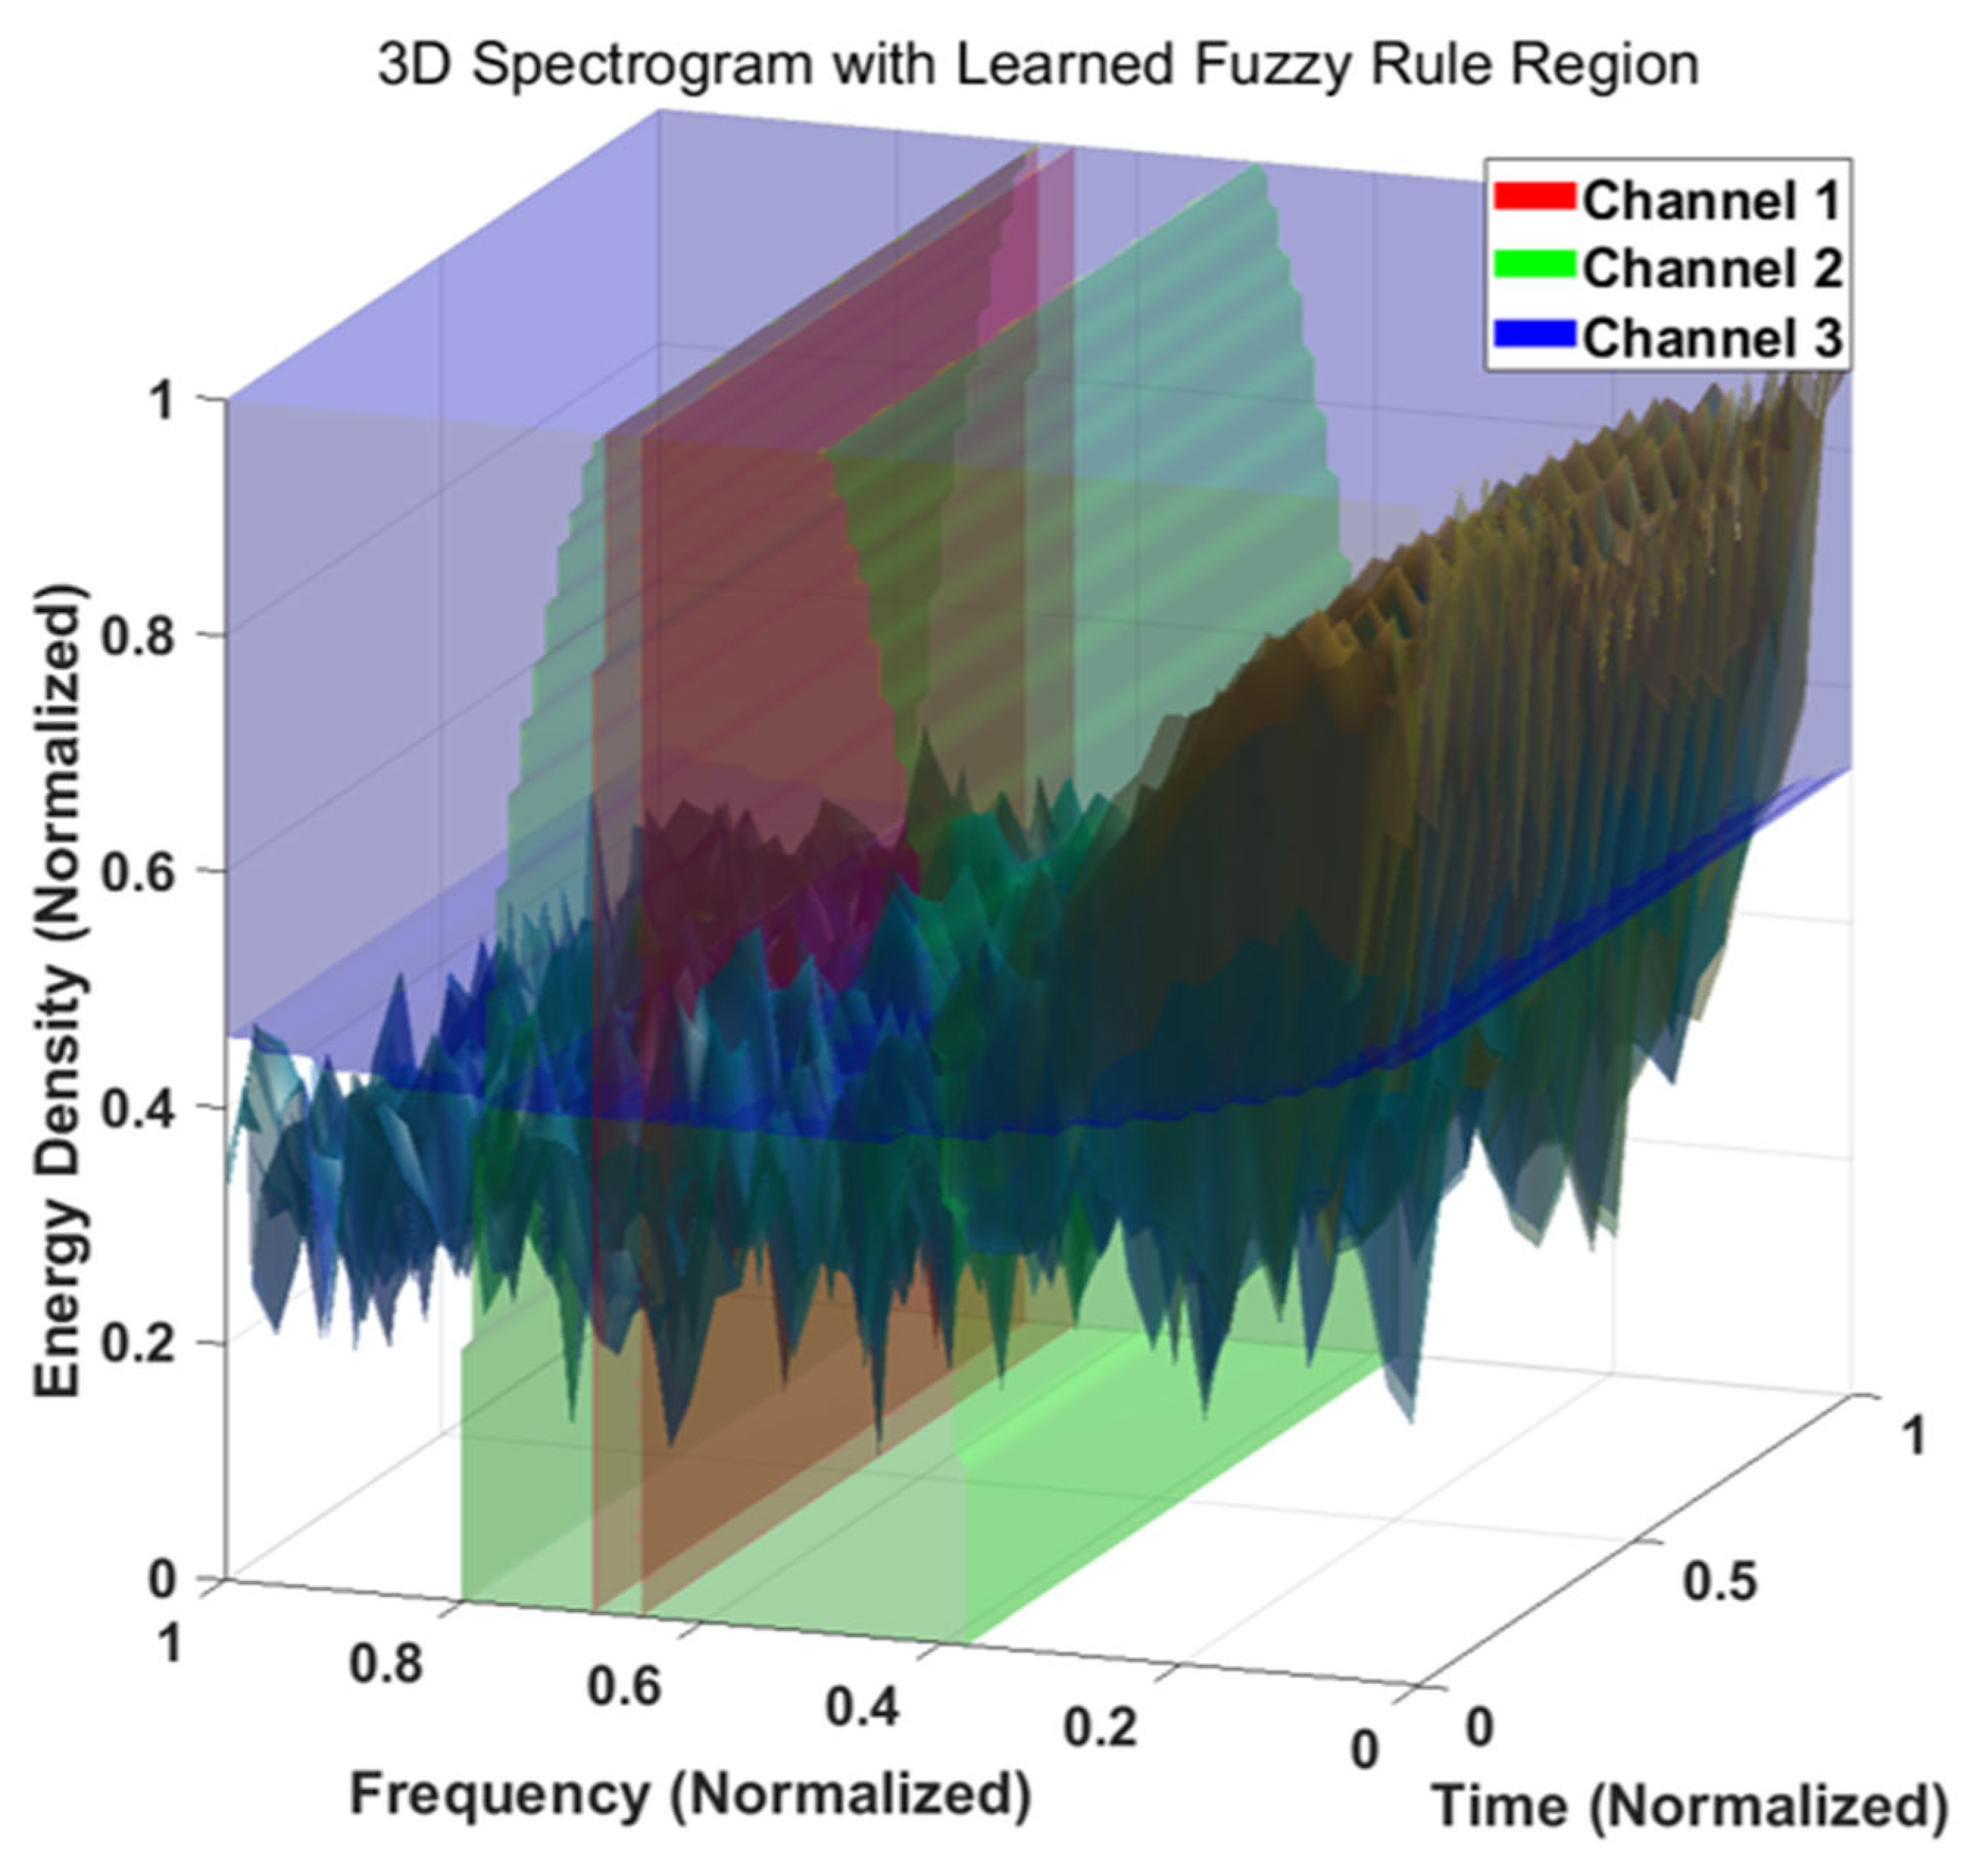
Figure 9 and Figure 10 visualize the learned explainable features within FEFSN by representing the ECG spectrogram in 3D space (time, frequency, and energy density) alongside the learned EMF and FMF in energy–frequency coordinates. In Figure 9, Channel 1 (red area) generated rules by focusing on the overall energy band information within a low-frequency range. Channel 2 (green area) focused on the low-to-mid energy band across the entire frequency range, and Channel 3 (blue area) concentrated on the high-frequency band across the entire energy band. The AND operation identifies overlapping regions among these three channels, while the OR operation represents the comprehensive area, with a tendency to concentrate where overlaps occur due to the summing operation. Rule 2, in Figure 10, shows Channel 1 focusing on the entire energy band within a narrow frequency range, Channel 2 focusing on the entire energy band within a mid-frequency range, and Channel 3 focusing on the high-energy band across the entire frequency range for rule generation. Unlike Grad-CAM, which produces a saliency map based on gradient backpropagation, the rule-based attention maps generated by FEFSN directly visualize the actual fuzzy rules activated during inference. This enables us to identify which energy–frequency regions were emphasized or suppressed and whether inhibitory (negative-weight) rules contributed to the decision. Furthermore, the complete reasoning pathway—including EMF/FMF memberships, AND/OR combinations, and composite rule formation—can be decomposed and analyzed, providing a much deeper level of interpretability. Thus, FEFSN explains not only where the model focused but also why it made such a decision, offering superior interpretability compared to conventional CNN-based attention or saliency methods.

5. Discussion

In this work, we introduce a new framework that enables fuzzy inference to operate directly on two-dimensional spectrogram representations by leveraging EMF- and FMF-based multi-energy–frequency rule construction. This approach maintains or slightly improves performance in ECG domain adaptation while assisting, rather than hindering, the learning process in the CNN layers. In addition, the learned rules can be visualized to analyze the model’s reasoning about energy–frequency relationships, thereby enhancing interpretability. However, the method has several limitations. The selection of the number of energy bands and frequency bands requires empirical tuning depending on the task, implying that optimal parameters must be determined through iterative experimentation. Future research will incorporate Design of Experiments (DOE) techniques, such as the Taguchi method, to systematically optimize the fuzzy parameters and maximize the efficiency of FEFSN [20]. Furthermore, since fuzzy logic and CNN have fundamentally different computational structures, achieving fully stable training may benefit from separating their optimization processes or adopting dedicated optimization strategies for each module.

6. Conclusions

In this study, we proposed a novel explainable ECG domain adaptation model, which extends the conventional table-based fuzzy inference system into the spectrogram image domain. This extension enables the modeling of input uncertainty and continuous temporal variations through interpretable fuzzy rules within the time–frequency space. In ECG analysis, domain shifts often arise due to inter-patient variability and measurement noise, leading to degraded generalization performance of deep learning models. While deep learning approaches achieve high accuracy, they typically lack interpretability regarding their decision-making process. To address these challenges, our model integrates an FRIGM at the input layer that learns energy–frequency domain rules, providing a rule-based filtering mechanism and visual representation in the form of rule images. Experimental results demonstrated that FEFSN achieved performance comparable to, and in some cases superior to, a CNN baseline model, while offering explicit visual rationales for its inferences. The primary objective of this work is not to maximize absolute reconstruction quality, but to achieve interpretable noise suppression through rule-based filtering. Unlike GAN-based restoration models, FEFSN operates using fuzzy rules, which may result in lower absolute PSNR values. Nevertheless, FEFSN shows a slight improvement over the CNN baseline and, more importantly, enables clear visualization of which energy–frequency regions were emphasized during adaptation. This demonstrates that FEFSN enhances interpretability and reliability without hindering performance, indicating potential applicability to other models or more advanced future methods. Furthermore, we plan to extend the proposed framework to other biomedical signal domains—such as EEG and EMG—to validate its scalability and general applicability in broader physiological contexts.

Author Contributions

Conceptualization, T.-W.K. and K.-C.K.; methodology, T.-W.K. and K.-C.K.; software, T.-W.K. and K.-C.K.; validation, T.-W.K. and K.-C.K.; formal analysis, T.-W.K. and K.-C.K.; investigation, T.-W.K. and K.-C.K.; resources, K.-C.K.; data curation, K.-C.K.; writing—original draft preparation, T.-W.K.; writing—review and editing, K.-C.K.; visualization, T.-W.K. and K.-C.K.; supervision, K.-C.K.; project administration, K.-C.K.; and funding acquisition, K.-C.K. All authors have read and agreed to the published version of the manuscript.

Funding

This research was supported by the Basic Science Research Program through the National Research Foundation of Korea (NRF), funded by the Ministry of Education (No. 2017R1A6A1A03015496), and the Regional Innovation System & Education (RISE) program through the Gwangju RISE Center, funded by the Ministry of Education (MOE) and Gwangju Metropolitan City, Republic of Korea (2025-RISE-05-013).

Data Availability Statement

The data are available in a publicly accessible repository [17,18].

Conflicts of Interest

The authors declare no conflicts of interest.

References

  1. Triwiyanto, E.Y.; Lamidi, M.R.M. Recent Technology and Challenge in ECG Data Acquisition Design: A Review. In Proceedings of the 2021 International Seminar on Application for Technology of Information and Communication (iSemantic), Semarangin, Indonesia, 18–19 September 2021; pp. 144–150. [Google Scholar]
  2. Pereira, T.M.C.; Sebastião, R.; Conceição, R.C.; Sencadas, V. A Review on Intelligent Systems for ECG Analysis: From Flexible Sensing Technology to Machine Learning. IEEE J. Biomed. Health Inform. 2025, 29, 3398–3413. [Google Scholar] [CrossRef] [Scilit] [PubMed]
  3. Siddiqui, M.M.; Qureshi, A.A.; Al Mashani, K.S.; Shajanah, H.A. IoT Based ECG Monitoring System for ICU. In Proceedings of the 2024 International Conference on Signal Processing and Advance Research in Computing (SPARC), Lucknow, India, 12–13 September 2024; pp. 1–5. [Google Scholar]
  4. Ruby, E.D.K. A Review On Wearable Device Technology For Healthcare Industry Applications. In Proceedings of the 2023 2nd International Conference on Ambient Intelligence in Health Care (ICAIHC), Bhubaneswar, India, 17–18 November 2023; pp. 1–5. [Google Scholar]
  5. Plaza-Seco, C.; Baksh, M.; Barner, K.E.; Blanco-Velasco, M. DeepTWA-TM: Deep Learning T-Wave Alternans Detection in Ambulatory ECG via Time Analysis. IEEE J. Biomed. Health Inform. 2025, 29, 5585–5595. [Google Scholar] [CrossRef] [Scilit] [PubMed]
  6. Bibbò, L.; Angiulli, G.; Laganà, F.; Pratticò, D.; Cotroneo, F.; La Foresta, F.; Versaci, M. MEMS and IoT in HAR: Effective Monitoring for the Health of Older People. Appl. Sci. 2025, 15, 4306. [Google Scholar] [CrossRef] [Scilit]
  7. Islam, M.; Anderson, D.T.; Pinar, A.J.; Havens, T.C.; Scott, G.; Keller, J.M. Enabling Explainable Fusion in Deep Learning With Fuzzy Integral Neural Networks. IEEE Trans. Fuzzy Syst. 2020, 28, 1291–1300. [Google Scholar] [CrossRef] [Scilit]
  8. Imamguluyev, R. Integrating Fuzzy Logic with Deep Learning: A New Approach to Explainable Artificial Intelligence. In Proceedings of the 2025 6th International Conference on Mobile Computing and Sustainable Informatics (ICMCSI), Goathgaun, Nepal, 7–8 January 2025; pp. 1701–1706. [Google Scholar]
  9. Ye, Y.; Luo, T.; Huang, W.; Sun, Y.; Li, L. ECG-based Cross-Subject Mental Stress Detection via Discriminative Clustering Enhanced Adversarial Domain Adaptation. In Proceedings of the 2022 16th IEEE International Conference on Signal Processing (ICSP), Beijing, China, 21–24 October 2022; pp. 495–499. [Google Scholar]
  10. Li, H.; Zhang, Y.; Han, J.; Yan, Y.; Liu, Y.; Yang, H. AdapSQA: Adaptive ECG Signal Quality Assessment Model for Inter-Patient Paradigm using Unsupervised Domain Adaptation. In Proceedings of the 2022 IEEE International Conference on Bioinformatics and Biomedicine (BIBM), Las Vegas, NV, USA, 6–9 December 2022; pp. 3378–3384. [Google Scholar]
  11. Tang, M.; Zhang, Z.; He, Z.; Li, W.; Mou, X.; Du, L.; Wang, P.; Zhao, Z.; Chen, X.; Li, X.; et al. Deep adaptation network for subject-specific sleep stage classification based on a single-lead ECG. Biomed. Signal Process. Control. 2022, 75, 103548. [Google Scholar] [CrossRef] [Scilit]
  12. Chen, M.; Wang, G.; Ding, Z.; Li, J.; Yang, H. Unsupervised Domain Adaptation for ECG Arrhythmia Classification. In Proceedings of the 2020 42nd Annual International Conference of the IEEE Engineering in Medicine & Biology Society (EMBC), Montreal, QC, Canada, 20–24 July 2020; pp. 304–307. [Google Scholar]
  13. Lee, E.; Ho, A.; Wang, Y.-T.; Huang, C.-H.; Lee, C.-Y. Cross-Domain Adaptation for Biometric Identification Using Photoplethysmogram. In Proceedings of the ICASSP 2020—2020 IEEE International Conference on Acoustics, Speech and Signal Processing (ICASSP), Barcelona, Spain, 4–8 May 2020; pp. 1289–1293. [Google Scholar]
  14. Deng, F.; Tu, S.; Xu, L. Multi-source unsupervised domain adaptation for ECG classification. In Proceedings of the 2021 IEEE International Conference on Bioinformatics and Biomedicine (BIBM), Houston, TX, USA, 9–12 December 2021; pp. 854–859. [Google Scholar]
  15. Yi, P.; Si, Y.; Fan, W.; Zhang, Y. ECG Biometrics Based on Attention Enhanced Domain Adaptive Feature Fusion Network. IEEE Access 2024, 12, 1291–1307. [Google Scholar] [CrossRef] [Scilit]
  16. Hasani, H.; Bitarafan, A.; Baghshah, M.S. Classification of 12-lead ECG Signals With Adversarial Multi-Source Domain Generalization. In Proceedings of the 2020 Computing in Cardiology, Rimini, Italy, 13–16 September 2020; pp. 1–4. [Google Scholar]
  17. Lugovaya, T.S. Biometric Human Identification Based on Electrocardiogram. Master’s Thesis, Faculty of Computing Technologies and Informatics, Electrotechnical University “LETI”, Saint-Petersburg, Russia, 2005. [Google Scholar]
  18. Goldberger, A.L.; Amaral, L.A.N.; Glass, L.; Hausdorff, J.M.; Ivanov, P.C.; Mark, R.G.; Stanley, H.E. PhysioBank, PhysioToolkit, and PhysioNet: Components of a new research resource for complex physiologic signals. Circulation 2000, 101, e215–e220. [Google Scholar] [CrossRef] [Scilit] [PubMed]
  19. Park, S.R.; Lee, J. A fully convolutional neural network for speech enhancement. arXiv 2016, arXiv:1609.07132. [Google Scholar] [CrossRef] [Scilit]
  20. Laganà, F.; Faccì, A.R. Parametric optimisation of a pulmonary ventilator using the Taguchi method. J. Electr. Eng. 2025, 76, 265–274. [Google Scholar] [CrossRef] [Scilit]
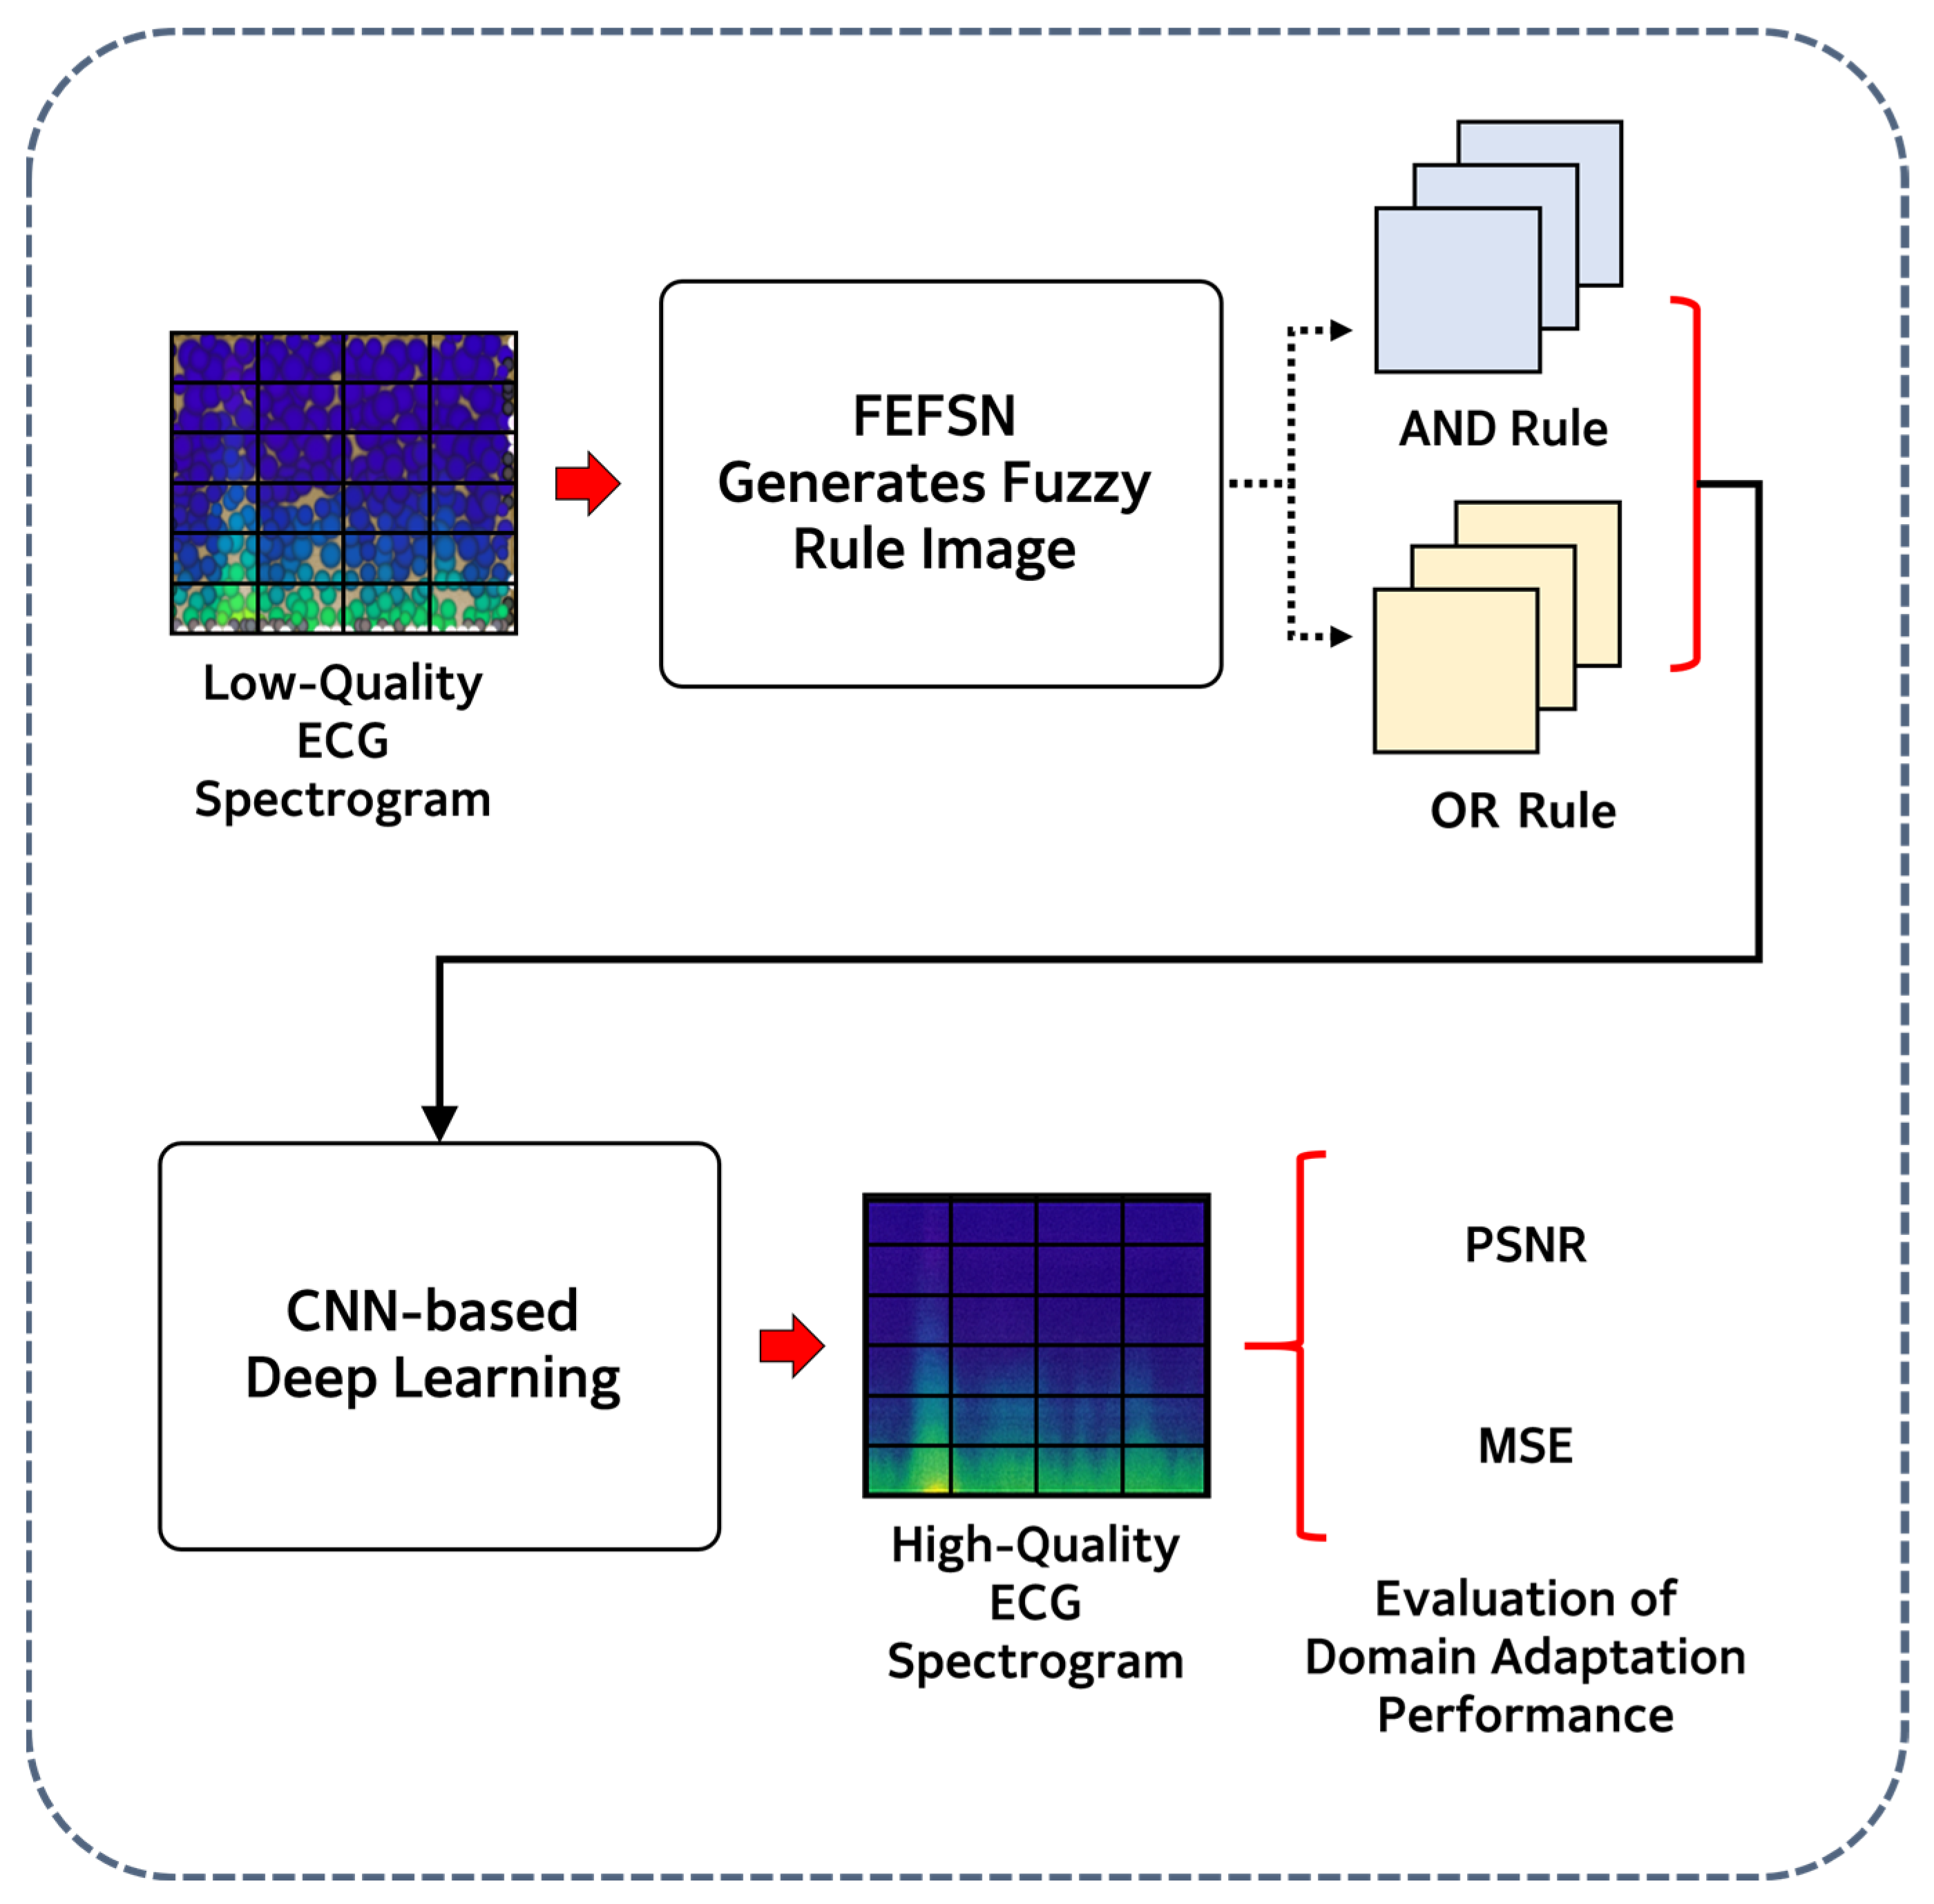
Figure 1. Rule-based ECG domain adaptation flow chart with FEFSN and deep learning.
Applsci 15 12909 g001
Figure 2. Overview of FEFSN application for fuzzy rule-based domain adaptation.
Applsci 15 12909 g002
Figure 3. Comparison of results of domain adaptation to noisy ECG spectrograms via FEFSN: (a) FEFSN prediction results, (b) ECG with noise, and (c) actual ECG.
Applsci 15 12909 g003
Figure 4. Visualization of the EMF designed for the decomposition of spectrograms into multi-channel input for fuzzy rule processing: (a) energy band 1 of EMF, (b) energy band 2 of EMF, and (c) energy band 3 of EMF.
Applsci 15 12909 g004
Figure 5. The multi-channel activity images generated from the input spectrogram after applying the EMF decomposition based on learned energy density bands: (a) modified input spectrogram by applying EMF 1, (b) modified input spectrogram by applying EMF 2, and (c) modified input spectrogram by applying EMF 3.
Applsci 15 12909 g005
Figure 6. FMF applied to the EMF-generated multi-channels: (a) FMF for rule 1 and (b) FMF for rule 2, illustrating the difference in frequency band emphasis per rule.
Applsci 15 12909 g006
Figure 7. Visualization of spectrograms filtered by frequency rule after EMF application: (a) output after applying FMF 1 (rule 1); (b) output after applying FMF 2 (rule 2).
Applsci 15 12909 g007
Figure 8. Visualization of the AND and OR rule images generated by FEFSN: (a) AND fuzzy rule 1 image, (b) AND fuzzy rule 2 image, (c) OR fuzzy rule 1 image, and (d) OR fuzzy rule 2 image.
Applsci 15 12909 g008
Figure 9. Visualization of the 3D ECG spectrogram and the learned EMF and FMF for rule 1.
Applsci 15 12909 g009
Figure 10. Visualization of the 3D ECG spectrogram and the learned EMF and FMF for rule 2.
Applsci 15 12909 g010
Table 1. Evaluation of ECG domain adaptation performance with CNN.
PSNR (Mean ± Std)MSE (Mean ± Std)
7.195 ± 0.0790.191 ± 0.004
Table 2. PSNR and MSE performance for ECG domain adaptation with FEFSN.
Frequency BandsEnergy DomainsPSNR (Mean ± Std)MSE (Mean ± Std)
227.189 ± 0.1440.191 ± 0.006
237.189 ± 0.1480.191 ± 0.007
247.195 ± 0.1130.191 ± 0.005
257.155 ± 0.1040.193 ± 0.005
327.170 ± 0.1450.192 ± 0.006
337.158 ± 0.0890.192 ± 0.004
347.203 ± 0.1080.191 ± 0.005
357.137 ± 0.1220.193 ± 0.005
427.215 ± 0.1360.190 ± 0.006
437.165 ± 0.0580.192 ± 0.003
447.122 ± 0.0870.194 ± 0.004
457.162 ± 0.1260.192 ± 0.006
527.196 ± 0.1020.191 ± 0.004
537.273 ± 0.1470.187 ± 0.006
547.194 ± 0.0940.191 ± 0.004
557.176 ± 0.1470.192 ± 0.006
Disclaimer/Publisher’s Note: The statements, opinions and data contained in all publications are solely those of the individual author(s) and contributor(s) and not of MDPI and/or the editor(s). MDPI and/or the editor(s) disclaim responsibility for any injury to people or property resulting from any ideas, methods, instructions or products referred to in the content.