Article

Effect of Different Biostimulant Application Forms on Some Geometrical and Mechanical Properties of Soybean Seeds

by
Artur Przywara
1,
Monika Różańska-Boczula
2,*,
Stanisław Parafiniuk
1,
Sławomir Kocira
1,3,
Agnieszka Żelazna
4 and
Grzegorz Łysiak
5
1
Department of Machinery Operation and Production Processes Management, University of Life Sciences in Lublin, 20-950 Lublin, Poland
2
Department of Applied Mathematics and Computer Science, University of Life Sciences in Lublin, 20-950 Lublin, Poland
3
Faculty of Agriculture and Technology, University of South Bohemia in České Budějovice, 370 05 České Budějovice, Czech Republic
4
Faculty of Environmental Engineering and Energy, Lublin University of Technology, Nadbystrzycka 40 B Str., 20-618 Lublin, Poland
5
Department of Food Engineering and Machines, University of Life Sciences in Lublin, 20-950 Lublin, Poland
*
Author to whom correspondence should be addressed.
Appl. Sci. 2025, 15(23), 12593; https://doi.org/10.3390/app152312593
Submission received: 24 October 2025 / Revised: 24 November 2025 / Accepted: 25 November 2025 / Published: 27 November 2025

Abstract

The physical and mechanical properties of soybean seeds are of fundamental importance for their practical use, as they determine the quality of seed material and the efficiency of technological processes in the food, feed, and oil industries, as well as the seeds’ ability to withstand transport, storage, and processing. Modern agriculture strives to increase productivity sustainably, and plant biostimulants are an innovative solution aiming to support plant development and to improve plant resistance. The purpose of this study was to determine how the form of an application of a biostimulant influences the geometrical and mechanical properties of soybean seeds. Two biostimulants (Asahi SL and Kelpak SL), both applied in three ways (universal spray nozzle, injector spray nozzle, and spray hoses), were tested in conjunction with three levels of moisture (6%, 8%, and 10%) on soybean seeds of the cultivar Abelina. The results demonstrated that the biostimulants did not have a significant effect on the sphericity of seeds, which remained at an average level: 0.74. Lower moisture of seeds resulted in their weaker tolerance to mechanical damage and a higher compression resistance factor. Seeds with a moisture content of 6% treated with Asahi SL using universal nozzle 12004C showed the highest cracking resistance (719.4 N∙mm−1) and ultimate force (245.1 N) compared with untreated seeds (672.4 N∙mm−1 and 216.4 N). The Asahi SL biostimulator increased the compression work up to the maximum force by 12% relative to the control, regardless of the spray application method, while the ceramic universal spray nozzle caused an almost 10% increase in maximum force compared with the control, irrespective of the type of biostimulator used. The findings indicate that biostimulants have a positive effect on the physical quality of seeds, with the choice of spray parameters playing a key role. The results provide practical guidelines for optimising agrotechnical treatments to produce seeds with improved quality parameters. They are also crucial for making an appropriate selection of sowing and seed-processing equipment, minimising seed loss and improving the efficiency of soybean production.

1. Introduction

Modern agriculture is facing a challenge of improving productivity while simultaneously alleviating pressure on the natural environment. The shrinking of available farmland, climate change, and the need to produce food sustainably require implementation of innovative technologies in plant production [1,2]. In this context, plant biostimulants, which activate plants’ natural physiological mechanisms, thereby supporting their development and stress tolerance, as well as improving the quality and volume of yields, are an increasingly popular solution [3,4].
Based on the EU Regulation 2019/1009 of the European Parliament and of the European Council, plant biostimulants are defined as certain substances or microorganisms which are applied to plants or to the rhizosphere in order to improve such plant characteristics as nutrient use efficiency, stress tolerance, yield quality, and availability of nutrients in the soil. Biostimulants are divided into several main categories: plant and algal extracts, amino acids and protein hydroisolates, humic acids, inorganic substances (e.g., silicon, phosphorites), and microorganisms such as mycorrhizal fungi and rhizospheric bacteria [3,5]. More attention in recent years has been paid to extracts from marine algae, which are a source of numerous bioactive substances, including natural plant hormones (auxins, cytokines, gibberellin), polysaccharides, vitamins, betains, and phenols—supporting the growth, resistance, and regeneration of plants [6,7,8,9]. Many studies [10,11,12,13] indicate that the use of biostimulants—especially ones of natural origin, e.g., algal extracts—can have a beneficial effect on the growth and development of plants and on the quality traits and physical characteristics of seeds.
Owing to the high content of protein and fat in seeds and their widespread use in food and feed production and in industries, soybean is one of the major crops grown worldwide. In Poland, the acreage cropped with soybean is increasing steadily, and with the advent of new cultivars and technologies, the plant is gaining popularity in Polish agriculture. For this reason, the use of biostimulants in soybean production can generate agrotechnical and economic benefits by supporting the growth of soybean plants and improving the profitability and efficiency of soybean production [14,15]. Biostimulants are beneficial to the development of the root system, photosynthesis, atmospheric nitrogen fixing, and water management in a plant, which ensures better drought tolerance, seed filling, and higher yield quality of plants [10,16,17,18]. Numerous studies have demonstrated that the use of biostimulants contributed to the improvement in such physicochemical properties of seeds as thousand seed weight, hardness, protein content, moisture, and structural integrity, which are significant for both processing and storage of seeds [19,20,21,22,23,24].
However, the effectiveness of biostimulants depends on the way they are applied [25]. Plant spraying is one of the most common foliar application methods, as it enables rapid and even absorption of active substances by leaves. The key factor that determines the effectiveness of an application treatment, apart from the physicochemical properties of biostimulants [26], is the selection of proper technical parameters of spraying, such as working pressure, type of working liquid, travel speed, and—above all—the type of sprayer used [27,28,29]. Operating pressure determines droplet size: excessively high pressure produces fine droplets that readily evaporate and provide uneven plant coverage, whereas too low a pressure limits the absorption of active substances. The composition of the spray solution, particularly the presence of adjuvants and biostimulants, affects the adhesion and penetration of the formulation, which may enhance seed filling and increase yield but, at improper concentrations, can lead to plant stress. The travel speed of the sprayer influences the uniformity of plant coverage—driving too fast reduces the amount of product deposited on the leaves and decreases seed uniformity. The type of nozzle determines the distribution and direction of the spray stream, affecting canopy penetration depth and the uniformity of the product’s action. An inadequate combination of parameters may result in reduced thousand seed weight, lower seed density, and an increased proportion of deformed seeds. Conversely, properly selected spraying parameters ensure the effective action of biologically active substances, leading to improved seed filling and higher physical seed quality. In this context, air-injector nozzle sprayers have gained popularity as a device limiting spray drift by generating larger droplets filled with air, which are less prone to be carried away by wind [28,30,31]. This is significant in regard to environmental protection because the drift of working solution is minimised and the contamination of adjacent areas is limited [28,32,33]. However, considering the larger diameter and smaller number of droplets, injector nozzles may reduce the accuracy of the plant canopy coverage, which in the case of biostimulants can limit the effectiveness of the preparation and lead to an uneven development of quality characteristics of seeds [34,35,36,37]. On the other hand, traditional flat-fan nozzles enable the generation of finer droplets, which can enhance the uniformity of target coverage and improve the effectiveness of biostimulants. However, small droplets are more prone to drift, which in practice is conducive to losses of the preparation and an uneven application over a field [38,39]. In consequence, local differences in the impact of the active substance arise, which can translate into variability in biometric traits and geometrical and mechanical properties of seeds.
Considering the above information, it is crucial to conduct studies on how the form of biostimulant application affects seeds’ physical and mechanical properties such as their mass, thickness, or resistance to compression. Biostimulants, as a novel means of supporting the growth and development of plants, are attracting increasing attention in agricultural practice and research. However, despite the growing interest in their application, there is a distinct gap in the literature concerning a comprehensive analysis of the effect of technical parameters of spray application and how they affect the efficiency of biostimulant application and their influence on the physical quality of seeds.
The purpose of this study was to determine how the manner in which a biostimulant is applied affects these aforementioned characteristics of soybean seeds. The analysis also included the seeds’ moisture content as a complementary parameter, which not only reflects seeds’ maturity and storability but can also significantly affect the interpretation of results of measurements of seed mass, thickness, and compression resistance. The data obtained from this experiment can contribute to a better insight into mechanisms of action of biostimulants and provide practical guidelines for optimisation of agrotechnical treatments for the sake of producing seeds with better quality parameters.

2. Materials and Methods

The research material consisted of seeds of the soybean cultivar Abelina, which is an early variety grown across all of Poland and characterised by high tolerance, stable yields, and high protein and fat content. The experiment was conducted in 2022–2024 at the Experimental Farm (University of Life Sciences in Lublin) in Czesławice (51°18′23″N, 22°16′2″E). The field experiment was established on loess soil with a silty clay texture, classified as a good wheat complex (soil class II), on plots measuring 20 m2 (4 m × 5 m). The soil used in the experiment was characterised by a high content of phosphorus (P—127.5 mg∙kg−1 soil), potassium (K—173.6 mg∙kg−1 soil), and magnesium (Mg—65.6 mg∙kg−1 soil). It had a neutral pH (pH at 1 mol KCl—7.1), and the organic matter content was 1.3%.
The two–factor field experiment was arranged in a completely randomised block design with three replications. The soybean cultivar used (vegetation period of 135–144 days) was sown following post-spring wheat.
The experimental factors included:
I. Type of biostimulant;
A. Control plot (no biostimulant);
B. Asahi SL—biostimulant;
C. Kelpak SL—biostimulant;
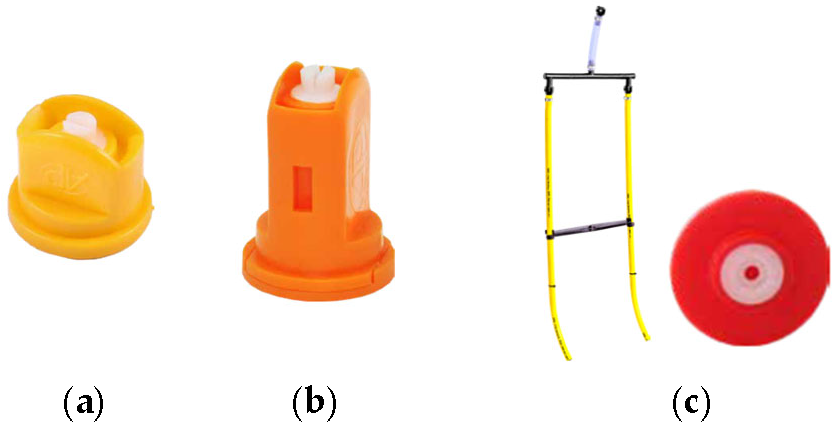
II. Application method (Figure 1);
a. Universal ceramic nozzle (type: 12004C—fine-droplet: Agroplast, Poland, Sawin);
b. Ceramic air-injector nozzle (type: 6MS04C—very coarse-droplet: Agroplast, Poland, Sawin);
c. Double RSM dribble hoses with ceramic orifice (type: RSM04C: Agroplast, Poland, Sawin).
Biostimulant doses were determined according to the manufacturers’ recommendations provided on the product labels (Table 1). To capture the visible interaction of interest, a double biostimulant application was performed at the stage of a fully developed trifoliate leaf on the third node (BBCH 13) and at the beginning of flowering (BBCH 61), with the following doses: Asahi SL, 0.5 L∙ha−1; Kelpak SL, 3.0 L∙ha−1.
Figure 1. Forms of the application of biostimulants Asahi SL and Kelpak SL: (a) universal ceramic nozzle; (b) ceramic air-injector nozzle; (c) hose drop system.
Applsci 15 12593 g001
Soil cultivation included the following operations: shallow ploughing + harrowing, harrowing, and pre-winter ploughing. In spring, the field operations consisted of harrowing, NPK fertilisation, cultivation with harrowing, seed sowing, harrowing, and a pre-emergence herbicide treatment.
Seeds were sown in rows spaced 30 cm apart, with 4 cm spacing between seeds. As a protective measure, the pre-emergence herbicide Boxer 800 EC (active ingredient: prosulfocarb, 800 g∙L−1) was applied. Prior to sowing, mineral NPK fertilisation was applied at the following doses: N, 30 kg∙ha−1 (ammonium sulfate, 34.5%); P, 40 kg∙ha−1 (superphosphate, 40%); K, 80 kg∙ha−1 (potassium salt, 60%).
Biostimulant application was carried out using a suspended field sprayer operating at a working pressure of 0.3 MPa and using of 300 L∙ha−1 of working liquid. The results were compared with the control treatment, in which no biostimulants were used, and the same amount of water was applied during spraying. Plant harvesting was performed at pod maturity (BBCH 89). At this stage, a third experimental factor—seed moisture content—was included in the analysis, with three levels: 6%, 8%, and 10%.
After harvest, seeds were cleaned and sorted out by removing damaged kernels. In order to obtain a uniform moisture content, the seeds were dried for 72 h by the weight-dryer method at 103 °C [40]. The experiment assumed three levels of seed moisture, i.e., 6, 8, and 10%. After drying, to ensure uniform moisture at the set level, the necessary amount of distilled water ( Q ) per sample was calculated from Formula (1) used by Kibar [41], and afterwards, the seeds were stored in polyethylene bags for 15 days in a refrigerator at a temperature 5 °C:
Q = W i ( M f M i ) 100 M f
where W i is the weight of a dry sample (g), M f is the expected moisture of the sample (%), and M i is the sample’s moisture before wetting (%).
Before the tests, the required number of samples was removed from the refrigerator and left to warm up to room temperature. A total of 50 soybean seeds were selected at random for each of the moisture levels tested, and then the seed thickness (dt), width (dw) and length (dl) were measured in each sample. Afterwards, the soybean seeds were submitted to uniaxial compression tests between two parallel plates of a Zwick/Roell Z005 (Germany, Ulm) testing machine equipped with a compression crosshead of a maximum force of 500 N. During the tests, the speed of the movable plate was constant at 3 mm∙min−1. Each test was carried out until a seed broke, while recording changes in the load force as a function of the displacement of the crosshead.
The testing machine enabled us to determine the following:
-
Ultimate force (maximum force)—Fmax (N);
-
Deformation at the ultimate force—Lmax (mm);
-
Compression work up to the maximum force—W (mJ).
Using the measured values, the following were calculated:
-
Conventional compression resistance factor as the value of the ultimate force to deformation at the ultimate force—RF = Fmax/Lmax (N∙mm−1) [42];
-
Compression work related to the seed thickness—W/dt (mJ∙mm−1);
-
Compression work related to the seed mass—W/m (mJ∙g−1).
The Corey shape Ffactor (SF), calculated from the formula below, served to determine the sphericity of seeds:
S F = d t d w · d l
where dt, dw, and dl are the shortest, intermediate, and longest axes of the seed, respectively [43].

Statistical Analysis

The statistical analysis aimed to verify the impact of the three factors (biostimulant, spray nozzle, and seed moisture) and their combinations on soybean seeds’ properties such as seed sphericity, mass, thickness, deformation, compression work up to the maximum force W, W/thickness, W/mass, and resistance factor (RF). In the initial part of the analysis, using the Shapiro–Wilk test, we investigated whether the characteristics measured for soybean seeds represented normal distribution. Because normal distribution was not confirmed in most cases, to verify the null hypothesis assuming that the tested characteristics did not differ significantly between the levels of the experimental factors, the non-parametric Kruskal–Wallis test was performed. Wherever the Kruskal–Wallis test showed statistical significance (p < 0.05), a post hoc analysis of multiple comparisons was carried out to identify homogenous groups. In the charts and tables, these groups are marked with lowercase letters. Furthermore, to determine the effect of geometrical parameters on the resistance properties of soybean seeds, the Spearman rank correlation coefficient was used. This tool enables one to assess the direction and strength of relationships between the analysed characteristics, and the resultant implications can be helpful in agronomic and technological practice.
Statistical processing of the data was performed using Statistica version 13.3, setting the significance level of tests set at α = 0.05.

3. Results

The research results concerning the effect of the biostimulant application form and seed moisture content on the selected geometrical properties of soybean seeds are presented below. Based on these findings, differences emerged in the mean values of the analysed characteristics obtained under the different experimental conditions. To evaluate the sphericity of soybean seeds, as determined by the Corey shape factor, it was necessary to measure three dimensions: length (dl), width (dw), and thickness (dt). Based on these results (Table S1, Supplementary Materials), significant differences were observed only in 2023. Seeds with 10% moisture content from plots treated with Asahi SL and sprayed with 12004C universal nozzles were significantly longer compared to control crops with seeds with 6% moisture content and seeds with 8% moisture content treated with Kelpak SL biostimulant and sprayed with 6MS04C injector nozzles. This translated into a higher seed mass in the former case. It can be suspected that the universal spray nozzle, generating smaller droplets, achieved a higher plant canopy coverage. This relationship is confirmed by the research of Sayinci et al. [44], which showed that a universal spray nozzle had a higher coverage rate—of 22.9 to 26.7% (depending on the spray height: from 40 cm to 80 cm)—than air-injector nozzles, which provided coverage ranging from 8.9 to 9.6%.
Another reason could be the reduced surface tension due to the presence of a biostimulant in the water [45,46]. The length, width, and thickness of soybean seeds, depending on the applied biostimulant, form of application, and moisture, were averaged over the years 2022–2024 and are presented in Figure 2.
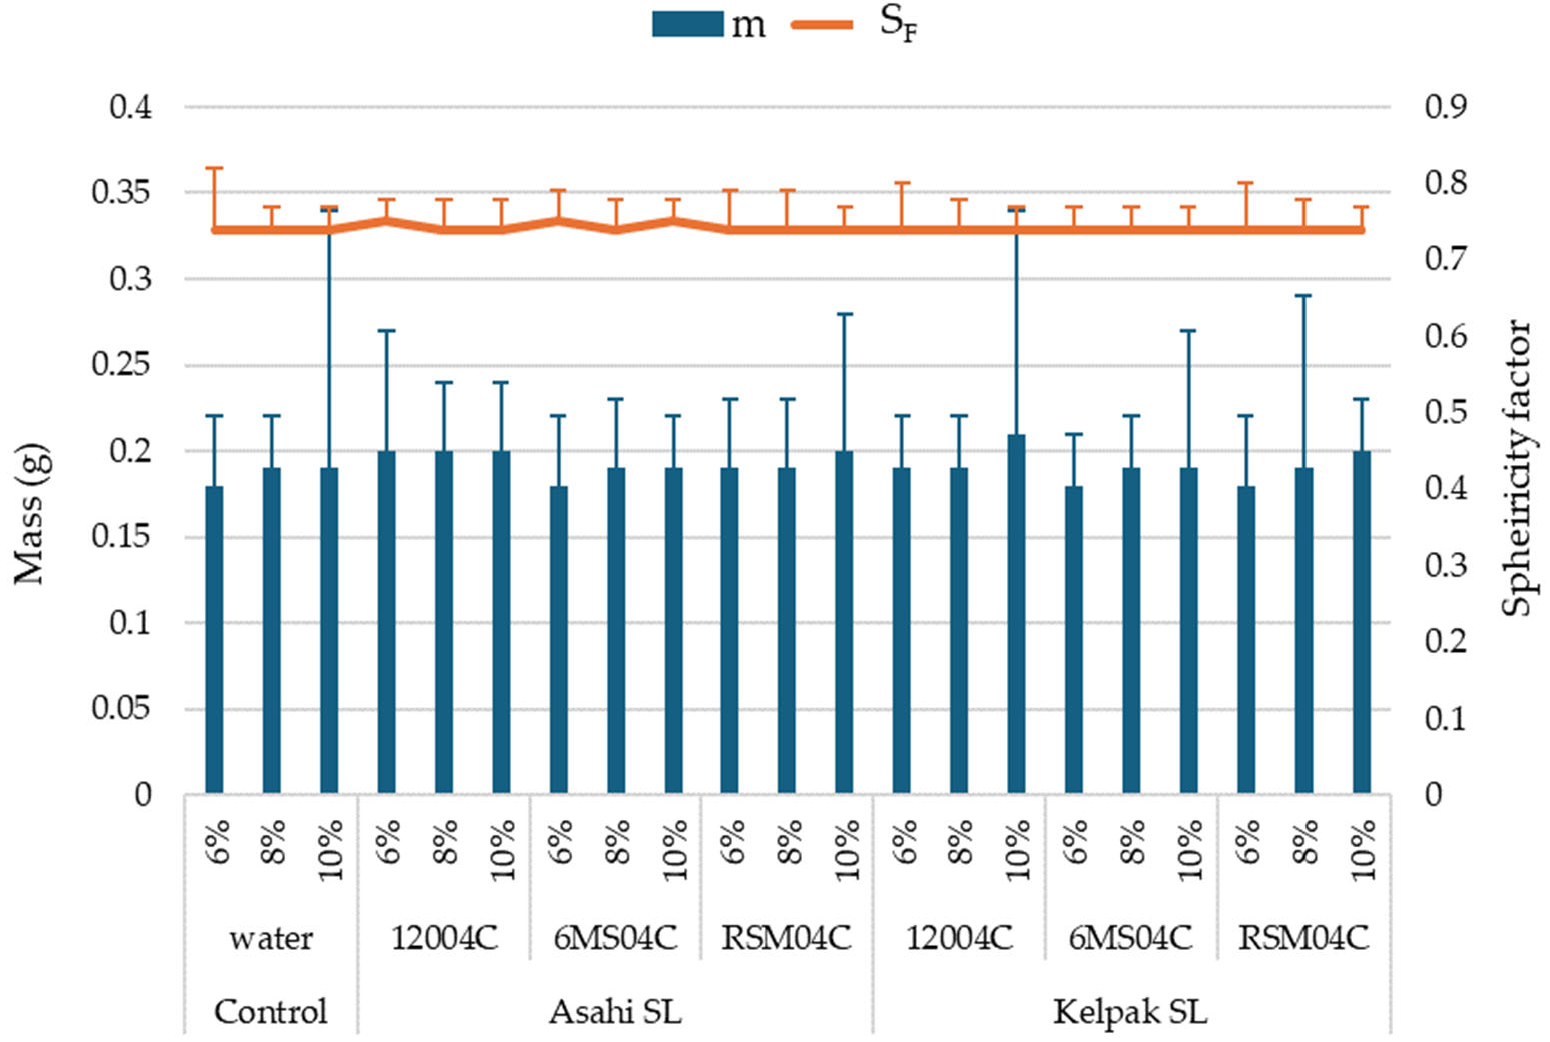
Considering the values of the sphericity factor SF (Table S2, Supplementary Materials), it emerges that they were similar in nearly all cases. Regardless of the form of the biostimulant and the way it was applied, as well as the levels of seed moisture content, the sphericity of seeds was constant and remained at an average level of 0.74. In very few cases, its value was 0.73 or 0.75 (Figure 3).
Seeds of the soybean cultivar Abelina were characterised by different degrees of resistance to mechanical damage depending on the analysed factors. The results collated in Table S3 (Supplementary Materials) justify the conclusion that an average force needed to crack soybean seeds with 6% moisture content was similar independently of the form of application and the biostimulant used (Figure 4A). On the other hand, the soybean seeds with a moisture content of 8% formed two homogenous groups, indicating that the use of the 6MS04C injector nozzle to apply the biostimulant Kelpak SL resulted in lower resistance to compression. As regards seeds with 10% moisture, the least resistant to compression were the seeds originating from the control cultivation, where no biostimulant was applied. When Kelpak SL was sprayed, regardless of the form of application, the force needed to damage the seeds was significantly lower at higher moisture contents (8 and 10%). In turn, the application of Asahi SL led to an increase in the average ultimate force by about 15 N relative to the seeds with 6% moisture treated with Kelpak, irrespective of the method of application. A higher water content in seeds (10%) resulted in the average ultimate force increasing by about 12 N when the preparation Kelpak SL was applied. The most evident rise in the ultimate force needed to crack soybean seeds was noted with the universal nozzle 12004C used to spray Asahi SL over the plants, whereas the lowest ultimate force was recorded in the case of seeds with 10% moisture content grown on the control plots. The seeds that were most resistant to breaking were the ones whose moisture content was 6% and which had been treated with the biostimulant Asahi SL sprayed through the 12004C universal spray nozzle (245.11 N). Using the same type of a nozzle, the highest resistance to compression was determined for seeds with a moisture content of 8% (203.94 N on average) compared to 178.34 N for seeds with moisture of 10%, both sprayed with the biostimulant Kelpak SL.
The least resistant to damage were the soybean seeds with the moisture content of 10%, which cracked at an average force lower by around 104 N than that needed to damage the hardest seeds, which reached 141.62 N in the configuration without the application of biostimulants. The lowest values of the force causing damage to seeds with 6 and 8% moisture were obtained when the biostimulant Kelpak SL was applied through the 6MS04C injector nozzle, where they equalled 213.80 N and 171.66 N, respectively. The resistance tests on seeds treated with either biostimulant applied using a RSM04C spray hose yielded results closer to the ones obtained from the variants with 6MS04C injector nozzles.
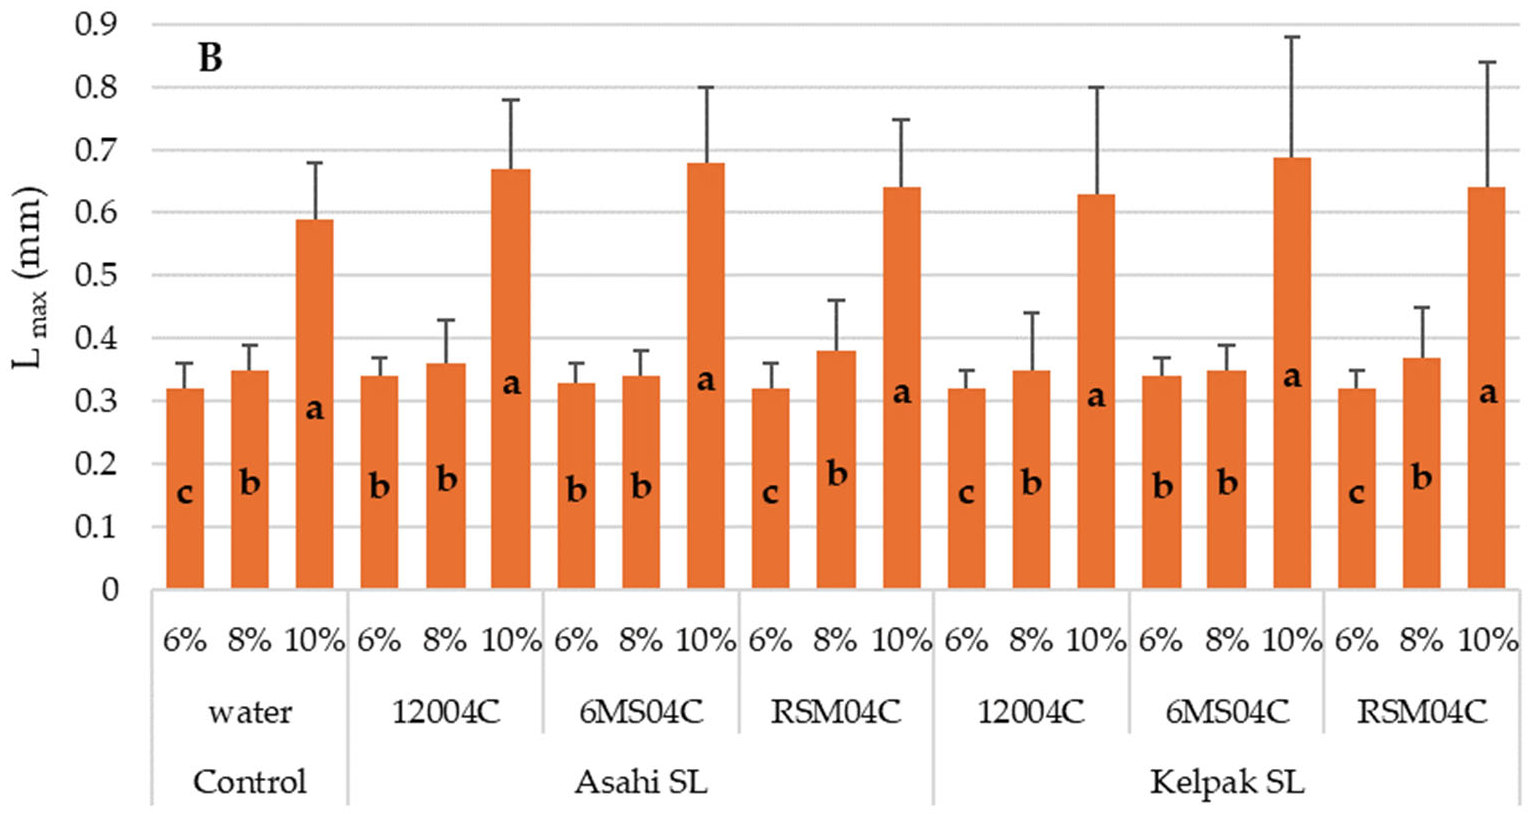
When analysing deformation at the ultimate force (Lmax) resulting from the application of maximum force to soybean seeds, it emerged that the aforementioned parameter was the highest for seeds with moisture of 10% (Figure 4B) and did not differ in a statistically significant manner between the types of the biostimulant or the forms of its application (0.59–0.67 mm). These values were nearly twice as high as the ones obtained for seeds with a moisture content of 6% and 8%, where the average deformation ranged within 0.32–0.38 mm. Furthermore, at 6% seed moisture, significantly higher values of deformation were recorded for seeds treated with a biostimulant through the 6MS04C spray than in the control group or in the 12004C and RSM04C experimental variants.
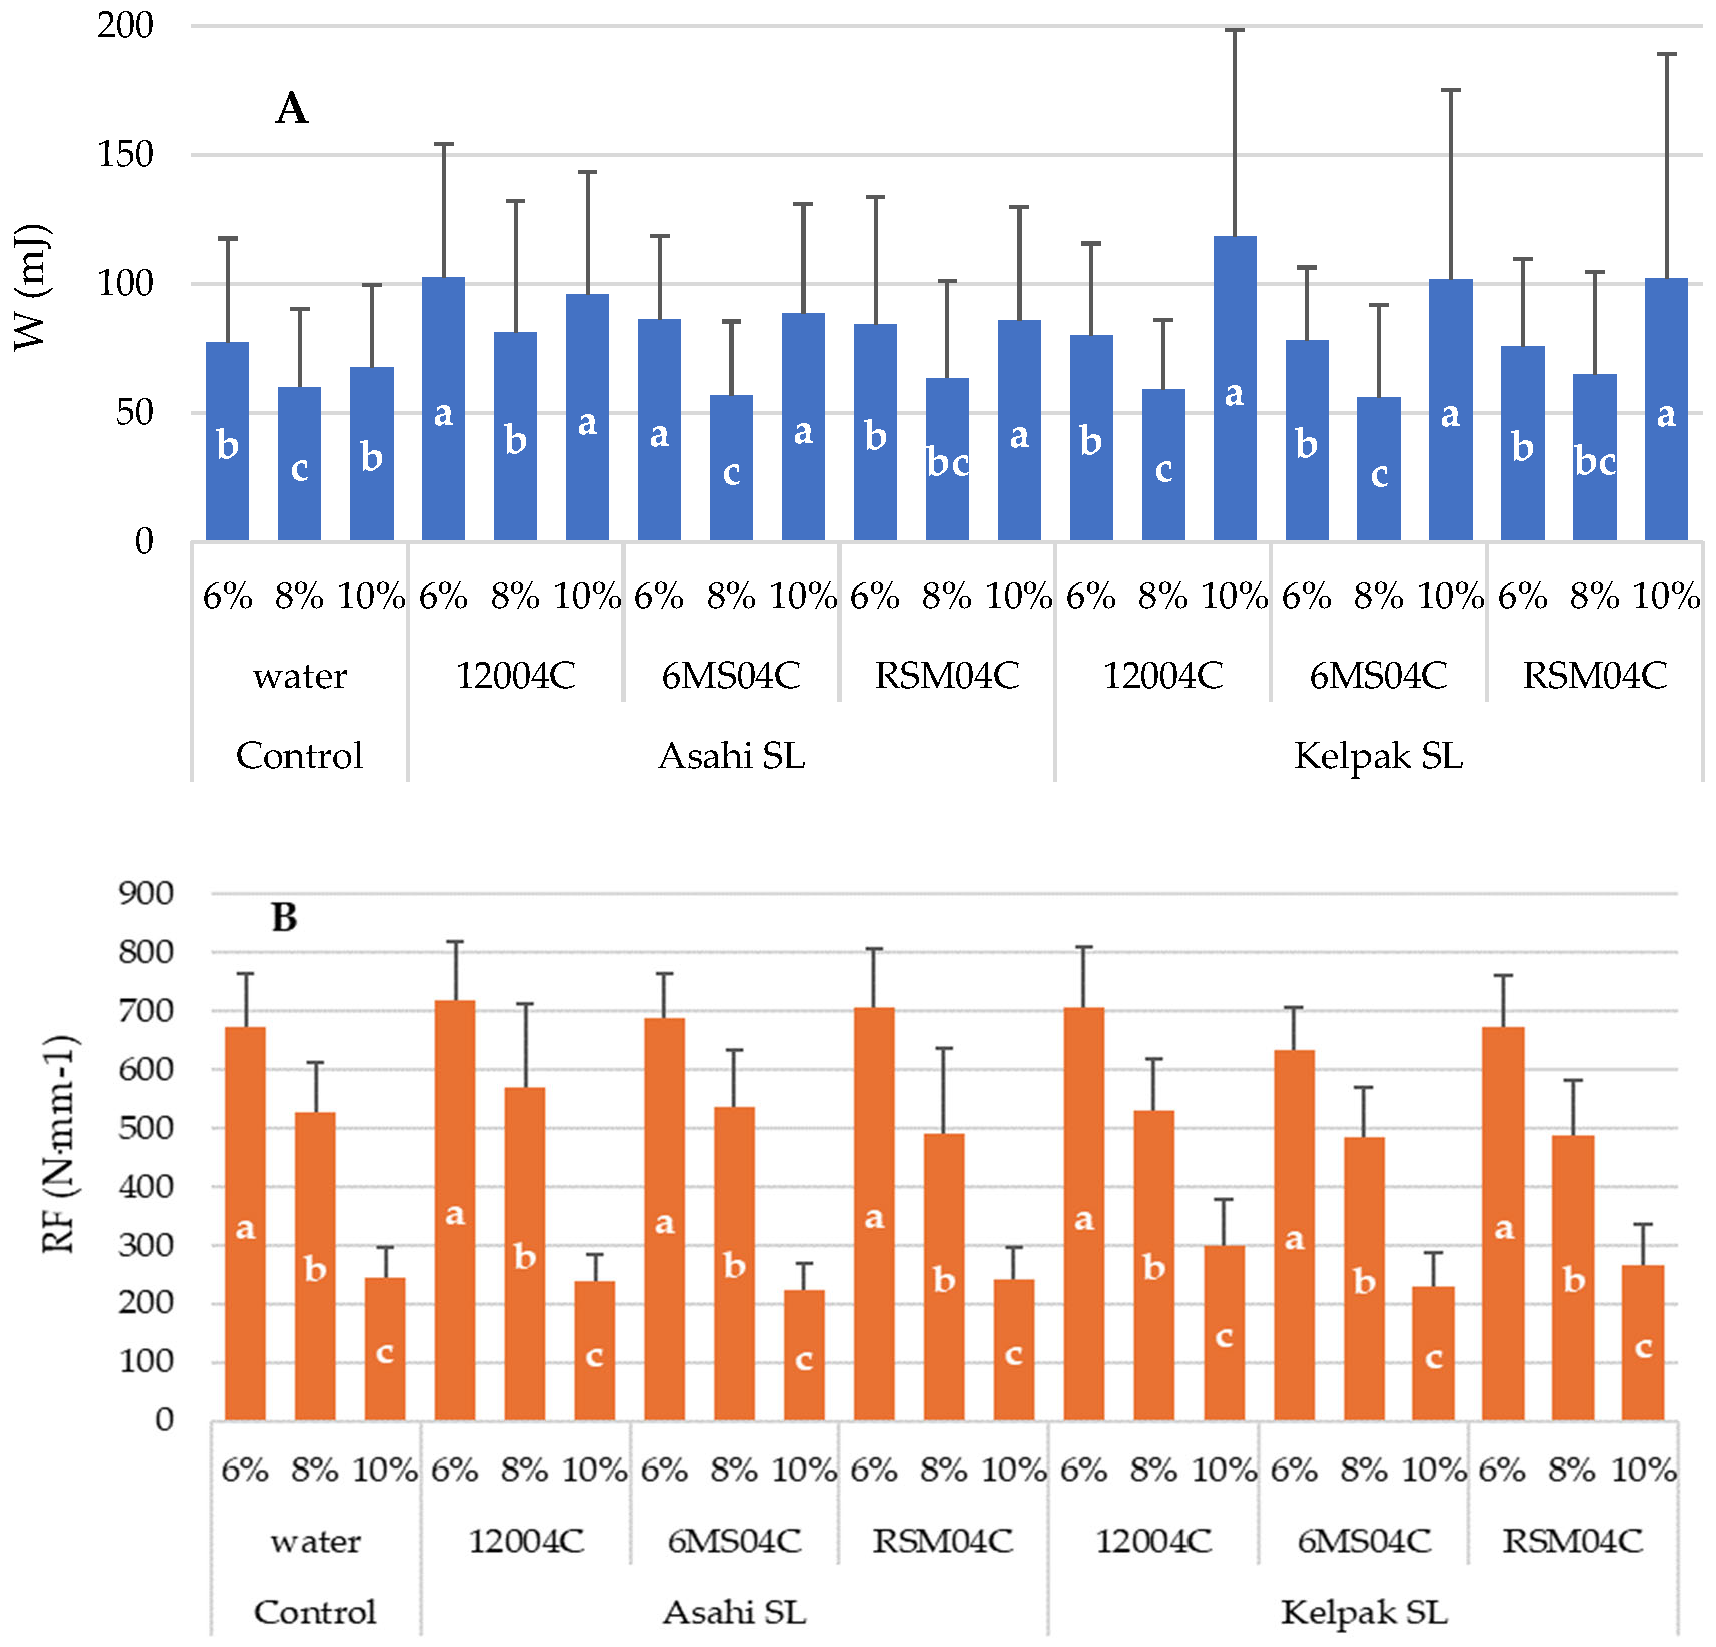
According to the results presented in Table S4 (Supplementary Materials), significantly more energy was required to destroy soybean seeds with a 10% water content, excluding the control group, in which the ultimate force was significantly lower, at 67.57 mJ. In the case of Kelpak SL, the average force at 10% moisture reached 107.38 mJ, whereas for seeds from plants treated with Asahi SL, it equalled 90.12 mJ (Figure 5A). On the other hand, the lowest values of energy sufficient to crack the seeds were observed at the seed moisture content of 8%. In particular, a force of 55.85 mJ was needed to crack seeds with 8% moisture content sprayed with a 6MS04C injector nozzle.
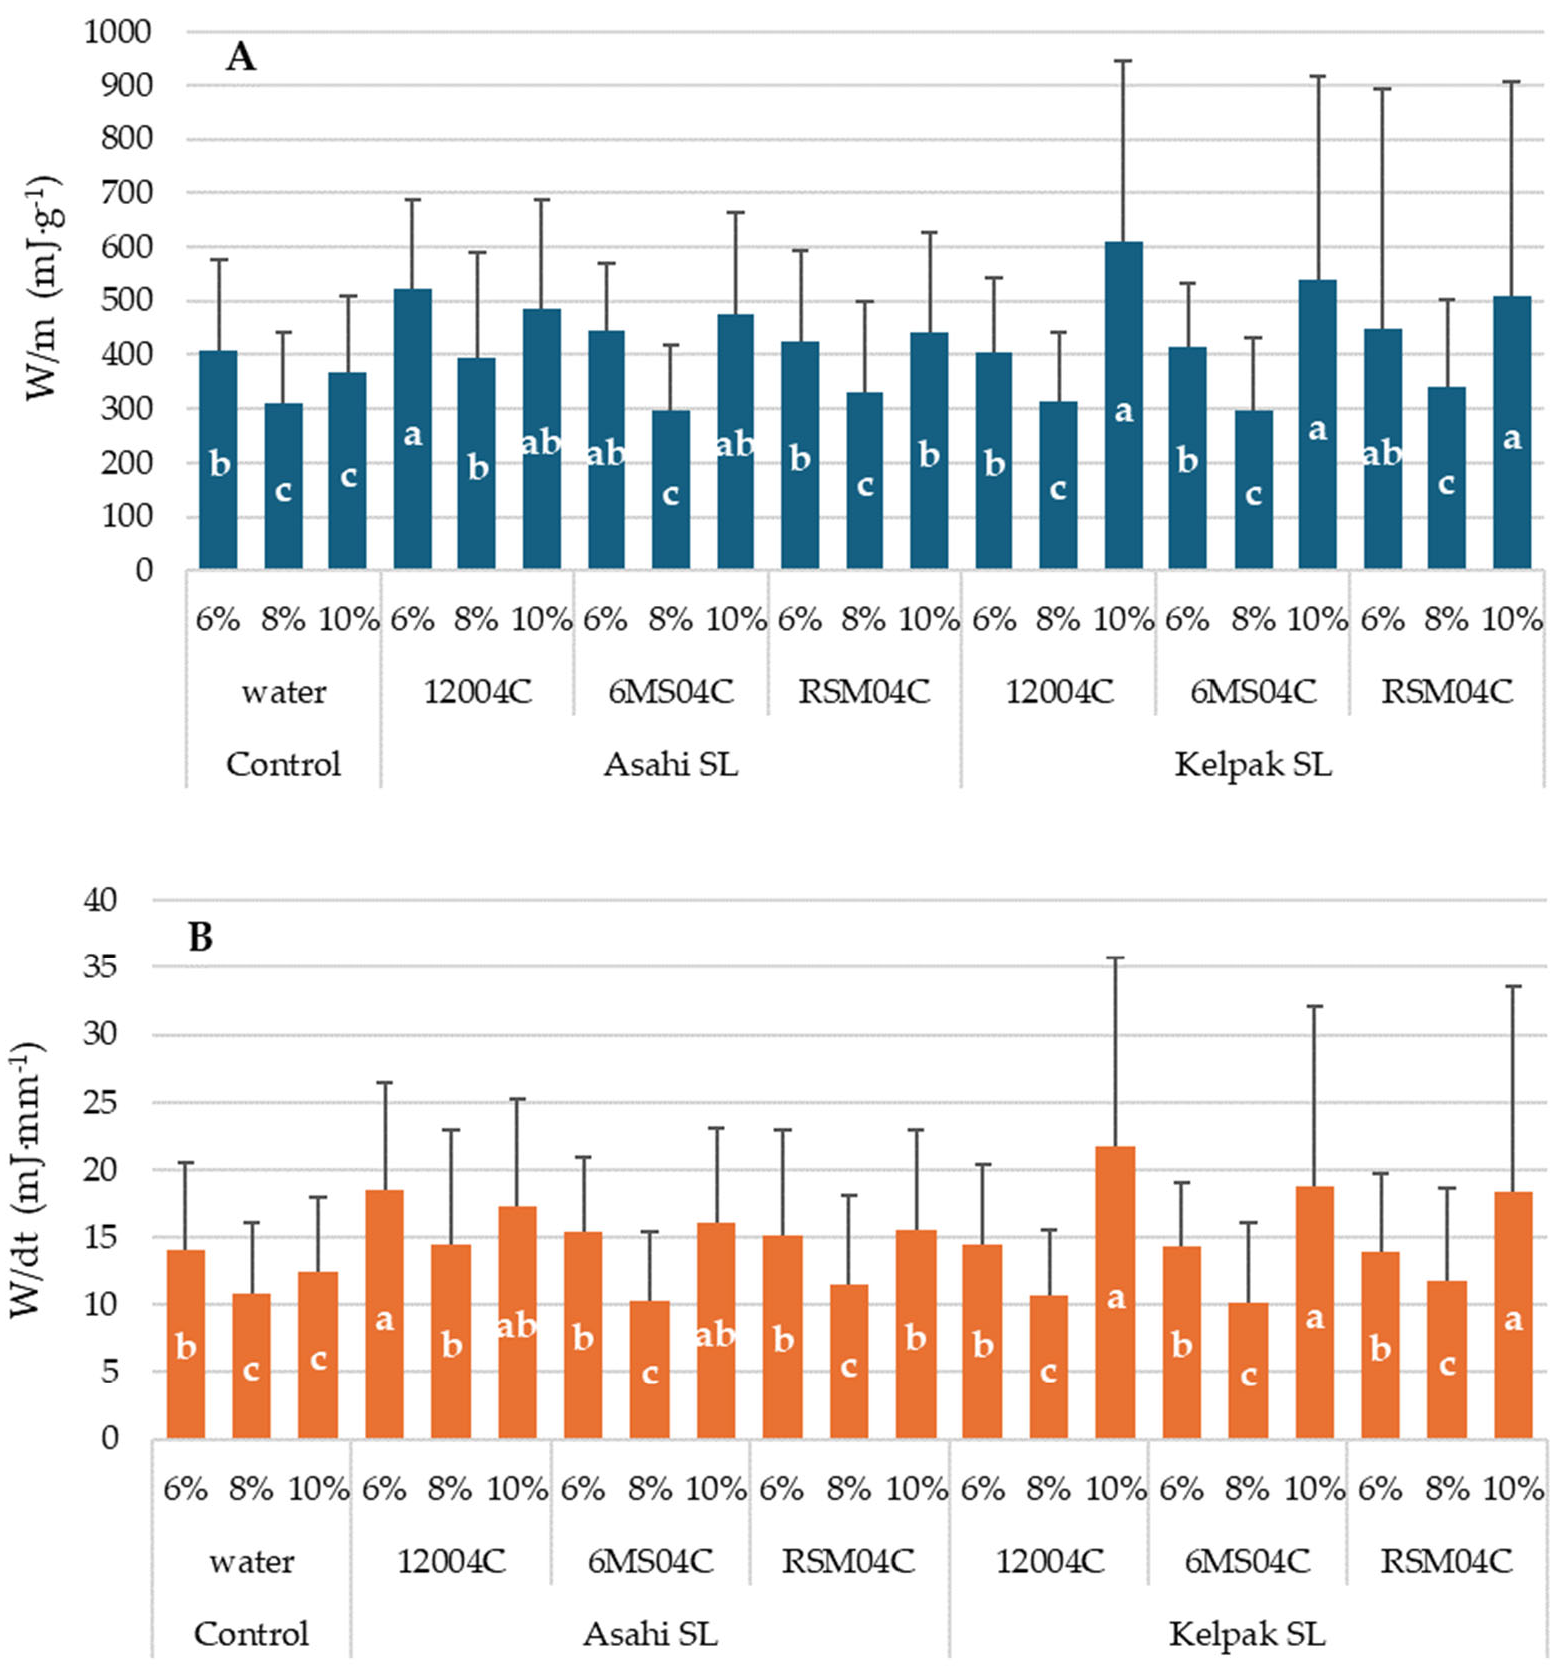
The highest values of compression work, in relation to both mass (553.06 mJ∙g−1 on average) and thickness (19.63 mJ∙mm−1 on average) of soybean seeds, were observed in seeds with a water content of 10% harvested from plants treated with Kelpak SL (Table S5, Supplementary Materials, and Figure 6). In contrast, the lowest values of compression work were recorded for seeds with 8% water content (314.95 mJ∙g−1 for mass and 11.27 mJ∙mm−1 for thickness, on average). An exception to the trend among seeds with this moisture percentage concerned the compression work relative to mass or to seed thickness, both of which were higher when Asahi SL was applied to plants through the 12004C universal spray nozzle (394.71 mJ∙g−1 and 14.45 mJ∙mm−1, respectively).
Considering the conventional compression resistance factor (RF, Table S4, Supplementary Materials) as the value of the ultimate force to deformation at the ultimate force, its lowest value was noted whem Asahi SL was applied with the 6MS04C injector nozzle and the seeds’ moisture content was 10% (223.30 N∙mm−1); as such, it was lower by 25 N than the average resistance (248.67 N∙mm−1) in the lowest class distinguished for this factor (Figure 5B, c). In the same cultivation variant (Asahi SL), but with the use of the 12004C universal spray nozzle and with the moisture content of seeds equal to 6%, the highest value of the analysed factor was achieved, i.e., RF = 719.35 N∙mm−1. This value was higher by 34 N than the average resistance noted in the highest class determined for this factor, where it equalled 684.85 N∙mm−1 (Figure 5B, a).
The use of the 12004C universal nozzle resulted in the highest RF values across all moisture groups of soybean seeds. It is also worth noting that the values of this factor increased as the seeds’ moisture content decreased (Spearman’s coefficient = −0.88).
The following part of this article is dedicated to the analysis of the impact of the main factors involved in the experiment (biostimulant, type of spray technology, moisture content of seeds) on the geometrical and resistance parameters of soybean seeds. The results, averaged for the data collected in years 2022–2024, are presented in Table 2, Table 3, Table 4 and Table 5.
On the basis of Table 2, and considering the biostimulant applied, it can be asserted that the parameters denoting the ultimate force, thickness of seeds, compression work up to the maximum force, and compression work related to the seed thickness and to the mass of seeds differed significantly (p-value < 0.05). As regards the other parameters, no significant influence of a biostimulant was determined.
When analysing Table 3, it emerges that the force needed to damage the seeds was significantly greater when the biostimulants were applied than in their absence. The use of Asahi SL also had a significant effect on the increased thickness of seeds. Considering such parameters as the compression work up to the maximum force and the compression work related to the seed thickness and to the mass, no significant differences were found between the control and Kelpak SL. However, for the biostimulant Asahi SL, the noted values were higher than those obtained from the control plots or the plots treated with Kelpak SL.
With respect to the way the biostimulants were sprayed (Table 2, type of spraying), it can be concluded that such parameters as ultimate force, compression work up to the maximum force, and compression work related to the seed thickness and the mass, as well as the resistance factor, differed significantly and reached the highest values when the Agroplast 12004C universal nozzle was used (Table 2, p-value < 0.05). However, no significant impact of the type of spray was determined in the case of the other characteristics tested.
The resistance factor (RF), which is the ratio of the ultimate force to the deformation at the ultimate force, was significantly differentiated between seeds from the plants sprayed with a universal versus an injector nozzle and from those sprayed with a universal nozzle and a hose drop system. However, no significant differences were determined with respect to the mean values of the RF between the control and any of the three spray forms (Table 4).
The soybean seeds analysed in this study were submitted to compression tests at different seed moisture levels. Moisture proved to be a significant factor for such parameters as ultimate force, deformation, compression work up to the maximum force, compression work related to seed thickness and mass, and the resistance factor RF (Table 2, p-value < 0.05). As for the sphericity and the mass and thickness of seeds, no significant influence of seed moisture was detected.
According to the data included in Table 5, the greatest force was needed to break seeds with 6% moisture, while the seeds with 10% moisture were damaged by the smallest force. Similar findings were obtained as regards the deformation that occurred when the force needed to damage the seeds was applied. The greatest deformation was recorded for seeds with 10% moisture. Considering such characteristics as the compression work up to the maximum force and, consequently, the compression work related to the seed thickness and to seed mass, there were no significant differences between seeds with 6% and 10% moisture, while significantly lower values were determined for seeds with 8%. An analysis of the resistance factor (RF) showed that its values were significantly differentiated between all the seed moisture levels. More specifically, the highest values of the RF were noted for 6% and the lowest ones for 10% seed moisture.
Finally, an analysis of the values of the rank correlation coefficient determined for the soybean seeds’ geometrical and resistance parameters proved that such mechanical parameters as the ultimate force, compression work up to the maximum force (W), and the W/dt ratio were positively correlated with the mass, thickness, width, and length of soybean seeds. Thus, the heavier, thicker, wider, and longer the seeds are, the more resistant they become to mechanical damage due to the applied Fmax, W, and W/dt (Table 6).
It can also be noted that as the thickness of seeds increases, the sphericity factor (SF) increases moderately.

4. Discussion

One of the most serious problems in cultivation of leguminous plants is the high sensitivity of their seeds to mechanical damage occurring during the seed threshing, cleaning and drying, transport, storage, and processing, which causes considerable quantitative and qualitative losses. High sensitivity of legume seeds to mechanical damage is mainly due to their structure. Unlike cereal grains, they have two cotyledons, between which a gap may form if the water content is low, which makes them more prone to damage; for example, they can break in half [47]. A very significant factor involved in the damage of legume seeds is therefore their moisture content, which affects the elasticity and resistance to damage of both the cotyledons and the seed coat [48,49].
Biostimulants, as a modern means of supporting the growth and development of plants, are gaining increasing importance in both agricultural practice and research. However, as the amount of available data pertaining to the geometrical and mechanical properties of soybean seeds from plants treated with biostimulants is limited, a need has arisen to carry out detailed analyses in this regard. This research paper presents results of a study in which two biostimulants were applied in cv Abelina soybean cultivation, using different forms of biostimulant application and including different seed moisture levels as another experimental factor. The results confirm the significant role of both the biological and technological factors in the quality of seeds obtained. The findings indicate that regardless of the applied biostimulant and type of spray device, the sphericity factor (SF) of soybean seeds was within the range of 0.73–0.75. The sphericity factor shows to what extent a product with a given shape is spherical. This is particularly important when selecting a sowing disc. An adequate choice helps to optimise the equipment and reduce losses and damage in the early stages of cultivation, as well as during harvest and post-harvest. The values of this factor determined in our study are similar to the ones reported in the literature, and any differences may be a consequence of the method adopted for calculating the sphericity factor. Deshpande et al. [50] demonstrated that the sphericity of soybean seeds with different moisture content (8.7–25%) was in the range of 0.806–0.816, with a higher moisture content leading to a slight increase in the seeds’ sphericity, a finding that our study does not confirm (rs = −0.04). In turn, a study by Hauth et al. [51] determined that this factor ranged from 0.85 to 0.89 for moisture levels varying from 10 to 33%. The results most similar to ours were reported by Polat et al. [52], who determined that the sphericity of seeds was from 0.75 to 0.72 for seed moisture of 6.7% and 15.3%, respectively. In our study, the fact that the SF values remained on a stable level suggests that regardless of the form of application, the biostimulants did not significantly affect the geometry of the Abelina cultivar seeds, which may have positive implications for the further processing steps such as sorting or sowing soybean seeds.
The size of soybean seeds after the application of either of the biostimulants did not reveal the emergence of any significant difference, although the mean values of the seeds’ thickness, width, and length were, in most cases, slightly higher in biostimulant-treated plants. With respect to results achieved in other studies [41,52,53,54], where conventional cultivation methods were used, the results concerning the size of seeds were in similar ranges. The same outcomes were obtained in terms of seed mass.
The observed increase in the length and mass of seeds following the application of Asahi SL through the 12004C nozzle and at 10% seed moisture could be a consequence of the better coverage of plants with finer droplets and a lower surface tension of the working solution. A study by Krawczuk et al. [25,46] demonstrated that the physical properties of the liquid sprayed on plants and the type of sprayer used were the factors influencing the height of the first pod, height of plant, and protein content. Moreover, using universal nozzles for the application of a biostimulant proved to be more economically viable than using nozzles with an air injector. This can attest to a positive influence of a biostimulant on the development of plants, helping them to form full and well-filled seeds. Similar results were achieved by Rymuza et al. [23], who showed that foliar application of a biostimulant increased the mass of a thousand seeds of soybean by approximately 13% depending on the type of a substance applied. This further supports the assumption that an adequate choice of spraying parameters may have a considerable impact on the physical quality of yields.
Evident differences were observed in the mechanical parameters of seeds, especially at different seed moisture levels and with varying forms of biostimulant application. Other research [50,51,53,55,56,57,58] provides evidence that seed moisture content influences seeds’ susceptibility to damage—lower moisture content corresponds to higher mechanical resistance, which is confirmed by the trend detected in our study. However, this resistance to mechanical damage depends on a specific variety of plants [54,59]. The highest resistance to cracking was demonstrated by seeds which had a moisture content of 6% and were treated with Asahi SL applied through a 12004C universal nozzle. The force needed to damage them was 245.11 N, and this was the highest value determined for the aforementioned biostimulant compared to the other application forms (6MS04C injector nozzle, 228.81 N; RSM04C hose drop systems, 227.17 N) and to spraying with Kelpak SL or the control. Overall, raising the seed moisture content to 10% led to a considerable decline in the value of the ultimate force. However, the application of the preparation Kelpak SL with any of the methods resulted in a higher resistance of seeds versus the control or the plots treated with Asahi SL. A possible reason for this is that the former biostimulant has a different mechanism of action, based on marine algae, which may favour more intensive biomass growth at the expense of seed quality [60]. The lowest values of ultimate force for the biostimulant Asahi SL, aside from the control cultivation, were obtained for all application methods: 12004C nozzle, 156.05 N; 6MS04C nozzle, 148.91 N; hose drop systems, 151.10 N. These results are comparable to the ones obtained by Kuźniar et al. [59], who carried out tests on 10 soybean cultivars and determined that the ultimate force was 144.4 N at a seed moisture of 10% and 166.1 N at 7%. This comparison shows how a difference of 1% in seed moisture considerably changes the seed’s resistance to compression.
As expected, an increase in the moisture content of seeds raised their susceptibility to deformation. The deformation parameters were twice as high for seeds with moisture of 10% as for ones with 6% water content. An increase in the moisture of seeds resulted in a considerable decline in ultimate force and, consequently, an increase in deformation and energy. A study by Kuźniar [59] revealed that seeds undergoing damage at the application of the smallest force were also most susceptible to deformation.
The relationship between moisture and destruction energy was also confirmed. The highest energy needed to destroy seeds relative to the control was determined for both tested biostimulants: 107.38 mJ for Kelpak SL and 90.12 mJ for Asahi SL at seed moisture of 10%. Decreasing the moisture content in seeds to 8%, combined with the use of a 6MS04C injector nozzle, contributed to decreasing this energy to 55.85 mJ. This trend is also verified by the study conducted by Tavakoli et al. [56], in which the difference in the amount of energy destroying seeds with a moisture content of 6.92 to 21.19% was 58.34 mJ.
In our study, we found a high correlation between ultimate force and conventional factor of resistance to compression with seed mass, compression work related to the seed mass, and seed mass with seed thickness. These findings are supported by the results reported by Kuźniar et al. [47], who obtained an RF value of 616.3 N·mm−1 for seeds with moisture of 13%. This means that the mass of seeds has a stronger influence on their resistance to mechanical damage, especially on the amount of ultimate force needed and the conventional factor of resistance to compression. Moreover, a strong and negative correlation was observed for deformation and the RF (rs = −0.73), which should be interpreted as a decreasing length of deformation caused by the increasing ultimate force. This happens when we deal with seeds with a lower moisture content. On average, the value of this index, depending on the experimental variant, oscillated from 248.67 N·mm−1 for seed moisture of 10% to 684.85 N·mm−1 for seeds with moisture of 6%.
To summarise, the application of the biostimulants Asahi SL and Kelpak SL in the cultivation of crops, including legumes, generates a beneficial effect on yield-forming traits, yield volumes, and chemical composition. This is confirmed by Iwanicka [61], who demonstrated even better effects of the biostimulant Kelpak SL, which is a preparation of natural origin, relative to a synthetic preparation such as Asahi SL. Moreover, the results presented in this paper are congruent with the current trends in the research on sustainable intensification of crop production, where the use of biostimulants in conjunction with a precision application technology improves the quality of yields without increasing the chemical pressure on the natural environment.
Although the conducted study did not reveal significant differences in the effects of biostimulant application methods on the geometric and mechanical properties of soybean seeds, it is advisable to consider the degree of plant coverage when selecting the device (nozzle) used for spray delivery. A higher level of coverage ensures better penetration of the applied formulation. Universal nozzles are structurally designed as a compromise, prioritising convenience and broad applicability rather than maximum effectiveness under all conditions. The nozzle type strongly influences droplet size, deposition, and drift, which directly affects the efficacy of treatments. Seed moisture, on the other hand, is a key factor influencing seed quality. Excessive moisture content can lead to seed damage during mechanical cleaning and transport, and it also promotes microbial development. Cracking, abrasion, and micro-damage negatively affect germination energy and seed viability, thereby reducing the seeds’ value as sowing material. Conversely, overly hard seeds may exhibit delayed germination. In the present study, three moisture levels were examined, and it was observed that decreasing water content increased resistance to mechanical damage, as well as the RF index. Taking these relationships into account, it is essential that soybean seed moisture does not exceed 13%, as recommended for safe storage or transport.
The present study is subject to several limitations. The experiment was conducted using a single soybean cultivar (Abelina) and two specific biostimulants, which restricts the generalisation of the findings. Moreover, only selected geometrical and mechanical seed parameters were analysed, and the influence of environmental factors outside the controlled experimental conditions was not assessed. Future studies should therefore include a wider range of cultivars, biostimulant formulations, and field conditions to confirm and expand the results obtained.
The research aimed to verify whether various application methods of biostimulants have a significant impact on the geometric and mechanical properties of soybeans. Undoubtedly, the strength of the seed coat is crucial for the storage and processing of seeds, and therefore, a further direction of work could be research on changes that occur at the biological level of soybean seeds. This may allow us to describe the mechanism by which the applied treatments influence their quality.

5. Conclusions

(1)
No significant differences were determined in terms of the seed size (thickness, width, length) and seed mass between the variants with the use of a biostimulant and the control. The use of the biostimulants Asahi SL and Kelpak SL, irrespective of the form of application or moisture content in seeds, did not significantly affect the sphericity of seeds of the soybean.
(2)
The use of a 12004C universal spray nozzle resulted in the attainment of the highest values of ultimate force in all the experimental variants. This could be a consequence of the form of sprayed liquid, supplied as finer droplets, which helps the preparation to penetrate deeper into the plant’s structure. An exception was the use of Asahi SL applied with a 12004C universal sprayer nozzle combined with seed moisture of 10%.
(3)
Lower seed moisture (6%) led to a higher resistance of seeds to mechanical damage and a higher RF.
(4)
Kelpak SL, for all forms of application, improved the mechanical resistance of seeds compared to the control, which could be attributed to the natural composition of this biostimulant.

Supplementary Materials

The following supporting information can be downloaded at: https://www.mdpi.com/article/10.3390/app152312593/s1, Table S1: Length (dl), width (dw) and thickness (dt) of soybean seeds depending on the applied biostimulant, form of application, and moisture (mean ± standard deviation); Table S2: Mass (m) and sphericity factor (SF) of soybean seeds depending on the applied biostimulant, form of application, and moisture (mean ± standard deviation); Table S3: Ultimate force (Fmax) to soybean seeds and deformation at the ultimate force (Lmax), depending on the applied biostimulant, form of application, and moisture (mean ± standard deviation); Table S4: Compression work up to the maximum force (W) and conventional compression resistance factor (RF) depending on the applied biostimulant, form of application, and moisture (mean ± standard deviation); Table S5: Compression work related to the mass and thickness (W/m, W/dt), depending on the applied biostimulant, form of application, and moisture (mean ± standard deviation).

Author Contributions

Conceptualisation, A.P., S.P. and S.K.; methodology, A.P., S.P., S.K. and G.Ł.; software, M.R.-B. and A.Ż.; validation, A.P., M.R.-B., S.K., A.Ż. and G.Ł.; formal analysis, A.P., M.R.-B. and S.K.; investigation, A.P., S.P., S.K. and G.Ł.; resources, A.P., S.P. and S.K.; data curation, M.R.-B. and A.P.; writing—original draft preparation, A.P., M.R.-B., A.Ż. and S.P.; writing—review and editing, A.P., M.R.-B., S.K. and G.Ł.; visualisation, A.Ż. and G.Ł.; supervision, A.P., S.K., A.Ż. and G.Ł.; project administration, A.P. and M.R.-B.; funding acquisition, S.P. and M.R.-B. All authors have read and agreed to the published version of the manuscript.

Funding

This research received no external funding.

Institutional Review Board Statement

Not applicable.

Informed Consent Statement

Not applicable.

Data Availability Statement

The data that support the findings of this study are available on request from the corresponding author. The data are not publicly available due to privacy or ethical restrictions.

Acknowledgments

We would like to thank all participants for their understanding of any availability and all collaborators and volunteers of the educational centers for their contributions to this study.

Conflicts of Interest

The authors declare no conflicts of interest.

References

  1. FAO. The State of the World’s Land and Water Resources for Food and Agriculture—Systems at Breaking Point; FAO: Rome, Italy, 2021. [Google Scholar] [CrossRef]
  2. Tudi, M.; Ruan, H.D.; Wang, L.; Lyu, J.; Sadler, R.; Connell, D.; Chu, C.; Phung, D.T. Agriculture Development, Pesticide Application and its Impact on the Environment. Int. J. Environ. Res. Public Health 2021, 18, 1112. [Google Scholar] [CrossRef]
  3. du Jardin, P. Plant biostimulants: Definition, Concept, Main Categories and Regulation. Sci. Hortic. 2015, 196, 3–14. [Google Scholar] [CrossRef]
  4. Yakhin, O.I.; Lubyanov, A.A.; Yakhin, I.A.; Brown, P.H. Biostimulants in Plant Science: A Global Perspective. Front. Plant Sci. 2017, 7, 2049. [Google Scholar] [CrossRef]
  5. Calvo, P.; Nelson, L.; Kloepper, J.W. Agricultural Uses of Plant Biostimulants. Plant Soil 2014, 383, 3–41. [Google Scholar] [CrossRef]
  6. Wally, O.S.; Critchley, A.T.; Hiltz, D.; Craigie, J.S.; Han, X.; Zaharia, L.I.; Abrams, S.R.; Prithiviraj, B. Regulation of Phytohormone Biosynthesis and Accumulation in Arabidopsis Following Treatment with Commercial Extract from the Marine Macroalga Ascophyllum nodosum. J. Plant Growth Regul. 2013, 32, 324–339. [Google Scholar] [CrossRef]
  7. Kocira, S.; Sujak, A.; Kocira, A.; Wójtowicz, A.; Oniszczuk, A. Effect of Fylloton Application on Photosynthetic Activity of Moldavian Dragonhead (Dracocephalum moldavica L.). Agric. Agric. Sci. Procedia 2015, 7, 108–112. [Google Scholar] [CrossRef]
  8. Shukla, P.S.; Borza, T.; Critchley, A.T.; Prithiviraj, B. Seaweed—Based Compounds and Products for Sustainable Protection Against Plant Pathogens. Mar. Drugs 2021, 19, 59. [Google Scholar] [CrossRef] [PubMed]
  9. Singh, A.; Sharma, K.; Chahal, H.S.; Kaur, H.; Hasanain, M. Seaweed-Derived Plant Bootsters: Revolutionizing Sustainable Farming and Soil Health. Front. Soil Sci. 2025, 5, 1504045. [Google Scholar] [CrossRef]
  10. Ertani, A.; Nardi, S.; Francioso, O.; Pizzeghello, D.; Tinti, A.; Schiavon, M. Metabolite-Targeted Analysis and Physiological Traits of Zea mays L. in Response to Application of a Leonardite-Humate and Lignosulfonate-Based Products for Their Evaluation as Potential Biostimulants. Agron. J. 2019, 9, 445. [Google Scholar] [CrossRef]
  11. Rouphael, Y.; Colla, G. Biostimulants in Agriculture. Front. Plant Sci. 2020, 11, 40. [Google Scholar] [CrossRef]
  12. Shukla, P.S.; Prithiviraj, B. Ascophyllum Nodosum Biostimulant Improves the Growth of Zea Mays Grown Under Phosphorus Impoverished Conditions. Front. Plant Sci. 2021, 11, 601843. [Google Scholar] [CrossRef]
  13. Rouphael, Y.; Carillo, P.; Garcia-Perez, P.; Cardarelli, M.; Senizza, B.; Miras-Moreno, B.; Lucini, L. Plant Biostimulants from Seaweeds or Vegetal Proteins Enhance the Salinity Tolerance in Greenhouse Lettuce by Modulating Plant Metabolism in a Distinctive Manner. Sci. Hortic. 2022, 305, 111368. [Google Scholar] [CrossRef]
  14. Michalek, W.; Kocira, A.; Findura, P.; Szparaga, A.; Kocira, S. The Influence of Biostimulant Asahi SL on the Photosynthetic Activity of Selected Cultivars of Phaseolus vulgaris L. ASPE 2018, 20, 1286–1301. [Google Scholar]
  15. Findura, P.; Hara, P.; Szparaga, A.; Kocira, S.; Czerwińska, E.; Bartoš, P.; Treder, K. Evaluation of the Effects of Allelopathic Aqueous Plant Extracts, as Potential Preparations for Seed Dressing, on the Modulation of Cauliflower Seed Germination. Agriculture 2020, 10, 122. [Google Scholar] [CrossRef]
  16. Van Oosten, M.J.; Pepe, O.; De Pascale, S.; Silletti, S.; Maggio, A. The Role of Biostimulants and Bioeffectors as Alleviators of Abiotic Stress in Crop Plants. Chem. Biol. Technol. Agric. 2017, 4, 5. [Google Scholar] [CrossRef]
  17. Kocira, S. Effect of Amino Acid Biostimulant on the Yield and Nutraceutical Potential of Soybean. Chil. J. Agric. Res. 2019, 79, 17–25. [Google Scholar] [CrossRef]
  18. Sozoniuk, M.; Świeca, M.; Bohatá, A.; Bartoš, P.; Bedrníček, J.; Lorenc, F.; Jarošová, M.; Perná, K.; Stupková, A.; Lencová, J.; et al. Selection of Reference Genes for Expression Profiling in Biostimulation Research of Soybean. Chem. Biol. Technol. Agric. 2024, 11, 130. [Google Scholar] [CrossRef]
  19. Battacharyya, D.; Babgohardi, M.Z.; Rathar, P.; Prithiviraj, B. Seaweed Extracts as Biostimulants in Horticulture. Sci. Hortic. 2015, 196, 39–48. [Google Scholar] [CrossRef]
  20. Bulgari, R.; Franzoni, G.; Ferrante, A. Biostimulants Application in Horticultural Crops Under Abiotic Stress Conditions. Agronomy 2019, 9, 306. [Google Scholar] [CrossRef]
  21. Ali, O.; Ramsubhag, A.; Jayaraman, J. Biostimulant Properties of Seaweed Extracts in Plants: Implications towards Sustainable Crop Production. Plants 2021, 10, 531. [Google Scholar] [CrossRef]
  22. Repke, R.A.; Silva, D.M.R.; dos Santos, J.C.C.; de Almeida Sliva, M. Alleviation of Drought Stress in Soybean by Applying a Biostimulant Based on Amino Acids and Macro- and Micronutrients. Agron. J. 2022, 12, 2244. [Google Scholar] [CrossRef]
  23. Rymuza, K.; Radzka, E.; Cała, J. The Effect of Applied Biostimulants on the Yielding of Three Non-genetic Modified Soybean Cultivars. Agriculture 2023, 13, 900. [Google Scholar] [CrossRef]
  24. Karpiński, P.; Kocira, S. Possibilities of Using a Multispectral Camera to Assess the Effects of Biostimulant Application in Soybean Cultivation. Sensors 2025, 25, 3464. [Google Scholar] [CrossRef] [PubMed]
  25. Krawczuk, A.; Parafiniuk, S.; Przywara, A.; Huyghebeart, B.; Rabier, F.; Limbourg, Q.; Mostade, O.; Kocira, S. Technical Parameters of Sprying with a Biostimulant as a Determinant of Biometrical Properties and Yield of a Soybean Seeds. J. Agric. Eng. 2021, 25, 171–179. [Google Scholar] [CrossRef]
  26. Krawczuk, A.; Ogrodniczek, J.; Bohata, A.; Bartos, P.; Olšan, P.; Findura, P.; Kocira, S. Physical Properties of Plant Extracts with Biostimulant Potential Produced Using Cold Plasma and Low-Pressure Microwave Discharge. J. Agric. Eng. 2024, 28, 277–285. [Google Scholar] [CrossRef]
  27. Forster, W.A.; Kimberlay, M.O.; Zabkiewicz, J.A. A Universal Spray Droplet Adhesion Model. ASABE 2005, 48, 1321–1330. [Google Scholar] [CrossRef]
  28. Nuyttens, D.; Beatens, K.; De Schampheliere, M.; Sonck, B. Effect of Nozzle Type, Size and Pressure on Spray Droplet Characteristics. Biosyst. Eng. 2007, 97, 333–345. [Google Scholar] [CrossRef]
  29. Khan, F.A.; Khorsandi, F.; Ali, M.; Ghafoor, A.; Khan, R.A.Z.; Umair, M.; Shahzaib; Rehman, A.; Hussain, Z. Spray Drift Reduction Management in Agriculture: A review. Prog. Agric. Eng. Sci. 2024, 20, 1–36. [Google Scholar] [CrossRef]
  30. Ozkan, H.E. Effect of Major Variables on Drift Distances of Spray Droplets; Ohio State University Extension Service, Publication AEX: Columbus, OH, USA, 2016; pp. 816–900. [Google Scholar]
  31. Butler Ellis, M.C.; Lane, A.G.; O’Sullivan, C.M.; Jones, S. Wind Tunel Investigation of the Ability of Drift-Reducing Nozzles to Provide Mitigation Measures for Bystander Exposure to Pesticides. Biosyst. Eng. 2021, 202, 152–164. [Google Scholar] [CrossRef]
  32. Butler Ellis, M.C.; Alanis, R.; Lane, A.G.; Tuck, C.R.; Nuyttens, D.; van de Zande, J.C. Wind Tunnel Measurements and Model Predictions for Estimating Spray Drift Reduction Under Field Conditions. Biosyst. Eng. 2017, 154, 25–34. [Google Scholar] [CrossRef]
  33. Moorea, D.R.J.; McCarroll-Butler, C.A.; Avanasic, R.; Chen, W.; White, M.; Brain, R.A. How Protective to the Environment is the Pesticide Risk Assessment and Registration Process in the United States? J. Regul. Sci. 2021, 9, 1–20. [Google Scholar] [CrossRef]
  34. Szewczyk, A. Analiza Ustawienia, Parametrów i Warunków Pracy Rozpylacza w Aspekcie Jakości Opryskiwania Upraw Polowych; Wydawnictwo Uniwersytetu Przyrodniczego we Wrocławiu: Wrocław, Poland, 2010; Volume 97, pp. 1–131. [Google Scholar]
  35. de Oliveira, R.B.; Precipito, L.M.B.; Gandalfo, M.A.; de Oliveira, J.V.; Lucio, F.R. Effect of Droplet Size and Leaf Surface on Retention of 2,4-D Formulations. Crop Prot. 2019, 119, 97–101. [Google Scholar] [CrossRef]
  36. Lodwik, D.; Pietrzyk, J.; Malesa, W. Analysis of Volume Distribution and Evaluation of the Spraying Spectrum in Terms of Spraying Quality. Appl. Sci. 2020, 10, 2395. [Google Scholar] [CrossRef]
  37. Subr, A.; Parafiniuk, S.; Milanowski, M.; Krawczuk, A.; Kachel, M. Study of Deposited Spray Quality of Spraying Agents with Different Physical Properties. Plant Arch. 2020, 20, 6109–6114. [Google Scholar]
  38. Koszel, M. Ocena Jakości Oprysku w Sytuacji Różnego Stopnia Zużycia i Różnych Eksploatacyjnych Parametrów Rozpylaczy Płaskostrumieniowych. J. Agric. Eng. 2009, 8, 55–60. [Google Scholar]
  39. Ozkan, H.E. Strategies to Minimize Spray Drift; Ohio State University Extension Service, Publication AEX: Columbus, OH, USA, 2022. [Google Scholar]
  40. ASAE Standard S352.2; Moisture Measurement—Ungrounded Grains and Seeds. American Society of Agricultural and Biological Engineers: St. Joseph, MI, USA, 2006.
  41. Kibar, H.; Öztürk, T. Physical and Mechanical Properties of Soybean. Int. Agrophys. 2008, 30, 239–244. [Google Scholar]
  42. Żabiński, A.; Mudryk, K. Wybrane Właściwości Fizyczne Nasion Krajowych i Zagranicznych Odmian Soczewicy Jadalnej. J. Agric. Eng. 2009, 9, 319–329. [Google Scholar]
  43. Mora, C.F.; Kwan, A.K.H. Sphericity, Shape Factor and Convexity Measurement of Coarse Aggregate for Concreto Using Digital Image Processing. Cem. Concr. Res. 2000, 30, 351–385. [Google Scholar] [CrossRef]
  44. Sayinci, B.; Demir, B.; Açik, N. Comparision of spray nozzles in terms of spray coverage and drop distribution uniformity at low volume. Turk. J. Agric. For. 2020, 44, 262–270. [Google Scholar] [CrossRef]
  45. Yu, Y.; Zhu, H.; Ozkan, H.E.; Derksen, R.C.; Krause, C.R. Evaporation and Deposition Coverage Area of Droplets Containing Insecticides and Spray Additives on Hydrophilic, Hydrophobic, and Crabapple Leaf Surfaces. Trans. ASAE 2009, 52, 39–49. [Google Scholar] [CrossRef]
  46. Krawczuk, A.; Huyghebaert, B.; Rabier, F.; Parafiniuk, S.; Przywara, A.; Koszel, M.; Lorencowicz, E.; Kocira, S. The Technical Parameters of Seaweed Biostimulant Spray Application as a Factor in the Economic Viability of Soybean Production. Appl. Sci. 2023, 13, 1051. [Google Scholar] [CrossRef]
  47. Kuźniar, P.; Jarecki, W.; Bobrecka-Jamro, D. Właściwości Mechaniczne Nasion Wybranych Roślin Strączkowych a ich Masa i Grubość. J. Agric. Eng. 2013, 4, 171–177. [Google Scholar]
  48. Sosnowski, S.; Kuźniar, P. Effect of Dynamic Loading on the Quality of Soybean. Int. Agrophys. 1999, 13, 125–132. [Google Scholar]
  49. Hebda, T.; Frączek, J. Wpływ Wybranych Czynników na Wartość Wskaźnika Odkształcenia Nasienia. J. Agric. Eng. 2005, 11, 171–180. [Google Scholar]
  50. Deshpande, S.D.; Bal, S.; Ojha, T.P. Physical properties of soybean. J Agric. Eng. Res. 1993, 56, 89–98. [Google Scholar] [CrossRef]
  51. Hauth, M.R.; Bothelho, F.M.; Hoscher, R.H.; de C.C. Bothello, S.; de Oliveira, G.H.H. Physical Properties of Different Soybean Cultivars During Drying. Eng. Agric. 2018, 38, 590–598. [Google Scholar] [CrossRef]
  52. Polat, R.; Atay, U.; Saglam, C. Some Physical and Aerodynamic Properties of Soybean. J. Agron. 2006, 5, 74–78. [Google Scholar] [CrossRef]
  53. Ashalou, M.O.; Noibi, A.O. Effect of Moisture Content on Some Mechanical Properties of Soybean (Glycine max) Varieties. Afr. J. Food Sci. Technol. 2013, 4, 211–220. [Google Scholar]
  54. Bako, T.; Mamai, E.A.; Bature, B.J. Physical and Mechanical Properties of Soya Bean Seeds in Relations to the Design of oil Extractors. J. Postharvest Technol. 2019, 7, 50–61. [Google Scholar]
  55. Alonge, A.F. The Effect of Moisture Content on Mechanical Properties of Soybean (Glycine max (L) Merr.). J. Agric. Res. Dev. 2003, 2, 60–69. [Google Scholar] [CrossRef]
  56. Tavakoli, H.; Rajabipour, A.; Mohtasebi, S.S. Moisture-Dependent Some Engineering Properties of Soybean Grains. Agric. Eng. Int. 2009, 11, 1110. [Google Scholar]
  57. Kruszelnicka, W.; Chen, Z.; Ambrose, K. Moisture-Dependent Physical-Mechanical Properties of Maize, Rice, and Soybeans as Related to Handling and Processing. Materials 2022, 15, 8729. [Google Scholar] [CrossRef]
  58. Lamidi, W.A.; Ogunlade, C.A.; Olaniyan, A.R.; Shittu, K.A.; Murtadha, M.A.; Ajibade, A.F.; Fadeyibi, A. Moisture Dependent: Physical Properties of Baobab Seeds (Adansonia digitata L.). J. Agric. Eng. 2023, 27, 33–46. [Google Scholar] [CrossRef]
  59. Kuźniar, P.; Szpunar-Krok, E.; Findura, P.; Buczek, J.; Bobrecka-Jamro, D. Physical and Chemical Properties of Soybean Seeds Determine their Susceptibility to Mechanical Damage. Zemdirb. Agric. 2016, 103, 183–192. [Google Scholar] [CrossRef]
  60. Kocira, S.; Szparaga, A.; Kocira, A.; Czerwińska, E.; Wójtowicz, A.; Borowiecka-Mielniczuk, U.; Koszel, M.; Findura, P. Modeling Biometric Traits, Yield and Nutritional and Antioxidiant Properties of Seeds of Three Soybean Cultivars Through the Application of Biostimulant Containing Seaweed and Amino Acids. Front. Plant Sci. 2018, 9, 388. [Google Scholar] [CrossRef]
  61. Iwanicka, N. Agronomic, Qualitative and Economic Effects of Using Selected Biostimulants in the Cultivation of Common Bean (Phaseolus vulgaris L.), Orzeł Variety. Ph.D. Thesis, Instytut Nauk o Żywności Człowieka i Rolnictwie—Państwowa Akademia Nauk Stosowanych w Chełmie, Chełm, Poland, 2022. Available online: https://up.lublin.pl/wp-content/uploads/2022/12/Rozprawa-doktorska-Natalia-Iwanicka.pdf (accessed on 13 October 2025).
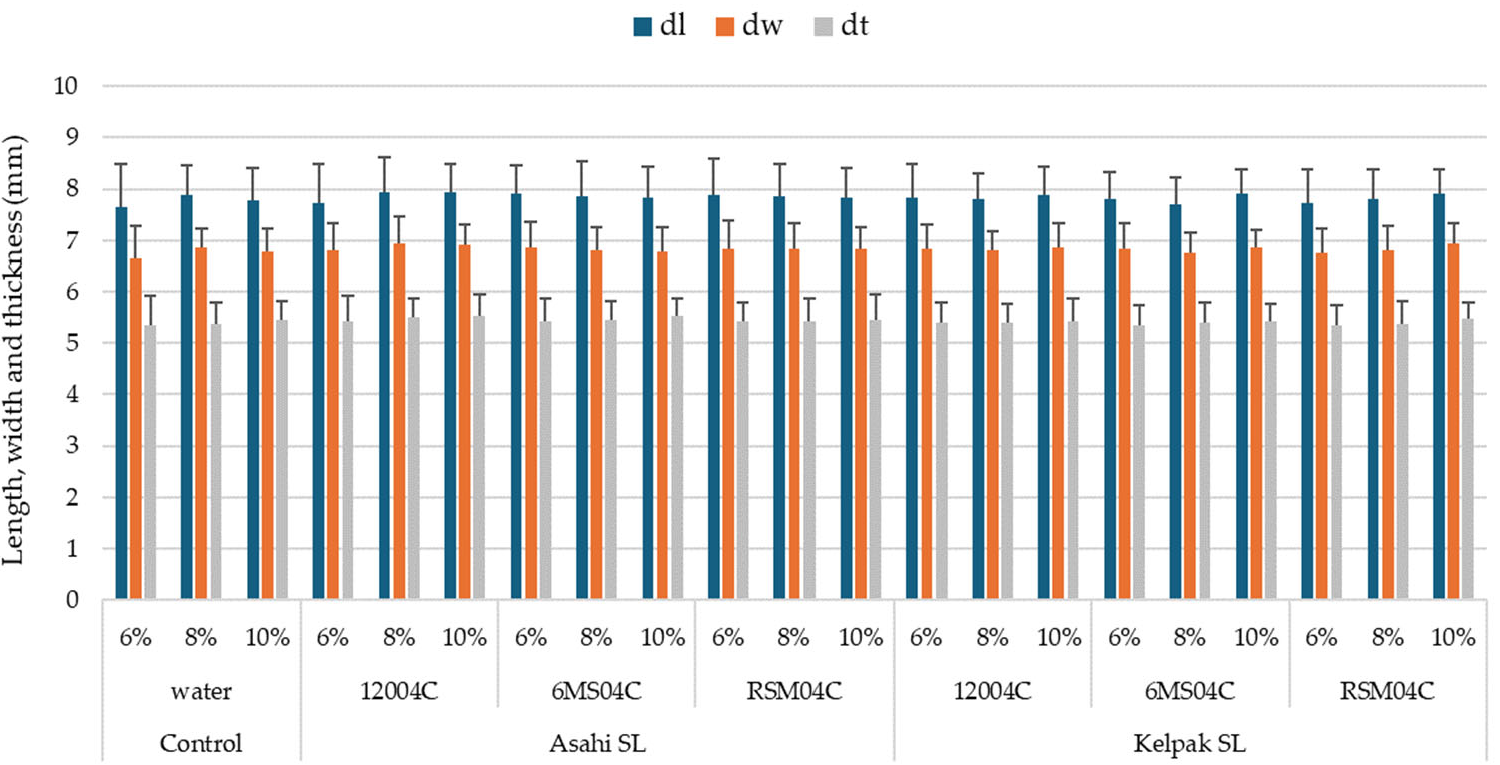
Figure 2. Length (dl), width (dw), and thickness (dt) of soybean seeds depending on the applied biostimulant (Asahi SL, Kelpak SL), form of application (water, 12004C, 6MS04C, RSM04C), and moisture (6, 8, 10%)—means and standard deviations from 2022 to 2024 (no significant differences—group letters omitted).
Applsci 15 12593 g002
Figure 3. Mass (m) and sphericity factor (SF) of soybean seeds depending on the applied biostimulant (Asahi SL, Kelpak SL), form of application (water, 12004C, 6MS04C, RSM04C), and moisture (6, 8, 10%)—means and standard deviations from 2022 to 2024 (no significant differences—group letters omitted).
Applsci 15 12593 g003
Figure 4. (A) ultimate force (Fmax) applied to soybean seeds and (B) deformation at the ultimate force (Lmax) depending on the applied biostimulant (Asahi SL, Kelpak SL), form of application (water, 12004C, 6MS04C, RSM04C), and moisture (6, 8, 10%)—means and standard deviations from 2022 to 2024. The same letters indicate homogeneous groups.
Applsci 15 12593 g004aApplsci 15 12593 g004b
Figure 5. (A) compression work up to the maximum force (W) and (B) conventional compression resistance factor (RF) depending on the applied biostimulant (Asahi SL, Kelpak SL), form of application (water, 12004C, 6MS04C, RSM04C), and moisture (6, 8, 10%)—means and standard deviations from 2022 to 2024. The same letters indicate homogeneous groups.
Applsci 15 12593 g005
Figure 6. (A) compression work related to the mass (W/m) and (B) thickness (W/dt) depending on the applied biostimulant (Asahi SL, Kelpak SL), its form of application (water, 12004C, 6MS04C, RSM04C), and seed moisture (6, 8, 10%)—means and standard deviations from 2022 to 2024. The same letters indicate homogeneous groups.
Applsci 15 12593 g006
Table 1. Chemical composition, concentrations, and dates of application of the biostimulants.
BiostimulantCharacteristicsNumber
of Sprays
Concentration
Kelpak SLContains Ecklonia maxima extract obtained by cold cellular-burst technology.
Composition: auxins (11 mg·L−1) and cytokinins (0.031 mg·L−1), alginates, brassinosteroids, gibberellins, phlorotannins (Eckol), polyamines. In crop cultivation, it is recommended to apply the biostimulant 1 to 3 times in a dose of 2–4 L·ha−1.
Single spray
(BBCH 12–13)
0.7%
1.0%
Double spray
(BBCH 12–13
and BBCH 61)
0.7%
1.0%
Asahi SLContains active substances from the group of nitrophenols, present naturally in plant cells.
Composition: 0.3% sodium para–nitrophenolate, 0.2% sodium ortho-nitrophenolate, and 0.1% of sodium nitroguaiacolate.
In crop cultivation, it is recommended to apply the biostimulant 1 to 3 times, in a dose of 0.5–0.6 L·ha−1, at 7–30 day intervals, carrying out the first spraying at the stage when the second true leaf unfolds.
Single spray
(BBCH 12–13)
0.1%
1.0%
Double spray
(BBCH 12–13 and BBCH 61)
0.1%
0.2%
Table 2. Results of the Kruskal–Wallis (H) test applied to determine the effect of a biostimulant (control, Asahi SL, Kelpak), type of spraying (control 12004C, 6MS04C, RSM04C), and seed moisture content (6, 8, 10%) on the analysed parameters.
Factordt
(mm)
dw
(mm)
dl
(mm)
Mass
(g)
SFFmax
(N)
Lmax
(mm)
W
(mJ)
W/m
(mJ∙g−1)
W/dt
(mJ∙mm−1)
RF
(N∙mm−1)
Results of Statistical Test
Biostimulant7.834.175.825.869.4111.215.1520.9930.1225.302.95H
0.0199 *0.12410.05450.05350.0091 *0.0037 *0.0762<0.0001 *<0.0001 *<0.0001 *0.2294p-value
Type of spraying3.076.162.927.746.5840.854.6737.8044.2236.8517.41H
0.38140.10410.40430.05240.0864<0.0001 *0.1971<0.0001 *<0.0001 *<0.0001 *0.0006 *p-value
Moisture0.321.572.561.114.23763.731404.96176.44249.47203.321637.23H
0.85170.45500.27850.57540.1204<0.0001 *<0.0001 *<0.0001 *<0.0001 *<0.0001 *<0.0001 *p-value
* statistical significance at the 0.05 level.
Table 3. Means ± standard deviations of characteristics and statistically significant groups for the applied biostimulants.
CharacteristicsControlAsahi SLKelpak
SF0.743 ± 0.032 a0.744 ± 0.036 a0.739 ± 0.032 a
Fmax (N)180.31 ± 49.04 a190.63 ± 54.04 b186.90 ± 43.97 b
m (g)0.185 ± 0.039 a0.191 ± 0.040 a0.187 ± 0.034 a
dt (mm)5.420 ± 0.388 a5.473 ± 0.383 b5.423 ± 0.344 a
Lmax (mm)0.417 ± 0.136 a0.451 ± 0.170 a0.446 ± 0.188 a
W (mJ)67.361 ± 33.519 a75.549 ± 33.457 b70.894 ± 32.084 a
W/dt (mJ∙mm−1)12.249 ± 5.521 a13.892 ± 5.854 b12.913 ± 5.473 a
W/m (mJ∙g−1)361.479 ± 152.340 a414.181 ± 165.899 b383.191 ± 156.572 a
RF (N∙mm−1)482.154 ± 193.836 a490.199 ± 218.188 a477.297 ± 186.625 a
Different letters in the row indicate statistically significant differences between biostimulants.
Table 4. Means ± standard deviations of characteristics and statistically significant groups for various forms of application.
CharacteristicsControl12004C6MS04CRSM04C
SF0.743 ± 0.032 a0.742 ± 0.033 a0.742 ± 0.032 a0.740 ± 0.036 a
Fmax (N)180.31 ± 49.04 a198.22 ± 50.13 b183.00 ± 45.00 a185.08 ± 49.59 a
m (g)0.185 ± 0.039 a0.192 ± 0.039 a0.186 ± 0.035 a0.188 ± 0.038 a
dt (mm)5.420 ± 0.388 a5.464 ± 0.380 a5.441 ± 0.345 a5.439 ± 0.369 a
Lmax (mm)0.417 ± 0.136 a0.445 ± 0.173 a0.457 ± 0.191 a0.444 ± 0.172 a
W (mJ)67.361 ± 33.519 a80.607 ± 36.152 b72.041 ± 32.982 a71.675 ± 34.895 a
W/dt (mJ∙mm−1)12.249 ± 5.521a14.328 ± 5.791 b13.009 ± 5.483 a12.773 ± 5.515 a
W/m (mJ∙g−1)361.479 ± 152.340 a429.639 ± 169.519 b386.401 ± 154.725 a380.858 ± 157.490 a
RF (N∙mm−1)482.154 ± 193.836 ab508.779 ± 207.765 a465.266 ± 196.070 b477.252 ± 203.075 b
Different letters in the line indicate statistically significant differences between various forms of application.
Table 5. Means ± standard deviations of characteristics and statistically significant groups for moisture levels.
Characteristics6%8%10%
SF0.744 ± 0.035 a0.741 ± 0.034 a0.740 ± 0.031 a
Fmax (N)224.00 ± 16.00 a182.90 ± 43.73 b155.71 ± 33.53 c
m (g)0.187 ± 0.039 a0.188 ± 0.038 a0.189 ± 0.036 a
dt (mm)5.442 ± 0.393 a5.445 ± 0.367 a5.445 ± 0.345 a
Lmax (mm)0.327 ± 0.036 a0.355 ± 0.052 a0.643 ± 0.140 b
W (mJ)79.445 ± 32.177 a60.226 ± 31.006 b81.446 ± 36.636 a
W/dt (mJ∙mm−1)14.6783 ± 5.537 a11.069 ± 5.507 b15.073 ± 6.590 a
W/m (mJ∙g−1)430.435 ± 145.633 a323.282 ± 146.079 b440.305 ± 182.414 a
RF (N∙mm−1)684.203 ± 93.560 a520.495 ± 105.119 b247.814 ± 61.974 c
Different letters in the line indicate statistically significant differences between different moisture levels.
Table 6. The Spearman correlaztion coefficients (rs) of the analysed geometrical and resistance parameters of soybean seeds.
rsSFFmax
(N)
Lmax
(mm)
W
(mJ)
W/dt
(mJ∙mm−1)
W/m
(mJ∙mg−1)
RF
(N·mm−1)
m (g)0.060.45 *0.180.51 *0.42 *0.170.21
dt (mm)0.43 *0.39 *0.200.45 *0.35 *0.160.17
dw (mm)−0.060.42 *0.180.48 *0.40 *0.170.18
dl (mm)−0.220.43 *0.190.49 *0.42 *0.200.19
* statistical significance at the 0.05 level.
Disclaimer/Publisher’s Note: The statements, opinions and data contained in all publications are solely those of the individual author(s) and contributor(s) and not of MDPI and/or the editor(s). MDPI and/or the editor(s) disclaim responsibility for any injury to people or property resulting from any ideas, methods, instructions or products referred to in the content.