Article

Simplified Model of Humidity in the Space of a Protective Mask and Experimental Verification—A Pilot Study

by
Tomasz Janusz Teleszewski
1,
Katarzyna Gładyszewska-Fiedoruk
2,* and
Jianming Liu
3
1
Department of HVAC Engineering, Faculty of Civil Engineering and Environmental Sciences, Bialystok University of Technology, Wiejska 45E, 15-351 Białystok, Poland
2
Institute of Environmental Engineering, Warsaw University of Life Sciences (SGGW), Nowoursynowska 166, 02-776 Warsaw, Poland
3
Tianjin Key Laboratory of Water Quality Science and Technology, School of Environmental and Municipal Engineering, Tianjin Chengjian University, Tianjin 300384, China
*
Author to whom correspondence should be addressed.
Appl. Sci. 2025, 15(23), 12513; https://doi.org/10.3390/app152312513
Submission received: 27 February 2025 / Revised: 27 May 2025 / Accepted: 24 November 2025 / Published: 25 November 2025
(This article belongs to the Special Issue Air Quality in Indoor Environments, 3rd Edition)

Abstract

Air humidity is an important parameter of the microclimate in the mask space. The aim of the study is to assess the mask microclimate in terms of air humidity and to develop a simplified model of humidity distribution as a function of time, which can be used to estimate and predict humidity in the mask space. Humidity and temperature parameters were tested for five different types of protective masks. The protective masks used for the tests differed in their construction and material thickness of the mask walls. The microclimate in the mask space was assessed based on one-hour measurements of temperature and humidity during office work, based on publicly available guidelines and standards. Based on the moisture balance in the space between the face and the mask wall, a simplified one-dimensional model of absolute humidity in space was determined. The results of the study indicated that in all cases, regardless of the type of mask, the permissible values of temperature and relative humidity were exceeded. The average values of temperature and relative humidity in the mask space for all masks and people were 31.94 °C and 83.65%, respectively. The absolute humidity value is strongly dependent on the ambient air humidity. In months with higher absolute humidity values, such as September, a higher absolute humidity occurs in the mask space. One way to lower the humidity level in the mask is to dry the air in the room.

1. Introduction

Air humidity is a basic parameter related to air quality and microclimate [1,2,3]. Wearing masks undoubtedly changes the parameters of the air in the inhaled air compared to the parameters of the environment [4,5,6,7]. Masks are commonly used in healthcare settings to protect healthcare workers from respiratory infections [8,9,10]. Masks are also used to reduce the spread of bacteria from the mouth, nose and face to the outside air [11,12]. Since the COVID-19 pandemic, the wearing of masks has become recommended and even mandatory in public places in many countries [13]. Masks are also used to protect against dangerous substances contained in the air, such as pesticides [6].
During the frequent use of protective masks during the COVID-19 pandemic, masks caused problems most often related to the discomfort of wearing masks [8,14]. Commonly reported problems were pressure on the face, difficulty breathing, discomfort, communication difficulties and headache [8]. Wearing a mask can also cause “dry eye” [14], which is caused by the upward flow of air towards the surface of the eye during exhalation. The research results from the study [15] indicate that over 70% of the respondents wearing masks reported feeling discomfort on their faces. Of all the people who felt discomfort, 62.7% reported that the main symptom was facial fever, 25.4% reported symptoms of dyspnea and 9.1% experienced an accelerated heartbeat, which may have been caused by an increase in temperature in the mask space. People who wear masks prefer lower ambient temperatures [15]. A certain solution to neutralize the increase in temperature in the space of the mask is to remove the mask from the face and take a break from wearing the mask [4] of course, if the working conditions allow it. Healthcare workers are advised to change masks every two hours [16]. Comparing the increase in temperature and humidity in the space of the mask, a faster increase in temperature in the mask was observed compared to air humidity [17]. The increase in humidity in the mask space may have a negative effect on the facial skin [18]. Wearing a mask may also contribute to the growth of colonies of bacteria and fungi on the surface of the mask [19,20,21,22,23,24], which is undoubtedly related to the accumulation of moisture between the mask and the face, the main source of which is the human. Mask humidity also affects the filtration efficiency of electret FFP masks when worn in real conditions [25].
In modeling the flow of mass and heat in masks, Computational Fluid Dynamics (CFD) numerical calculations are most often used [26,27,28,29]. Three-dimensional numerical methods are quite complicated due to spatial grids and may be associated with significant discrepancies [28] in the computational results between CFD models [28].
Due to the problems caused by air humidity when wearing a protective mask [6,13,14,15,16,17,18,19,20,21,22,23,24], it is important to carefully examine the course of changes in air humidity as a function of time in the protective space of the mask.
In the literature, no evaluation of the microclimate under the masks in terms of temperature and humidity, as well as algorithms that would allow predicting the humidity in the space of the mask, have been found.
The aim of the publication is to assess the microclimate in terms of temperature and humidity in the mask space based on the adopted standards [1,3] and to develop a simplified model of humidity as a function of time for selected types of masks.
The following sections present the remainder of this publication. Section 2 describes the types of masks and the method of measuring temperature and humidity in the mask space. In Section 3, the microclimate in the mask space was assessed based on the measured temperature and humidity. Then, a simplified model of humidity in the mask space was built. The last part of this publication contains conclusions.

2. Materials and Methods

The tests were carried out for five types of protective masks in an office located in the city of Bialystok in Poland in the temperate climate zone. The temperate climate in Poland is characterized by high weather variability throughout the year. Winters can be frosty or mild, while summers can be rainy or hot [30]. The office room is equipped with stack ventilation with an average number of air changes per hour equal to 0.25 1/h.
The measurements were taken in conditions similar to those experienced by many millions of people during the COVID-19 pandemic. To ensure that we did not harm human beings, we obtained informed consent from all individuals participating in the research. The data that support the findings of this study are available from the first author but restrictions apply to the availability of these data, which were used under license for the current study, and so are not publicly available. Data are however available from the authors upon reasonable request and with permission of first author.
The research was conducted in conditions where masks were mandatory at work and outside. The types of masks tested were worn during the COVID-19 pandemic. All types of masks tested were permitted. The research was conducted during normal office work and did not interfere with people’s functioning and their work.
Preview photos of the tested masks are shown in Figure 1. The number 1 three-layer flat mask, in accordance with the EN 14683 [31] standard, was made of non-woven polypropylene. The hand-made mask number 2 was made of three layers of 100% cotton material with a weight of 125 g/m2 during the COVID-19 pandemic when masks were not available on the local market. The number 3 double-layer flat mask was made of non-woven polypropylene. The number 4 convex KN95 mask in accordance with EN 149: 2001 + A1: 2009/GB2626-2006 [32,33] was made of polypropylene. Mask number 5 type FFP2 in accordance with the EN 149: 2001 [32] standard was made of polypropylene and was equipped with an exhalation check valve.
Four adults with the following characteristics participated in the study:
-
Person A: Female, age 35, height 164 cm, weight 64 kg.
-
Person B: Female, age 57, height 171 cm, weight 102 kg.
-
Person C: Male, age 43, height 180 cm, weight 87 kg.
-
Person D: Male, age 58, height 178 cm, weight 100 kg.
Adults of working age were included in the study. In Poland, according to the Statistics Poland [34], the working age for men refers to the group aged from 18 to 64, and in the case of women, the working age is from 18 to 59. People of working age were selected from the most representative groups in terms of percentages according to the age pyramid of the Polish population [35].
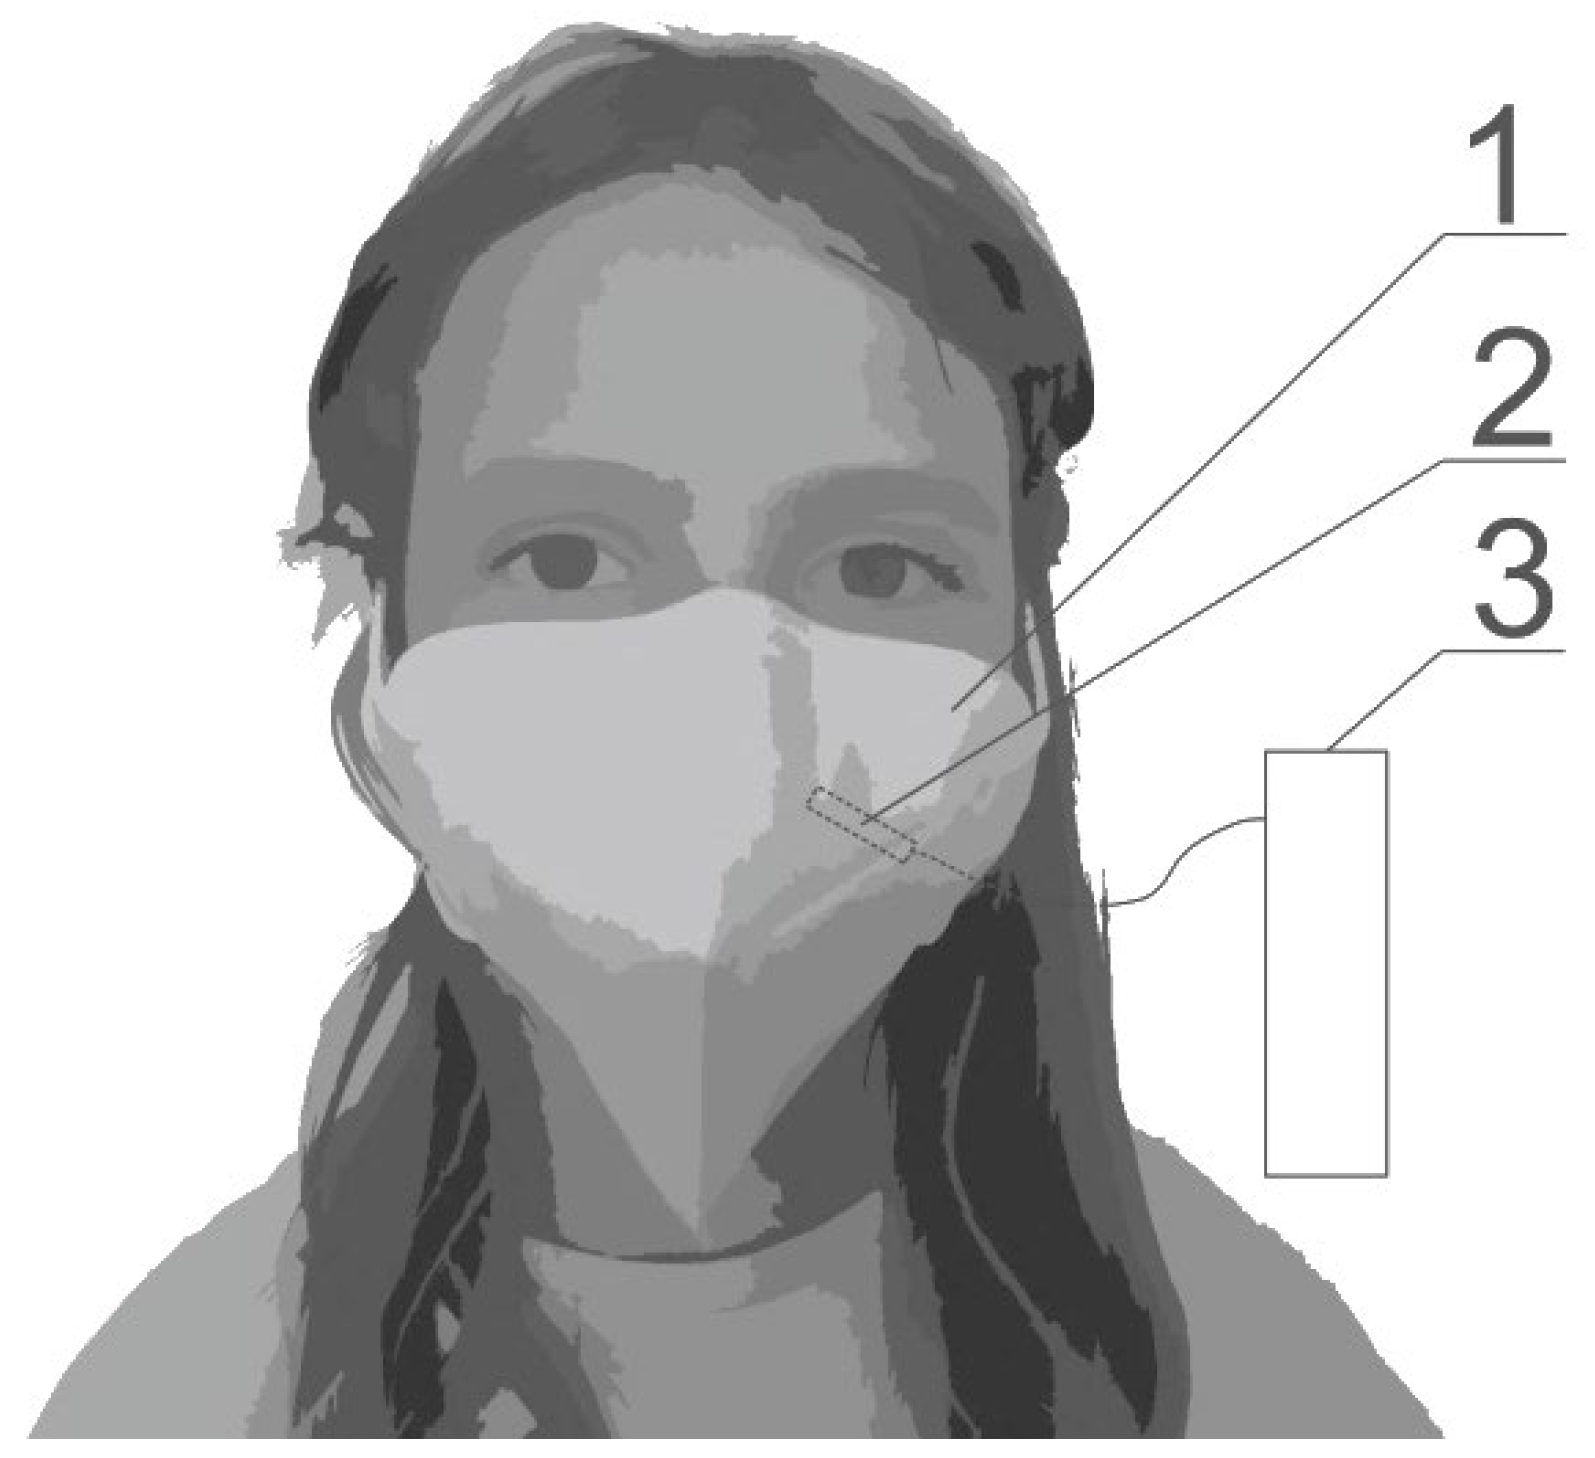
Each person tested all types of masks five times. The research was carried out in the following months: January, March, April, September, November and December. During the study, all persons performed light office work classified in accordance with the standard [36,37] in class W1. Work activity in class W1 [36,37,38], is light manual work, including writing, typing, drawing, work in the chemical laboratory, inspection, assembly or sorting of lightweight materials. For the measurement of humidity and temperature, a Testo 435 data logger with measuring probes with the following parameters was used: humidity, measuring range: +10 to +98% RH, resolution 0.1% RH, accuracy ±1%RH, temperature, measuring range: 0 and +50 °C, resolution 0.1 °C, accuracy ±0.3 °C. The humidity and temperature measuring point was located in the lower part of the zygomaticus major muscle in the mask space (Figure 2). Humidity and temperature measurements in the mask space were taken in a series of measurements at one-minute intervals during a one-hour experiment. Then, based on the one-hour measurement series, arithmetic mean values of humidity and temperature were determined. During the tests, the ambient air parameters ranged from 19.5 °C to 25.0 °C, and the relative humidity ranged from 35% to 64%.

3. Results and Discussion

Table 1 presents the mean, minimum, maximum values and standard deviations for temperature (Tm, Tm_min, Tm_max, σTm, respectively), relative humidity (ϕm, ϕm_min, ϕm_max, σϕm, respectively) and absolute humidity (ωm, ωm_min, ωm_max, σωm, respectively) in the space between the mask and the face for individual masks after one hour of use in office work for the selected five mask types. The values of air parameters in the mask space, which are presented in Table 1, refer to 20 averaged tests of individual masks (from 20 measurement series). The average temperature in the mask space was in the range of 30.5–32.7 °C, while the average relative humidity was in the range of 80.8–87.1%. In the work [6], the temperature in the tested masks was in the range of 35.5–37.9 °C and these values are higher than the temperatures obtained in this work. The discrepancies between the average temperatures of this work and publication [6] result from the fact that in the work [6] the tests were carried out at a much higher ambient temperature, equal to 28 °C, which resulted in less heat exchange between the mask space and the external environment. In the article [29], the measured temperatures in the mask space were similar to the temperatures in the mask in this work, which may be due to similar temperatures in the room.
The lowest average hourly temperature was obtained in mask no. 3, which was made of two layers of material and has the thinnest wall thickness compared to the other masks. Under the adopted test conditions, heat was transported from the mask space to the external environment. According to Fourier’s law [39], which describes the thermal conductivity of solids, the heat flux that flows through the mask wall depends on the thickness of the mask wall. In the case of mask No. 3, due to the small wall thickness, the heat exchange was the most intense compared to the other masks, and therefore the temperature in mask No. 3 turned out to be the lowest.
The assessment of the microclimate in the mask space in terms of temperature and humidity can be performed based on the ASHRAE [1] guidelines and literature [3]. It should be noted that no standards have been found in the literature that define the parameters and quality of air in the mask space. For ASHRAE [1] the allowable temperature and humidity range was not met. In the case of publication [3], the microclimate assessment was divided into four ratings: “Good” (for the condition 24 °C < T ≤ 27 °C), “Intermediate” (for the condition T ≤ 24 °C and 30% < ϕ ≤50% or 24 °C < T ≤ 27 °C and ϕ ≤ 30% or 24 °C < T ≤ 27 °C and ϕ > 50% or T > 27 °C and 30% < ϕ ≤ 50%) and “Bad” (for condition T ≤ 24 °C and ϕ > 50% or T ≤ 24 °C and ϕ ≤ 30% or T > 27 °C and ϕ > 50% or T > 27 °C and ϕ ≤ 30%).
The average values from one hour of mask use indicate a “Bad” rating. It should be noted here that the parameters of the ambient air inside the laboratory met the ASHRAE [1] guidelines, while in the case of evaluation according to publication [3] the air was rated “Intermediate” and “Good”. A solution to the problem of poor air quality under the mask may be to take a break from using the mask by removing it from the face [4]. Figure 3 shows the graphical results of the calculations from Table 1 on a psychrometric chart with the comfort area marked for a clothing level of 0.65 clo and a metabolic rate of 1.40 met based on ASHRAE implemented in the application [40]. The marked points of air parameters inside the mask space 1–4 are located outside the thermal comfort area. Despite significant humidity in the mask space, people wearing masks during the one-hour period did not report any problems. In [8], approximately 83.8% of people reported problems with using the mask, which may be caused by the much longer time of wearing the mask compared to the one-hour period.
Figure 4 shows a box plot for absolute humidity. Based on the box plot, it can be seen that the smallest data dispersion occurs in mask no. 5, which may be due to the operation of the check valve in this mask. The largest interquartile range occurs in masks no. 1, 2 and 3, while the smallest interquartile range occurs in masks no. 4 and 5. The differences in moisture dispersion are probably caused by the type of construction of the masks. Masks No. 1, 2 and 3 are loosely woven [41] masks, while masks 4 and 5 are layered fine-woven masks that provide better protection [41]. Perhaps the lower material density of masks 1, 2 and 3 contributes to a greater dispersion of absolute humidity values. According to publication [42], the relative humidity value has no effect on the hydraulic resistance generated by the masks.
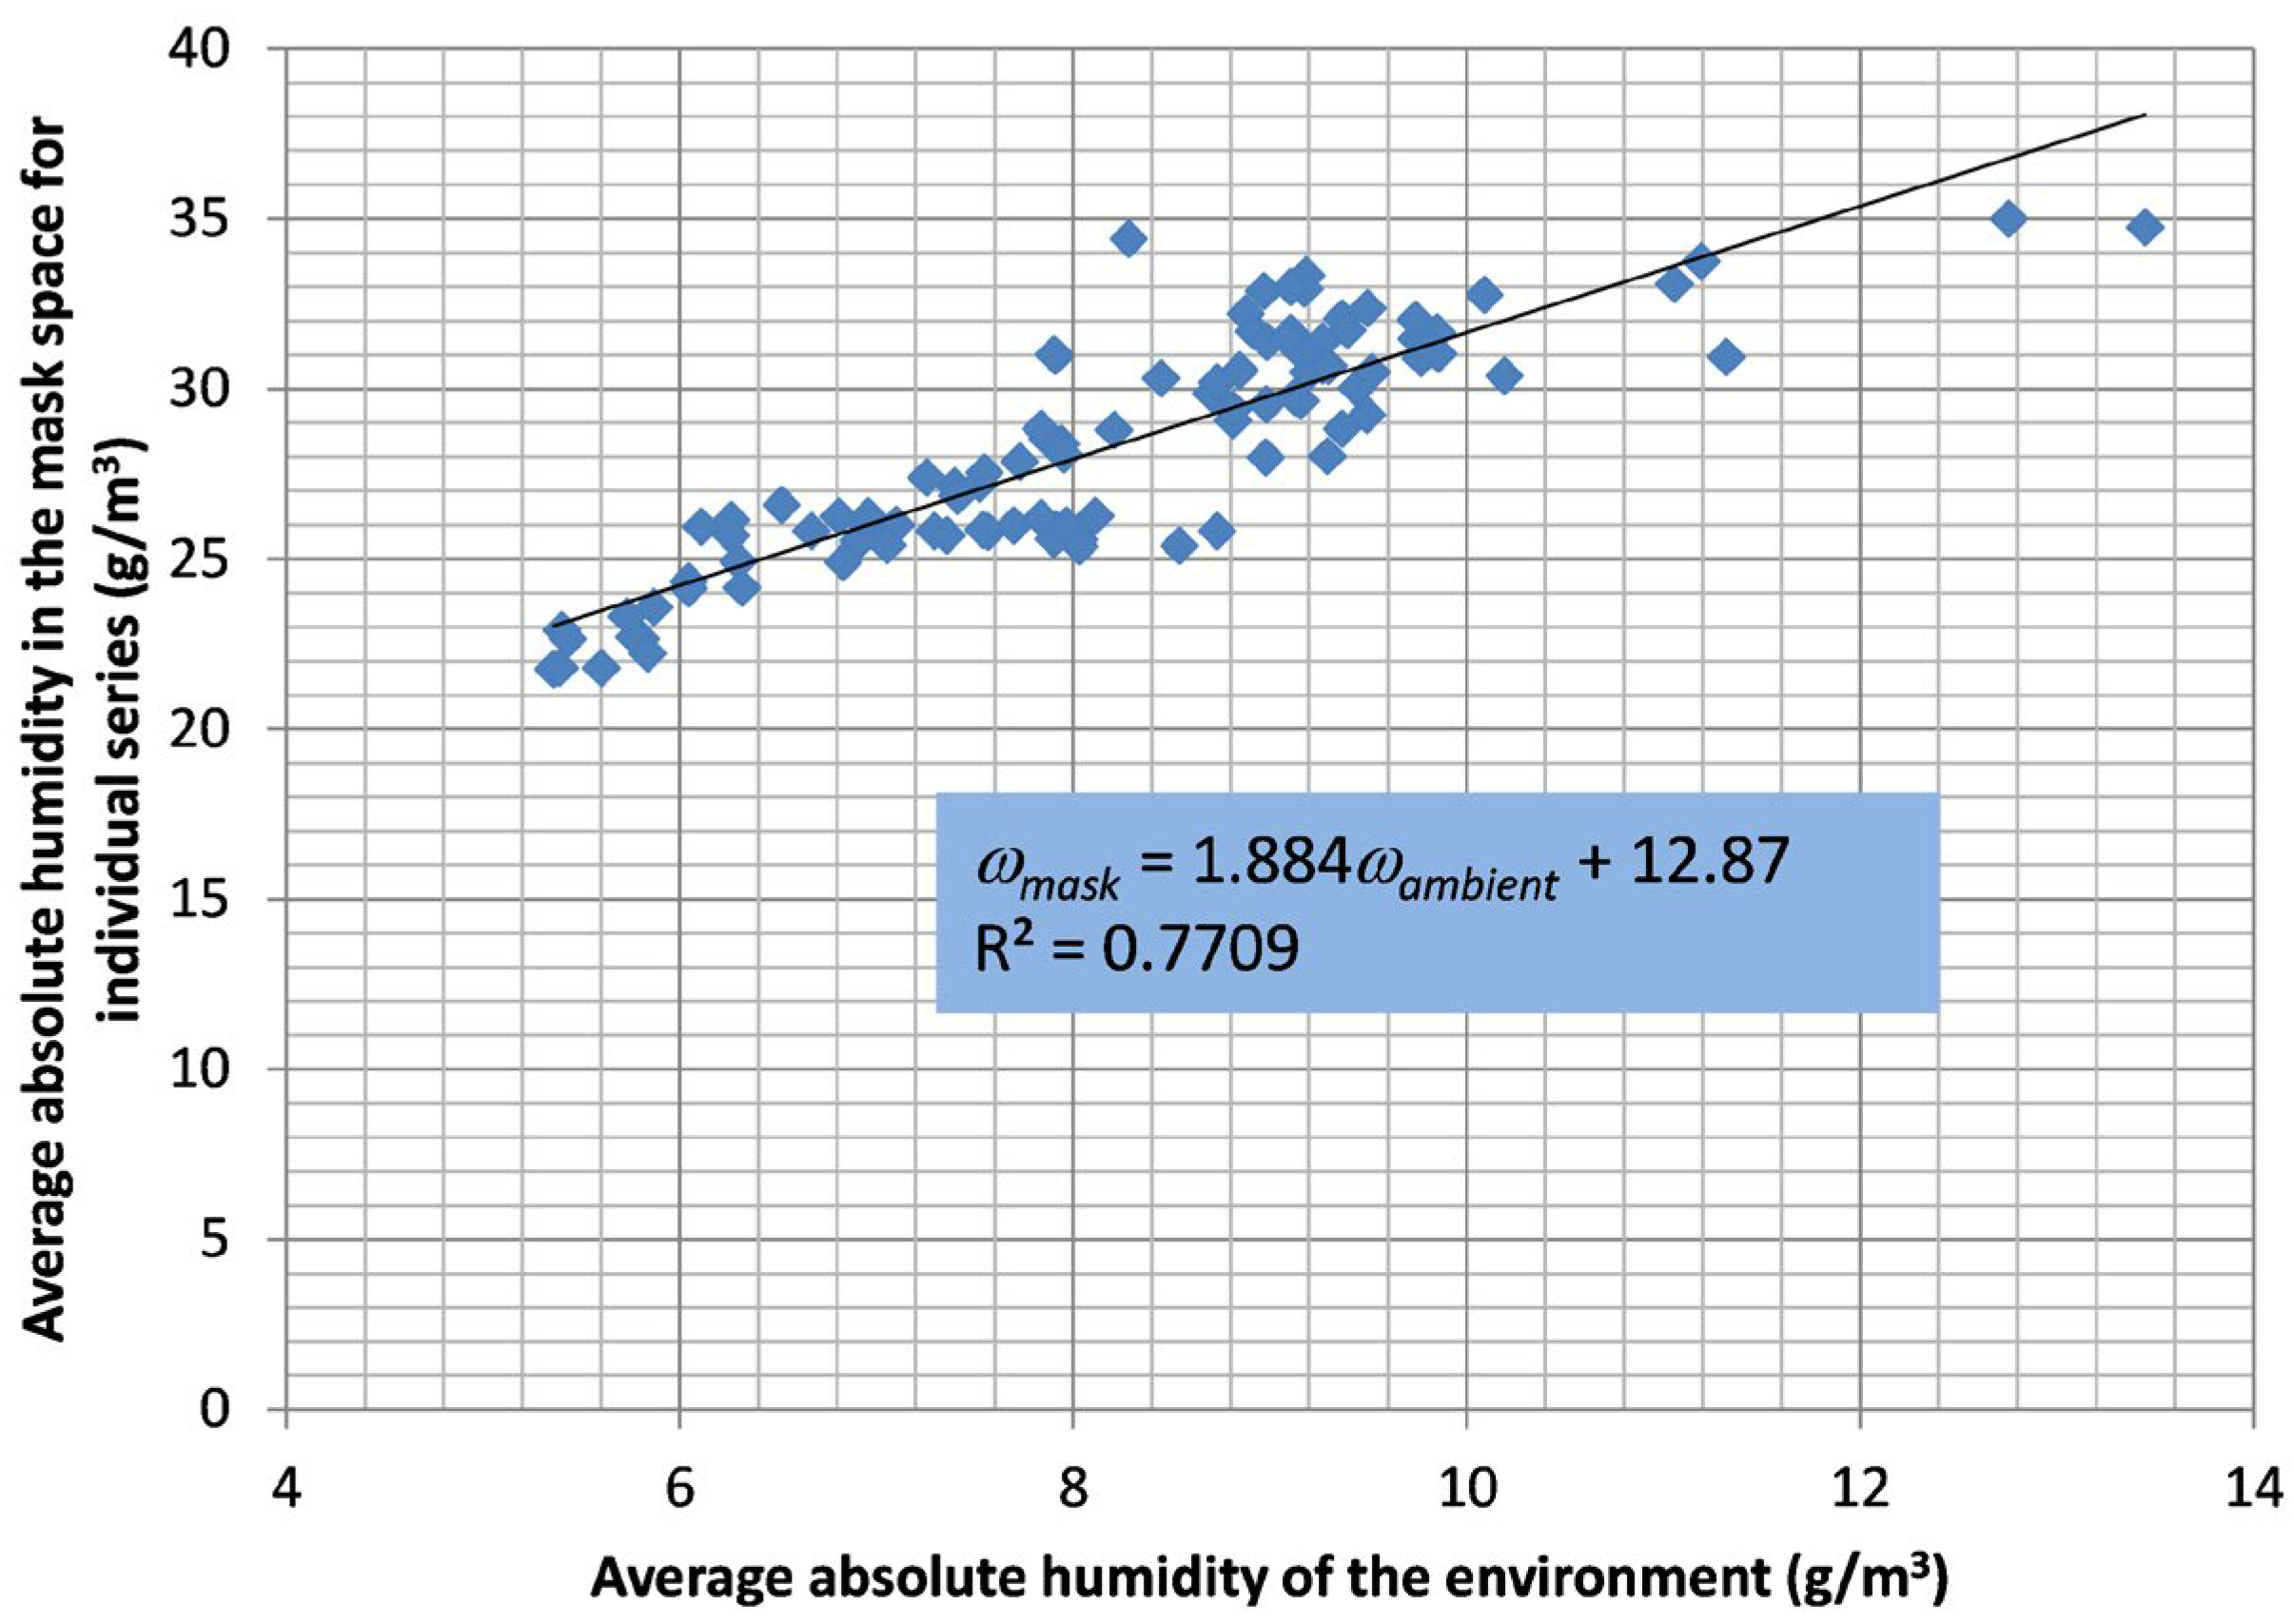
Figure 5 shows the relationship between the absolute humidity in the mask space and the absolute humidity inside the room. The coefficient of determination R2, which was 0.77, indicates a strong correlation between the absolute humidity in the mask space and the absolute humidity of the environment outside the mask. Lowering the humidity by drying the air inside the room where people wearing masks are present may contribute to reducing the humidity in the mask space.
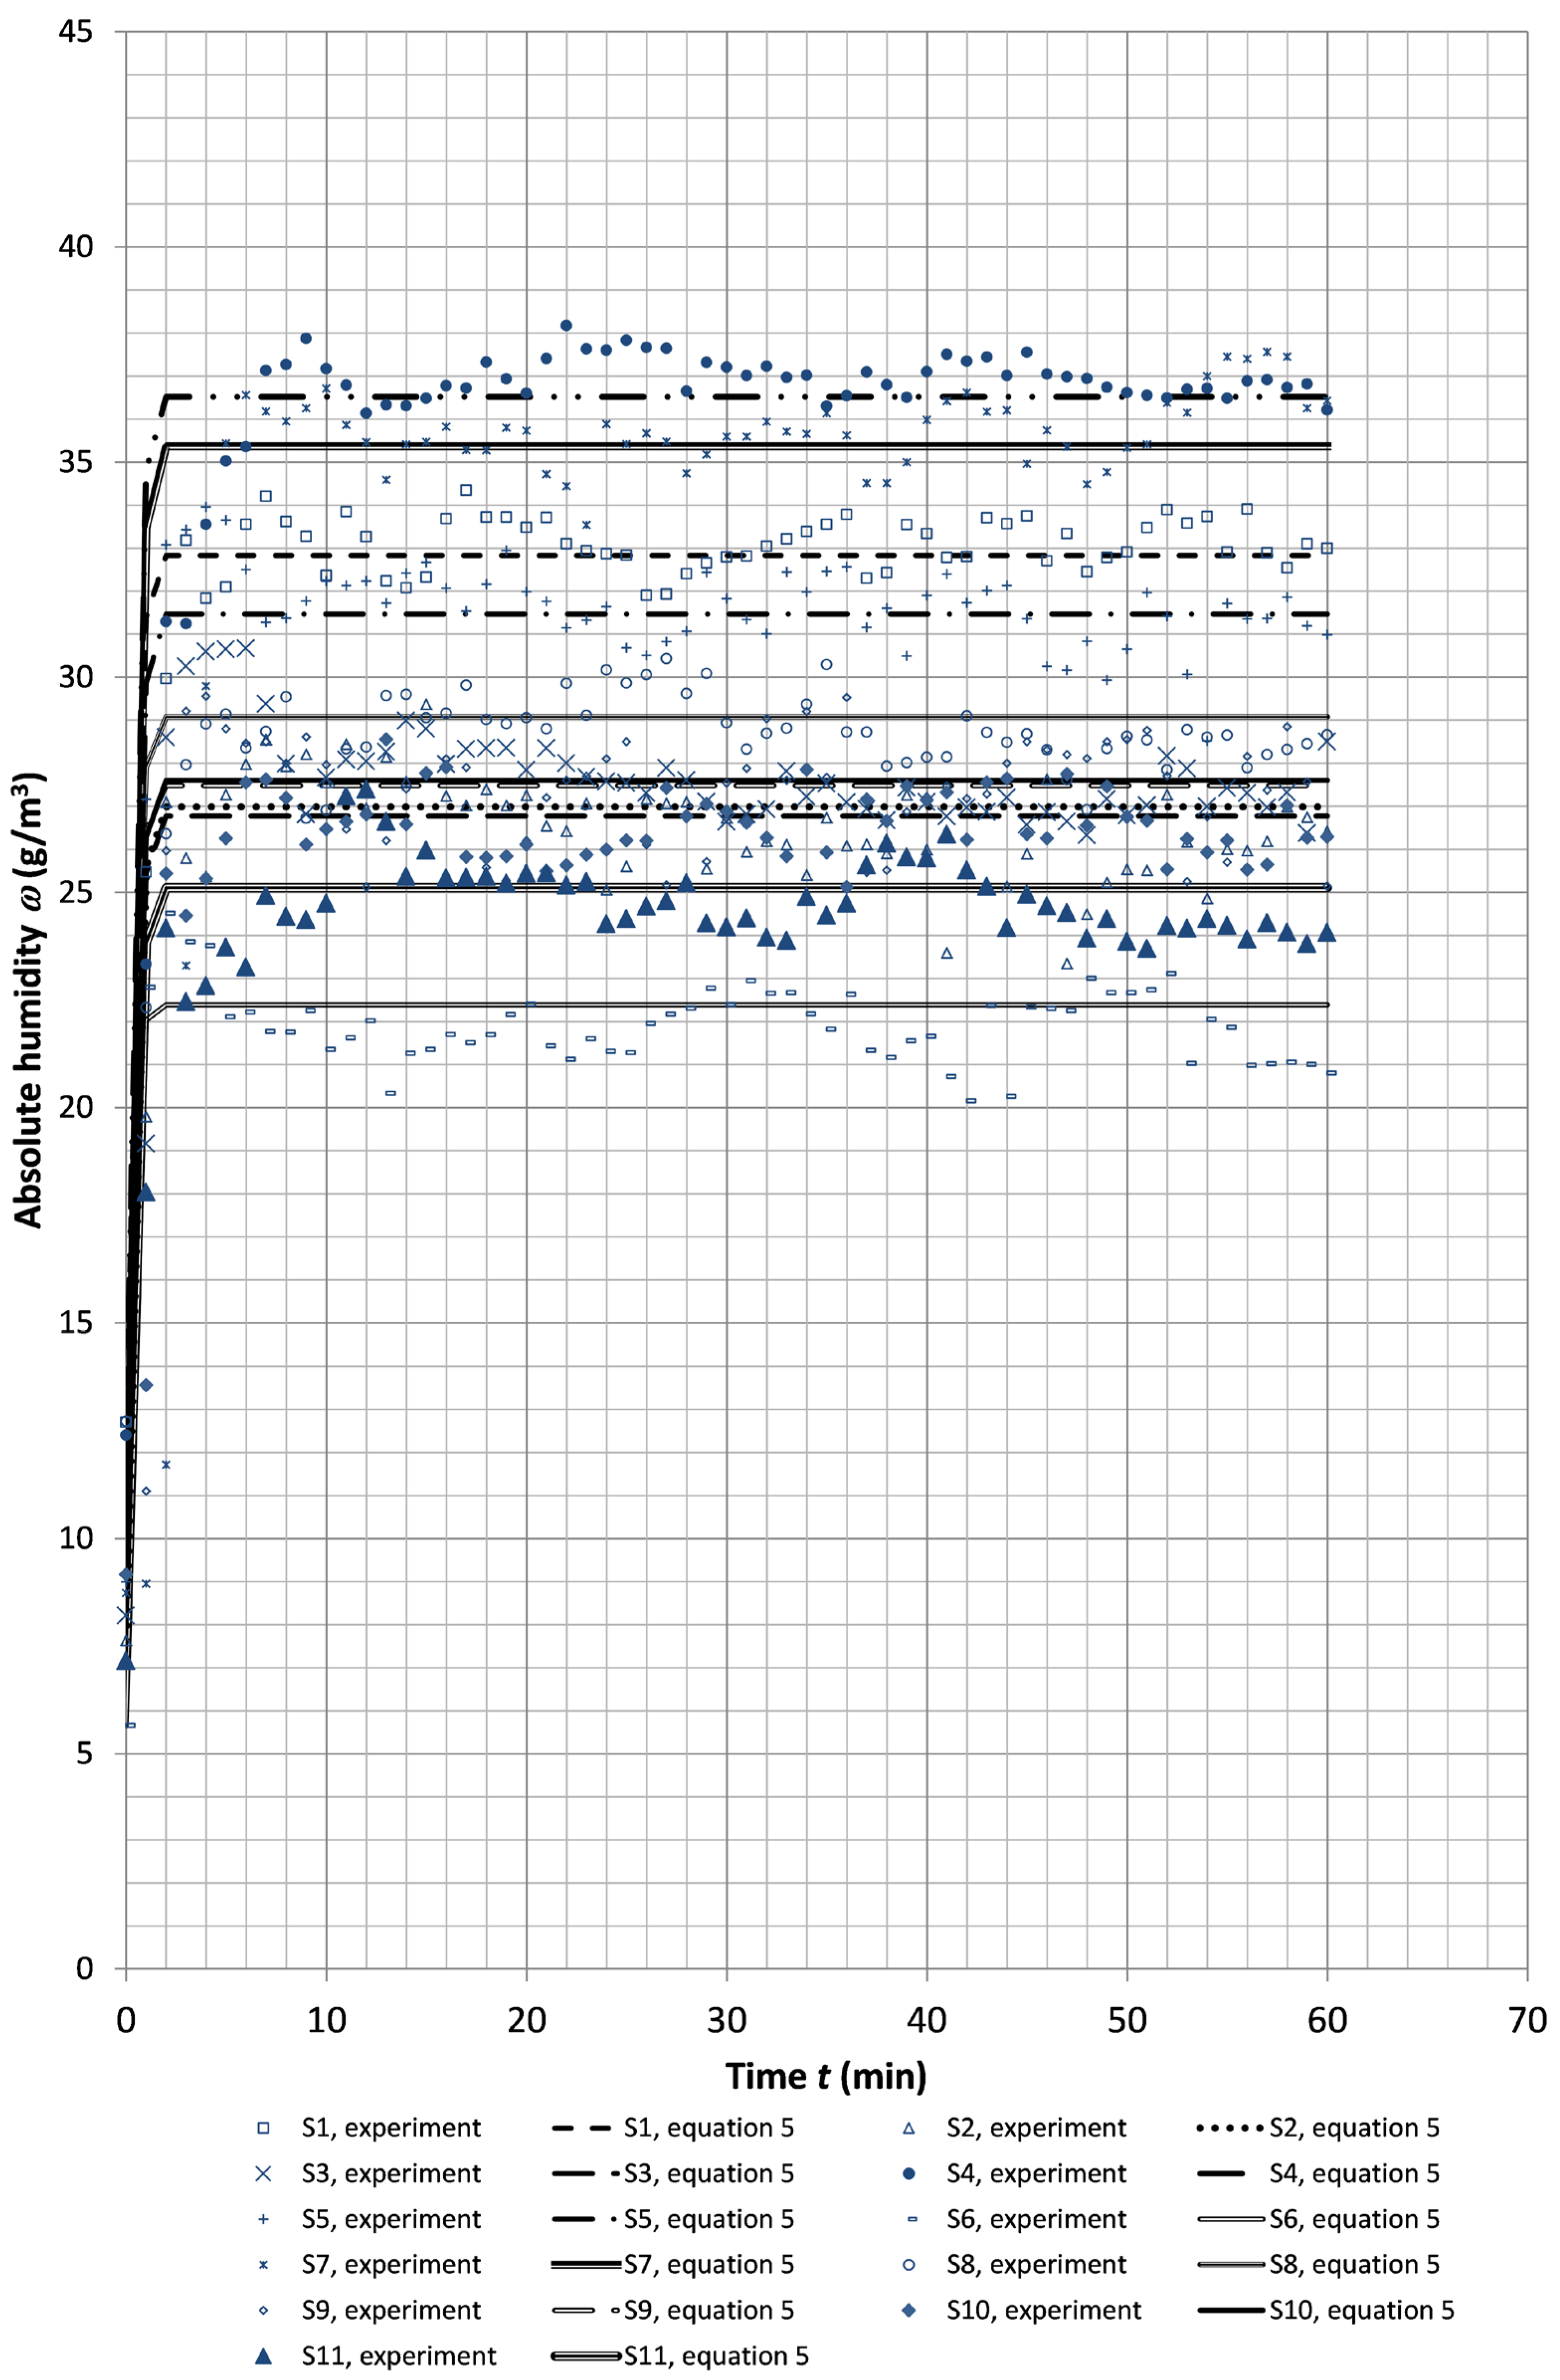
Due to the significant number of measurement series, Table 2 and Figure 6 present a selection of 11 measurement series that were performed for different absolute humidity values in the room. Figure 6 presents representative measurement series of absolute humidity as a function of time for one-hour mask use for selected masks and people, while Table 2 describes the average values of temperature, relative and absolute humidity of the ambient air in the office and in the mask space, and the type of mask with the tester.
Analyzing the course of absolute humidity (Figure 6) as a function of time, a rapid increase in humidity can be observed within a few minutes until the mask is put on the face. After a few minutes, the absolute humidity stabilizes, its final value depends primarily on the moisture content in the ambient air and the temperature inside the room (Table 2). Ambient temperature has an effect on human humidity generation. People who used the mask at lower temperatures experienced less discomfort [14]. It should be noted here that the value of moisture generated by humans depends primarily on physical activity [43]. One of the physical activities is office work in a sitting position, for which all protective mask testing studies have been carried out.
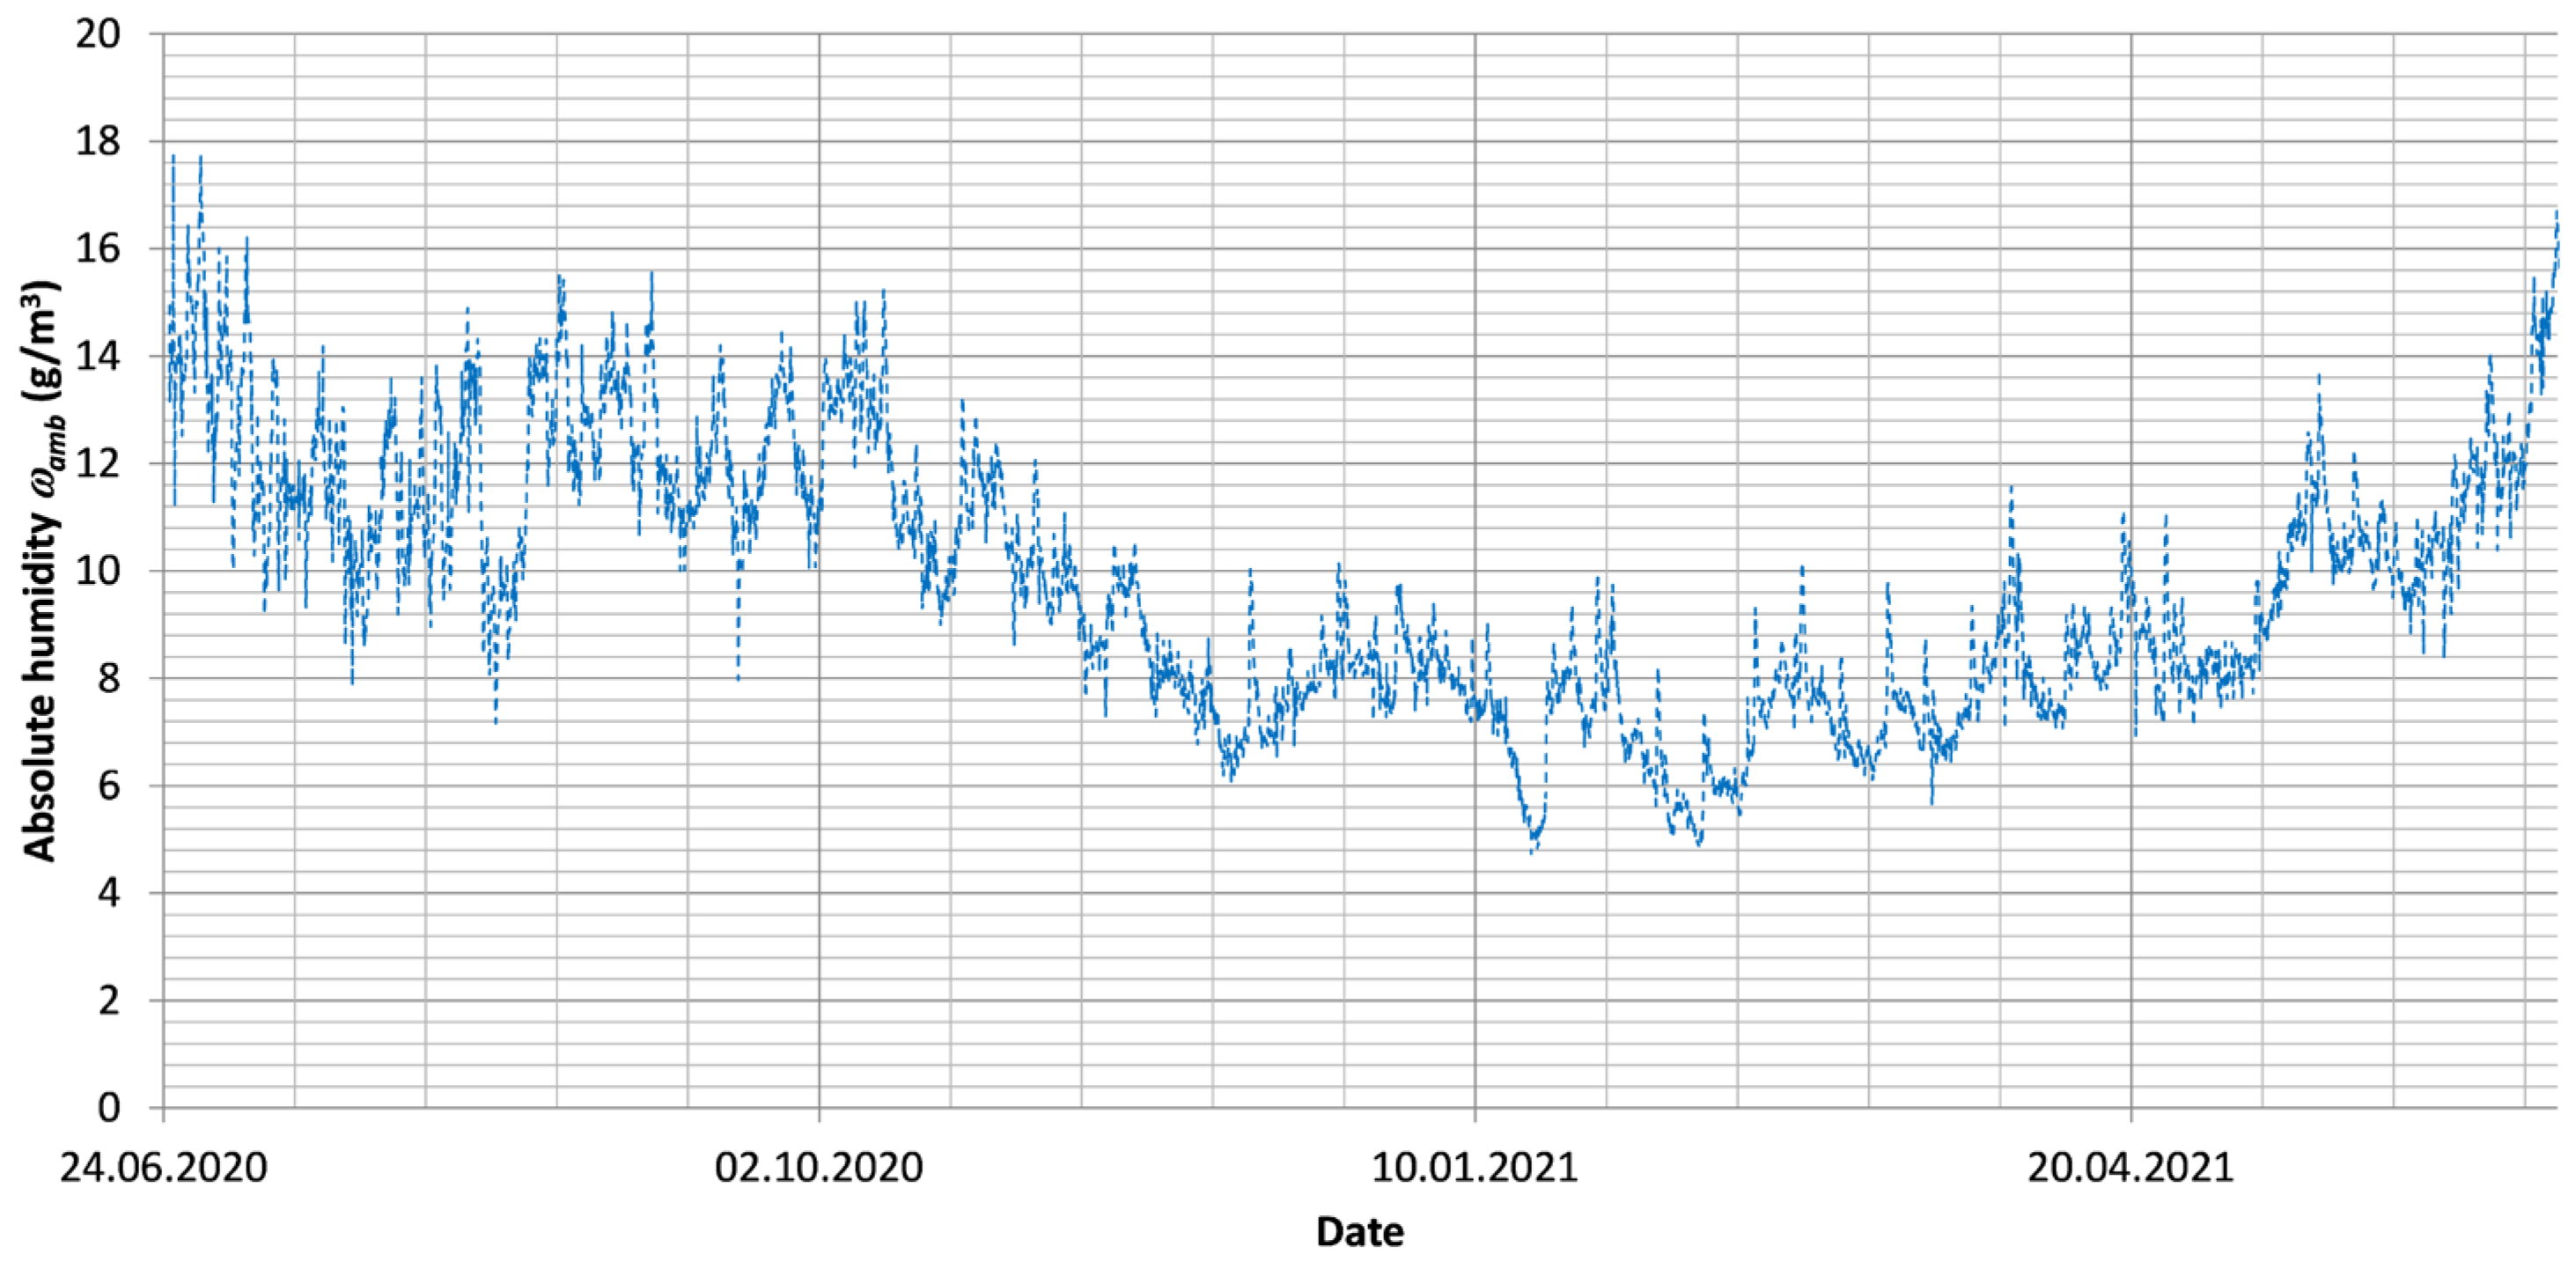
The moisture content of the outdoor air in a temperate climate depends largely on the season, the ventilation and heating system and the number of people in the room. Figure 7 presents the course of absolute humidity in 2021 in the room where the tests were conducted. The lowest values of absolute humidity occur in winter and the highest in summer. The stabilized absolute humidity values presented in Figure 6 depend primarily on the absolute humidity in the room, which in turn depends on the season. During the measurements, the highest average absolute humidity values in the room and in the mask space were recorded in September, and the lowest absolute humidity values in January and December.
Figure 8 shows the effect of removing mask 4 from the face on the absolute humidity measurements and the course of changes in the absolute humidity value in the tested room. After removing the mask from the face, there was a sudden drop in absolute humidity. A similar trend of changes in humidity was obtained in [4]. Removing the mask from the face reduces the absolute humidity to the absolute humidity value close to the room.

4. Simplified One-Dimensional Model of Absolute Humidity in the Mask Space

One-dimensional models can be used for prediction and simple analysis of air parameters related to air quality and microclimate, such as air temperature [44,45] or carbon dioxide concentration in the air [46,47]. Despite the simplifying assumptions made when formulating the differential equations, one-dimensional models can give good convergence to the experiment and provide better computational performance compared to complicated three-dimensional models.
The basis of the one-dimensional simplified model of absolute humidity ω [g/m3] in the mask space is the humidity balance, which consists of the humidity discharged from the mask space and supplied to the mask from the outside Qn [g/h] and the human-generated humidity Qg [g/h]:
V d ω d t = Q n + Q g ,
where V [m3] is tidal volume, t [h] is time.
The tidal volume parameter, according to the standard [37], is related to the work rate class, which is determined on the basis of the activities performed [37]. The adopted model assumes a work rate class of the W1 type [37], which is characterized by light work related, among others, to writing and working in the laboratory. For the work rate class W1, the tidal volume was assumed to be 1.5 dm3, in accordance with the standard [36,38]. It should be noted here that the mask during use is pressed against the face and has a small volume in relation to the tidal volume, therefore only the tidal volume was assumed in the model without taking into account the volume of the mask. Human-generated humidity Qg [g/h] was assumed on the basis of the relationship determined in publication [48]. The values of moisture from human origin determined from formula [48] for representative measurement series 1–11 are presented in Table 3.
Humidity Qamb discharged from the mask to the environment and supplied to the mask from the outside is described by the following relationship:
Q n = n V ( ω a m b ω ) ,
where ω [g/m3] is the absolute humidity inside the mask, ωamb [g/m3] is the absolute humidity outside, and n is the number of air changes in the mask [1/h].
The number of exchanges was determined as the ratio of the airflow volumetric flow q and the tidal volume V:
n = q V ,
In accordance with the testing guidelines for protective masks [36,37,38] for the work rate class W1, the masks are tested for two air flows of 10 L/h and 35 L/h. The volume flow of air was assumed as q = 24 L/h.
After substituting Formula (4) into relation (3), the absolute humidity balance takes the form:
V d ω d t = n V ( ω a m b ω ) + Q g ,
After integrating the above equation with respect to time, the model of absolute humidity (ω = ωnum) change as a function of time t in the mask space was determined:
ω n u m = ω a m b + Q g n V + ω t = 0 ω a m b Q g n V e n t ,
The calculation results of the model (5) for an air flow of 24 l/h were compared with the data from the experiment. The relative error was determined according to the following formula:
δ ω n u m = ω exp ω n u m ω exp 100 %
where ωexp is the absolute humidity from the experiment, while ωnum is the value determined from the model (5). The average value of the relative error determined according to the Formula (6) from all measurement series amounted to 7.4%.
A graphical comparison of the calculation results of the model (5) with the experiment for the selected eleven measurement series is shown in Figure 6. For greater clarity, Figure 8 shows a graphical comparison of the model with the experiment only for the measurement series No. 1. As can be seen in Figure 6 and Figure 9, the results obtained from the one-dimensional model achieved good agreement with the experimental data. Comparing the solution of model (5) with the experiment (Figure 9), it can be seen that the model function is a smooth function in a given one-hour time interval, while the results of the experiment are characterized by fluctuations. Fluctuations in absolute humidity are probably caused by the nature of office work, in which the head makes small movements while working at the computer, which may interfere with the flow of air through the mask. The simplified model (5) can be used to estimate the humidity in the mask space for different types of masks and for different climatic conditions and different physical activities.

5. Conclusions

Wearing a mask causes an increase in temperature and humidity in the air in the mask space during light office work from the moment the mask is put on the face. Absolute humidity values stabilize after a few minutes and depend on the temperature and humidity of the ambient air in the room. The average values of temperature and humidity during one-hour use of the mask significantly exceeded the recommended levels presented in the standards [1]. During the use of the mask, discomfort may occur due to the simultaneous increase in temperature and air humidity. Research has shown that the average relative humidity in the mask space is approximately twice as high as the relative humidity of the ambient air, while the average temperature inside protective masks is approximately one and a half times higher than the ambient air temperature. The research was carried out in different seasons in the temperate climate zone, which is characterized by high variability of both temperature and humidity as a function of time. The average temperature and average relative humidity values in the mask space during one hour of mask use exceeded thirty degrees Celsius and eighty percent, respectively. It should be noted here that the general trends in providing thermal and humidity comfort for people assume that the higher the value of air humidity, the lower the value of air temperature should be.
Research has shown that removing the mask causes a drop in temperature and air humidity in the space where the temperature and humidity were measured. Removing the mask is undoubtedly a simple method that can restore the air parameters from before wearing the mask.
The simplified model of absolute humidity in the space of the mask developed in the work can be used to predict the course of absolute humidity in the space of the mask based on the temperature and air humidity in rooms where people are present. It should be noted here that the developed model was tested in office conditions while working at a computer. The calculation results indicate that the people taking part in the experiment generated humidity from 26.3 g/h to 38.4 g/h. In subsequent research, the model will be validated for other physical activities.
In the next research works, it is planned to confirm the results of this work for a larger number of measurement series and conduct research on methods to reduce high temperature and humidity in the mask space. Accumulation of air humidity in the mask can be optionally reduced by using a suitable material that lets moisture out. The temperature in the mask space can be lowered by using materials from which the mask is made with a higher thermal conductivity coefficient, which may contribute to greater heat transfer outside the mask.

Author Contributions

Conceptualization, T.J.T. and K.G.-F.; methodology, T.J.T. and K.G.-F.; software, T.J.T.; validation, T.J.T.; formal analysis, T.J.T., K.G.-F. and J.L.; investigation, T.J.T. and J.L.; resources, K.G.-F.; writing—original draft preparation, T.J.T. and K.G.-F.; writing—review and editing, T.J.T. and J.L.; visualization, T.J.T.; supervision, T.J.T. and K.G.-F.; project administration, K.G.-F. All authors have read and agreed to the published version of the manuscript.

Funding

The study has been executed with resources of the statutory work financed by the Ministry of Science and Higher Education in Poland (WZ/WB-IIŚ/8/2023 and Institute of Environmental Engineering, Warsaw University of Life Sciences (SGGW)) and Tianjin Chengjian University, Tianjin Key Laboratory of Water Quality Science and Technology.

Institutional Review Board Statement

This study does not require ethical review or approval because it is non-invasive and will not cause harm to the human body.

Informed Consent Statement

Informed consent was obtained from all subjects involved in the study.

Data Availability Statement

The data generated and analyzed during this study are available on request from the corresponding author. The data are not publicly available due to ongoing research and analysis.

Conflicts of Interest

The authors declare no conflicts of interest.

Nomenclature

nair change rate in the mask (ACH) (h−1)
qvolumetric flow (m3/h)
Qghumidity generated by the mask user (g/h)
Qnmoisture removed from the mask space and supplied to the mask from the outside (g/h)
Ttemperature in the mask space (°C)
Tmmean temperature in the mask space (°C)
Tm_maxmaximum temperature from one-hour average temperatures in the mask space (°C)
Tm_minminimum temperature from one-hour average temperatures in the mask space (°C)
ttime (min or h)
Vtidal volume (m3)
Greek symbols
σTmstandard deviation for temperature in the mask space (°C)
σϕmstandard deviation for relative humidity in the mask space (%)
σωmstandard deviation for absolute humidity in the mask space (g/m3)
ϕmaverage relative humidity in the mask space (%)
ϕm_maxmaximum relative humidity from one-hour average relative humidity values in the mask space (%)
ϕm_minminimum relative humidity from one-hour average relative humidity values in the mask space (%)
ωabsolute humidity in the mask space (g/m3)
ωambambient absolute humidity (external) (g/m3)
ωexpabsolute humidity from measurements (g/m3)
ωmmean absolute humidity in the mask space (g/m3)
ωm_maxmaximum absolute humidity from one-hour average absolute humidity values in the mask space (g/m3)
ωm_minminimum absolute humidity from one-hour average absolute humidity values in the mask space (g/m3)
ωnumabsolute humidity determined from Equation (5) (g/m3)
ωt=0initial value of absolute humidity in the mask space (g/m3)

References

  1. ASHRAE Standard 55; Thermal Environmental Conditions for Human Occupancy. ASHRAE Standard: Peachtree Corners, GA, USA, 2012.
  2. Dumała, S.M.; Guz, Ł.; Badora, A. Indoor Air Quality in Schools Located in Poland, Lublin Province. J. Ecol. Eng. 2024, 25, 17–26. [Google Scholar] [CrossRef]
  3. Szczurek, A.; Maciejewska, M. Categorisation for air quality assessment in car cabin. Transp. Res. D Transp. Environ. 2016, 48, 161–170. [Google Scholar] [CrossRef]
  4. Gupta, D. Living with in-mask micro-climate. Med. Hypotheses 2020, 144, 110010. [Google Scholar] [CrossRef] [PubMed]
  5. Gładyszewska-Fiedoruk, K.; Teleszewski, T.J. Experimental studies of carbon dioxide concentration in the space under the face mask protecting against COVID-19—Pilot studies. J. Environ. Health. Sci. Eng. 2022, 20, 1111–1119. [Google Scholar] [CrossRef]
  6. Hayashi, C.; Tokura, H. The effects of two kinds of mask (with or without exhaust valve) on clothing microclimates inside the mask in participants wearing protective clothing for spraying pesticides. Int. Arch. Occup. Environ. Health 2004, 77, 73–78. [Google Scholar] [CrossRef]
  7. Teleszewski, T.J.; Gładyszewska-Fiedoruk, K.; Sulewska, M.J. Experimental Studies of Hydraulic Losses and Carbon Dioxide Concentration in the Space Under the Face Mask Protecting Against COVID-19. Civ. Environ. Eng. Rep. 2022, 32, 13–24. [Google Scholar] [CrossRef]
  8. Chughtai, A.A.; Stelzer-Braid, S.; Rawlinson, W.; Pontivivo, G.; Wang, Q.; Pan, Y.; Zhang, D.; Zhang, Y.; Li, L.; MacIntyre, C.R. Contamination by respiratory viruses on outer surface of medical masks used by hospital healthcare workers. BMC Infect. Dis. 2019, 19, 491. [Google Scholar] [CrossRef]
  9. McLaws, M.-L.; Chughtai, A.A.; Salmon, S.; MacIntyre, C.R. A highly precautionary doffing sequence for health care workers after caring for wet Ebola patients to further reduce occupational acquisition of Ebola. Am. J. Infect. Control 2016, 44, 740–744. [Google Scholar] [CrossRef]
  10. World Health Organization (WHO). Infection Prevention and Control Of Epidemic- and Pandemic-Prone Acute Respiratory Infections In Health Care; WHO: Geneva, Switzerland, 2014. [Google Scholar]
  11. Li, Y.; Liang, M.; Gao, L.; Ahmed, M.A.; Uy, J.P.; Cheng, C.; Zhou, Q.; Sun, C. Face masks to prevent transmission of COVID-19: A systematic review and meta-analysis. Am. J. Infect. Control 2021, 49, 900–906. [Google Scholar] [CrossRef]
  12. Liao, M.; Liu, H.; Wang, X.; Hu, X.; Huang, Y.; Liu, X.; Brenan, K.; Mecha, J.; Nirmalan, M.; Lu, J.R. A technical review of face mask wearing in preventing respiratory COVID-19 transmission. Curr. Opin. Colloid Interface Sci. 2021, 52, 101417. [Google Scholar] [CrossRef]
  13. WHO. Coronavirus Disease (COVID-19): Masks. Available online: https://www.who.int/news-room/questions-and-answers/item/coronavirus-disease-covid-19-masks (accessed on 5 January 2024).
  14. Burgos-Blasco, B.; Arriola-Villalobos, P.; Fernandez-Vigo, J.I.; Oribio-Quinto, C.; Ariño-Gutierrez, M.; Diaz-Valle, D.; Benitez-Del-Castillo, J.M. Face mask use and effects on the ocular surface health: A comprehensive review. Ocul. Surf. 2023, 27, 56–66. [Google Scholar] [CrossRef]
  15. Tang, T.; Zhu, Y.; Zhou, X.; Guo, Z.; Mao, Y.; Jiang, H.; Fang, Z.; Zheng, Z.; Chen, X. Investigation of the effects of face masks on thermal comfort in Guangzhou, China. Build. Environ. 2022, 214, 108932. [Google Scholar] [CrossRef] [PubMed]
  16. Guan, X.; Lin, J.; Han, J.; Gao, X.; Zhang, Y.; Hu, B.; Guidoin, R.; Wang, L. Prolonged Use of Surgical Masks and Respirators Affects the Protection and Comfort for Healthcare Workers. Materials 2022, 15, 7918. [Google Scholar] [CrossRef]
  17. Cherrie, J.W.; Wang, S.; Mueller, W.; Wendelboe-Nelson, C.; Loh, M. In-mask temperature and humidity can validate respirator wear-time and indicate lung health status. J. Expo. Sci. Environ. Epidemiol. 2019, 29, 578–583. [Google Scholar] [CrossRef]
  18. Liu, Y.; Zhao, H.; Chen, H.; Li, X.; Ran, C.; Sun, H.; Wang, L. Does mask wearing affect skin health? An untargeted skin metabolomics study. Environ. Int. 2023, 178, 108073. [Google Scholar] [CrossRef]
  19. Park, A.; Khadka, S.; Sato, F.; Omura, S.; Fujita, M.; Hashiwaki, K.; Tsunoda, I. Bacterial and Fungal Isolation from Face Masks: Newly Emerged Hygiene Issues Under COVID-19 Pandemic. Sci. Rep. 2022, 12, 11361. [Google Scholar] [CrossRef]
  20. Gyapong, F.; Debra, E.; Ofori, M.O.; Ayerakwa, E.A.; Abban, M.K.; Mosi, L.; Isawumi, A. Multi-drug resistant microbes are resident on nose masks used as preventive protocols for COVID-19 in selected Ghanaian cohort. Wellcome Open Res. 2023, 8, 250. [Google Scholar] [CrossRef]
  21. Lee, Y.H.; Kim, H.; Heo, D.W.; Ahn, I.-S.; Auh, Q.-S. Volatile sulfide compounds and oral microorganisms on the inner surface of masks in individuals with halitosis during COVID-19 pandemic. Sci. Rep. 2023, 13, 2487. [Google Scholar] [CrossRef]
  22. Merenstein, C.; Fitzgerald, A.S.; Khatib, L.A.; Graham-Wooten, J.; Bushman, F.D.; Collman, R.G. Effects of Mask Reuse on the Oropharyngeal, Skin, and Mask Microbiome. J. Infect. Dis. 2023, 228, 479–486. [Google Scholar] [CrossRef]
  23. Ostrowski, P.; Masiuk, H.; Kulig, P.; Skoryk, A.; Wcisłek, A.; Jursa-Kulesza, J.; Sarna, A.; Sławiński, M.; Kotowski, M.; Tejchman, K.; et al. Medical Face Masks Do Not Affect Acid-Base Balance Yet Might Facilitate the Transmission of Staphylococcus aureus in Hospital Settings during the COVID-19 Pandemic. Int. J. Environ. Res. Public Health. 2023, 20, 2474. [Google Scholar] [CrossRef]
  24. Liu, Z.; Chang, Y.; Chu, W.; Yan, M.; Mao, Y.; Zhu, Z.; Wu, H.; Zhao, J.; Dai, K.; Li, H.; et al. Surgical masks as source of bacterial contamination during operative procedures. J. Orthop. Transl. 2018, 14, 57–62. [Google Scholar] [CrossRef]
  25. Stoll, D.; Antonyuk, S. Influence of Humidity on FFP Masks with Electret Filter Media Under Real-Life Wearing Conditions. Atmosphere 2025, 16, 62. [Google Scholar] [CrossRef]
  26. Solano, T.; Shoele, K. Investigation of the Role of Face Shape on the Flow Dynamics and Effectiveness of Face Masks. Fluids 2022, 7, 209. [Google Scholar] [CrossRef]
  27. Barari, K.; Si, X.; Xi, J. Impacts of Mask Wearing and Leakages on Cyclic Respiratory Flows and Facial Thermoregulation. Fluids 2024, 9, 9. [Google Scholar] [CrossRef]
  28. Pisapia, F.; Rees, D.; Rasekh, M. Design and Evaluation of Face Mask Filtration: Mechanisms, Formulas, and Fluid Dynamics Simulations. Appl. Sci. 2024, 14, 5432. [Google Scholar] [CrossRef]
  29. Rasekh, M.; Pisapia, F.; Hafizi, S.; Rees, D. Filtering Efficiency and Design Properties of Medical- and Non-Medical-Grade Face Masks: A Multiscale Modeling Approach. Appl. Sci. 2024, 14, 4796. [Google Scholar] [CrossRef]
  30. Factors Shaping the Climate of Poland. Available online: https://zpe.gov.pl/a/factors-shaping-the-climate-of-poland/D12UnACu9 (accessed on 5 April 2022).
  31. EN 14683:2001; Medical Face Masks—Requirements and Test Methods. European Standards: Pilsen, Czech Republic, 2001.
  32. EN 149:2001+A1:2009; Respiratory Protective Devices—Filtering Half Masks to Protect Against Particles—Requirements, Testing, Marking. European Standards: Pilsen, Czech Republic, 2001.
  33. GB 2626-2006; Respiratory Protective Equipment—Non-Powered Air-Purifying Particle Respirator. Chinese GB Standards: Beijing, China, 2006.
  34. Statistical Yearbook. Available online: https://stat.gov.pl/metainformacje/slownik-pojec/pojecia-stosowane-w-statystyce-publicznej/861,pojecie.html (accessed on 5 April 2022).
  35. Statistical Yearbook. Available online: https://stat.gov.pl/obszary-tematyczne/ludnosc/ludnosc/ludnosc-piramida/ (accessed on 5 April 2022).
  36. ISO 16900-12:2016; Respiratory Protective Devices—Methods of Test and Test Equipment—Part 12: Determination of Volume-Averaged Work of Breathing and Peak Respiratory Pressures. ISO: Geneva, Switzerland, 2016.
  37. ISO/TS 16976-4:2012; Respiratory Protective Devices—Human Factors—Part 4: Work of Breathing and Breathing Resistance: Physiologically Based Limits. ISO: Geneva, Switzerland, 2012.
  38. Makowski, K. New requirements in regard of ergonomic parameters of filtering respiratory protective devices. Bezpieczeństwo Pr. Nauka I Prakt. 2020, 10, 22–25. (In Polish) [Google Scholar] [CrossRef]
  39. Bergman, T.L.; Lavine, A.S.; Incropera, F.P. Fundamentals of Heat and Mass Transfer, 7th ed.; John Wiley & Sons, Incorporated: New York, NY, USA, 2011; ISBN 9781118137253. [Google Scholar]
  40. Psychrometric Chart. Available online: https://drajmarsh.bitbucket.io/psychro-chart2d.html (accessed on 5 February 2022).
  41. Types of Respirators and Masks. Available online: https://archive.cdc.gov/www_cdc_gov/coronavirus/2019-ncov/prevent-getting-sick/types-of-masks.html (accessed on 5 February 2022).
  42. Segovia, J.M.; Huang, C.-H.; Mamishev, M.; Yuan, N.; He, J.; Novosselov, I. Performance of Textile Mask Materials in Varied Humidity: Filtration Efficiency, Breathability, and Quality Factor. Appl. Sci. 2022, 12, 9360. [Google Scholar] [CrossRef]
  43. Zemitis, J.; Borodinecs, A.; Frolova, M. Measurements of moisture production caused by various sources. Energy Build. 2016, 127, 884–891. [Google Scholar] [CrossRef]
  44. Horak, J.; Schmerold, I.; Wimmer, K.; Schauberger, G. Cabin air temperature of parked vehicles in summer conditions: Life-threatening environment for children and pets calculated by a dynamic model. Theor. Appl. Climatol. 2017, 130, 107–118. [Google Scholar] [CrossRef]
  45. Sun-Ik, N.; Minsung, K.; Min, S.K. Performance analysis of an automotive heat pump system with desiccant coated heat exchangers. Appl. Therm. Eng. 2022, 213, 118723. [Google Scholar] [CrossRef]
  46. Batog, P.; Badura, M. Dynamic of Changes in Carbon Dioxide Concentration in Bedrooms. Procedia Eng. 2013, 57, 175–182. [Google Scholar] [CrossRef]
  47. Macarulla, M.; Casals, M.; Carnevali, M.; Forcada, N.; Gangolells, M. Modelling indoor air carbon dioxide concentration using grey-box models. Build Environ. 2017, 117, 146–153. [Google Scholar] [CrossRef]
  48. Gładyszewska-Fiedoruk, K.; Teleszewski, T.J. Modeling of Humidity in Passenger Cars Equipped with Mechanical Ventilation. Energies 2020, 13, 2987. [Google Scholar] [CrossRef]
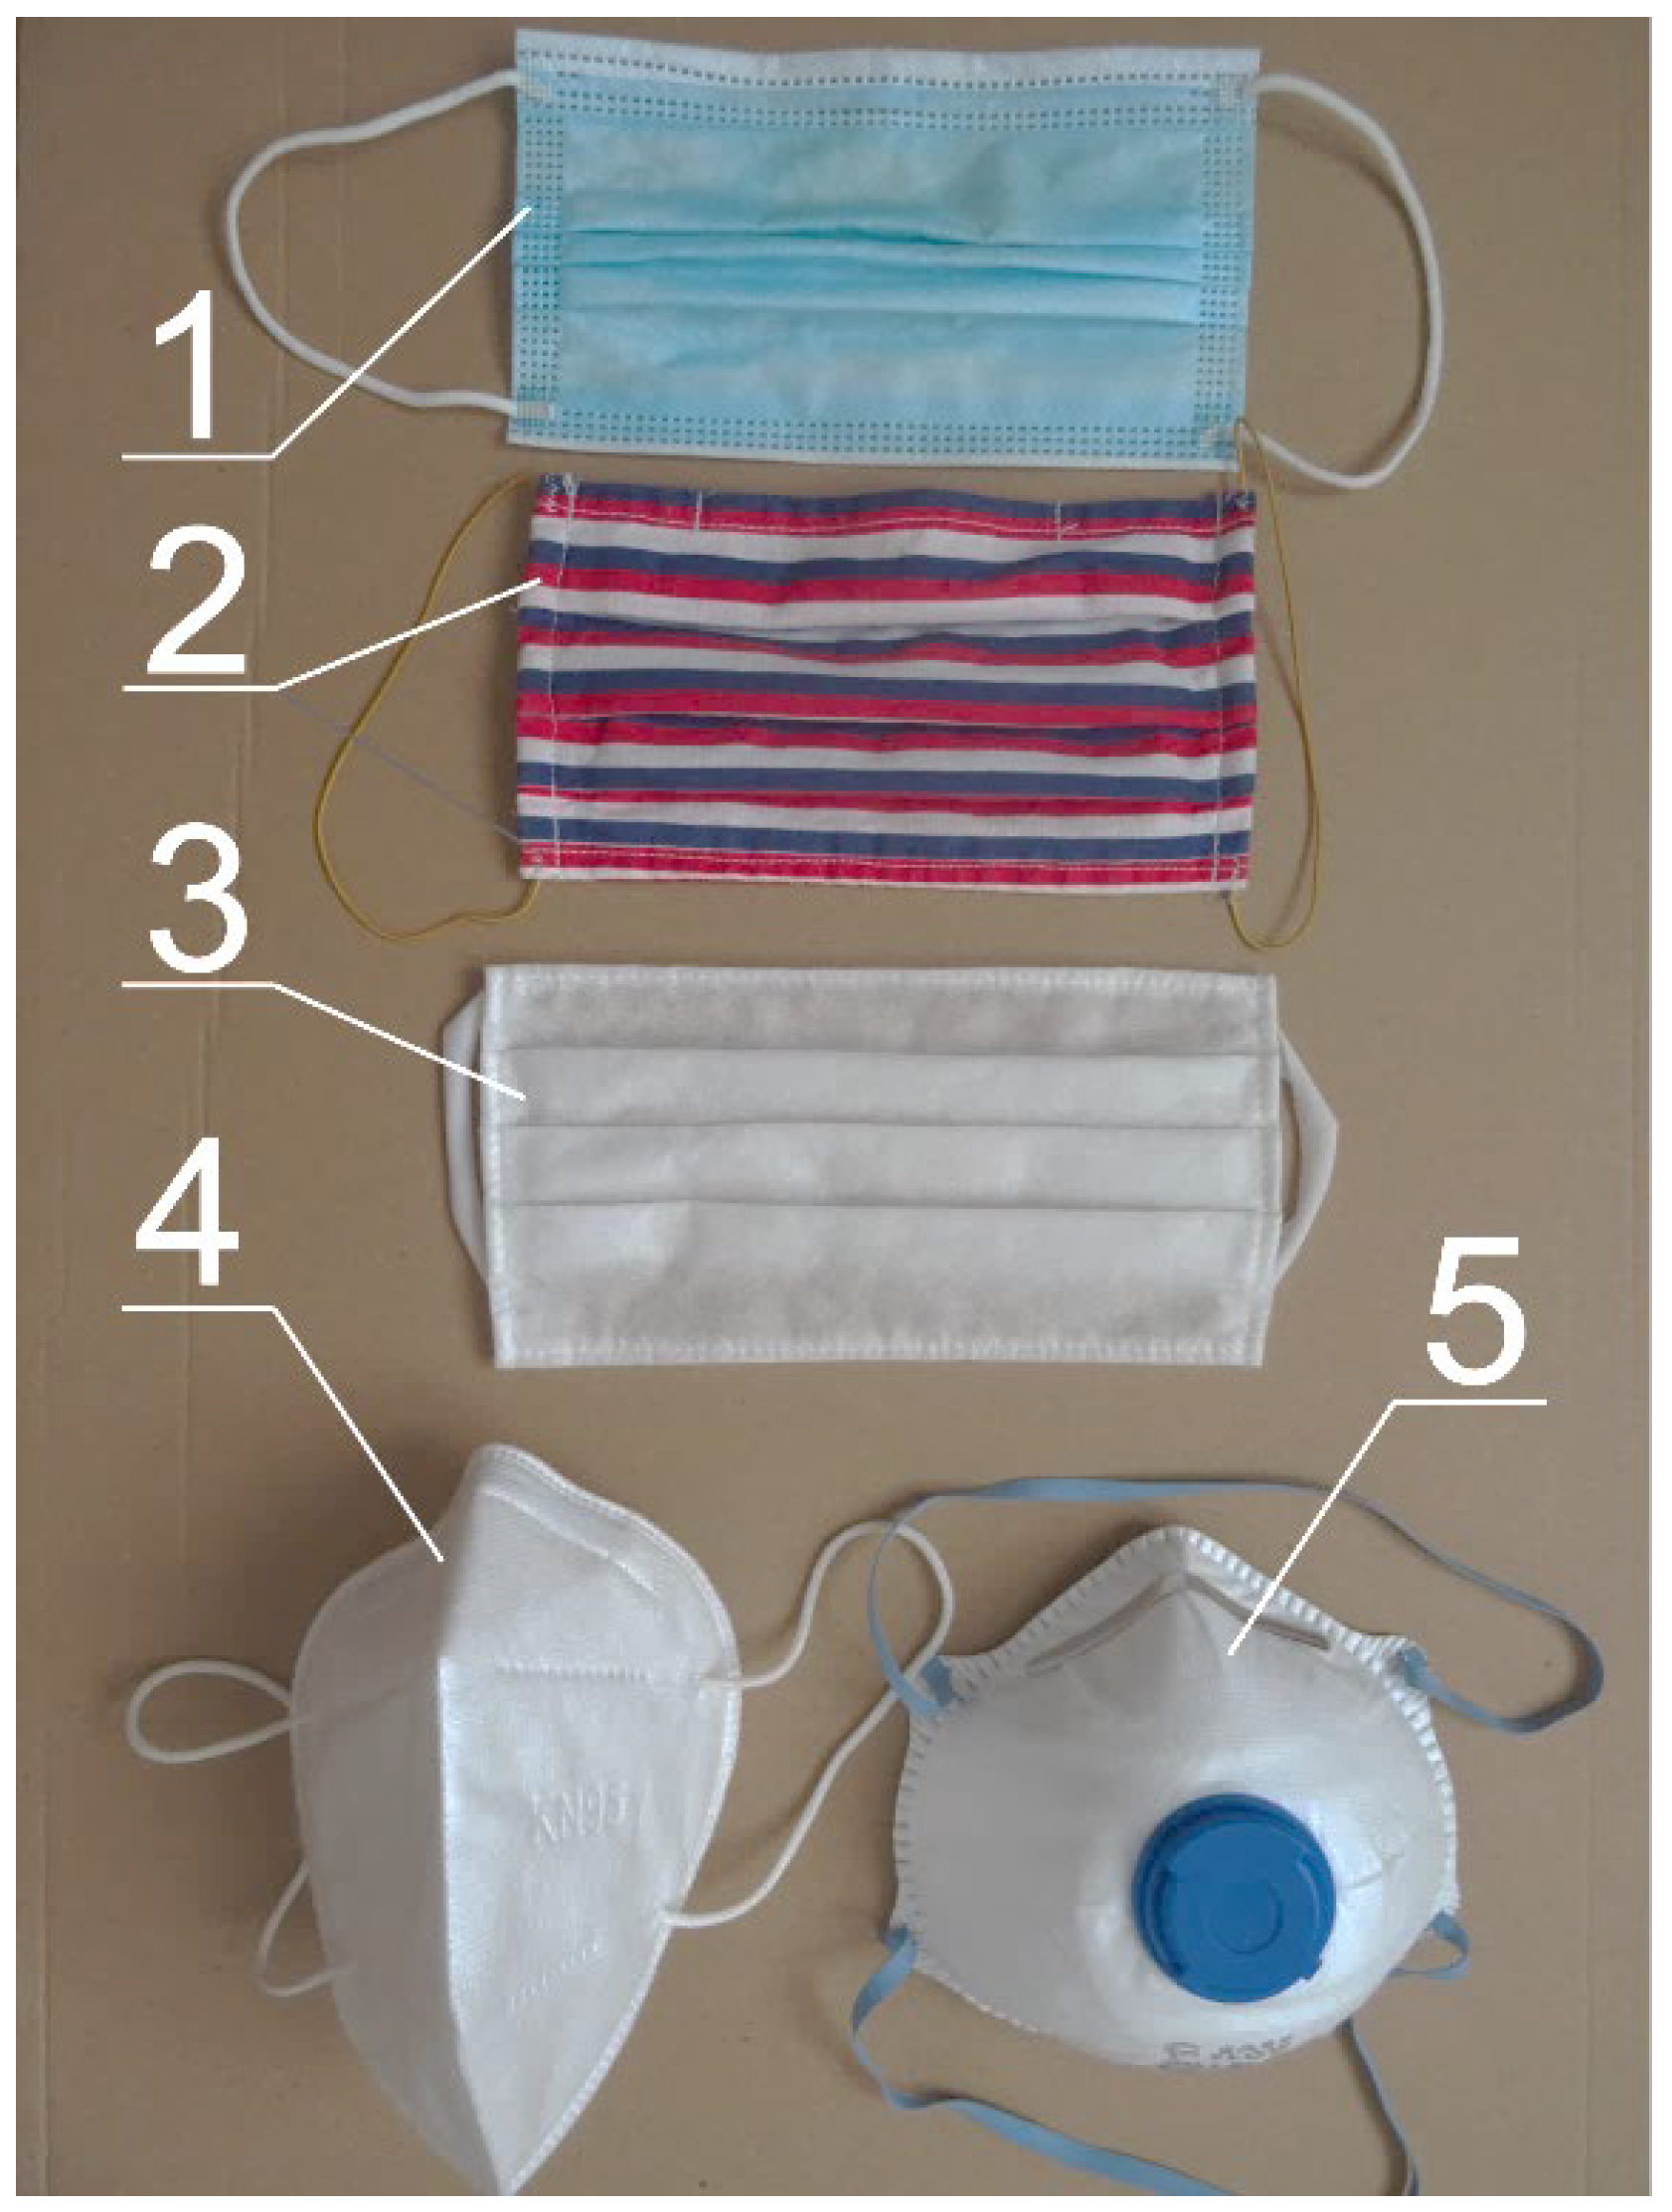
Figure 1. General view of the tested masks: 1—three-layer flat mask, 2—hand-made mask, 3—double-layer flat mask, 4—KN95 convex mask, 5—FFP2 mask.
Applsci 15 12513 g001
Figure 2. The adopted method of measuring humidity in the space between the face and the mask: 1—mask, 2—humidity measuring probe, 3—Testo data logger.
Applsci 15 12513 g002
Figure 3. Average values of temperature and relative humidity on the psychrometric chart with the marked comfort area for clothing level equal to 0.65 clo and metabolic rate 1.40 met based on ASHRAE implemented in the application [40].
Applsci 15 12513 g003
Figure 4. Box plots for absolute humidity. The crosses in the figures indicate average values.
Applsci 15 12513 g004
Figure 5. Dependence of absolute humidity inside the mask on absolute humidity outside.
Applsci 15 12513 g005
Figure 6. Absolute humidity in the mask space as a function of time—comparison with the model for selected measurement series.
Applsci 15 12513 g006
Figure 7. Absolute humidity over a year in the room where the masks were tested.
Applsci 15 12513 g007
Figure 8. The effect of removing the mask from the face on the absolute humidity after one hour of using mask 4.
Applsci 15 12513 g008
Figure 9. Comparison of the results from the model (5) with the data from the experiment for an exemplary measurement series.
Applsci 15 12513 g009
Table 1. Average values of temperature, relative humidity, absolute humidity for one hour of use of masks.
Mask NumberTmTm_minTm_maxσTm
-°C°C°C°C
Mask 131.730.133.71.3
Mask 232.229.334.12.1
Mask 330.527.133.93.7
Mask 432.729.233.81.4
Mask 532.630.534.11.5
Mask Numberϕmϕm_minϕm_maxσϕm
-%%%%
Mask 182.576.092.95.8
Mask 287.179.092.95.7
Mask 383.581.987.12.4
Mask 485.578.793.74.1
Mask 580.875.386.45.2
Mask Numberωmωm_minωm_maxσωm
-g/m3g/m3g/m3g/m3
Mask 127.524.032.53.4
Mask 229.824.133.43.6
Mask 325.721.830.74.8
Mask 429.924.934.83.0
Mask 528.226.331.02.1
Table 2. Average values of temperature, relative humidity and absolute humidity for one-hour use of masks for selected measurement series.
Number of Measurement SeriesPersonMaskMonthAverage Ambient TemperatureAverage Ambient Relative HumidityAverage Ambient Absolute HumidityAverage Temperature in the Mask SpaceAverage Relative Humidity in the Mask SpaceAverage Absolute Humidity in the Mask Space
Tmϕmωm
----°C%g/m3°C%g/m3
S1B1September22.052.010.133.290.932.5
S2D1April20.341.57.330.682.326.7
S3D2April19.550.98.529.790.527.3
S4C2September22.663.512.833.399.136.1
S5B3September22.045.08.733.781.631.2
S6D3March18.735.05.627.282.121.7
S7C4November24.537.08.333.793.034.6
S8B4September20.452.09.231.685.528.3
S9A5April21.035.66.532.477.026.8
S10D5April20.345.07.930.483.426.0
S11B1December19.837.06.330.975.824.4
Table 3. Values of human-generated moisture, determined from the formula according to publication [48] for representative measurement series 1–11.
Number of Measurement SeriesS1S2S3S4S5S6S7S8S9S10S11
Human-generated moisture Qg [g/h]32.728.426.334.232.724.238.428.630.228.427.1
Disclaimer/Publisher’s Note: The statements, opinions and data contained in all publications are solely those of the individual author(s) and contributor(s) and not of MDPI and/or the editor(s). MDPI and/or the editor(s) disclaim responsibility for any injury to people or property resulting from any ideas, methods, instructions or products referred to in the content.