Article

Performance Analysis of Data-Driven and Deterministic Latency Models in Dynamic Packet-Switched Xhaul Networks

by
Mirosław Klinkowski
* and
Dariusz Więcek
National Institute of Telecommunications, Szachowa 1, 04-894 Warsaw, Poland
*
Author to whom correspondence should be addressed.
Appl. Sci. 2025, 15(23), 12487; https://doi.org/10.3390/app152312487
Submission received: 22 October 2025 / Revised: 14 November 2025 / Accepted: 20 November 2025 / Published: 25 November 2025

Abstract

Accurate prediction of maximum flow latency is crucial for ensuring the efficient transport of latency-sensitive fronthaul traffic in packet-switched Xhaul networks while maintaining the reliable operation of 5G and beyond Radio Access Networks (RANs). Deterministic worst-case (WC) models provide strict latency guarantees but tend to overestimate actual delays, resulting in resource over-provisioning and inefficient network utilization. To address this limitation, this study evaluates a data-driven Quantile Regression (QR) model for latency prediction in Time-Sensitive Networking (TSN)-enabled packet-switched Xhaul networks operating under dynamic traffic conditions. The proposed QR model estimates high-percentile (tail) latency values by leveraging both deterministic and queuing-related data features. Its performance is quantitatively compared with the WC estimator across diverse network topologies and traffic load scenarios. The results demonstrate that the QR model achieves significantly higher prediction accuracy—particularly for midhaul flows—while still maintaining compliance with latency constraints. Furthermore, when applied to dynamic Xhaul network operation, QR-based latency predictions enable a reduction in active processing-node utilization compared with WC-based estimations. These findings confirm that data-driven models can effectively complement deterministic methods in supporting latency-aware optimization and adaptive operation of 5G/6G Xhaul networks.

1. Introduction

The evolution toward the fifth- and sixth-generation (5G/6G) mobile networks, increasingly based on centralized (C-RAN) and virtualized (vRAN) radio access architectures, brings unprecedented performance demands to the underlying transport layer, commonly referred to as the fronthaul (FH) or converged Xhaul [1,2]. A major challenge in these new mobile networks is the support of ultra-reliable low-latency communications (URLLC), where the overall end-to-end delay must be kept within the order of a millisecond—or even less—while maintaining reliability levels approaching 99.999 % [3]. Within the transport segment, stringent constraints apply in particular to high-priority FH user-plane traffic, for which standardized profiles typically assume a maximum one-way latency budget targeted at or below 100 μs [4,5]. Under these conditions, the ability to accurately predict network latency becomes essential for ensuring the expected Quality of Service (QoS) levels. Reliable latency prediction under time-varying traffic loads enables intelligent routing, adaptive resource allocation across network slices, and effective admission control, thereby ensuring Service Level Agreement (SLA) compliance and stable network performance [6,7,8,9,10].
Ethernet-based, packet-switched Xhaul networks have emerged as a cost-effective and scalable solution for transporting heterogeneous radio data flows between distributed radio and processing elements in 5G/6G RANs [4,11,12,13]. However, their operation is inherently affected by non-deterministic delays resulting from packet buffering and contention in Ethernet switches (bridges), which make it challenging to provide the strict delay guarantees required by latency-sensitive FH traffic. To meet these demands, packet-switched Ethernet Xhaul networks have been enhanced with Time-Sensitive Networking (TSN) mechanisms, standardized for fronthaul applications in IEEE 802.1CM [11]. The TSN suite of IEEE standards specifies traffic classes, scheduling profiles, and mechanisms such as time-aware shaping and frame preemption that enable deterministic, bounded transmission delays [14,15]. While TSN significantly improves delay determinism, its guarantees can degrade under high and bursty FH loads, where contention among high-priority flows still leads to excessive buffering and increased queuing delays [16,17]. Consequently, maintaining predictable latency requires not only TSN mechanisms but also accurate latency models that capture the buffering behavior of packet flows and enable real-time prediction and control of delay during dynamic network operation.
Traditional queuing-theory models are primarily intended to estimate average delays [18]. Although these models can be extended to approximate high-percentile delay values [17,19], such formulations remain approximations that, while useful for FH link dimensioning [17], cannot ensure the strict maximum latency guarantees required in 5G RANs. To achieve strict delay compliance, deterministic worst-case (WC) latency models, often derived using Network Calculus [20] or related analytical frameworks [11,21], are typically employed to establish upper bounds that flow latencies cannot exceed. However, the main drawback of WC estimates lies in their pessimistic nature, as they remain accurate under low traffic conditions but become increasingly conservative as congestion builds up in multi-hop networks [20]. This conservatism leads to resource over-provisioning and, consequently, inefficient utilization of network capacity [22].
To overcome the limitations of conservative WC modeling and enable more efficient resource utilization, data-driven modeling approaches have gained increasing attention. Machine Learning (ML) and Deep Learning (DL) methods are now increasingly applied to capture network performance dynamics, often framing latency estimation as a time-series prediction [7,8] or as a regression problem [9,22]. However, data-driven techniques have rarely been applied to predict maximum flow latencies in packet-switched Xhaul networks, with only a few studies addressing this topic. Among these, ref. [22] focuses on TSN-based Ethernet Xhaul networks, employing a linear regression (LR) model to predict maximum flow latencies and thereby refine the estimates produced by a deterministic WC model. In contrast, the authors of [19] investigate a different transport technology—namely, time-slotted FlexE—which follows a circuit-style transmission paradigm rather than packet switching. Consequently, the applicability of data-driven latency prediction methods to TSN-enabled packet-switched Xhaul networks, as defined in the IEEE 1914.1 standard [4] and referenced in Open RAN (O-RAN) specifications [12], remains largely unexplored.
In this study, we evaluate the effectiveness of a regression-based approach for predicting maximum flow latencies in TSN-enabled packet-switched Xhaul networks. The analysis focuses on the Xhaul network operating under dynamic conditions, as expected in 5G/6G environments, where both traffic loads and flow configurations may change over time. Specifically, we employ a Quantile Regression (QR) model [23], which is well suited for this task as it estimates high-percentile delay values and thus effectively captures the tail behavior of latency distributions under variable traffic conditions. The model is trained using a comprehensive data set generated for multiple Xhaul topologies and diverse traffic load scenarios, ensuring broad representativeness of network states. Its performance is then evaluated in a dynamic network environment, where both traffic configurations and load levels vary over time. The predictive accuracy and robustness of the QR model are compared against the deterministic WC estimator, providing quantitative insights into the potential of data-driven methods to complement analytical latency modeling in future 5G/6G transport networks.
The main contributions of this study are summarized as follows:
  • A regression-based approach is proposed to predict maximum flow latencies in dynamic TSN-enabled packet-switched Xhaul networks.
  • The performance of the proposed QR predictor is evaluated and compared with deterministic WC latency estimations in a dynamic Xhaul scenario characterized by varying traffic loads and changing Xhaul flow configurations.
  • The accuracy and applicability of the QR model, trained on a comprehensive data set generated under diverse network configurations and load conditions, are validated across a wide range of evaluation scenarios.
  • The impact of data-driven latency prediction on overall network performance is analyzed, demonstrating its potential to enhance deterministic latency modeling in dynamic Xhaul operation.
The novelty of this work lies in the quantitative comparison of a data-driven QR model against a deterministic WC model for latency prediction of traffic flows in complex Xhaul topologies (mesh and ring). We demonstrate that the improved accuracy of the QR model yields measurable, multi-percent gains in resource efficiency during network operation, thereby providing a practical, data-driven solution to mitigate the over-provisioning inherent in conservative WC estimations.
The remainder of this paper is organized as follows. Section 2 reviews the related literature. Section 3 introduces the main assumptions of the considered network and traffic models. Section 4 presents the deterministic WC and data-driven QR latency models analyzed in this study. Section 5 outlines the data generation workflow for ML analysis, including the details of the network scenarios and evaluation tools. Section 6 describes the dynamic packet-switched Xhaul network scenario used for model evaluation. Section 7 reports the results of simulation experiments, while Section 8 provides their interpretation and discussion. Finally, Section 9 concludes the paper and summarizes the main findings.

2. Related Works

Latency management in TSN-based packet-switched networks focuses on mitigating the non-deterministic delays caused by packet buffering and contention in Ethernet bridges (switches). Solutions defined within the IEEE TSN family of standards, including IEEE 802.1CM, dedicated to fronthaul networks [11], as well as IEEE 802.1Qbv scheduled traffic [14] and IEEE 802.1Qbu frame preemption [15], aim to provide the deterministic transmission guarantees required by latency-sensitive services. In particular, IEEE 802.1CM explicitly defines the individual latency components, including queuing delays, and specifies a reference latency model for the calculation of worst-case delay in TSN-enabled packet-switched fronthaul networks [11].
Early research efforts concentrated on implementing and evaluating standards-based fronthaul solutions such as Common Public Radio Interface over Ethernet (CoE) and enhanced CPRI (eCPRI), in conjunction with TSN mechanisms defined in IEEE 802.1CM [16]. Several studies investigated whether TSN techniques, including IEEE 802.1Qbv scheduled traffic and IEEE 802.1Qbu frame preemption, are capable of satisfying the stringent delay and jitter requirements imposed on fronthaul traffic [24]. Additionally, advanced scheduling algorithms aimed at jitter minimization, such as exhaustive-search or the proposed Comb-Fitting scheduling methods, were introduced to maintain packet delay variation within the required strict limits [16].
Deterministic analytical approaches, particularly those based on Network Calculus (NC) [20], have been extensively applied to estimate worst-case upper bounds on end-to-end latency [21,25]. NC is widely used for worst-case delay analysis in TSN networks, especially for time-triggered or other latency-critical traffic classes [26]. While NC provides formal bounds, these bounds often overestimate actual latencies, potentially leading to the over-dimensioning of network resources [22].
Queuing theory models [18] are widely employed to analyze latencies in packet-switched networks. Classical models such as M/M/1 and G/G/1 are, however, primarily intended for estimating mean delays and thus insufficient to guarantee the strict maximum latency requirements imposed by 5G/6G systems [19,27]. Nevertheless, several extensions and more sophisticated models have proven effective. For instance, the N*D/D/1 model has been successfully applied to estimate extreme queuing delay percentiles-such as the 99.9999999 th percentile corresponding to a Frame Loss Ratio (FLR) target of 10 7 -for aggregated eCPRI high-priority FH flows in 5G New Radio (NR) networks [17]. This approach enables maximizing link lengths while maintaining compliance with IEEE 802.1CM latency constraints. Furthermore, a queuing-based model combining a Quasi-Birth-Death (QBD) process for centralized unit (CU) and distributed unit (DU) nodes with Open Jackson Network theory for the packet-switched fronthaul segment has been proposed to evaluate end-to-end delays under flexible functional split configurations [27]. In more general Deterministic Networking (DetNet) scenarios, the M/M/1 envelope model has been introduced as a simple yet effective methodology for obtaining tight upper bounds on delay percentiles, providing a practical tool for network planning and dimensioning [28].
To achieve higher accuracy than deterministic bounds and enable proactive network management, recent studies have increasingly adopted data-driven modeling approaches. ML and DL techniques are applied to predict network latency, typically formulated as time-series forecasting or regression problems, which are particularly relevant for URLLC scenarios [9]. Linear Regression (LR) has been employed to refine deterministic WC latency estimates by training on simulated data, thereby improving prediction accuracy and mitigating the risk of resource over-dimensioning [22]. More advanced Neural Network (NN) architectures—such as Feedforward Neural Networks (FNN), Convolutional Neural Networks (CNN), Recurrent Neural Networks (RNN), and Long Short-Term Memory (LSTM) models—have been explored to forecast network latency based on historical measurement data [29]. Graph Neural Network (GNN) models, including RouteNet and GraphSAGE, have also been applied to predict per-flow end-to-end delays by leveraging network topology, flow configuration, and dynamic indicators such as queue utilization [25]. A lightweight Multi-Layer Perceptron (MLP) model for accurate Round-Trip Time (RTT) prediction in 5G NSA edge networks was proposed in [30] and validated using real-world measurement data collected across diverse mobility scenarios. The authors of [8] introduced an adaptive contrastive learning framework that employs a dilated-convolution encoder and a hierarchical contrastive loss function to predict network latency in 5G URLLC scenarios, using real-world data collected along the entire communication path. Hybrid approaches that integrate analytical latency bounds from NC (e.g., Total Flow Analysis or Separate Flow Analysis) as input features for GNNs have been shown to further enhance the prediction of high-latency quantiles [25].
5G/6G networks built upon O-RAN architectures are expected to increasingly rely on Artificial Intelligence (AI) and ML for dynamic spectrum management, resource allocation, and real-time network control and optimization [31,32]. Within this context, several recent studies have applied AI/ML techniques to enhance latency management in next-generation RANs. In [33], the authors proposed an O-RAN-compliant mathematical framework for 6G networks supporting multiple URLLC services, incorporating a Stochastic Network Calculus (SNC)-based controller that allocates guaranteed radio resources and ensures that packet delay violation probabilities remain within prescribed service-level tolerances. In a related line of work, ref. [34] presented an AI-driven latency forecasting system, implemented and validated within a functional 5G O-RAN hardware prototype, which leverages a bidirectional LSTM model for real-time prediction of air-interface delay and link quality to support adaptive, latency-aware decision-making.
Despite increasing interest in data-driven latency modeling, only a few studies explicitly address the prediction of maximum one-way latencies in packet-switched Xhaul networks. In [19], a Deep-Q learning approach was proposed to forecast input traffic patterns and optimize resource allocation, using the 99.9th percentile delay along Xhaul paths as a strict performance constraint. However, that study focused on a time-slotted FlexE-based Xhaul network, which follows a circuit-style transmission paradigm and thus differs from the non-deterministic packet-switching behavior defined in IEEE 802.1CM TSN networks. In contrast, ref. [22] examined a TSN-based Ethernet Xhaul network and introduced an LR model to refine deterministic WC latency estimates. While the LR approach improved average prediction accuracy, it inherently estimates conditional means rather than high-percentile values, and therefore requires additional engineering to capture tail latency behavior, limiting its applicability in practice.
To the best of our knowledge, no prior work has investigated a regression-based approach employing a QR model specifically designed to predict high-percentile latencies in dynamic TSN-enabled packet-switched Xhaul networks, where both traffic loads and flow configurations vary over time.

3. Network Model

The study considers a packet-switched Xhaul network that interconnects the functional components of a RAN [4]. The assumptions regarding the network, traffic, and latency models follow those adopted in our previous works [10,35,36]. The architecture consists of three main entities: (i) radio units (RUs) located at antenna sites, (ii) distributed units (DUs) that perform part of the baseband processing and can be virtualized at processing-pool (PP) nodes, and (iii) centralized units (CUs) positioned at a hub node to complete the radio processing chain. The RUs, PPs, and the hub are interconnected through an Ethernet-based transport infrastructure that multiplexes and routes data flows among these entities [11].
The considered network supports two categories of traffic. Fronthaul (FH) flows connect the RUs with their assigned PP nodes hosting DUs, whereas midhaul (MH) flows connect PPs with the hub node performing CU functions. Communication occurs in both directions: uplink (UL, RU → PP → hub) and downlink (DL, hub → PP → RU), resulting in four flow types: FH-UL, FH-DL, MH-UL, and MH-DL. Each flow type is characterized by distinct bit-rate and latency requirements. The RUs attached to a common access switch are assumed to form a cluster that may require joint DU processing for multi-cell coordination. Consequently, all FH flows originating from the same cluster are routed to a common DU node.
All flows are transmitted as periodic bursts of Ethernet frames that encapsulate radio data [17,37]. Bursts are forwarded end-to-end without fragmentation, following a store-and-forward policy at each switch. Traffic scheduling follows a strict-priority discipline [11], where FH bursts have higher priority than MH bursts, and bursts of the same priority are served in the first-in–first-out (FIFO) order. Each burst consists of a fixed number of Ethernet frames, and the time interval between consecutive bursts, referred to as the transmission window, depends on the applied 5G numerology [38]. For numerology index μ [ 0 , 4 ] , the subcarrier spacing equals 15 × 2 μ  kHz, resulting in a transmission window of 66 . 6 ¯ × 2 μ  μs [17,38]. Each network instance defined in Section 5 and evaluated in Section 7 assumes a fixed numerology to examine its impact on latency modeling and overall network performance.
Figure 1 shows an example of FH and MH packet burst transmission and buffering in both UL and DL directions of the packet-switched Xhaul network. The figure illustrates the periodic generation of bursts, their traversal through consecutive switching nodes, and the operation of TSN mechanisms that apply strict-priority burst scheduling.
Although the network illustrated in Figure 1 ensures that latency-sensitive FH traffic is prioritized over MH traffic, contention among bursts of the same priority may still lead to considerable queuing delays. Because reliable RAN operation requires that the one-way latencies of FH and MH flows remain within predefined limits [4,5], predicting maximum burst delays accurately becomes critical for ensuring service-level compliance. This study therefore investigates the Xhaul transport network under these latency constraints, using analytical and data-driven latency models described in the next section.

4. Latency Models

The Xhaul transport network must ensure that the one-way latency experienced by any packet flow remains within predefined limits [4,5]. In the considered packet-switched Xhaul network scenario, this requirement implies that the delay of any burst belonging to a flow cannot exceed a specified maximum value. In this section, we present two latency models used to estimate or predict these delays: a deterministic worst-case (WC) estimator and a data-driven quantile regression (QR) predictor.

4.1. Worst-Case Model

The considered worst-case latency model was introduced in [11] for estimating packet delays in TSN packet-switched fronthaul networks, where flows of different priorities coexist. It accounts for static delays caused by signal propagation in links ( L f P ), packet store-and-forward operations in switches ( L f SF ), and transmission times of packet bursts over links ( L f T ), as well as for buffering delays that occur at switch output ports ( L f B ). For a given flow f, the total latency is expressed as
L f WC = L f P + L f SF + L f T + L f B ,
where the first three components represent static delays, and the last term corresponds to buffering delays accumulated along the path.
The WC model assumes worst-case buffering delays. In particular, L f B is estimated as an upper bound on the queuing latency of bursts served under the strict-priority scheduling algorithm (adopted in this study), derived using the principles of network calculus theory, as discussed in [21]. These buffering delays arise from two sources:
  • bursts belonging to other flows of equal or higher priority that may be transmitted before the burst of the considered flow, and
  • the largest burst of a lower-priority flow that may already be in transmission and is not preempted.
For a flow f routed through buffered links e along path p, the buffering latency L f B is calculated as
L f B = e p q H ( f , e ) L ( q , e ) + max q L ( f , e ) L ( q , e ) ,
where H ( f , e ) denotes the set of flows with equal or higher priority than f that share link e, L ( f , e ) represents the set of lower-priority flows interfering with f, and L ( q , e ) is the latency contribution of an interfering flow q on link e, corresponding to the transmission delay of the burst of flow q in that link. The first term in (2) aggregates the delays caused by all higher- or equal-priority flows, while the second term accounts for the largest delay that can be introduced by a lower-priority flow already in transmission.

4.2. Quantile Regression Model

The quantile regression model provides a data-driven alternative to deterministic latency estimation by learning the conditional distribution of flow latency from observed data. Unlike ordinary least-squares regression, which estimates the conditional mean of a dependent variable, QR predicts a specific quantile (e.g., 0.95 or 0.99) of the latency distribution, thereby capturing high-percentile delay behavior. This capability makes QR particularly suitable for packet-switched Xhaul networks, which must comply with strict one-way latency limits and where queuing effects produce long-tailed latency distributions that are not well characterized by mean-based models. The concept of quantile regression was first introduced in [39] and has since been widely adopted in predictive modeling, including recent applications to delay forecasting in packet networks [40].
From a theoretical viewpoint, QR extends classical linear regression by replacing the mean-squared loss with an asymmetric quantile (pinball) loss, which penalizes underestimation more heavily for higher quantiles [23]. Given a flow f described by a vector of features x f = [ x f , 1 , x f , 2 , , x f , n ] , the QR-predicted latency is expressed as:
L f QR = β 0 + i = 1 n β i x f , i ,
where β 0 is the intercept and β i are regression coefficients. The coefficient values β i ( 0 i n ) are obtained by minimizing the quantile loss function
L Q ( y , y ^ ) = Q ( y y ^ ) , if y y ^ , ( 1 Q ) ( y ^ y ) , otherwise .
where Q is the desired quantile level ( 0 < Q < 1 ), and y and y ^ are the actual and predicted latency values, respectively. This asymmetric loss function enforces conservative predictions for high quantiles (e.g., Q 0.99 ), thereby reducing the risk of underestimating latency values.
In this study, the feature set combines descriptors that represent both static path properties and dynamic queuing interactions of packet flows. The complete feature set used for each flow f includes:
  • Routing path characteristics: hop count N f hops , the number of buffered links along the path N f buffers , and the static latency L f stat , representing the sum of propagation, store-and-forward, and transmission delays, i.e., L f stat = L f P + L f SF + L f T ;
  • Deterministic latency bound: the worst-case latency estimate L f WC , which serves as a baseline input linking the QR model to analytical latency bounds;
  • Queuing-related indicators:
    -
    L f EP , same —buffering contribution from equal-priority (EP) flows entering the same switch input port g. It captures the overlap between the reception delay of the burst of flow f ( L ( f , g ) ) and the transmission delay of a burst of another EP flow q at the switch output port e ( L ( q , e ) ). If L ( q , e ) L ( f , g ) , the burst of flow q is completely transmitted before the burst of flow f is fully received, and no buffering delay is introduced. Otherwise, a partial buffering delay occurs, which is reduced proportionally to the difference between the burst reception and transmission times.
    -
    L f EP , other —buffering contribution from EP flows arriving from other input ports. It accounts for the longest EP burst from each such port, and is calculated as the sum of their respective delay contributions.
    -
    L f HP , sum —aggregated buffering impact from higher-priority (HP) flows, calculated as the total delay induced by all such flows contending for transmission at the same output port.
This combination of deterministic and empirical features enables the QR model to learn both the structural characteristics of the routing path and the stochastic variability caused by packet contention.

5. Data Generation

This section describes the methodology used to generate the data sets used in the ML analysis and training of the QR latency prediction model. The data generation process integrates optimization-based flow allocation and packet-level network simulations to produce representative latency measurements under diverse Xhaul configurations. The following subsections outline the main network and system assumptions, the workflow for building the data sets for ring and mesh topologies, the underlying MILP optimization used to obtain feasible flow allocations, and the simulation framework used for latency measurements and feature extraction.

5.1. Main Assumptions

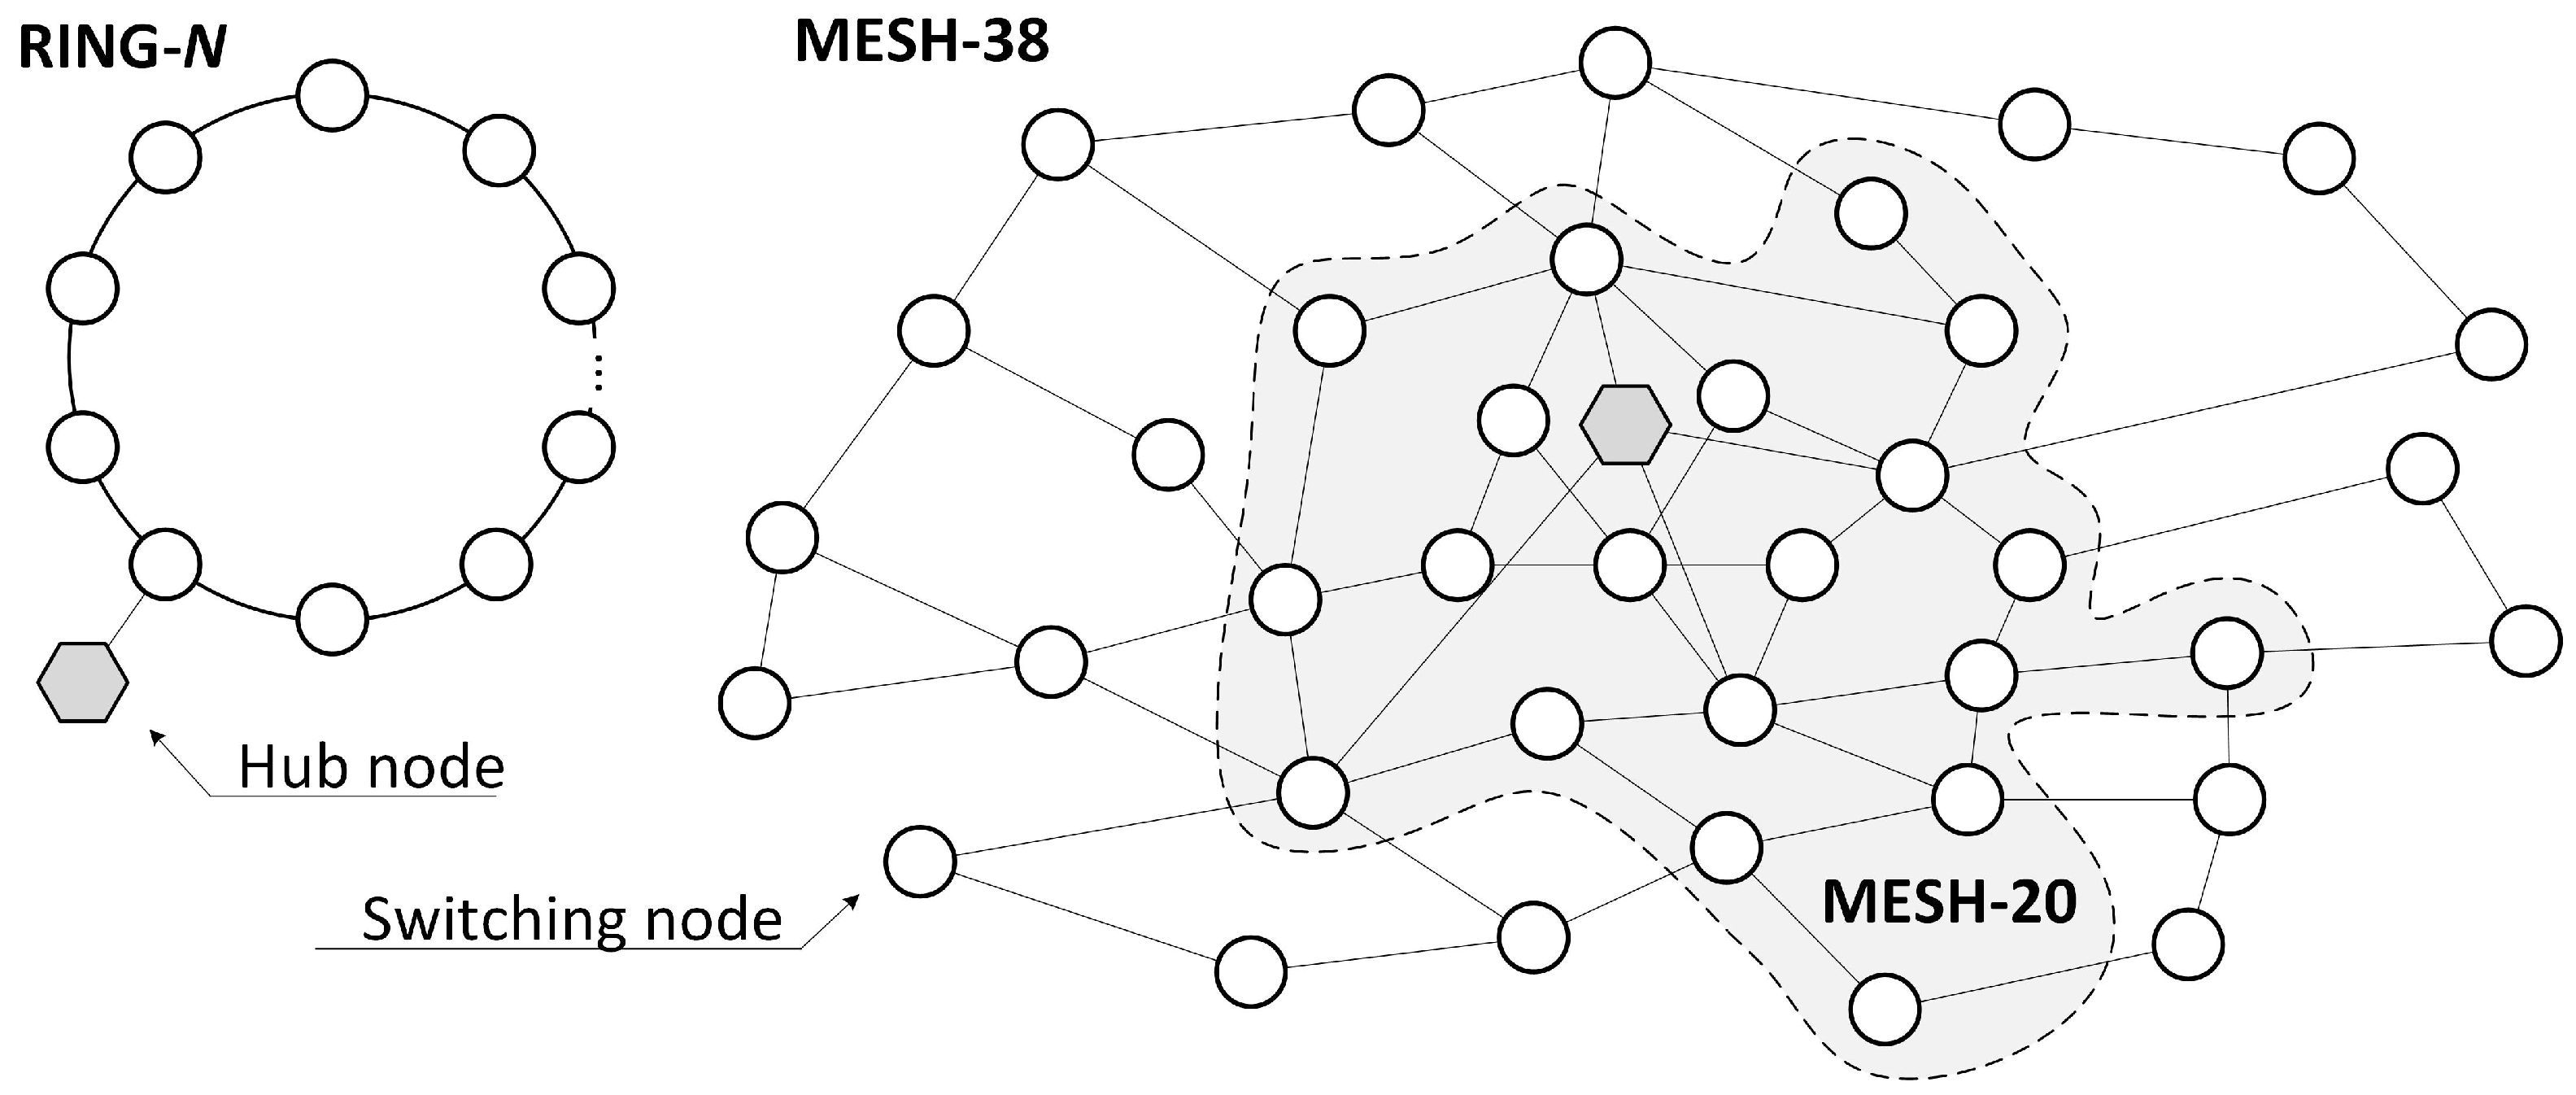
The study considers two representative Xhaul transport topologies: ring and mesh networks [10,41,42]. In the case of ring networks (RING-N), the number of switching nodes (N) ranges from 5 to 10, whereas for mesh (MESH-N), two larger networks are analyzed, with N { 20 , 38 } . The corresponding topologies are shown in Figure 2.
For each topology, network scenarios were generated with varying numbers of RUs (R), randomly attached to the switching nodes. In RING-N networks, we consider R { 10 , 20 , 30 } , while in MESH-N networks the range extends to R { 10 , 20 , 30 , 40 , 50 } . The parameters of the network links, including capacities and lengths, are shown in Table 1 [10], where the actual link lengths are randomly selected within given ranges. Propagation delays are derived assuming a transmission speed of 2 × 10 5  km/s, which reflects the typical velocity factor of optical fiber (≈0.67c). Each switch introduces a store-and-forward latency of 5 μs, corresponding to the forwarding delay value used for latency analysis in Annex B of the IEEE 802.1CM standard [11].
In the analysis, we assume a radio system configured with eight MIMO layers, 32 antenna ports, and 100 MHz channels [43]. The functional split adopts Option 7.2 for FH and Option 2 for MH [44]. The corresponding maximum radio data flow rates, derived from the model in [43], are 21.624 Gbps and 22.204 Gbps for FH uplink and downlink, and 3.024 Gbps and 4.016 Gbps for MH uplink and downlink, respectively. Two numerologies are considered, μ { 1 , 2 } . The Ethernet frame size is fixed at 1542 bytes, consistent with the assumptions adopted in [11]. The burst size for each flow follows directly from the radio bit-rate, the Ethernet frame size, the applied numerology, and the periodic traffic generation model proposed in [17] and described in detail in [35]. Flow routing is determined using the k-shortest path algorithm.

5.2. Data Generation Workflow

Two independent data sets were created for the ML analysis, one for the ring and the other for the mesh topology, using the network scenarios and system parameters defined in Section 5.1 within the procedure illustrated in Figure 3.
The data generation workflow in Figure 3 consists of the following two steps.
  • Step 1: Generating feasible flows —feasible FH and MH flows satisfying capacity and latency constraints were generated for each network scenario. For this purpose, a mixed-integer linear programming (MILP) optimization method, discussed in Section 5.3, was applied assuming maximum Xhaul flow bit-rates ( ρ = 1.0 ) and latency estimation based on the WC model.
  • Step 2: Generating data features—the goal of this step was to generate the data features, including the measurement of the actual latencies, for each individual data flow produced in Step 1. To this end, packet-level Xhaul network simulations were executed for each network scenario and data were gathered, as described in Section 5.4.
For the ring topology, a total of 7200 network scenarios were processed. Specifically, six networks with different numbers of switching nodes (N) were considered, each combined with three RU counts (R), according to the assumptions in Section 5.1. Every configuration was repeated ten times with random RU-to-switch assignments and evaluated under two radio numerologies ( μ ). For each flow, the one-way latency limit was set either as a random value between 50 µs and 150 µs in the case of FH, or as a fixed 1 ms for MH flows [4]. Traffic load levels ρ { 0.1 , 0.25 , 0.5 , 0.75 , 1.0 } were considered, where  ρ denotes the fraction of the maximum radio flow bit-rates (see Section 5.1) allocated to corresponding flow types (FH/MH in both uplink and downlink). To introduce variability, the bit rate of each flow was further perturbed by a random deviation bounded by δ { 0 , 0.1 , 0.2 , 0.5 } , while ensuring that the resulting load remained within 0.01 ρ 1.0 . Assuming on average 20 RUs per scenario and four flows per RU, the resulting ring data set contains 576,000 labeled flow samples.
The data set for the mesh topology was derived from 12,000 distinct scenarios. It comprises two networks with different numbers of switching nodes (N), each combined with five RU counts (R) as defined in Section 5.1. Every configuration was evaluated under ten random RU-to-switch assignments and two numerologies. For each case, three FH latency limits were applied: (a) a fixed 75 µs, (b) a fixed 100 µs, and (c) a randomly chosen value between 50 µs and 150 µs, independently assigned per flow. The same sets of ρ and δ as in the ring scenarios were considered. Assuming an average of 30 RUs per scenario and four flows per RU, the mesh data set comprises 1,440,000 labeled flow samples.
The generated data sets were used in the ML analysis to train and test the QR latency prediction model with the quantile parameter set to Q = 0.9999 . The model was implemented using the QuantileRegressor class from the scikit-learn Python library and trained separately for each data flow type (FH-UL, FH-DL, MH-UL, MH-DL), numerology, and network topology (ring or mesh). In the training process, the regularization coefficient was set to α = 0 , and the highs solver was used as the underlying optimization method. All remaining optimization settings followed their default values, and no additional parameter tuning was applied.
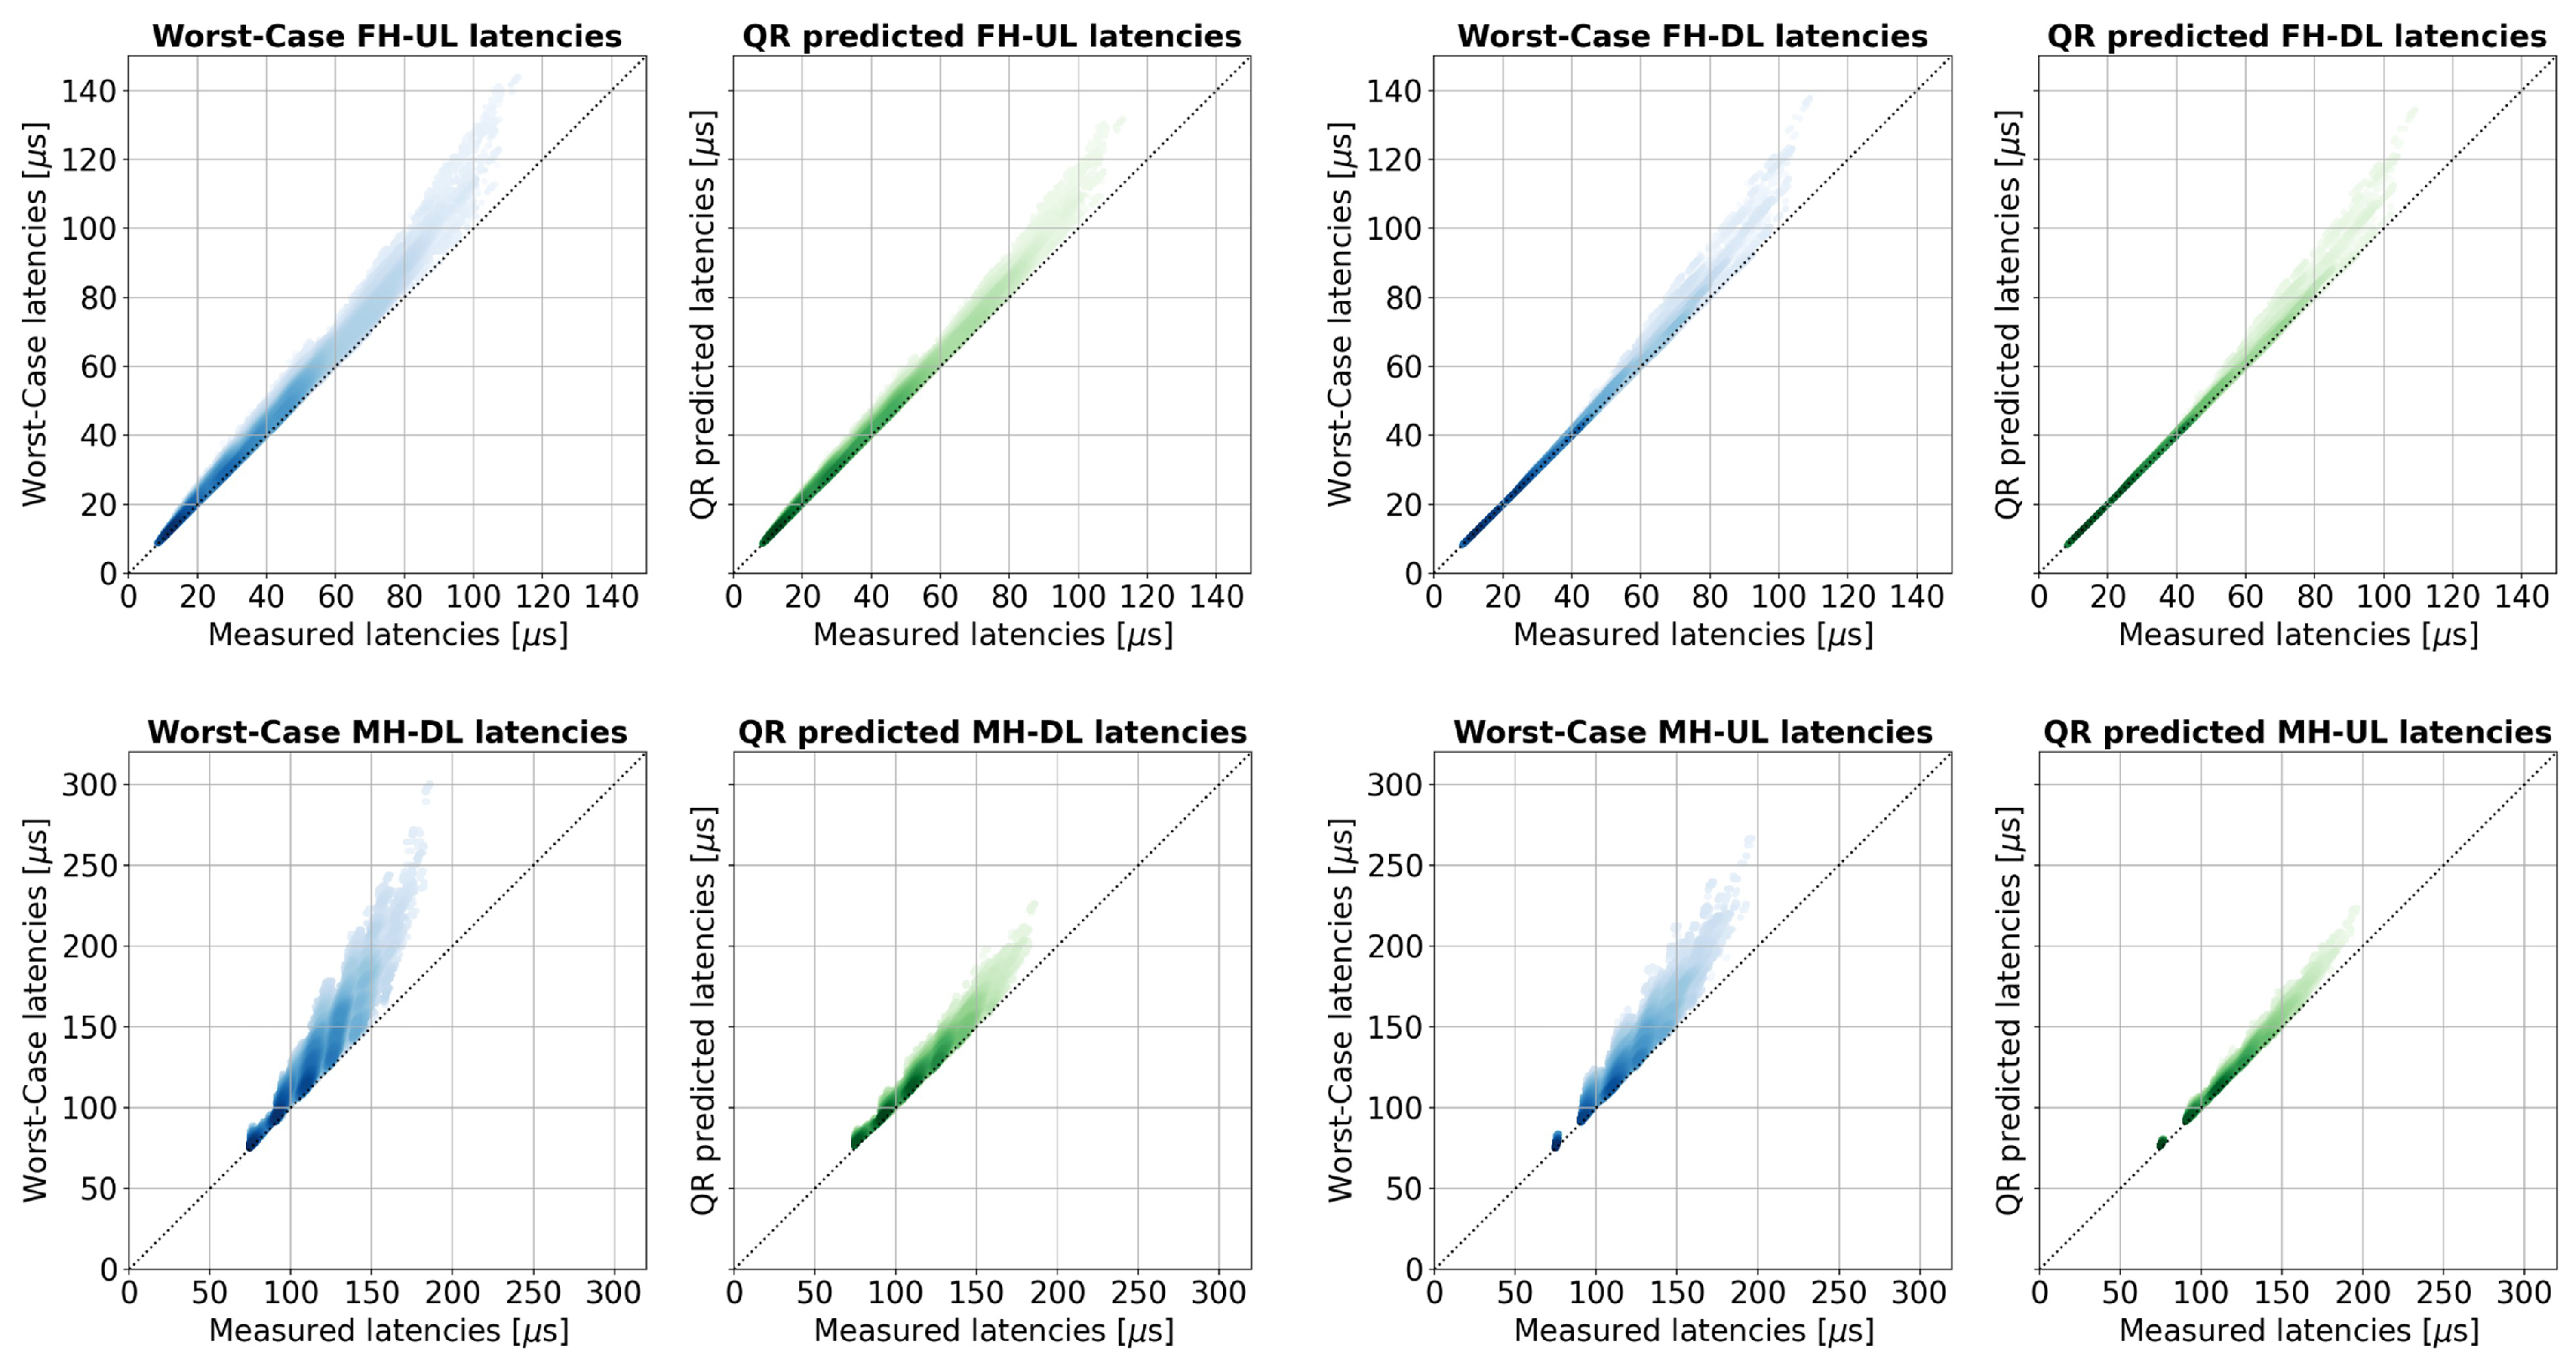
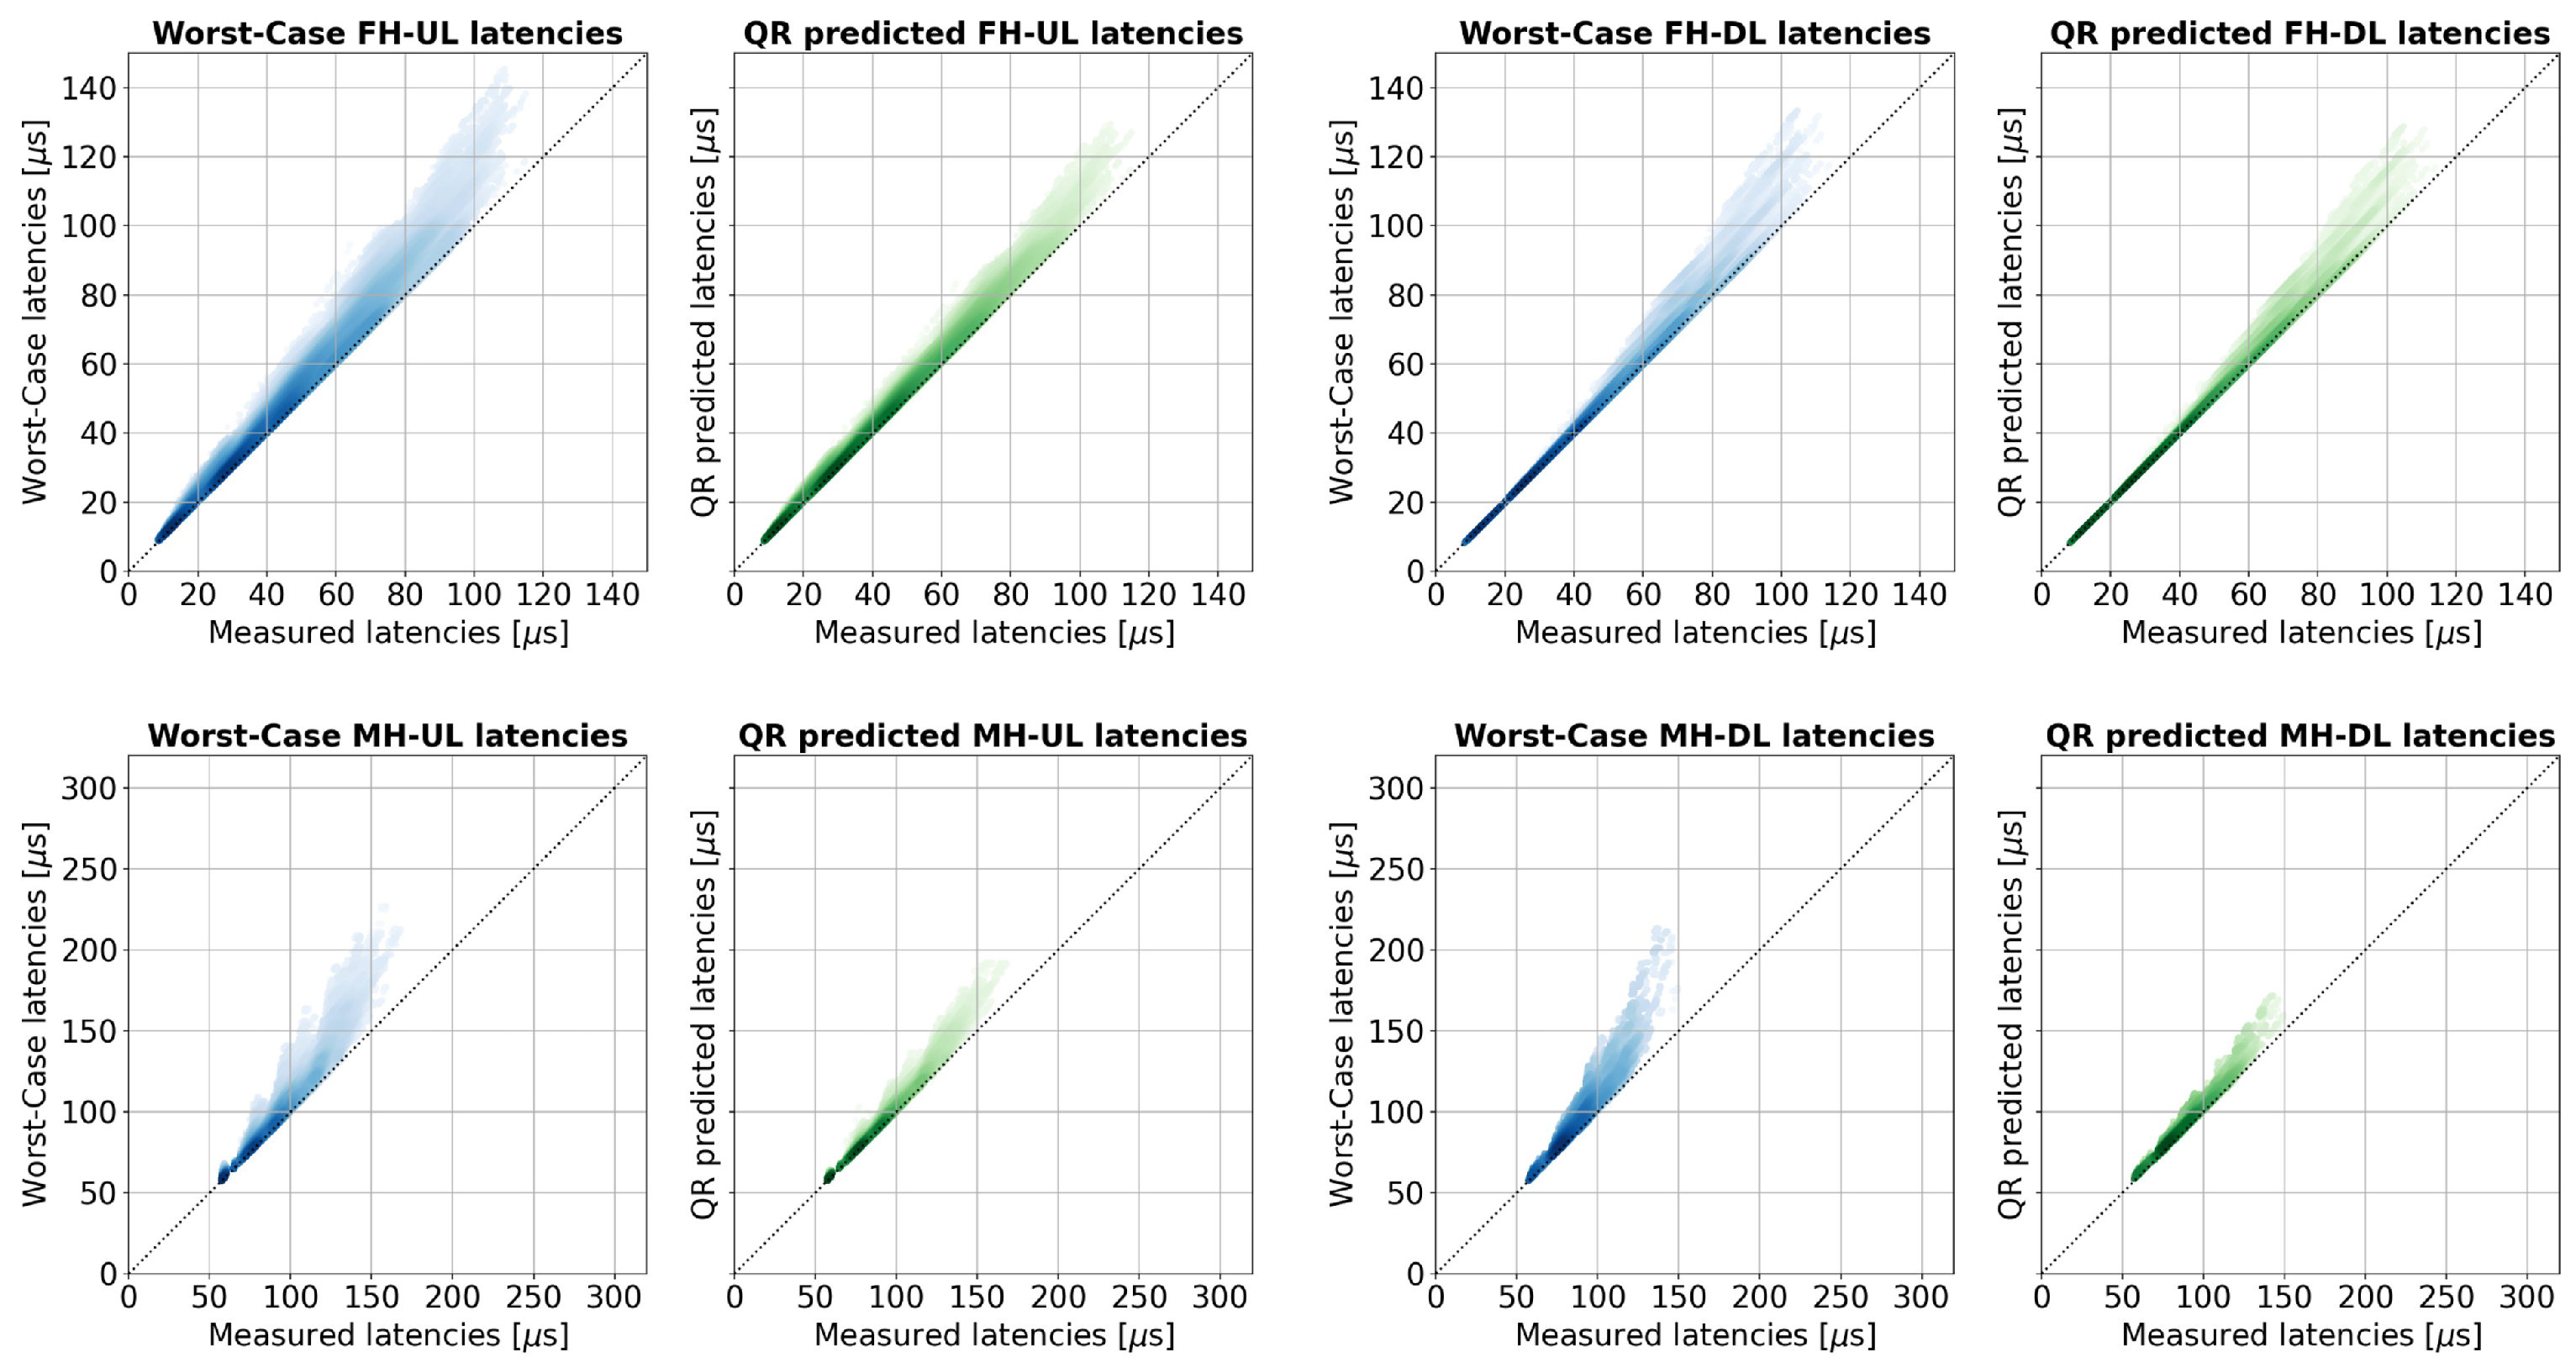
Figure 4 and Figure 5 illustrate the relationship between the measured maximum one-way flow latencies and the corresponding values estimated using the WC model (left) and predicted by the QR model (right). Dedicated plots for individual flow types and network topologies are presented, covering the complete RING-N and MESH-N data sets and both numerologies, μ { 1 , 2 } . Each point represents a pair of measured and modeled latency values, with color intensity reflecting sample density, where darker regions indicate areas of higher concentration. These plots show how closely the QR-based predictions align with the actual flow latencies compared to the more conservative WC estimates.
To quantitatively assess model performance, the coefficient of determination ( R 2 ) metric available in the Python scikit-learn library was used. The R 2 score ranges from to 1, with higher values indicating better model accuracy. Table 2 summarizes the R 2 results obtained for the evaluated models across different network scenarios—RING-N and MESH-N—and numerologies μ { 1 , 2 } . Results are reported separately for FH and MH flows in both uplink (UL) and downlink (DL) directions.
The results in Table 2 show that the WC model performs very well for FH flows, achieving R 2 values of 0.918–0.96 for FH-UL and up to about 0.98–0.991 for FH-DL. However, its accuracy declines noticeably for MH flows, leading to less reliable latency estimates for this flow type. In all cases, the QR model provides more accurate latency predictions than the WC model, with particularly large improvements observed for MH flows.

5.3. MILP Optimization

Feasible allocations of FH and MH flows, necessary for conducting the network simulations, were obtained using the MILP optimization model introduced in [35]. For clarity and brevity, only the main modeling assumptions are summarized below, while the full mathematical formulation can be found in [35].
The MILP models a problem of planning a packet-switched Xhaul network, jointly finding the placement of DUs at selected PP nodes and the routing of FH and MH flows between RUs, PPs, and the hub. The formulation includes constraints ensuring that each cluster of RUs is assigned to a common PP location, that the link utilization does not exceed available capacity, and that individual flow latencies remain within the imposed limits. The objective is to minimize the number of active PPs required to satisfy these constraints. The MILP problem is solved using the CPLEX v.12.9 optimizer [45].

5.4. Network Simulations

The transmission and routing of packet flows between Xhaul network elements were emulated using an event-driven simulator developed in the OMNeT++ v.5.6.1 environment [46]. For each network scenario, the simulations provided measurements of actual flow latencies and feature values associated with individual flows. The simulator emulates the operation of packet switches, including output-buffer queuing and prioritized handling of fronthaul packets. The main assumptions adopted in the simulator implementation are summarized below.
  • Packet bursts from each flow source are transmitted periodically within a transmission window defined by the 5G radio numerology, as detailed in Section 3, following the traffic model described in [17].
  • To introduce variability and avoid repetitive buffering patterns, the departure time of each burst (i.e., its offset relative to the start of the transmission window) is randomly modified every two transmission periods. Furthermore, the simulation enforces that all bursts complete their transmission within each two-window cycle, preventing temporal congestion caused by overlapping bursts from the same source.
  • A store-and-forward switching mechanism without cut-through is assumed, meaning that each burst is fully received at the input port before transmission begins at the output port.
  • Packet bursts are queued in a first-in–first-out (FIFO) manner and transmitted as complete units, without fragmentation or interleaving.
  • Switches operate according to the strict-priority algorithm [11], which ensures that high-priority (HP) latency-sensitive FH bursts are always served before lower-priority (LP) MH bursts.
  • Profile A of operation, as defined in [11], is applied, guaranteeing that an LP burst already being transmitted cannot be preempted by an HP burst.
  • The latency of a flow, defined as the maximum one-way delay, is taken as the largest delay value measured among all bursts of that flow transmitted during the entire simulation.
  • Each simulation assumes the transmission of 10 7 bursts, after which the simulation terminates.

6. Evaluation Scenario

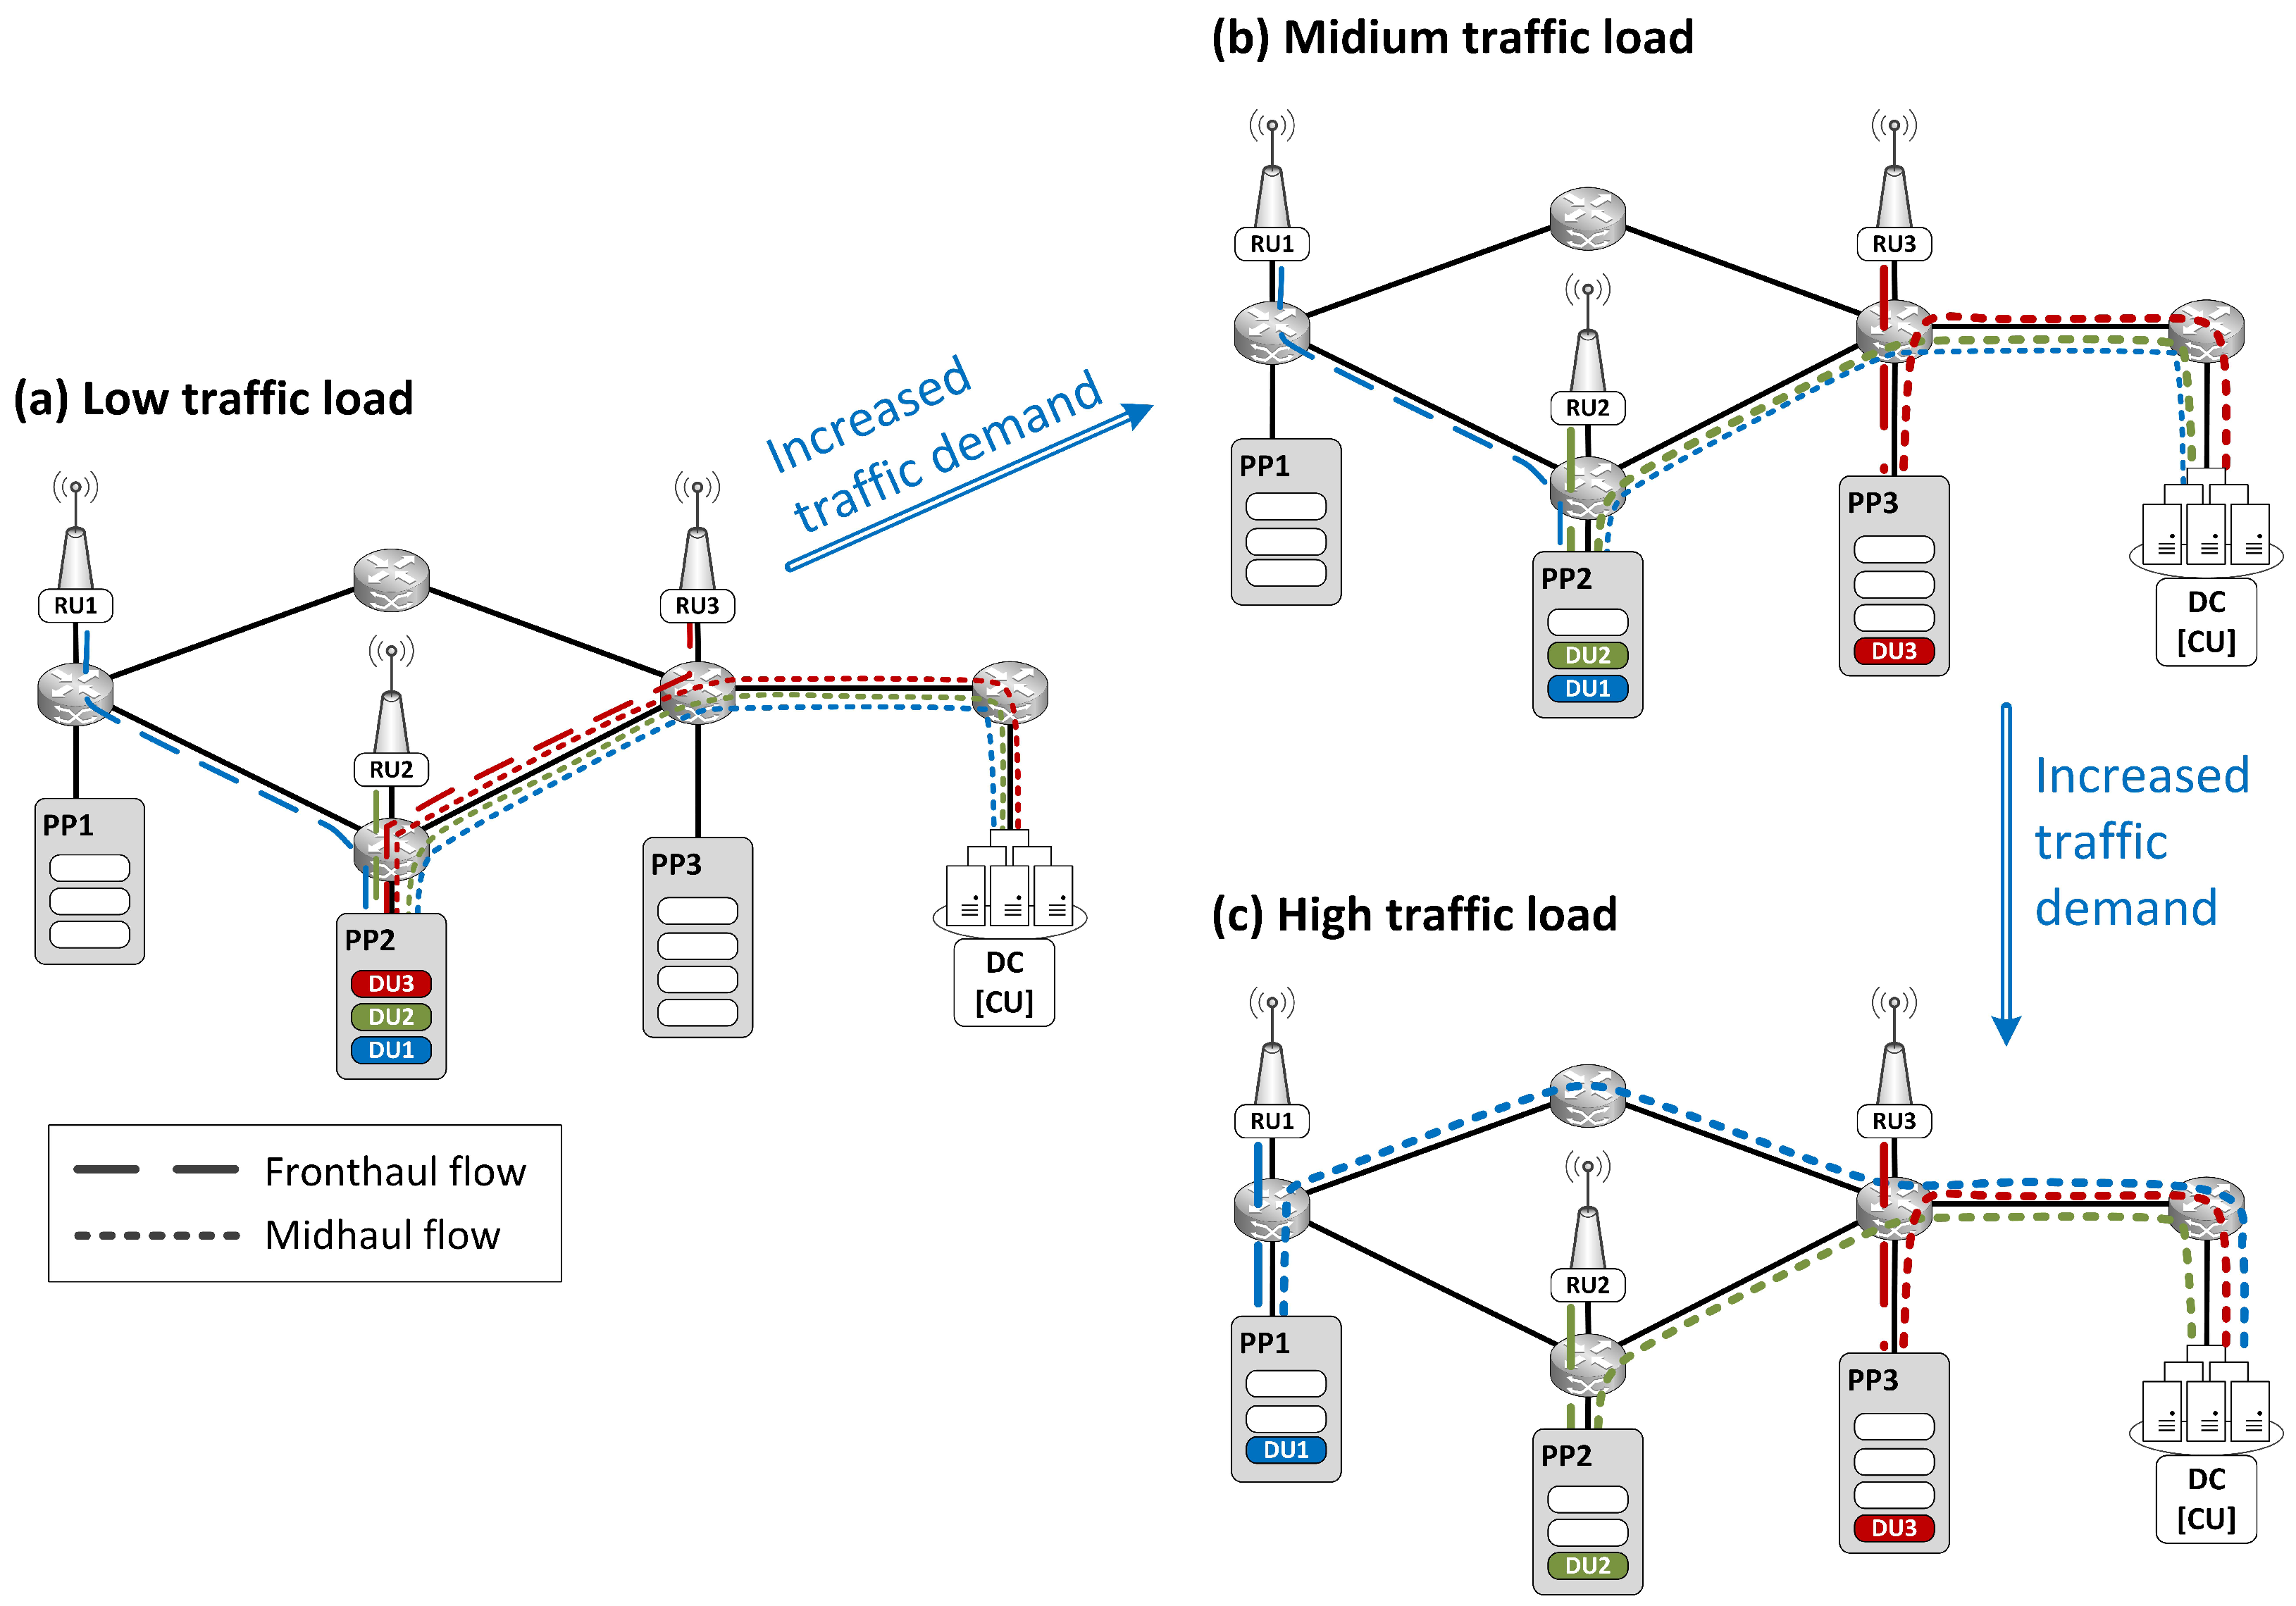
The latency models are evaluated in a dynamic network scenario illustrated in Figure 6.
The network evaluation scenario assumes a progressive increase in network traffic load—from low to high levels—accompanied by dynamic reallocation of DU units among PP nodes and the adaptation of FH and MH routing paths. At low load conditions (see Figure 6a), DU units are aggregated into a smaller number of active PPs, allowing the remaining PPs to enter a sleep mode and thereby improving energy efficiency [47]. As the traffic load ( ρ ) increases, and either link utilization approaches capacity limits or flow latencies become excessive, DUs are gradually reallocated to PPs located closer to their corresponding RUs to satisfy capacity and latency constraints (see Figure 6b,c).
The implemented DU reallocation mechanism consists of the following two stages.
  • Stage 1: Selection of PP nodes —In an offline preprocessing stage, a pair of PP nodes, denoted as PP min and PP max , is determined for each RU by solving the MILP optimization model described in Section 5.3 for two extreme network load conditions, namely the minimum ( ρ = 0.1 ) and maximum ( ρ = 1.0 ) traffic levels.
  • Stage 2: DU reallocation—During the network simulation, whenever a change in traffic load is detected, the system verifies whether the current DU allocation satisfies the transmission capacity and latency constraints of all flows. If these conditions are not met, an inactive PP max node hosting the largest number of DUs is activated, and the corresponding DUs are reallocated to this node. The reallocation is carried out only to the minimum extent required to restore feasibility, ensuring that the number of active PP nodes remains as small as possible throughout the simulation.
The network simulations start with the traffic load set to ρ = 0.1 , with all DUs initially allocated to their corresponding PP min nodes. At each simulation step, the traffic load is incremented by Δ ρ = 0.05 , and network reconfiguration is performed when required, following the procedure described above. The simulations continue until the traffic load reaches ρ = 1.0 .
The considered dynamic network scenario effectively reflects the adaptive nature of packet-switched Xhaul networks, which can reconfigure flow allocations in response to varying traffic conditions, making it well suited for evaluating latency models across a wide range of traffic loads. It is essential to note that the latency constraints verified during traffic-load variations in the network simulations are evaluated using one of the latency models introduced in Section 4, namely the WC or QR model, depending on the case under analysis. Simultaneously, the actual flow latencies are measured in the simulator and used as a reference to assess the accuracy of the employed model and to validate its reliability, as discussed in the next section.

7. Results

In this section, the QR and WC latency models are numerically evaluated in dynamic packet-switched Xhaul networks, using the evaluation scenario introduced in Section 6. We begin by validating the maximum FH latencies predicted by the QR model against the given latency limits, and by comparing them with WC estimations and simulation outcomes for ring and mesh topologies. Next, we assess the prediction accuracy of both models for FH and MF flows under different traffic loads, latency limits, and numerologies. Finally, we analyze the impact of latency prediction accuracy on network performance in terms of PP utilization, considering the number of RUs, traffic load, latency limits, and numerologies as evaluation parameters. These results provide an overview of how model choice influences latency estimation, SLA compliance, and resource efficiency in packet-switched Xhaul networks.

7.1. Validation of QR Model

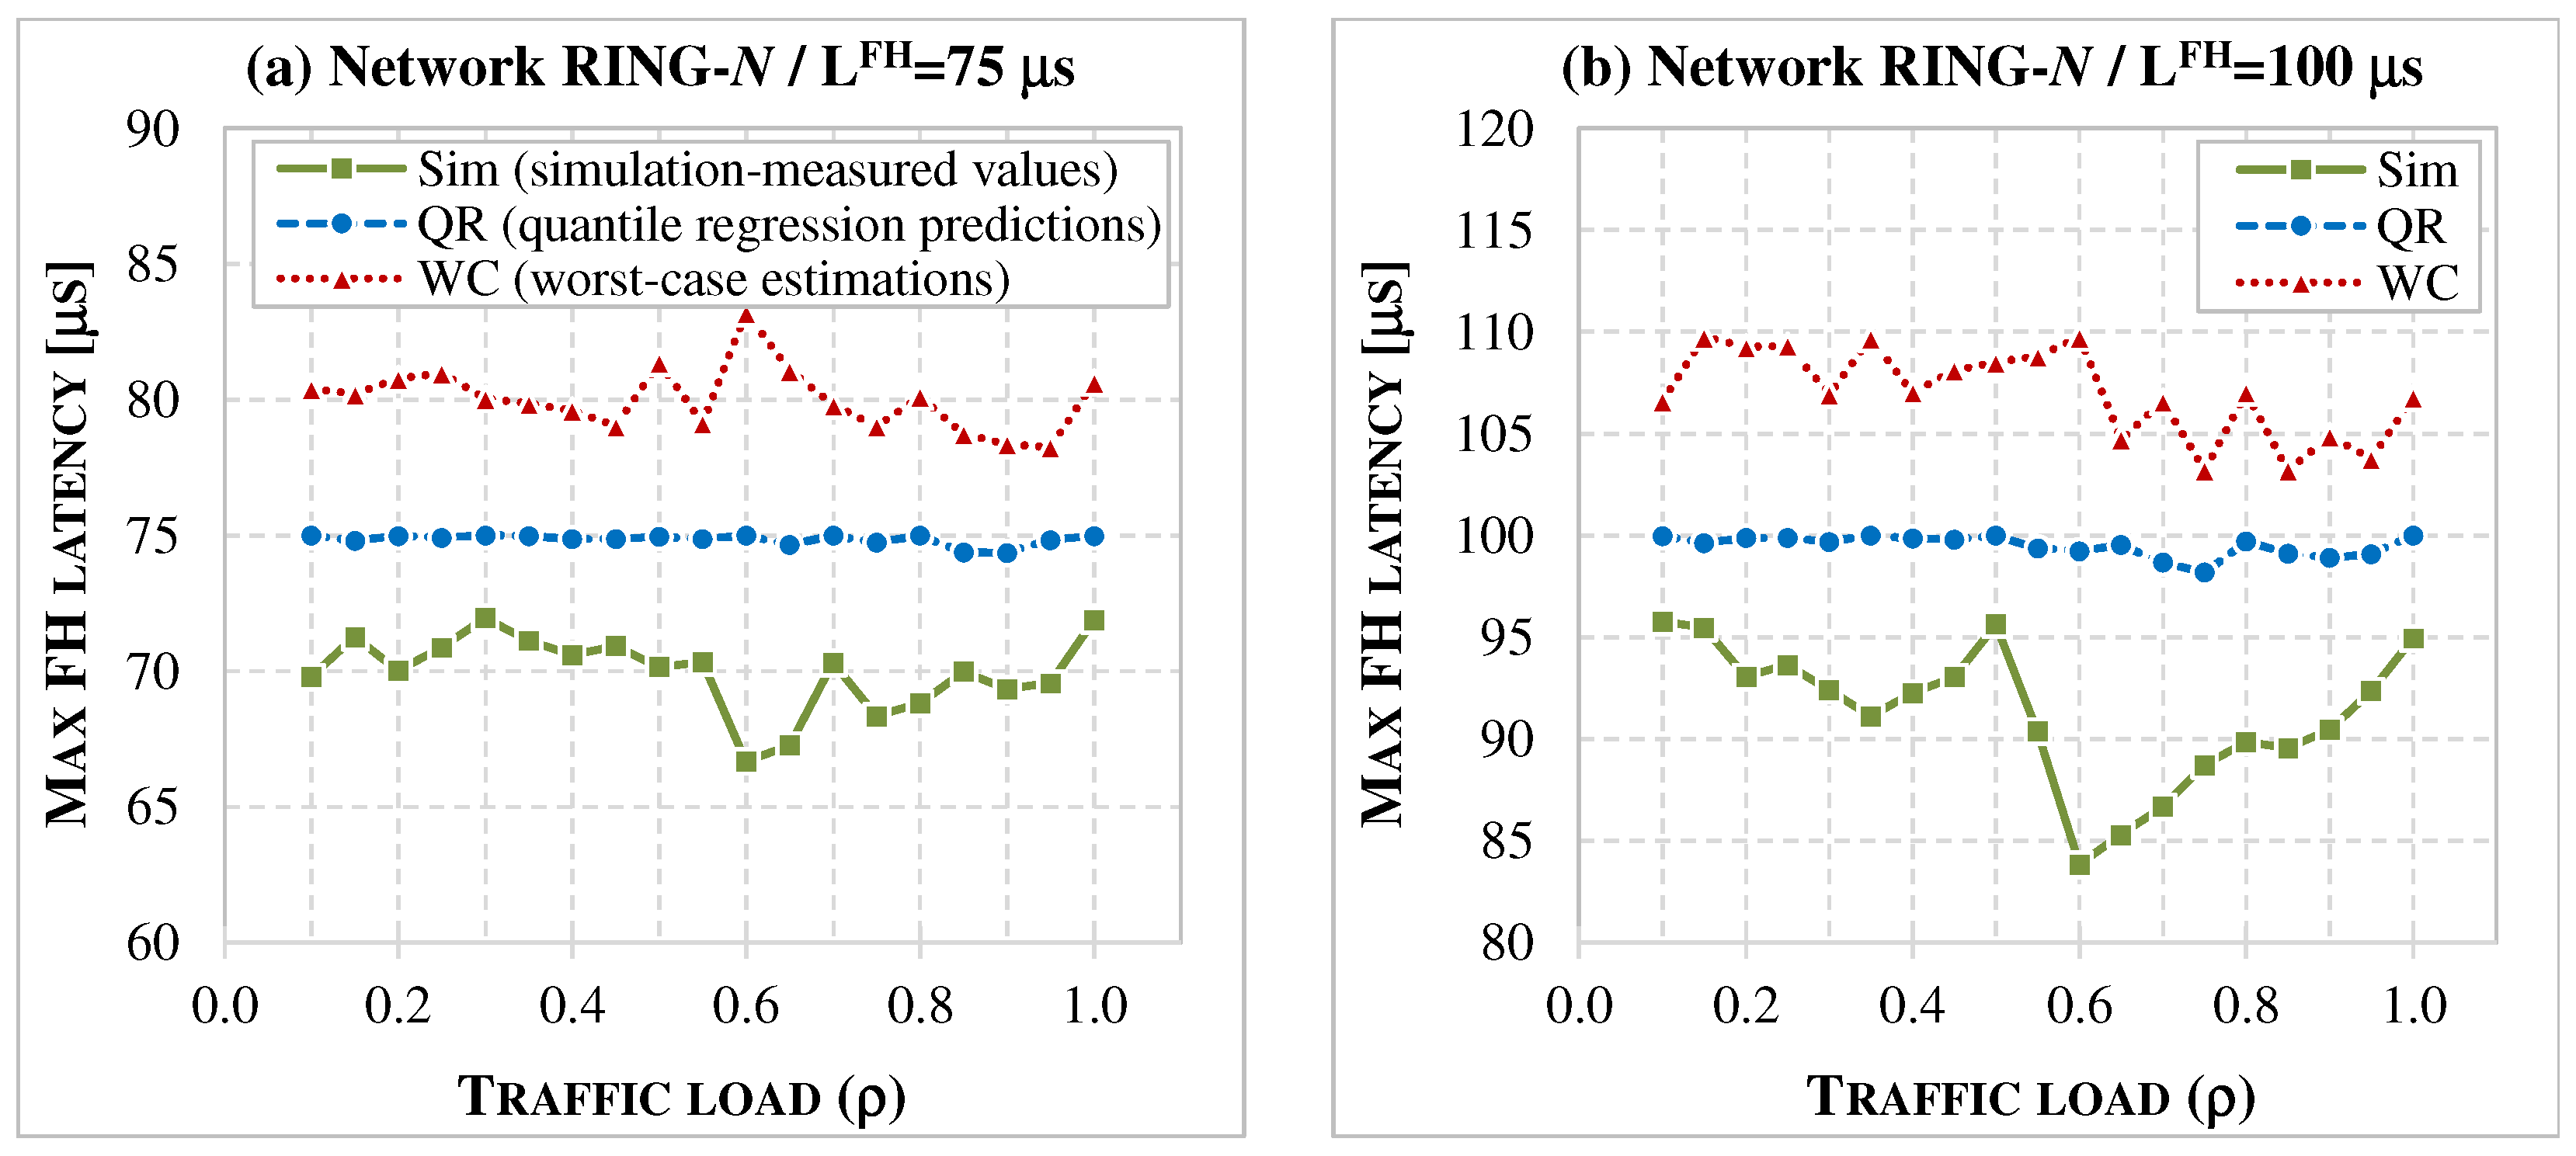
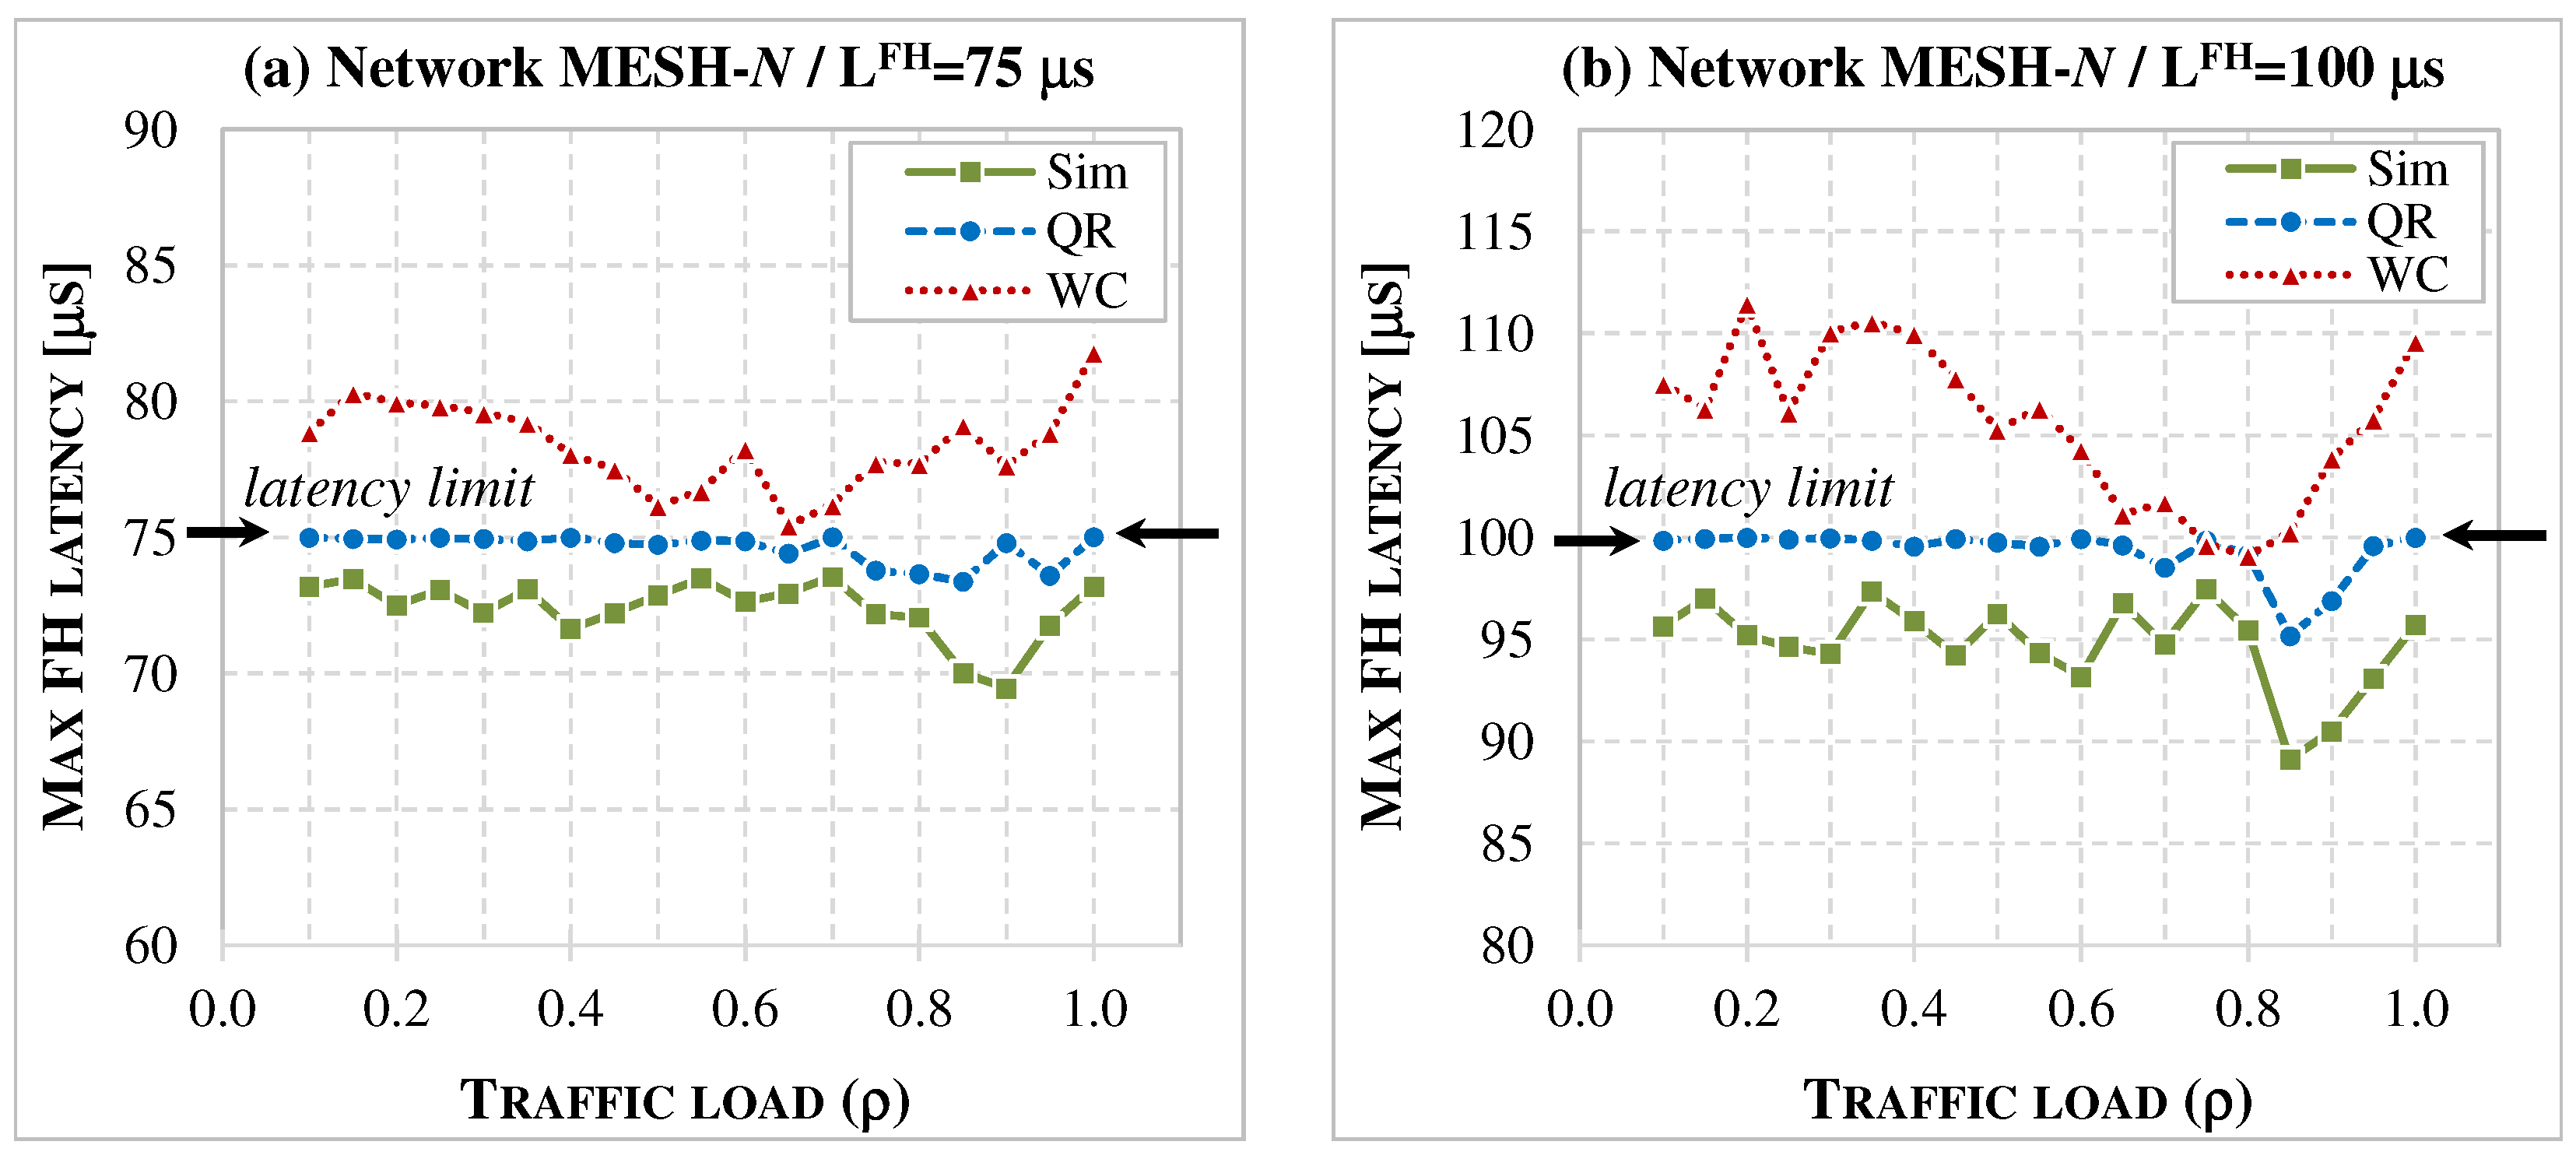
Here, we examine the reliability of the QR model, specifically verifying whether its maximum latency estimates remain within the imposed latency limits. Figure 7 and Figure 8 present the maximum one-way FH latencies in RING-N and MESH-N networks, respectively, as functions of traffic load ( ρ ). Simulation results (denoted as Sim) are compared with the quantile regression predicted values (QR) and the worst-case estimated values (WC), assuming FH latency limits of 75 μs and 100 μs. For each load level, the reported value corresponds to the maximum latency across all analyzed scenarios, i.e., different network instances and parameter settings, assuming N { 6 , 8 , 10 } for RING-N and N { 20 , 38 } for MESH-N topologies, R { 10 , 20 , 30 } RUs, and numerologies μ { 1 , 2 } , with 10 random RU placements considered for each network setting. The results were obtained for the networks using the QR model.
The results in Figure 7 and Figure 8 show that the QR predictions remain below the latency limits across the entire range of ρ , confirming QR as a reliable model for one-way latency estimation in dynamic packet-switched Xhaul networks with varying traffic loads. The reported maximum predicted values are also close to the corresponding simulated latencies—particularly in MESH-N networks—with deviations typically within a few microseconds. In contrast, the WC estimates consistently exceed the FH latency limits, reflecting their conservative, overestimation approach. It is worth noting that these results correspond to networks optimized using the QR model, which explains why the WC estimates may lie above the limits.

7.2. Accuracy of Latency Models

Next, we analyze the accuracy of latency predictions ( Δ ), defined as the relative difference between estimated or predicted latencies and the simulation results, where lower values of Δ indicate higher accuracy.
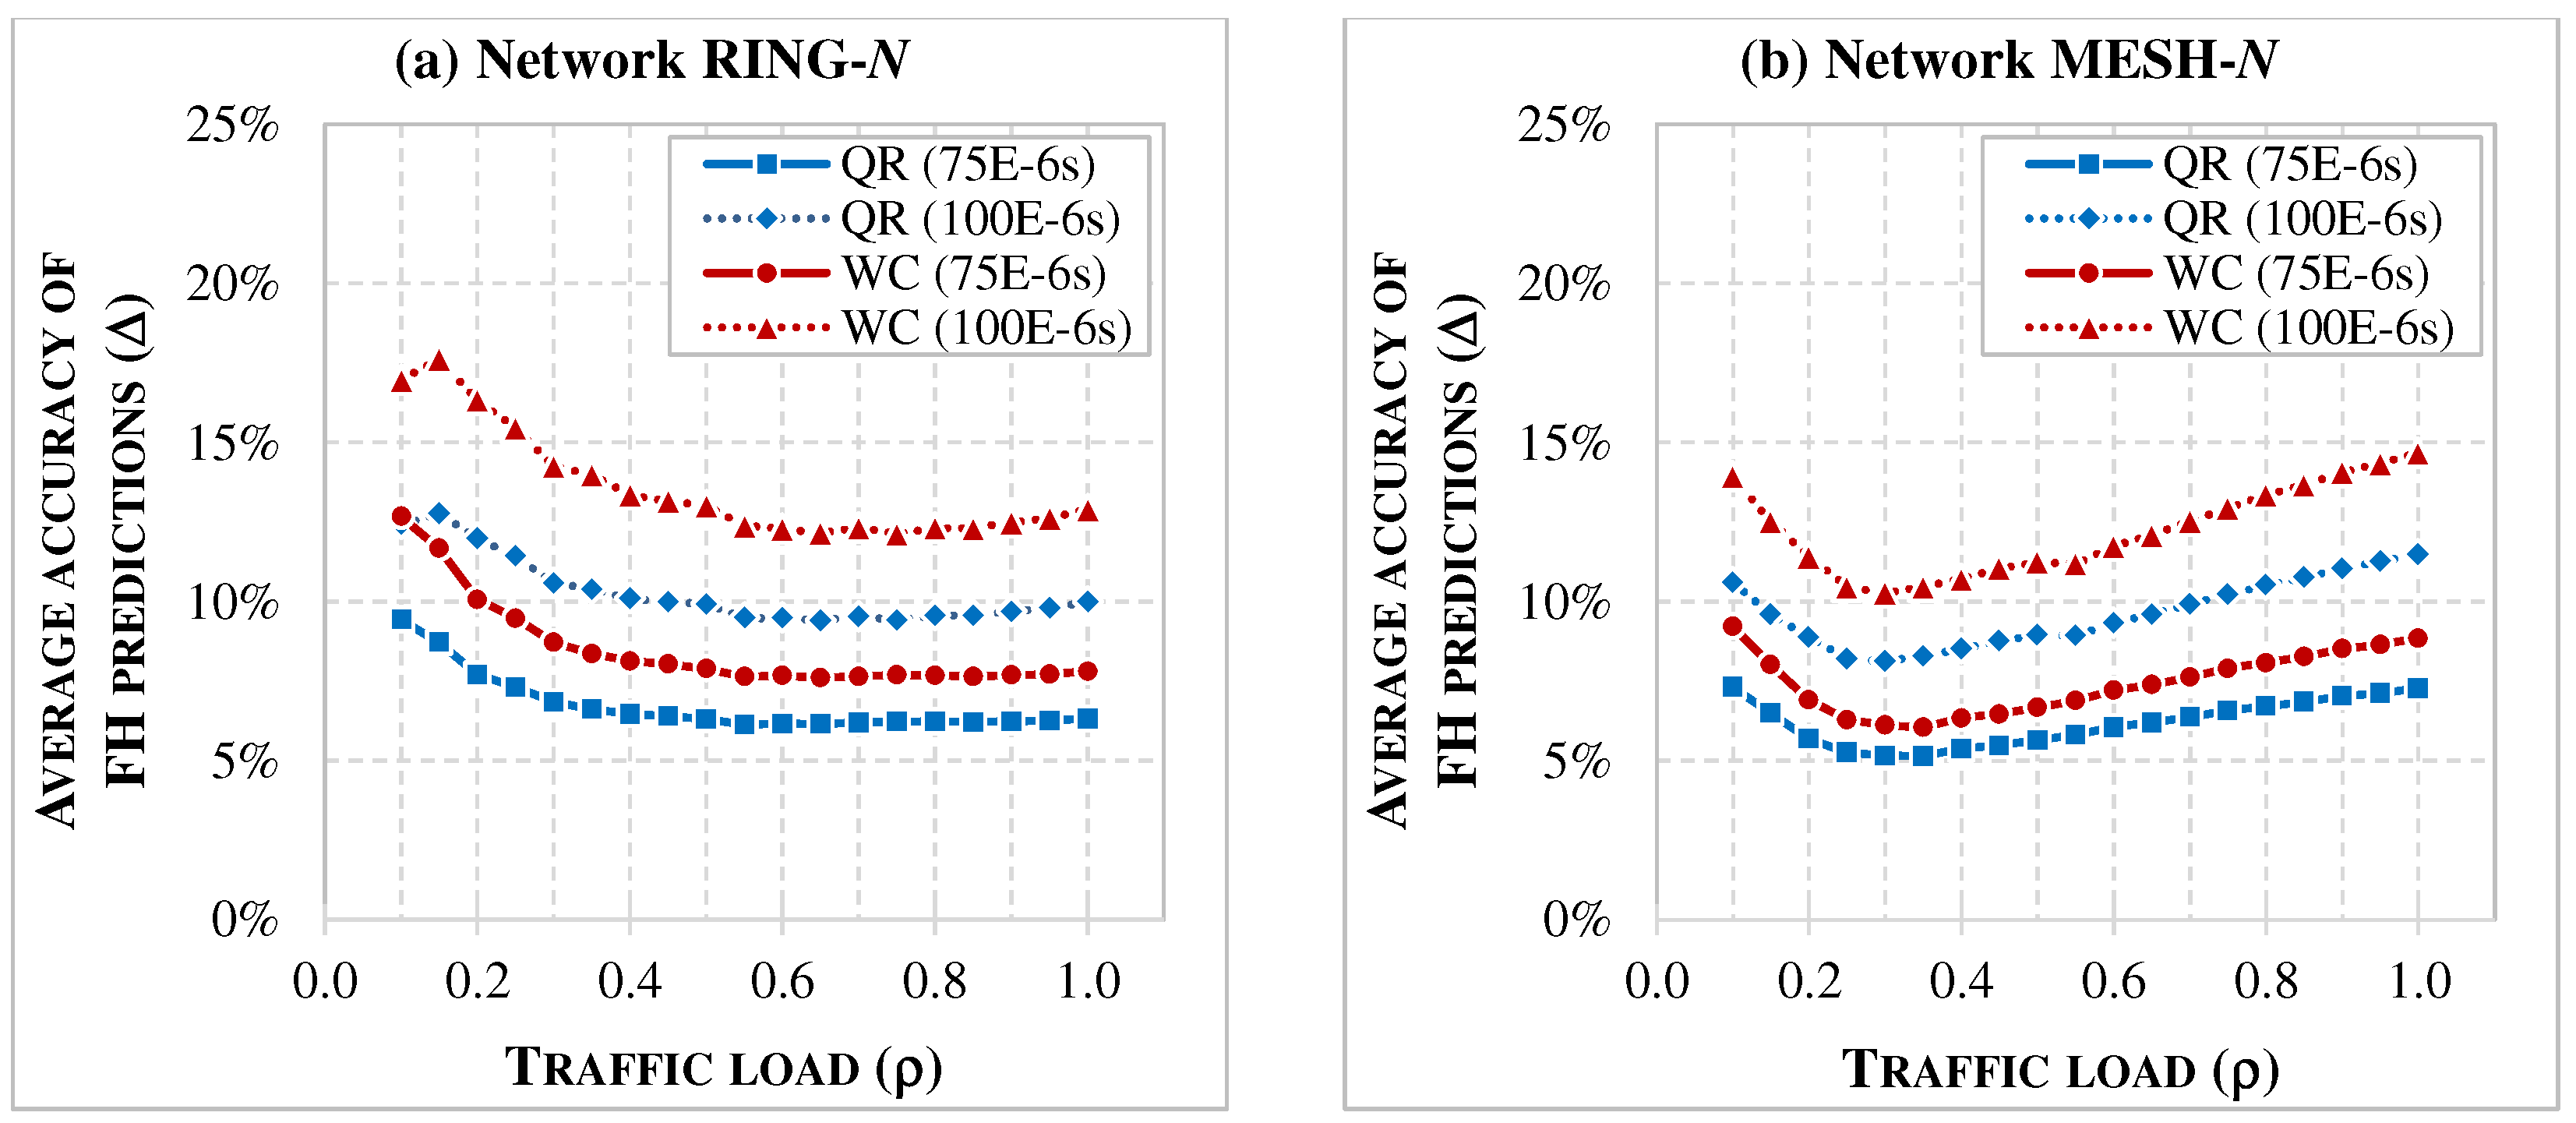
Figure 9 shows the average prediction accuracy of the WC and QR models for FH flows in RING-N and MESH-N networks, evaluated over the same set of scenarios as in Section 7.1. The values of Δ are plotted as functions of traffic load ( ρ ) for FH latency limits L F H = 75 μs and 100 μs, illustrating how both models behave under different load conditions.
In Figure 9, the average accuracy results for FH flows indicate that QR achieves higher accuracy than WC, with Δ ranging from about 5% (for L F H = 75 μs in MESH-N) to 13% (for L F H = 100 μs in RING-N), compared to WC, where Δ varies between 6% (for L F H = 75 μs in MESH-N) and up to 18% (for L F H = 100 μs in RING-N). Accuracy for both models is generally higher across the entire range of ρ when lower latency limits are imposed. In RING-N networks, both models exhibit reduced accuracy at low loads, which improves as ρ increases and stabilizes beyond ρ 40 % . The highest accuracy in MESH-N is observed at moderate loads ( 20 % ρ 40 % ), while performance deteriorates at both very low and very high load conditions.
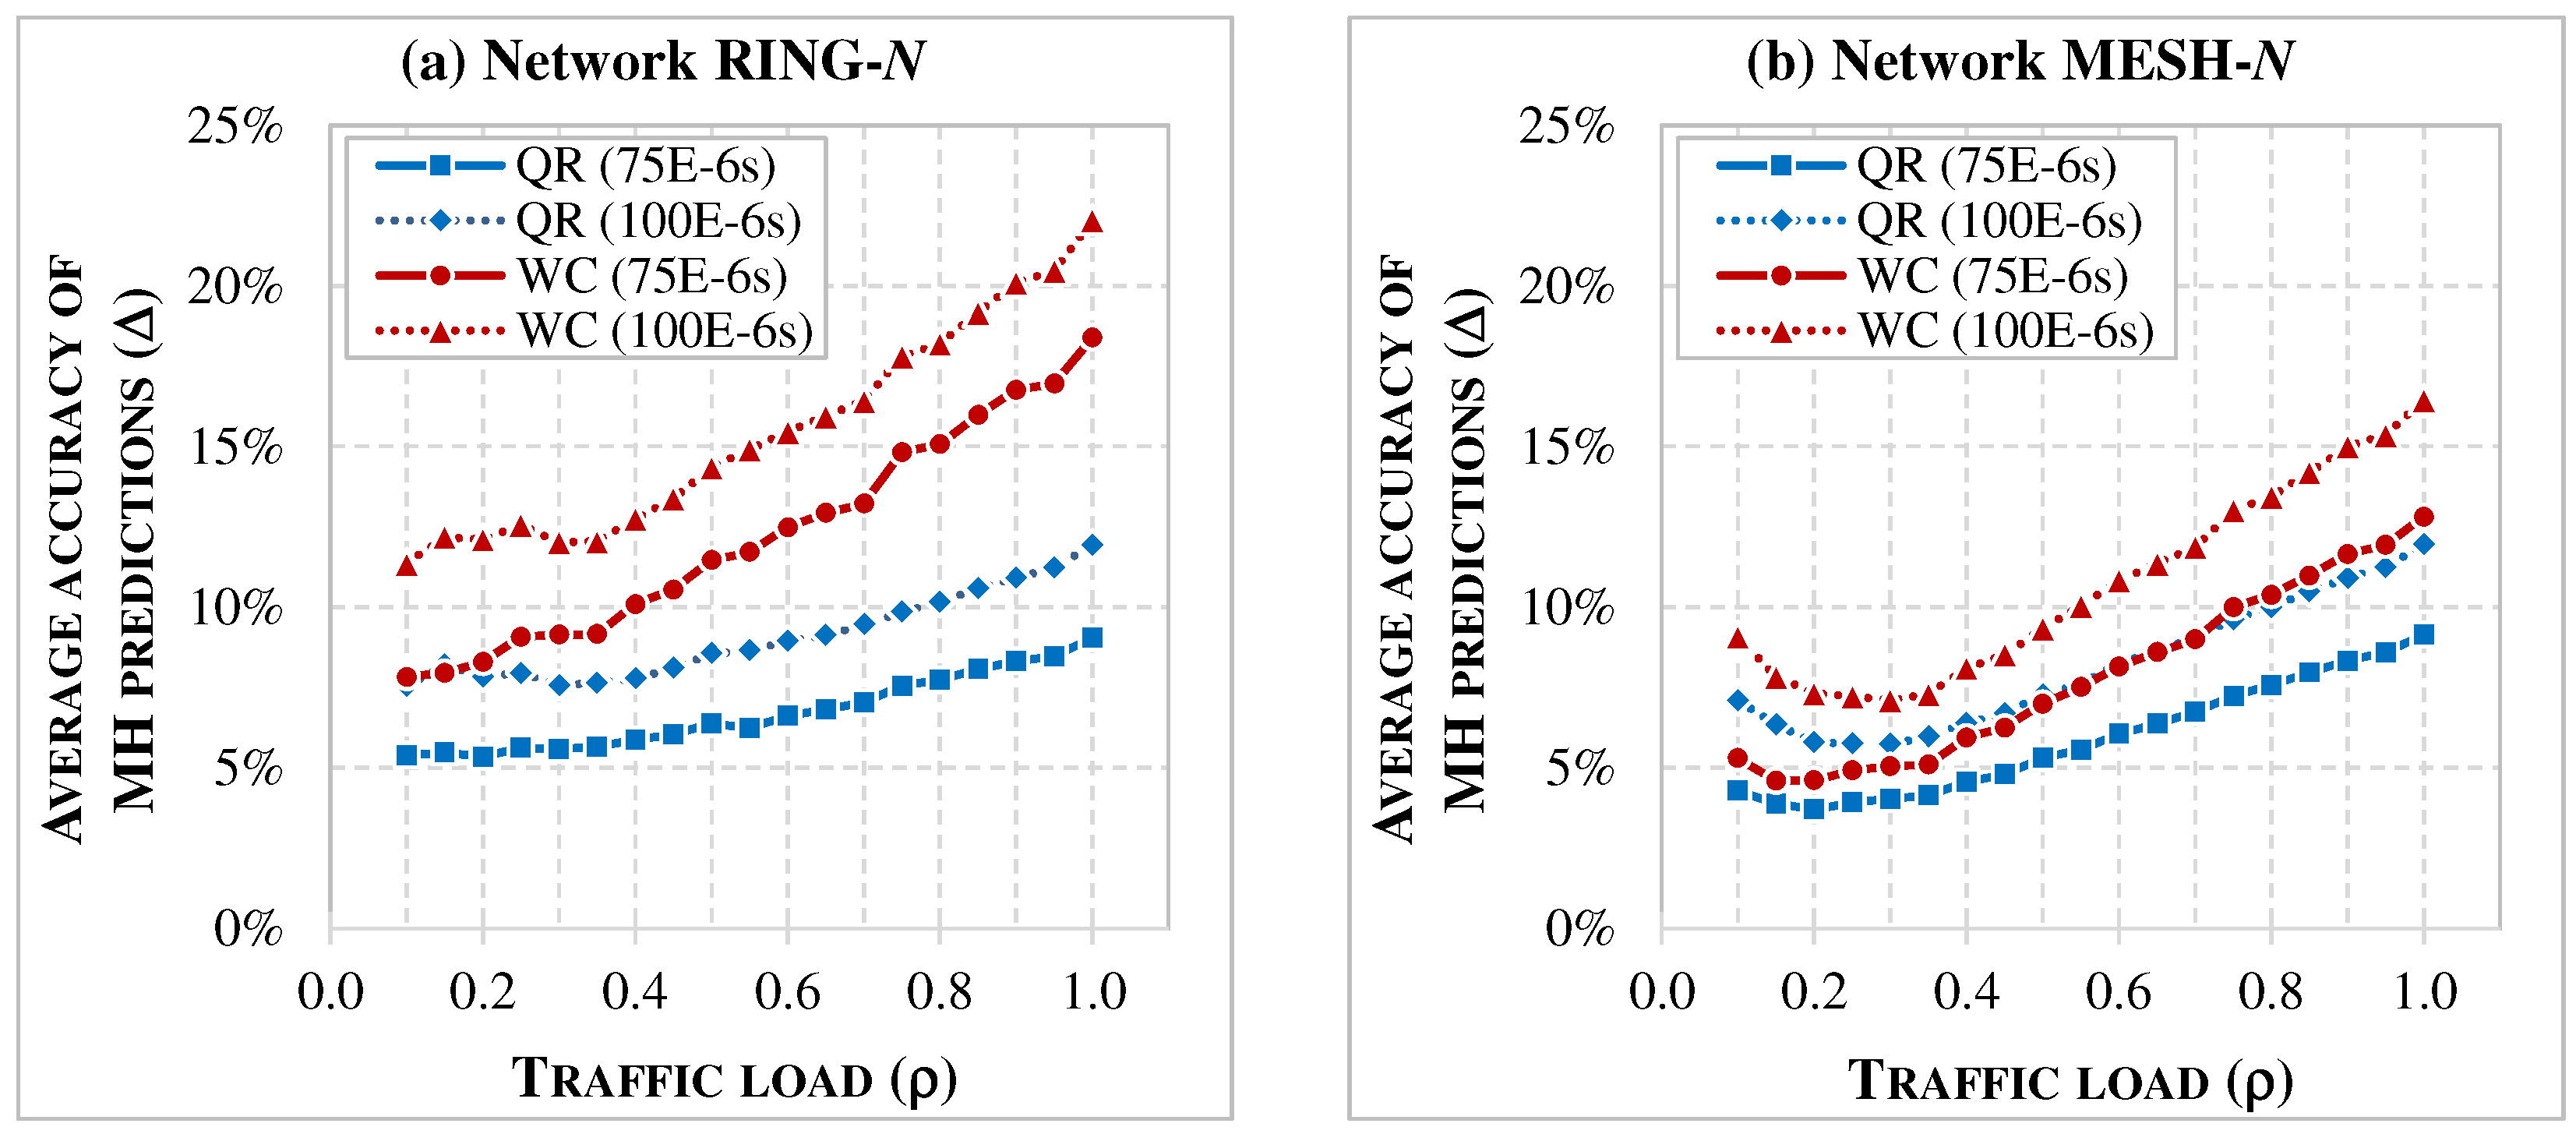
Figure 10 extends the accuracy analysis to MH flows in RING-N and MESH-N networks, again as a function of traffic load ( ρ ) for latency limits L F H 75 , 100  μs. Compared to FH flows, a different trend can be observed: in RING-N networks, the accuracy of both models decreases as ρ increases. Moreover, while the QR model maintains a level of accuracy comparable to that for FH flows, the accuracy of the WC model deteriorates sharply at higher loads in RING-N, with Δ exceeding 22% on average.
Table 3 reports the average prediction accuracy of the WC and QR latency models for both FH and MH flows. The values are averaged over RING-N and MESH-N scenarios for traffic loads ρ ranging from 0.1 to 1.0 (step 0.05), with FH latency limits L F H { 75 , 100 }  μs and numerologies μ { 1 , 2 }
The results in Table 3 confirm the trends shown in Figure 9 and Figure 10, with QR reducing the average prediction error by several percentage points (pp) compared to WC, as summarized in the last two columns of the table. For FH flows, predictions are generally more accurate (lower values of Δ ) for the lower numerology ( μ = 1 ), particularly in the case of WC. In contrast, for MH flows, both models perform better at the higher numerology ( μ = 2 ). Another observation is that prediction accuracy decreases when the FH latency limit ( L F H ) is increased.
Concluding this subsection, QR predictions achieve consistently higher accuracy than WC estimations for both FH and MH flows. Nevertheless, the error of QR predictions still ranges from a few to several percent depending on the network scenario and traffic load, which motivates further exploration of alternative ML models that may deliver additional improvements in prediction accuracy.

7.3. Impact on Network Performance

Finally, we assess the impact of latency prediction models on network performance in terms of processing resource utilization.
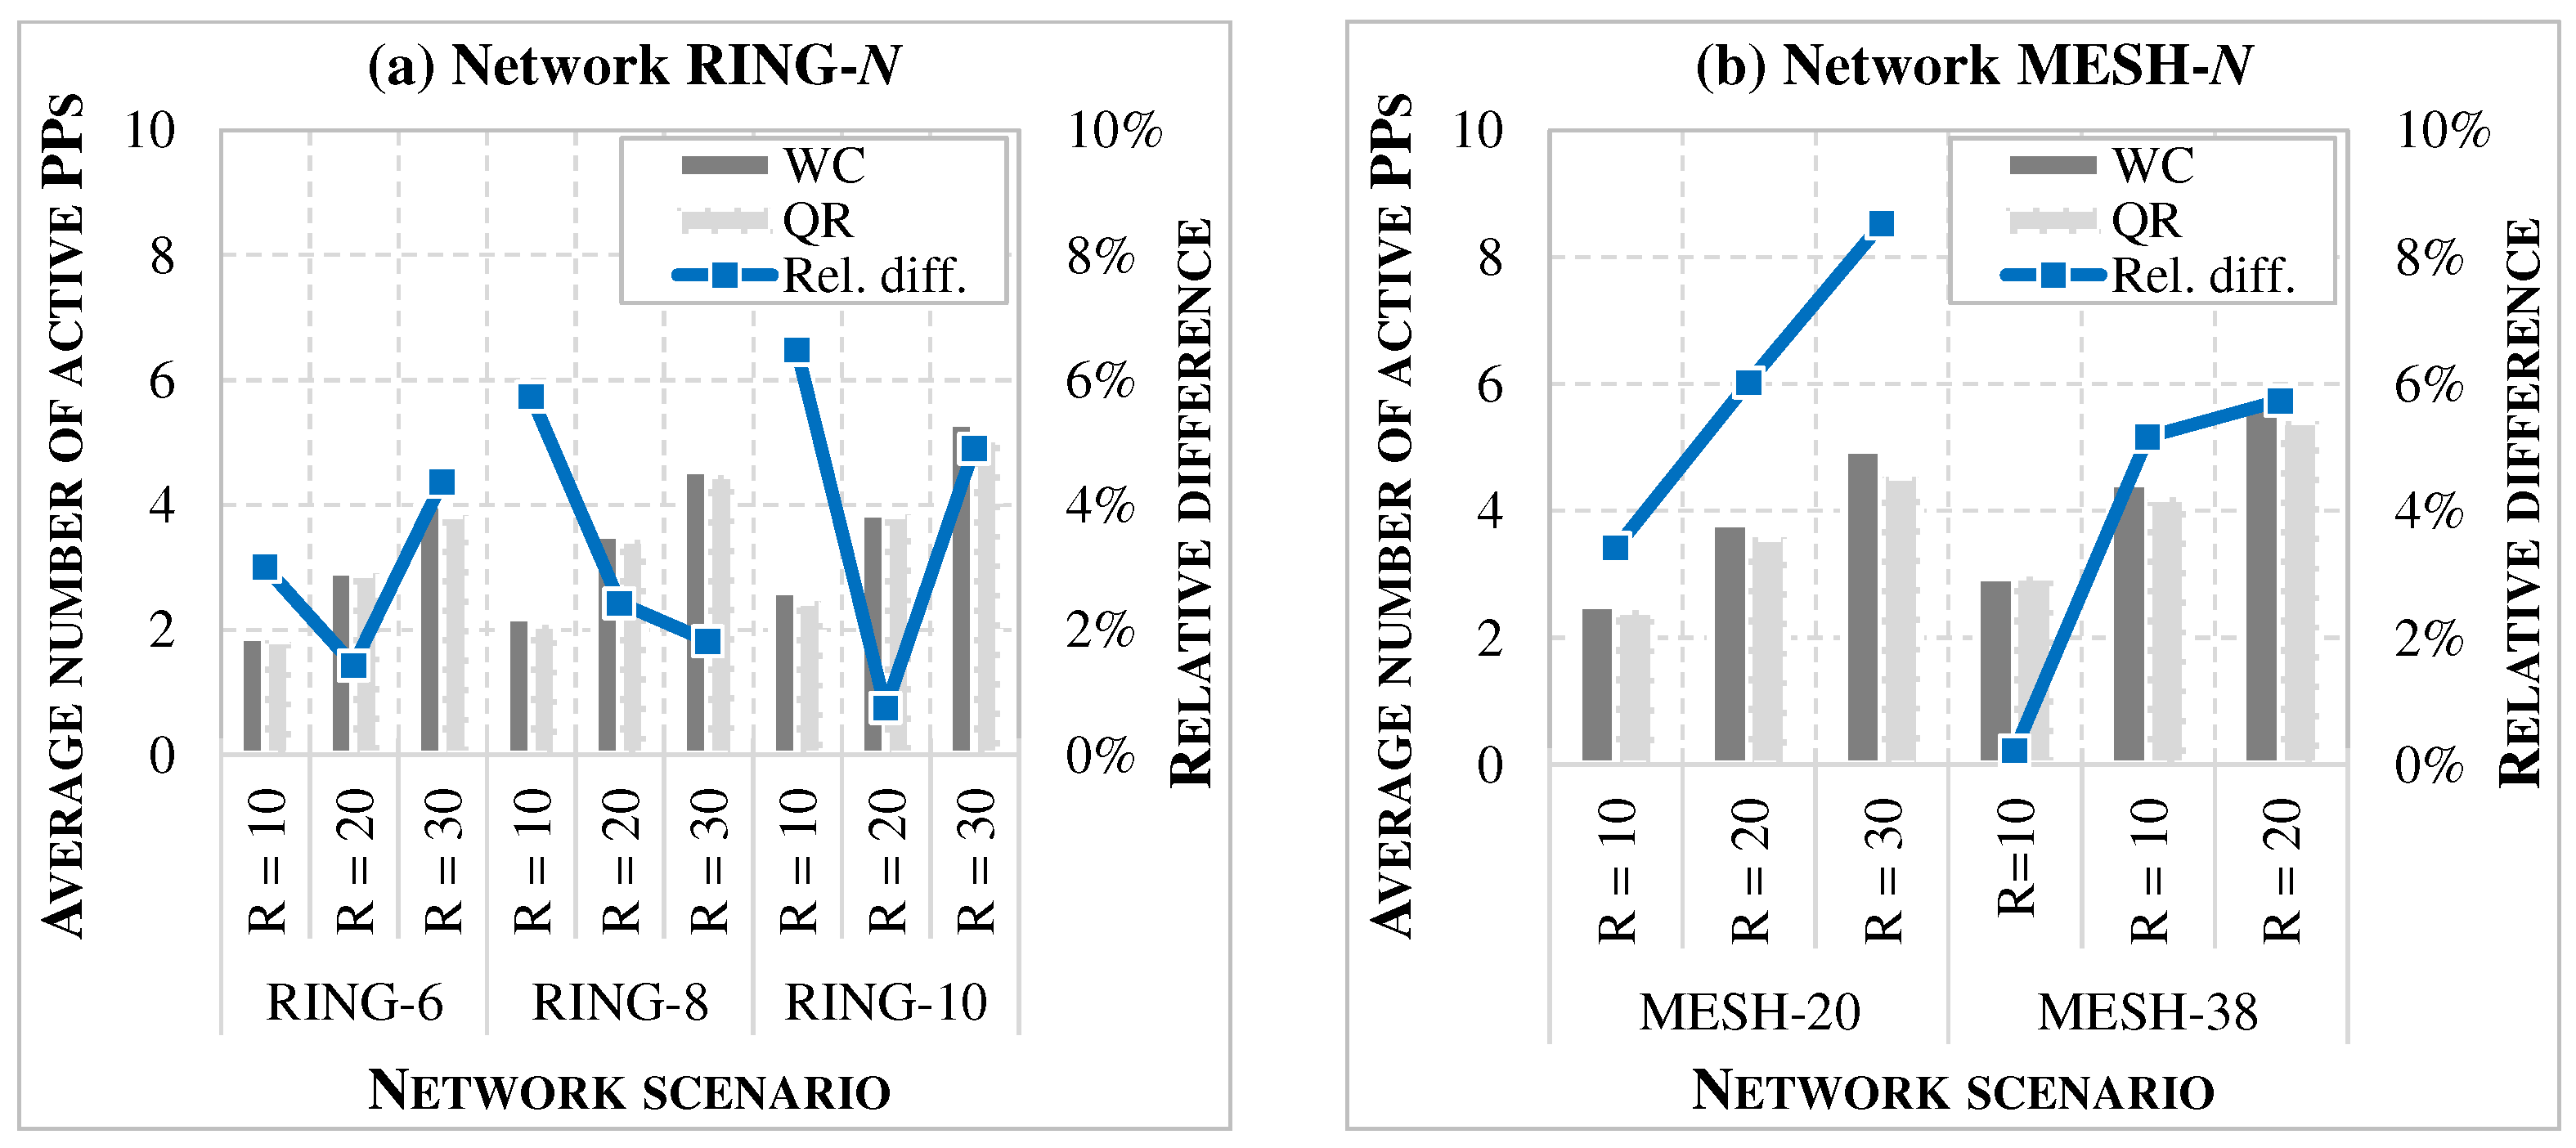
Figure 11 presents the average number of active PPs (bars) and the relative reduction in PPs (lines) achieved with QR predictions compared to WC estimates in RING-N and MESH-N networks. The results are averaged over the network instances considered in the previous subsection—covering different traffic loads, latency limits, and numerologies—and are reported for scenarios with varying numbers of RUs, R { 10 , 20 , 30 } . The use of QR predictions consistently reduces the number of required active PPs compared with WC-based estimates, with the relative savings most pronounced in MESH-N networks and increasing with the number of RUs, reaching nearly 10% in some scenarios.
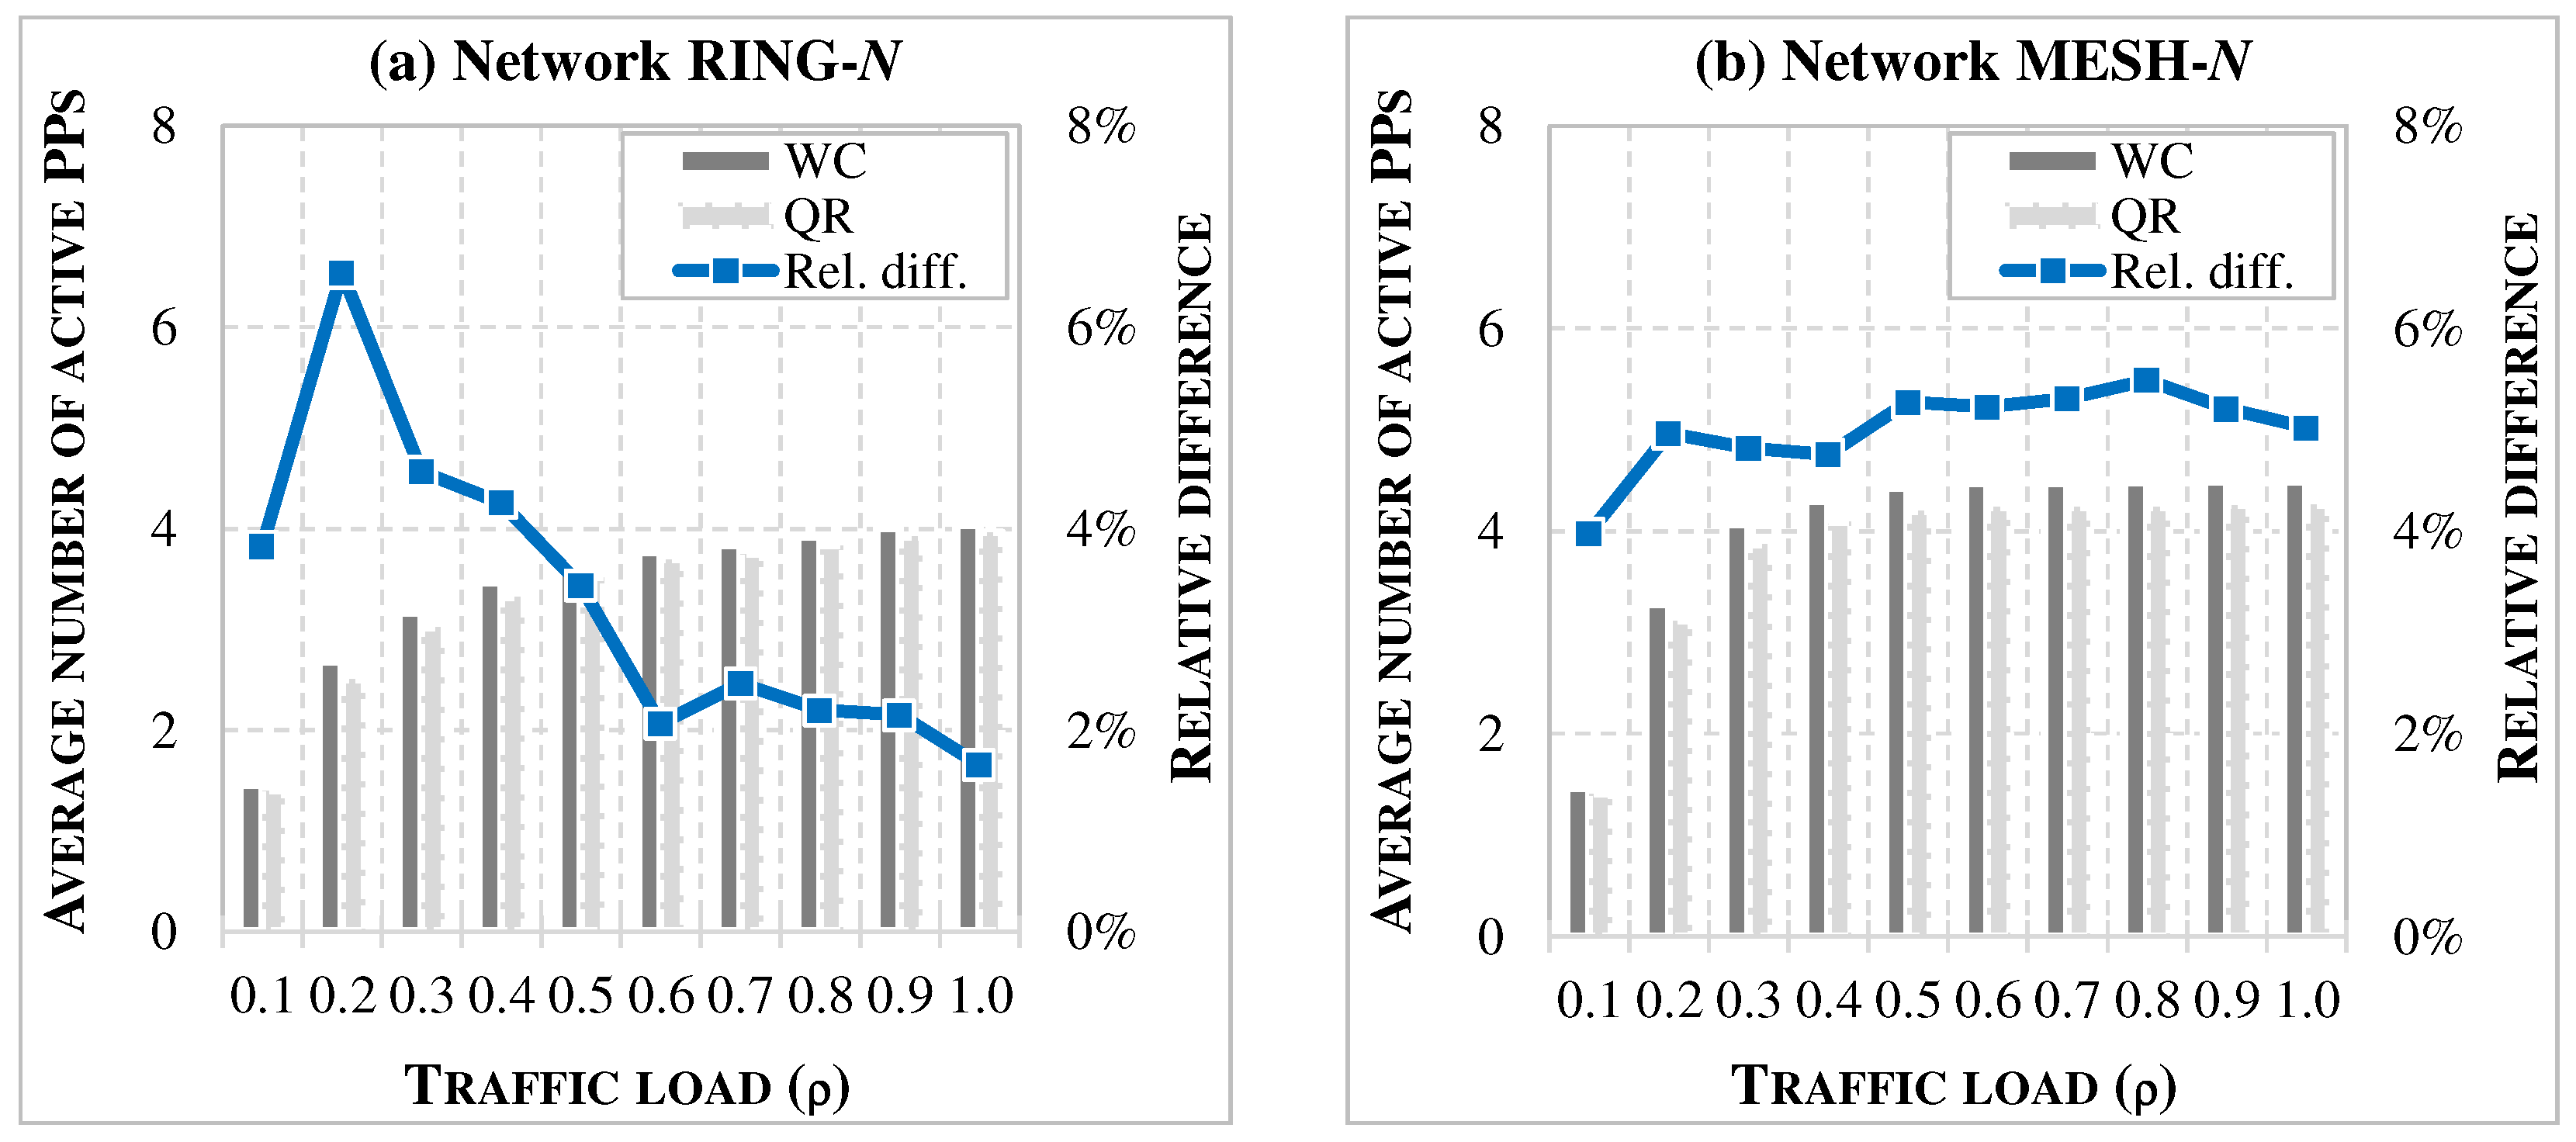
Figure 12 presents a similar analysis of PP utilization gains, this time as a function of traffic load ( ρ ). QR-based latency predictions require fewer active PPs than WC, with average reductions ranging from about 2% to more than 6%. The relative difference between the models remains relatively stable across the entire load range in MESH-N networks, whereas in RING-N networks it decreases with increasing traffic load.
Table 4 reports the average performance gains obtained by using QR instead of WC for different FH latency limits ( L F H ) at specific traffic loads in RING-N and MESH-N networks. Gains are evident for both latency limits, with savings in active PPs typically ranging from 2% to 11%, and the highest values observed in lightly loaded networks ( ρ = 0.2 ) with the higher latency limit of 100 μs.
Furthermore, Table 5 presents similar results, but this time for different numerologies, μ 1 , 2 . In MESH-N networks, QR shows consistently larger benefits at μ = 2 compared with μ = 1 for almost all traffic loads ( ρ 0.2 ), whereas in RING-N networks the results are more variable across load levels.

8. Discussion

This Section provides concluding remarks on the analysis presented in Section 7 and discusses the applicability of the QR-based latency predictor.
  • The comparison presented in Section 7 shows that deterministic WC estimation, while ensuring that latency limits are not violated, is overly conservative. WC values often exceed the actual latencies observed in simulations, which may lead to rejecting feasible configurations and allocating more network resources than necessary. In contrast, the QR-based predictions remain within acceptable limits and closely approximate the measured latencies, making them a more accurate approach for estimating maximum one-way delays.
  • The accuracy analysis confirms that the QR model consistently reduces prediction errors for both FH and MH flows. Although the absolute error still reaches a few percent in some cases, it represents a clear improvement over the WC estimator, especially in mesh topologies and at higher traffic loads. The results also show that tighter latency limits improve the accuracy of both models and that the impact of numerology differs between FH and MH flows. These observations highlight the need for parameter-aware adaptation of predictors and motivate the exploration of more advanced ML models.
  • At the network level, more accurate latency prediction translates directly into improved resource efficiency. When QR-based estimates are applied during network operation, a decrease of 1–11% in active processing nodes is observed on average, depending on the scenario. Although these gains may seem modest, they become significant in large-scale deployments, where even small efficiency improvements yield noticeable reductions in energy consumption and operational costs. Importantly, this effect is consistent across different network sizes, traffic loads, and RU configurations, confirming the robustness of the QR approach.
  • An important consideration regarding the applicability of the QR model is the range of network sizes and traffic loads represented in the training data. In this study, the maximum load level was limited to ρ = 1.0 , corresponding to the full radio-flow bit-rate defined for each RU, and therefore representing the intended maximum Xhaul traffic. Scenarios with ρ > 1.0 —i.e., exceeding the nominal RU capacity—were not considered. While the QR predictor may still produce reasonable outputs under such conditions, proper training for these extreme loads would require incorporating corresponding samples into the dataset. Similarly, although the training data cover a diverse set of topologies, including ring networks with up to 10 switches and mesh networks with up to 50 RUs, applying the model to significantly larger or structurally different networks would likely require extending the training dataset to ensure robust generalization.
  • The QR model is well suited for packet-switched Xhaul networks because it focuses on conservatively predicting high-quantile latency values. In this study, the QR predictor incorporates worst-case latency estimations as one of its input features. If analogous WC estimations can be formulated for scenarios with additional traffic classes or more advanced QoS differentiation schemes, the same QR-based methodology could be extended to those settings as well. Extending the approach to multi-class priority scheduling or differentiated QoS policies therefore constitutes a promising direction for future research.
  • While the evaluation considers a broad range of traffic loads and dynamically changing flow configurations, it does not explicitly address extreme operating conditions such as sudden traffic surges or link failures. The analysis assumes that traffic remains within the SLA-compliant maximum bit-rate levels defined for the flows. Nevertheless, the simulations include scenarios with varying routing configurations and time-varying loads, suggesting that the QR model may retain applicability in situations where flows must be rerouted following a link failure. A systematic investigation of such extreme network states, particularly those involving abrupt congestion spikes or partial network outages, remains an important topic for future research.
  • An additional consideration concerns the computational complexity of the QR model in the context of dynamic network operation. Although the model is intended for real-time use, its training is performed entirely offline using large data sets that cover diverse traffic loads and routing configurations. For the mesh topology, training on the complete dataset of up to 1.44 million labeled samples, corresponding to 360,000 samples per flow type, required approximately 1.5–2 h per flow type on a standard laptop. Once trained, the model can be deployed without further retraining, even under dynamically changing flow configurations. Inference is lightweight (sub-millisecond), as it involves only simple linear operations on features such as WC and other latency-related components, which are dynamically computed through iterative summation of per-link latency values along each flow’s routing path. These properties make the QR predictor entirely suitable for real-time network control. While a formal complexity analysis of the underlying optimization solver is beyond the scope of this work, the empirical results indicate that the approach is computationally efficient and practically deployable.
  • Overall, the obtained results show that applying the QR model in latency-sensitive packet-switched Xhaul networks improves efficiency without violating SLA constraints. By mitigating conservatism in WC estimates, the QR approach enables more effective use of network resources. These findings support the integration of data-driven latency predictors into future network control and management systems, including those operating within the O-RAN architecture, enabling proactive and automated network optimization.

9. Conclusions

This study addressed the problem of accurate latency prediction in dynamic TSN-enabled packet-switched Xhaul networks that transport fronthaul and midhaul traffic in 5G and beyond RANs. Two latency modeling approaches were considered and compared: a deterministic worst-case model derived from network calculus principles, and a data-driven quantile regression model designed to predict high-percentile (tail) flow latencies. The WC model provides strict upper bounds on transmission delays, ensuring network reliability but often resulting in overly conservative (overestimated) latency values.
In contrast, the QR model estimates conditional quantiles of latency distributions, leveraging both deterministic and queuing-related data features.
The results demonstrate that the QR model significantly improves the accuracy of latency prediction—particularly for midhaul flows—while maintaining compliance with stringent latency limits required by 5G/6G RANs. When applied in a dynamic network operation scenario, the QR-based predictions translate into measurable resource savings, reducing the number of active processing nodes by several percent compared with WC-based estimations.
These findings confirm that data-driven models can effectively complement deterministic latency models, offering a practical means to mitigate the over-provisioning effects typical of conservative WC calculations.
Future work will focus on further improving latency prediction accuracy beyond the results achieved with the QR model by exploring alternative, more advanced ML and DL models. In addition, the data-driven modeling framework will be extended toward hybrid learning approaches that combine analytical latency bounds with real-time telemetry data, enabling continuous model adaptation during network operation. These developments are expected to further enhance the predictive reliability of latency models in evolving 6G Xhaul systems and facilitate their integration into digital-twin-based network management platforms.

Author Contributions

Conceptualization, M.K.; methodology, M.K.; software, M.K.; validation, D.W.; investigation, M.K. and D.W.; resources, M.K.; data curation, M.K.; writing—original draft preparation, M.K.; writing—review and editing, M.K. and D.W.; visualization, M.K.; supervision, M.K.; project administration, M.K.; funding acquisition, M.K. All authors have read and agreed to the published version of the manuscript.

Funding

This research was supported by National Science Centre, Poland, under grant number 2024/53/B/ST7/02482.

Institutional Review Board Statement

Not applicable.

Informed Consent Statement

Not applicable.

Data Availability Statement

The raw data used in this study are available from the corresponding author upon request.

Conflicts of Interest

The authors declare no conflicts of interest.

References

  1. Alimi, I.A.; Teixeira, A.; Monteiro, P. Towards an Efficient C-RAN Optical Fronthaul for the Future Networks: A Tutorial on Technologies, Requirements, Challenges, and Solutions. IEEE Commun. Surv. Tutor. 2018, 20, 708–769. [Google Scholar] [CrossRef]
  2. Chih-Lin, I.; Li, H.; Korhonen, J.; Huang, J.; Han, L. RAN Revolution with NGFI (xhaul) for 5G. IEEE J. Lightw. Technol. 2018, 36, 541–550. [Google Scholar]
  3. Abdullah, M.; Elayoubi, S.E.; Chahed, T.; Lisser, A. Performance Modeling and Dimensioning of Latency-Critical Traffic in 5G Networks. In Proceedings of the GLOBECOM 2023—2023 IEEE Global Communications Conference, Kuala Lumpur, Malaysia, 4–8 December 2023. [Google Scholar]
  4. 1914.1-2019; IEEE Standard for Packet-Based Fronthaul Transport Networks. IEEE: New York, NY, USA, 2019.
  5. Common Public Radio Interface: eCPRI V1.2 Requirements for the eCPRI Transport Network. 2018. Available online: https://www.cpri.info/downloads/Requirements_for_the_eCPRI_Transport_Network_V1_2_2018_06_25.pdf (accessed on 14 October 2025).
  6. O-RAN Alliance. O-RAN Control, User and Synchronization Plane Specification, v18.0. Available online: https://www.o-ran.org/ (accessed on 14 October 2025).
  7. Skocaj, M.; Conserva, F.; Grande, N.S.; Orsi, A.; Micheli, D.; Ghinamo, G.; Bizzarri, S.; Verdone, R. Data-driven Predictive Latency for 5G: A Theoretical and Experimental Analysis Using Network Measurements. In Proceedings of the 2023 IEEE 34th Annual International Symposium on Personal, Indoor and Mobile Radio Communications (PIMRC), Toronto, ON, Canada, 5–8 September 2023. [Google Scholar]
  8. Cai, Y.; Li, W.; Meng, X.; Zheng, W.; Chen, C.; Liang, Z. Adaptive Contrastive Learning Based Network Latency Prediction in 5G URLLC Scenarios. Comput. Netw. 2024, 240, 110185. [Google Scholar] [CrossRef]
  9. Zhang, L.; Fu, J.; He, Y.; Jiang, X. Toward Deterministic Wireless Communication: Latency Prediction Using Network Measurement Data. In Proceedings of the 2024 IEEE 35th International Symposium on Software Reliability Engineering Workshops (ISSREW), Tsukuba, Japan, 28–31 October 2024. [Google Scholar]
  10. Klinkowski, M. Optimized Planning of DU/CU Placement and Flow Routing in 5G Packet Xhaul Networks. IEEE Trans. Netw. Serv. Manag. 2024, 21, 232–248. [Google Scholar] [CrossRef]
  11. 802.1CM-2018; IEEE Standard for Local and Metropolitan Area Networks—Time-Sensitive Networking for Fronthaul. IEEE: New York, NY, USA, 2018.
  12. O-RAN Alliance. Xhaul Packet Switched Architectures and Solutions. Tech. Spec. v8.0. 2025. Available online: https://specifications.o-ran.org/specifications (accessed on 14 October 2025).
  13. Bertin, E.; Crespi, N.; Magedanz, T. Shaping Future 6G Networks: Needs, Impacts, and Technologies; John Wiley & Sons: Hoboken, NJ, USA, 2021. [Google Scholar]
  14. 802.1Qbv-2015; IEEE Standard for Local and Metropolitan Area Networks—Bridges and Bridged Networks—Amendment 25: Enhancements for Scheduled Traffic. IEEE: New York, NY, USA, 2015.
  15. 802.1Qbu-2016; IEEE Standard for Local and Metropolitan Area Networks—Bridges and Bridged Networks—Amendment 26: Frame Preemption. IEEE: New York, NY, USA, 2016.
  16. Chitimalla, D.; Kondepu, K.; Valcarenghi, L.; Tornatore, M.; Mukherjee, B. 5G Fronthaul–Latency and Jitter Studies of CPRI over Ethernet. J. Opt. Commun. Netw. 2017, 9, 172–182. [Google Scholar] [CrossRef]
  17. Perez, G.O.; Larrabeiti, D.; Hernandez, J.A. 5G New Radio Fronthaul Network Design for eCPRI-IEEE 802.1CM and Extreme Latency Percentiles. IEEE Access 2019, 7, 82218–82229. [Google Scholar] [CrossRef]
  18. Kleinrock, L. Queueing Systems Volume 1: Theory; John Wiley & Sons: Hoboken, NJ, USA, 1975. [Google Scholar]
  19. Chughtai, M.N.; Noor, S.; Laurinavicius, I.; Assimakopoulos, P.; Gomes, N.J.; Zhu, H.; Wang, J.; Zheng, X.; Yan, Q. User and Resource Allocation in Latency Constrained Xhaul via Reinforcement Learning. J. Opt. Commun. Netw. 2023, 15, 219–228. [Google Scholar] [CrossRef]
  20. Boudec, J.Y.L.; Thiran, P. Network Calculus—A Theory of Deterministic Queuing Systems for the Internet; Lecture Notes in Computer Science (2050); Springer: Berlin/Heidelberg, Germany, 2001. [Google Scholar]
  21. Zhang, J.; Wang, T.; Finn, N. Bounded latency calculating method, using network calculus. In Proceedings of the IEEE 802.1 Working Group Interim Session, Hiroshima, Japan, 14–17 January 2019. [Google Scholar]
  22. Klinkowski, M.; Perello, J.; Careglio, D. Application of Linear Regression in Latency Estimation in Packet-Switched 5G xHaul Networks. In Proceedings of the 2023 23rd International Conference on Transparent Optical Networks (ICTON), Bucharest, Romania, 2–6 July 2023. [Google Scholar]
  23. Koenker, R. Quantile Regression; Econometric Society Monographs; Cambridge University Press: Cambridge, UK, 2005. [Google Scholar]
  24. Wan, T.; Ashwood-Smith, P. A performance Study of CPRI over Ethernet with IEEE 802.1Qbu and 802.1Qbv Enhancements. In Proceedings of the 2015 IEEE Global Communications Conference (GLOBECOM), San Diego, CA, USA, 6–10 December 2015. [Google Scholar]
  25. Helm, M.; Carle, G. Predicting Latency Quantiles Using Network Calculus-assisted GNNs. In Proceedings of the GNNet ’23: Proceedings of the 2nd on Graph Neural Networking Workshop 2023, Paris, France, 8 December 2023. [Google Scholar]
  26. Zhao, L.; Pop, P.; Craciunas, S.S. Worst-Case Latency Analysis for IEEE 802.1Qbv Time Sensitive Networks Using Network Calculus. IEEE Access 2018, 6, 41803–41815. [Google Scholar] [CrossRef]
  27. Diez, L.; Alba, A.M.; Kellerer, W.; Agüero, R. Flexible functional split and fronthaul delay: A queuing-based model. IEEE Access 2021, 9, 151049–151066. [Google Scholar] [CrossRef]
  28. Koneva, N.; Sánchez-Macián, A.; Hernández, J.A.; Arpanaei, F.; González de Dios, O. On Finding Empirical Upper Bound Models for Latency Guarantees in Packet-Optical Networks. In Proceedings of the 2025 International Conference on Optical Network Design and Modeling (ONDM), Pisa, Italy, 6–9 May 2025. [Google Scholar]
  29. Elgcrona, E. Latency Prediction in 5G Networks by Using Machine Learning. Master’s Thesis, Lund University, Lund, Sweden, 2023. [Google Scholar]
  30. Zinno, S.; Navarro, A.; Rotbei, S.; Pasquino, N.; Botta, A.; Ventre, G. A Lightweight Deep Learning Approach for Latency Prediction in 5G and Beyond. In Proceedings of the 2025 21st International Conference on Network and Service Management (CNSM), Bologna, Italy, 27–31 October 2025. [Google Scholar]
  31. Agarwal, B.; Irmer, R.; Lister, D.; Muntean, G.M. Open RAN for 6G Networks: Architecture, Use Cases and Open Issues. IEEE Commun. Surv. Tutor. 2025. [Google Scholar] [CrossRef]
  32. Brik, B.; Chergui, H.; Zanzi, L.; Devoti, F.; Ksentini, A.; Siddiqui, M.S.; Costa-Pérez, X.; Verikoukis, C. Explainable AI in 6G O-RAN: A Tutorial and Survey on Architecture, Use Cases, Challenges, and Future Research. IEEE Commun. Surv. Tutor. 2025, 27, 2826–2859. [Google Scholar] [CrossRef]
  33. Adamuz-Hinojosa, O.; Zanzi, L.; Sciancalepore, V.; Garcia-Saavedra, A.; Costa-Pérez, X. ORANUS: Latency-tailored Orchestration via Stochastic Network Calculus in 6G O-RAN. In Proceedings of the IEEE INFOCOM 2024—IEEE Conference on Computer Communications, Vancouver, BC, Canada, 20–23 May 2024; pp. 61–70. [Google Scholar]
  34. Garcia-Saavedra, A.; Costa-Perez, X.; Leith, D.J.; Iosifidis, G. Enhancing 5G O-RAN Communication Efficiency Through AI-Based Latency Forecasting. In Proceedings of the IEEE INFOCOM 2025—IEEE Conference on Computer Communications Workshops (INFOCOM WKSHPS), London, UK, 19 May 2025; pp. 1–2. [Google Scholar]
  35. Klinkowski, M. Optimization of Latency-Aware Flow Allocation in NGFI Networks. Comp. Commun. 2020, 161, 344–359. [Google Scholar] [CrossRef]
  36. Klinkowski, M. Latency-Aware DU/CU Placement in Convergent Packet-Based 5G Fronthaul Transport Networks. Appl. Sci. 2020, 10, 7429. [Google Scholar] [CrossRef]
  37. Common Public Radio Interface: eCPRI V1.2 Interface Specification. 2018. Available online: https://www.cpri.info/downloads/eCPRI_v_1_2_2018_06_25.pdf (accessed on 14 October 2025).
  38. Esmaeily, A.; Mendis, H.V.K.; Mahmoodi, T.; Kralevska, K. Beyond 5G Resource Slicing with Mixed-Numerologies for Mission Critical URLLC and eMBB Coexistence. IEEE Open J. Comm. Soc. 2023, 4, 727–747. [Google Scholar] [CrossRef]
  39. Koenker, R.; Bassett, G.J. Regression Quantiles. Econometrica 1978, 46, 33–50. [Google Scholar] [CrossRef]
  40. Skocaj, D.; Dincic, M.; Bennesby, T.; Vukadinovic, V. TAILING: Tail Distribution Forecasting of Packet Delays Using Quantile Regression Neural Networks. In Proceedings of the ICC 2023—IEEE International Conference on Communications, Rome, Italy, 28 May–1 June 2023. [Google Scholar]
  41. ITU-T Technical Report. Transport Network Support of IMT-2020/5G. 2018. Available online: https://www.itu.int/hub/publication/t-tut-home-2018/ (accessed on 14 October 2025).
  42. Khorsandi, B.M.; Raffaelli, C. BBU location algorithms for survivable 5G C-RAN over WDM. Comput. Netw. 2018, 144, 53–63. [Google Scholar] [CrossRef]
  43. Lagen, S.; Giupponi, L.; Hansson, A.; Gelabert, X. Modulation Compression in Next Generation RAN: Air Interface and Fronthaul Trade-offs. IEEE Comm. Mag. 2021, 59, 89–95. [Google Scholar] [CrossRef]
  44. 3GPP. Study on New Radio Access Technology: Radio Access Architecture and Interfaces. Tech. Rep. TR 38.801, v14.0.0. 2017. Available online: https://portal.3gpp.org/desktopmodules/Specifications/SpecificationDetails.aspx?specificationId=3056 (accessed on 14 October 2025).
  45. IBM. CPLEX Optimizer. Available online: https://www.ibm.com/products/ilog-cplex-optimization-studio (accessed on 14 October 2025).
  46. Varga, A. OMNeT++ Discrete Event Simulator. Available online: https://omnetpp.org/ (accessed on 14 October 2025).
  47. Innovative Optical Wireless Network Global Forum. PoC Reference of Mobile Fronthaul over APN (ver. 2.0). 2024. Available online: https://iowngf.org/wp-content/uploads/2025/02/IOWN-GF-RD-PoC_Reference_of_MFH_over_APN-2.0.pdf (accessed on 14 October 2025).
Figure 1. Transmission and buffering of FH and MH packet bursts in uplink and downlink directions in a packet-switched Xhaul network.
Applsci 15 12487 g001
Figure 2. Xhaul transport network topologies assumed in analysis: RING-N and MESH-N.
Applsci 15 12487 g002
Figure 3. Data set generation workflow.
Applsci 15 12487 g003
Figure 4. Flow latencies in RING-N networks: measured, WC-estimated, and QR-predicted.
Applsci 15 12487 g004
Figure 5. Flow latencies in MESH-N networks: measured, WC-estimated, and QR-predicted.
Applsci 15 12487 g005
Figure 6. Evaluation scenario illustrating the reallocation of DUs and the adaptation of FH and MH routing paths as traffic load increases.
Applsci 15 12487 g006
Figure 7. Maximum fronthaul latencies in RING-N networks under varying traffic load ( ρ ), obtained for networks utilizing the QR model, assuming FH latency limits of (a) 75 μs and (b) 100 μs, compared with simulation results (Sim) and WC estimates.
Applsci 15 12487 g007
Figure 8. Maximum fronthaul latencies in MESH-N networks under varying traffic load ( ρ ), obtained for networks utilizing the QR model, assuming FH latency limits of (a) 75 μs and (b) 100 μs, compared with simulation results (Sim) and WC estimates.
Applsci 15 12487 g008
Figure 9. Average prediction accuracy of FH latencies as a function of traffic load ( ρ ), obtained with the WC and QR models for FH latency limits of 75 μs and 100 μs in (a) RING-N and (b) MESH-N networks.
Applsci 15 12487 g009
Figure 10. Average prediction accuracy of MH latencies as a function of traffic load ( ρ ), obtained with the WC and QR models for FH latency limits of 75 μs and 100 μs in (a) RING-N and (b) MESH-N networks.
Applsci 15 12487 g010
Figure 11. Average number of active PPs (bars) and relative reduction of PPs (lines) achieved with the QR model compared to the WC model in (a) RING-N and (b) MESH-N networks scenarios with different numbers of RUs (R).
Applsci 15 12487 g011
Figure 12. Average number of active PPs (bars) and relative reduction of PPs (lines) achieved with the QR model compared to the WC model under different traffic loads ( ρ ) in (a) RING-N and (b) MESH-N networks.
Applsci 15 12487 g012
Table 1. Parameters of network links.
LinkBit-Rate [Gbit/s]Length [km]
switch–RU25 [ 0.2 0.5 ]
switch–switch100 [ 1 3 ]
switch–PP400 [ 0.2 0.5 ]
switch–hub400 [ 10 15 ]
Table 2. Comparison of the R 2 score of WC and QR latency models in networks RING-N and MESH-N for numerologies μ { 1 , 2 } .
R 2  Score
FH MH
Network μ Model UL DL UL DL
RING-N1WC0.9520.9900.6330.012
QR0.9800.9930.9520.864
2WC0.9560.9910.8230.516
QR0.9860.9950.9720.929
MESH-N1WC0.9600.9900.7540.381
QR0.9840.9930.9440.873
2WC0.9180.9800.8840.480
QR0.9740.9910.9630.853
Table 3. Average prediction accuracy ( Δ ) of the WC and QR latency models for FH and MH flows in RING-N and MESH-N networks, evaluated for FH latency limits L F H { 75 , 100 } μs and numerologies μ { 1 , 2 } .
Model WCModel QRAbsolute Difference
Network L FH [μs] μ FH MH FH MH FH MH
RING-N7517%14%6%8%1%6%
210%10%7%5%3%5%
100113%19%11%12%2%7%
214%12%10%7%4%5%
MESH-N7516%8%5%6%1%2%
29%7%7%5%2%2%
100110%12%9%9%2%3%
214%9%11%7%4%2%
Table 4. Average performance gain, expressed as the reduction in active PPs achieved with the QR model compared to the WC model, in RING-N and MESH-N networks under different traffic loads ( ρ ) and FH latency limits L F H { 75 , 100 } μs.
Traffic Load ( ρ )
Network L FH [μs] 0.1 0.2 0.3 0.4 0.5 0.6 0.7 0.8 0.9 1.0
RING-N754%3%3%4%3%2%2%3%3%2%
1004%11%6%5%4%2%3%2%1%2%
MESH-N753%3%5%5%6%6%6%6%6%6%
1005%8%4%4%4%4%4%4%4%4%
Table 5. Average performance gain, expressed as the reduction in active PPs achieved with the QR model compared to the WC model, in RING-N and MESH-N networks under different traffic loads ( ρ ) and numerologies μ { 1 , 2 } .
Traffic Load ( ρ )
Network μ 0.1 0.2 0.3 0.4 0.5 0.6 0.7 0.8 0.9 1.0
RING-N16%5%4%4%3%1%1%2%3%2%
21%9%5%4%4%3%4%3%1%1%
MESH-N15%2%2%3%5%4%4%4%4%3%
23%9%10%8%7%8%8%8%8%8%
Disclaimer/Publisher’s Note: The statements, opinions and data contained in all publications are solely those of the individual author(s) and contributor(s) and not of MDPI and/or the editor(s). MDPI and/or the editor(s) disclaim responsibility for any injury to people or property resulting from any ideas, methods, instructions or products referred to in the content.