Article

Factors Influencing the Seismic Collapse of Stratified Steep Cliffs Based on Analytic Hierarchy Process (AHP)

1
College of Transportation Engineering, Nanjing Tech University, Nanjing 210009, China
2
College of Civil Engineering, Kashi University, Kashi 844000, China
*
Author to whom correspondence should be addressed.
Appl. Sci. 2025, 15(23), 12485; https://doi.org/10.3390/app152312485
Submission received: 22 October 2025 / Revised: 15 November 2025 / Accepted: 18 November 2025 / Published: 25 November 2025
(This article belongs to the Special Issue Novel Insights into Rock Mechanics and Geotechnical Engineering)

Abstract

Rockfalls from stratified unstable rock masses on cliffs present a significant geological hazard. This study investigates their seismic failure mechanisms and quantifies the influence of key controlling factors through an integrated approach of shaking table tests and UDEC numerical simulations. The introduction of a displacement angle precisely defined failure initiation, with tests revealing that the collapse angle exhibited a strong positive correlation with block size. Numerical simulations on seven factors showed that the collapse displacement angle ranged from 9° to 21°, primarily controlled by joint spacing. The Analytic Hierarchy Process (AHP) quantified the factor priorities, identifying the degree of rock mass fragmentation as the most influential factor with a weight of 0.278, followed by seismic amplitude (0.222) and cliff slope angle (0.167). The results provide a quantitative basis for designing early-warning systems using displacement angle thresholds and prioritize targeted mitigation strategies for the most critical factors in seismic-prone regions.

1. Introduction

Cliff-layered hazardous rock (Figure 1) is a distinctive landform commonly found in river valleys, primarily formed by river incision into near-horizontal or gently dipping sedimentary strata. Hazardous rock refers to rock masses and their combinations located on cliffs or slopes, cut by multiple structural planes and exhibiting poor stability. Their collapse refers to the sudden detachment and rapid descent of these unstable rock masses from their parent rock under self-weight or external forces. As one of the three major geological hazards in mountainous regions, this phenomenon exhibits significant suddenness and destructiveness [1]. Along cross-border transportation corridors like the China–Pakistan Highway, large-scale collapses of rock mass groups represent an extremely hazardous geological disaster type. Owing to their sudden onset and brief duration, they frequently pose severe threats to transportation and infrastructure safety, directly testing the resilience and disaster prevention capabilities of critical cross-border facilities. Given the instantaneous nature and destructive power of such disasters, systematic research into the internal and external controlling factors of rockfall and their respective influence weights has become an urgent necessity for scientific prevention, control, and risk mitigation.
The collapse behavior of cliff-like layered unstable rock masses under seismic loading is governed by the complex interaction among multiple factors, which can be systematically categorized into: (1) geological conditions (e.g., intact rock strength, and rock mass structure defined by joint orientation, spacing, and persistence); (2) topographic features (e.g., slope height and gradient); and (3) environmental triggers (e.g., seismic loading, rainfall infiltration, and hydrogeological conditions) [1,2,3]. In recent years, scholars have made significant progress in studying the failure mechanisms of unstable rock masses, focusing on slope deformation displacement [4,5,6,7,8], dynamic response amplification effects [9,10,11], and instability failure patterns [12,13,14,15,16,17,18]. Frodella W et al. monitored rockfall from cliffs formed after rock mass collapses by integrating multiple remote sensing technologies, providing an in-depth explanation of their pre-collapse precursors and post-disaster deformation mechanisms [19], Arnold L. et al. Researched the complex interdependence between the dynamic response of unstable rock masses and damage accumulation necessitates further investigation into controlling factors such as rock mass strength, slope geometry, and failure motion characteristics [20]. However, regarding the multi-factor coupling mechanisms of earthquake-induced collective rockfall, a clear hierarchy of influencing factors has yet to be established. This ambiguity hinders the identification of critical issues in practical mitigation efforts.
Constrained by the difficulty of realistically reproducing seismic dynamic processes in field experiments, vibration table model tests and numerical simulations have become essential methods for studying the dynamic response of unstable rock masses. The RocFall software has been increasingly adopted by numerous Chinese scholars for simulating rock slope [21,22,23,24,25,26,27,28,29,30,31,32], while tools like RocFall are highly effective for simulating the kinematic trajectories of detached rockfalls, they are inherently limited in modeling the pre-failure fracture mechanisms of the rock mass. Xu et al. [33] systematically investigated the weighting of multiple factors—including slope height, slope gradient, rock layer thickness and dip angle, dynamic load amplitude and frequency, high water level elevation, and its degradation range and morphology—in the Three Gorges Reservoir area. This study integrated field surveys, shake table tests, and UDEC numerical simulations using the Orthogonal Analysis Method (OAM). Borgeat et al. [34] analyzed factors such as resonance frequency of unstable rock masses, site amplification ratio, and seismic wave velocity variations through long-term monitoring of environmental vibration data, employing enhanced frequency domain decomposition and site-reference spectrum ratio techniques. They found a seasonal time lag between temperature changes and wave velocity, while the effects of snowmelt and rainfall were relatively minor. Fattahi et al. [35] analyzed using EasyKBT software that the degree of fragmentation and block height are the most critical parameters affecting stability. Liu et al. [36] assessed cliff stability using the limit equilibrium method, emphasizing that heavy rainfall and earthquakes are the primary triggers for rockfall. Although these studies reveal various influencing factors of rockfall instability from different perspectives, they lack systematic and comprehensive approaches. They fail to clarify the hierarchical relationships among multiple factors, making it difficult to provide direct theoretical support for practical rockfall mitigation projects. Therefore, establishing a prioritization system for influencing factors is urgently needed to guide engineering practices in addressing primary contradictions and achieving efficient prevention and control.
In recent years, the introduction of the Analytic Hierarchy Process (AHP) [37], a multi-criteria decision-making method developed by Saaty in the 1970s [38] and subsequently refined, has provided new avenues for studying the weighting of influencing factors and demonstrated significant advantages in investigating the collapse mechanisms of cliff-layered unstable rock masses. Deng F. et al. [39] developed a cloud model based on three-dimensional geological modeling and AHP for regional underground space geological suitability assessment. Liu Y. et al. [40] employed an AHP-Fuzzy Comprehensive Evaluation (AHP-FCE) model to systematically analyze three primary factors and twelve secondary factors influencing rockfall, determining the weight of each factor through AHP. Zhang R. et al. [41] combined AHP with the Entropy Weight Method (EWM) to construct a fuzzy comprehensive evaluation secondary model for complex dynamic disasters, effectively overcoming the issues of incomplete indicators and strong subjectivity in weighting within traditional evaluations; Dong F. et al. [42] established an evaluation system for surrounding rock stability encompassing three primary indicators and 21 secondary indicators. This system comprehensively considered multidimensional factors, including deformation, engineering, and geology. The combined weighting method of AHP-EWM was employed to calculate the indicator combination weights at key nodes; Liu X. et al. [43] integrated UDEC numerical simulation with GIS technology, employing the AHP-CV (Coefficient of Variation) combined weighting method to effectively quantify nine key indicators—including elevation, slope gradient, slope aspect, and NDVI—in rockfall events along Changbai County highways. These studies consistently demonstrate that AHP and its derivative weighting methods hold significant value in identifying the weighting factors influencing the collapse of cliff-layered unstable rock masses. This provides a reliable methodological support for clarifying the hierarchical relationships among the influencing factors of unstable rock mass collapse in this research.
Despite progress in related research, two critical scientific issues remain unresolved in the field of cliff-layered rockfall: (1) a systematic synthesis of influencing factors and the establishment of a scientific classification system are lacking; (2) effective quantitative characterization of the influence weights of key factors such as topography, lithological characteristics, geological structures, and triggering factors is absent. To address these issues, this study innovatively proposes a three-dimensional multiscale research approach integrating “physical testing-numerical simulation-impact weighting”. Furthermore, while some previous studies have utilized shaking tables or AHP in isolation, a clear hierarchy of influencing factors governing the coupled effects of structural geometry (e.g., joint spacing defining fragmentation), topographic features, and seismic loading for collective rockfall was still lacking. Therefore, this study aims to answer the following core research question: “How do structural and dynamic parameters jointly control the initiation and progression of group collapse in stratified rock masses during earthquakes?”
To address this question, the paper is structured as follows: Section 2 details the shaking table model tests and the analysis based on the displacement angle. Section 3 presents the UDEC numerical simulations investigating the impact of seven key factors on collapse modes and timing. Section 4 employs the Analytic Hierarchy Process (AHP) to quantify the weight of each influencing factor. Section 5 discusses the engineering implications and limitations of the study, and Section 6 summarizes the main conclusions. The research outcomes are expected to deepen understanding of the mechanisms governing earthquake-induced mass rockfall in steep, layered cliffs, providing a scientific basis and technical support for geological hazard prevention and control in major infrastructure projects along the Belt and Road.

2. Small Shaker Model Tests

2.1. Test Equipment and Materials

Plexiglas was used to fabricate three sizes of cubic molds (side lengths of 1.5 cm, 3 cm and 5 cm), casting more than 4000, 800 and 250 rock models, respectively, to simulate critical rock bodies with different degrees of fragmentation. The rock blocks were fabricated from a common cement–mortar mixture, primarily composed of Ordinary Portland Cement, fine sand, and water. The mixture proportion by weight was cement:sand:water = 1:2:0.45. This mix was designed to simulate the brittle failure behavior of weak to medium-strength rock. The key physical and mechanical parameters of the analog material, determined through standard laboratory tests (uniaxial compression, direct shear) on representative samples, are summarized in Table 1. The vibrating table surface was made of a 398 mm × 598 mm × 10 mm plexiglass base plate and was installed in the position of the original shear model box. To construct a support structure for the critical rock mass, a 300 mm × 600 mm × 20 mm plexiglass baffle was used; the two plates were connected through a loose leaf and reinforced with two hollow steel tubes at the back to prevent loosening due to vibration. It is acknowledged that the rigid plexiglass boundary may cause wave reflections, which could potentially amplify the seismic input to the model. However, as this study focuses on the comparative analysis of failure initiation and patterns under consistent boundary conditions, and the primary failure mechanism is overturning driven by inertial forces rather than complex wave propagation within the mass, the influence of this effect on the primary conclusions regarding factor influence is considered secondary. During the test, the seismic wave parameters were input through the computer, and a video camera was used to record the whole collapse process (Figure 2).
The model test was designed based on the Froude similarity law, which governs physical processes where gravitational forces are dominant. The scaling relationships for key physical quantities, derived from the Froude similarity law and the requirement for constitutive relation similarity, are summarized in Table 2.

2.2. Test Methods

On the basis of the tectonic characteristics of blocky hazardous rocks in cliffs, this study adopts a simplified test framework that focuses on four major influencing factors: hazardous rock fragmentation, joint inclination, hazardous rock height and seismic intensity. Cube models of different sizes were used to simulate the degree of hazardous rock fragmentation: 1.5 cm (severely fragmented), 3 cm (moderately fragmented) and 5 cm (mildly fragmented). The knuckle inclination (60°, 70°, 80°, and 90°) was adjusted by means of a Plexiglas plate connected by a loose leaf, and different stacking heights (27 cm, 30 cm, 33 cm, and 36 cm) were used to simulate the size of the critical rock mass. Seismic loads were applied by a shaking table using a sinusoidal waveform. Different Peak Ground Accelerations (PGA) of 0.05 g, 0.1 g, and 0.2 g were simulated, with the specific combinations of frequency (f) and amplitude (A) for each PGA level detailed in Table 3. The input excitation was applied unidirectionally, parallel to the slope face, to simulate the most critical loading direction for toppling failure. While real earthquakes are multi-directional, this simplification is standard practice for isolating and understanding the fundamental failure mechanism in a controlled manner. The tests were completed by relying on the shaking table system at the Institute of Geotechnical Engineering, Nanjing Tech University, to ensure that the test conditions were consistent with the actual engineering background [44,45,46,47,48,49,50,51]. Each test in the scheme was repeated twice to ensure the reproducibility of the collapse process and the consistency of the measured displacement angle.

2.3. Test Scheme

During the pretest stage, the most representative test conditions were determined by testing several sets of parameter combinations. The model demonstrated good stability and representativeness when 3 cm blocks (stacked to a total height of 30 cm), a nodal plate inclination angle of 80°, and a vibration intensity of 0.1 g were used. This parameter set was thus defined as the baseline condition (Case B in Table 3). A total of 11 comparative test groups were then designed using the one-way variable method, encompassing variations in block size, stacking height, nodal angle, and vibration intensity, as detailed in Table 4.
The one-variable-at-a-time (OVAT) approach was adopted in this preliminary experimental phase to efficiently and clearly identify the individual effect of each primary factor on the collapse behavior. It is acknowledged that this method does not capture potential interaction effects between parameters, which could be a focus of more advanced factorial design studies in the future. The tests were conducted in a systematic sequence, beginning with the baseline condition and then progressing through groups of tests where one parameter was varied at a time. This systematic approach ensured consistent initial conditions for each comparative group and facilitated a clear interpretation of the results.

2.4. Test Analyses

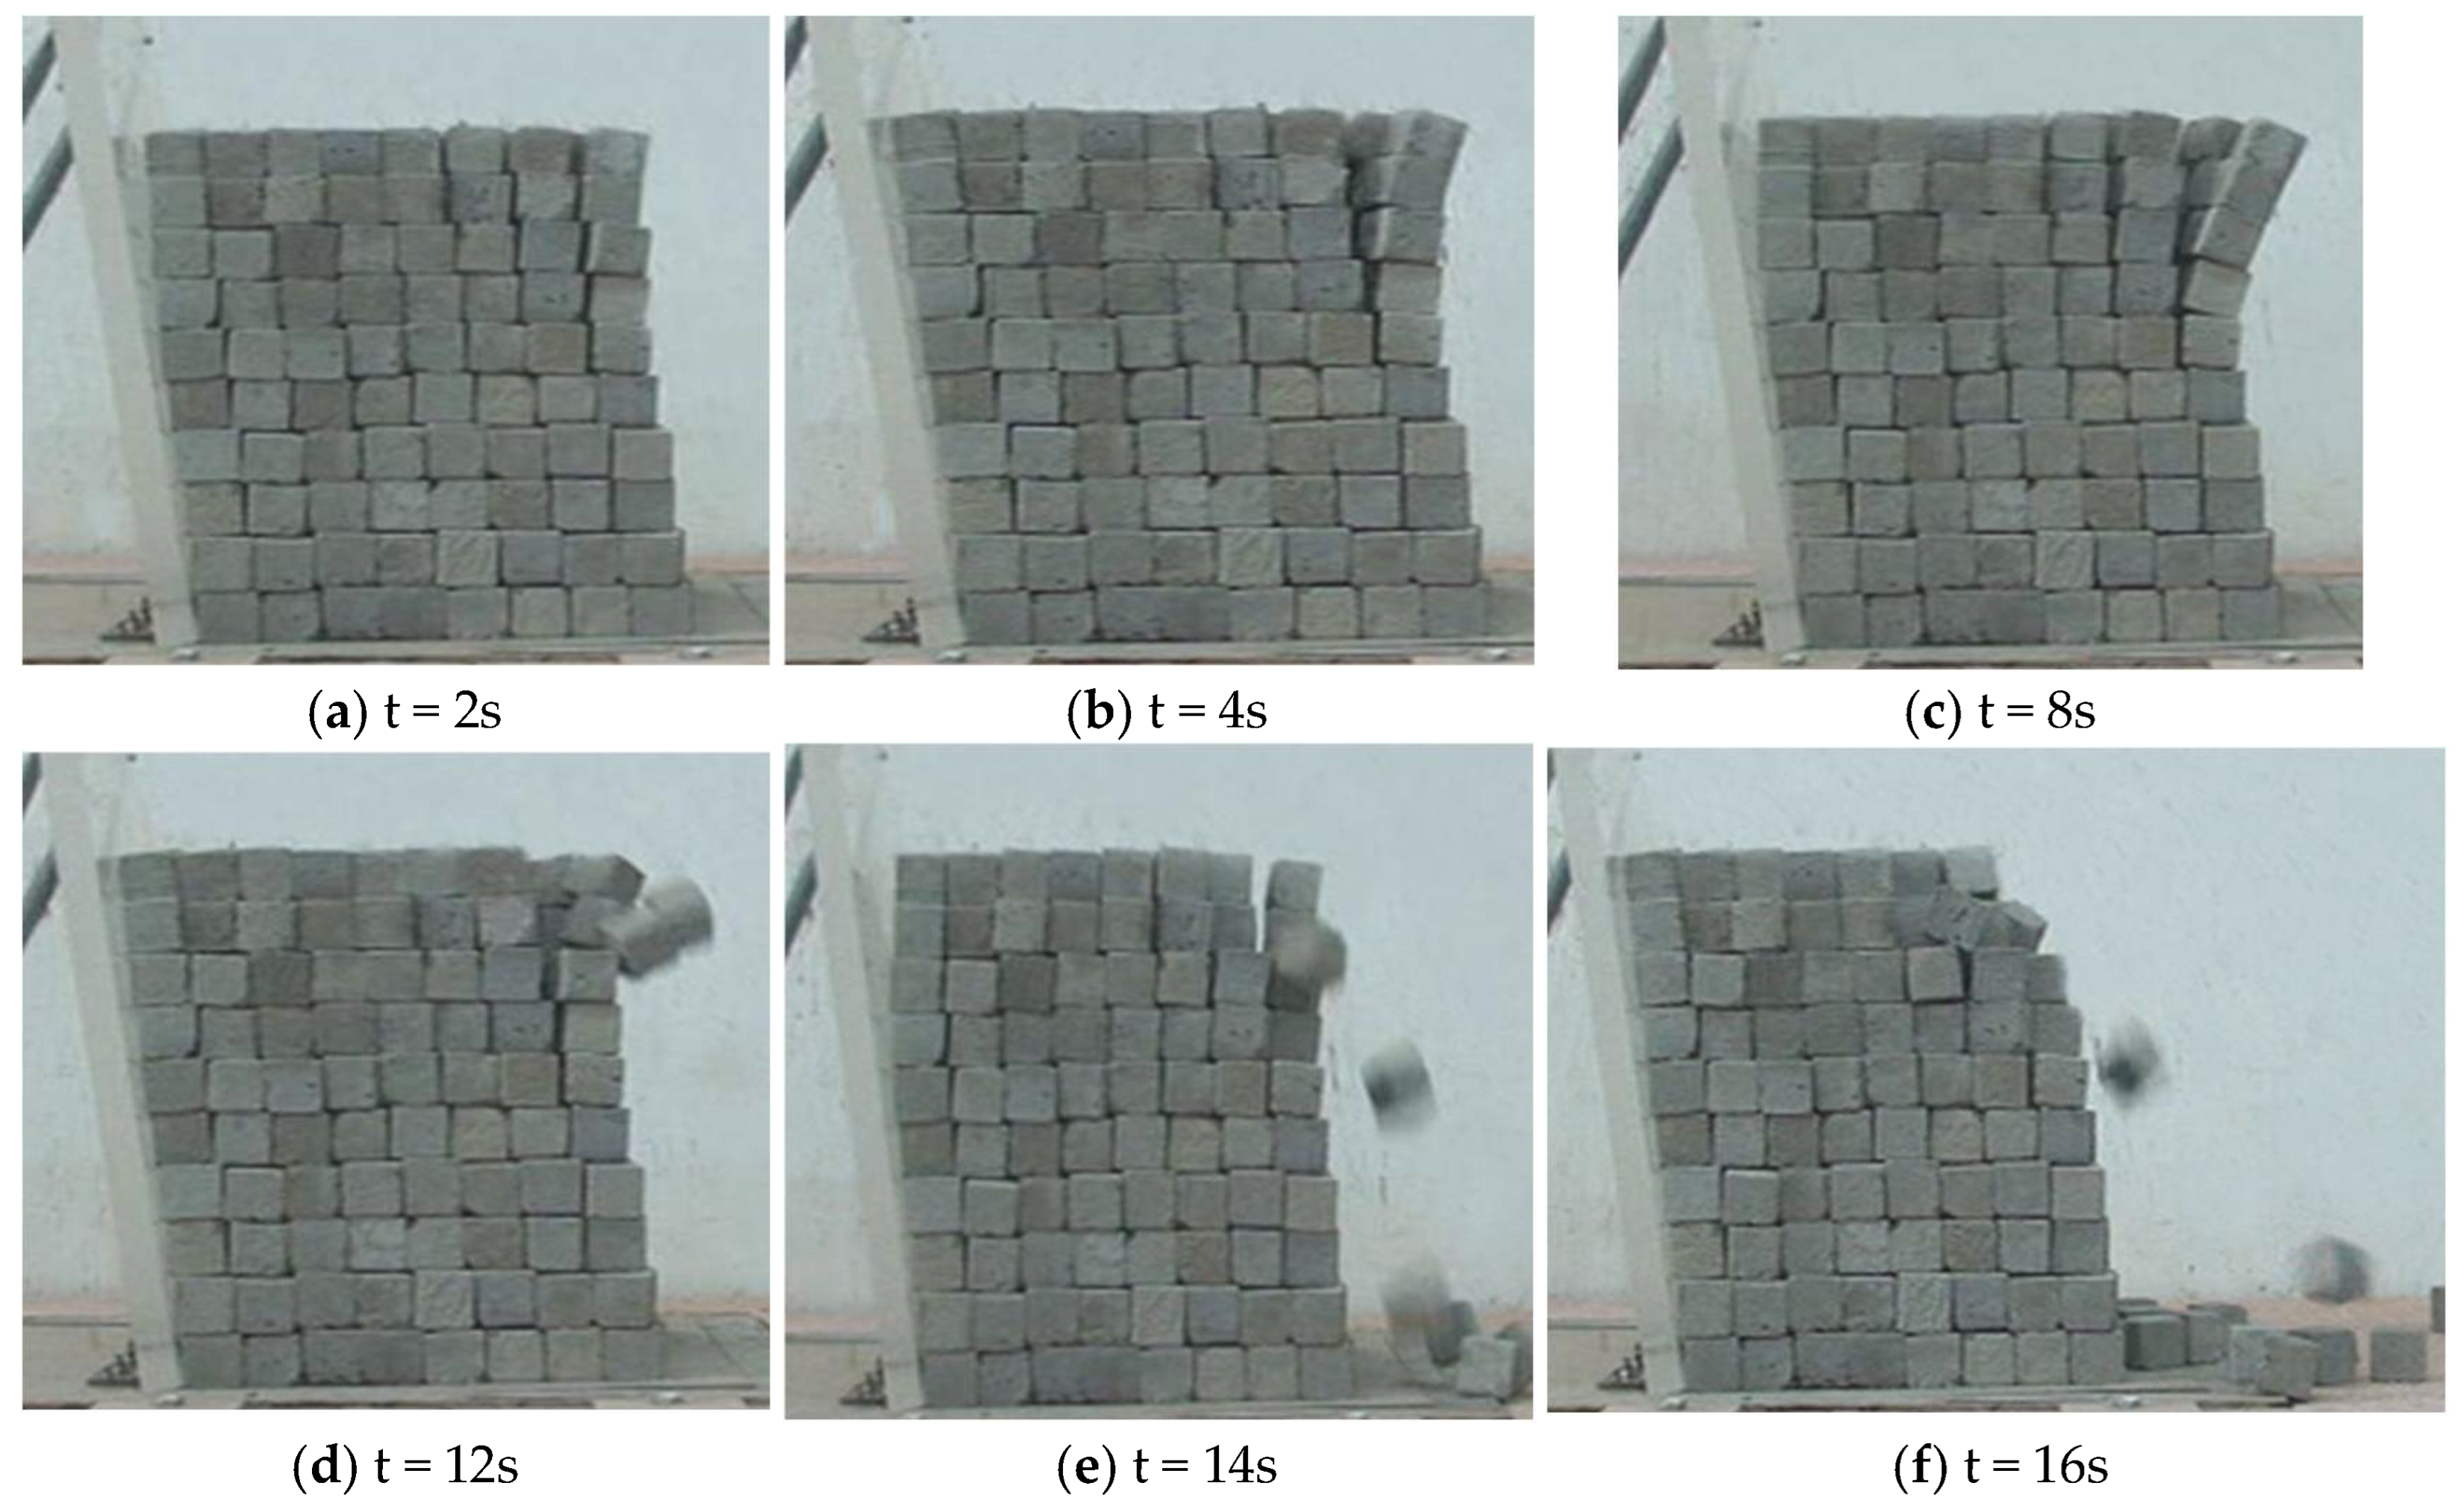
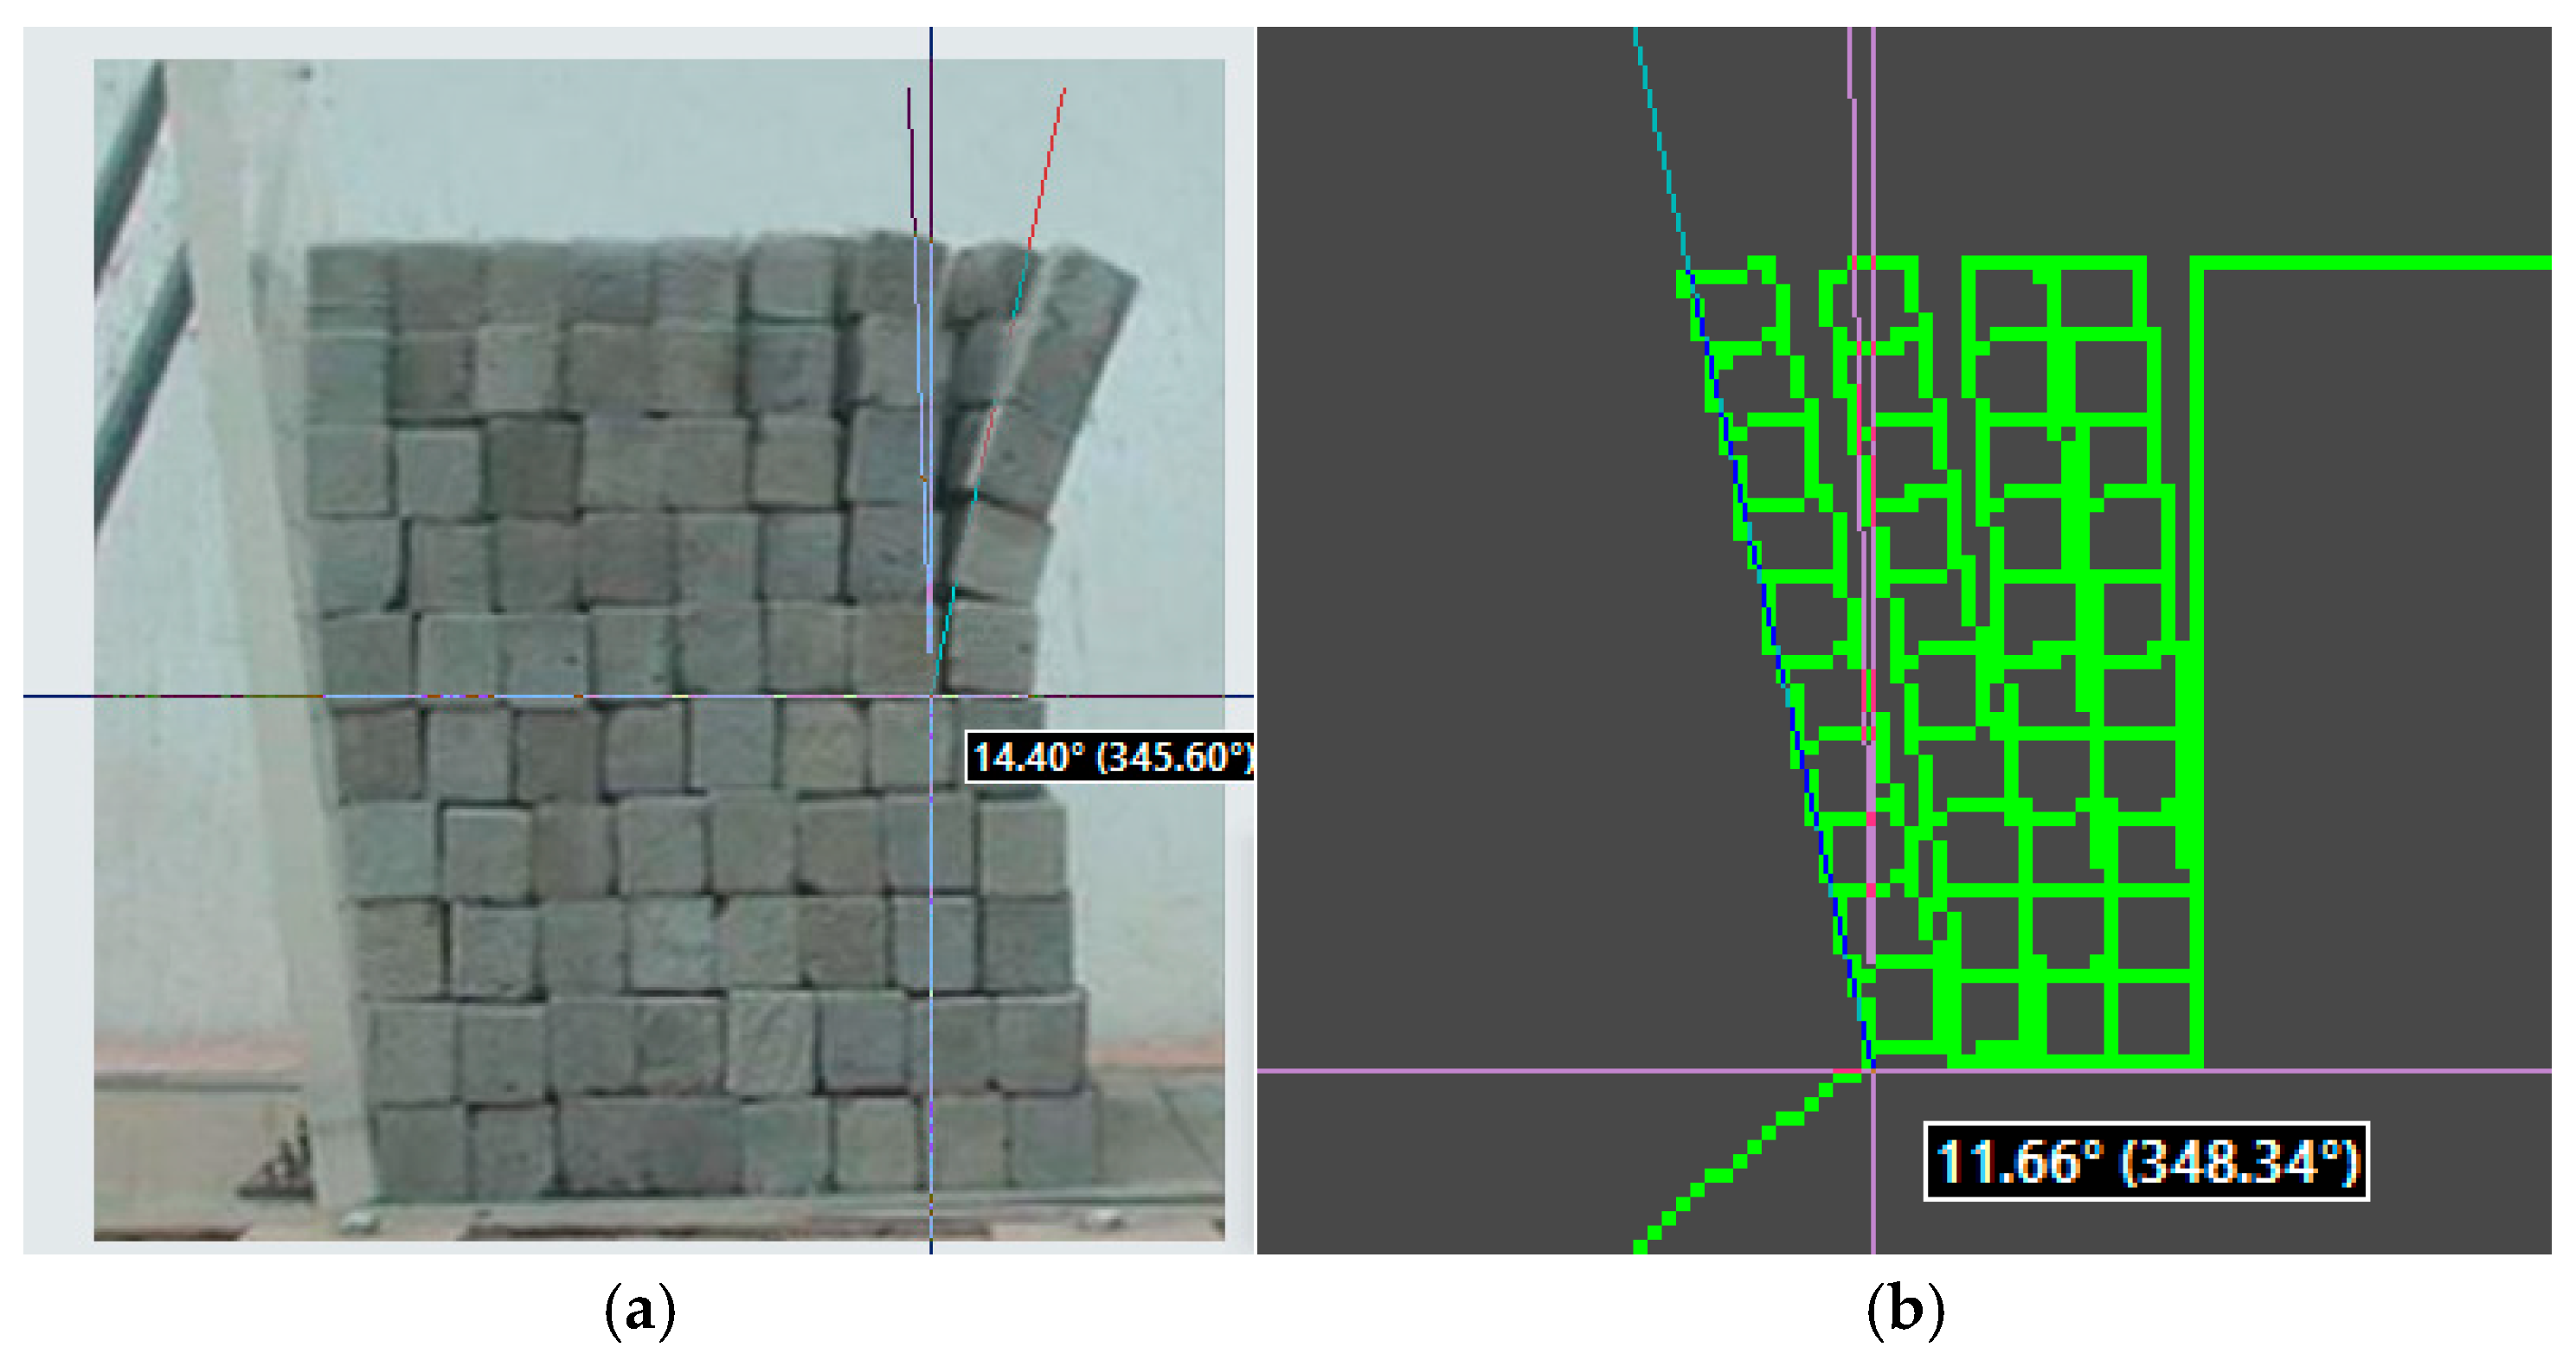
From the shaker model test, observations indicate that collapse usually starts at the top of the block at the outermost edge of the hazardous rock body (Figure 3) and then gradually expands. To quantitatively characterize this failure initiation, we introduce the displacement angle. As schematically defined in Figure 4a, it is the angle between the major axis of the outermost rocking rock column and the original (pre-vibration) joint line. This angle was directly measured from high-frequency video recordings of the tests using the image analysis software PickPick 5.1.3, which provides precise angular measurements on screenshots. The use of the displacement angle as a criterion for collapse has significant advantages: (1) it helps eliminate the effects of height differences and achieve a uniform evaluation of blocks at different locations; (2) compared with displacement monitoring, the range of changes in the angular parameter is more concentrated, which enables a more accurate identification of the critical point of collapse. Therefore, in this study, the displacement angle is used as a key index to assess the stability of a block.
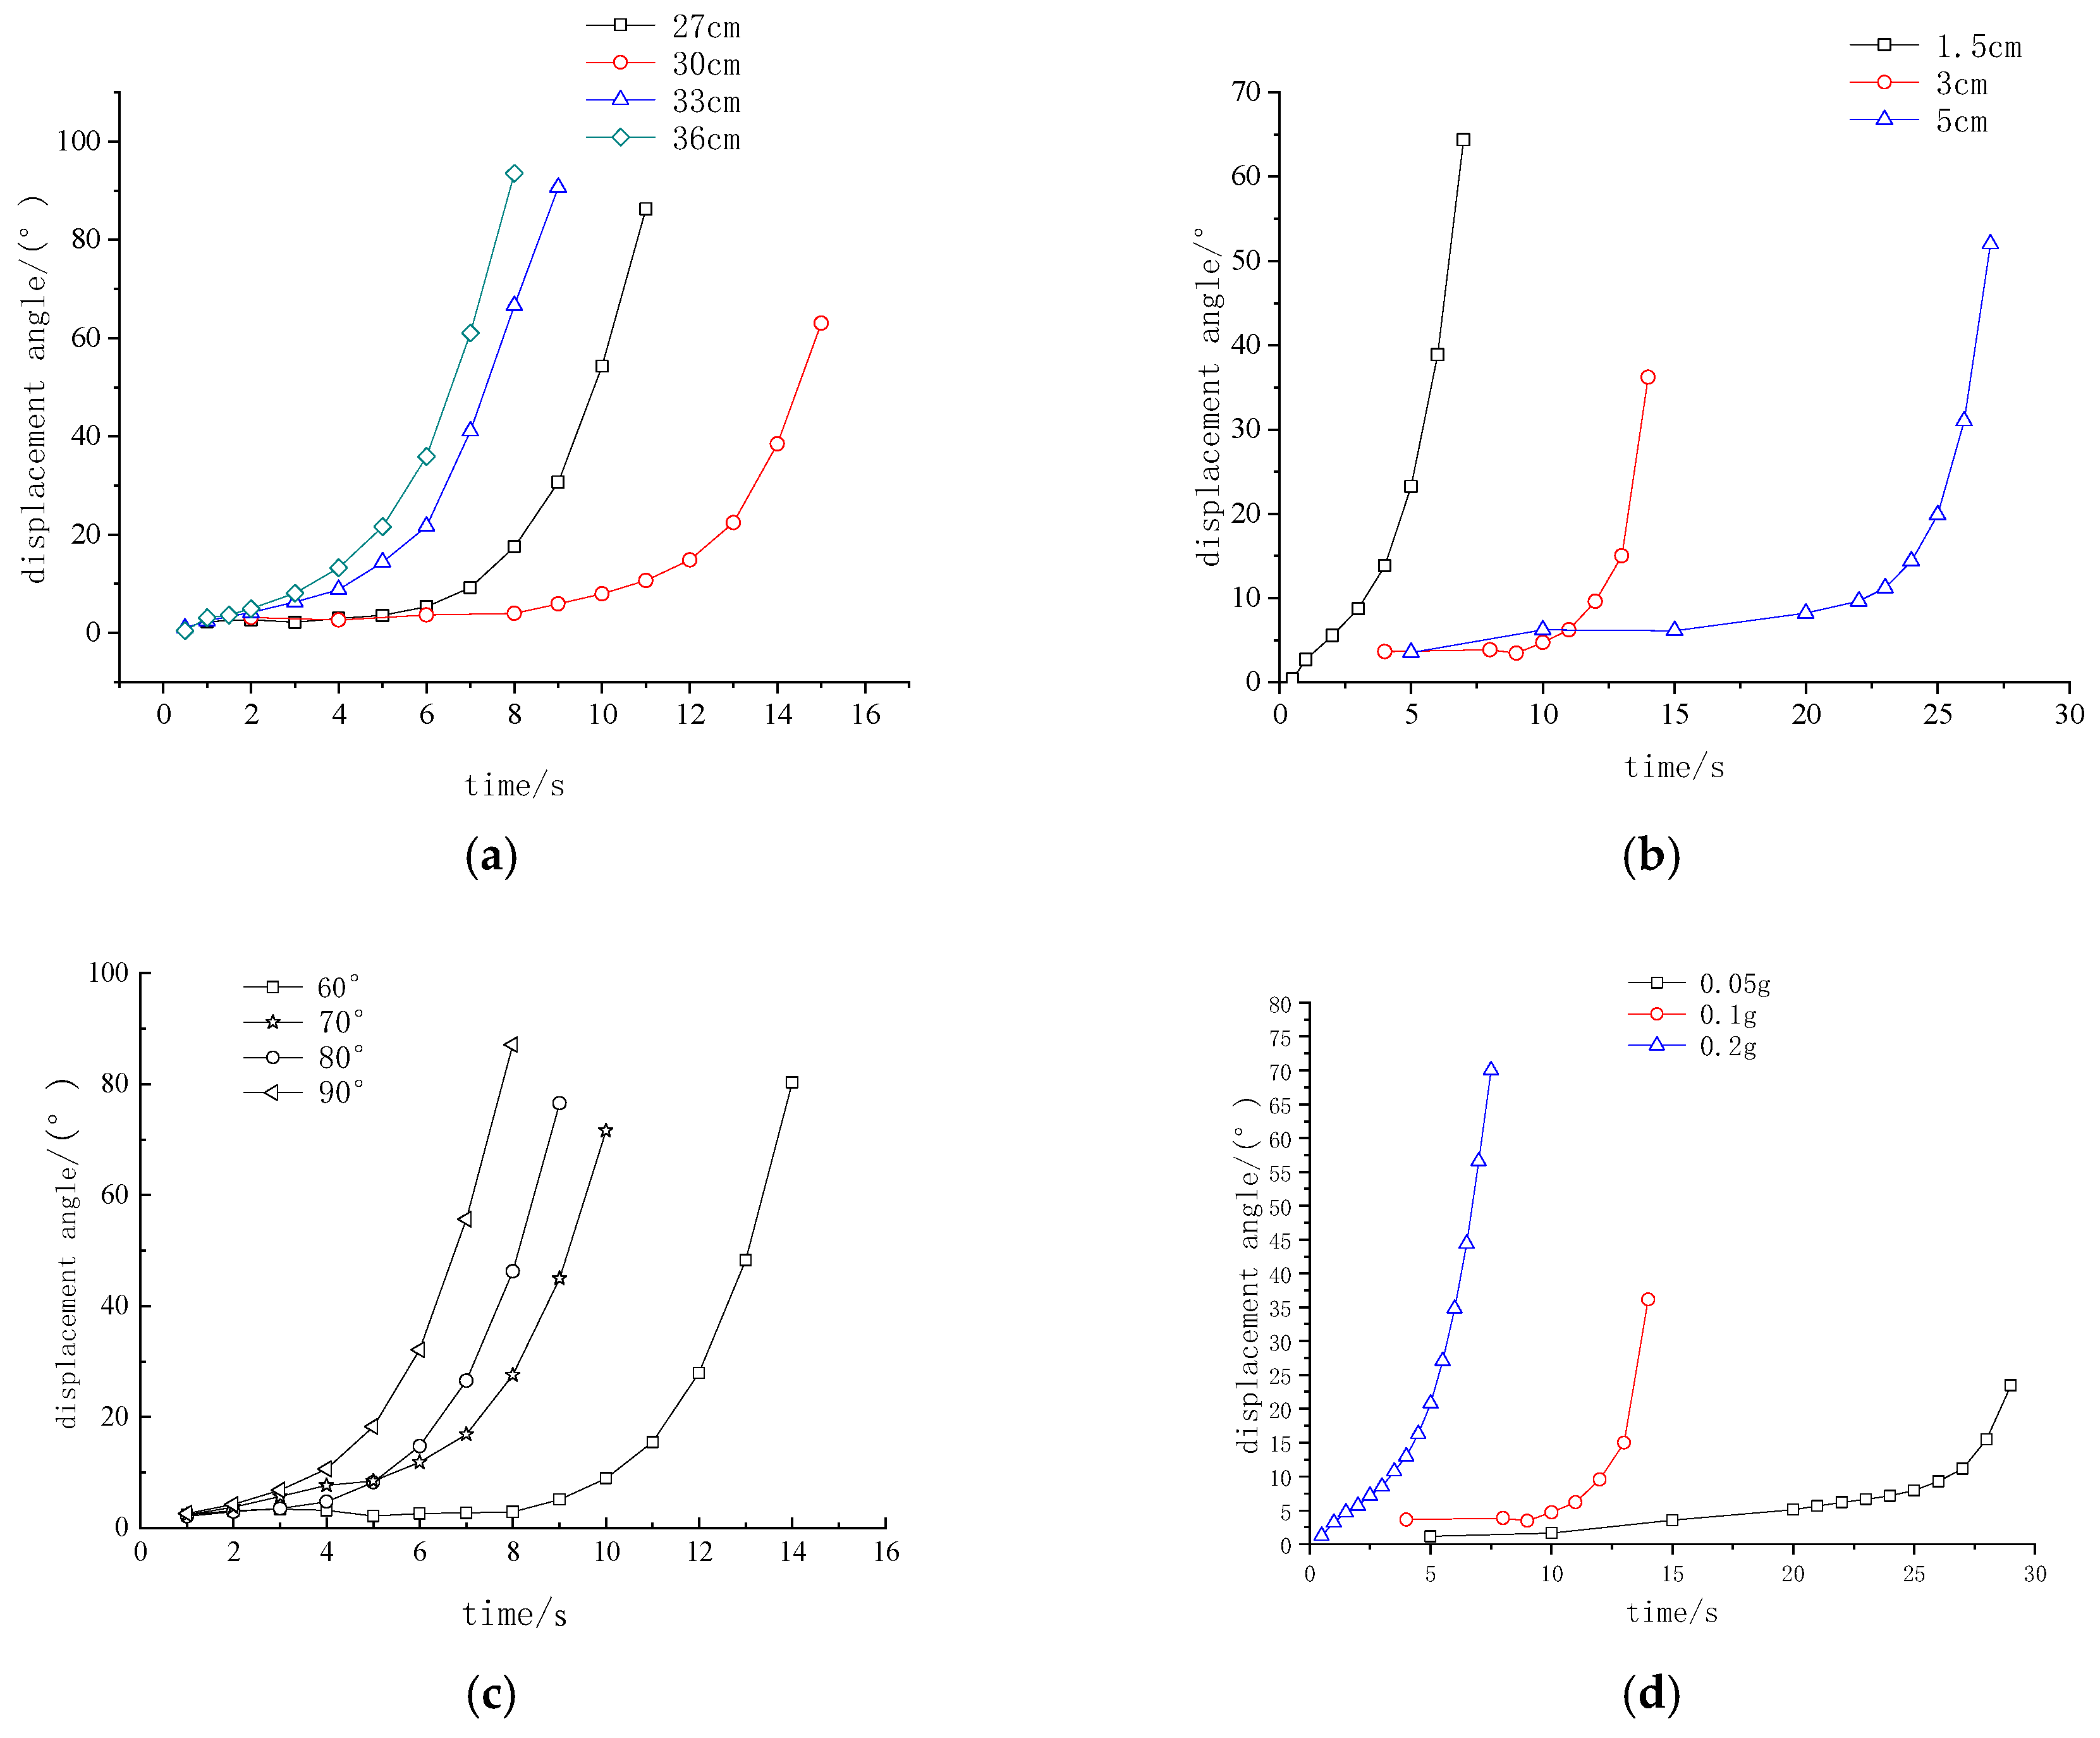
After opening the screenshot, launch the Pickpick software. Select the protractor function, and the software will automatically hide. Click the angle vertices on the screenshot, then drag out the two angle sides. The software will directly display the angle values. Figure 4b illustrates the practical measurement screen of the software, obtaining the displacement angle value directly at any moment before the collapse. The time–history curve of the displacement angle (Figure 5) was constructed from such measurements. The inflection point of this curve, where the angle begins to rapidly increase, was identified as the collapse initiation time, and the corresponding angle value was recorded as the collapse displacement angle.
The test results, based on the average of two replicates for each condition, reveal a significant correlation between the collapse angle and the influencing factors (Figure 5). Specifically, the mean collapse angles for block sizes of 1.5 cm, 3 cm, and 5 cm were 8.8° ± 0.3°, 11.2° ± 0.5°, and 15.1° ± 0.4°, respectively, showing a strong positive correlation, which were obviously positively correlated; the collapse angles corresponding to the hazardous rock heights (27–36 cm) and the joint angles (60–90°) fluctuated within the ranges of 10–18° and 14–16°, respectively, without obvious monotonic changes. The seismic intensity (0.05–0.2 g), on the other hand, caused the collapse angle to vary between 9 and 15°. Analysis of the collapse angles reveals a clear trend: the displacement angle at failure is not a fixed value but varies systematically with the influencing factors. Specifically, the collapse angles under the tested conditions predominantly fell within a range of approximately 9° to 18°, with values around 15° being a representative outcome for several key configurations, particularly those involving lower fragmentation degrees (larger block sizes). Among all factors, the degree of rock fragmentation demonstrated the most stable and pronounced relationship, exhibiting a strong positive correlation with the collapse angle.
A comprehensive analysis revealed that the degree of hazardous rock fragmentation is the most critical factor affecting collapse. This parameter quantitatively captures the cumulative damage to the rock mass structure from the synergistic weathering processes characteristic of the Kashi region along the China–Pakistan Highway. The region experiences intense thermal cycling (from both large diurnal and seasonal temperature variations), as well as potent, albeit episodic, freeze–thaw actions driven by limited precipitation. These processes, combined with physical shaking from frequent minor seismicity, progressively generate and widen discontinuities, leading to increased fragmentation. This factor demonstrated a stable and positive correlation with the collapse angle, whereas the influences of other factors were relatively complex and nonlinear. This result underscores that for engineering protection in such environments, strategies aimed at mitigating the effects of these specific weathering processes—for instance, by sealing cracks to reduce water infiltration for freeze–thaw prevention—are paramount. This result suggests that long-term effective weathering prevention measures should be prioritized in practical engineering protection to significantly reduce the risk of dangerous rock failure. Moreover, the collapse angle threshold of 15° can provide an important reference basis for engineering monitoring and early warning.
The observed displacement angle threshold (e.g., the representative value of 15° for larger blocks) has a clear physical meaning: it marks the transition of the rock column from a recoverable rocking state to an irreversible toppling failure. The rapid increase in the angle signifies that the column’s center of gravity has moved beyond its base of support, constituting the actual physical onset of collapse. Therefore, monitoring the displacement angle provides a direct and mechanically sound precursor for collapse warning.

3. Two-Dimensional (2D) UDEC Numerical Simulation

UDEC (Universal Distinct Element Code), as a numerical analysis tool specifically designed to simulate the mechanical behavior of discontinuous media in two dimensions, can effectively model the deformation and failure processes of structural surfaces such as joints and fractures in rock masses under static and dynamic loading. Based on vibration table model tests and geological survey data of unstable rockfall sites along the China–Pakistan Highway, this study employs UDEC to systematically analyze the influence mechanisms of key parameters—including rock mass fragmentation, block height, joint dip angle, and seismic intensity—on the stability of such unstable rock masses. Surveys indicate that cliff heights in the study area primarily range from 50 to 140 m (average 86 m), with slopes generally reaching 70° to 90°. Unstable rock masses typically exhibit zonal distribution along cliffs, forming unstable rock blocks cut by structural planes. Based on volume scale, they can be categorized as: super-large (>1000 m3), large (100–1000 m3), medium (10–100 m3), small (1–10 m3), and rockfall (<1 m3). Research indicates that the vast majority of rockfalls occur on steep slopes with gradients exceeding 45°, and unstable rock masses are typically present at heights exceeding 20 m—collapses are extremely rare below this threshold.

3.1. Generalization of Geometric Models and Parameter Selection

This numerical simulation establishes a numerical model of cliff rockfall using the discrete element method software UDEC (a two-dimensional code) (as shown in Figure 6). The UDEC model was constructed at prototype scale to directly represent the in situ cliff geometry and to avoid potential scaling issues related to material properties and stress levels. The base of the model was fixed in both vertical and horizontal directions. To minimize wave reflection artifacts from the lateral boundaries, free-field boundary conditions were applied to the left and right sides of the model. The rock blocks were discretized into a finite difference mesh with an average element size of 0.5 m, which was determined to be sufficiently fine to capture stress concentrations and block deformation accurately. Rayleigh damping was employed with a minimum damping ratio of 2% set at the central frequency of the input seismic wave to account for material energy dissipation. The UDEC model simulates the behavior of a weakly cemented sedimentary rock mass (e.g., sandstone or siltstone), which is typical of the stratified cliffs along the China–Pakistan Highway. This lithological assumption is consistent with the observed field failure modes. The mechanical parameters for the intact rock blocks and the discontinuities (joints and bedding planes) used in the simulation are summarized in Table 5. These parameters were selected based on values for weak rock reported in the authoritative rock mechanics literature [52,53] and are considered appropriate for modeling large-scale, structurally controlled failures where the geometry and strength of discontinuities are the dominant factors.
The symbols and meanings of each factor are listed in Table 6. The study aims to investigate the influence of seven key factors on the precursor characteristics preceding group failure in overturning-type rockfalls. The model is based on a plane-strain assumption, which is appropriate for simulating the cross-sectional failure mechanisms of the stratified rock mass under investigation.

3.2. Model Validation Against Experimental Results

To validate the reliability of the UDEC model, a simulation was conducted under conditions equivalent to the baseline shaking table test (Case B: 3 cm blocks, 30 cm height, 80° nodal angle, 0.1 g PGA). The numerical model was scaled accordingly, and a sinusoidal input motion matching the test frequency was applied.
A comparison between the experimental and numerical results is presented in Figure 7. The failure mode observed in the simulation—characterized by the initial toppling of the outermost column at the top, followed by progressive collapse—closely matches the physical test observations (compare Figure 7a,b). Furthermore, the time–history of the displacement angle derived from the experimental and numerical exhibits a similar trend to the experimental curve, with a critical displacement angle around 11–15°. The quantitative agreement in both the failure pattern and the key precursor parameter confirms that the numerical model is capable of effectively capturing the essential physics of the seismic collapse process, thereby validating its use for the parametric study.

3.3. Research on Influencing Factors in Rockfall

A total of 28 distinct numerical simulations were performed according to the scheme in Table 6 to systematically investigate the seven key factors. The parameter intervals (e.g., H1 from 40 to 100 m, β from 60° to 90°) were selected to cover the typical ranges observed in field surveys along the China–Pakistan Highway (see Section 3.1) and to capture potential nonlinear behavioral thresholds within these practical limits.
Through numerical simulation methods, this study systematically investigates the collapse mechanisms of stratified unstable rock masses on cliffs under seismic action. It aims to reveal the quantitative influences of seven key parameters on failure modes (such as toppling and sliding) and the initiation time of collapse, with particular focus on evaluating the effects of these seven controlling factors on the patterns of the collapse.
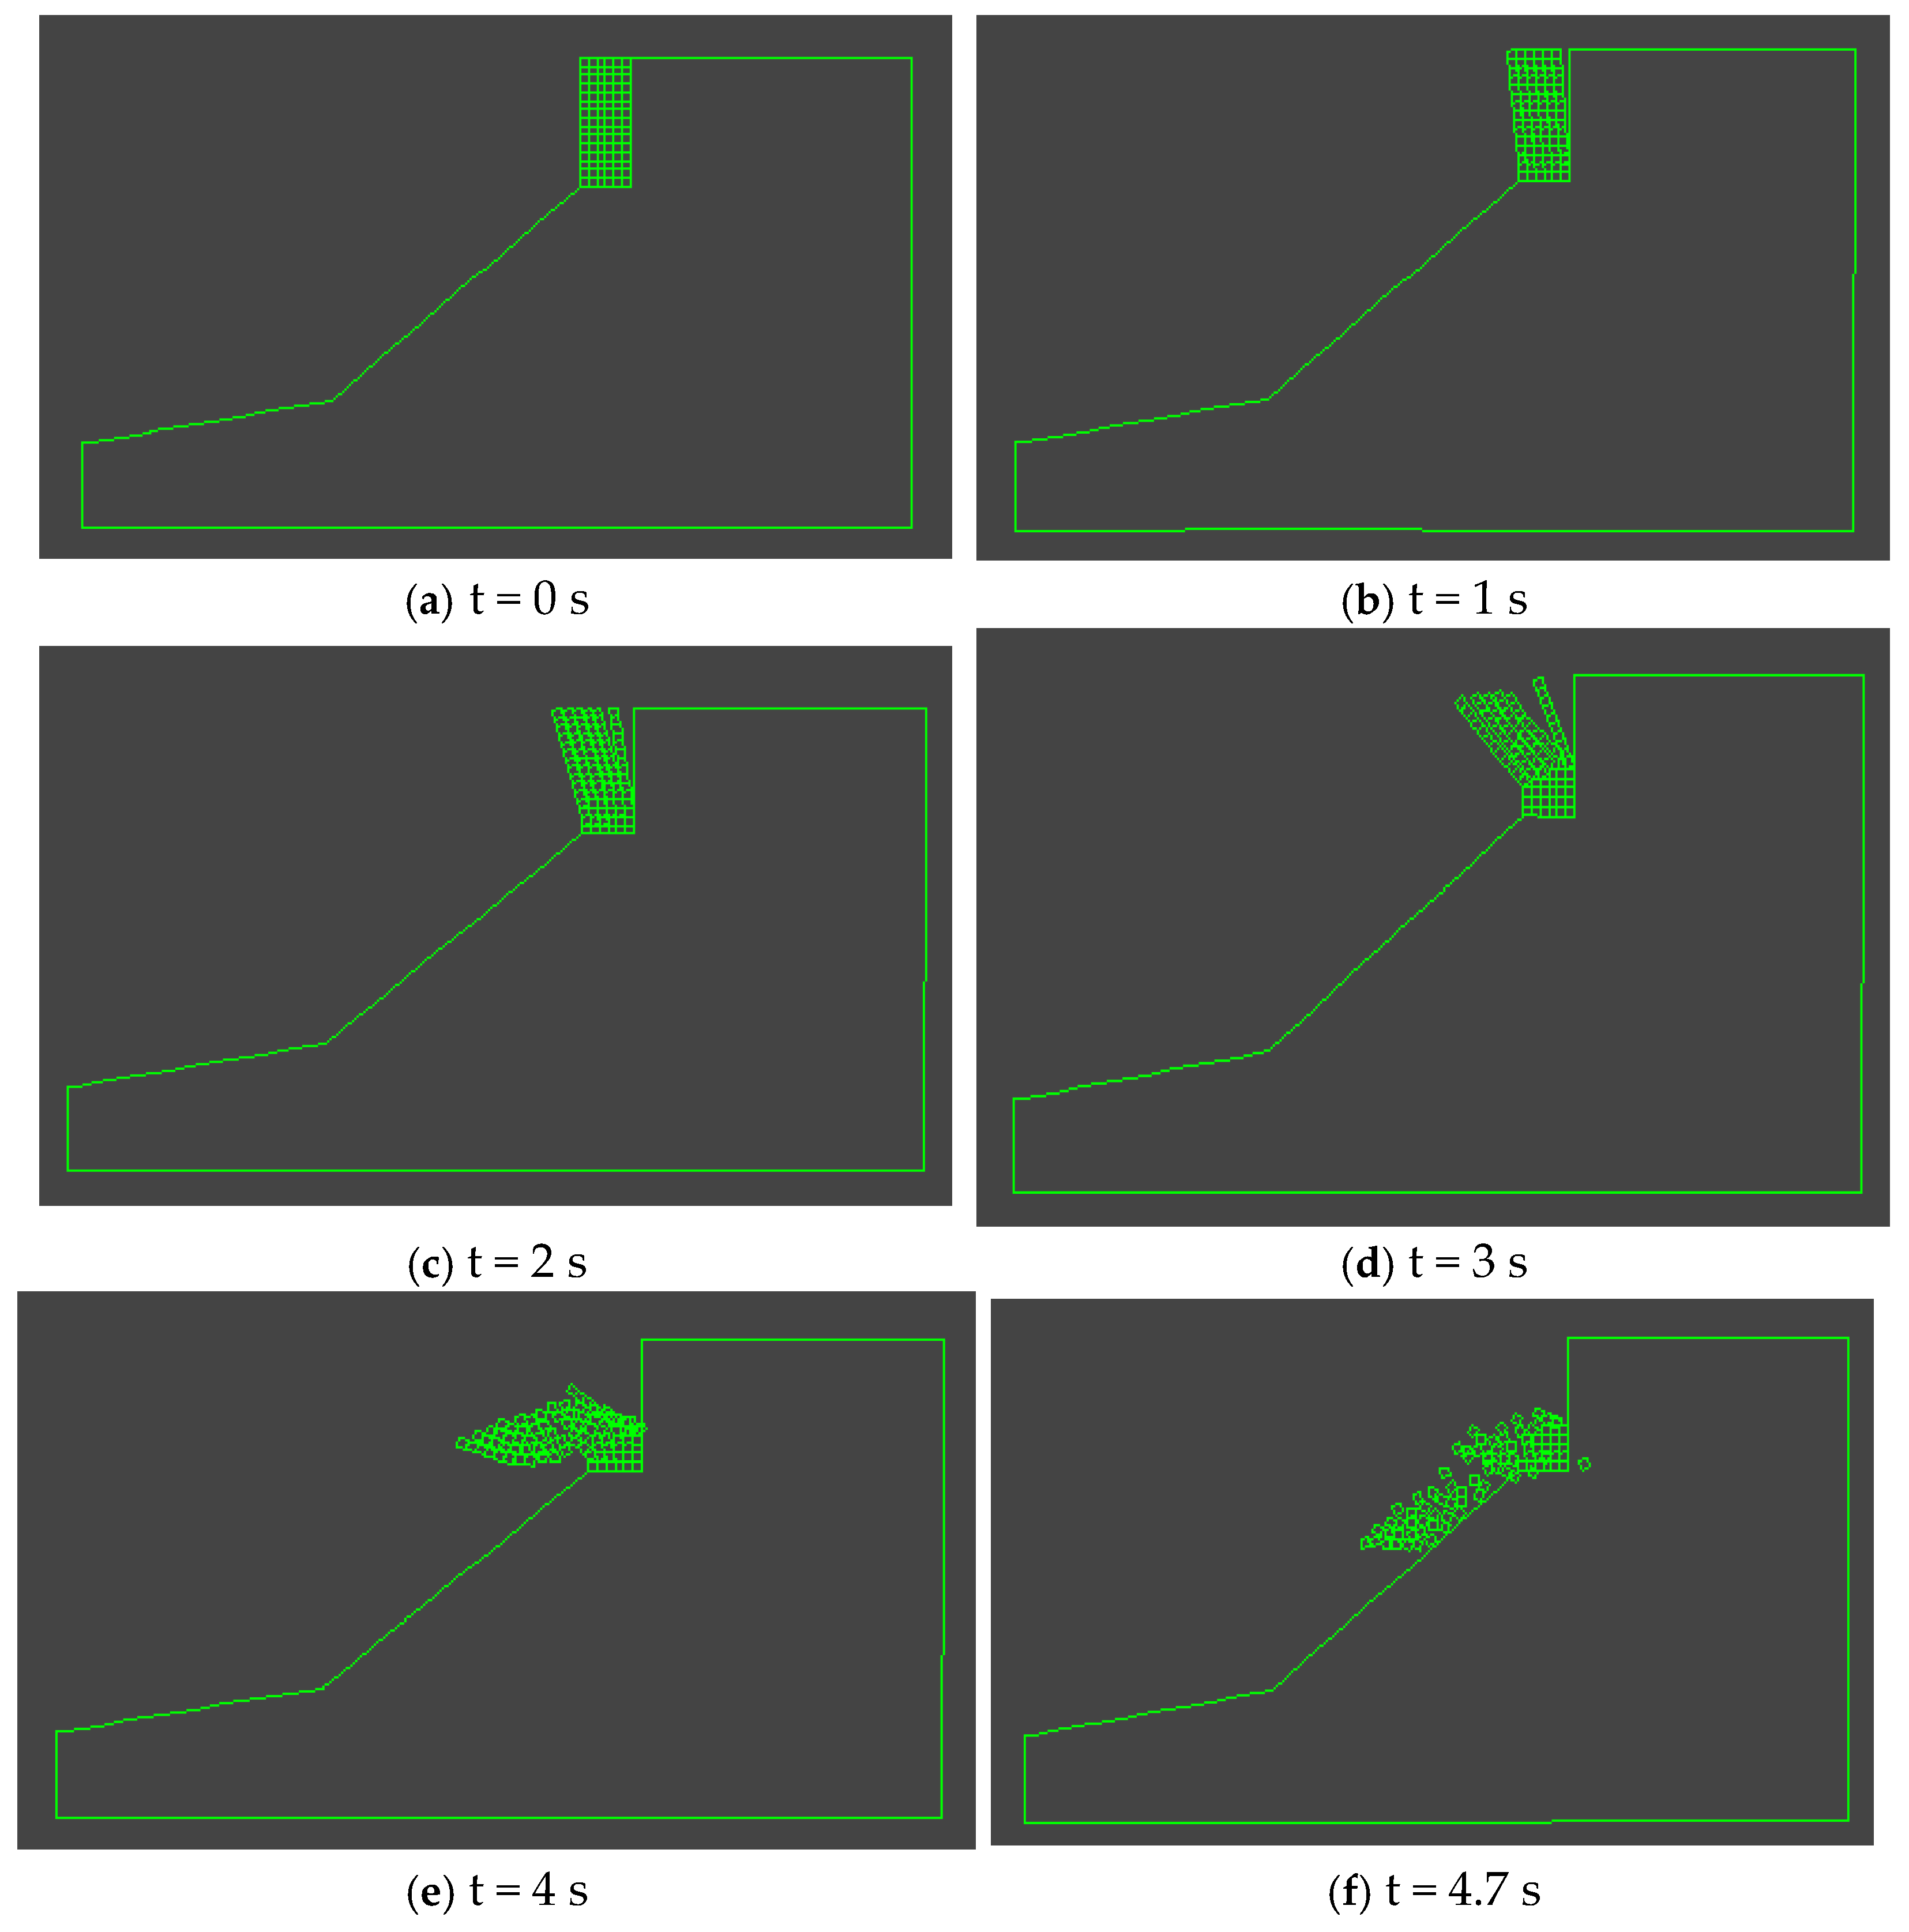
The specific parameter settings for the UDEC numerical calculation model are as follows: Model dimensions (width × height) are 100 m × 55 m, with the unstable rock mass occurrence height H1 = 40 m, block height H2 = 15 m, and rock layer thickness b = 6 m. Seismic motion parameters are set as amplitude λ = 0.9 m/s2, rock layer dip angle α = 0° (horizontal layering), and cliff slope angle β = 90° (vertical slope). Considering that the fragmentation degree of the unstable rock mass is controlled by the spacing between structural planes, the plane spacing d1 and joint spacing d2 are uniformly set to 1m. Figure 8 illustrates the progressive failure process at six characteristic time points (0 s, 1 s, 2 s, 3 s, 4 s, 4.7 s) within the 0–4.7s time interval, providing a visual representation of the integral toppling failure mode described above. The specific schemes are presented in Table 7.

3.4. Criteria for Determining the Critical Threshold of Collapse

The numerical simulation results indicate that when the height of the unstable rock block is H2 = 15 m, the failure modes under different occurrence heights (H2 = 40–100 m) exhibit consistent characteristics: initial failure occurs at approximately one-third of the block’s height (i.e., around 5 m above the base), forming a rotational pivot. Subsequently, the upper section of the rock block undergoes integral toppling, disintegrating into granular debris upon impact with the ground. The lower section experiences secondary collapse due to the instability of the upper part, ultimately leaving only the most basal fragmented debris remaining. This behavioral pattern was consistently observed across Simulation Cases 1–4, demonstrating that variations in the occurrence height do not significantly alter the fundamental failure mode of the unstable rock mass.
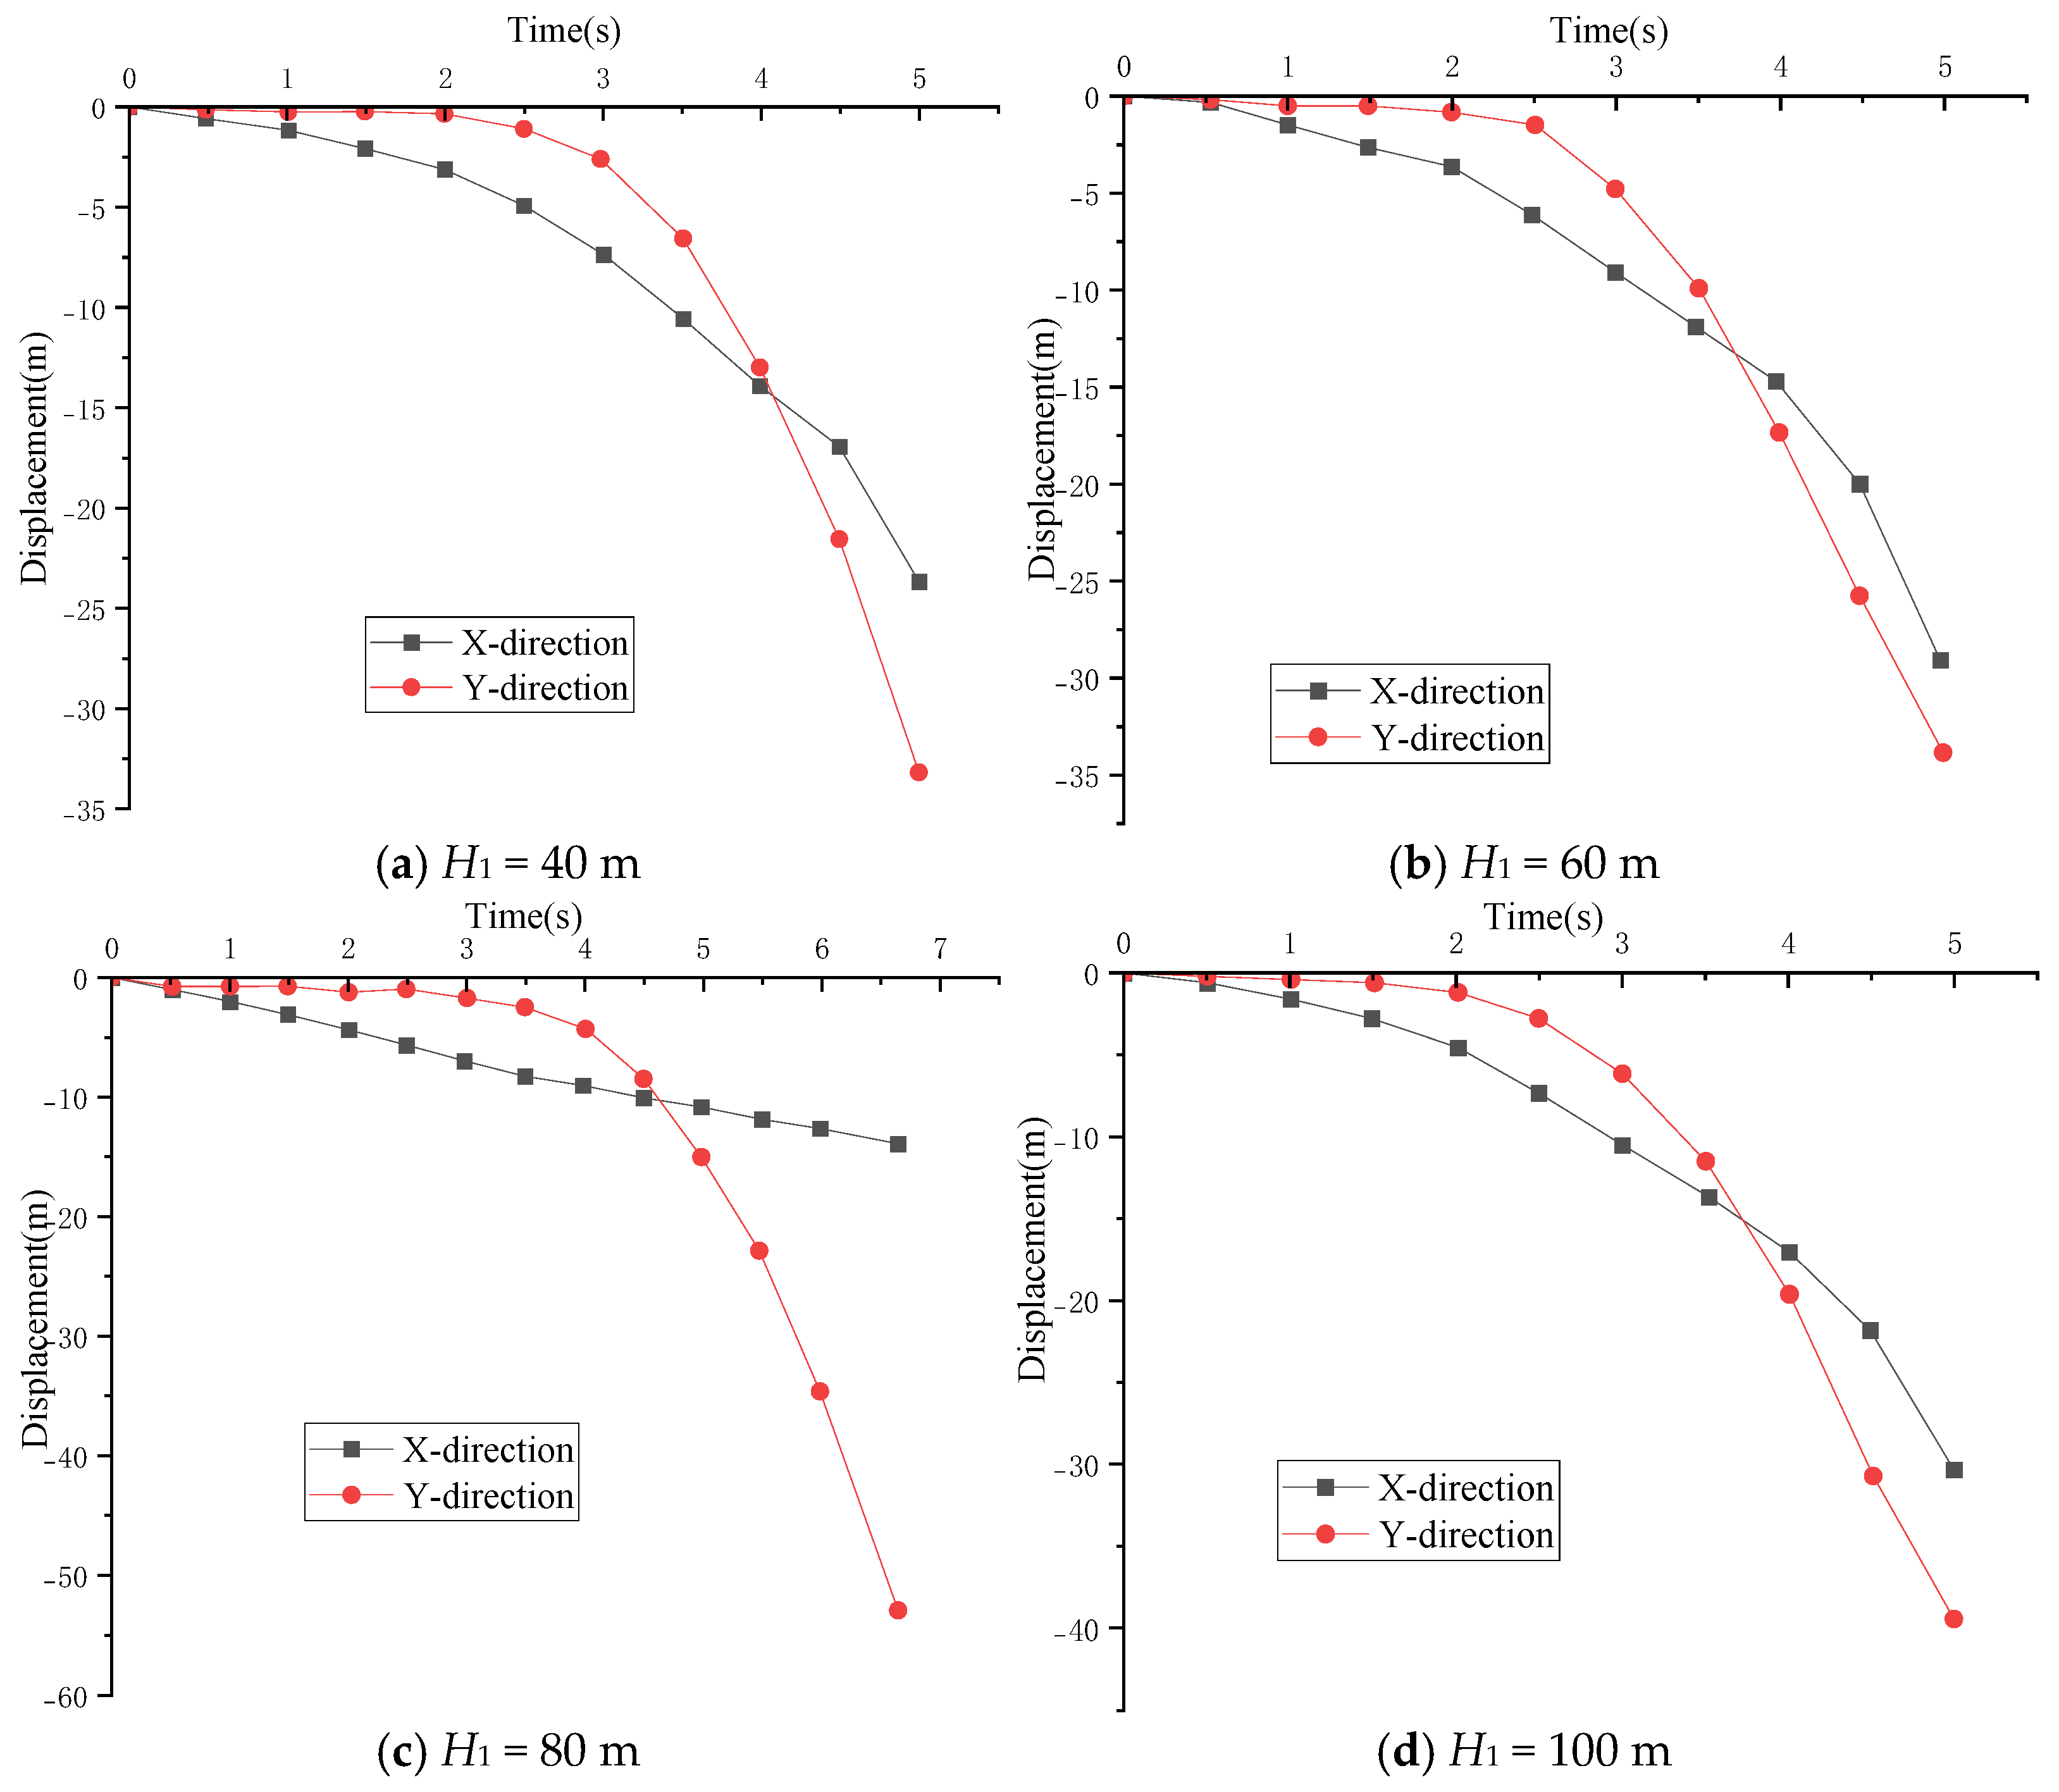
The horizontal displacement–time (X-t) and vertical displacement–time (Y-t) curves were obtained by assigning history points to the distinct element (block) located at the top of the free surface of the unstable rock mass. UDEC automatically records the velocity and displacement of these monitored blocks throughout the simulation.
Based on the analysis of the displacement monitoring curves in Figure 9, the kinematic evolution process of the unstable rock block can be clearly revealed. In the horizontal direction (X-t curve), under the action of seismic shear waves, the block exhibits continuous and uniform displacement toward the free surface, with the curve showing a linear increase at a 45° angle, reflecting its inertial motion characteristics. In the vertical direction (Y-t curve), the displacement remains nearly zero initially due to the support from the lower section. Once the block’s center of gravity exceeds a critical offset, a distinct inflection point appears in the curve, followed by a typical parabolic trajectory consistent with free-fall motion. This complete displacement evolution process—transitioning from forced vibration to free motion—not only verifies the mechanical mechanism behind unstable rock collapse but also demonstrates a high degree of consistency with classical physical laws.
Taking the inflection point on the Y-t curve as the initiation criterion for rock collapse is physically significant, as it marks the moment when the monitored block loses contact with the underlying support system and begins free motion. Mathematically, the inflection point represents an abrupt change in the slope of the curve (i.e., the first derivative), corresponding to an extreme value in the second derivative.
To quantitatively and objectively identify this critical point, we employed a method based on the fundamental mathematical definition of an inflection point. The vertical displacement–time (Y-t) data from UDEC monitoring were exported and analyzed using Origin 2024 software. The critical collapse initiation time was rigorously defined as the point where the second derivative of the Y-t curve with respect to time equals zero: d2Y/dt2 = 0 (1) the specific operational steps in Origin were as follows: (1) The Y-t data were plotted and the curve was set as the active plot; (2) the ‘Analysis’ → ‘Mathematics’ → ‘Differentiate’ tool was applied; (3) in the differentiation settings, the ‘Order’ was set to ‘2′ to compute the second derivative; (4) the resulting second derivative curve was output to a new worksheet; (5) The point where the second derivative values crossed zero was identified as the inflection point, corresponding to the collapse time. This point also coincides with the maximum value of the first derivative (vertical velocity), signaling the peak descent speed attained just before the block transitions into unrestrained free-fall.” The inflection point (d2Y/dt2 = 0) has a profound physical meaning: it marks the moment of peak vertical velocity immediately before the block enters free-fall. This peak in kinetic energy coincides with the sudden release of stored strain energy from the rock mass and the instantaneous loss of vertical constraint, causing the vertical acceleration to drop to zero. Therefore, this mathematically defined criterion precisely captures the transition from constrained rocking to irreversible collapse, representing the onset of gravitational free-fall.

3.5. Analysis of the Impact Mechanisms of Collapse Factors

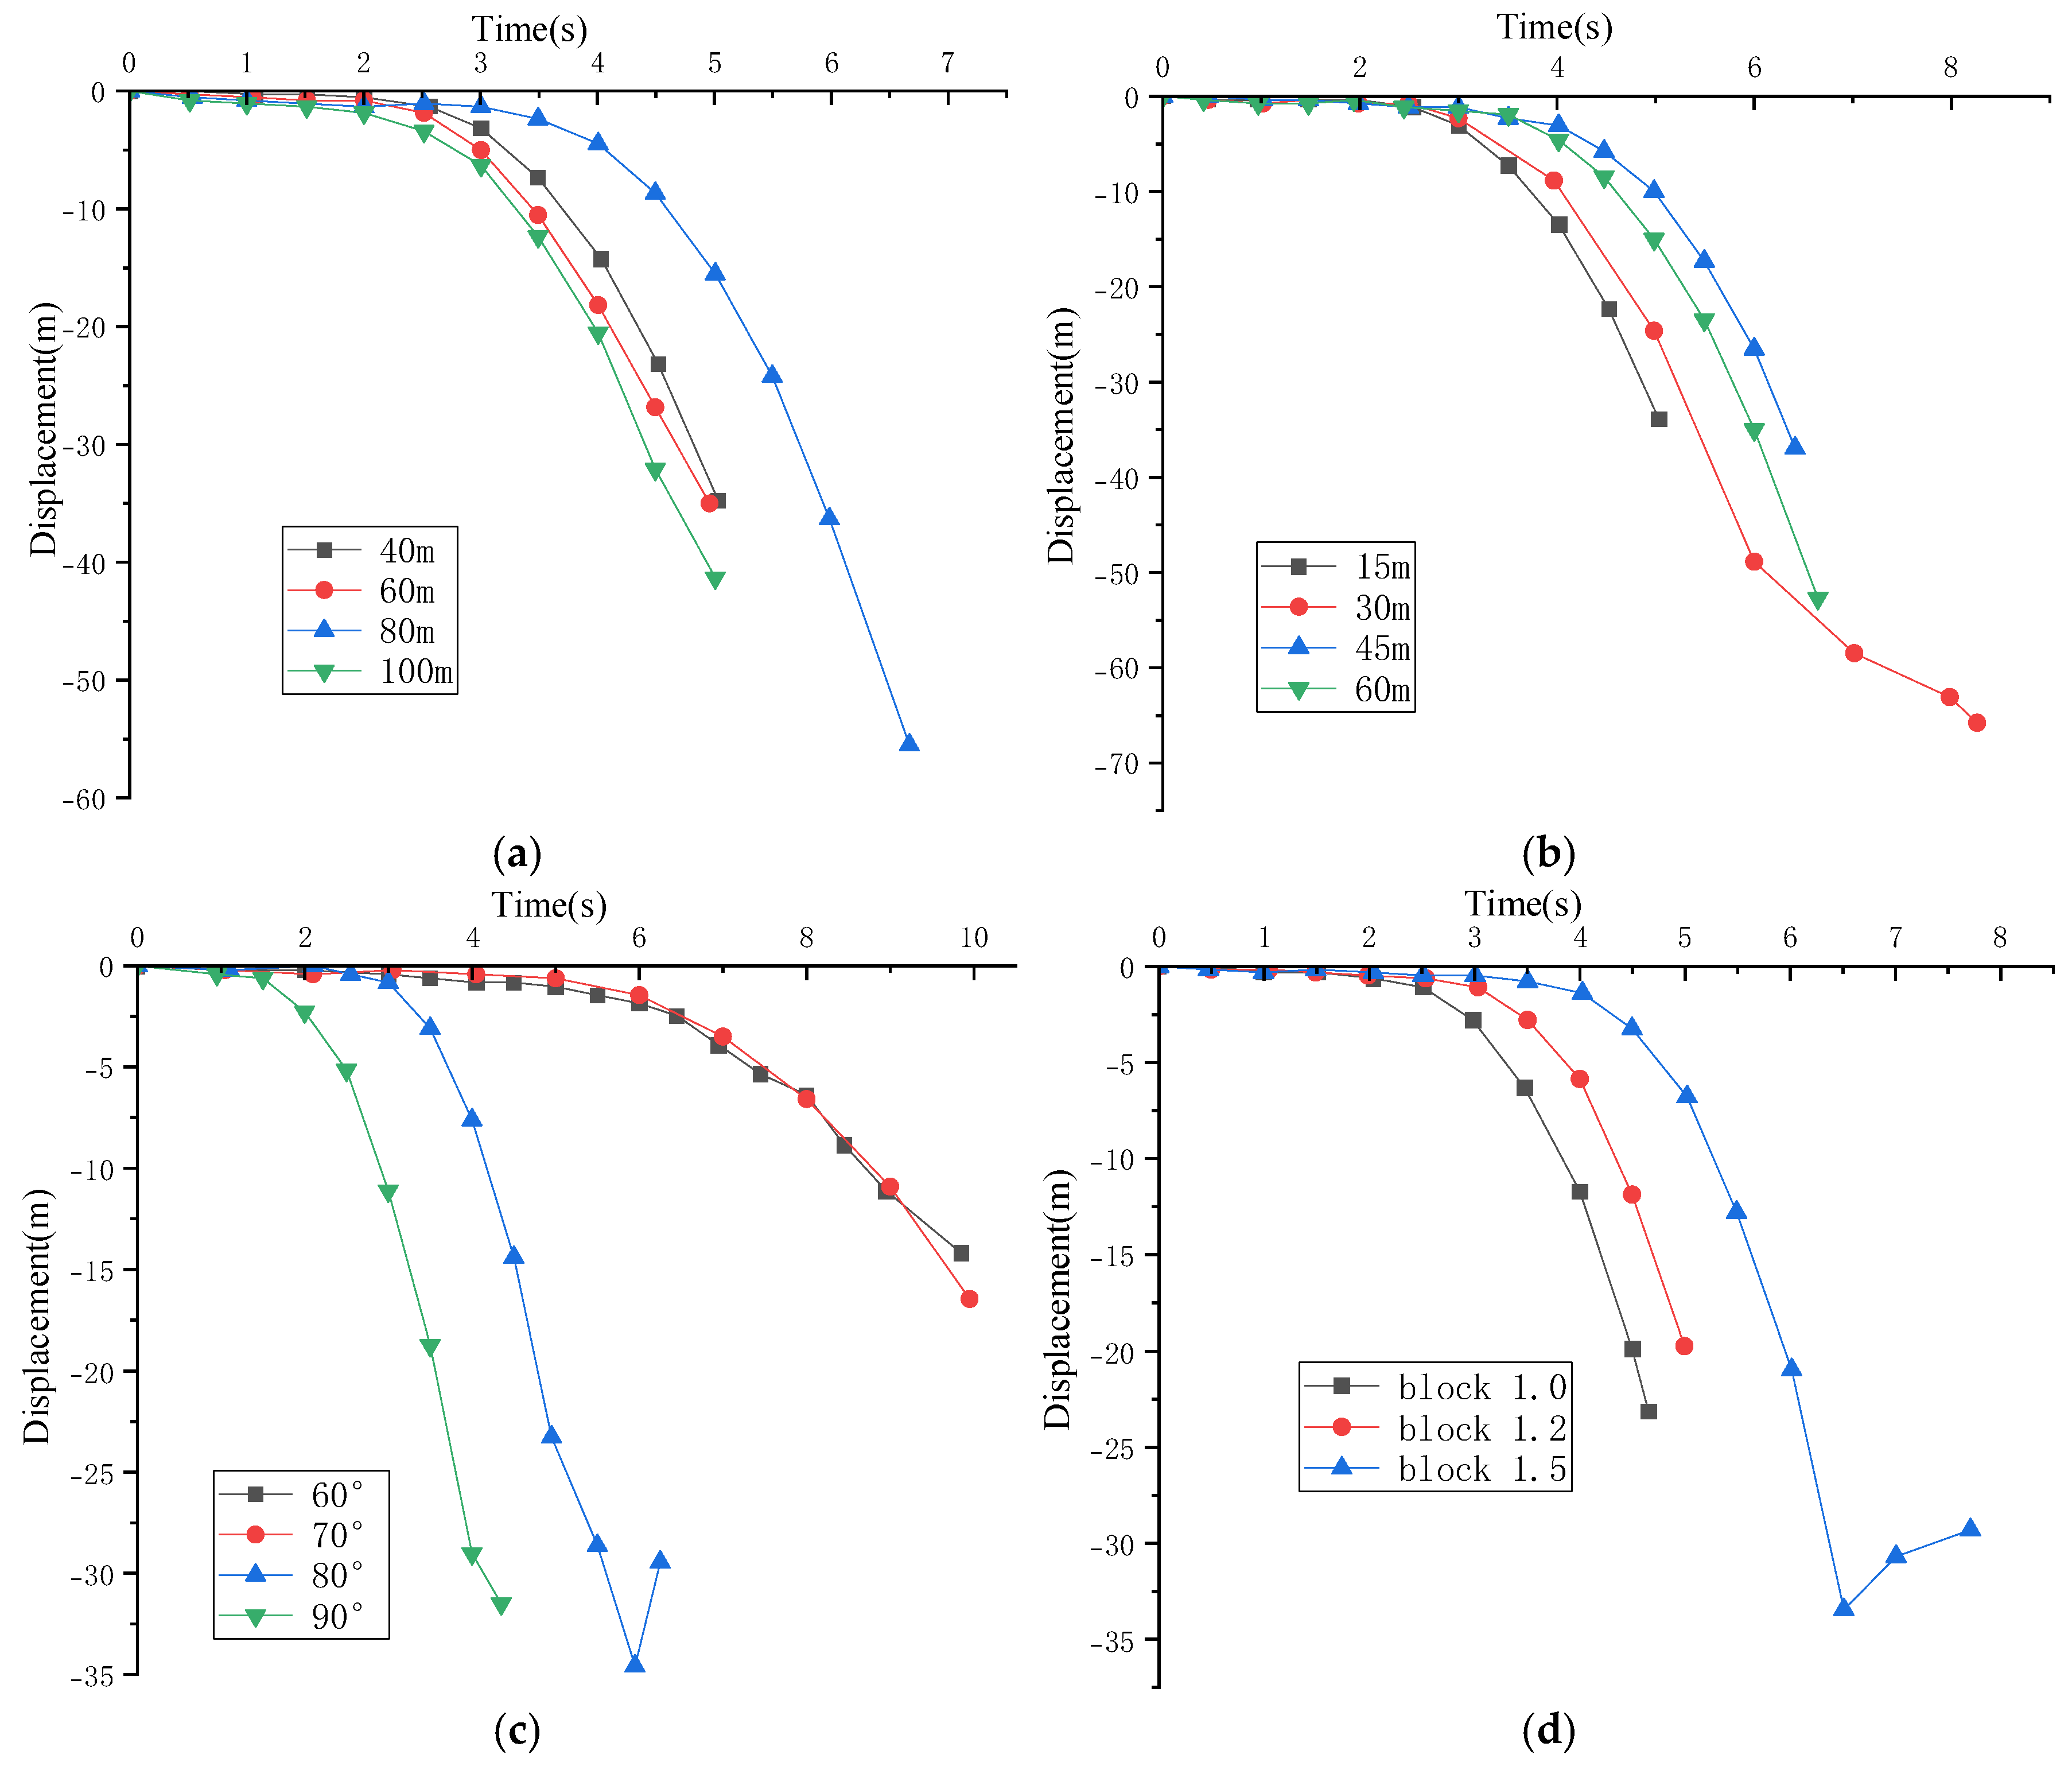
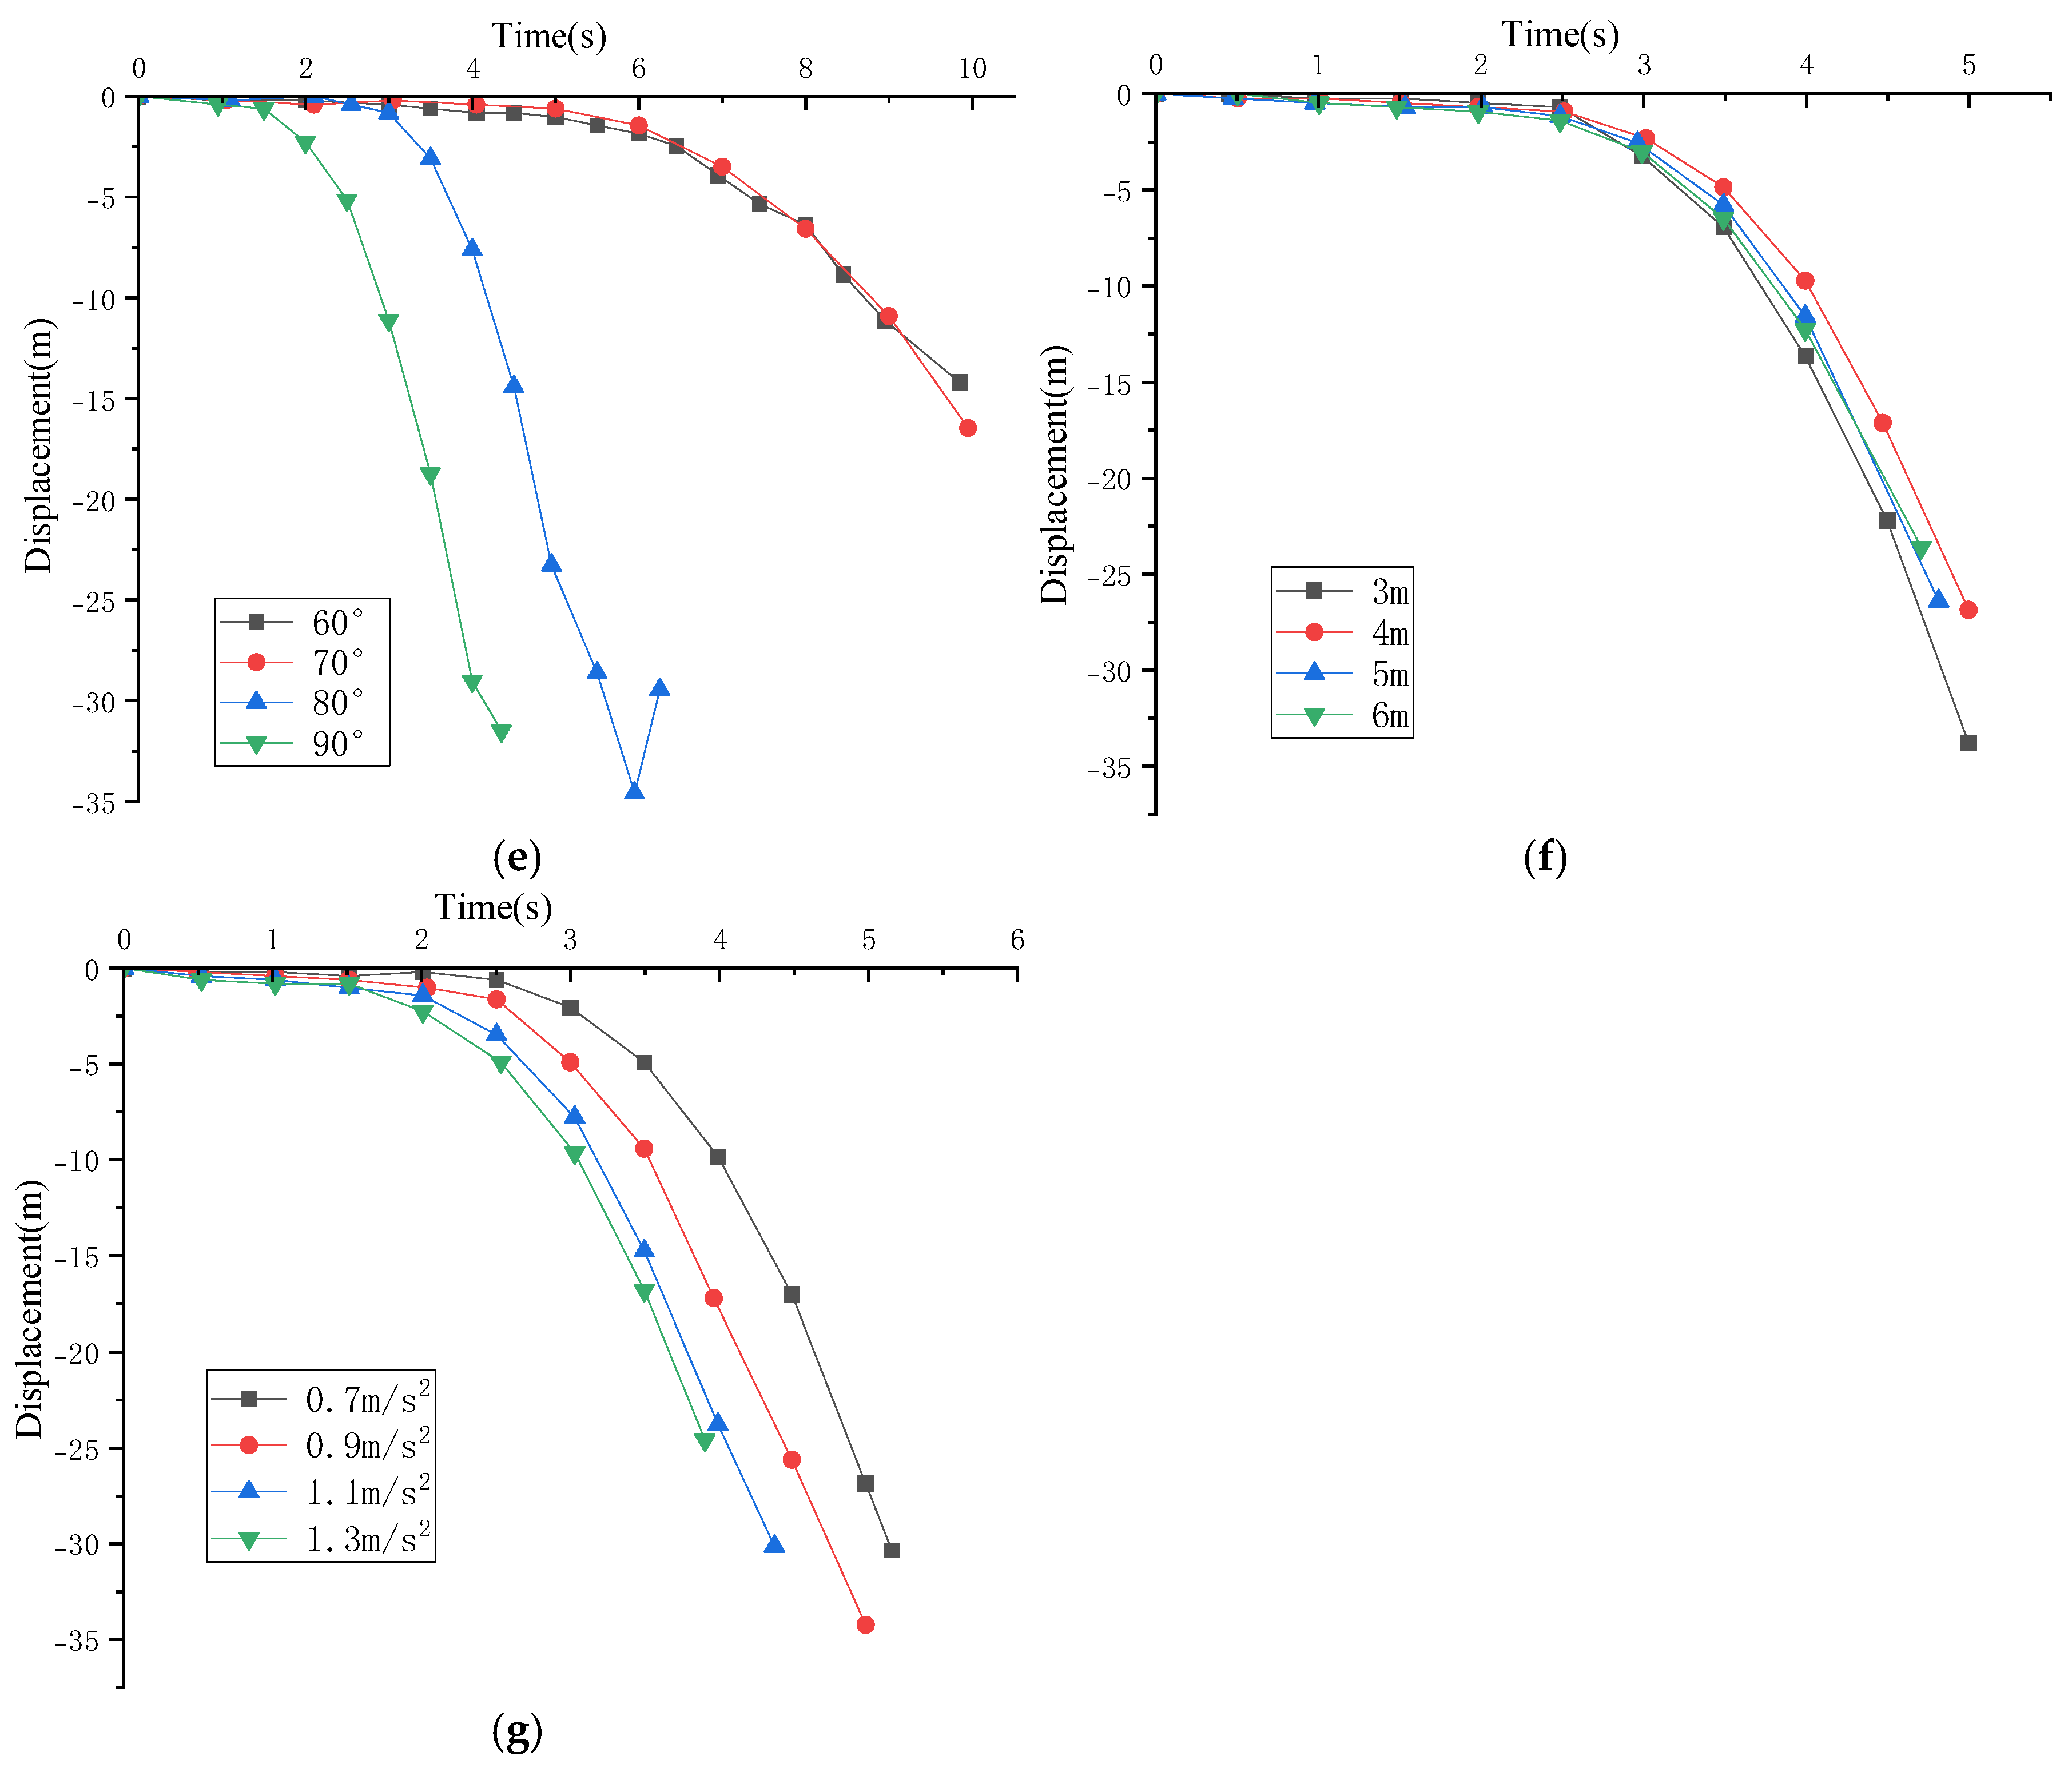
Under various influencing factors, the vertical displacement–time–history curves (Y-t) are shown in Figure 10.
Mechanistic Interpretation of Geometric Effects: The geometry of the unstable rock mass, particularly the relative configuration of the upper and lower layers, plays a critical role in controlling the failure mode and collapse timing. For instance, when the occurrence height H1 is below 80 m, the self-weight of the rock mass enhances stability by increasing the normal stress along potential failure surfaces, thereby delaying collapse. However, beyond 80 m, the increasing height amplifies the overturning moment due to the longer lever arm, leading to a transition from stable rocking to progressive toppling failure. Similarly, for block height H2, a threshold of 45 m was identified: below this value, the anti-overturning moment increases with height, enhancing stability; above it, a dynamic equilibrium is reached between gravitational and resisting moments, stabilizing the collapse timing. These findings highlight the nonlinear and threshold-dependent behavior of stratified rock masses under seismic loading, where geometric proportions dictate the transition between different failure modes (e.g., from block-toppling to granular disintegration).
Critical Thresholds and Nonlinear Behavior: Our results reveal several critical thresholds that govern the collapse behavior:
Occurrence height H1: 80 m—transition from self-weight stabilization to moment-driven instability.
Block height H2: 45 m—transition from height-dependent stability to dynamic equilibrium.
Slope angle β: 70°—beyond which slope steepness has diminishing influence on collapse timing.
Joint spacing: 2 m—no collapse occurs when spacing exceeds this value, indicating a transition from discontinuous to continuous rock mass behavior. These thresholds underscore the non-monotonic and context-dependent influence of geometric and dynamic factors, emphasizing the need for site-specific stability assessments.
Reformatted Tables with Summarized Findings: To improve clarity and consistency, Table 8 and Table 9 have been restructured with unified column headings and concise summaries of the observed effects and failure types. The revised tables now provide a more systematic overview of how each factor influences collapse behavior.

3.6. Precursors to Rock Collapse

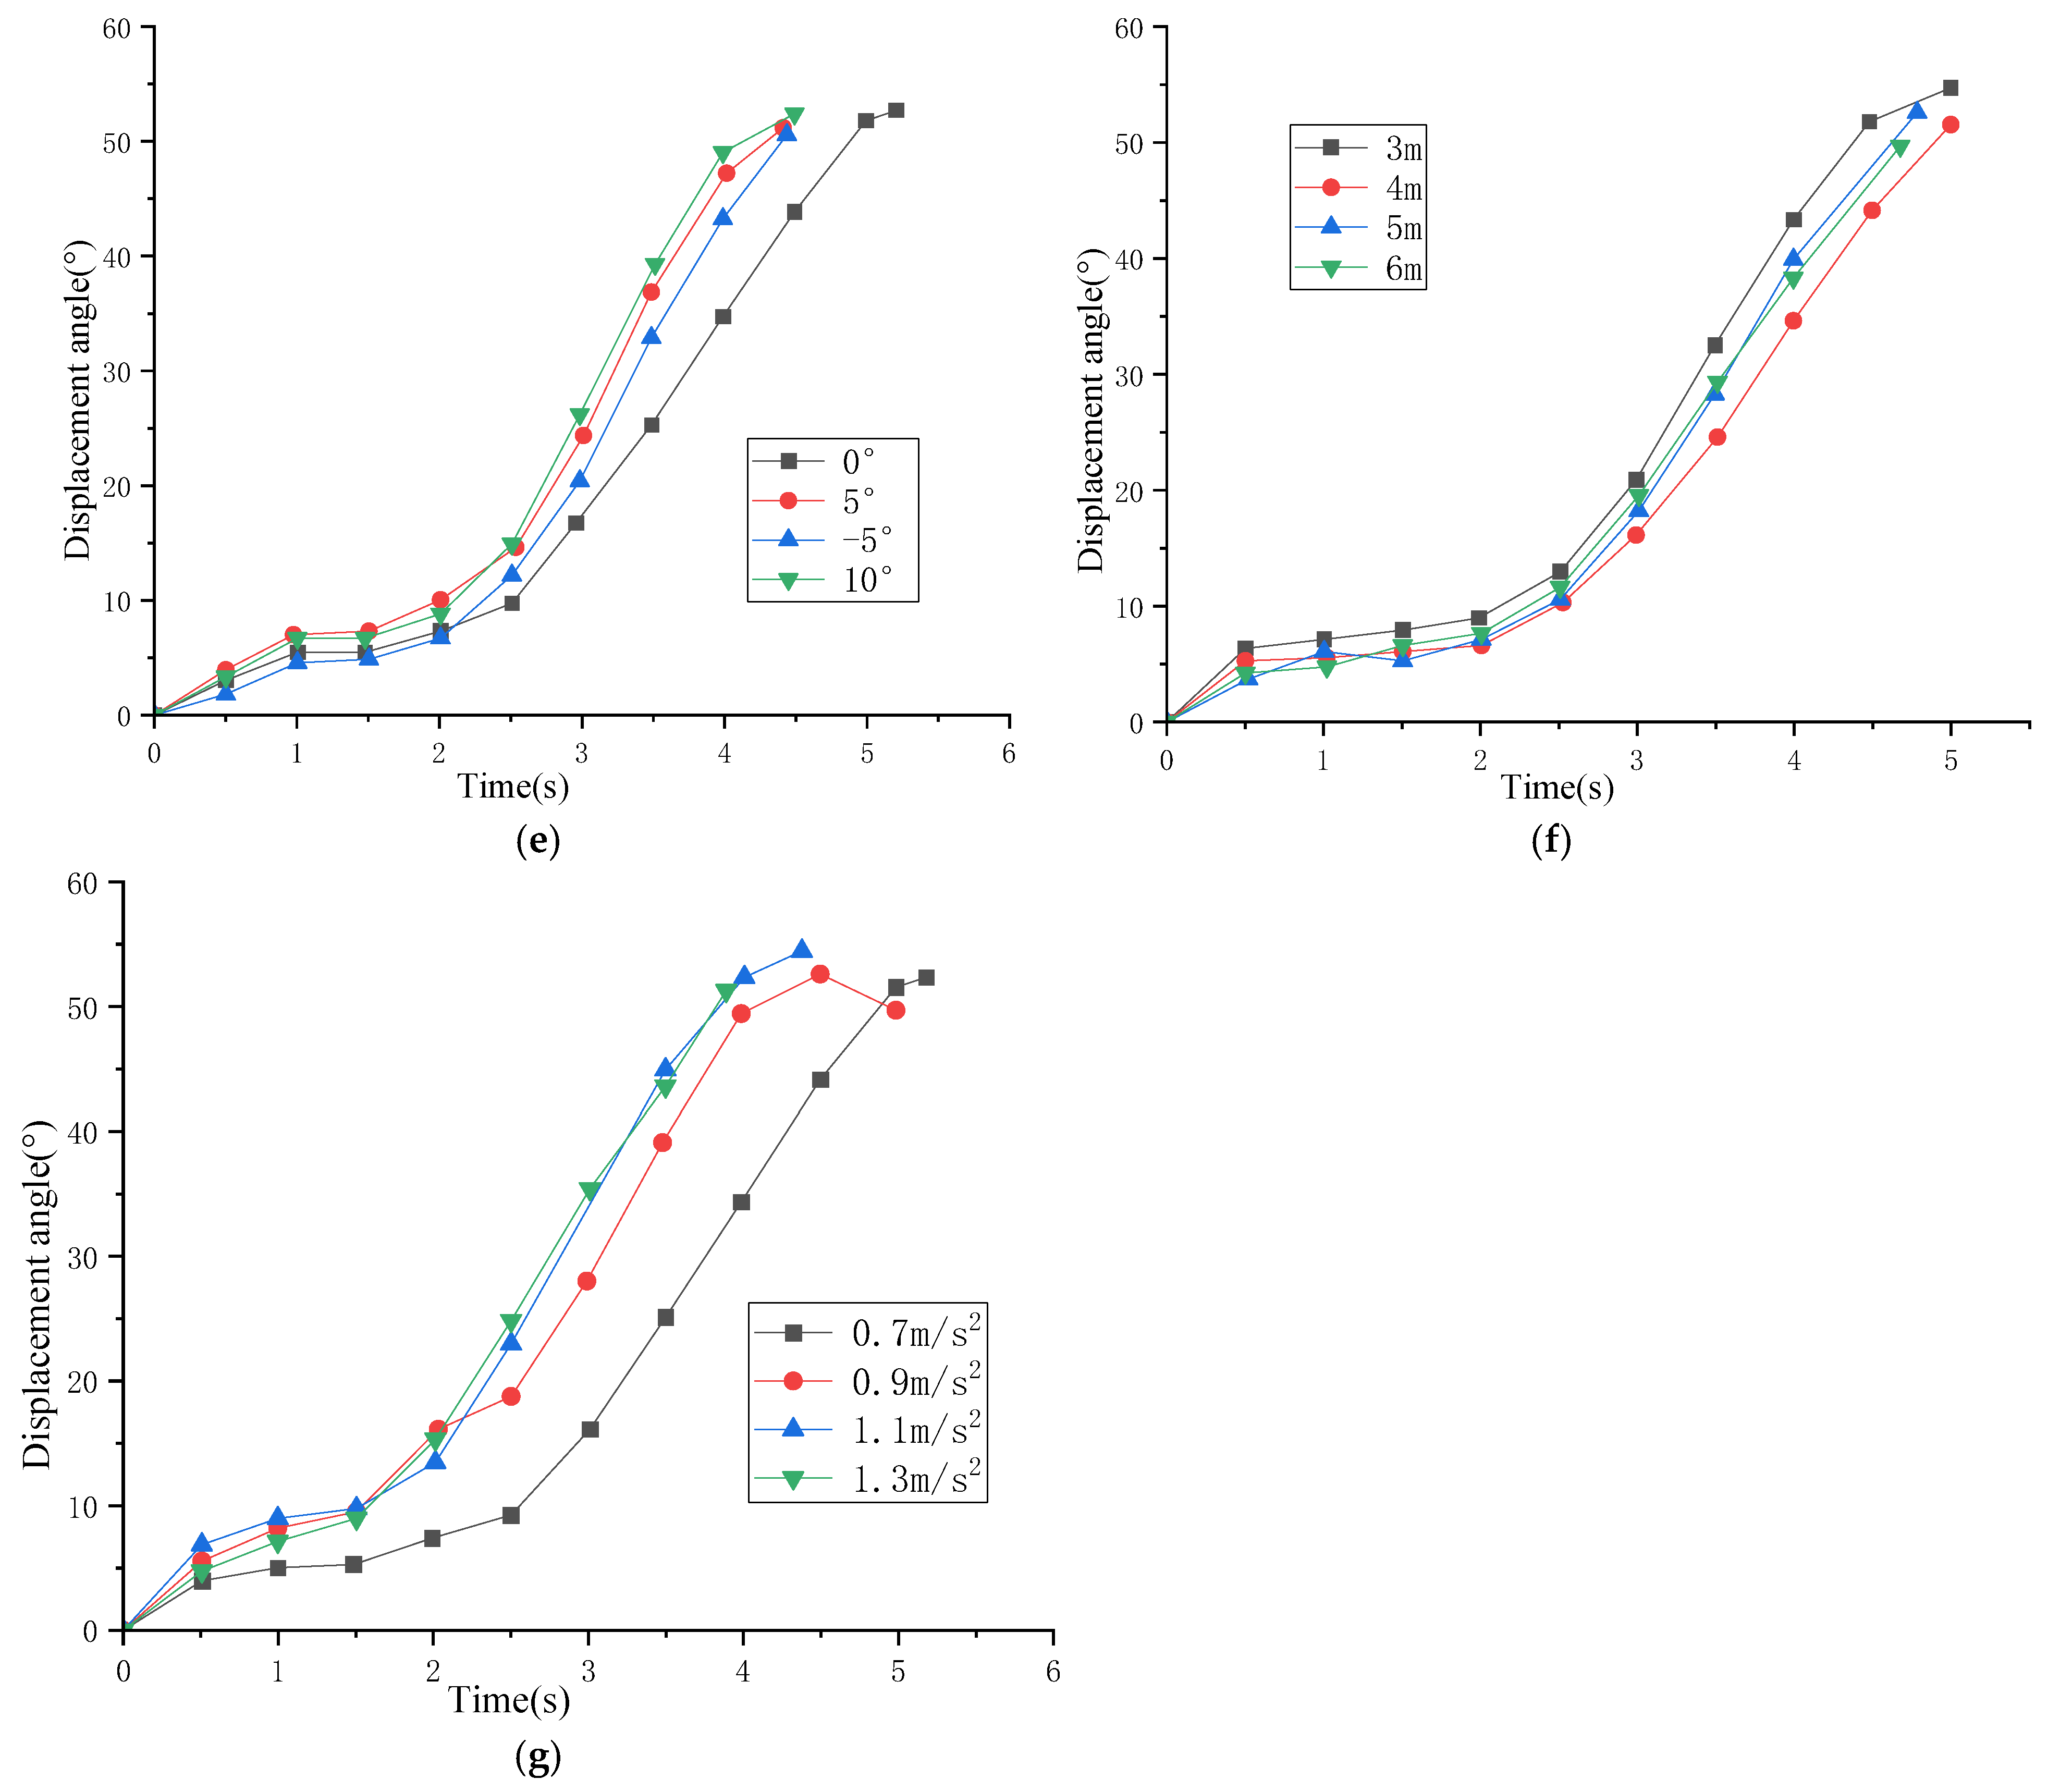
The X-t and Y-t data of the unstable rock blocks, obtained through numerical simulation monitoring under seven different conditions, were compiled. Based on the definition of the displacement angle, the variation in the displacement angle over time under these different conditions was derived and is presented in Figure 11.
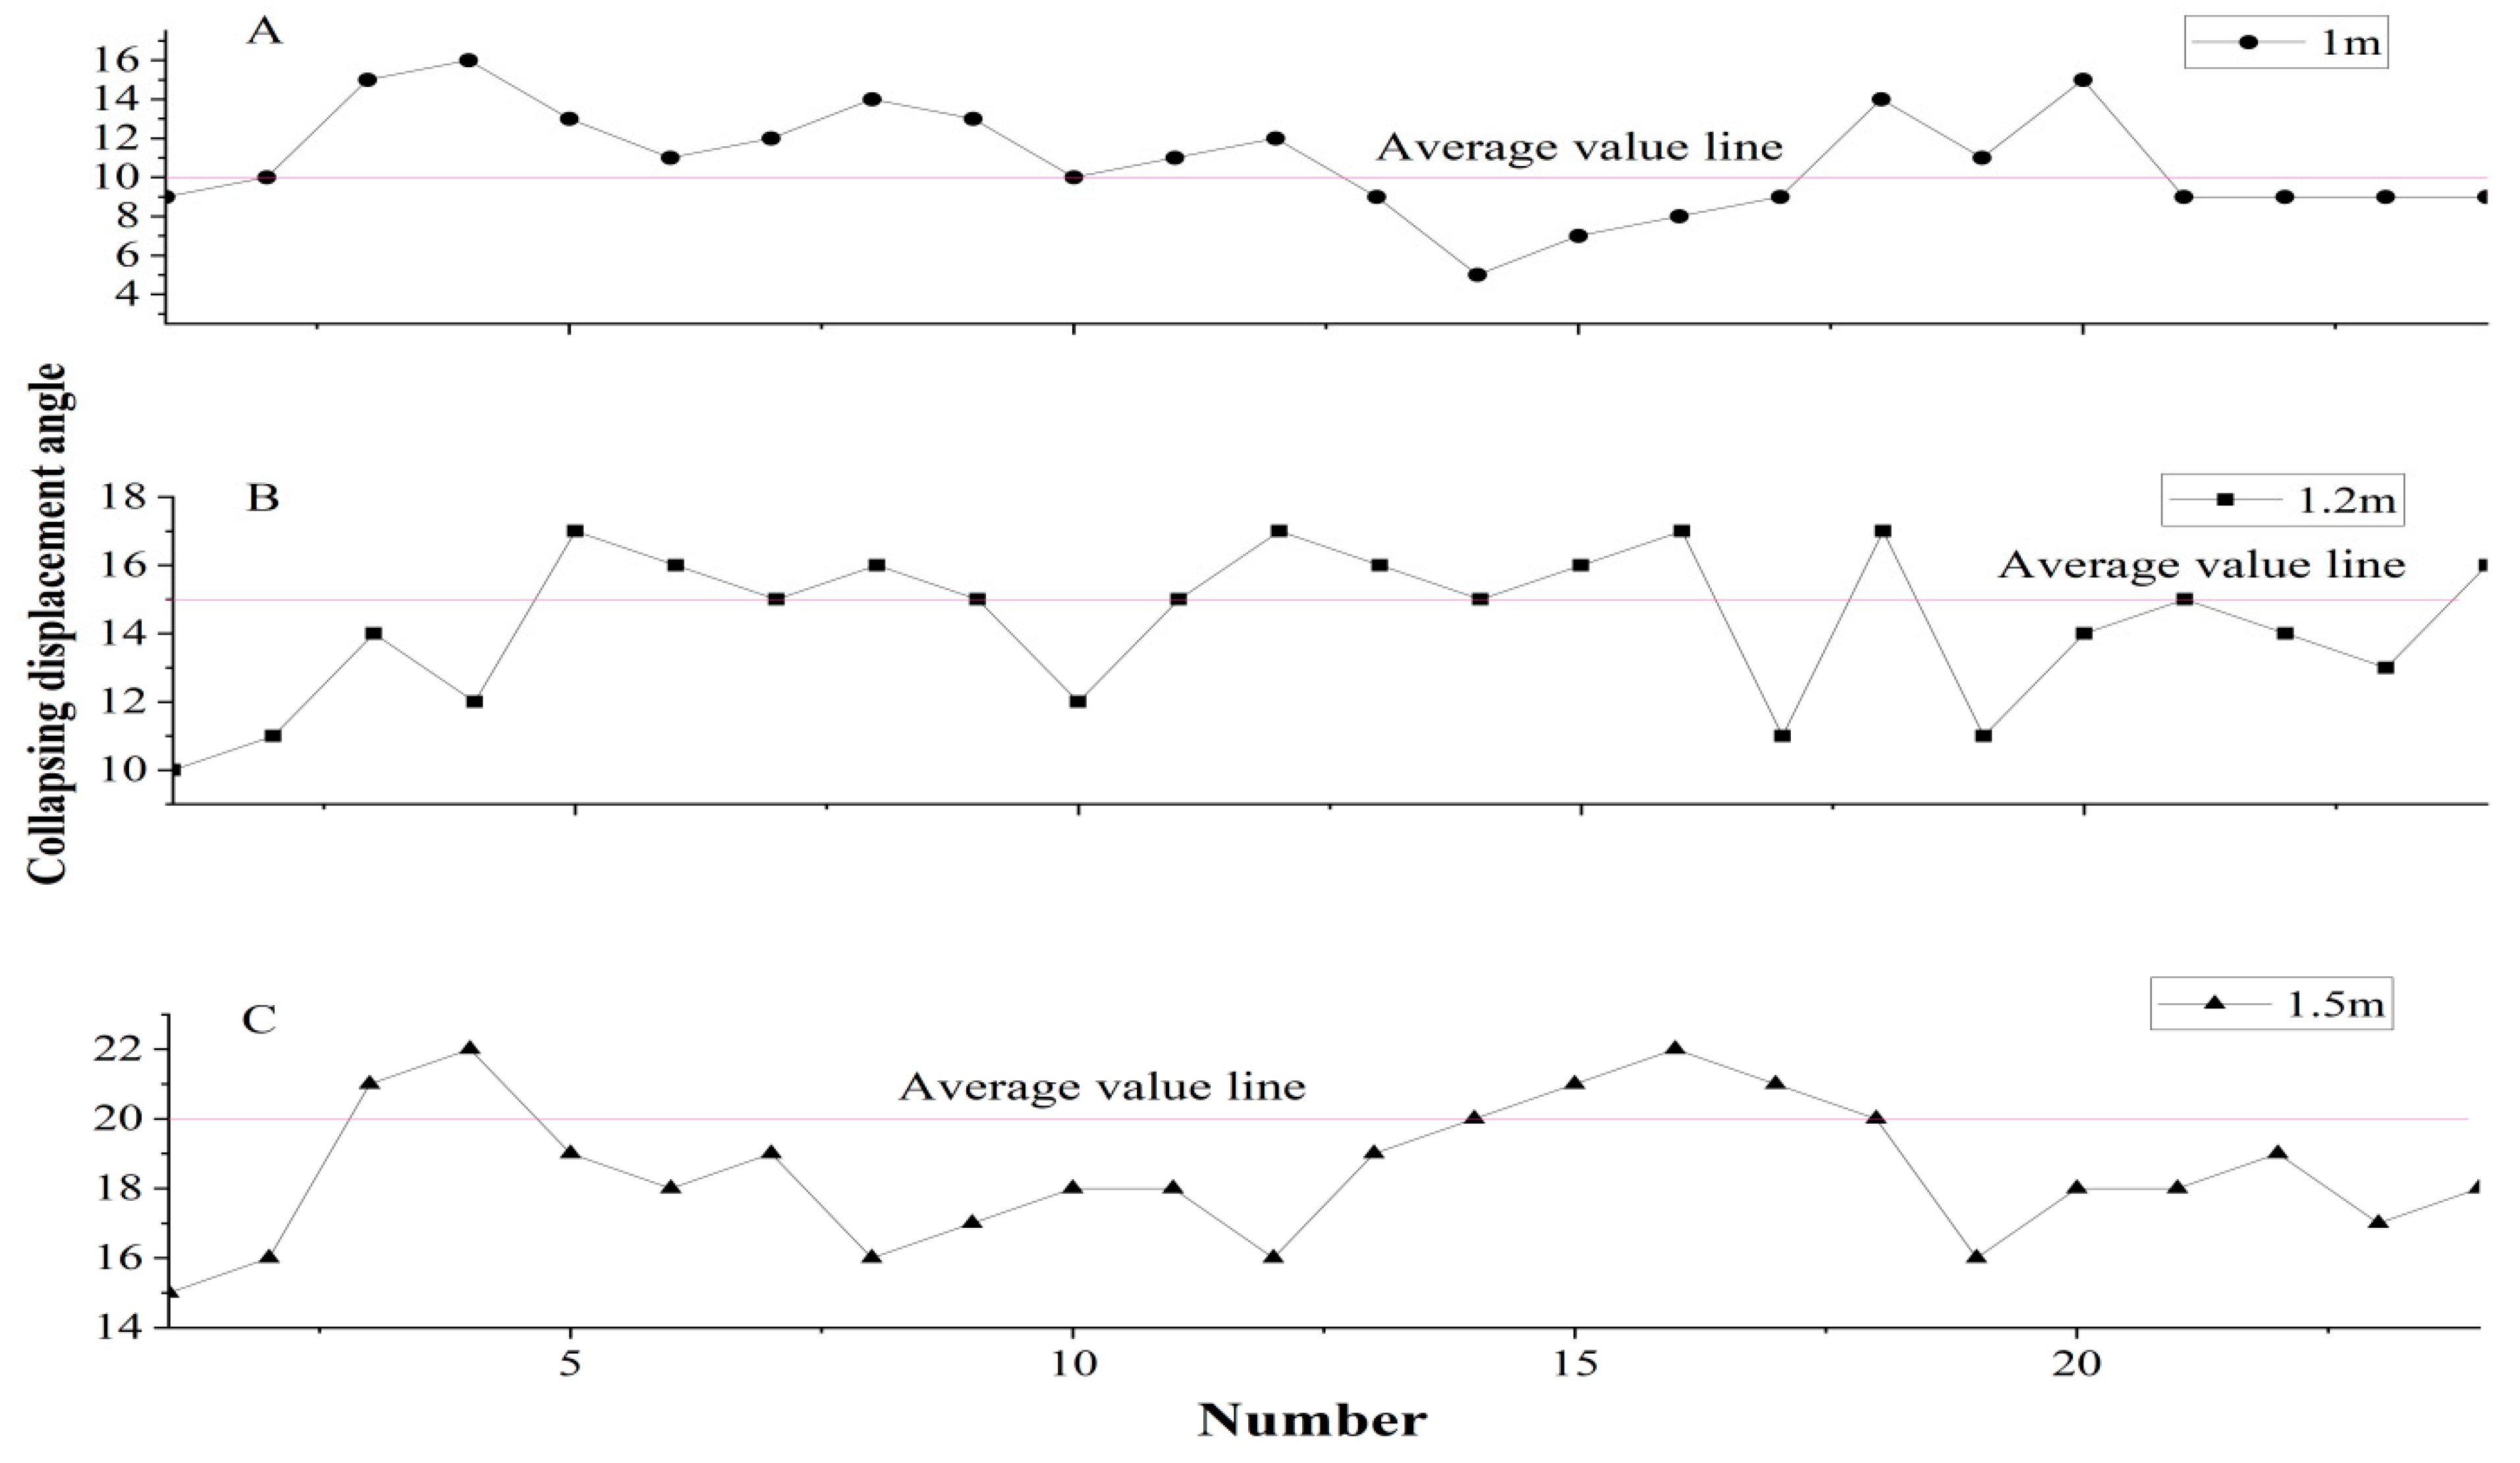
The displacement-angle threshold ranges (9–15°, 12–17°, and 16–21°) presented in this study were derived exclusively from the 28 UDEC numerical simulations detailed in Section 3.3 and Table 7. These simulations systematically investigated seven factors, with the joint spacing (d1 and d2) being one of the key variables (specifically at 1.0 m, 1.2 m, and 1.5 m).
To provide statistical support, the displacement angles from simulations grouped by joint spacing were analyzed. The threshold ranges represent the observed spread of collapse initiation angles for each joint spacing set. The mean displacement angles and their standard deviations were calculated as follows: for the subset of simulations with d = 1.0 m, the mean is 11.8° ± 1.9°; for d = 1.2 m, it is 14.5° ± 1.7°; and for d = 1.5 m, it is 18.2° ± 1.6°. This quantitative analysis, derived from our parametric study, confirms that joint spacing is the primary factor controlling the critical displacement angle, with other factors causing minor variations within a well defined range for a given spacing.
Uncertainties and Field Applicability: The identified threshold ranges are subject to uncertainties stemming from several sources. The primary source is model simplification, including the 2D plane-strain assumption, which neglects 3D edge effects and interlock, and the use of homogeneous, linearly elastic material models for the rock blocks. Furthermore, the joint properties (e.g., zero tensile strength, constant friction angle) are idealized. Regarding measurement accuracy, the displacement angle in the simulations was calculated from the computed displacements of distinct element nodes, which is numerically precise. However, the extrapolation to real field conditions introduces uncertainty related to the accuracy of field monitoring techniques.
Despite these limitations, the displacement angle shows significant promise as a precursory indicator for field application. In practical engineering, the displacement angle of a critical rock block on a real cliff could be monitored using remote sensing technologies such as terrestrial laser scanning (TLS) or unmanned aerial vehicle (UAV)-based photogrammetry. By periodically capturing high-resolution 3D point clouds of the cliff face, the tilt or rotation of key blocks relative to a stable datum can be tracked over time. An early-warning system could be implemented by setting alert thresholds based on the lower bounds of the displacement angle ranges identified in this study (e.g., issuing a warning when the monitored angle exceeds 8° for a highly fragmented rock mass with an estimated joint spacing of ~1 m). This provides a mechanically meaningful and potentially measurable parameter for proactive risk management.
A detailed analysis of Figure 11 reveals the decisive influence of various factors on the displacement angle, leading to the generalized pattern summarized in Figure 10. The analysis shows that as the occurrence height, rock mass height, cliff slope angle, surrounding rock fragmentation degree, rock layer thickness, dip angle of bedding planes, and seismic wave amplitude gradually increase, the collapse displacement angle of the layered unstable rock mass does not exhibit a monotonic increasing or decreasing trend. Instead, it fluctuates in a non-uniform pattern—sometimes decreasing then increasing, or vice versa—with no consistent directional behavior. However, the values of these displacement angles fall within a relatively narrow range, indicating that they converge within a specific interval.
Further analysis of the relationship between joint spacing and the displacement angle shows that the collapse angle increases with larger joint spacing in the layered rock mass, demonstrating a clear positive correlation.
As shown in Figure 12, the scatter plots summarize the collapse displacement angles obtained from the numerical simulations, grouped by the joint spacing parameter. The data for each spacing (1.0 m, 1.2 m, 1.5 m) are derived from the corresponding simulation cases in the overall 28-simulation scheme. The plots show that the displacement angles are predominantly concentrated within the range of 9° to 15° for 1.0 m spacing, 12° to 17° for 1.2 m spacing, and 16° to 21° for 1.5 m spacing.
As demonstrated in the preceding analysis, the collapse displacement angle exhibits a consistent increasing trend as the joint spacing expands. Specifically, the lower bound of the displacement angle rises from 9° to 16°, while the upper bound increases from 15° to 21°. The results indicate that once the joint spacing is determined, variations in other factors have a negligible influence on the concentration range of the displacement angle. Comparative evaluation of the effects of joint spacing versus other parameters confirms that joint spacing exerts the most dominant control on the displacement angle. This observation aligns with the well-established principle in rock mechanics that joint spacing is a primary determinant of rock mass strength and deformability. It has been extensively documented that larger joint spacing (representing a less fragmented rock mass) leads to a significant increase in overall stability and failure resistance [38,54,55], which directly explains the corresponding increase in the critical displacement angle observed in our simulations. Thus, the range of the collapse displacement angle becomes well defined for a given joint spacing. Furthermore, as joint spacing increases, the value range within which the displacement angle concentrates also shifts toward higher values. Consequently, once the joint spacing is established, the expected bounds of the displacement angle can be determined. This enables safety assessments through displacement angle monitoring: the layered unstable rock mass remains stable as long as the measured displacement angle does not exceed the minimum critical value required for collapse initiation.

4. Weight Analysis of Various Factors Based on AHP

4.1. The Principle of the Analytic Hierarchy Process (AHP)

The Analytic Hierarchy Process (AHP) [37,38], proposed by American operational researcher Thomas L. Saaty in the 1970s, is a multi-criteria decision-making method used for the analysis of complex systems. Its core concept involves decomposing a decision problem into a hierarchical structure comprising objectives, criteria, and alternatives. Through pairwise comparisons, the relative importance of elements at each level is quantitatively determined, ultimately yielding a comprehensive ranking of the weights of underlying factors relative to the overall goal.

4.2. Selection of Evaluation Factors

The collapse of stratified unstable rock masses on cliffs is influenced by numerous factors. The seven factors (F1 to F7) selected for the AHP in this study (see Table 10) were chosen based on a comprehensive analysis of our experimental and numerical results presented in Section 2 and Section 3. These specific factors were identified as the key controlling parameters in our shaking table tests and were systematically investigated as the primary variables in our UDEC numerical simulation scheme (Table 7). This selection ensures that the subsequent weighting analysis is directly grounded in and consistent with the quantitative findings of our physical and numerical models.
It is acknowledged that other factors, such as rock mass anisotropy (beyond the geometry defined by our joint sets) and groundwater pressure, can influence rock slope stability. However, these factors were excluded from the current AHP model for the following reasons: (1) The scope of this study is focused on the seismic collapse mechanism under predominantly dry conditions, as simulated in both our physical and numerical models; the influence of groundwater was not within the defined scope. (2) The selected seven factors comprehensively represent the key geometric, material, and dynamic loading parameters that were found to govern the failure mode and timing in our simulations. Focusing on this core set of factors allows for a clear and concise interpretation of their relative importance in the context of our specific research framework.

4.3. Evaluation Process

The judgment matrix A was constructed by integrating the comparative importance assessments of each factor from both the numerical simulation results and expert judgment. Specifically, a panel of three experts with over ten years of experience in rock mechanics and geohazards was invited to complete a pairwise comparison questionnaire. Their individual judgments were then synthesized using the geometric mean to obtain each entry a i j in the final judgment matrix A. The elements a i j in matrix A represent the relative importance of the factor i over factor j , using the standard 1–9 scale of the Analytic Hierarchy Process (AHP), where a value of 1 indicates equal importance and 9 represents extreme dominance. The priority weights of the factors, represented by the eigenvector ω , were calculated by solving the classical eigenvalue problem:
A ω = λ m a x ω
where λ m a x is the principal eigenvalue of matrix A;
The eigenvector ω was then normalized to sum to 1, yielding the final weights.
C I = λ m a x n n 1
where n is the order of the matrix.
The Consistency Ratio (CR) is then obtained by comparing the CI to the Random Index (RI):
C R = C I R I
The consistency of the pairwise comparisons was verified by ensuring the Consistency Ratio (CR) was less than 0.1.
This approach structures and mathematizes complex decision problems, making it particularly suitable for multi-objective, multi-criteria, or unstructured decision contexts. It facilitates scientific and systematic decision-making even with limited quantitative information.
The resulting judgment matrix is as follows:
A = 1.00 1.50 2.00 3.00 3.00 5.00 5.00 0.67 1.00 1.50 2.00 2.00 3.00 3.00 0.50 0.67 1.00 1.50 1.50 2.00 2.00 0.33 0.50 0.67 1.00 1.00 1.50 1.50 0.33 0.50 0.67 1.00 1.00 1.50 1.50 0.20 0.33 0.50 0.67 0.67 1.00 1.00 0.20 0.33 0.50 0.67 0.67 1.00 1.00
The maximum eigenvalue and its corresponding eigenvector of the aforementioned 7th-order matrix were solved using MATLAB 23.2.0 programming. The results show that the maximum eigenvalue λ m a x = 7.00 , the Consistency Index (CI) and Consistency Ratio (CR) were calculated as follows:
C I = λ m a x n n 1 = 7.00 7 6 = 0.00
C R = C I R I = 0.00 1.32 = 0.00
where n = 7 is the order of the matrix and RI = 1.32 is the random index for n = 7. The CR value of 0.00 indicates a perfectly consistent matrix, which is indeed uncommon in practice. This perfect consistency was achieved because the final judgment matrix was constructed by synthesizing expert opinions using the geometric mean, and the experts’ judgments themselves showed a high degree of internal consistency, likely due to their shared expertise and the clear patterns emerging from our numerical simulation results.
The eigenvector was normalized to sum to 1, yielding the final weights. The AHP results, including the final weights of each factor, are summarized in Table 10. The weights sum to 1.000, confirming the proper normalization. The corresponding eigenvector is v = [0.6455,0.5164,0.3873,0.2582,0.2582,0.1291,0.1291]^T. Based on these results, the weight values of each evaluation indicator are summarized in the Table 10.
Therefore, the order of importance of the influencing factors F1 to F7 in the collective collapse under seismic action is as follows: joint and bedding plane spacing (i.e., the degree of rock mass fragmentation) > seismic wave amplitude > cliff slope angle > unstable rock mass height = occurrence height > bedding plane dip angle = rock mass thickness.
The results indicate that the displacement angle during the collapse of an unstable rock mass is directly related to block size. Joint and bedding plane spacing directly determine the value range of the collapse displacement angle, while changes in other factors only affect the specific value within this range. The displacement angle increases with larger joint spacing. Therefore, determining whether rock collapse occurs requires first clarifying the value of joint spacing. Once the joint spacing is established, the possible range of the collapse displacement angle can be defined. For a layered unstable rock mass to collapse, the displacement angle of the block must exceed the minimum threshold value of the collapse angle.
The Analytic Hierarchy Process (AHP) is a systematic methodology that addresses complex multi-objective problems by treating them as integrated systems. It decomposes overarching goals into multiple hierarchical criteria, utilizes fuzzy quantification of qualitative indicators to calculate hierarchical single rankings (weights) and overall rankings, and thereby serves as a structured approach for optimizing multi-alternative decision-making. A distinctive feature of AHP is its ability to deeply analyze the essence of complex decision problems, including their influencing factors and internal relationships, while mathematicalizing the decision-making process with relatively limited quantitative information. This makes it particularly suitable for providing simplified decision-making solutions to complex problems characterized by multiple objectives, multiple criteria, or unstructured nature—especially in cases where decision outcomes are difficult to measure directly and accurately.
AHP offers advantages such as systematic structure, simplicity, and practicality, and requires relatively little quantitative data. However, its limitations include the inability to generate new decision alternatives, reliance on substantial qualitative input which may reduce persuasiveness, challenges in determining weights when dealing with excessive criteria (leading to large statistical data requirements), and computational complexity in accurately calculating eigenvalues and eigenvectors. In this study, the weights of various factors derived through AHP analysis based on seven influencing factors provide foundational data for further research on hazard assessment within geological disaster risk evaluation.
The weight values of the seven influencing factors obtained through the AHP method indicate that the degree of rock mass fragmentation (joint and bedding plane spacing) has a decisive influence on rockfall. This finding is strongly corroborated by existing research across various methodologies. Field investigation studies have consistently identified joint density and persistence as the primary factors controlling rock slope stability and failure modes [56,57]. Furthermore, both laboratory physical simulations and numerical analyses (e.g., Discrete Element Method, Finite Element Method) have repeatedly verified the positive correlation between rock mass strength and joint spacing, and confirmed the extreme vulnerability of fragmented rock masses under seismic loading [13,54]. Therefore, the AHP weighting analysis in this study, from a decision-science perspective, further confirms the central role of rock mass fragmentation in the risk assessment of dangerous rock collapses. This conclusion provides a critical basis for selecting support methods for fractured unstable rock masses and lays a foundation for further research on collapse risk assessment in areas prone to geological disasters involving fragmented rock formations.

5. Discussion: Engineering Implications and Limitations

The findings of this study provide a quantitative basis for risk assessment and mitigation design for rockfalls along the China–Pakistan Highway in the Kashi region. To contextualize these findings for engineering practice, it is essential to discuss their applicability and limitations.

5.1. Model Application and Scale Justification

The UDEC numerical model and the physical tests were designed based on extensive field surveys of the site. The geometric parameters (e.g., cliff heights of 50–140 m, slope angles of 70–90°) were scaled down to a representative numerical model and a laboratory-scale physical model with ratios ranging from approximately 1:100 to 1:200. This scaling allows for the capture of the fundamental mechanical behaviors, such as flexural toppling and block sliding, which are governed by the geometry of the blocks and the slope. The seven influencing factors analyzed are direct abstractions of the key field-observed variables. Therefore, the relative influence of these factors, as determined by the AHP weight analysis, is of direct value for prioritizing investigation and stabilization efforts in the field, even if absolute dimensional values differ.

5.2. Limitations and Scale Effects

Several limitations should be considered when extrapolating these results. First, the UDEC simulations are conducted in 2D, which inherently assumes a continuous geometry along the third dimension. This is a simplification of the real 3D rock mass, where lateral constraints and edge effects can influence failure mechanisms. Second, the physical model used uniform cement–mortar blocks, which cannot fully replicate the complex strength heterogeneity and time-dependent weathering processes of in situ rock. Third, while the seismic loading was applied, the model does not account for other environmental triggers like progressive water pressure build-up in fractures during rainfall. These limitations represent valuable directions for future research, including full 3D numerical modeling and more sophisticated physical simulants.

5.3. Validation with Field Evidence

The characteristic structure of the cliff-layered unstable rock mass, which our models successfully reproduced, is clearly visible in the field photograph of the China–Pakistan Highway site presented in Figure 1. The image shows the near-vertical slope, sub-horizontal bedding, and well developed vertical jointing that leads to the formation of unstable rock blocks. The failure modes observed in our simulations, primarily toppling and sliding of columnar blocks, are consistent with the failure scars and rockfall deposits observed in the field, providing qualitative validation for our modeling approach.

5.4. Representativeness of the Assumed Lithology and Materials

The selection of a weakly cemented sedimentary rock as the numerical lithology and the use of cement–mortar in the laboratory are justified for the scope of this study. The primary focus was on the kinematics of collapse and the relative influence of geometric and dynamic factors, which are predominantly controlled by the structure of the rock mass (joint orientation and spacing) rather than the intricate details of the intact rock’s constitutive law. The cement–mortar blocks, with a UCS of 15-20 MPa (Table 1), exhibit brittle failure and a strength range that is representative of highly weathered and/or weak rock masses commonly involved in rockfall events. Similarly, the UDEC parameters in Table 4 were chosen to reflect a rock mass where failure is preconditioned by discontinuities. While the absolute values of strength parameters influence the specific timing of collapse, we have demonstrated that the ranking of factor importance and the fundamental failure modes are robust findings relevant to a class of stratified, jointed rock slopes in seismically active regions.

6. Conclusions

This study systematically investigated the seismic collapse mechanisms of stratified steep cliffs through an integrated approach of shaking table tests, UDEC numerical simulations, and Analytic Hierarchy Process (AHP) analysis. The main conclusions are summarized as follows:
(1)
Collapse displacement angle is strongly correlated with joint spacing. Quantitative result: The collapse displacement angle ranged from 9 to 15°, 12 to 17°, and 16 to 21° for joint spacings of 1.0 m, 1.2 m, and 1.5 m, respectively. Interpretation: Larger joint spacing (i.e., lower fragmentation) increases the critical angle required for collapse initiation. Engineering implication: The displacement angle serves as a quantifiable precursor for early-warning systems; monitoring tilt beyond these thresholds can signal imminent collapse.
(2)
Degree of rock mass fragmentation is the most influential factor. Quantitative result: AHP weighting assigned the highest priority to fragmentation degree (weight = 0.278), followed by seismic amplitude (0.222) and cliff slope angle (0.167). Interpretation: Fragmentation governs both the failure mode and the displacement angle threshold. Engineering implication: Mitigation measures should prioritize reducing weathering and sealing joints to minimize fragmentation progression.
(3)
Nonlinear thresholds govern collapse timing and mode. Quantitative result: Critical thresholds include H1 = 80 m (transition in collapse timing), H2 = 45 m (block height stability limit), and β ≈ 70° (slope angle influence saturation). Interpretation: Collapse behavior shifts from self-stabilizing to destabilizing beyond these thresholds. Engineering implication: Slope design and reinforcement should account for these thresholds to avoid abrupt stability loss.
(4)
Seismic amplitude and slope angle significantly affect collapse initiation. Quantitative result: Seismic amplitude showed a positive correlation with collapse time, while slope angle exhibited a negative correlation until β ≈ 70°. Interpretation: Higher PGA delays collapse by prolonging the rocking phase, whereas steeper slopes accelerate it. Engineering implication: Slope angle reduction or seismic retrofitting may be effective in high-seismicity regions.
Practical Implications: The findings provide a quantitative basis for early-warning systems and slope design in stratified cliffs. For instance, real-time monitoring of the displacement angle using UAV or TLS technologies can trigger alerts when site-specific thresholds (e.g., 9–15° for closely jointed rock) are exceeded. In design, prioritizing anti-weathering treatments and avoiding slope angles beyond 70° can enhance long-term stability. The AHP weightings help engineers focus resources on the most critical factors—especially fragmentation control.
Limitations and Future Work: This study has several limitations: Laboratory-scale models may not fully capture field-scale heterogeneity. Two-dimensional UDEC simulations ignore 3D edge effects and lateral constraints. Idealized boundary conditions and absence of rainfall or groundwater effects. Limited parameter interactions due to the one-variable-at-a-time approach.
Future work should include: Field validation using monitoring data from real cliffs. Integration of rainfall and groundwater effects into dynamic models. Three-dimensional high-fidelity modeling to capture complex block interactions. Probabilistic or machine learning approaches for risk forecasting under multi-hazard scenarios.

Author Contributions

N.M.: Data curation, investigation, resources, methodology, validation, visualization, writing—original draft, writing—review and editing. R.L.: conceptualisation, investigation, methodology, resources, supervision, validation, visualization, data curation, writing—original draft, writing—review and editing. P.Z.: conceptualisation, drawing, software. J.Q.: conceptualisation, drawing. All authors have read and agreed to the published version of the manuscript.

Funding

This work was supported by the Key Research Projects of Kashi University [grant number (2024) 2877]; the Introduction of Talent Research Initiation Fund of Kashi University [grant number GCC2024ZK-018] and [grant number GCC2024ZK-017]; Xinjiang Key Laboratory Project of Engineering Materials and Structural Safety [grant number XKLEMSS2025B06].

Institutional Review Board Statement

Not applicable.

Informed Consent Statement

Not applicable.

Data Availability Statement

The datasets used and/or analyzed during the current study are available from the corresponding author upon reasonable request.

Acknowledgments

The authors gratefully acknowledge the financial support from the funding above.

Conflicts of Interest

The authors declare no conflict of interest.

References

  1. Huang, R.; Liu, W.; Zhou, J.; Pei, X. Experimental Field Study of Movement Characteristics of Rock Blocks Falling down a Slope. J. Earth Sci. 2010, 21, 330–339. [Google Scholar] [CrossRef]
  2. Hungr, O.; Leroueil, S.; Picarelli, L. The Varnes classification of landslide types, an update. Landslides 2014, 11, 167–194. [Google Scholar] [CrossRef]
  3. Crosta, G.B.; Agliardi, F. Failure forecast for large rock slides by surface displacement measurements. Can. Geotech. J. 2003, 40, 176–191. [Google Scholar] [CrossRef]
  4. Zhou, F.; Liu, X.; Tang, H.; Miao, M.; Xu, B.; Guo, X. Analysis of the frequency–response stability and reliability of a tower-column unstable rock mass on a high and steep slope. Sci. Rep. 2024, 14, 20308. [Google Scholar] [CrossRef] [PubMed]
  5. Berrett, B.; Fulmer, E.; Leshchinsky, B.; Olsen, M.; Massey, C.; Wartman, J. Simplified analysis of coseismic slope displacement and hillslope weakening. Eng. Geol. 2025, 352, 108058. [Google Scholar] [CrossRef]
  6. Najib, F.D.; Kodama, J.; Fujii, Y. The Deformation modes of rock slopes due to excavation in mountain-type mines. Mater. Trans. 2015, 56, 1159–1168. [Google Scholar] [CrossRef]
  7. Mufundirwa, A.; Fujii, Y.; Kodama, N.; Kodama, J.I. Analysis of natural rock slope deformations under temperature variation: A case from a cool temperate region in Japan. Cold Reg. Sci. Technol. 2011, 65, 488–500. [Google Scholar] [CrossRef]
  8. Ning, Y.; Shen, Y.; Ding, T.; Xu, P.; Duan, F.; Zhang, B.; Zhang, B.; Smith, J.V. Evolution Process of Toppling Deformations in Interbedded Anti-Inclined Rock Slopes. Appl. Sci. 2025, 15, 7727. [Google Scholar] [CrossRef]
  9. Ning, Y.B.; Zhang, G.C.; Tang, H.M.; Shen, W.C.; Shen, P.W. Process analysis of toppling failure on anti-dip rock slopes under seismic load in southwest China. Rock Mech. Rock Eng. 2019, 52, 4439–4455. [Google Scholar] [CrossRef]
  10. Tai, D.; Qi, S.; Zheng, B.; Luo, G.; He, J.; Guo, S.; Zou, Y.; Wang, Z. Effect of excitation frequency and joint density on the dynamic amplification effect of slope surface on jointed rock slopes. Eng. Geol. 2024, 330, 107385. [Google Scholar] [CrossRef]
  11. Antwi Buah, P.; Zhang, Y.; He, J.; Yu, P.; Xiang, C.; Fu, H.; He, Y.; Liu, J. Evaluating the dynamic response and failure process of a rock slope under pulse-like ground motions. Geomat. Nat. Hazards Risk 2023, 14, 2167613. [Google Scholar] [CrossRef]
  12. Zhou, H.X.; Che, A.L.; Zhu, R.J. Damage evolution of rock slopes under seismic motions using shaking table test. Rock Mech. Rock Eng. 2022, 55, 4979–4997. [Google Scholar] [CrossRef]
  13. Zang, M.; Yang, G.; Dong, J.; Qi, S.; He, J.; Liang, N. Experimental study on seismic response and progressive failure characteristics of bedding rock slopes. J. Rock Mech. Geotech. Eng. 2022, 14, 1394–1405. [Google Scholar] [CrossRef]
  14. Miao, S.; Su, L.; Zhang, C.; Liu, Z.; Wang, B.; Dong, Z. Dynamic response characteristics and damage failure process of bedding rock slope in shaking table test. Bull. Eng. Geol. Environ. 2024, 83, 358. [Google Scholar] [CrossRef]
  15. Negi, R.; Sati, S.P.; Sharma, V.; Samanta, M.; Kumar, V.; Puniya, M.K.; Rana, S.S.; Kanungo, D.P. Evaluating instability & failure pattern of landslides, Giri valley, Northwest Himalaya, India. Bull. Eng. Geol. Environ. 2024, 83, 271. [Google Scholar] [CrossRef]
  16. Bolla, A.; Paronuzzi, P. Geomechanical field survey to identify an unstable rock slope: The Passo della Morte case history (NE Italy). Rock Mech. Rock Eng. 2020, 53, 1521–1544. [Google Scholar] [CrossRef]
  17. Luo, W.; Liu, S.; Tao, Z.; Wang, H.; Gan, X. Nonlinear energy consumption analysis of shallow-buried bias tunnel stability with improvement of failure mode. Sci. Rep. 2025, 15, 25965. [Google Scholar] [CrossRef]
  18. Zhan, Z.; Qi, S.; He, N.; Zheng, B.; Ge, C. Shaking table test study of homogeneous rock slope model under strong earthquake. J. Eng. Geol. 2019, 27, 946–954. [Google Scholar]
  19. Frodella, W.; Ciampalini, A.; Gigli, G.; Lombardi, L.; Raspini, F.; Nocentini, M.; Scardigli, C.; Casagli, N. Synergic use of satellite and ground based remote sensing methods for monitoring the San Leo rock cliff (Northern Italy). Geomorphology 2016, 264, 80–94. [Google Scholar] [CrossRef]
  20. Arnold, L.; Wartman, J.; MacLaughlin, M. Seismically-induced failure mechanisms in massive rock slopes. Eng. Geol. 2025, 352, 108046. [Google Scholar] [CrossRef]
  21. Liu, W.L.; Dong, J.X.; Xu, H.H.; Sui, S.G.; Yang, R.X.; Zhou, L.S. Trajectory analysis and risk evaluation of dangerous rock mass instability of an overhang slope, southwest of China. Adv. Civ. Eng. 2021, 2021, 7153535. [Google Scholar] [CrossRef]
  22. Akin, M.; Dinçer, İ.; Orhan, A.; Varol, O.O. A comparative study on rockfall block motion characteristics using 3-D and 2-D rockfall simulations: A case study from Cappadocia (Mazı, Türkiye). Nat. Hazards 2025, 121, 2265–2291. [Google Scholar] [CrossRef]
  23. Zhu, H.; Yang, Z.; Cheng, L.; Luo, R.; Liu, Z. Study on rockfall trajectory of dangerous rocks based on rocfall numerical simulation: A case study of a section of dangerous rocks in the three gorges reservoir area. Sci. Technol. Innov. 2020, 19, 45–46. [Google Scholar]
  24. Jianqun, H. Application of Rocfall software in engineering design of geological disaster prevention and control of collapse. Eng. Constr. Des. 2020, 12, 33–34. [Google Scholar]
  25. Zhang, S.; Luo, Y. Discussion on prevention and control method of boulder falling in high and steep building slope based on rocfall simulation. Guangdong Civ. Eng. Archit. 2019, 26, 54–63. [Google Scholar]
  26. Luo, C.; Xiang, Z.; Chen, R. Rockwall design based on Rocfall. Nonferrous Met. Des. 2018, 45, 12–23. [Google Scholar]
  27. Fu, X.; Sheng, Q.; Zhang, Y.; Chen, J.; Leng, X. Extension of discontinuous deformations analysis method to simulate seismic response of large rock cavern complex. Int. J. Geomech. (ASCE) 2017, 17, E4016008. [Google Scholar] [CrossRef]
  28. Wang, L.; Yongfeng, C.; Xingxin, N. Calculation and application of blasting force transport distance based on rocfall numerical simulation. Min. Res. Dev. 2015, 35, 8–11. [Google Scholar]
  29. Fu, X.; Sheng, Q.; Tang, H.; Chen, J.; Du, Y.; Zhang, Z.; Mei, H. Seismic stability analysis of a rock block using the block theory and Newmark method. Int. J. Numer. Anal. Methods Geomech. 2019, 43, 1392–1409. [Google Scholar] [CrossRef]
  30. Zeng, S. Application of rocfall software in the design of dangerous rock collapse. China Water Transp. (Second. Mon.) 2011, 11, 211–212. [Google Scholar]
  31. Xu, J.; Zhang, M.; Fan, W. A review of geological hazard risk evaluation. Disaster 2015, 30, 130–134. [Google Scholar]
  32. Xiang, X.; Huang, R. Risk evaluation and risk management of geological hazards. Geol. Hazards Environ. Prot. 2000, 11, 38–41. [Google Scholar]
  33. Xu, B.; Liu, X.; Zhou, X.; Liang, Y.; Cai, P.; Han, Y.; Tu, Y.; Deng, Z.; Xie, Y.; Huang, J. Investigation of the dynamic response pattern and instability mechanism of a bedding rock slope subjected to frequent seismic loads. Int. J. Geomech. 2024, 24, 04024117. [Google Scholar] [CrossRef]
  34. Borgeat, X.; Glueer, F.; Häusler, M.; Hobiger, M.; Fäh, D. On the variability of the site-response parameters of the active rock slope in Brienz/Brinzauls (Switzerland). Geophys. J. Int. 2025, 240, 779–790. [Google Scholar] [CrossRef]
  35. Fattahi, H.; Hematian, M. Integrating Block Theory and Reliability Methods for Enhanced Stability in Underground Construction: A Case Study. Min. Metall. Explor. 2025, 42, 1693–1715. [Google Scholar] [CrossRef]
  36. Liu, W.L.; Dong, J.X.; Sui, S.G.; Xu, H.H.; Yang, R.X.; Shen, Z.L. Stability assessment of dangerous rock mass of an overhanging slope in Puerdu Town, Southwestern China. Adv. Civ. Eng. 2021, 2021, 6526417. [Google Scholar] [CrossRef]
  37. Ishizaka, A.; Labib, A. Review of the main developments in the analytic hierarchy process. Expert Syst. Appl. 2011, 38, 14336–14345. [Google Scholar] [CrossRef]
  38. Saaty, T.L. A scaling method for priorities in hierarchical structures. J. Math. Psychol. 1977, 15, 234–281. [Google Scholar] [CrossRef]
  39. Deng, F.; Pu, J.; Huang, Y.; Han, Q. 3D geological suitability evaluation for underground space based on the AHP-cloud model. Undergr. Space 2023, 8, 109–122. [Google Scholar] [CrossRef]
  40. Liu, Y.; Ouyang, Z.; Yi, H.; Qin, H. Study of the multilevel fuzzy comprehensive evaluation of rock burst risk. Sustainability 2023, 15, 13176. [Google Scholar] [CrossRef]
  41. Zhang, R.; Tian, D.; Wang, H.; Kang, X.; Wang, G.; Xu, L. Risk assessment of compound dynamic disaster based on AHP-EWM. Appl. Sci. 2023, 13, 10137. [Google Scholar] [CrossRef]
  42. Dong, F.; Wang, S.; Yang, Y.; Ren, M.; Demisa, M.G.; Zhang, R. Research on dynamic fuzzy prediction method for surrounding rock stability of mountain tunnels throughout the construction period. Tunn. Undergr. Space Technol. 2025, 158, 106390. [Google Scholar] [CrossRef]
  43. Liu, X.; Lang, Q.; Zhang, J.; Zhang, Y.; Yu, C.; Jin, Q.; Liu, Y.; Liu, Z.W.P. Dynamic failure mechanisms and hazard evaluation of rock collapse induced by extreme rainfall in Changbai County highways. Sci. Rep. 2025, 15, 9794. [Google Scholar] [CrossRef]
  44. Xu, C.S.; Jiang, Z.W.; Du, X.L.; Shen, Y.Y.; Chen, S. 1-g shaking table tests of precast horseshoe segmental tunnel: Experimental design, dynamic properties, deformation mode and damage pattern. Tunn. Undergr. Space Technol. 2021, 113, 103976. [Google Scholar] [CrossRef]
  45. Yang, Y.S.; Yu, H.T.; Yuan, Y.; Sun, J. 1 g Shaking table test of segmental tunnel in sand under near-fault motions. Tunn. Undergr. Space Technol. 2021, 115, 104080. [Google Scholar] [CrossRef]
  46. Srilatha, N.; Latha, G.M.; Puttappa, C.G. Effect of frequency on seismic response of reinforced soil slopes in shaking table tests. Geotext. Geomembr. 2013, 36, 27–32. [Google Scholar] [CrossRef]
  47. Yang, G.X.; Qi, S.W.; Wu, F.Q.; Zhan, Z.F. Seismic amplification of the anti-dip rock slope and deformation characteristics: A large-scale shaking table test. Soil Dyn. Earthq. Eng. 2017, 115, 907–916. [Google Scholar] [CrossRef]
  48. Yang, Z.P.; Tian, X.; Jiang, Y.W.; Liu, X.R.; Hu, Y.X.; Lai, Y.L. Experimental study on dynamic characteristics and dynamic responses of accumulation slopes under frequent microseisms. Arab. J. Geosci. 2020, 13, 770. [Google Scholar] [CrossRef]
  49. Panah, A.K.; Eftekhari, Z. Shaking table tests on polymeric-strip reinforced-soil walls adjacent to a rock slope. Geotext. Geomembr. 2021, 49, 737–756. [Google Scholar] [CrossRef]
  50. Dong, J.Y.; Wang, C.; Huang, Z.Q.; Yang, J.H.; Xue, L. Shaking table model test to determine dynamic response characteristics and failure modes of steep bedding rock slope. Rock Mech. Rock Eng. 2022, 55, 3645–3658. [Google Scholar] [CrossRef]
  51. Kuo, C.-Y.; Chang, K.-J.; Tsai, P.-W.; Wei, S.-K.; Chen, R.-F.; Dong, J.-J.; Yang, C.-M.; Chan, Y.-C.; Tai, Y.-C. Identification of co-seismic groundmotion due to fracturing and impact of the Tsaoling landslide, Taiwan. Eng. Geol. 2015, 196, 268–279. [Google Scholar] [CrossRef]
  52. Hoek, E.; Brown, E.T. The Hoek–Brown failure criterion and GSI–2018 edition. J. Rock Mech. Geotech. Eng. 2019, 11, 445–463. [Google Scholar] [CrossRef]
  53. Jaeger, J.C.; Cook, N.G.W.; Zimmerman, R. Fundamentals of Rock Mechanics; John Wiley & Sons: Hoboken, NJ, USA, 2009. [Google Scholar]
  54. Bahaaddini, M.; Hagan, P.C.; Mitra, R.; Hebblewhite, B.K. Scale effect on the shear behaviour of rock joints based on a numerical study. Eng. Geol. 2014, 181, 212–223. [Google Scholar] [CrossRef]
  55. Goodman, R.E. Block theory and its application. Geotechnique 1995, 45, 383–423. [Google Scholar] [CrossRef]
  56. Sewnun, D.; Joughin, W.C.; Armstrong, R.; Cooper, A. Keyblock stability analysis of longhole stopes. In Proceedings of the ISRM AfriRock-Rock Mechanics for Africa, Cape Town, South Africa, 3–5 October 2017. ISRM-AFRIROCK-2017-087. [Google Scholar]
  57. Agliardi, F.; Crosta, G.B.; Meloni, F.; Valle, C.; Rivolta, C. Structurally-controlled instability, damage and slope failure in a porphyry rock mass. Tectonophysics 2013, 605, 34–47. [Google Scholar] [CrossRef]
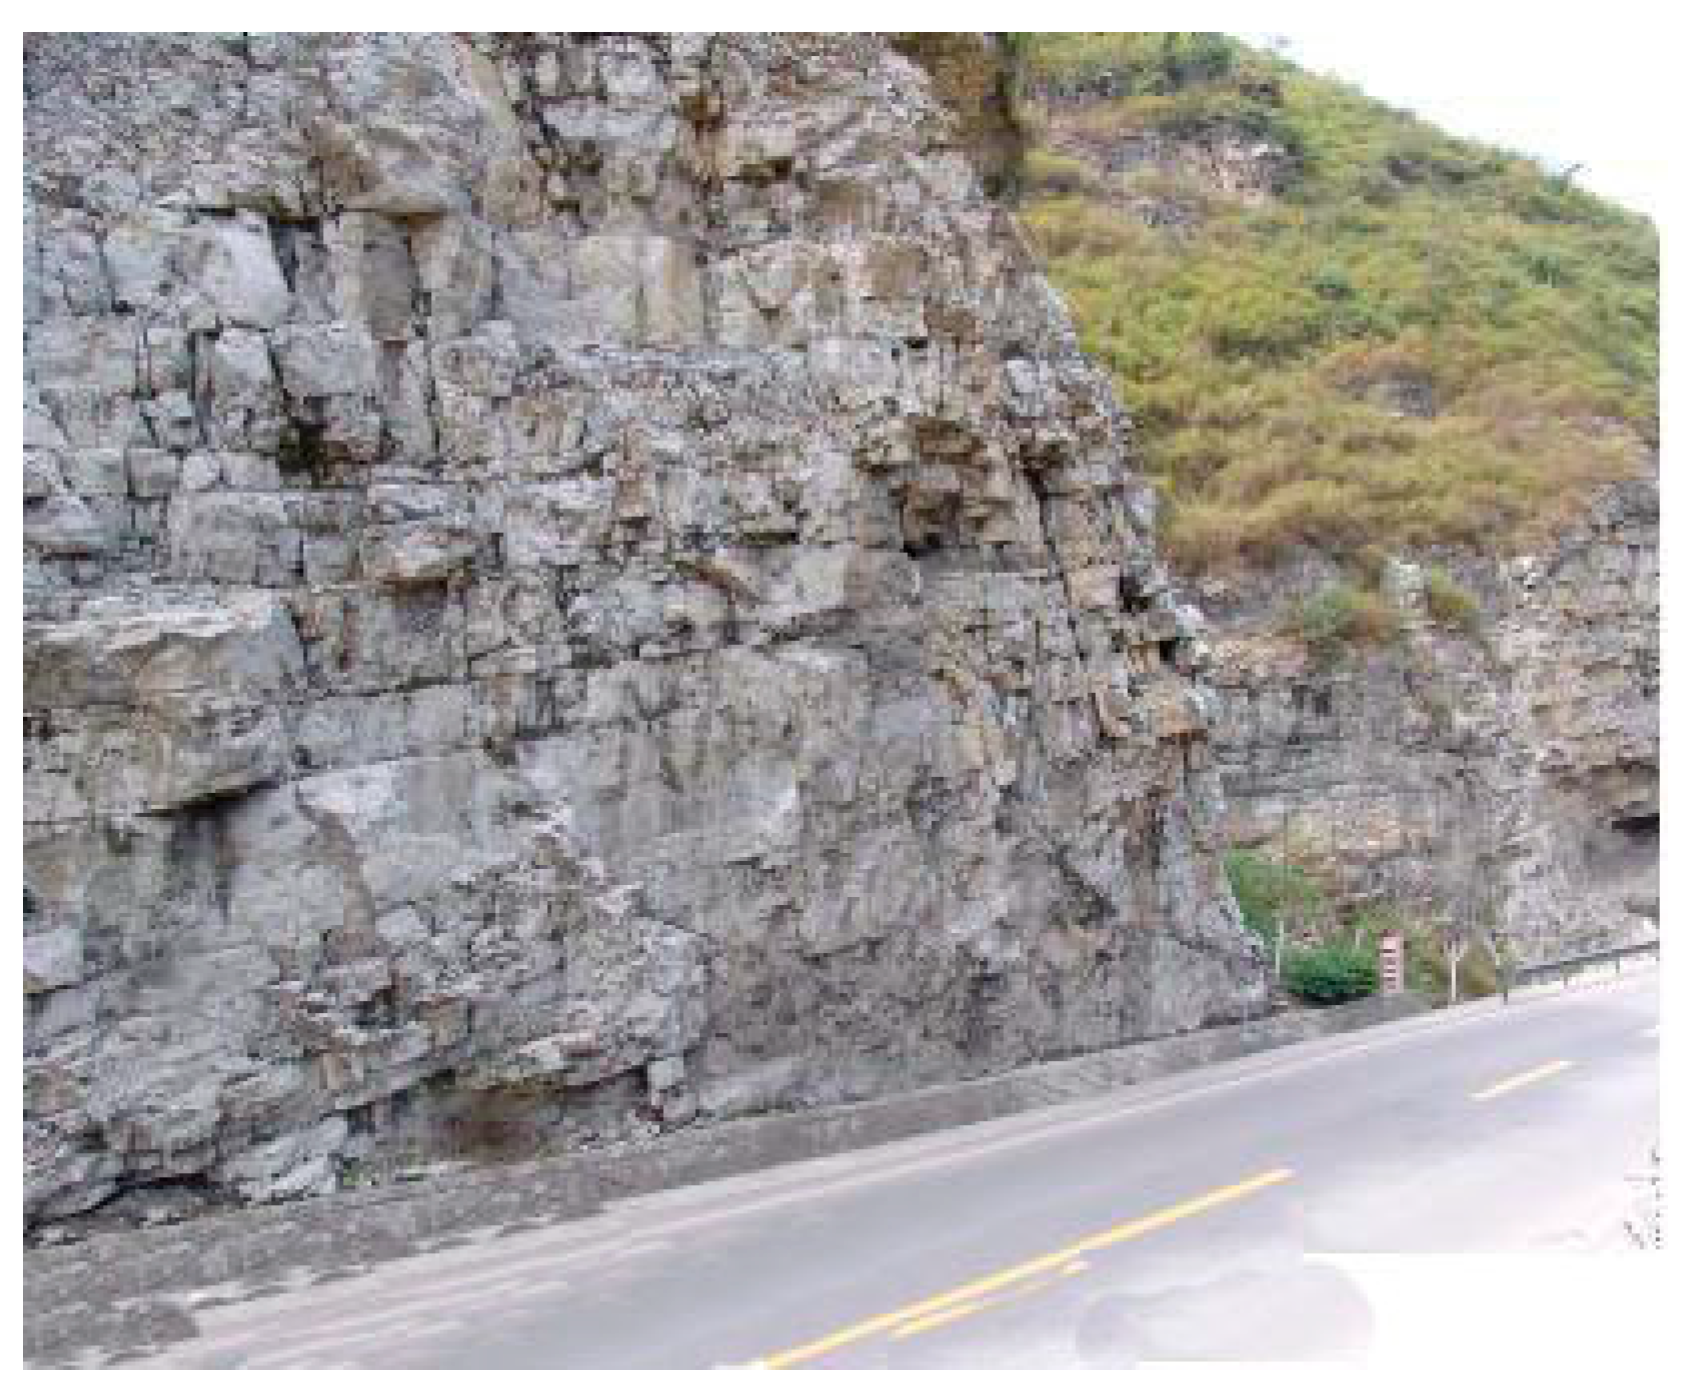
Figure 1. Field photograph of a typical cliff with layered unstable rock mass along the China–Pakistan Highway in the Kashi region, showing the engineering geological context of this study. The outcrop exhibits the key features modeled in this research: a steep cliff face, stratified rock layers, and a network of vertical joints that delineate potentially unstable rock blocks.
Applsci 15 12485 g001
Figure 2. Shaking test platforms (1—mold; 2—rock block; 3—seismic wave input computer; 4—high-definition camera; 5—nodal angle control plate; 6—shaker).
Applsci 15 12485 g002
Figure 3. Failure forms at different times of the block collapse.
Applsci 15 12485 g003
Figure 4. Definition and measurement of the displacement angle. (a) Schematic diagram defining the displacement angle as the angle between the major axis of the rocking rock column and the original joint line. (b) A practical measurement screen of Pickpick software, obtaining the displacement angle value (14.7°) directly.
Applsci 15 12485 g004
Figure 5. Displacement angle-time curves showing avalanche displacement of critical rock masses under different conditions. (a) different dangerous rock heights. (b) varying fragmentation degrees. (c) different joints. (d) varying seismic intensities.
Applsci 15 12485 g005
Figure 6. Schematic diagram of the 2D UDEC numerical model, defining the key geometric parameters.
Applsci 15 12485 g006
Figure 7. Validation of the UDEC numerical model against shaking table test results for the baseline case. (a) Displacement angle in the physical test. (b) Displacement angle simulated by UDEC.
Applsci 15 12485 g007
Figure 8. UDEC Numerical Simulation Typical Interface.
Applsci 15 12485 g008
Figure 9. Kinematic characteristics and collapse threshold identification under different occurrence heights. (ad) Horizontal (X) and vertical (Y) displacement–time curves for H1 = 40 m, 60 m, 80 m, and 100 m.
Applsci 15 12485 g009
Figure 10. Displacement maps illustrating the influence of seven key parameters. (a) Different occurrence height of unstable rock mass H1. (b) Different height of unstable rock mass H2. (c) Different cliff slope angle β. (d) Different degrees of rock mass fragmentation. (e) Different bedding plane inclination angle α. (f) Different thickness of unstable rock mass b. (g) Different seismic wave amplitude λ.
Applsci 15 12485 g010aApplsci 15 12485 g010b
Figure 11. The comprehensive map of displacement in Y-t direction. (a) Different occurrence height of unstable rock mass H2. (b) Different height of unstable rock mass h. (c) Different cliff slope angle β. (d) Different degrees of rock mass fragmentation. (e) Different bedding plane inclination angle α. (f) Different thickness of unstable rock mass b. (g) Different seismic wave amplitude λ.
Applsci 15 12485 g011aApplsci 15 12485 g011b
Figure 12. The collapse displacement angle ((A): joints spacing is 1 m; (B): joints spacing is 1.2 m; (C): joints spacing is 1.5 m).
Applsci 15 12485 g012
Table 1. Composition, mixture proportion, and mechanical parameters of the analog rock material.
PropertyValueUnitRemarks
Primary CompositionOrdinary Cement, Fine Sand, Water-Typical cement–mortar mixture
Mixture Proportion (by weight)1:2:0.45-Cement:Sand:Water
Density (ρ)2250 ± 50kg/m3Measured
Uniaxial Compressive Strength (UCS, σc)18 ± 2MPaTested on 50 mm cubes
Young’s Modulus (E)18 ± 2GPaSecant modulus at 50% of peak UCS
Cohesion (c)3.5 ± 0.5MPaDerived from direct shear test on mortar specimens
Internal Friction Angle (φ)35 ± 2°Derived from direct shear test on mortar specimens
Table 2. Similarity ratio of the model test.
CategoryPhysical QuantitySymbolScale FactorValue
GeometryLength α L L m / L p 1/100
Angle α β 11
Material Density α ρ ρ m / ρ p 1
Unit Weight α γ γ m / γ p 1
Elastic Modulus α E E m / E p 1
Poisson’s Ratio α μ 11
Dynamic LoadingAcceleration α a 11
Time α t α L 1 / 2 1/10
Frequency α f α L 1 / 2 10
Velocity α v α L 1 / 2 1/10
Displacement α δ α L 1/100
Note: The assumption of α ρ = α E = 1 is an idealization for material similarity. The cement–mortar used in this study was designed to approximate these requirements for weak rock behavior.
Table 3. Frequency and amplitude values of sine waves.
Earthquake Intensity
Accelerations
Frequency f (Hz)Amplification A (mm)
80.2 g35.5
3.54
70.1 g32.76
26.2
60.05 g23.1
1.55.5
Note: acceleration a = 4Af2π2.
Table 4. Experimental test scheme.
Case IDBlock Size (cm)Stacking Height (cm)Nodal
Angle (°)
PGA (g)Primary Factor
Investigated
B330800.1Baseline
Variation in Block Size (Fragmentation Degree)S11.530800.1Block Size
S2530800.1
Variation in Stacking HeightH1327800.1Stacking Height
H2333800.1
H3336800.1
Variation in Nodal AngleA1330600.1Nodal Angle
A2330700.1
A3330900.1
Variation in Seismic Intensity (PGA)P1330800.05PGA
P2330800.2
Table 5. Mechanical parameters and simulation settings used in the UDEC numerical model.
ComponentParameterSymbolValueUnitRemarks/Source
Intact RockDensityρ2650kg/m3Typical for sandstone/siltstone [52]
Young’s ModulusE15 GPaGPaEstimated based on UCS and typical values for weak rock [52]
Poisson’s Ratioν0.25-Typical value [52]
Uniaxial Compressive Strength (UCS)σc 40 MPaRepresentative of weak to medium rock [52]
DiscontinuitiesNormal Stiffnesskn50GPa/mEstimated based on joint properties and rock modulus [53]
Shear Stiffnessks20 GPa/mEstimated based on joint properties and rock modulus [53]
Cohesioncj 0.1MPaAssumed low value for clean, non-persistent joints
Friction Angleϕ30°Typical residual friction for rock joints [53]
Tensile Strengthσt0MPaAssumed zero for open/weathered joints
Simulation SettingsRayleigh Damping Ratioξ0.02 (2%)Common value for geotechnical dynamic analysis [53]
Mesh Size (average)-0.5mDetermined from mesh sensitivity analysis
Table 6. Numerical Simulation: Design of 7 Key Factor Parameters.
SymbolH1 (m)H2 (m)β (o)d1 (m)d2 (m)b (m)α (o)λ (m/s2)
Significanceoccurrence height of unstable rock massheight of unstable rock mass cliff slope angleInterlayer spacingJoint spacingthickness of unstable rock massbedding plane inclination angleseismic wave amplitude
Value range40~10015~6060~901~21~23~6−5~100.7~1.3
Table 7. Numerical Simulation Solution.
NoH1 (m)H2 (m)β (o)d1 (m)d2 (m)b (m)α (o)λ (m/s2)
1–440, 60, 80, 10015011300.9
5–84015, 30, 45, 60011300.9
9–12401560, 70, 80, 9011400.9
12–161001501, 1.2, 1.5, 21, 1.2, 1.5, 2600.9
17–204015901160, 5, 10, −50.9
21–2440150113, 4, 5, 600.9
25–286015011300.7, 0.9, 1.1, 1.3
Table 8. Summary of collapse modes under different influencing factors.
FactorsSymbolObserved Effect on Failure ModeFailure Type Transition
Occurrence HeightH1The rock mass undergoes integral toppling failure above the one-third height point, while secondary collapse occurs below it, resulting in minimal residual blocks.No
Block HeightH2H2 < 45 m: The upper section above the inflection point experiences integral toppling failure, while the lower section undergoes secondary collapse.
H2 > 45 m: The failure pattern exhibits two inflection points, resulting in an S-shaped collapse trajectory.
Yes
Cliff Slope Angleββ > 80°: No significant relative displacement is observed between columns. The upper section experiences integral toppling failure, and the completeness of the collapse increases with the slope angle.
β ≤ 80°: The slope exhibits relatively good stability. The outermost column develops an inflection point and undergoes toppling failure, followed by the second and third columns, resulting in progressive spalling-type collapse from the exterior inward.
Yes
Degree of Fragmentationd1, d2When the rock mass is fragmented, it collapses in an irregular, granular manner, with a significant number of blocks remaining at the base, while the upper sections experience more complete collapse.
When the rock mass is intact, it undergoes strip-shaped toppling failure along vertical joints, spalling from the free surface. Few blocks remain at the base, though those adjacent to the bedrock may remain stable without collapsing.
Yes
Rock Layer Thicknessbb < 6 m: The upper section experiences integral toppling failure with no relative displacement between columns.
b ≥ 6 m: Relative displacement occurs between columns.
Yes
Bedding Plane InclinationαThe section above the inflection point experiences integral toppling failure. A lower dip angle results in a greater volume of residual blocks.No
Seismic Wave AmplitudeλThe integral toppling failure in the upper section triggers secondary collapse in the lower part.No
Table 9. Summary of collapse initiation time under different influencing factors.
FactorsSymbolStarting Time of CollapseInduces Change in Time
Occurrence HeightH1H1 < 80 m, H1 is positively correlated with collapse time.
H1 > 80 m, H1 is negatively correlated with collapse time.
Yes
Block HeightH2h < 45 m, h is positively correlated with collapse time.
h > 45 m, No correlation between h and collapse time.
Yes
Cliff Slope Angleββ is negatively correlated with collapse time;
A slope threshold exists between 60° and 70°.
Yes
Degree of Fragmentationd1, d2The more fragmented the rock mass, the earlier the collapse initiation time.Yes
Rock Layer Thicknessbb shows no significant correlation with collapse time.No
Bedding Plane InclinationαNo Significant Impact.No
Seismic Wave AmplitudeλAmplitude is positively correlated with collapse time.Yes
Table 10. The weight value of the evaluation index.
FactorsOccurrence Height of Unstable Rock MassHeight of Unstable Rock MassThickness of Unstable Rock MassDegree of Rock Mass FragmentationCliff Slope AngleBedding Plane Inclination AngleSeismic Wave Amplitude
SymbolH1 (m)H2 (m)β (o)d1, d2 (m)b (m)α (o)λ (m/s2)
Denoted asF1F2F3F4F5F6F7
Weight Value0.27780.22220.16670.11110.11110.05560.0556
Disclaimer/Publisher’s Note: The statements, opinions and data contained in all publications are solely those of the individual author(s) and contributor(s) and not of MDPI and/or the editor(s). MDPI and/or the editor(s) disclaim responsibility for any injury to people or property resulting from any ideas, methods, instructions or products referred to in the content.