Article

Experimental Investigation on the Mechanisms of Fiber Bragg Gratings to Monitor the Failure Processes of Pre-Cracked Sandstone Specimens

School of Energy Science and Engineering, Henan Polytechnic University, Jiaozuo 454000, China
*
Authors to whom correspondence should be addressed.
Appl. Sci. 2025, 15(22), 12266; https://doi.org/10.3390/app152212266
Submission received: 9 October 2025 / Revised: 12 November 2025 / Accepted: 14 November 2025 / Published: 19 November 2025
(This article belongs to the Special Issue Novel Insights into Rock Mechanics and Geotechnical Engineering)

Abstract

Real-time monitoring of internal fracture evolution in fractured rock masses using fiber Bragg grating (FBG) technology can help mitigate geotechnical hazards. This study employed FBG, acoustic emission (AE), and digital image correlation (DIC) to analyze pre-cracked sandstone under uniaxial compression. During the failure of the pre-cracked specimens, the FBGs experienced non-uniform stresses. In the initial loading phase, the stress concentrations at the crack tips and the wing-crack development were dominated by tensile stresses, and the maximum tensile strain was 1.01%. After the initial yield strength was reached, the crack-propagation process transitioned to shear-stress dominance, and a maximum shear strain of 6.45% was exhibited. During multiple stress decreases (180–250 s), the FBG-measured local shear and tensile strains reflected stress variations that were associated with shear-locking effects and failure stages. Before the tensile-crack initiation, the FBG-detected principal-strain concentration zones exhibited prolonged incubation periods, whereas the shear-crack initiation was preceded by shorter incubation periods. The evolution curves of the damage variable, which was defined by the FBG coupling strength, could be categorized into three distinct stages: initial damage accumulation, damage acceleration, and final damage. When the initial yield strength was reached, the damage variable rapidly increased, particularly during the two stress decreases.

1. Introduction

Natural rock masses contain numerous pre-existing defects, such as fractures, pores, joints, and faults, which are formed during complex diagenetic processes [1]. These structural discontinuities significantly degrade the mechanical properties of the rock masses and are the primary triggers for instability [2]. In both surface and underground geotechnical engineering applications, the failure of the surrounding rock is fundamentally attributed to the propagation and coalescence of internal fractures due to excavation-induced disturbances; these failures lead to marked reductions in the rock strength and eventual macroscopic instability. Therefore, the performance of real-time monitoring of fracture evolution in rock masses and the use of preventive measures are critical to the mitigation of geotechnical hazards.
Monitoring fracture propagation in rock masses is critically enabled by established non-destructive techniques including acoustic emission (AE) [3,4], digital image correlation (DIC) [5], computed tomography (CT) scanning [6], scanning electron microscopy (SEM) [7], and optical imaging techniques [8]. These methodologies collectively provide multi-scale characterization capabilities essential for geomechanical analysis. While AE can capture elastic-wave signals during dynamic crack propagation, its spatial resolution for crack localization remains limited [9]. CT scanning provides 3D internal structural data; however, it is cost-prohibitive and unsuitable for real-time field monitoring [10]. Furthermore, SEM enables microscopic analysis but requires complex sample preparation and cannot be applied to large-scale specimens [11]. DIC facilitates non-contact surface-deformation measurements but is sensitive to the lighting conditions [12]. Collectively, these methods are limited with respect to spatial resolution, real-time operation, anti-interference performance, and distributed monitoring feasibility [13,14,15].
In recent years, the fiber Bragg grating (FBG) sensing technique has become popular in rock mechanics research due to the compact size of the equipment, high sensitivity, electromagnetic immunity, long-distance transmission capability, and distributed multi-point monitoring capabilities [16,17,18]. Laboratory studies have validated the effectiveness of FBGs when they are used for rock-deformation monitoring; in these applications, FBGs are embedded in or surface-bonded to the rock mass. For instance, Chai et al. [19] achieved a measurement accuracy of 0.5 με by embedding FBGs in cement mortar; this method outperformed conventional strain gauges by an order of magnitude. Hatenberger et al. [20] bonded FBGs to rock surfaces under uniaxial compression conditions, and they obtained strain data that were consistent with the actual rock deformation. Yang et al. [21] performed comparative tests that demonstrated that the accuracy of FBGs is superior to that of strain gauges. Wei et al. [22] conducted cyclic loading experiments that confirmed the consistency of an FBG-MTS system. Zhao et al. [23] verified the sub-micron displacement detection accuracy of an FBG in granite when they obtained a resolution of 0.8 μm. These systematic laboratory investigations provided a rigorous experimental foundation for using FBGs in rock-deformation monitoring applications. By building upon these validated methodologies, the FBG technique has been successfully used to monitor stresses in surrounding rock masses in field applications. For instance, Tang et al. [24] implemented a 500 m distributed FBG monitoring system in a tunnel and achieved a stress resolution of 0.1 MPa. Fang et al. [25] developed a 128-channel FBG system that revealed stress redistribution patterns in coal mine roadways with a spatial resolution of 2 cm. In addition, Piao et al. [26] monitored overburden deformation during mining and achieved a strain accuracy of 0.01% over 300 days.
However, current FBG research in the rock mechanics field predominantly focuses on pre-peak elastic deformation monitoring, while investigations of non-uniform strain fields during crack propagation remain scarce. When microcracks initiate and propagate in rocks, they create highly localized strain concentrations (in zones typically with widths of <1 mm) that challenge conventional FBG interpretation methods [27]. In materials science research, advanced FBG spectral-analysis techniques have been developed for crack monitoring. Zhao et al. [28] established a quantitative relationship between the spectral-area variation and the crack opening displacement (COD) in metals that has a detection threshold of 5 μm. P. Giaccari et al. [29] correlated FBG spectral splitting patterns with the crack propagation velocity in composites and achieved a velocity resolution of 0.1 mm/s. Zhang et al. [30] developed a damage index based on the spectral width that exhibited a correlation of 0.95 with the crack length in aluminum alloys. Guo et al. [31] attached an FBG to a high-strain-gradient region of a double-hole cantilever beam and observed a linear dependence of spectral bandwidth broadening on applied pressure. Nevertheless, the existing methodologies are fundamentally constrained by homogeneous material assumptions; these assumptions have created a critical knowledge gap for FBG-based monitoring of fracture evolution in inherently heterogeneous rock systems.
To resolve these fundamental limitations, systematic FBG monitoring experiments with pre-cracked sandstone specimens that were subjected to uniaxial compression were conducted during this study. The characteristic FBG spectral evolution during rock failure was investigated, and the bandwidth expansion and peak reflectivity were used as indicators for localized tensile and shear strains during the crack-propagation process. Furthermore, a damage variable that is based on the FBG coupling strength was proposed as a way to quantitatively describe the rock fracture process. The study findings provide both a novel methodology and a technical framework for real-time monitoring of fracture development in rock masses.

2. Materials and Methods

2.1. Specimen Preparation

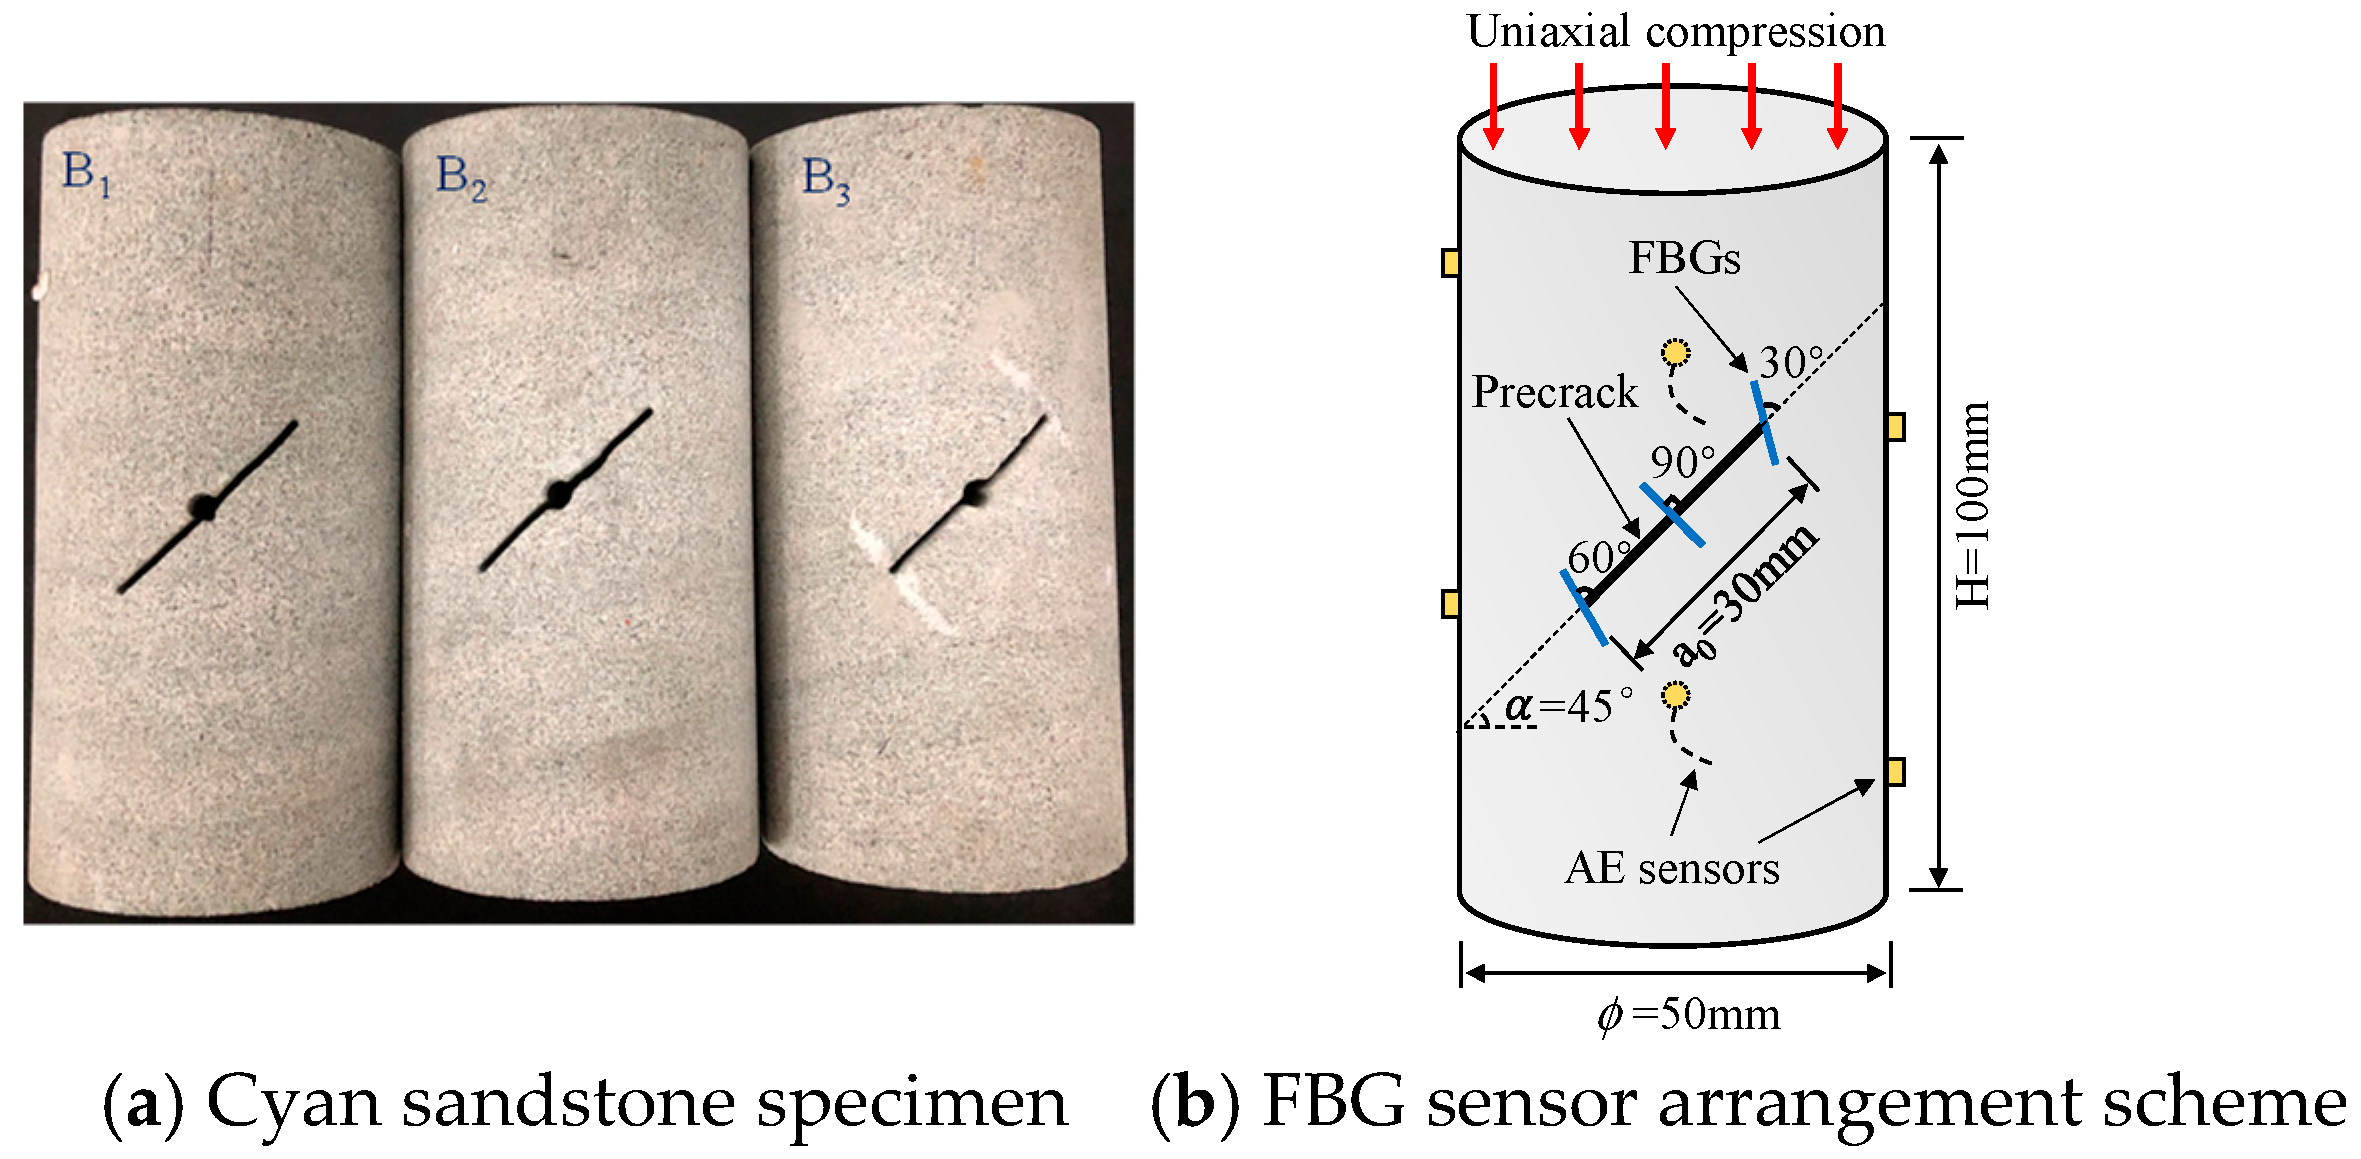
The experimental specimens were prepared using cyan sandstone with an average density of 2.4 g·cm−3 and a P-wave velocity of 3.4 km·s−1. In accordance with the ISRM testing standards, the sandstone was machined into standard cylindrical specimens that had diameters of 50 mm and heights of 100 mm. The end surfaces were ground to ensure parallelism within 0.1 mm, and they were inspected to confirm the absence of visible defects. Green sandstone specimens contained prefabricated through-going fractures. According to classical fracture mechanics theory, the theoretical angle of maximum tensile stress concentration at pre-crack tips under uniaxial compression is determined by [32]:
θ = tan 1 ( τ max σ n ) 45 ° ,
where τmax is the maximum shear stress and σn is the normal pressure. Pure Mode-I exhibit maximum tension concentration at θ = 70.5°, but shear-tension coupling under compression shifts this to 45–55°. At 45°, tensile concentration peaks, inducing characteristic wing cracks perpendicular to the main fracture—a signature rock failure mode. Per ISRM standards (a/L ≤ 0.4 to prevent splitting), fracture geometry was: width = 1 mm, length = 30 mm, inclination = 45° ± 0.5° to loading axis. The FBGs were placed at 30, 60, and 90° angles with respect to the fracture plane so that they would capture multi-directional strain responses. Prior to FBG bonding, all sensors underwent inspection; damaged units were replaced with new FBGs. EPON 828 epoxy adhesive (elastic modulus Ea = 2.5 GPa) was employed to match the cyan sandstone’s modulus, minimizing strain transfer loss. The epoxy was uniformly coated on the specimen surface, and FBGs were bonded at designated angles to ensure complete coverage of both grating and surrounding areas. Specimens were then cured at ambient conditions for 24 h to achieve full polymerization.
The classic strain transfer model proposed by A. Farhad governs FBG sensors, with core equations [33]:
S T E = 1 tan h ( β L / 2 ) β L / 2   ( β = G a E f t f t a ) ,
where Ga is the shear modulus of the adhesive, Ef is the elastic modulus of the FBG, tf is the fiber diameter, ta is the adhesive layer thickness, and L is the grating length. Substituting these parameters into the equation yields a calculated strain transfer efficiency (STE) of approximately 96.2%. The complete specimen geometry and FBG configuration are illustrated in Figure 1.

2.2. Experimental Loading Strategy

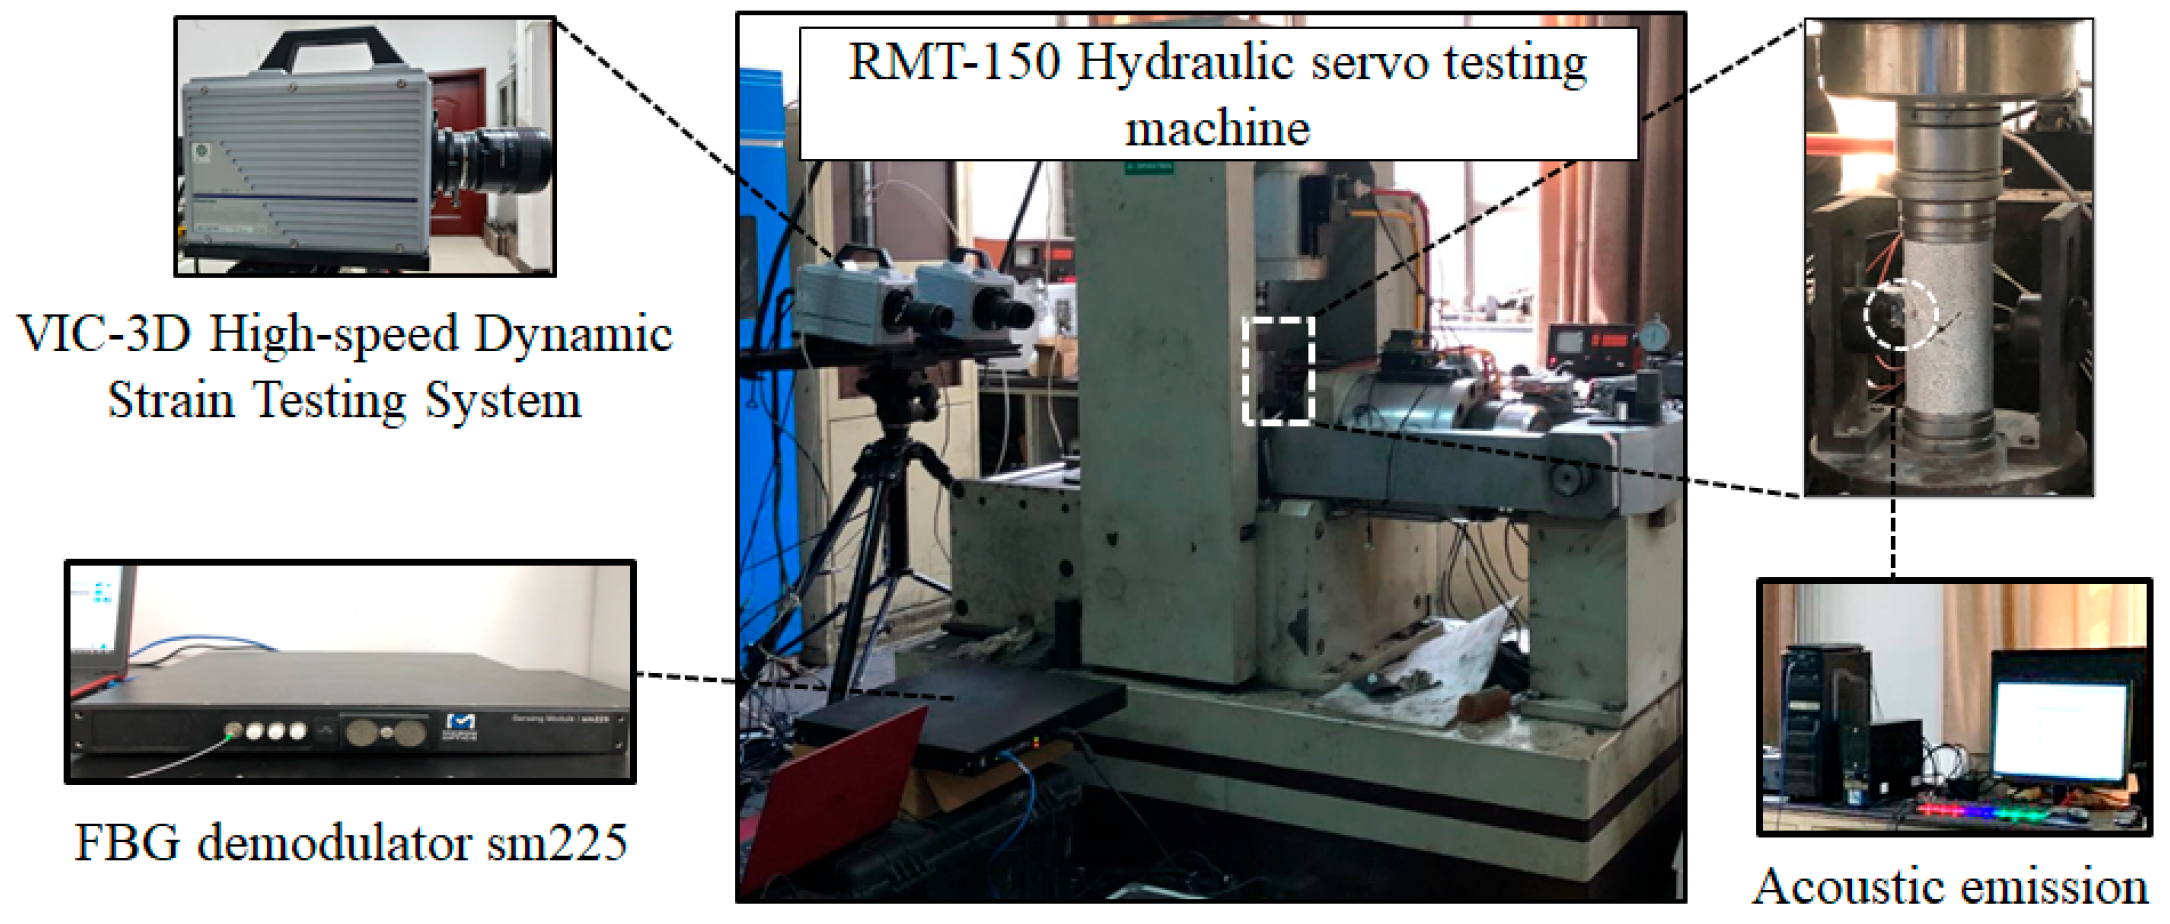
The loading equipment utilized for the test is the RMT-150 hydraulic servo testing system (GCTS, Tempe, AZ, USA). The test loading was controlled by axial displacement. The uniaxial loading rate was set at 0.005 mm/s. During the testing process, crack activity was monitored using three distinct systems: FBG monitoring technology, acoustic emission (AE) testing methods, and a camera system. The experimental procedure is illustrated in Figure 2. The FBG monitoring system employs a four-channel demodulator with an operational frequency of 100 Hz. The AE acquisition system was a 24-channel Micro-II Express digital monitoring system (Physical Acoustics Corporation (PAC), Princeton Junction, NJ, USA), which can collect AE parameters and time-history data in real time. AE sensors uniformly utilize Nano-30 probes (Physical Acoustics Corporation (PAC), Princeton Junction, NJ, USA) with a frequency bandwidth ranging from 125 to 750 kHz. The camera system incorporates an industrial camera manufactured by CSI in the United States along with VIC-3D v8 HS analysis software. The camera is configured to operate at a frame rate of 10,000 frames per second to effectively capture the crack propagation process within the specimen.
During the loading process, stress–strain data, FBG monitoring, high-speed camera shooting and AE testing were conducted simultaneously. To mitigate noise interference, the AE detection threshold was established at 45 dB with a 40 dB pre-amplifier gain. Key signal processing parameters included a peak definition time of 50 μs, hit definition time of 150 μs, and hit lockout time of 300 μs. Their layout is illustrated in Figure 1b. All systems operated synchronously to enable real-time data collection.
An iterative Levenberg–Marquardt optimization routine was employed to compute AE hypocenter parameters (x, y, z, t) by minimizing the distance residual (ω). Computations were based on the recorded P-wave arrival times at geophone locations (xi, yi, zi) and the known P-wave velocity (cp):
E = i = 1 N ω i 2 = i = 1 N ( x i x ) 2 + ( y i y ) 2 + ( z i z ) 2 c p ( t i t ) 2 ,
with N being the number of AE sensors, while automatic arrival time (ti) detection at the i-th sensor employed the AIC method [34].
For homogeneous rock specimens, arrival time quality governs accuracy. With precise ti and cp, standard residual minimization achieves < 2 mm location errors. Location error is quantified as:
E r r o r = 1 N i = 1 N | ( x x i ) 2 + ( x x i ) 2 + ( x x i ) 2 c p ( t i t ) | .
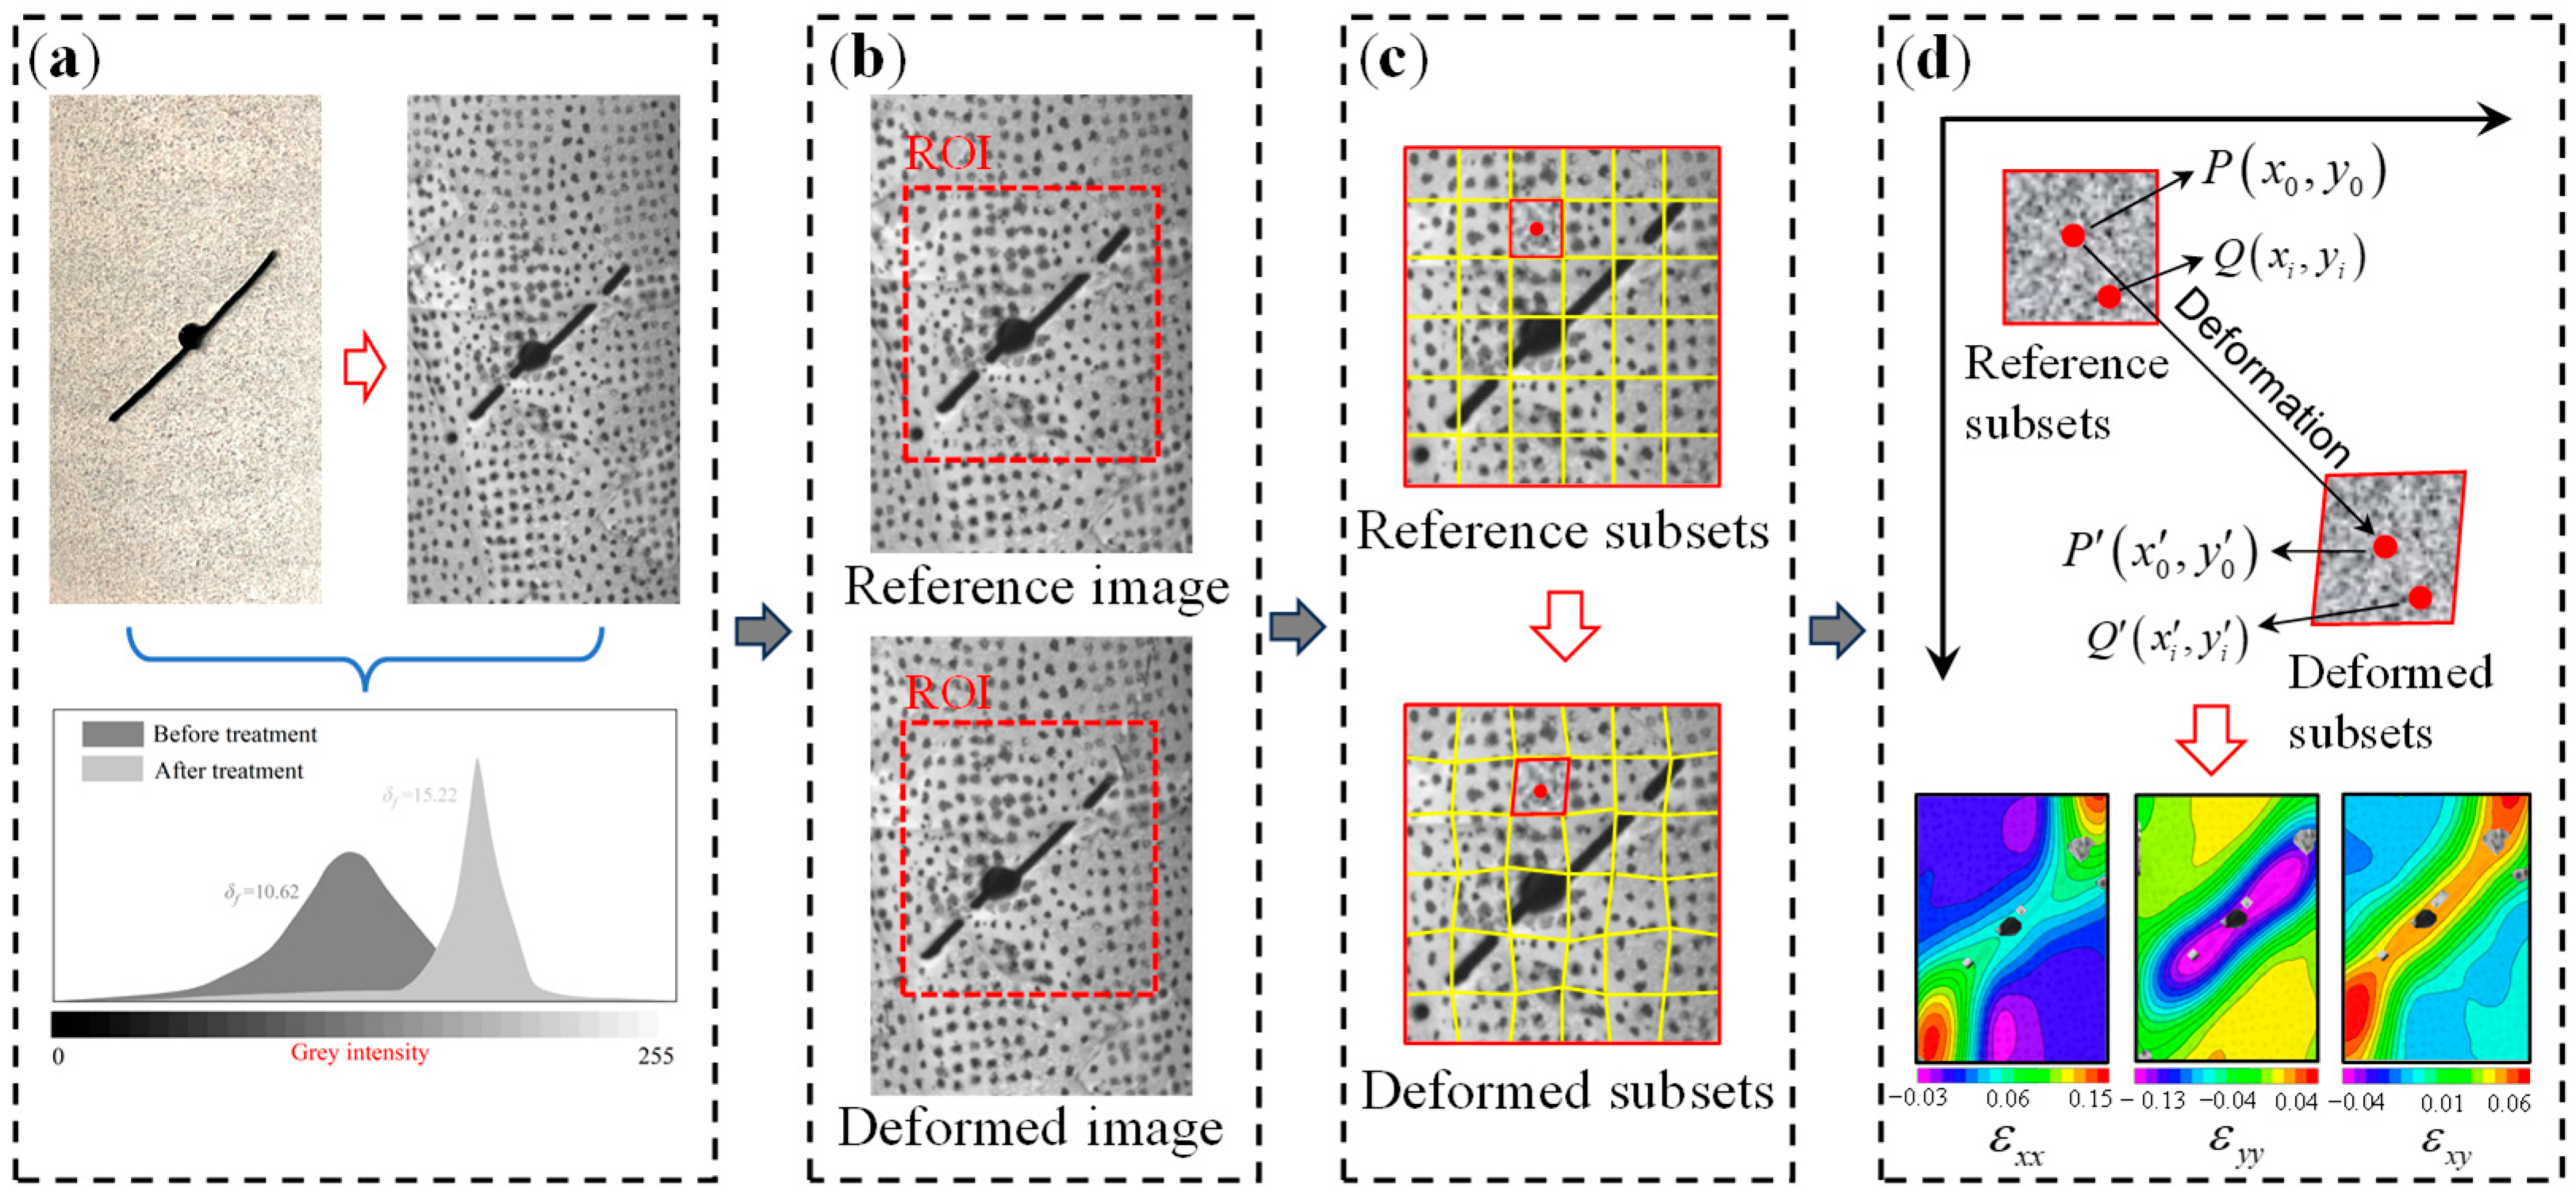
The strain values on the specimen surface were calculated using digital image correlation (DIC) analysis following image acquisition via a high-speed camera during loading. As shown in Figure 3b, the process begins by selecting a region of interest (ROI) within a predefined range (Figure 3c), which is then subdivided into multiple small subsets. After the specimen deforms under loading, reference and deformed images are correlated based on normalized cross-correlation criteria to track identical subsets. The displacement components after deformation are computed as follows:
x i x i = u 0 + u x x i x 0 + u y y i y 0 ,
y i y i = v 0 + v x x i x 0 + v y y i y 0 ,
where xi, yi, xi and yi are the coordinate component of points shown in Figure 3d; u0 and v0 are the displacement component of the reference subset center in x and y directions; u x , u y and v y are the first-order displacement gradient of the reference subset.
The strain components in the x, y, and xy directions can be calculated by:
ε x x = 1 2 2 u x + ( u x ) 2 + ( v x ) 2 ,
ε y y = 1 2 2 v y + ( u y ) 2 + ( v y ) 2 ,
ε x y = 1 2 u y + v x + u x u y + v x v y ,
where ε x x , ε y y and ε x y are the strain components of subset in x, y and xy directions.

2.3. FBG Strain Transfer Calibration in Heterogeneous Stress Fields

An FBG comprises periodic refractive index modifications inscribed within the core region of a single-mode optical fiber, functioning as an all-fiber optical component. For uniform axial strain, the wavelength shift, ∆λB, can be expressed by Equation (10) [35]:
Δ λ B = λ B ( 1 p e ) ε z ,
with εz characterizing the uniform axial strain field along the fiber axis, while pe designates the effective photoelastic constant of the material. When subjected to non-uniform stress fields, the transmission-matrix method was implemented by dividing the structure into N discrete segments with quasi-homogeneous properties, where the local grating parameters for each segment are described by Equations (11) and (12) [36]:
Λ i = Λ 0 1 + ε i ,
n e f f i = n e f f n e f f 3 2 ( 1 ν ) p 12 ν p 11 ε i ,
where ν quantifies Poisson’s ratio of the FBG, and εi corresponds to the axial strain experienced by the i-th segment within the grating period. Non-uniform strain fields induce concurrent alterations in both the grating pitch distribution and modal index modulation of FBGs, synergistically driving distortions in the reflected spectral profile.
To characterize FBG spectral responses under non-uniform stresses, we conducted calibration tests for local tensile and shear strains. As shown in Figure 4, a mechanical model was established with the FBG centered at the crack. Uniform tensile (εy) and shear (εx) strains were applied along y-axis and x-axis, respectively, generating localized strains at the crack interface through strain transfer.
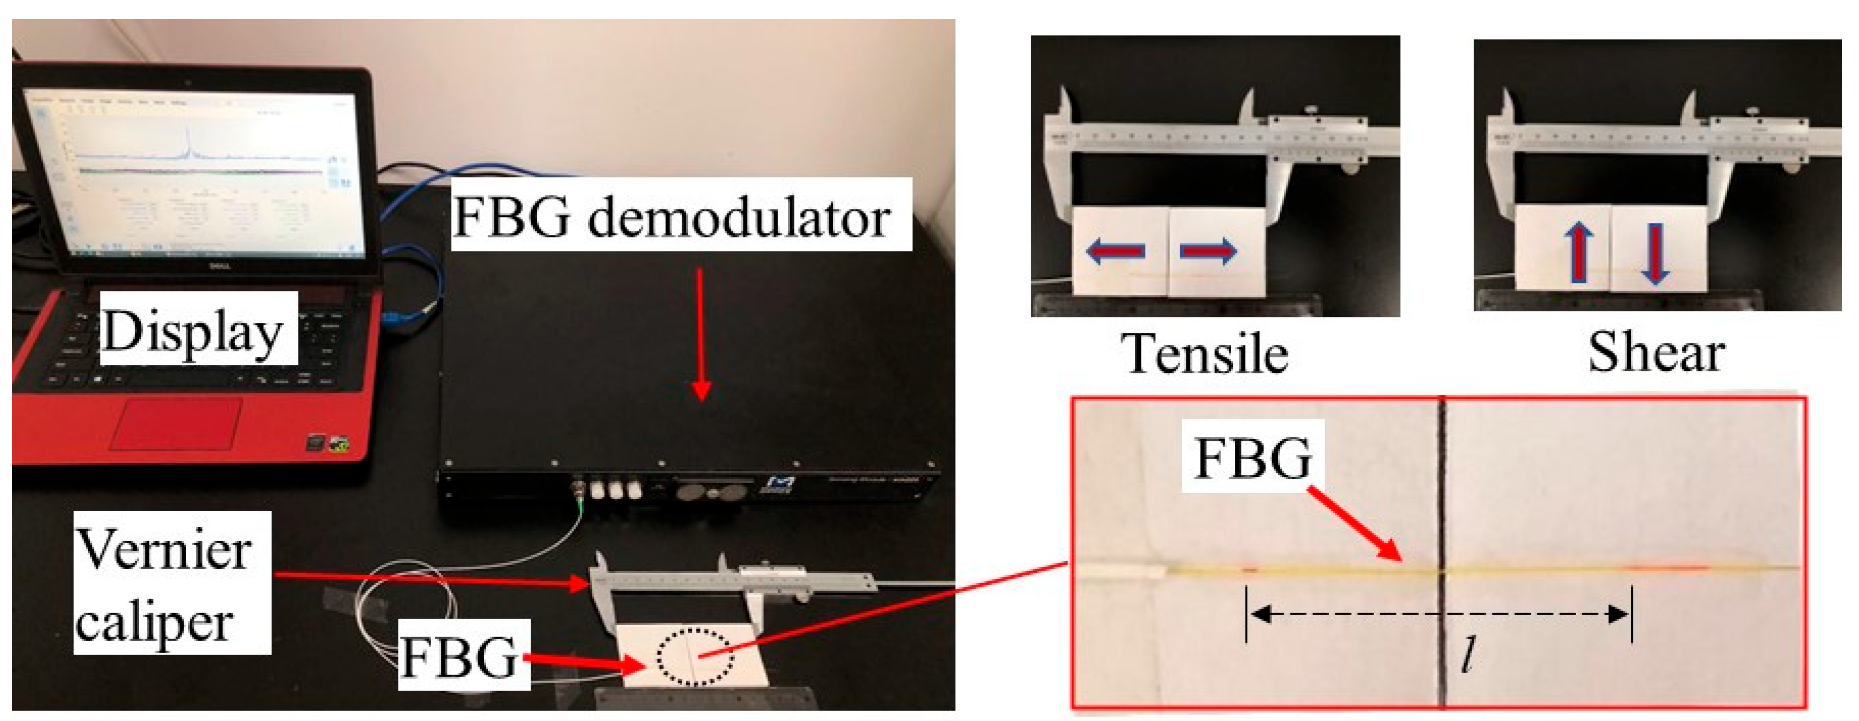
The experimental process is illustrated in Figure 5. The calibration experiment employed two identical square plastic plates with the FBG centrally bonded across their interface. Controlled plate displacements induced localized tensile and shear strains in the FBG, with applied displacements precisely measured using vernier calipers. A demodulator recorded the corresponding spectral responses, with multiple repeated tests conducted to ensure measurement accuracy.
The spectral changes induced by the localized deformation of the FBG are illustrated in Figure 6. The reflection spectrum obtained under local tensile loading (Figure 6a) exhibits multiple distinct peaks. However, as the spacing between adjacent peaks became smaller than the individual bandwidths, significant spectral overlap occurred, which resulted in a broadened composite reflection band. This broadening effect intensified systematically as the non-uniform axial strain increased. Notably, conventional narrowband threshold methods fail to capture the full extent of the broadened waveform. To address this limitation, the central wavelength of the 20 dB threshold reflection band was adopted for the data recording. In contrast, under local shear loading (Figure 6b), the spectrum progressively lost its discrete peak structure and developed oscillatory sidebands. The most pronounced characteristic is the gradual attenuation of the peak reflectivity while the central wavelength corresponding to the maximum reflectivity remained relatively stable. This distinct spectral evolution provides a clear indicator for shear-dominated deformation mechanisms.
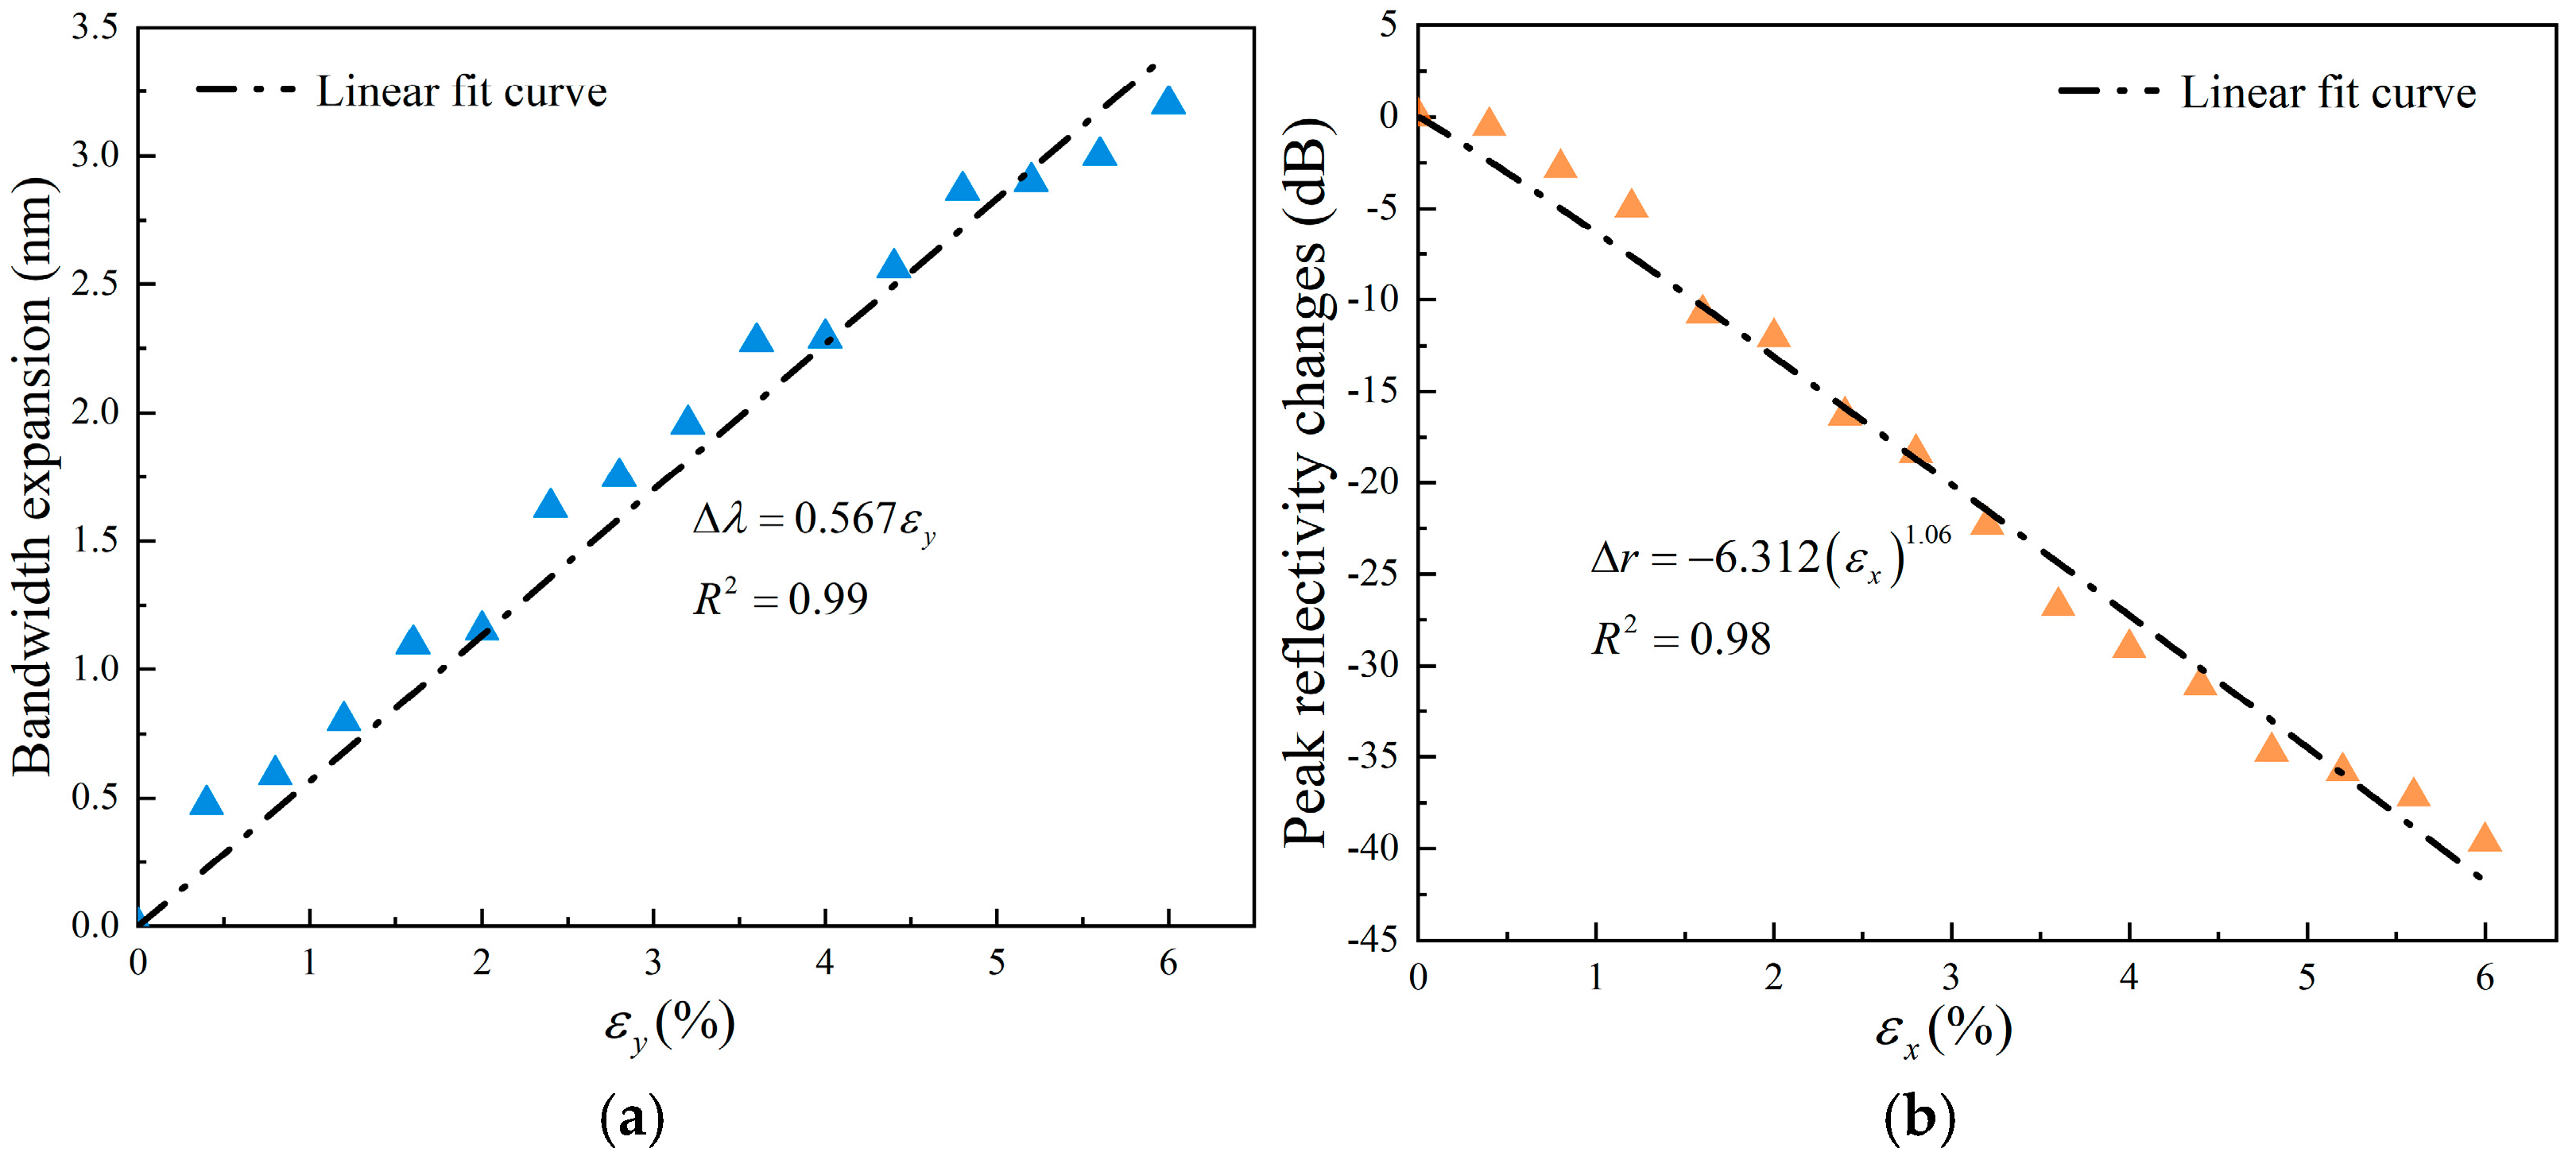
Under localized non-uniform tensile-strain conditions, the bandwidth expansion of the FBG spectrum progressively increased. A linear regression analysis of the 20 dB threshold bandwidth expansion revealed that a well-defined linear relationship existed between the bandwidth expansion and the tensile strain. This relationship is shown in Figure 7a and can be expressed by Δ λ = 0.567 ε y . Conversely, under localized shear-strain conditions, the peak reflectivity of the FBG spectrum demonstrated systematic attenuation. Linear fitting of the peak reflectivity variations revealed a proportional relationship with shear strain. This relationship is illustrated in Figure 7b and can be expressed by Δ r = 6.132 ε x 1.06 .
Under non-uniform strain fields, the distortion of the FBG spectrum stems from localized coupling variations in the grating period (Λ) and the modal effective index (neff). When tensile strain is generated at the crack tip, the non-uniform stretching of the grating period leads to a broadening of the reflection spectrum (Δλ), while shear slip causes a reduction in the peak reflectivity (Δr) by modulating the coupling coefficient (κ). Calibration experiments further quantify this relationship, revealing a linear positive correlation between Δλ and local tensile strain, and a negative correlation between Δr and shear strain. This lays the theoretical groundwork for identifying the dominant type of stress during subsequent crack propagation.

3. Results

3.1. Stress–Strain Behavior and AE Characteristics of the Pre-Cracked Sandstone Specimens

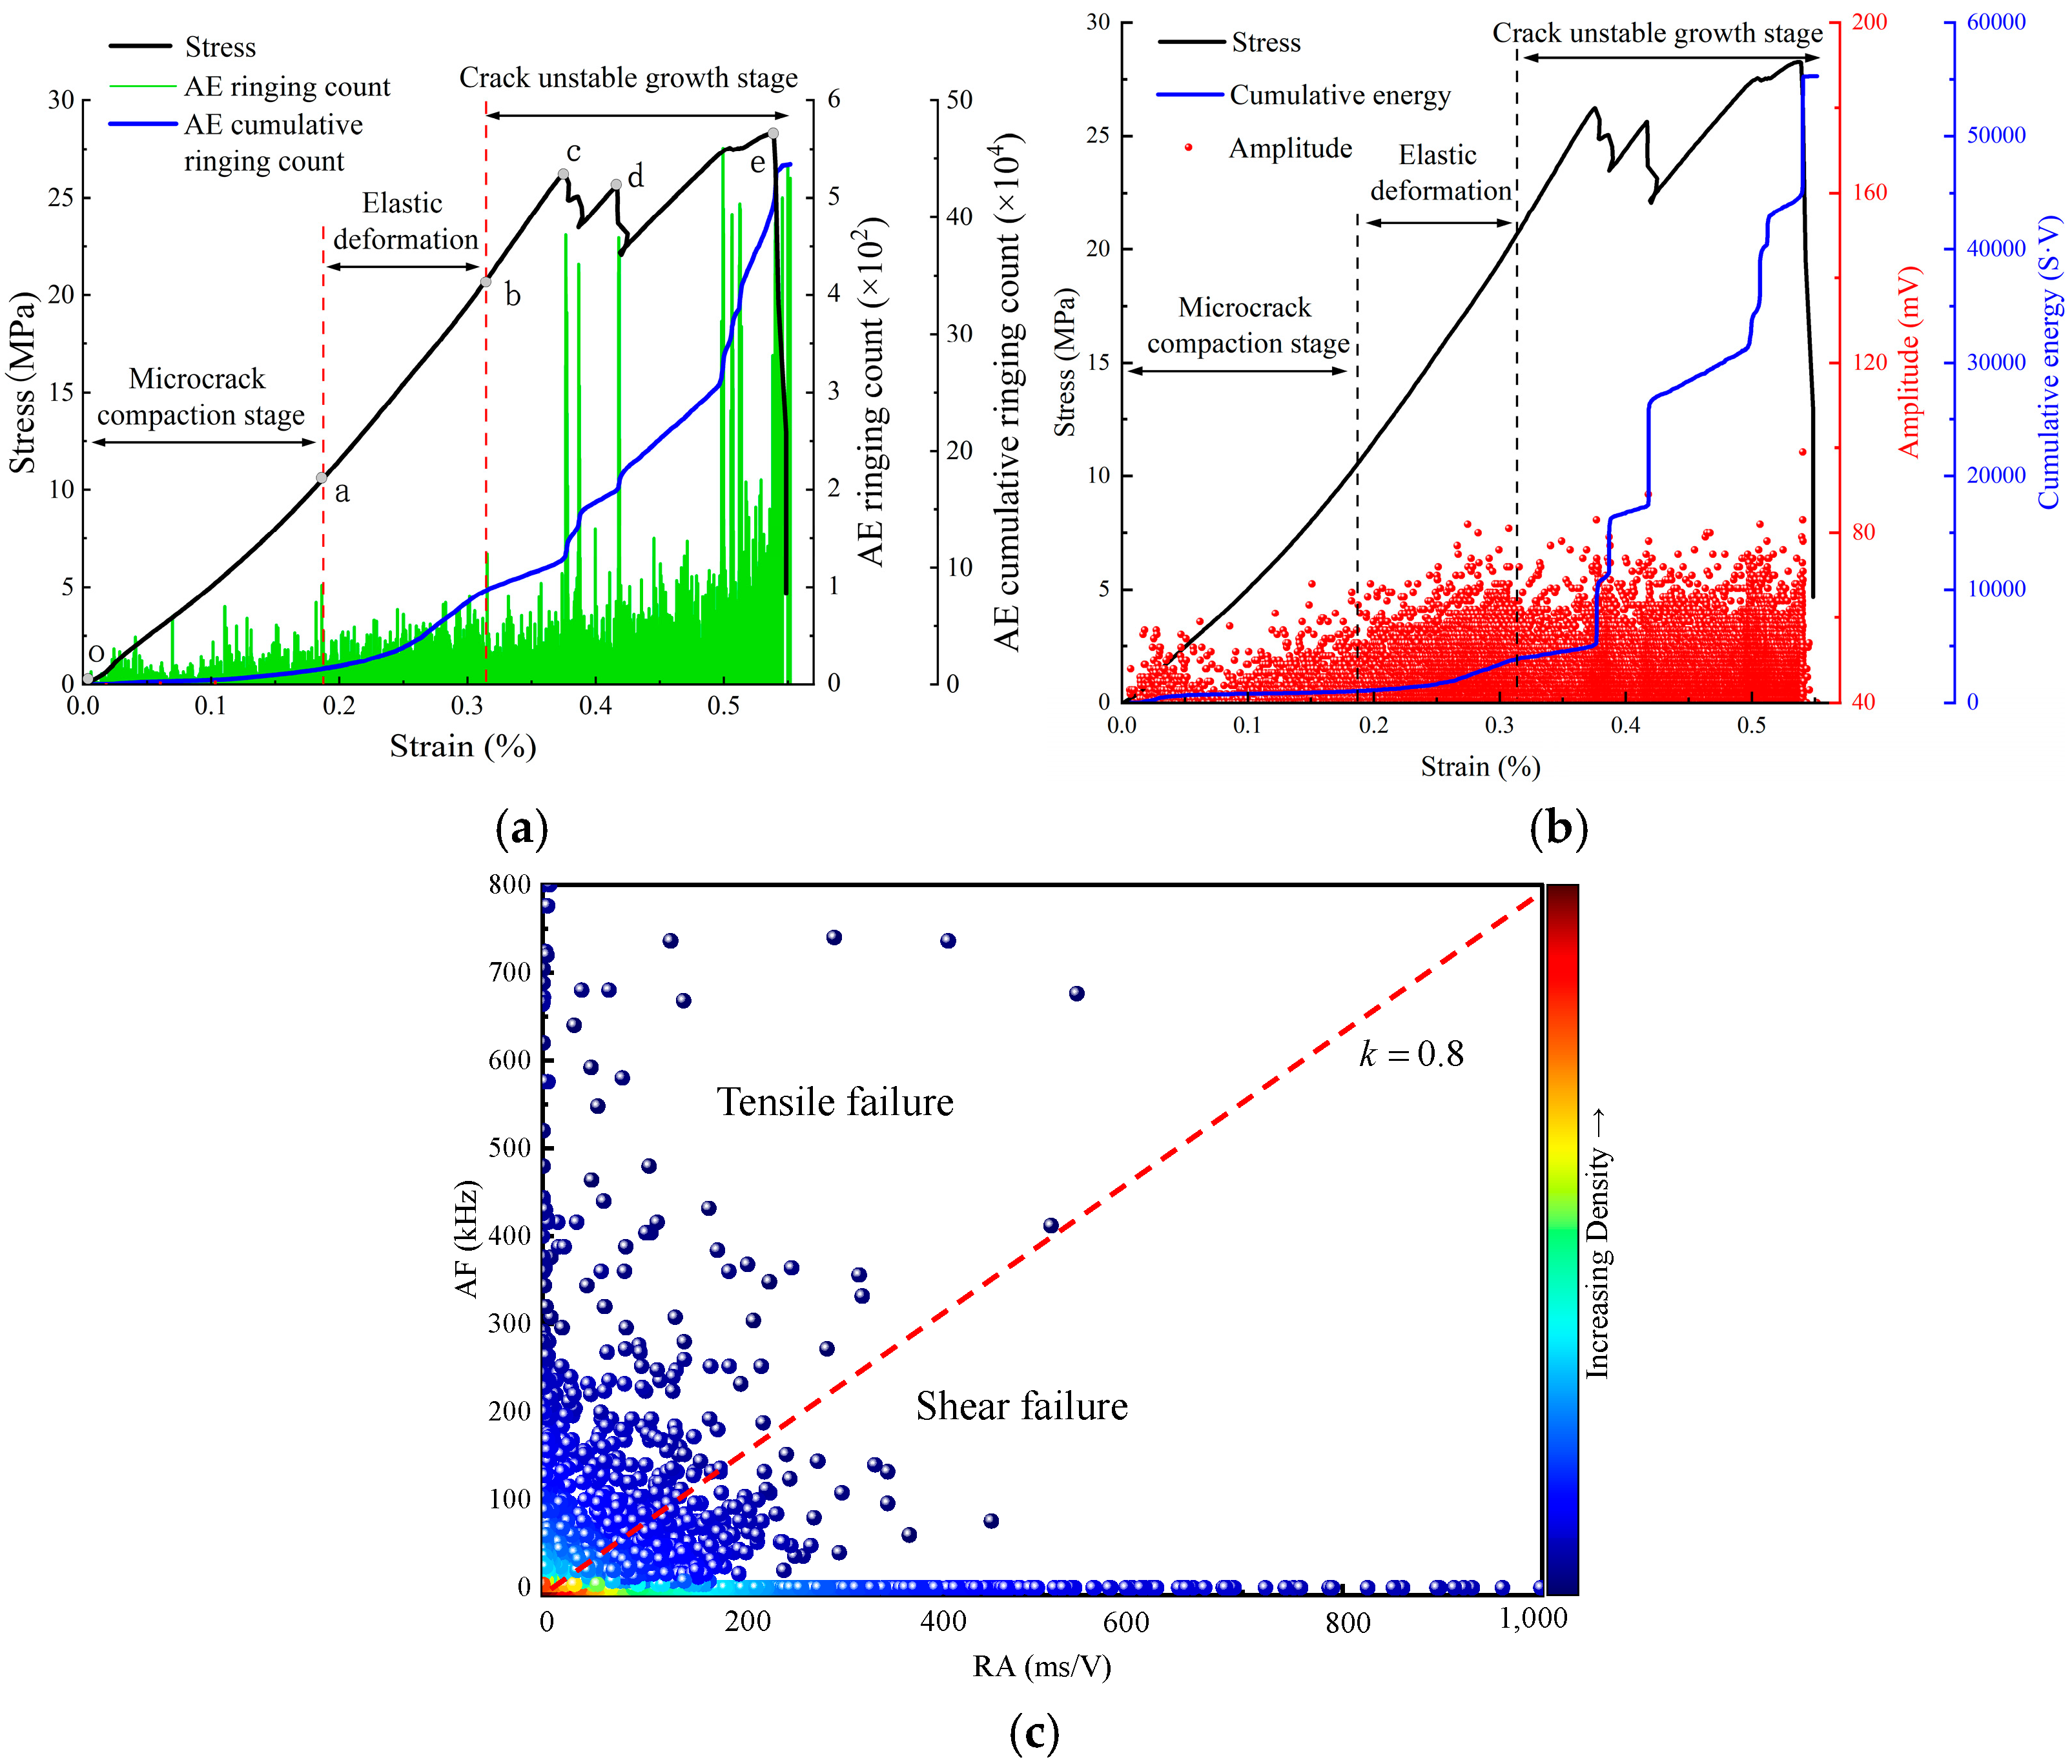
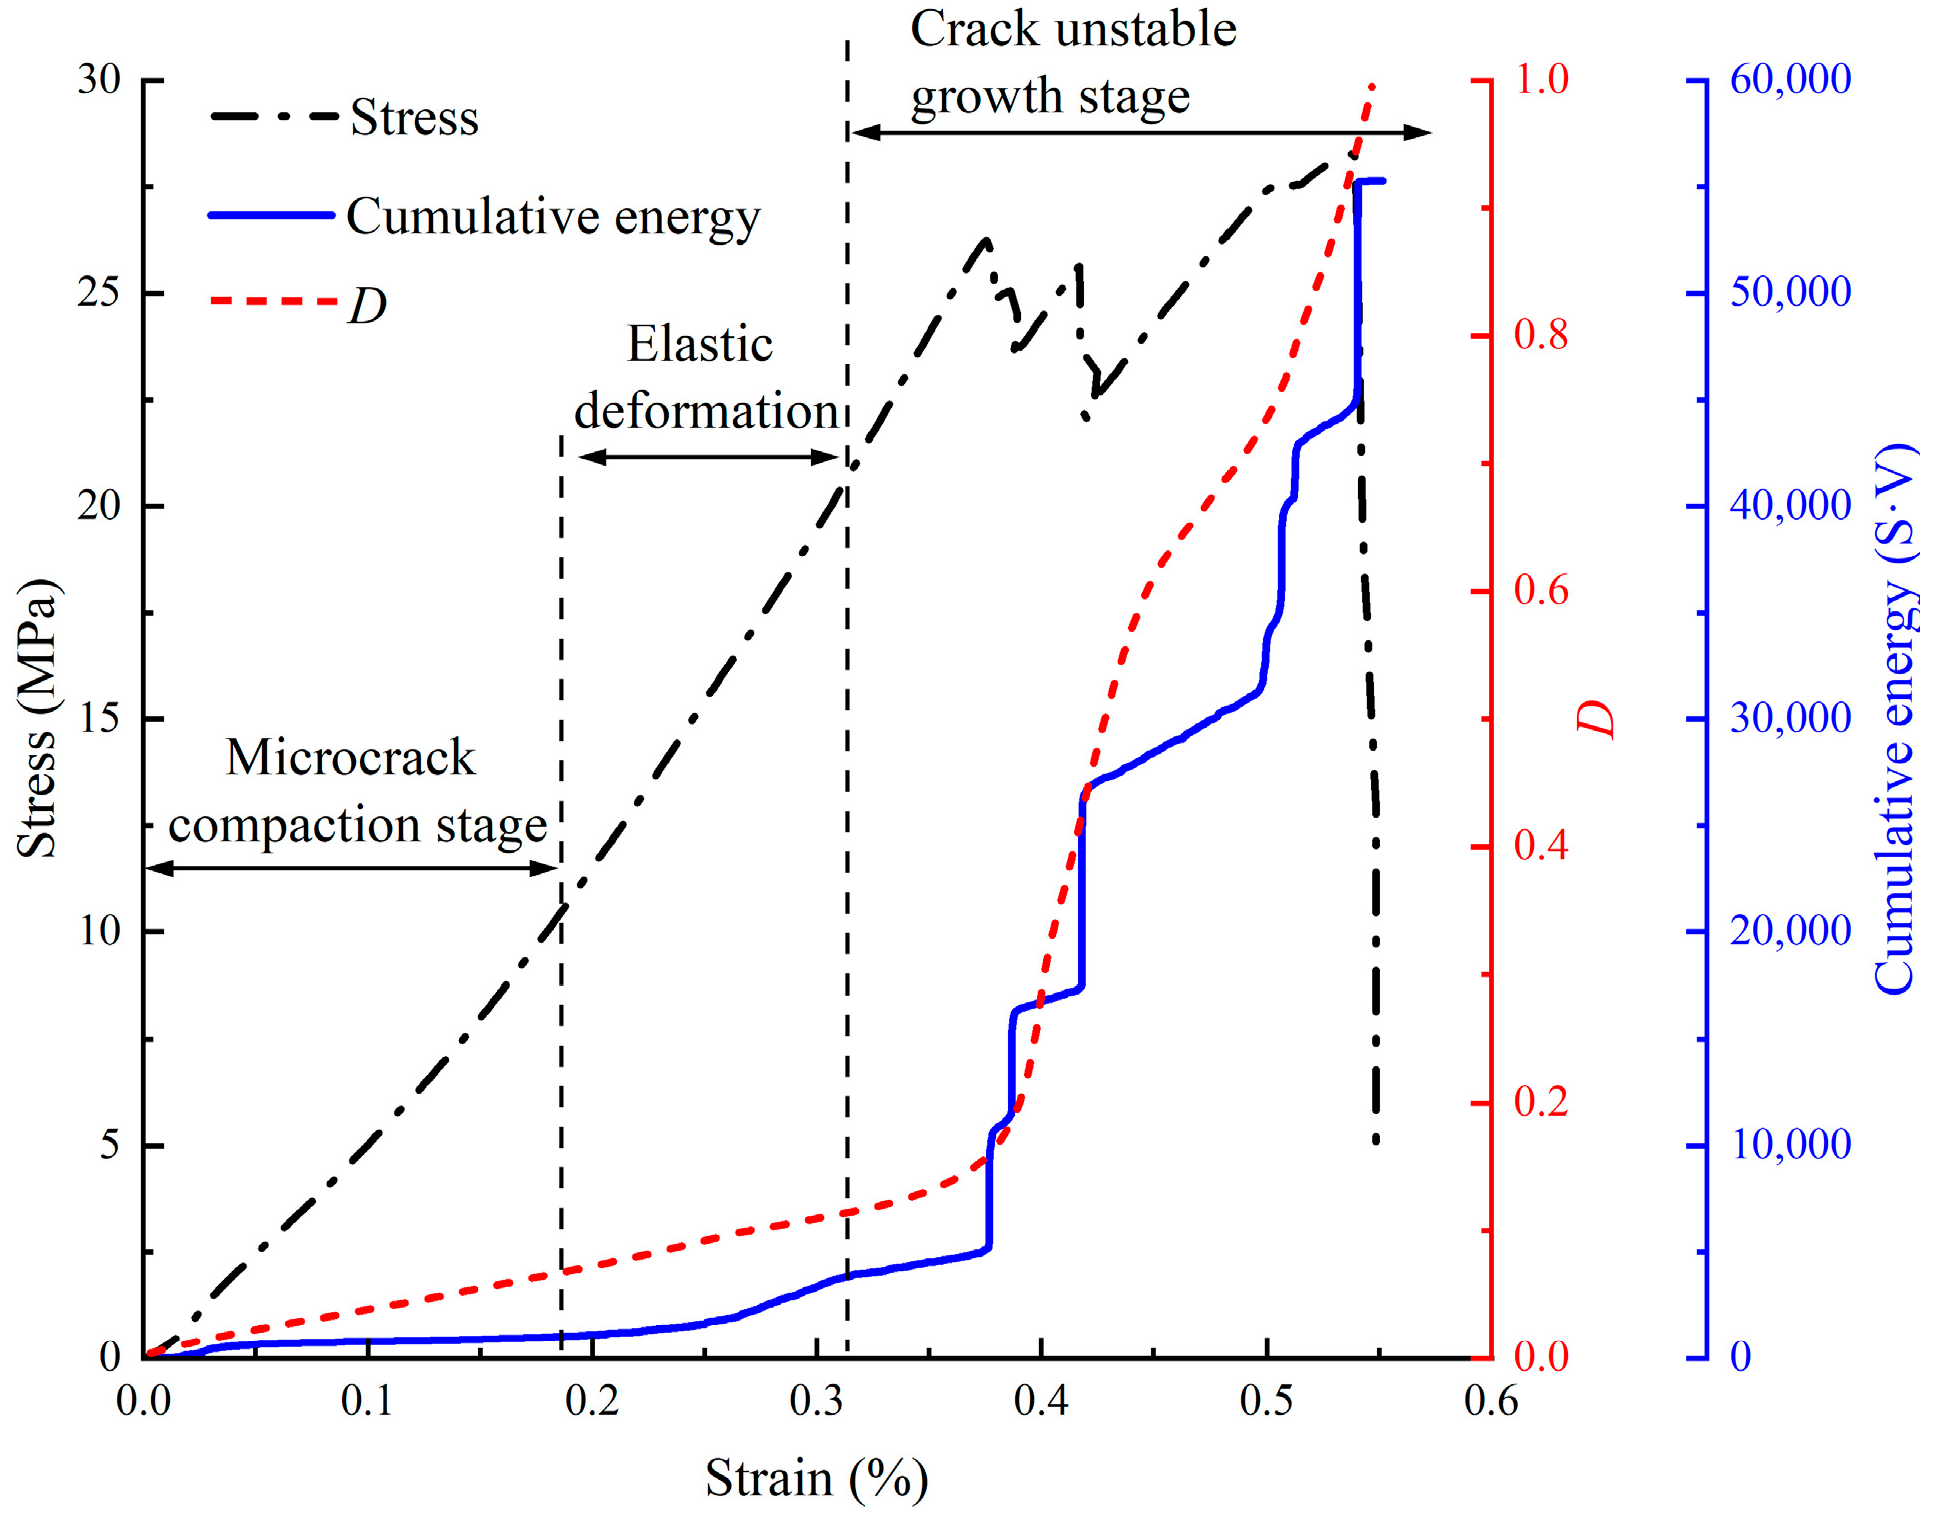
The failure processes of pre-cracked rocks usually involve compaction, elastic deformation, crack propagation, and coalescence. The use of AE parameters has become an important method of studying the characteristic stress thresholds of rocks. The stress–strain curve and AE characteristics of the B1 sample are depicted in Figure 8. During the initial loading, internal microcracks closed and the rock was in the compaction stage. The compaction limit load at point a was 12.5 MPa, and the AE exhibited fluctuations, generating a series of low-amplitude AE events. The cumulative energy demonstrated a slow increase, following a near-linear trend, reflecting predominant steady dissipation of energy release. After point a, the deformation entered a linear growth stage, and no significant changes were evident in the AE signal during this elastic stage. Next, the failure process deviates from this linearity, and the primary failure mode was unstable propagation of the prefabricated fissure. When the axial loading reached point b in the curve (σb = 20.67 MPa), wing cracks began to propagate in the direction perpendicular to that of the prefabricated fissure. This crack propagation caused stress redistribution to occur, and the prefabricated fissure closed further. The local load-bearing capacity of the specimen decreased at point c, and the degree of decrease was proportional to the wing-crack extension length. The AE signal exhibited significant fluctuations. This point represents the initial yield point of the pre-cracked rock specimen, at which the yield strength was σc = 26.25 MPa. As the loading proceeded, shear stress appeared at the surface of the closed crack and generated a shear-interlocking effect with the insufficiently extended wing cracks. Therefore, the bearing capacity once again exhibited an upward trend; however, the slope of the deformation curve decreased during the second growth stage. As the strain increased until point d was reached, the local load-bearing capacity of the specimen decreased again; at this point, the yield strength was σd = 25.63 MPa. The shear-interlocking effect that was generated previously failed gradually, causing a reduction in the secondary stress, and the acoustic emission signal exhibited significant fluctuations. When the shear stress again produced a shear-interlocking effect with the fully extended wing cracks, the load-bearing capacity again followed an upward trend. When peak load was reached at point e (σe = 28.28 MPa), the wing cracks were compacted and the prefabricated fissure had coalesced, and the deformation curve exhibited a third drop at this point. During this phase, AE activity exhibited two distinct characteristics: First, the amplitude distribution of events significantly broadened, with numerous medium-intensity events in the 60–80 mV range. Second, the cumulative energy curve began displaying a stepped growth pattern. Notably, during three pronounced stress drops, cumulative energy surged abruptly by 23%, 37%, and 52%, respectively. This correlation indicates that stress drops represent abrupt energy releases resulting from internal crack reorganization during propagation.
Figure 8c displays the AF-RA scatter density plot of AE monitoring during specimen loading. Extensive research confirms distinct spectral characteristics in AE signals corresponding to different crack types: events with high AF values and low RA values indicate tensile crack formation, while those with low AF and high RA represent shear cracks. Du et al. [37] demonstrated that shear failures typically generate AE events with frequencies below 150 kHz, whereas tensile failures produce higher-frequency emissions. Based on these findings, we established the discriminant boundary at k = 0.8, classifying events with AF/RA > 0.8 as tensile failures and AF/RA < 0.8 as shear failures. For fractured bluestone specimens, AE events concentrated densely during loading with tensile failures significantly outnumbering shear failures. Under normal stress conditions, tensile failure events substantially increased due to accumulated energy promoting wing crack initiation, secondary crack nucleation, and sustained propagation of both crack types through tensile-dominated mechanisms.

3.2. Characteristics of the FBG Spectral Variations

Figure 9 depicts the FBG spectral variations for pre-cracked specimen B1 under uniaxial compression loading. Observations of the loading process revealed that, as the load increased, the FBG spectra exhibited not only central wavelength shifts but also systematic bandwidth expansion and significant changes in the peak reflectivity. Specifically, for the FBG oriented at 30° with respect to the prefabricated crack (Figure 9a), when the load was 23.6 kN, the central wavelength was measured to be 1543.16 nm, the bandwidth expansion (Δλ) was 0.37 nm, and peak reflectivity was −12.7 dBm. When the load increased to 50.3 kN, the spectrum showed significant broadening, with an increase in Δλ to 2.62 nm, while the peak reflectivity gradually decreased, with a maximum reduction within −15 dBm. For the FBG oriented at 60° (Figure 9b), when the load was 23.6 kN, the central wavelength was 1548.81 nm, Δλ was 0.34 nm, and the peak reflectivity was −13.6 dBm. As the loading progressed, the peak reflectivity of this FBG decreased significantly, dropping to −59 dBm in the post-peak stage (9.2 kN). The FBG oriented at 90° (Figure 9c) also exhibited distinct spectral broadening characteristics when the load was 23.6 kN. It had a central wavelength of 1544.95 nm, a Δλ value of 0.48 nm, and a peak reflectivity of −16 dBm. When the load reached 63.9 kN, the peak reflectivity suddenly dropped to −50 dBm; however, due to preset measurement threshold limitations, the bandwidth expansion could no longer be accurately captured at this stage. The spectral response of the 90° FBG during initial loading (elastic stage, strain < 0.05%) is shown in Figure 9d. No significant bandwidth broadening or peak reflectivity reduction was observed, but a distinct leftward shift of the central wavelength occurred. Through comparison with spectral variations during crack propagation stages, such spectral alterations were confirmed to exclude background strain fluctuations or environmental interference.
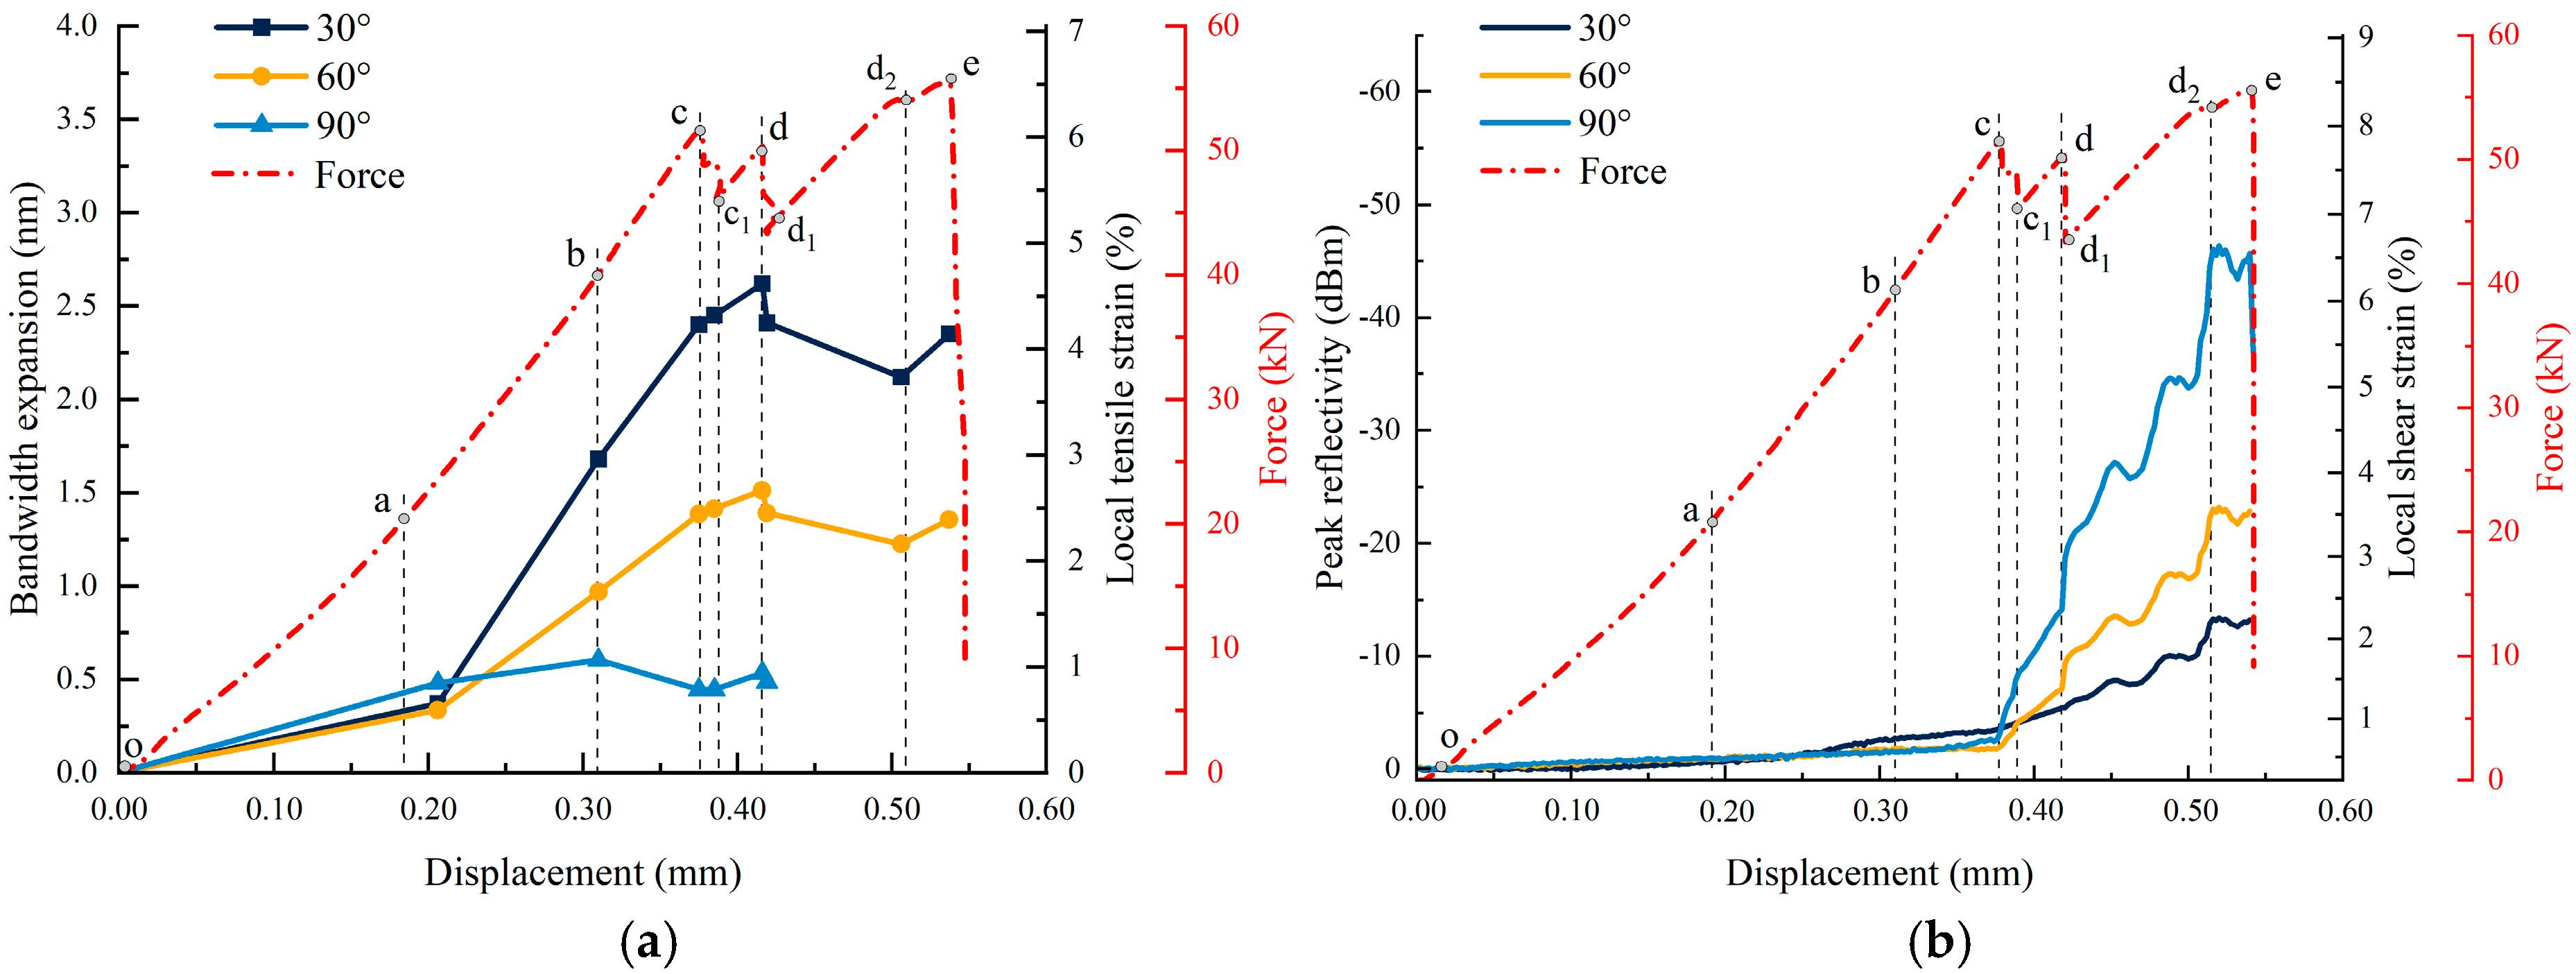
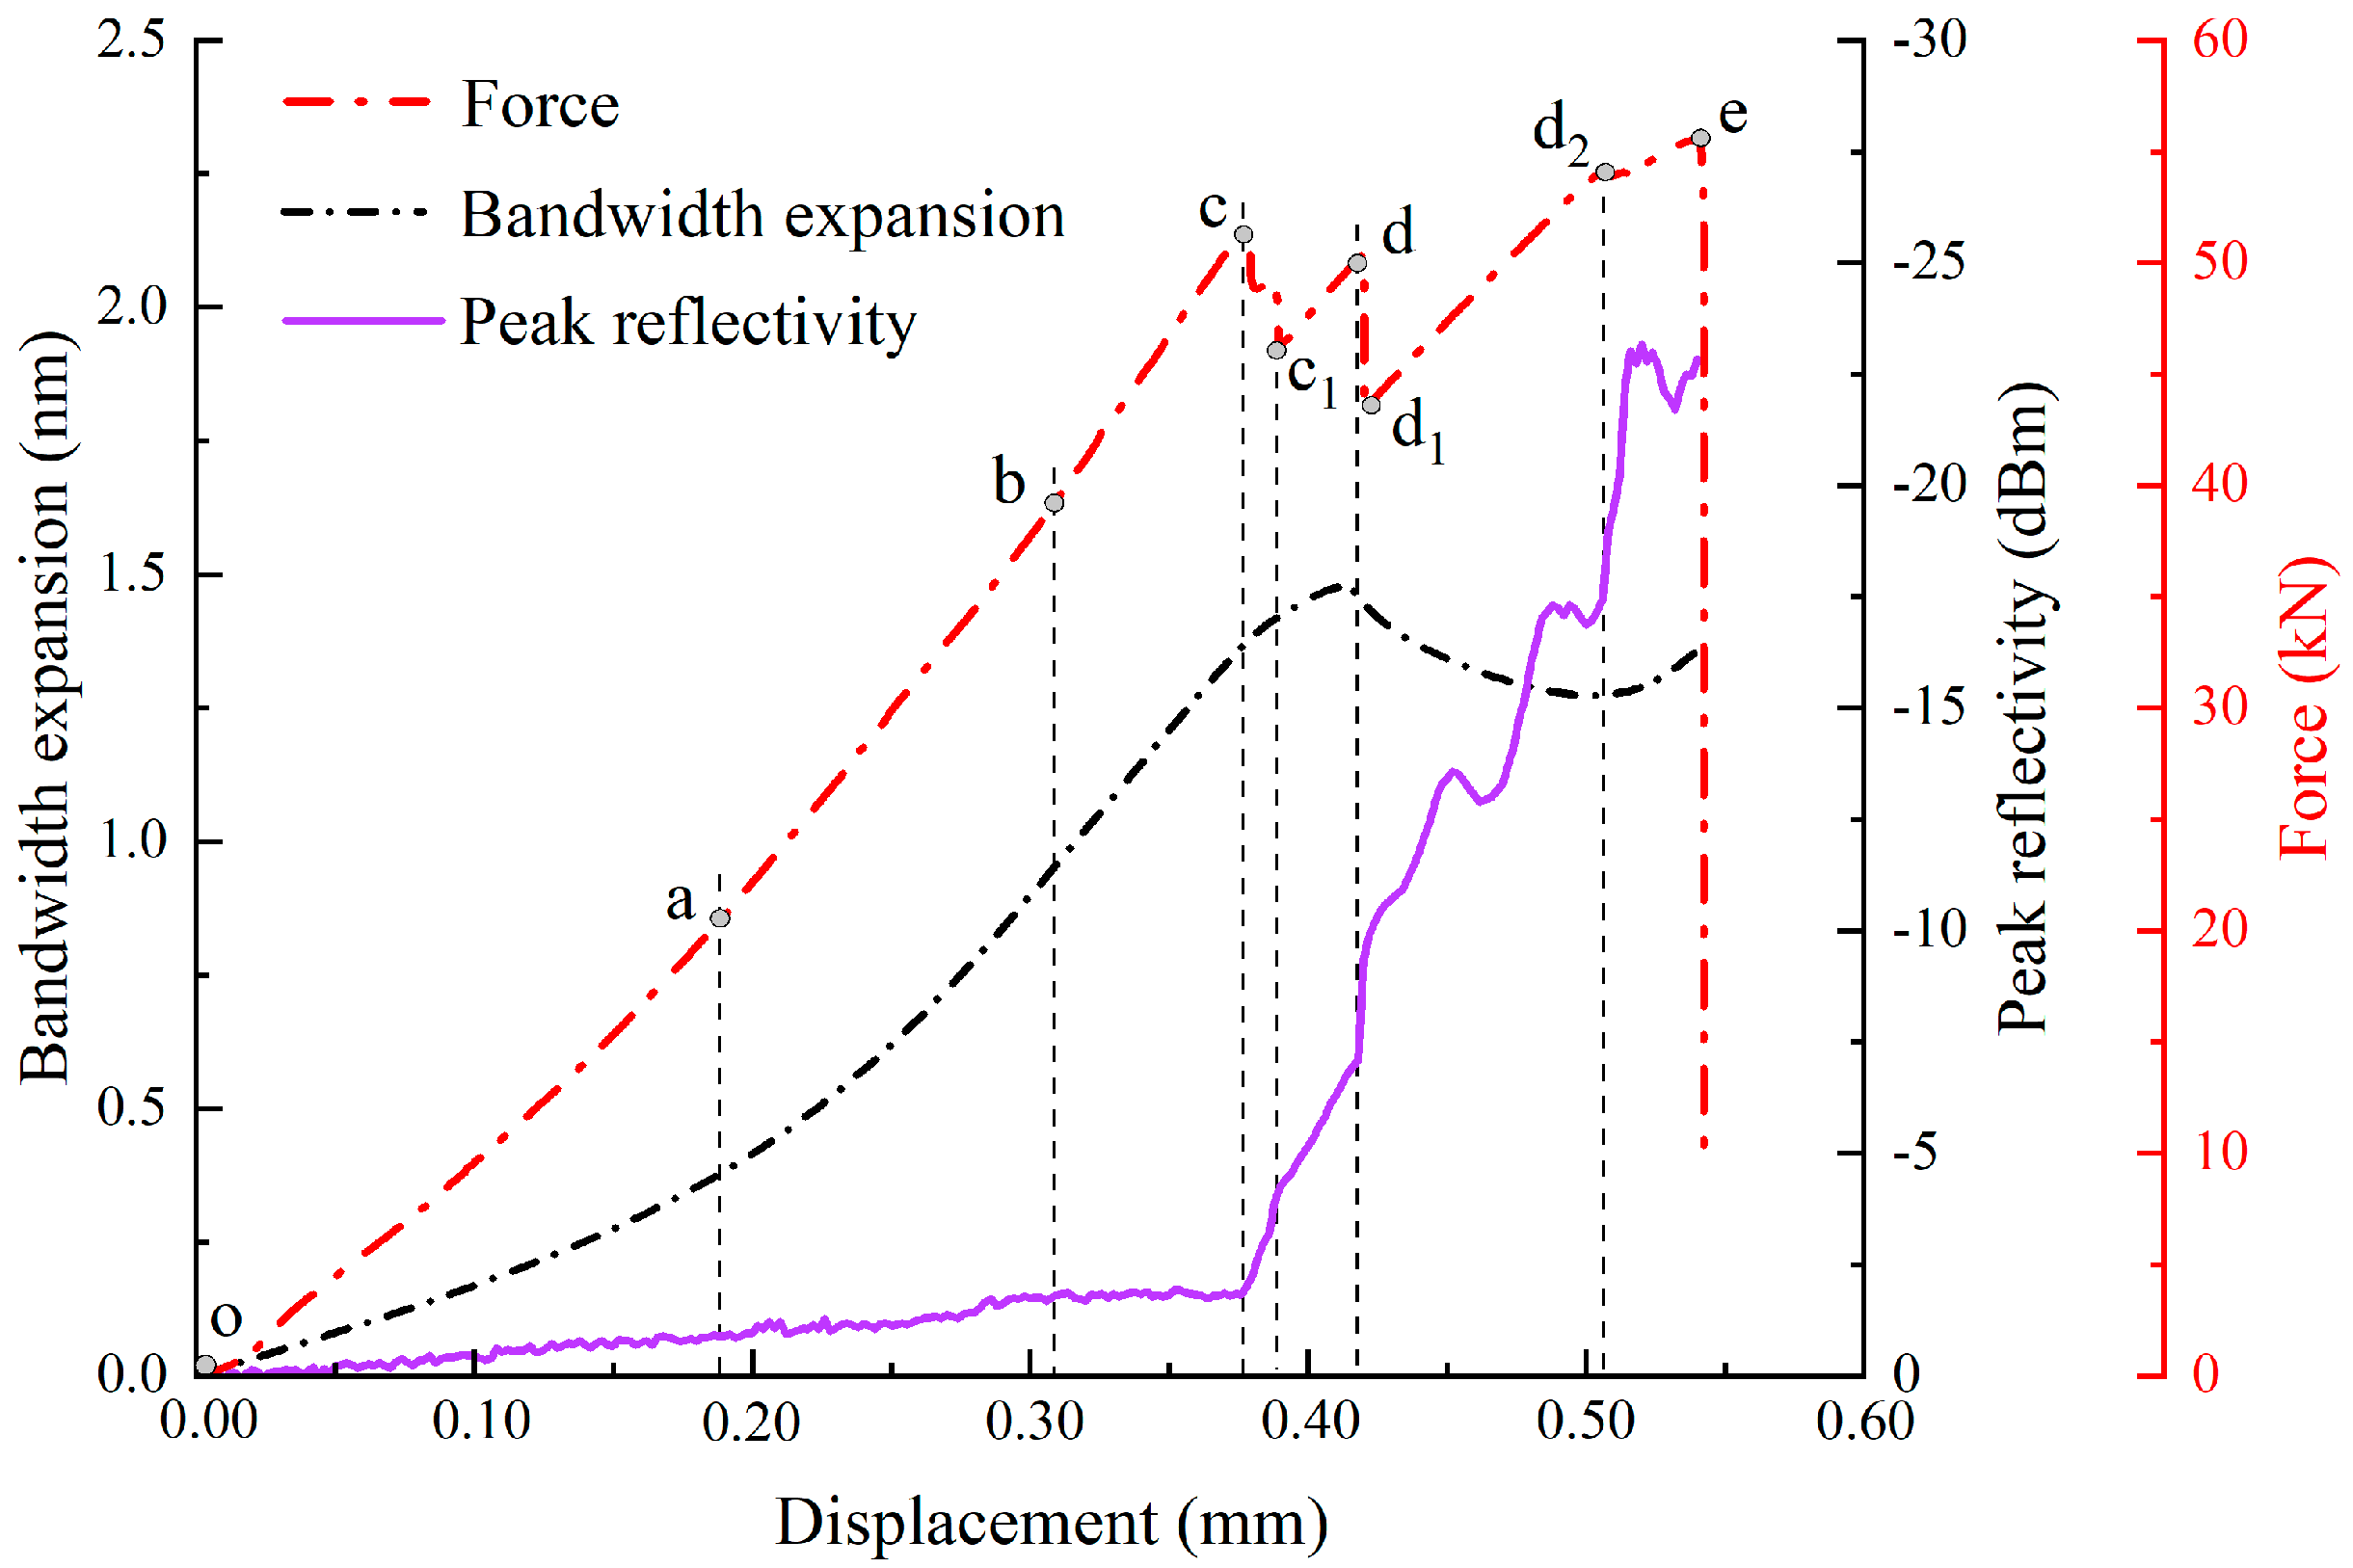
Figure 10 depicts the bandwidth-expansion and the peak-reflectivity variations of the FBGs of specimen B1, which were placed at various orientations with respect to the pre-existing crack. These results were calculated from those presented in Figure 8. The results demonstrate that, from the initial loading to complete failure, the FBG spectral bandwidth expansion exhibited distinct variation trends in different loading stages. Specifically, the FBG oriented at 30° had the most significant bandwidth expansion changes, while the FBG oriented at 90° displayed smaller variations and eventually was unable to capture bandwidth data in the later loading stages. Conversely, the peak-reflectivity variations had an opposite trend; the FBG oriented at 90° exhibited the most pronounced reflectivity variations, while the FBG oriented at 30° showed relatively minor changes. When the pre-cracked cyan sandstone was loaded to point a under uniaxial compression conditions, all the FBGs exhibited relatively small variations. Using the FBG calibration results, the local tensile and shear strains along the pre-existing crack were calculated to be 0.17% and 0.18%, respectively. These results indicate that, during the oa stage, the microcracks and inherent defects within the rock were being compacted, and only minor strains were generated around the pre-existing crack. Upon further loading to point b, the bandwidth expansion values of the FBGs oriented at 30, 60, and 90° increased to 1.68, 0.97, and 0.61 nm, respectively, while the corresponding peak reflectivity values decreased to −2.74, −1.83, and −1.55 dB, respectively. During this stage, the local tensile and shear strains along the pre-existing crack reached 0.65 and 0.27%, respectively. During the ab loading phase, all the FBGs (and particularly the 30° FBG) exhibited significant bandwidth-expansion increases, while peak reflectivity exhibited only modest decreases (which were most pronounced for the 30° FBG). These observations confirm that the specimen experienced elastic deformation during this stage; in addition, the local tensile stress dominated in the direction of the pre-existing crack, while shear stress remained relatively small.
When the loading progressed to point c, the local tensile and shear strains along the pre-existing crack reached 1.01 and 0.53%, respectively, during this stage. During the bc loading stage, the 30 and 60° FBGs exhibited significant bandwidth expansion increases, while the 90° FBG exhibited reduced broadening. All FBGs demonstrated peak reflectivity declines, and the 30° FBG had the most pronounced decrease. These measurements indicate that the local tensile stress remained dominant along the direction of the pre-existing crack, while the shear stress remained relatively low; these conditions led to the initiation and propagation of wing cracks in the direction perpendicular to that of the main fracture.
At point c1, the bandwidth expansion increases were negligible for all the FBG orientations, and the local tensile strain along the crack merely increased to 1.04%. However, the peak reflectivity values of the FBGs oriented at 30, 60, and 90° decreased significantly to −4.16, −4.24, and −8.48 dB, respectively, and the 90° FBG (which was oriented in a direction perpendicular to that of the crack) displayed the most dramatic reduction. The calculated local shear strain reached 1.32% during this stage. During the cc1 stage, the specimen experienced its first decrease in load; thus, this stage marked a transition during which the shear stress became dominant at the crack tip. This substantial shear strain promoted further wing-crack propagation, during which the extension length was directly proportional to the magnitude of the shear strain. When the loading process reached point d, the bandwidth expansion values of the FBGs oriented at 30, 60, and 90° increased to 2.62, 1.51, and 0.53 nm, respectively, and the calculated local tensile strain at the crack was 1.14%. In addition, the peak reflectivity values decreased to −5.42, −7.09, and −14.18 dB, respectively, and the local shear strain was 2.15%. During the c1d loading stage, although the bandwidth expansion continued to increase, it increased more slowly than during the bc phase. Meanwhile, the peak reflectivity declined significantly. During this stage, the shear strain exceeded the tensile strain, which indicates that shear stress developed at the closed crack surfaces. The interactions between this shear stress and the partially extended wing cracks created a shear-locking effect, which contributed to the recovery of the load-bearing capacity of the specimen. At point d1, the bandwidth expansion values of the FBGs oriented at 30, 60, and 90° abruptly decreased to 2.41, 1.39, and 0.48 nm, respectively. The local tensile strain at the crack dropped to 1.01%, while the peak reflectivity values further decreased to −5.90, −10.17, and −20.33 dB, respectively. The local shear strain reached 3.02%. During the dd1 phase, the specimen experienced a second decrease in load; this decrease was accompanied by a reduction in the tensile strain and a significant increase in the shear strain. These results suggest that the shear-locking effect partially failed during this stage, thereby allowing the shear stress to dominate and further cause the pre-existing crack to propagate, which ultimately reduced the load-bearing capacity of the specimen. At point e, the bandwidth expansion values of the FBGs oriented at 30 and 60° increased to 2.35 and 1.35 nm, respectively, while the local tensile strain stabilized at 1.0%. The peak reflectivity values of the FBGs oriented at 30, 60, and 90° dropped sharply to −13.24, −22.83, and −45.65 dB, respectively, while the local shear strain reached 6.45%. During the d1e stage, the load-bearing capacity of the specimen recovered; however, the tensile strain at the crack first decreased and then increased, and this behavior was accompanied by fluctuations in the shear strain. These results indicate unstable crack propagation and repeated shear-locking interactions between the main crack and the wing cracks. Beyond this point, the deformation curve exhibited three successive load decreases, and the FBGs fractured, which prevented further spectral measurements. These results confirm that the coalescence of pre-existing cracks led to a rapid and unstable specimen failure.
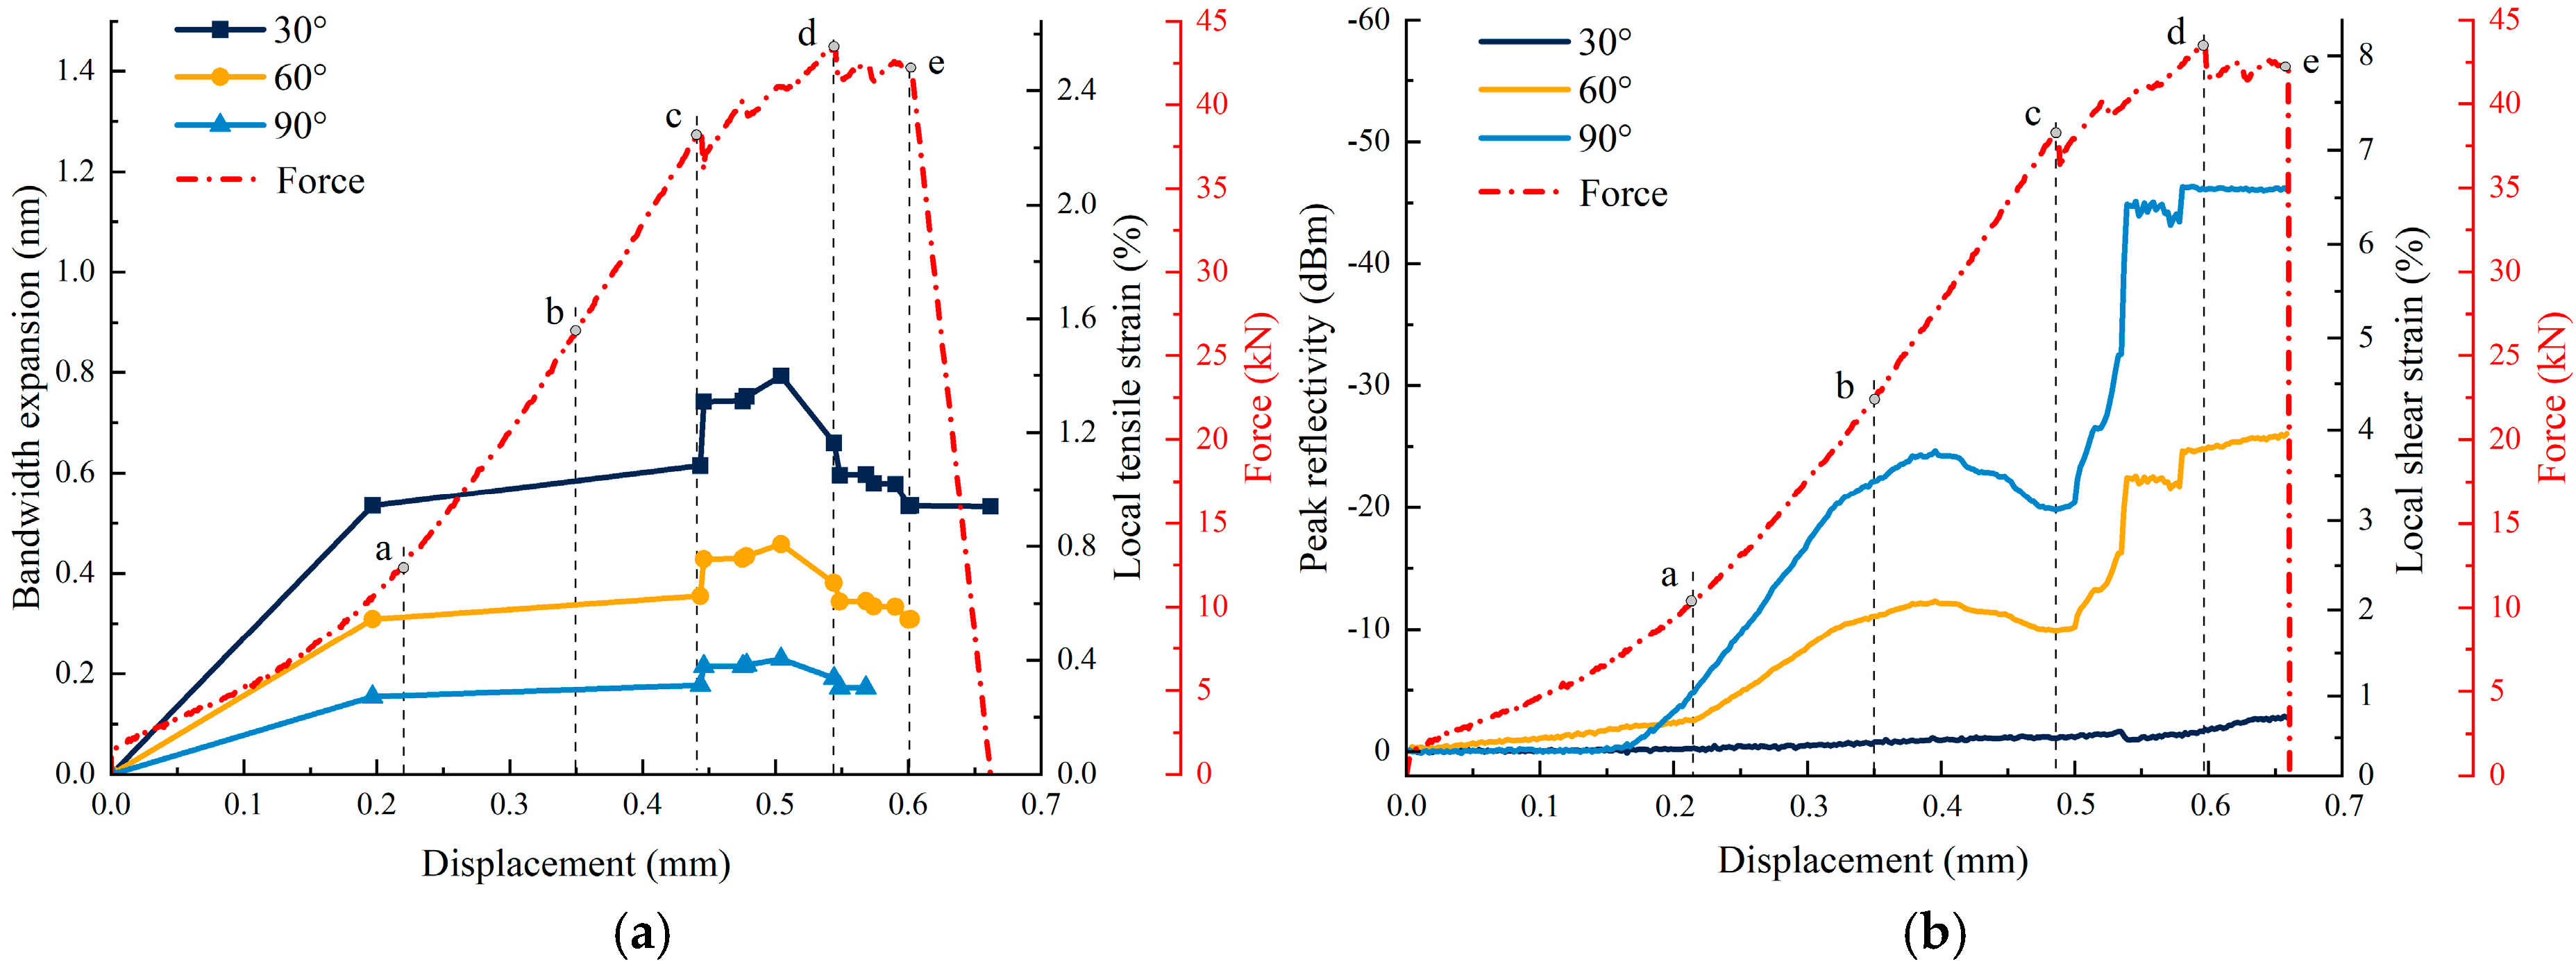
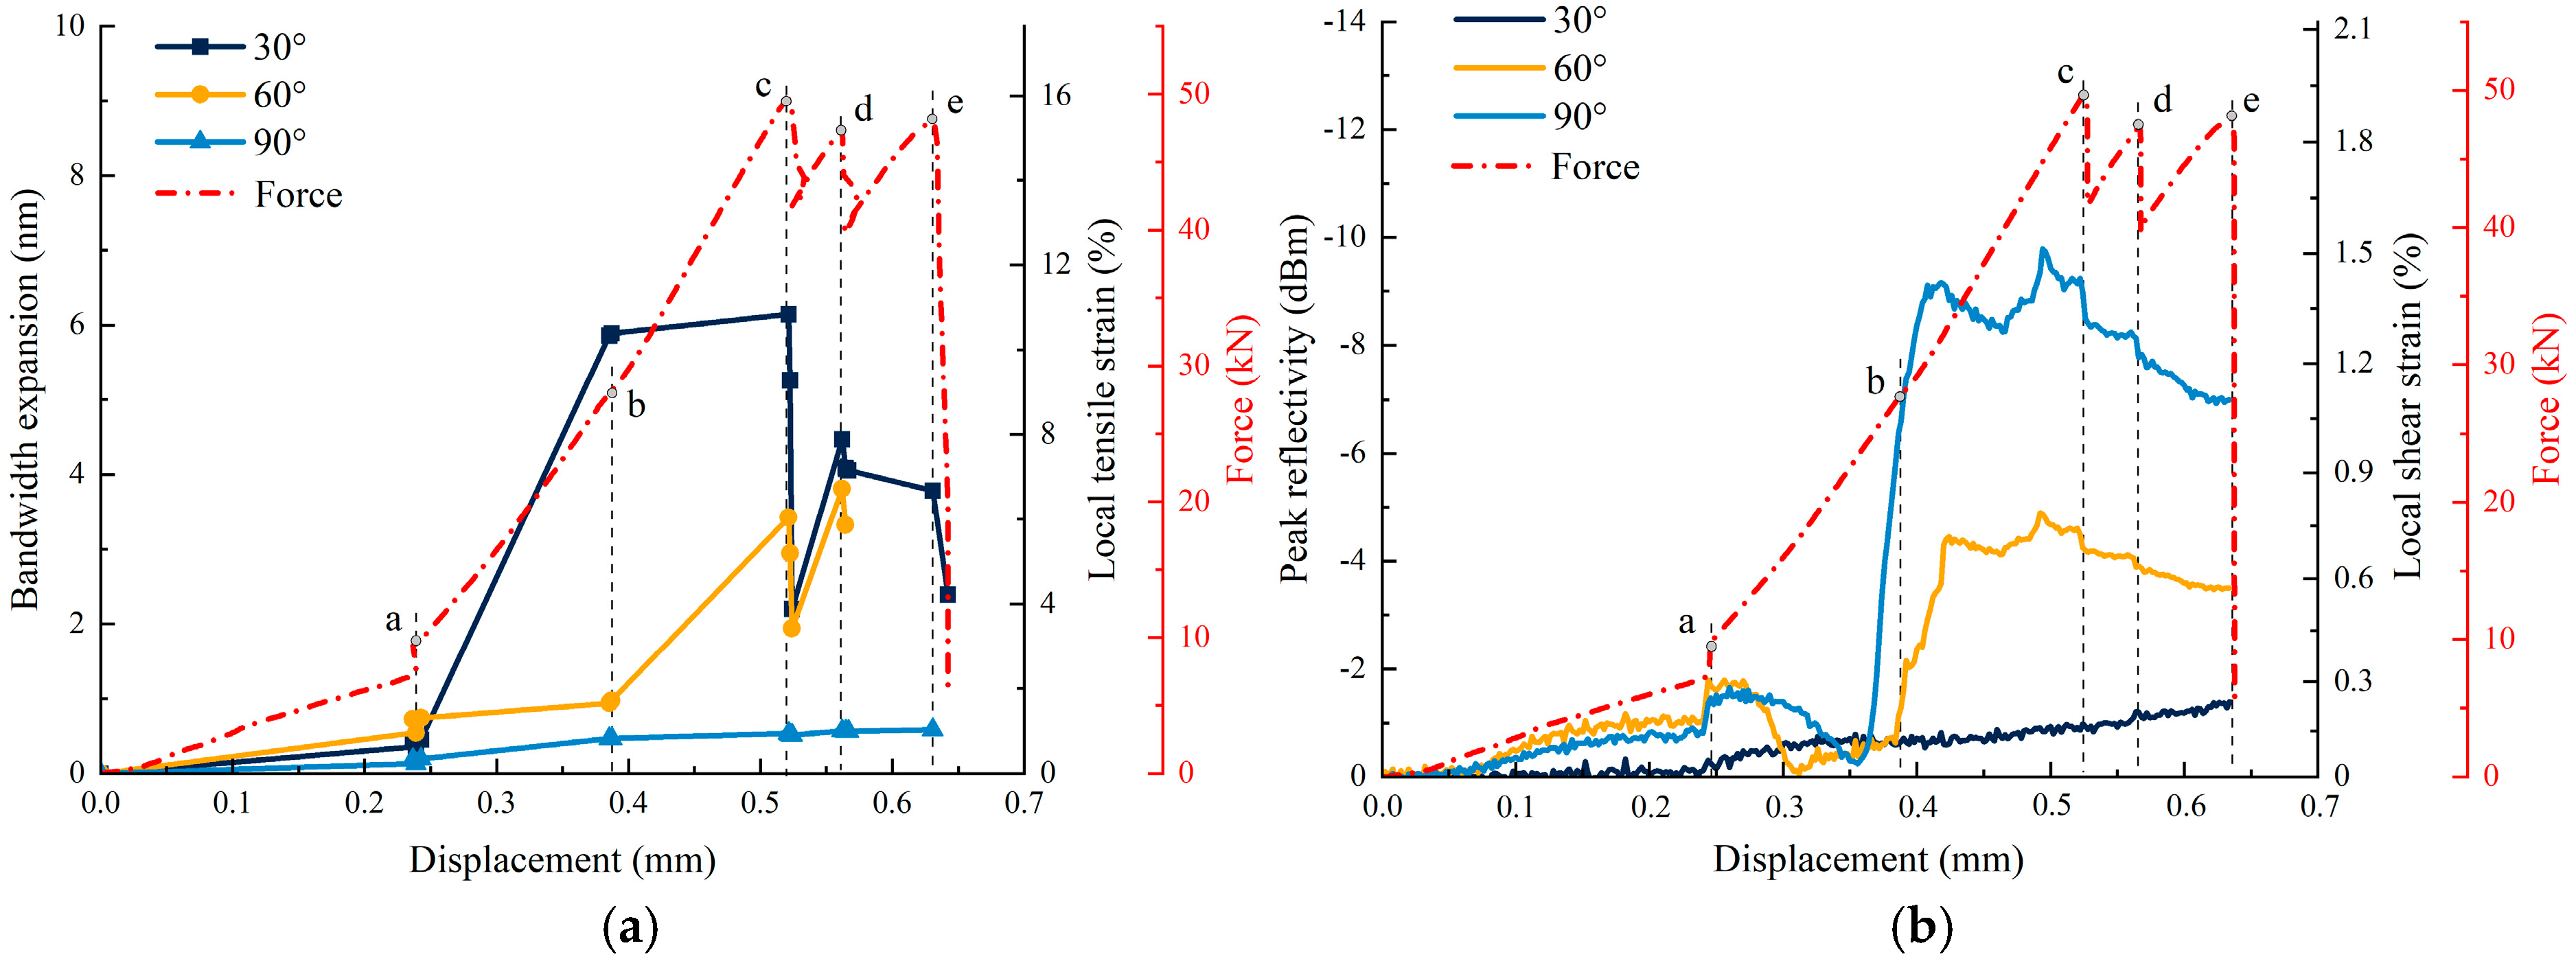
During the loading process, the significant increase in Δλ for the 30° FBG (from 0.37 nm to 2.62 nm) indicates its alignment with the tensile propagation direction of the wing crack, while the sharp decrease in Δr for the 90° FBG (from −16 dBm to −50 dBm) reflects the concentration of shear strain on the plane perpendicular to the crack surface (Figure 8). This directional sensitivity verifies the model’s ability to resolve local stress components. The variations in the bandwidth expansion and peak reflectivity values for specimens B2 and B3 are shown in Figure 11 and Figure 12, respectively, and these curves exhibit similar trends to those described for specimen B1.

3.3. Failure Modes of the Pre-Cracked Sandstone Specimens

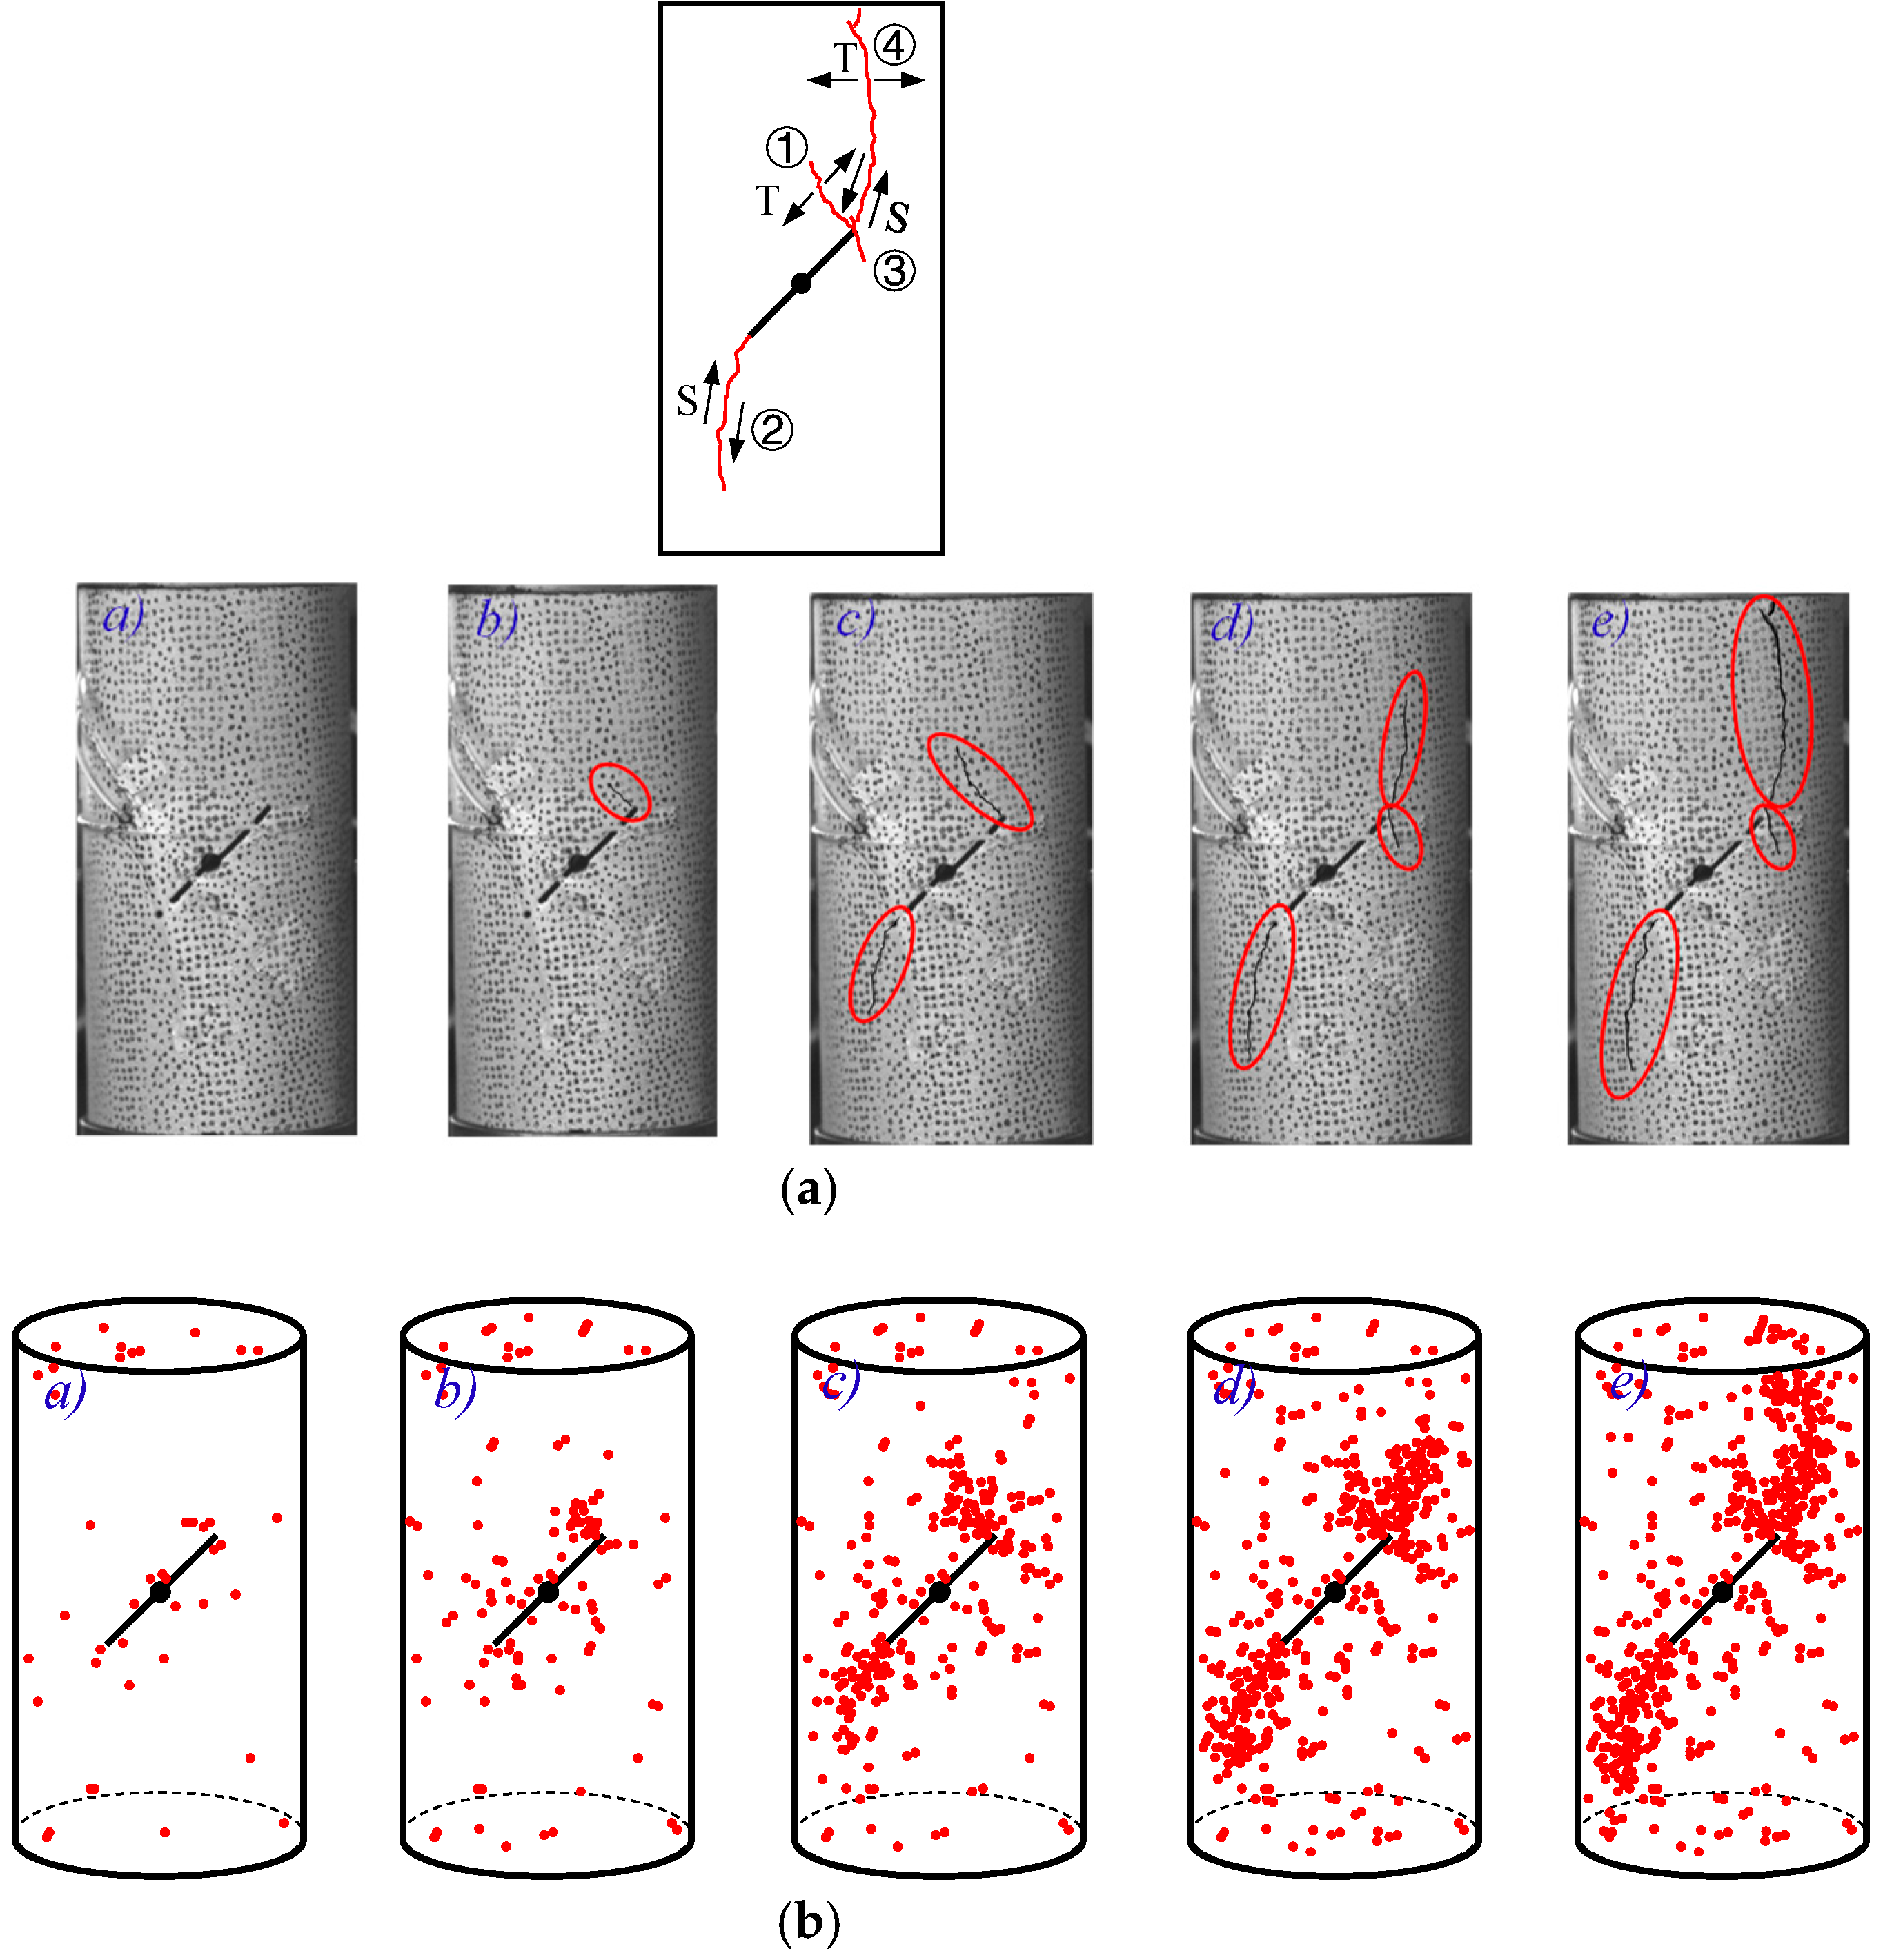
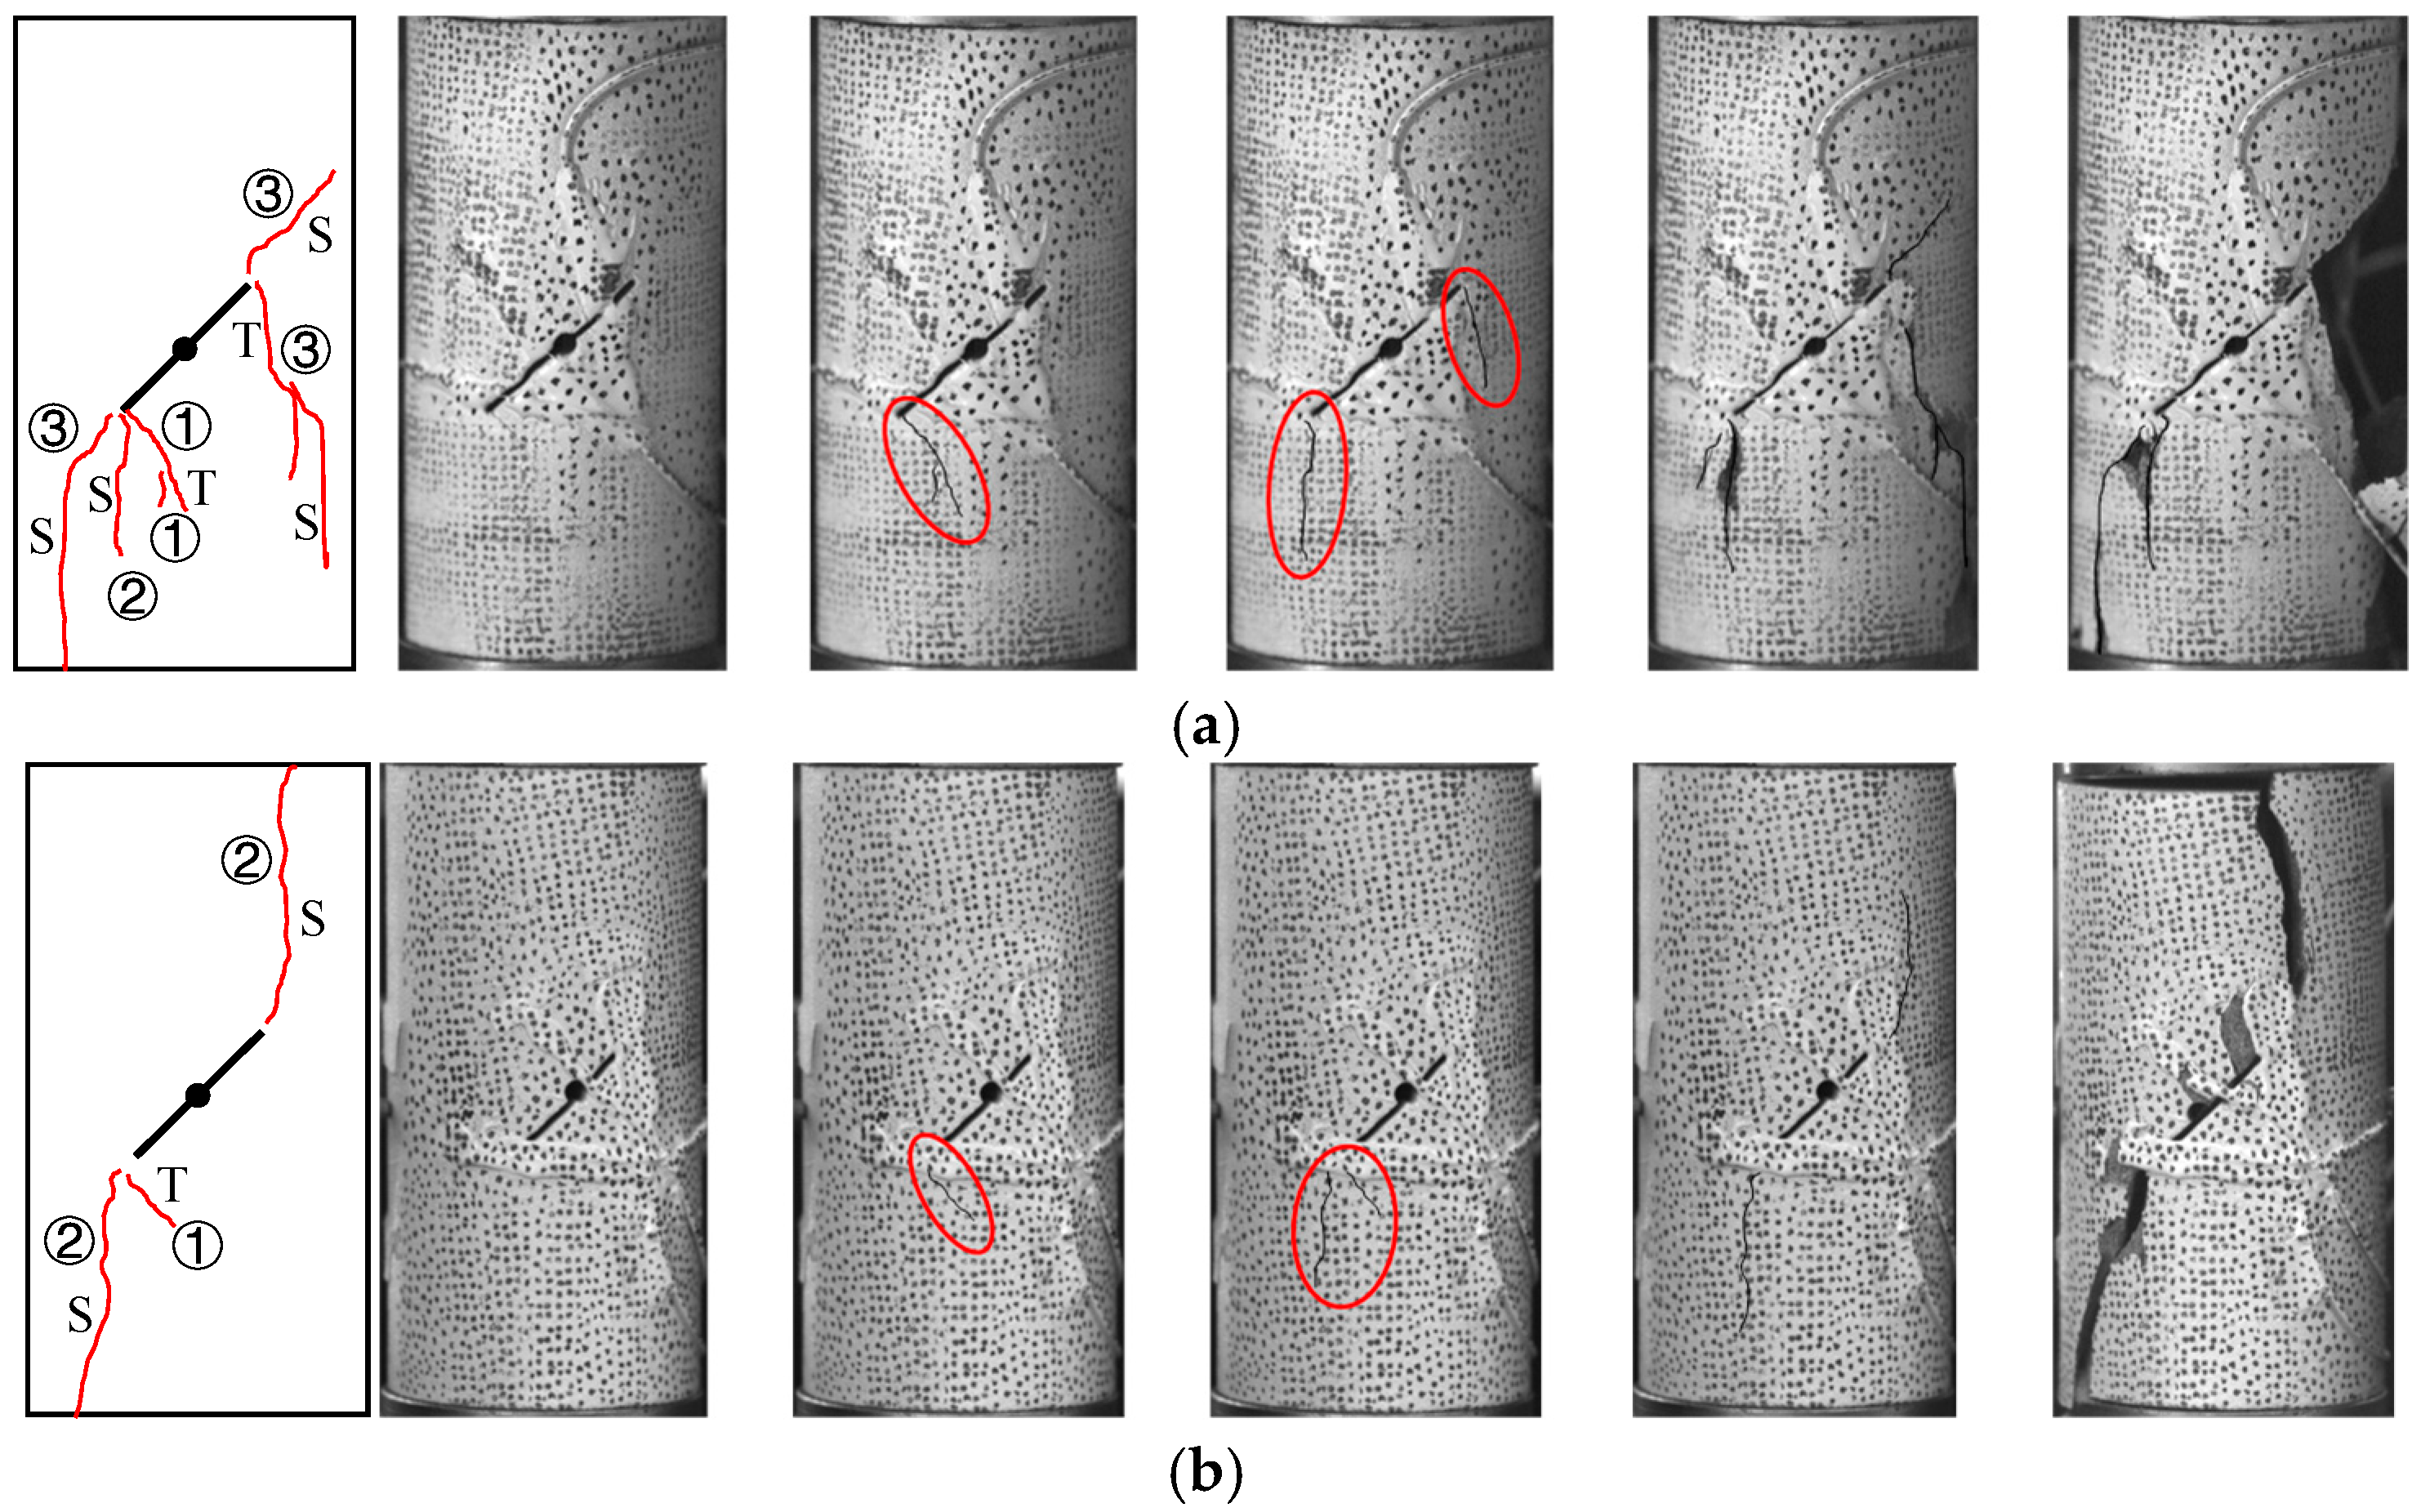
Under external-loading conditions, various types of cracks with different trajectories and initiation mechanisms (tensile or shear) may develop in fractured rocks. As was summarized by Wong [38], seven typical crack patterns exist. Figure 13 and Figure 14 illustrate the surface-crack propagation processes in the single-fracture cyan sandstone specimens. During the initial loading, all three specimens developed wing cracks in the direction perpendicular to that of the pre-existing fracture and at its tips. However, these wing cracks had different orientations in the different specimens: specimens B1 and B2 exhibited wing cracks at the top of the fracture, while specimen B3 had bottom-initiated wing cracks. In specimens B1 and B3, the wing cracks eventually became compacted during the later loading stages, and the final failure patterns were not determined by these initial cracks. However, in specimen B2, after the top wing cracks propagated sufficiently, anti-tensile cracks emerged. This phenomenon typically accompanies tensile failure, and in this case, it ultimately resulted in a combined failure mode in which the wing cracks coalesced with the pre-existing fracture. All the specimens ultimately developed both tensile and shear cracks, and mixed-mode (tension–shear) cracks appeared during the propagation process.
The AE localization patterns that appeared during the failure process of specimen B1 are shown in Figure 13b. During the initial loading stage, the AE events exhibited a random and scattered distribution, though concentration of the stresses led to the formation of localized micro-crack clusters near the fracture tips with no visible macroscopic cracking. When the loading progressed to point b, concentrated AE clusters appeared at the top fracture tip as wing cracks initiated and propagated in the direction perpendicular to that of the pre-existing fracture; this phenomenon resulted in a significant increase in the number of AE events. When the loading process reached point c, AE clusters began to develop at the bottom fracture tip, which indicated the beginning of macroscopic crack propagation, and the wing cracks continued to extend. During this stage, the AE events that were aligned with the direction of the top fracture revealed the development of micro-cracks in this region. At point d, many dense AE clusters formed along the direction of the fracture; this occurrence marked substantial macroscopic crack growth in which most of the AE events were concentrated along the propagation path. The final failure was characterized by complete coalescence of the top cracks while the bottom cracks remained unconnected, as well as by intensive AE activity along all the crack propagation paths.
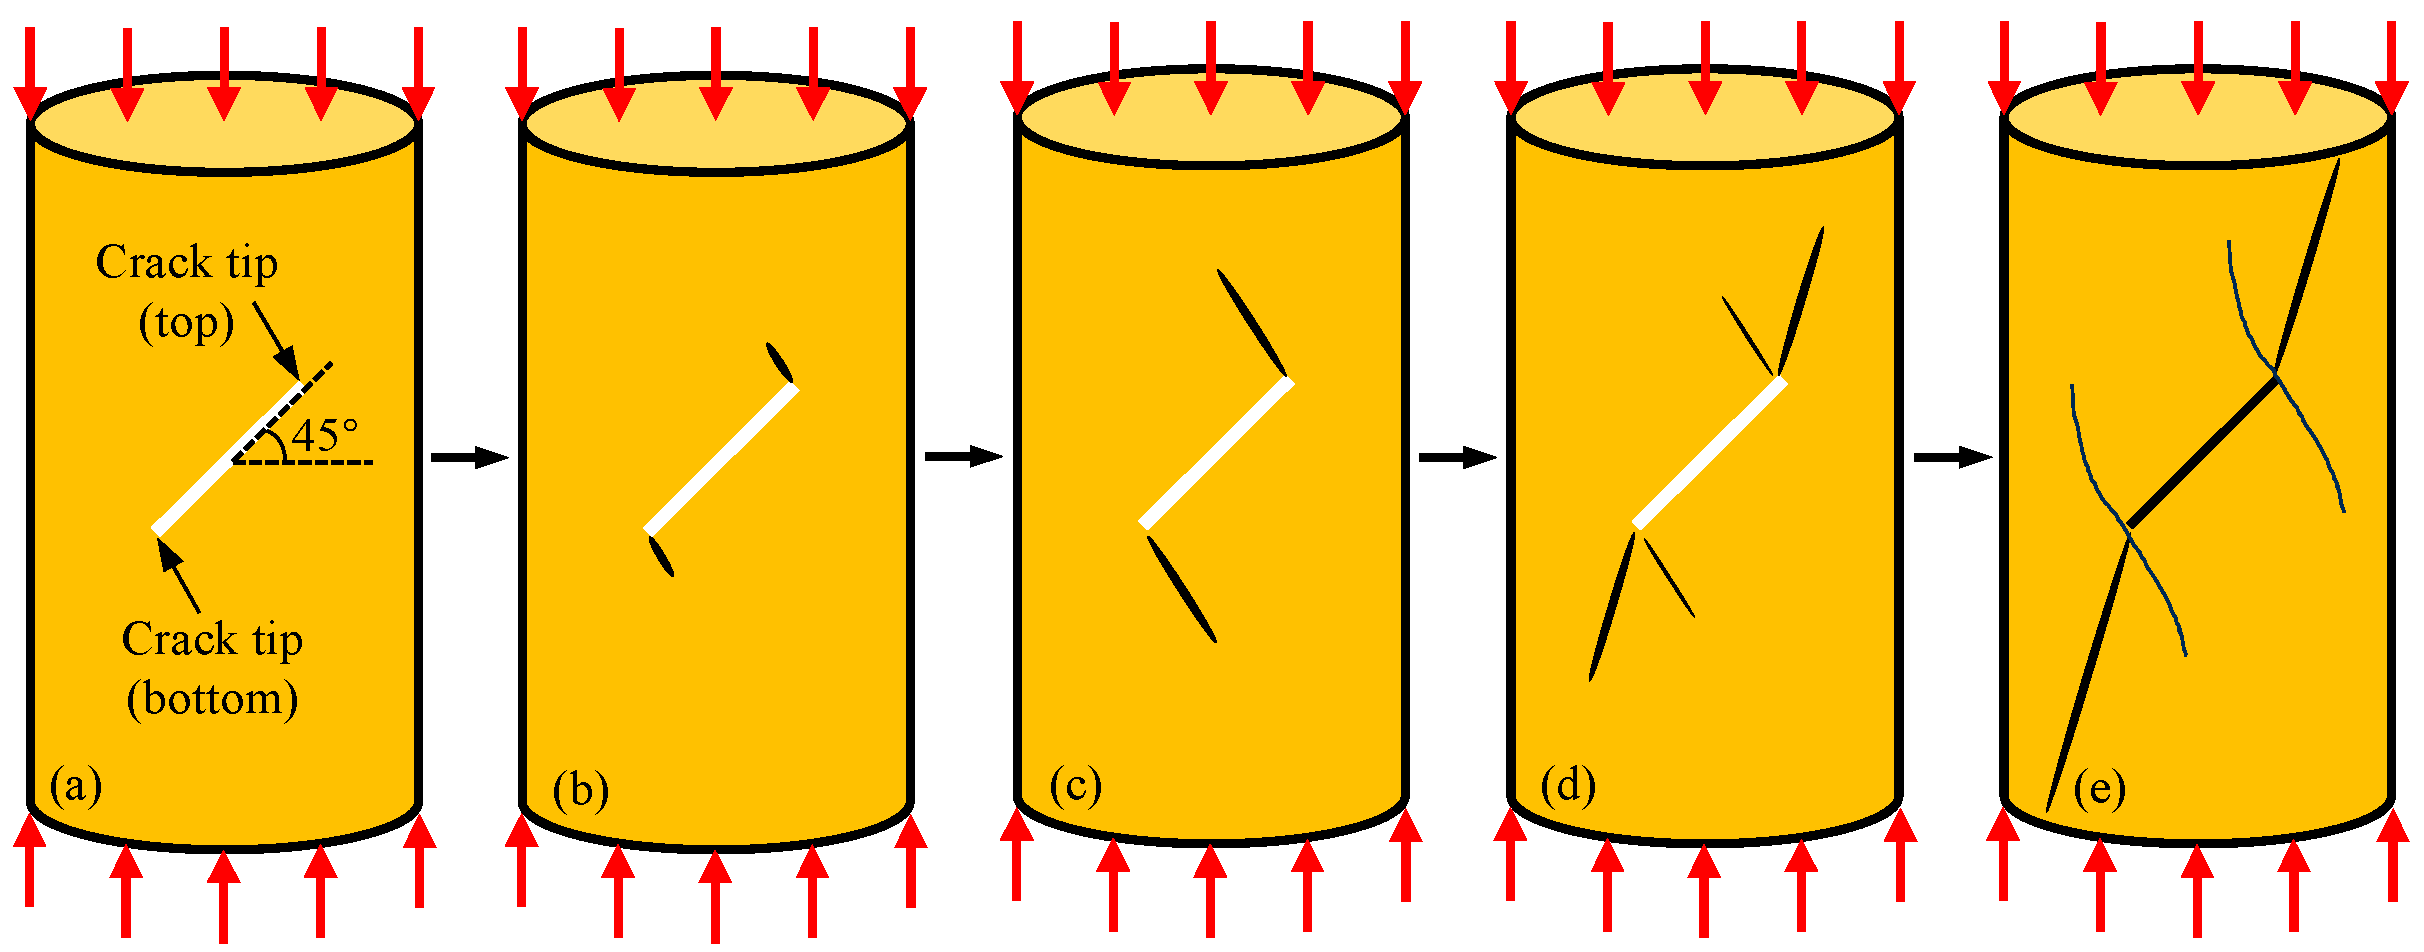
The stress–strain behavior and failure patterns collectively demonstrate the crack propagation mechanism, which is illustrated in Figure 15. The stress–strain curves for the fractured cyan sandstone specimens exhibit five characteristic stages: initial compaction, elastic deformation, first stress decrease, intermittent failure of the shear-locking effects, and final stress decrease [39,40]. The shear-locking phenomenon is responsible for the multiple peaks that appear in the stress–strain curves. The AE monitoring results show that the pre-cracked specimens generated fewer micro-fracture events than did intact rocks; this occurred because the failure process was predominantly controlled by the pre-existing fractures, while the formation of new cracks was limited. However, the high-energy micro-fracture events that occurred during the stress decreases released substantially more energy than those that occurred in intact specimens; this result clearly demonstrates that pre-existing fractures promote brittle post-peak behavior in sandstone.

3.4. Analyses of the Propagation Process and Mechanism of the Pre-Crack Sandstone

When exposed to prolonged geological tectonic activity, rocks develop many complex structural discontinuities, such as joints and fractures, which significantly alter their physical and mechanical properties [41]. The propagation and coalescence of cracks within rocks generally occur in three distinct phases. First, in the initial stress application phase, while no macroscopic crack propagation occurs, the damaged zones at the crack tips expand. Second, in the sustained loading phase, rapid crack extension occurs in the rock matrix. Third, the cracks continuously propagate until they are completely interconnected. The evolution of the crack-propagation process is depicted in Figure 16. When FBGs are used to monitor fractured rock specimens, crack propagation induces non-uniform strains at the fracture locations, which cause measurable spectral distortions. The crack-propagation process can be quantitatively characterized by calculating the changes in both bandwidth expansion and the peak reflectivity.
Figure 17 shows the spectral variations for the FBG oriented at 60° in specimen B1. Before the initial yield strength is reached at point c, the bandwidth expansion progressive increased at various rates, while the peak reflectivity decreased with a nearly constant slope. During the initial loading stage (the oa stage), Δλ gradually and linearly increased to 0.36 nm, while Δr decreased linearly to −0.93 dBm; these results indicate that the micro-crack compaction phase was dominated by a small linear tensile strain around the pre-existing fracture. During the ab stage, Δλ increased nonlinearly to 0.97 nm with an accelerating slope, while Δr decreased linearly to −1.83 dBm. Although the load–displacement curve exhibits linear elastic deformation, the spectral data reveal a significant stress concentration around the pre-existing fracture, which produced a locally nonlinear tensile strain and a linearly increasing shear strain. During the bc stage, both Δλ and Δr varied linearly. Figure 16 shows that this stage marked the initiation of wing cracks, which was primarily driven by the linearly increasing tensile strain (which was quantified by the Δλ measurements), while local shear stress concentrations developed at the crack tips. After the initial yield strength was reached at point c, the first stress decrease in the load–displacement curve occurred. In the cc1 stage, Δλ increased nonlinearly with a decelerating slope, while Δr decreased sharply from −3.21 to −8.48 dBm (which represents a reduction of approximately 150%); these results indicate shear-dominated failure with large shear strains that initiated crack propagation. During the c1d load-recovery stage, the Δλ slope gradually decreased and Δr continued to decline, though it declined more slowly than during the cc1 stage. These results demonstrate the development of a stress concentration in which shear stress was dominant, and which generated shear-locking effects between the main crack and the partially extended wing cracks. At point d, the second stress decrease occurred, and Δλ peaked at 1.49 nm. In the subsequent d1d stage, Δλ decreased nonlinearly, while Δr dropped nearly vertically; thus, continued shear-driven crack advancement was confirmed. The d1e stage, which preceded the final failure at point e, featured step-like reductions in Δr, which revealed discontinuous fracture progression. Throughout the loading process, the slope variations in both the Δλ and Δr curves consistently aligned with the mechanical response; thus, the ability of the FBGs to characterize real-time crack evolution was validated.
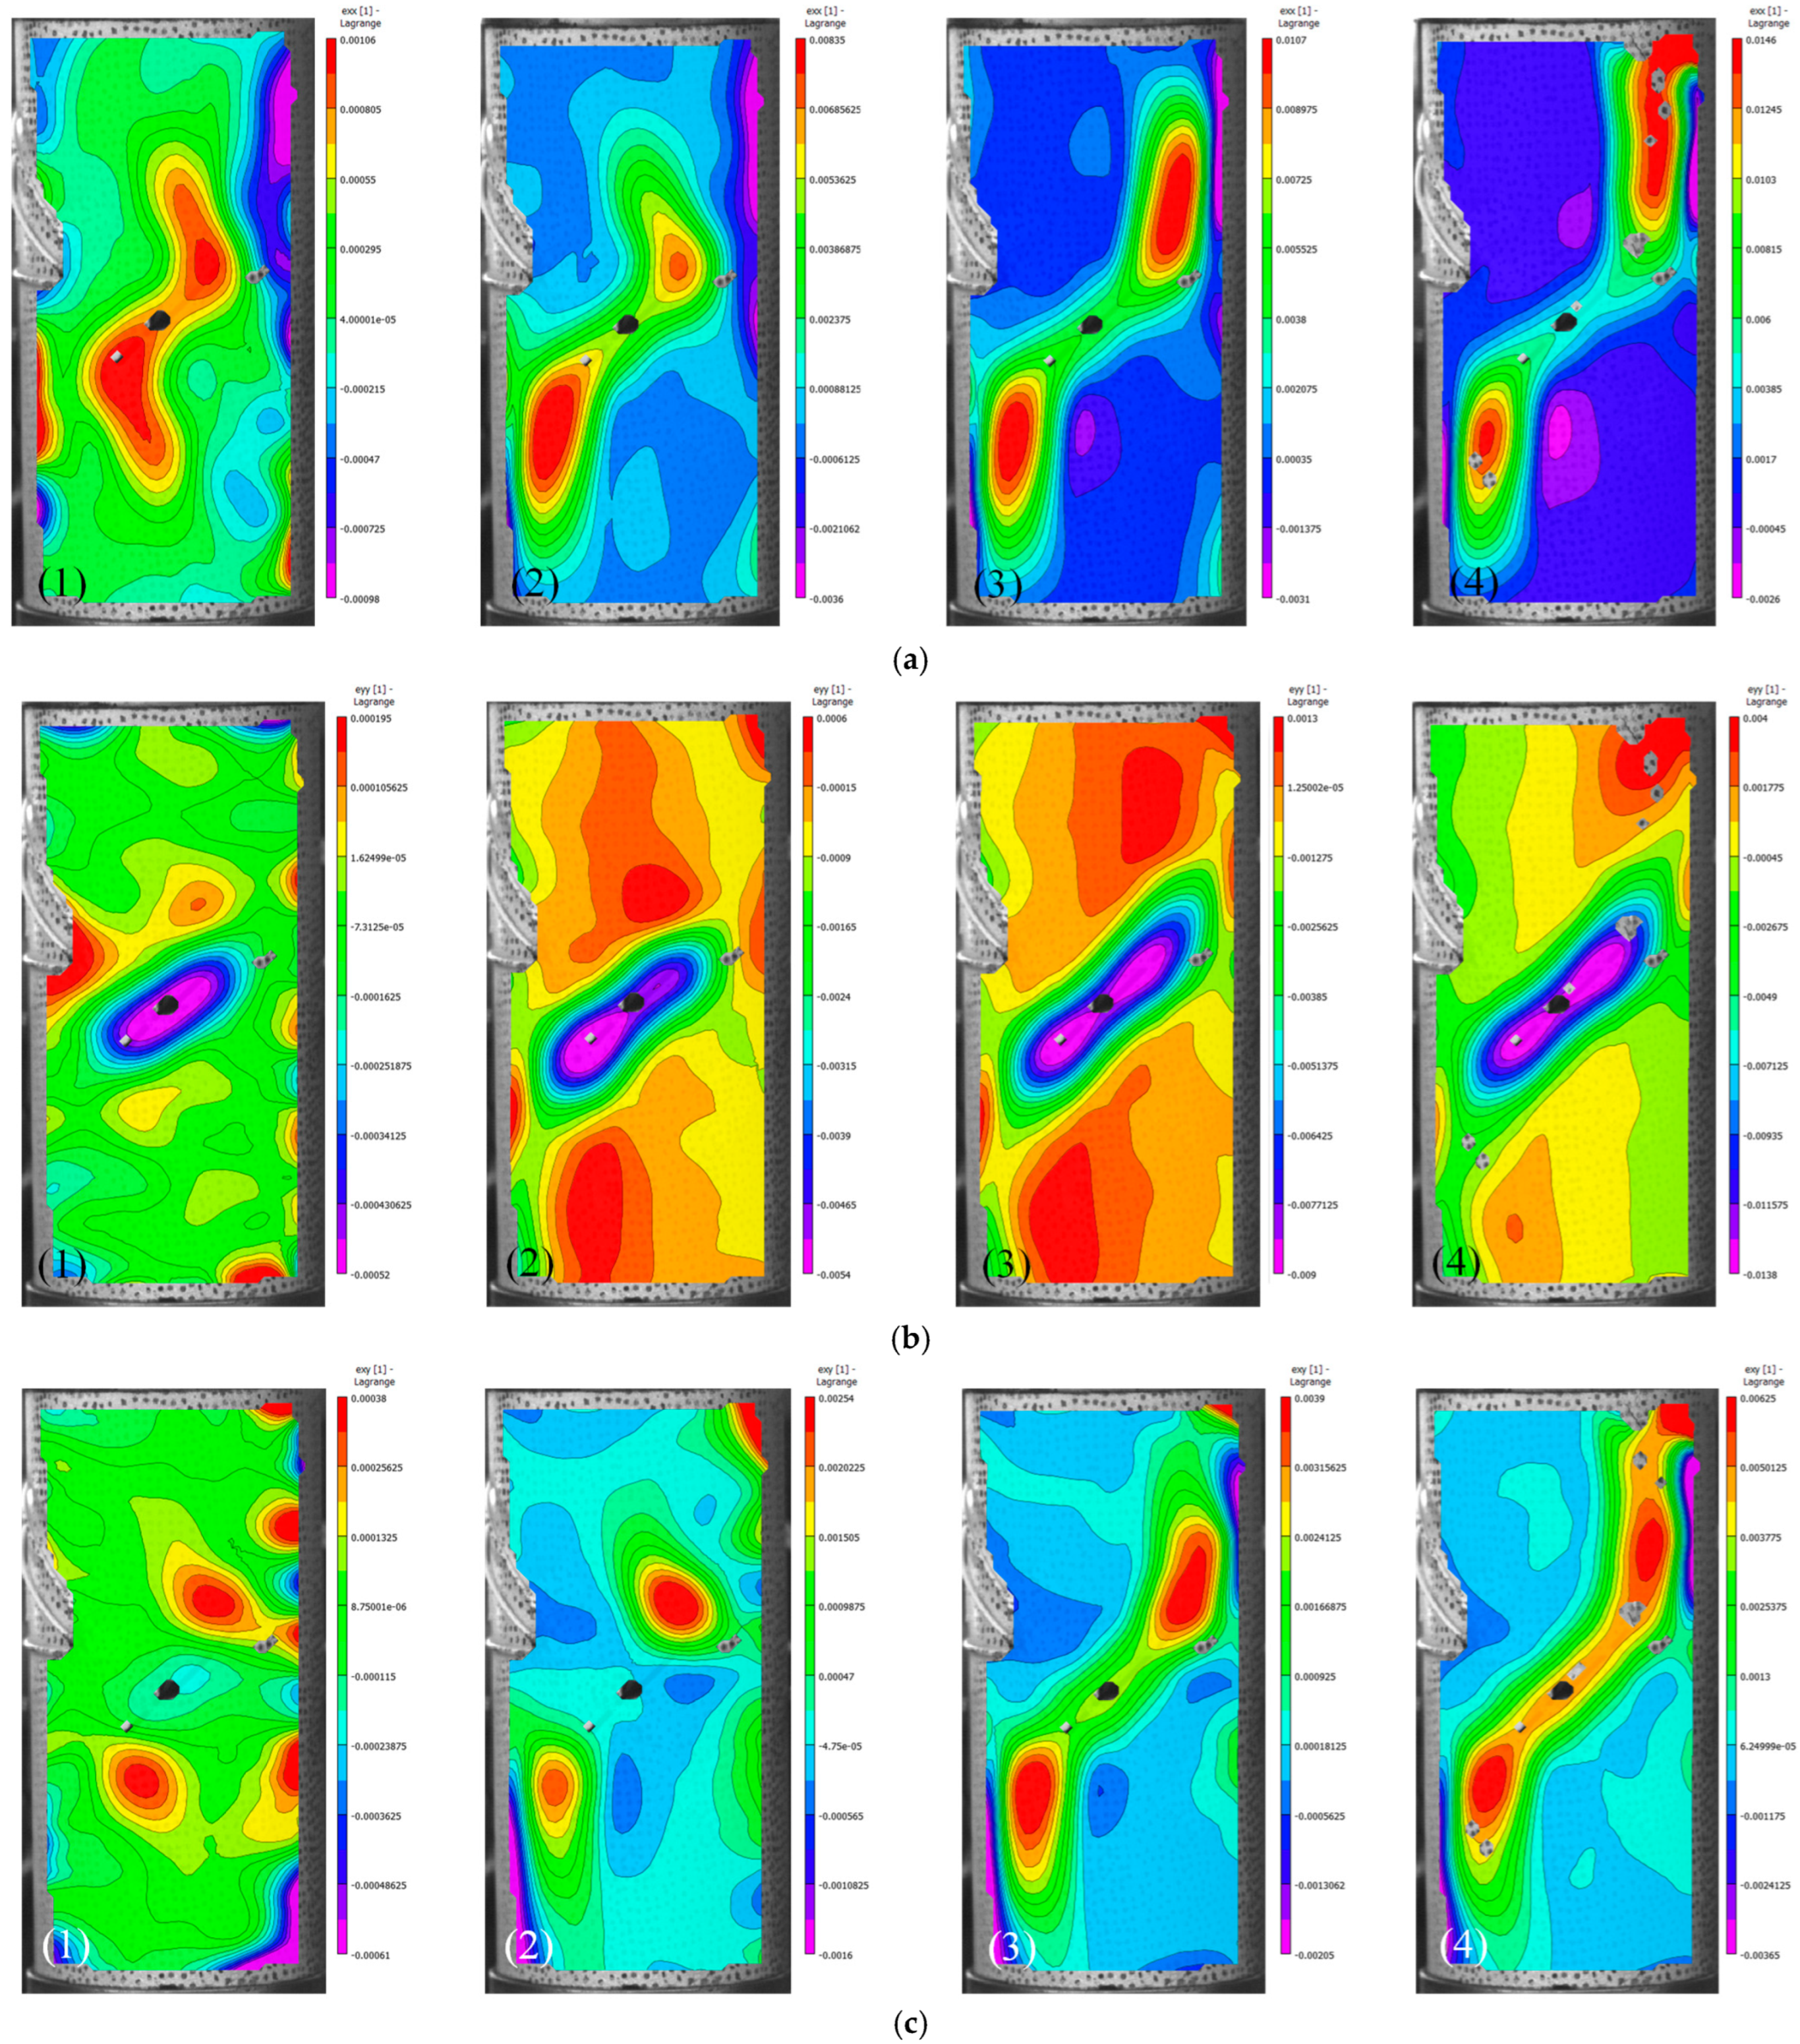
During the crack-propagation process, the local tensile and shear strains collectively determine the direction of crack growth. DIC monitoring revealed the strain-field evolution on the specimen surface (Figure 18). Initially, the surface strain field was uniformly distributed. When the axial stress reached 80% of the initial yield strength, strain localization emerged on the rock surface, as shown in Figure 18a–c (1). The strain concentration zones in the x and xy directions were located at the crack tip and were oriented in the direction perpendicular to that of the fracture, while strain concentration zone in the y direction covered the entire fracture. This localization indicated the development of internal damage, and the deformation was concentrated in damaged zones where wing cracks were initiated in the direction perpendicular to that of the fracture, while the pre-existing crack gradually became compacted. As the load increased, the strain values in the x and xy concentration zones increased, and these zones migrated toward the crack bottom as the top wing-cracks extended. The rock deformation became discontinuous, and the process transitioned from the localized-concentration stage to the fracture-development stage, as shown in Figure 18a–c (2). When the initial yield strength had been reached, the strain concentration zones expanded toward both ends of the fracture, and the direction of the concentration zone at the crack top gradually transitioned from perpendicular to parallel with respect to the crack propagation direction, as shown in Figure 18a–c (3). The specimen exhibited crack propagation from both ends of the crack, and an extension length of 15 mm was reached. During this strain concentration zone transition, shear-locking effects were generated between the propagating cracks and the wing cracks, and intermittent failures occurred. The strain concentration path essentially followed the crack propagation path. When the axial stress reached the peak strength, the strain concentration zones expanded to the upper or lower ends or the side boundaries of the specimen. When the strain was 1.5%, fully penetrating fractures formed that triggered the final rock failure, as shown in Figure 18a–c (4).
Zhang et al. [42] proposed a quantitative method for directly characterizing rock cracking behavior using DIC, comprising four key steps: measurement point selection, displacement extraction, local coordinate transformation, and relative displacement calculation. To quantitatively characterize the crack-propagation process and identify the crack types, we implemented this methodology by analyzing the relative displacement evolution at characteristic points across fracture surfaces. If the relative strain demonstrated a separation and opening tendency, tensile cracks were indicated; however, if a shear-slippage tendency was demonstrated, shear cracks were indicated. The displacement evolution curves for characteristic points are presented in Figure 19. For points A and B, the horizontal displacements on both sides of the fracture tended to decrease. This result occurred because, under boundary effects, a tensile crack first developed at the right side of the upper crack tip, which caused the left side of the rock mass to move leftward as a whole. However, because point A moved leftward faster than point B, the fracture had an opening tendency. For points C and D, the horizontal displacements on both sides of the crack had opposite directions (one was positive and one negative), which also indicated an opening tendency. When loading duration had reached 250 s, the width of the fracture opening suddenly decreased, which indicated that the fracture had begun a compaction and closure process. For points E and F, the displacements on both sides of the crack showed increasing trends, which resulted from the fracture compaction and closure effects. Since point F moved faster than point E, the fracture still demonstrated an opening tendency; however, the opening rate was slower. For points A, B, C, and D, the vertical displacements on both sides of the crack remained consistent, which indicates that there was no shear-slippage tendency between the fracture sides. However, for points E and F, significant differences between the vertical displacements of the two sides were observed, which demonstrates shear-dislocation phenomena. The roughness of the shear surface caused the fracture plane to exhibit a slow expansion tendency in the normal direction. In summary, the fractures at characteristic points A, B, C, and D were tension-dominated, while the fracture at points E and F was shear-dominated. These results indicate that the rock experienced a mixed tensile–shear failure.
The strain evolution curves for the characteristic points were used to quantitatively determine the crack initiation times and sequence. The strain evolution characteristics were analyzed at the points where the FBGs were bonded to the fracture surface. The principal strains at the characteristic points were calculated from the tensile and shear strains that were measured by the FBGs, and the resultant principal-strain evolution curves are presented in Figure 20. At 50 s into the loading process, the principal strain at the crack tip began to increase slowly; the principal strain at point B started to increase at 70 s, which indicates that the pre-existing crack in the specimen had begun to close gradually. When the loading time approached 125 s and the axial stress reached 70% of the initial yield strength, the strain growth rate increased and strain localization appeared at the crack tip. At 150 s into the loading process, the principal strain at point A decreased and the wing crack that was perpendicular to the crack tip at point A began to propagate, which caused the stress to be redistributed and the pre-existing crack to close further. Since no wing crack appeared at the crack tip at point C, continued loading caused the principal strain at point C to gradually exceed that of point A. At 180 s, the principal strain briefly decreased and then rapidly increased, which marked the initiation of the pre-existing crack propagation. As the loading continued, shear-locking effects were generated with the insufficiently propagated wing cracks; however, these effects failed within a short time, after which the crack continued to propagate. At approximately 210 s into the loading process, the principal strain at the crack tip began to increase steadily, at which time new shear-locking effects were produced during the continued crack propagation. Due to the rapid failure of the second shear-locking event, the FBGs failed to capture this transient process. At 250 s, the principal strain at the crack tip increased rapidly as the cracks gradually coalesced and the pre-existing crack closed.

3.5. Spectral Damage Characteristics of the Pre-Crack Sandstone Monitored by the FBGs

During the failure processes of the pre-fractured rock specimens, the wavelength, bandwidth, and peak reflectivity values of the FBG spectra exhibited discontinuous variations. Extensive studies have demonstrated that the damage variable, D, of a rock can be defined by various parameters [43]. For instance, Zhang et al. [44] conducted uniaxial compression tests on 3D-printed sandstone specimens featuring varied intermittent aperture densities, analyzing damage evolution processes using DIC monitoring results. Dong et al. [45] performed uniaxial compression tests on specimens with prefabricated defects, utilizing AE ring-down counts as damage variables to characterize critical states during damage progression. Wang et al. [46] established a loss-damage constitutive model through AE energy analysis during uniaxial compression tests on fractured rocks under diverse loading rates, quantitatively describing deformation and damage processes.
To characterize the damage evolution in the pre-fractured specimens during the loading process, the characteristic parameters of the FBG reflection spectra can serve as effective damage indicators. The reflection characteristics of FBGs can be described by the coupled-mode theory, in which periodic refractive-index modulation induces coupling between forward- and backward-propagating modes. The key spectral parameters, which are the peak reflectivity and the bandwidth, can be expressed by Equations (13) and (14), respectively:
r max = tanh 2 ( κ L ) ,
λ = λ B 2 π n e f f L ( κ L ) 2 + π 2 .
In Equations (13) and (14), κL represents the product of the coupling coefficient and the grating length, and it reflects the overall coupling strength. This parameter critically determines the FBG spectral characteristics because it influences both the peak reflectivity and the bandwidth while governing the spectral shape. Therefore, κL was adopted as the damage indicator for the specimens investigated during this study. For cases in which the coupling is weak (κL < 1), the peak reflectivity and bandwidth can be approximated by Equations (15) and (16), respectively:
r max ( κ L ) 2 ,
λ λ B 2 n e f f L .
Equations (15) and (16) demonstrate that, when the FBG is subjected to shear stress (and thus the grating length remains constant) the variations in the peak reflectivity can be primarily determined by the coupling coefficient, κ. Conversely, when the FBG is subjected to tensile stress, the spectral bandwidth variations are mainly governed by the grating length, L. When the FBG experiences a combination of shear and tensile stresses, κ and L can be calculated separately. In this study, the initial grating length, L0, was 1 cm; thus, the initial κL product can be expressed by Equation (17):
κ L r max λ B 2 λ n e f f .
Kachanov defined D by the expression in Equation (17) [47]:
D = A d A ,
where A is the initial effective cross-sectional area and Ad is the damaged area. The FBG coupling strength, g = κL, was selected as the independent variable used to characterize the crack damage in the specimens during this study. The integrated coupling strength per unit of damaged area is defined by the expression in Equation (19):
g c = g w A ,
where gc is the coupling strength per unit of damaged area and gw is the coupling strength at complete failure. When the rock damage reaches a certain state with Ad, the instantaneous coupling strength can be expressed by Equation (20):
g d = g c A d = g w A A d ,
By combining Equations (18) and (19), the damage variable can be rewritten as Equation (21):
D = g d g 0 .
During experimental processes, rock specimens cannot achieve complete damage failure and will retain some residual strength after the failure. When the maximum damage level is reached, the damage variable remains less than 1; therefore, modification of the damage variable is necessary. The damage variable was corrected according to Equation (22):
D = D i g d g w .
In Equation (22), gw represents the coupling strength when the damage variable reaches the critical value. The critical damage value must be normalized according to Equation (23):
D i = 1 σ c σ p ,
where σ c and σ p represent the peak strength and the residual strength, respectively, after the peak strength of the rock material has been reached. The modified damage variable can then be expressed by Equation (24):
D = ( 1 σ c σ p ) g d g w .
The damage evolution curves obtained from the experiments are depicted in Figure 21. Under uniaxial compression conditions, the damage characteristic curves of the pre-cracked sandstone specimens monitored by FBGs can be divided into three stages: initial damage accumulation, damage acceleration, and final failure. During the initial damage accumulation stage (the ob stage), the damage variable, which was obtained by the FBGs mounted at different angles, remained low (with values of 0.13, 0.24, and 0.11 for the 30, 60, and 90° FBGs, respectively). These low values reflected the gradual accumulation of micro-damage caused by crack compaction and elastic deformation. In the damage acceleration stage (the bc stage), D increased to 0.26 and 0.4 for the 30 and 60° FBGs, respectively, thereby indicating stress concentrations at the crack tips, which initiated wing-crack propagation. After the initial yield strength was reached at point c, D of the 90° FBG increased abruptly; this sharp increase corresponded to crack propagation and a significant release of AE energy. This stage featured two stress decreases, during which D increased rapidly (shear-locking failure); however, D increased slowly again during the stress recovery. When the peak strength was reached at point e, D reached its maximum value and the specimen failed.
As shown in Figure 22, the damage evolution curves defined by various methodologies in relevant studies consistently validate the feasibility of using FBG coupling strength as a damage metric. The damage curves in Figure 22a, corresponding to different aperture densities, all exhibit typical staged characteristics: a slow increase during the initial loading phase, followed by a sharp rise upon entering the unstable crack propagation stage. This pattern is further corroborated by the curves under four loading conditions in Figure 22b. Most importantly, Figure 22c reveals synergistic effects between different monitoring techniques, where the accelerated increase in the damage variable is fully synchronized with the surge in acoustic emission counts and the stress drop, marking the onset of macroscopic damage. The high degree of consistency in the fundamental morphology of these damage evolution curves demonstrates that the damage curve derived from FBG coupling strength in this study reliably reflects the intrinsic damage evolution process in rocks, particularly the critical transition to unstable failure.
4. Discussion

(1) During monitoring of the failure process of fractured rock under uniaxial compression, FBG, AE, and DIC demonstrate unique advantages and complementarity, jointly establishing a multi-scale, multi-dimensional damage monitoring system. Loading process monitoring results are shown in Figure 23. During the pore compaction stage, AE cumulative energy accumulates at a constant low rate with predominantly low-energy events, indicating no new crack generation. The FBG damage variable D stabilizes within the 0.10–0.15 range, confirming damage originates from pre-existing fracture compression readjustment. During elastic deformation to microcrack initiation, the AE cumulative energy slope abruptly increases by 300%, high-energy events rise to 35%, and localization reveals clustered events at crack tips. Concurrently, FBG damage variable D accelerates, while DIC observes stress concentration perpendicular to prefabricated fractures. These three indicators demonstrate tensile wing-crack nucleation. In the shear-dominated failure phase, AE energy release rate peaks (90% shear-type events). FBG damage variable D leaps to 0.53 primarily due to a 150% Δr drop and shear strain increase from 0.53% to 1.32%, forming a shear lock effect. After the second stress–strain curve steep drop, AE amplitudes show single mega-events > 90 mV along main fractures. FBG-monitored Δλ decreases to 1.01% (reflecting tensile stress unloading) while Δr continuously drops to −20.33 dB (shear strain = 3.02%). DIC captures strain concentration along crack propagation paths—these three results quantitatively characterize shear lock formation and failure. At final instability, AE energy curves rise vertically, FBG damage variable D approaches 1, and DIC observes complete crack coalescence leading to macroscopic failure.
FBG captures micron-scale strain concentration at fracture tips through embedded monitoring. By demodulating bandwidth broadening (Δλ) and peak reflectivity (Δr), it quantifies tensile and shear strain distribution around fractures in real-time. Especially during initial crack propagation when DIC detects no surface deformation, FBG identifies potential damage zones through 0.05–0.1 nm bandwidth variations. AE provides internal dynamic processes with microsecond resolution, recording transient crack propagation and energy changes. DIC offers full-field macro-scale deformation evolution, with spatial resolution tracing strain distribution along crack paths, visually demonstrating complete failure under uniaxial compression.
(2) The monitoring accuracy of the FBG is highly dependent on the strain transfer efficiency between the sensor and the rock mass. Although we achieved a calculated Strain Transfer Efficiency (STE) of approximately 96.2% (Equation (2)) by selecting an epoxy adhesive with a matched elastic modulus and controlling the adhesive layer thickness, additional errors may be introduced under complex field conditions due to factors such as the long-term durability of the adhesive, temperature effects, and the surface roughness of the rock mass. Furthermore, the response of the FBG to localized strain gradients is subject to physical limitations. When the strain gradient exceeds a certain threshold, significant distortion of the reflection spectrum occurs, making accurate demodulation challenging. Consequently, the current method is more suitable for monitoring strain field variations during the main fracture evolution stage. Currently, the relationships between Δλ/Δr and the local strains are primarily qualitative and semi-quantitative. Achieving fully quantitative analysis requires the development of more sophisticated inversion models that can correlate the FBG spectral response with complex, non-uniform strain fields.

5. Conclusions

(1)
The variations in the FBG bandwidth expansion and the peak reflectivity effectively reflected the local stress characteristics during the crack-propagation process. During the initial loading stage, the stress concentration at the crack tip and the wing-crack development were dominated by tensile stress (the maximum tensile strain was 1.01%). After the initial yield strength was reached, the crack propagation transitioned to a shear-dominated behavior (the maximum shear strain was 6.45%). During multiple stress decreases, the measured local shear and tensile strains accurately captured the stress variations associated with the shear-locking effects and the failure stages, and the results were consistent with the displacement evolution of characteristic points and acoustic-emission localization results.
(2)
The principal-strain evolution curves obtained from the FBGs were used to determine the timing of the crack initiation. Strain concentration zones developed over an extended period before the tensile cracks were initiated, while the shear cracks exhibited shorter incubation times. During the shear-locking generation and failure stage (180–250 s), the principal strain briefly decreased before it rapidly increased due to the initial failure; however, the transient secondary-failure process was not captured.
(3)
The product of the FBG coupling coefficient and grating length, which represents the overall coupling strength, served as an effective damage variable during the loading process. The spectral damage characteristic curves can be divided into three stages: initial damage accumulation, accelerated damage growth, and final failure. After the initial yield strength was reached, the FBG measured damage variable increased rapidly. The damage variable surged abruptly during the two stress decreases, while it increased slowly during the stress-recovery phases. The damage variable peaked when the stress attained its maximum value.

Author Contributions

Z.Z.: Conceptualization, Methodology, Formal analysis, Writing—Original draft, Writing—Review and editing. S.W.: Conceptualization, Writing—Original draft, Funding acquisition. H.N.: Conceptualization, Methodology, Formal analysis, Writing—Original draft, Writing—Review and editing, Funding acquisition. All authors have read and agreed to the published version of the manuscript.

Funding

This research was funded by the National Natural Science Foundation of China [grant number 51674099, 51974106].

Institutional Review Board Statement

Not applicable.

Informed Consent Statement

Not applicable.

Data Availability Statement

The data that support the findings of this study are available from the corresponding authors upon reasonable request.

Acknowledgments

This work was supported by the guidance and financial support of Shiming Wei and Hua Nan.

Conflicts of Interest

The authors declare no conflicts of interest.

References

  1. Zhao, H.B.; Hu, G.L.; Li, W.; Zhang, H.; Lei, K. Research progress and thinking on crack propagation law of prefabricated fractured rocks. Chin. J. Undergr. Space Eng. 2016, 12, 899–906. [Google Scholar]
  2. Wang, S.Y.; Sloan, S.W.; Sheng, D.C.; Yang, S.Q.; Tang, C.A. Numerical study of failure behavior of pre-cracked rock specimens under conventional triaxial compression. Int. J. Solids Struct. 2014, 51, 1132–1148. [Google Scholar] [CrossRef]
  3. Dong, L.J.; Zhang, Y.H.; Sun, D.Y.; Chen, Y.C.; Tang, Z. Stage characteristics of acoustic emission and identification of unstable crack state for granite fractures. Chin. J. Rock Mech. Eng. 2022, 41, 120–131. [Google Scholar] [CrossRef]
  4. Wang, X.R.; Wang, E.Y.; Liu, X.F.; Zhou, X. Failure mechanism of fractured rock and associated acoustic behaviors under different loading rates. Eng. Fract. Mech. 2021, 247, 107674. [Google Scholar] [CrossRef]
  5. Fu, S.Y.; Li, H.B.; Li, X.F. Research on the range of fracture process zone of granite based on DIC and acoustic emission. Chin. J. Rock Mech. Eng. 2022, 41, 2497–2508. [Google Scholar] [CrossRef]
  6. Liu, S.X.; Xing, J.; Zheng, X.; Chen, S.J. Zonal damage information and critical failure identification of CT images of rock under triaxial compression. Chin. J. Geotech. Eng. 2021, 43, 432–438. [Google Scholar] [CrossRef]
  7. Zhang, Y.; Li, G.; Wang, X.Y.; Chen, Z.; Li, Z. Microfabric characteristics of tight sandstone of Xujiahe formation in western Sichuan after high temperature and the effect on mechanical properties. Chin. J. Rock Mech. Eng. 2021, 40, 2249–2259. [Google Scholar] [CrossRef]
  8. Gao, X.; Gao, Y.N. Method for extracting stressed rock crack based on light reflectivity mutation. J. Mine Autom. 2022, 48, 76–84. [Google Scholar] [CrossRef]
  9. Xu, L.; Si, G.Y.; Jiang, S.; Wang, Y.H.; Jiao, S.L.; Wan, Y. Identify and formulate internal rock damage variable via acoustic emission (AE) and wave velocity measurement on rock materials-A review. Case Stud. Constr. Mater. 2025, 22, e04768. [Google Scholar] [CrossRef]
  10. Fusseis, F.; Xiao, X.; Schrank, C.; Decarlo, F. A brief guide to synchrotron radiation-based microtomography in (structural) geology and rock mechanics. J. Struct. Geol. 2014, 65, 1–16. [Google Scholar] [CrossRef]
  11. Tarik, S.; Lin, Q.Y.; Butcher, A.R.; Bijeljic, B.; Blunt, M.J. Multi-scale multi-dimensional microstructure imaging of oil shale pyrolysis using X-ray micro-tomography, automated ultra-high resolution SEM, MAPS Mineralogy and FIB-SEM. Appl. Energy 2017, 202, 628–674. [Google Scholar] [CrossRef]
  12. Chai, J.; Liu, Y.L.; OuYang, Y.B.; Zhang, D.D.; Du, W.G. Application of Digital Image Correlation Technique for the Damage Characteristic of Rock-like Specimens under Uniaxial Compression. Adv. Civ. Eng. 2020, 2020, 8857495. [Google Scholar] [CrossRef]
  13. Chai, J.; Ouyang, Y.B.; Liu, J.X.; Zhang, D.D.; Du, W.G. Experimental evaluation of precise monitoring of multi-scale deformation failure of rock mass based on distributed optical fiber. Measurement 2022, 199, 111381. [Google Scholar] [CrossRef]
  14. Hong, C.Y.; Zhang, Y.F.; Li, G.W.; Zhang, M.X.; Liu, Z.X. Recent progress of using Brillouin distributed fiber optic sensors for geotechnical health monitoring. Sens. Actuators A-Phys. 2017, 258, 131–145. [Google Scholar] [CrossRef]
  15. Hong, C.Y.; Zhang, Y.F.; Zhang, M.X.; Gordon, L.L.M.; Liu, L.Q. Application of FBG sensors for geotechnical health monitoring, a review of sensor design, implementation methods and packaging techniques. Sens. Actuators A-Phys. 2016, 244, 184–197. [Google Scholar] [CrossRef]
  16. Hou, G.Y.; Hu, Z.Y.; Li, Z.X.; Zhao, Q.R.; Feng, D.X.; Cheng, C.; Zhou, H. Present situation and Prospect of coal mine safety monitoring based on Fiber Bragg grating and distributed optical fiber sensing technology. J. China Coal Soc. 2023, 48, 96–110. [Google Scholar] [CrossRef]
  17. Chai, J.; Zhang, D.D.; Li, Y. Research progress of optical fiber sensing technology in geotechnical and geological engineering. J. Archit. Civ. Eng. 2015, 32, 28–37. [Google Scholar] [CrossRef]
  18. Huo, L.S.; Cheng, H.; Kong, Q.Z.; Chen, X.M. Bond-slip monitoring of concrete structures using smart sensors a review. Sensors 2019, 19, 1231. [Google Scholar] [CrossRef]
  19. Chai, J.; Zhu, L.; Li, Y.; Wei, S.M.; Zhang, G.W.; Yang, J.H. Experiment on sample simulation for detecting rock deformation by fiber optic grating. J. Xi’an Univ. Sci. Technol. 2008, 3, 401–405. [Google Scholar] [CrossRef]
  20. Hattenberger, C.S.; Naumann, M.; Borm, G. Fiber Bragg grating strain measurements in comparison with additional techniques for rock mechanical testing. IEEE Sens. J. 2003, 3, 50–55. [Google Scholar] [CrossRef]
  21. Yang, Y.W.; Bhalla, S.; Wang, C.; Soh, C.K.; Zhao, J. Monitoring of rocks using smart sensors. Tunn. Undergr. Space Technol. 2007, 2, 206–221. [Google Scholar] [CrossRef]
  22. Wei, S.M.; Chai, J.; Yin, S.X. Research of Pre-peak Deformation Detection of Rock with Fiber Bragg Grating Sensing. J. Mine Autom. 2011, 37, 29–32. [Google Scholar]
  23. Zhao, Y.; Yu, C.Y.; Xu, Y. Internal deformation measurement of rock materials based on embedded optical fiber Bragg grating sensor. J. Three Gorges Univ. (Nat. Sci.) 2021, 43, 29–36. [Google Scholar] [CrossRef]
  24. Tang, B.; Cheng, H. Application of distributed optical fiber sensing technology in surrounding rock deformation control of TBM-excavated coal mine roadway. J. Sens. 2018, 2018, 8010746. [Google Scholar] [CrossRef]
  25. Fang, X.Q.; Liang, M.F.; Li, S.; Zhang, L.; Yan, H.B.; Xie, X.P.; Yu, R.; Wu, G.; Lv, J.K. Key technologies of multi-parameter accurate perception and security decision in intelligent working face. J. China Coal Soc. 2020, 45, 493–508. [Google Scholar] [CrossRef]
  26. Piao, C.D.; Wang, D.; Kang, H.; He, H.; Zhao, C.Q.; Liu, W.Y. Model test study on overburden settlement law in coal seam backfill mining based on fiber Bragg grating technology. Arab. J. Geosci. 2019, 12, 401. [Google Scholar] [CrossRef]
  27. Yuan, S.F.; Jin, X.; Qiu, L.; Huang, H.M. Monitoring of crack propagation in repaired structures based on characteristics of FBG sensors reflecting spectra. Spectrosc. Spectr. Anal. 2015, 3, 724–729. [Google Scholar] [CrossRef]
  28. Zhao, Y.; Hu, D.Y.; Shi, W.; Zhang, W.F.; Xu, Y. Monitoring approach of fatigue crack propagation based on deformation spectrum of fiber grating. J. Propuls. Technol. 2022, 3, 383–391. [Google Scholar] [CrossRef]
  29. Giaccari, P.; Dunkel, G.R.; Humbert, L.; Botsis, J.; Limberger, H.G.; Salathé, R.P. On a direct determination of non-uniform internal strain fields using fibre Bragg gratings. Smart Mater. Struct. 2005, 14, 127–136. [Google Scholar] [CrossRef]
  30. Zhang, W.F.; Zhang, M.; Lan, Y.; Zhao, Y.; Dai, W. Detection of crack locations in aluminum alloy structures using FBG sensors. Sensors 2020, 20, 347. [Google Scholar] [CrossRef]
  31. Guo, T.; Qiao, X.G.; Jia, Z.N.; Sun, A.; Chen, C.Y. Simultaneous measurement of temperature and pressure using a single fiber Bragg grating based on reflected wave’s broadened bandwidth. Acta Opt. Sin. 2004, 24, 1401–1405. [Google Scholar]
  32. Erdogan, F.; Sih, G.C. On the crack extension in plates under plane loading and transverse shear. J. Basic Eng. 1963, 85, 519–525. [Google Scholar] [CrossRef]
  33. Farhad, A.; Yuan, L.B. Mechanics of bond and interface shear transfer in optical fiber sensors. J. Eng. Mech. 1998, 124, 385–394. [Google Scholar] [CrossRef]
  34. Carpinteri, A.; Xu, J.; Lacidogna, G.; Manuello, A. Reliable onset time determination and source location of acoustic emissions in concrete structures. Cem. Concr. Compos. 2012, 34, 529–537. [Google Scholar] [CrossRef]
  35. García, I.; Zubia, J.; Durana, G.; Aldabaldetreku, G.; Illarramendi, M.A.; Villatoro, J. Optical fiber sensors for aircraft structural health monitoring. Sensors 2015, 15, 15494–15519. [Google Scholar] [CrossRef] [PubMed]
  36. Rao, Y.J.; Wan, Y.P.; Zhu, T. Principle and Application of Fiber Grating; Science Press: Beijing, China, 2006. [Google Scholar]
  37. Dun, K.; Li, X.F.; Tao, M.; Wang, S.F. Experimental study on acoustic emission (AE) characteristics and crack classification during rock fracture in several basic lab tests. Int. J. Rock Mech. Min. Sci. 2020, 133, 104411. [Google Scholar] [CrossRef]
  38. Wong, L.N.Y.; Einstein, H.H. Systematic evaluation of cracking behavior in specimens containing single flaws under uniaxial compression. Int. J. Rock Mech. Min. Sci. 2009, 46, 239–249. [Google Scholar] [CrossRef]
  39. Yang, S.Q.; Jing, H.W. Strength failure and crack coalescence behavior of brittle sandstone samples containing a single fissure under uniaxial compression. Int. J. Fract. 2011, 168, 227–250. [Google Scholar] [CrossRef]
  40. Li, S.J.; Zhang, D.M.; Bai, X.; Zhang, X.M.; Chu, Y.P.; Guo, K.Y. Experimental study on mechanical properties, acoustic emission energies and failure modes of pre-cracked rock materials under uniaxial compression. Pure Appl. Geophys. 2019, 176, 4519–4532. [Google Scholar] [CrossRef]
  41. Broberg, K.B. Cracks and Fracture; Academic Press: New York, NY, USA, 1999. [Google Scholar]
  42. Zhang, K.; Zhang, K.; Bao, R.; Fan, W.C.; Xie, J.B. A novel quantitative explanation for the fracture mechanism of sandstone containing a circular inclusion. Fatigue Fract. Eng. Mater. Struct. 2023, 46, 1775–1791. [Google Scholar] [CrossRef]
  43. Song, Y.J.; Cheng, K.F.; Meng, F.D. Research on acoustic emission characteristics of fractured rock damage under freeze-thaw action. J. Min. Saf. Eng. 2023, 40, 408–419. [Google Scholar] [CrossRef]
  44. Zhang, K.; Zhang, K.; Jin, K.S.; Hu, K.F.; Xie, J.B. Influence of intermittent opening density on mechanical behavior and fracture characteristics of 3D-printed rock. Theor. Appl. Fract. Mech. 2023, 124, 103764. [Google Scholar] [CrossRef]
  45. Dong, T.; Zhu, W.B.; Gong, W.M.; Feng, G.; Wang, F.; Jiang, J.X. Quantitative calculation of rock strain concentration and corresponding damage evolution analysis. Theor. Appl. Fract. Mech. 2024, 133, 104615. [Google Scholar] [CrossRef]
  46. Wang, Q.Y.; Chen, W.; Peng, W.Q.; Wang, Y.Z.; Zhou, Y.; Peng, Z.L. Uniaxial compressive damage evolution and constitutive modeling of fissure-like rocks under different loading rates based on acoustic emission. Sci. Rep. 2025, 15, 2119. [Google Scholar] [CrossRef] [PubMed]
  47. Katchanov, L.M. Time of the rupture process under creep conditions, Izvestiia Akademii Nauk SSSR, Otdelenie Tekhnicheskikh Nauk. Mekhanika i Mashinostroenie 1958, 8, 26–31. [Google Scholar]
Figure 1. Specimen loading configuration and FBG arrangement scheme.
Applsci 15 12266 g001
Figure 2. Experimental loading process.
Applsci 15 12266 g002
Figure 3. The process of sample preparation and the flow chart for DIC calculation. (a) the treatment of sample surface for obtaining random distributed speckles; (b) ROI selection for analysis; (c) division of subset into small subsets; (d) the principles of DIC analysis.
Applsci 15 12266 g003
Figure 4. Mechanical model of the local tensile calibration of an FBG. (a) Localized tensile loading; (b) Localized shear loading.
Applsci 15 12266 g004
Figure 5. FBG calibration process.
Applsci 15 12266 g005
Figure 6. Local-strain spectral characteristics of an FBG. (a) Localized tensile loading; (b) Localized shear loading.
Applsci 15 12266 g006
Figure 7. (a) Variations in the 20 dB bandwidth expansion; (b) Variations in the local shear peak reflectivity.
Applsci 15 12266 g007
Figure 8. AE characteristics during the failure process of specimen B1. (a) AE ringing count and cumulative ringing count. (b) AE amplitude-energy-stress distribution. (c) Distribution map of RA-AF data.
Applsci 15 12266 g008
Figure 9. Spectral responses of the FBGs with different orientations for specimen B1. (a) 30°; (b) 60°; (c) 90°; (d) 90° (strain < 0.05%).
Applsci 15 12266 g009
Figure 10. FBG parameter variations for specimen B1. (a) Variations in the bandwidth expansion; (b) Variations in the peak reflectivity.
Applsci 15 12266 g010
Figure 11. FBG parameter variations for specimen B2. (a) Variations in the bandwidth expansion; (b) Variations in the peak reflectivity.
Applsci 15 12266 g011
Figure 12. FBG parameter variations for specimen B3; (a) Variations in the bandwidth expansion; (b) Variations in the peak reflectivity.
Applsci 15 12266 g012
Figure 13. Failure mode and AE characteristics of sample B1 (T = tensile crack initiation, S = shearing displacement). (a) Failure mode; (b) AE event locations.
Applsci 15 12266 g013
Figure 14. Failure modes of sample B2 and B3. (a) B2; (b) B3.
Applsci 15 12266 g014
Figure 15. Diagram of the surface-crack propagation in a pre-cracked sandstone specimen. (a) Stage I: Natural cracks and pores in the rock specimen gradually close; (b) Stage II: Tensile micro-cracks appear at the tip of the pre-existing crack in the direction of the principal stress; (c) Stage III: The tensile cracks at the tip of the main crack further expand, and the first stress decrease in the loading curve occurs; (d) Stage IV: Shear stress induces interlocking between the surface of the pre-existing crack and the wing cracks, which temporarily restores strength. Progressive interlocking failure then causes the second stress decrease to occur; (e) Stage V: Wing-crack compaction and prefabricated crack coalescence trigger rapid unstable failure.
Applsci 15 12266 g015
Figure 16. Evolution of the crack-propagation process in rock.
Applsci 15 12266 g016
Figure 17. Analysis of the FBG crack-propagation monitoring results for specimen B1.
Applsci 15 12266 g017
Figure 18. Strain-field distributions in various directions. (a) x direction; (b) y direction; (c) xy direction.
Applsci 15 12266 g018
Figure 19. Displacement curves for characteristic points on both sides of fractures.
Applsci 15 12266 g019
Figure 20. Principal-strain evolution at the FBG monitoring points.
Applsci 15 12266 g020
Figure 21. Damage evolution curve for sample B1.
Applsci 15 12266 g021
Figure 22. Damage Variable Evolution: Alternative Methods. (a) DIC [44]; (b) AE energy [45]; (c) AE counts [46].
Applsci 15 12266 g022
Figure 23. The mechanical characteristics and global strain field for specimen B1.
Applsci 15 12266 g023
Disclaimer/Publisher’s Note: The statements, opinions and data contained in all publications are solely those of the individual author(s) and contributor(s) and not of MDPI and/or the editor(s). MDPI and/or the editor(s) disclaim responsibility for any injury to people or property resulting from any ideas, methods, instructions or products referred to in the content.