1. Introduction
The development of smart building technologies has led to substantial advances in energy efficiency, operational resilience, and occupant comfort. Large-scale implementations have reported maintenance workload reductions of up to 40% and energy savings exceeding 30% through continuous monitoring and data-driven control [
1,
2,
3]. Digital twin–based management systems further extend these capabilities by providing real-time virtual representations that enhance asset tracking and decarbonization planning [
4].
Building Energy Management Systems (BEMS) incorporating artificial intelligence and cloud analytics have enabled predictive maintenance and optimized operational scheduling in newly constructed or deeply retrofitted buildings [
5,
6]. However, these solutions generally presuppose homogeneous infrastructures and seldom address interoperability with legacy or hybrid communication protocols typical of existing public buildings. Moreover, current role-based dashboards mainly target technical staff, offering limited engagement tools for diverse occupant groups such as teachers, students, and administrators [
7,
8,
9].
In particular, rehabilitated public buildings greatly benefit from smart BEMS. Implementing BEMS in older buildings helps bridge the gap between legacy infrastructure and modern performance standards, ensuring that infrastructure upgrades translate into real energy savings and improved indoor conditions. In fact, policies like the EU’s Energy Performance of Buildings Directive [
10] now mandate that renovated public buildings meet near Zero-Energy standards, a goal achievable only with advanced energy management and control. By digitizing and automating energy control in retrofitted schools, offices, and other public buildings, BEMS can optimize energy use based on occupancy and demand, directly supporting deep energy savings and sustainability targets [
11].
Another crucial aspect of modern BEMS is the use of Non-Intrusive Load Monitoring (NILM) for detailed energy monitoring and management. NILM disaggregates the total building power consumption measured at a single point (e.g., the main smart meter) into individual appliance loads, identifying each device’s energy signature without the need for separate sub-meters. This technique provides granular insights into the consumption patterns of various appliances, enabling targeted energy-saving measures and better demand management. Recent developments in NILM have introduced novel approaches that greatly improve its effectiveness. For example, a data-driven NILM method based on phase diagram analysis can offer very high appliance identification accuracy while remaining low-cost and simple [
12]. One such phase-diagram-based system recognized up to 29 different home appliances with an average accuracy of approximately 97.9% on a test dataset. Similarly, NILM techniques that leverage soft computing (e.g., fuzzy clustering and machine learning) have shown promising results in complex scenarios. By utilizing fuzzy logic and intelligent clustering, these methods can reliably isolate each device’s usage from an aggregated household load signal, thereby effectively identifying the behavior of individual appliances in real-time [
13]. Integrating these advanced NILM techniques into BEMS enhances the monitoring and management capabilities of smart buildings. In the context of rehabilitated public buildings, NILM-enabled BEMS can continuously track the performance of both new, efficient equipment and legacy systems, ensuring that energy retrofit measures are performing as expected and immediately detecting any anomalies or inefficiencies.
The concept of building digital twins (DTs) has gained significant attention as a means of integrating live data, simulation, and predictive modeling for real-time building management. DTs rely on accurate, structured, and continuously updated environmental and energy data, which aligns with the core design of the proposed framework. Through its multiscale sensing infrastructure, role-based visualization, and edge-to-cloud data synchronization, the system presented here provides a foundational layer for DT implementations, particularly in retrofitted educational buildings. Recent studies have underscored the importance of hybrid data strategies, including both physics-based and data-driven approaches, in enabling responsive and resilient DTs [
14,
15]. While full DT integration is beyond the scope of this work, the monitoring architecture developed herein can be extended toward that goal with minimal adaptation.
Recent studies emphasize the importance of integrating climatic and geographical variables into building management frameworks. Climate-responsive or geography-aware systems can improve resilience and sustainability under variable environmental conditions [
16,
17,
18,
19]. Yet, scalable and retrofit-compatible platforms for public infrastructure, characterized by aging equipment, budget limitations, and heterogeneous occupancy, remain largely unexplored. Real-time multiscale monitoring calibrated to the distinct spatial and temporal demands of schools and municipal facilities is particularly lacking [
20,
21,
22].
In terms of communication, the integration of multiple network protocols, including Wi-Fi, Zigbee, and Power-line Communication (PLC), is gaining attention, offering opportunities for resilience and incremental upgrades [
23,
24,
25]. Nonetheless, empirical validation of hybrid, fault-tolerant architectures within constrained retrofits is scarce, and cost remains a significant barrier to adoption in public schools and community buildings. Proprietary BMS frameworks, such as BACnet-based systems, remain costly and inflexible compared to modular, open-source solutions [
26].
Parallel research on behavioral engagement has demonstrated that real-time environmental feedback can promote more sustainable occupant behavior, particularly in educational environments [
27,
28]. However, scalable frameworks capable of integrating such behavioral mechanisms across multiple user roles, students, teachers, technicians, and managers, are limited. This restricts broader social and operational impacts.
Table 1 compares recent frameworks that address diverse facets of smart-building monitoring, encompassing multiscale integration, interoperability, and user engagement. Al-Janabi et al. [
21] introduced an adaptive multi-scale sensitivity model linking physical simulation with optimization algorithms for energy management. Their framework successfully demonstrated dynamic load forecasting and PV–storage coupling, yet relied primarily on simulated data and lacked field validation or redundancy mechanisms for continuous data acquisition. Biswas et al. [
22] developed a real-time smart-grid-integrated BEMS capable of optimizing consumption based on grid conditions, achieving notable energy-saving potential. Nevertheless, the system was evaluated at a single commercial site and did not address interoperability or retrofit compatibility, thereby limiting its generalizability to public infrastructures.
Soleimanijavid et al. [
8] focused on occupant-centric control using adaptive comfort feedback, revealing measurable comfort gains and improvements in HVAC efficiency through user interaction loops. While their work highlights the importance of behavioral engagement, it did not extend beyond controlled environments or address climatic diversity and scalability across multiple user groups. Similarly, Vales et al. [
9] proposed an IoT-based architecture combining Wi-Fi, BLE (Bluetooth Low Energy), and Zigbee to enhance device interoperability and energy management. Their prototype effectively demonstrated multi-protocol connectivity and real-time data fusion but lacked specific adaptation for retrofit contexts and did not incorporate climate or occupant modeling modules.
Climate-oriented frameworks by [
16,
17] advanced resilience analysis by integrating environmental risk and AI-based (Artificial Intelligence) adaptation modeling. Sommese et al. validated the role of nature-based strategies in mitigating heat island effects, whereas Ayadi et al. [
17] employed machine learning to predict building performance under climate change scenarios. Despite these achievements, both studies emphasized theoretical modeling over empirical deployment and omitted considerations related to indoor environmental quality or educational buildings.
Occupancy and typological studies provide complementary insights. Wang [
18] conducted a longitudinal analysis of occupancy patterns in educational facilities, revealing strong temporal correlations between occupancy density and peaks in energy consumption. Martínez-Reyes et al. [
19] proposed an energy-region typology framework that classifies building stocks based on climatic and socio-economic characteristics, offering valuable macro-level guidance but limited operational details. Banfi [
20] examined real-time occupancy monitoring and pattern analysis using low-cost sensing networks, advancing interpretability yet lacking integration with automated control or energy feedback mechanisms.
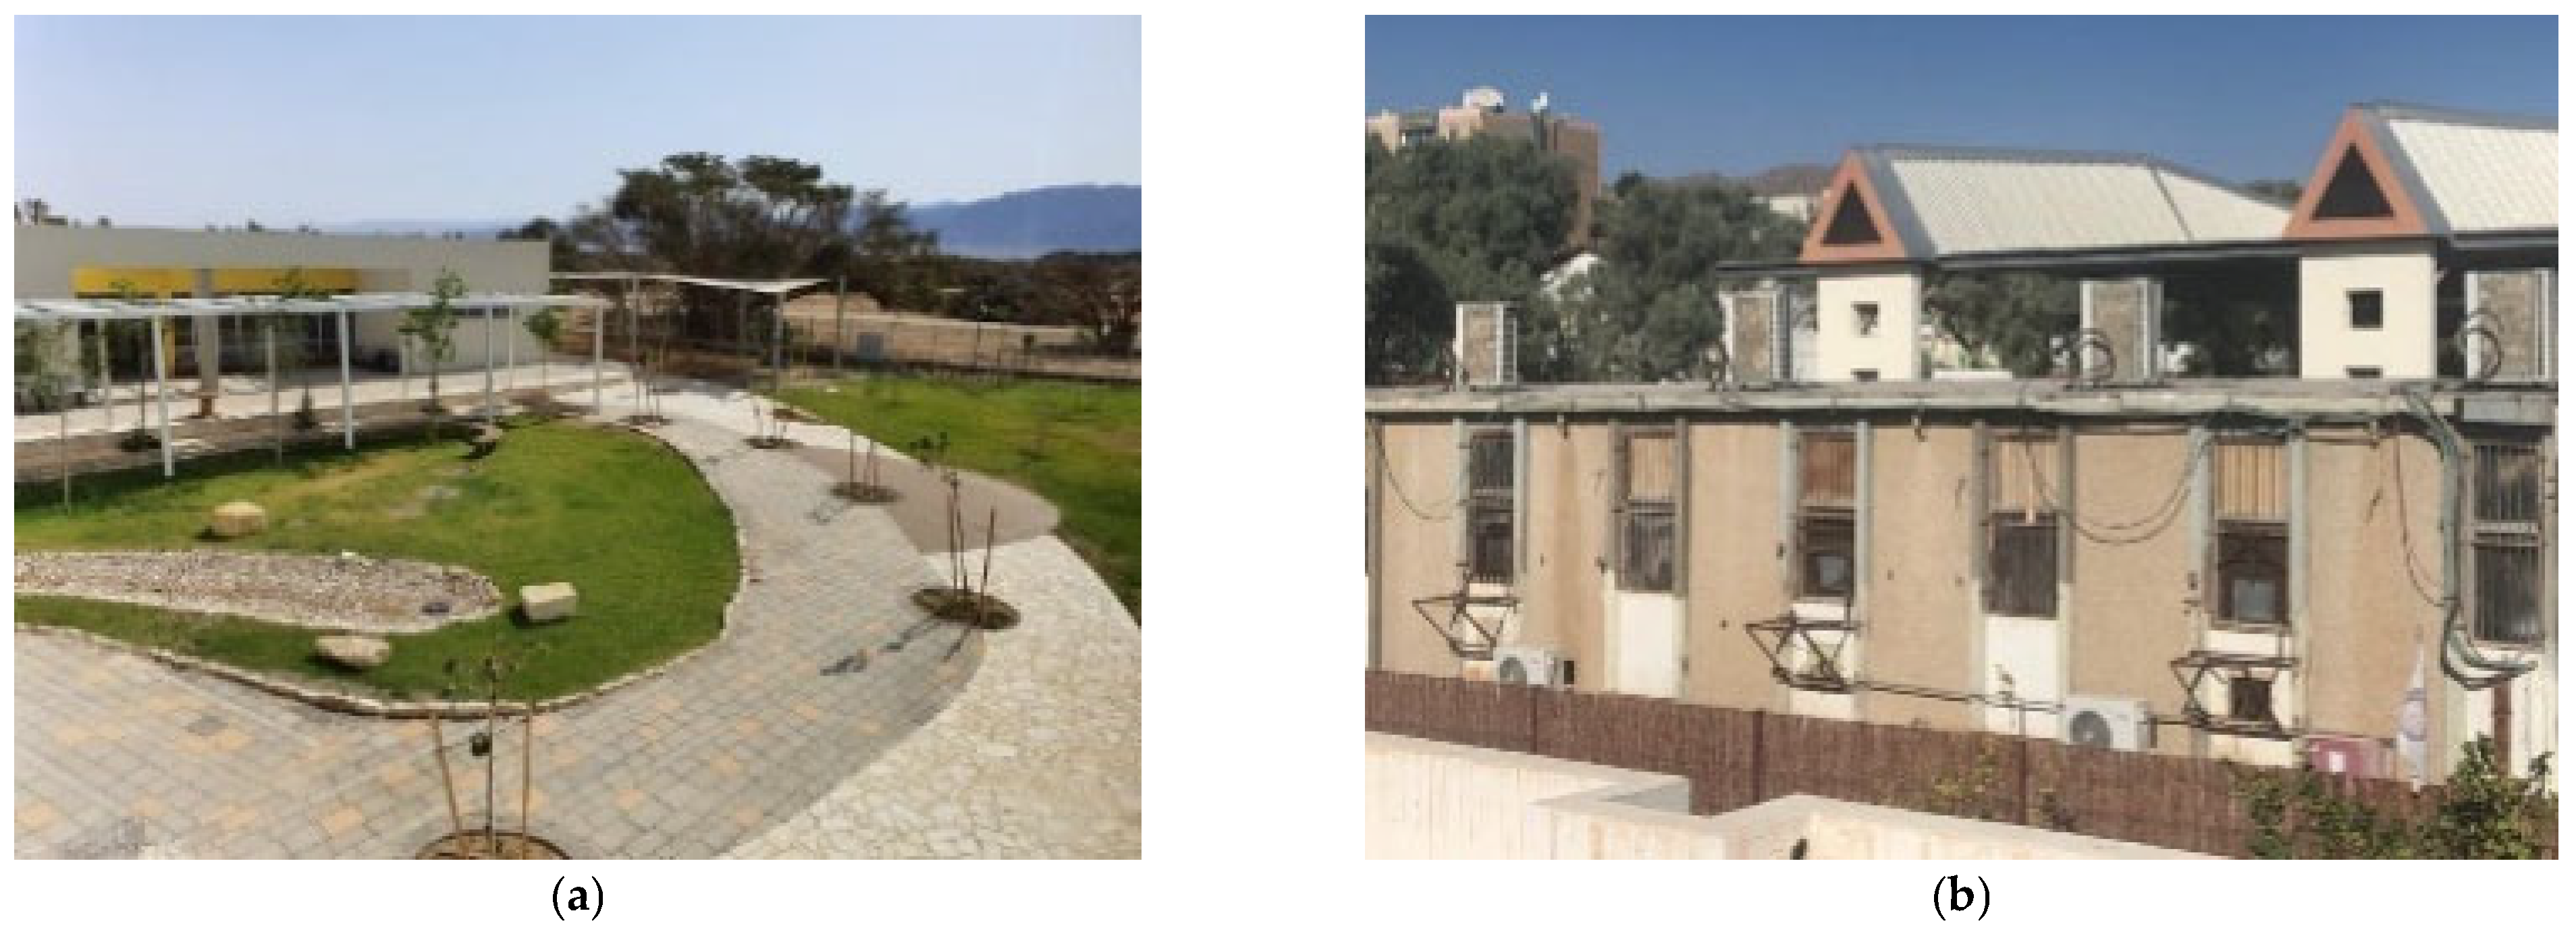
To address these gaps, the present study proposes a modular, multiscale, and role-adaptive monitoring framework for retrofitted public schools. The platform integrates heterogeneous sensors, hybrid communication protocols, and user-specific dashboards within a fault-tolerant architecture. It is empirically validated through a twelve-month deployment across two Israeli schools in distinct climatic zones, demonstrating measurable improvements in energy efficiency, indoor air quality, and stakeholder engagement.
In summary, recent research has made significant progress in smart building monitoring, digital twin integration, and occupant-centric control. However, existing frameworks generally focus on newly constructed or homogeneous infrastructures and seldom consider retrofit scenarios characterized by hybrid communication systems and diverse user roles. The present study addresses this research void by developing and empirically validating a modular, multiscale, and role-adaptive monitoring framework specifically designed for retrofitted public buildings. Unlike previous approaches that remain theoretical or limited to single domains, this work combines hybrid communication protocols, sensor redundancy, and role-specific dashboards within a cost-effective and scalable architecture, thereby bridging the gap between conventional commercial Building Management System (BMS) solutions and the operational realities of public educational facilities.
The remainder of this paper is structured as follows.
Section 2 presents the methodology of the multiscale monitoring platform, including system architecture, parametric math model, sensor integration, communication strategy, etc. Next,
Section 3 presents the test case implementation in two pilot buildings, followed by
Section 4, which reports the results of the twelve-month deployment, including performance, energy savings, and air quality trends; and by
Section 5 discussing the implications, challenges, and replicability of the approach. Finally,
Section 6 concludes the study and outlines future research directions.
2. Methodology
2.1. Multiscale System Architecture
The monitoring platform is built around a multiscale architecture that allows for observation and control across three hierarchical levels: macro-, meso-, and microscales.
At the macroscale, the system collects building-level data, including total electricity production from photovoltaic (PV) arrays, battery storage state, and outdoor weather variables such as ambient temperature, solar irradiance, and wind speed, using a rooftop weather station and main-line metering.
The mesoscale layer focuses on specific zones, as classrooms, corridors, and additional shared spaces, and monitors indoor air quality through CO
2, PM2.5, and VOC, thermal comfort through temperature and relative humidity, and localized energy consumption from HVAC and lighting circuits, as per criteria defined in ASHRAE Standard 55 for acceptable indoor environments [
29].
At the microscale, plug-level meters and clamp-on current sensors measure the electrical performance of individual circuits, while offline 1-wire probes provide surface temperature readings at critical points. This hierarchy offers both coarse- and fine-grained data, enabling cross-scale correlation analyses and targeted interventions, while allowing dashboards to present information appropriate to each user role.
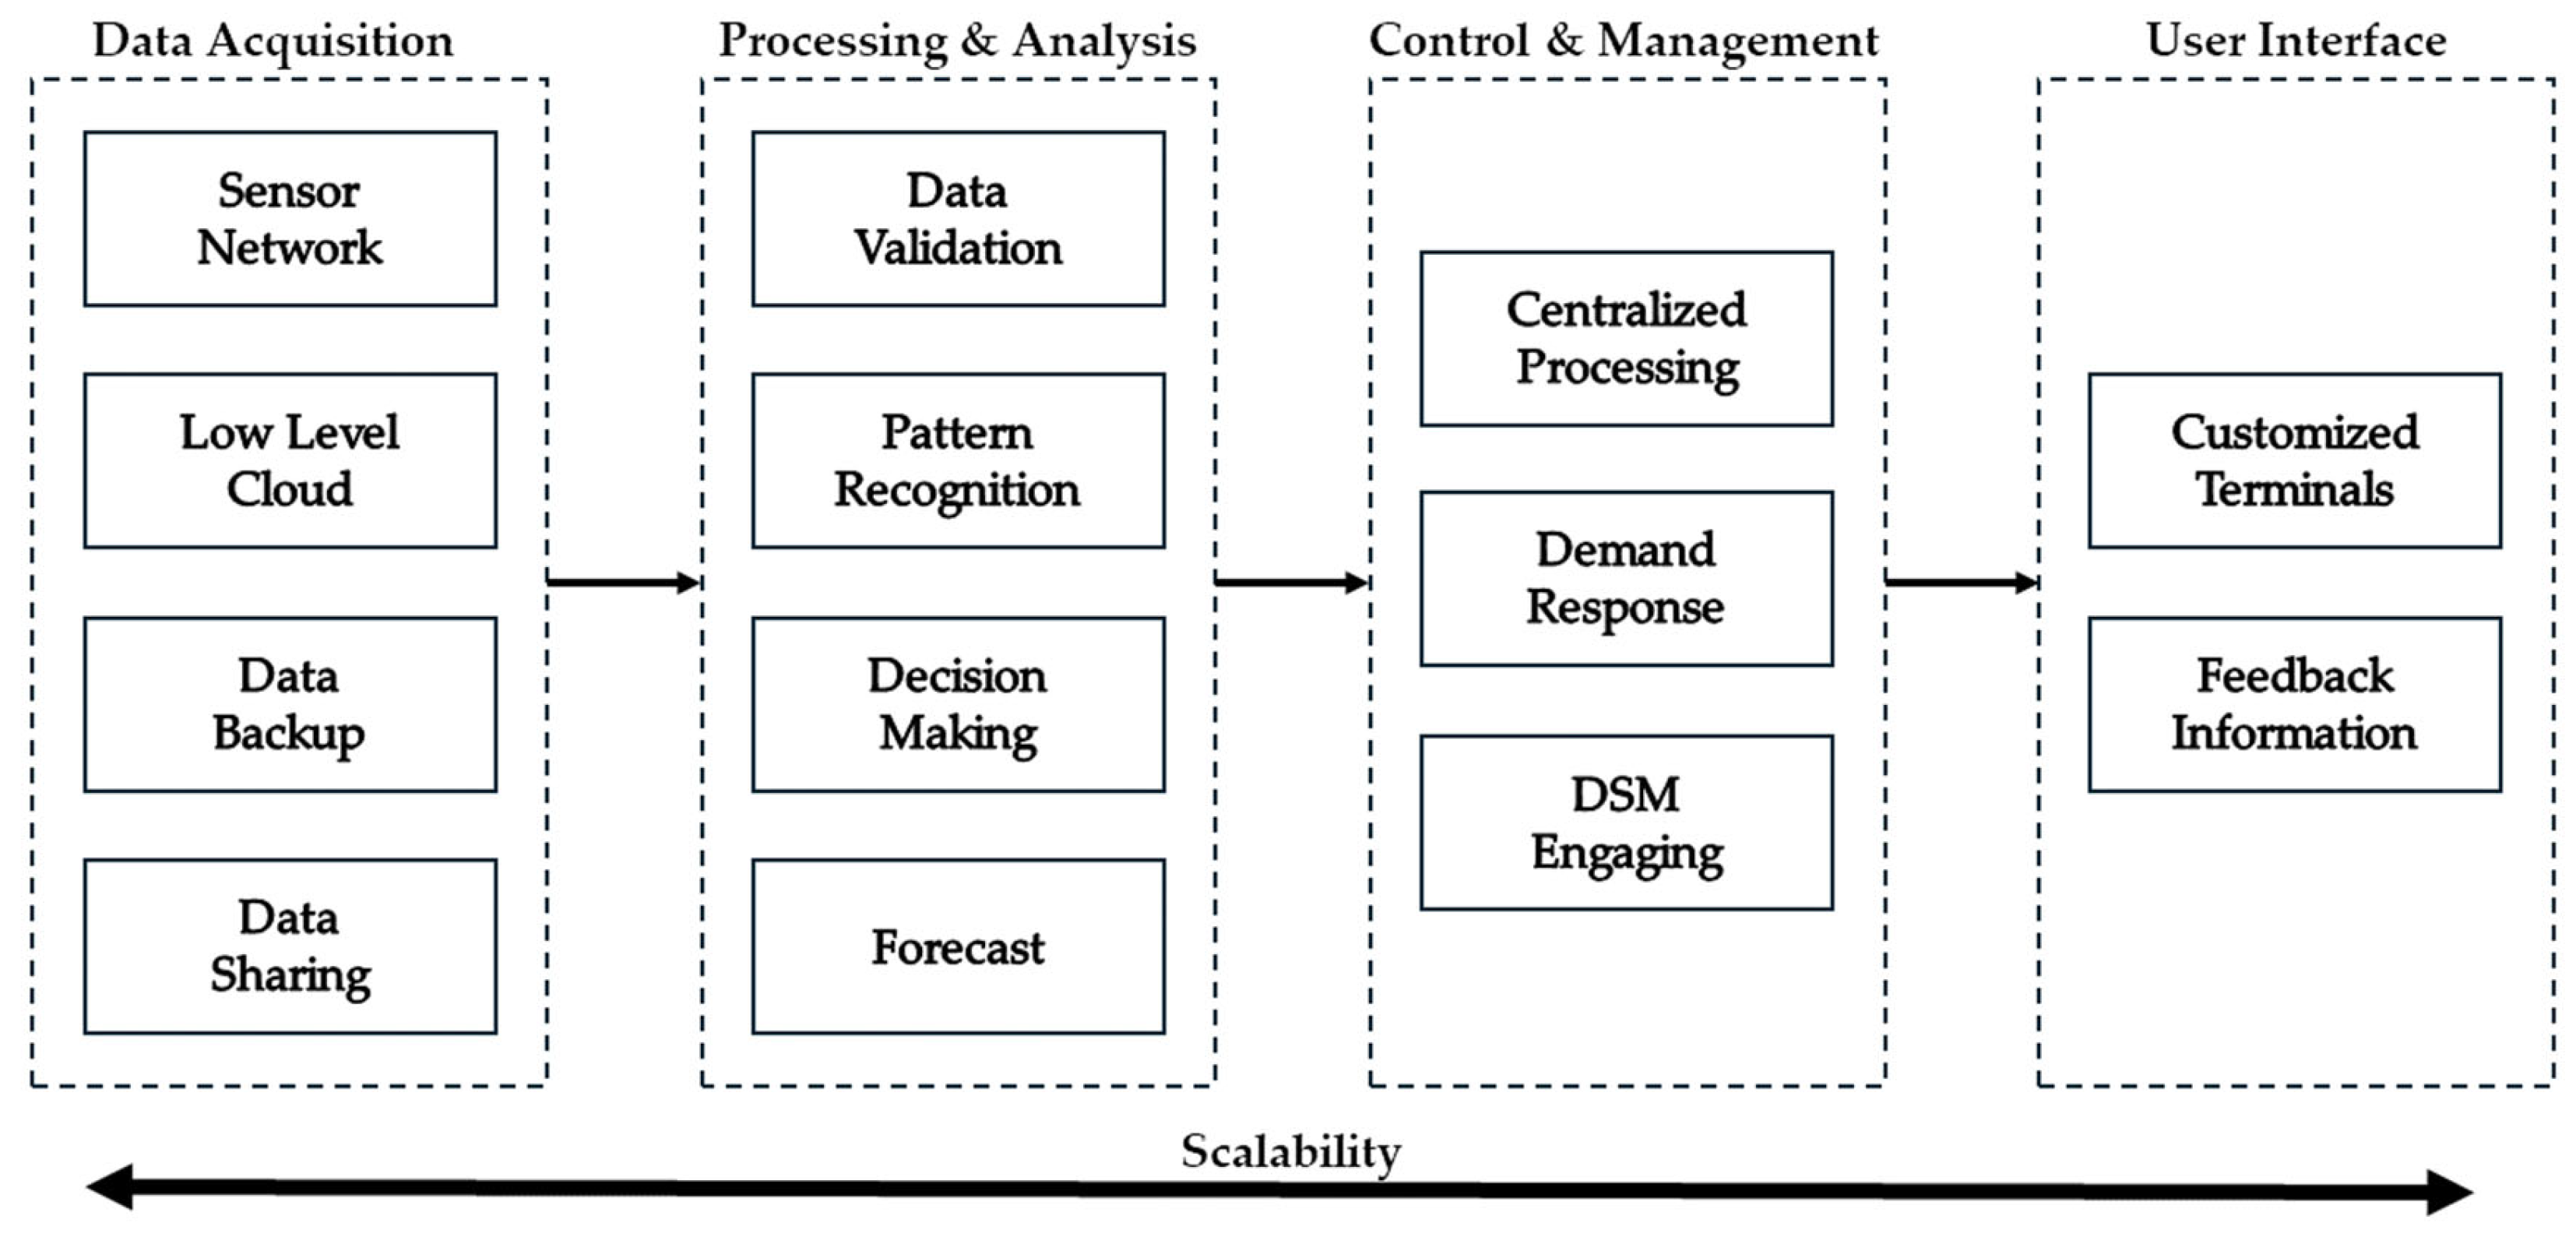
Figure 1 provides a high-level overview of the monitoring platform’s hierarchical architecture, linking physical sensing, data processing, and user interaction. At the base, a sensor network collects environmental and electrical parameters within classrooms and ancillary spaces.
The data flow progresses upward through a low-level cloud and centralized processing layer, where information is validated, stored, and analyzed using pattern recognition and forecasting algorithms. Subsequent layers support decision-making, control, and DSM engagement, translating processed data into actionable feedback for building users. At the top, customized terminals and dashboards present information tailored to various roles (students, teachers, technicians, and administrators), while ensuring scalability and data-sharing capability. This diagram summarizes the operational logic of the proposed system and establishes the framework for the detailed methodological subsections that follow. The specific details of each layer are specified in the subsequent sections.
The multiscale architecture, structured across building (macroscale), room (mesoscale), and device (microscale) levels, is designed to enable synchronized data acquisition and cross-scale analysis. All measurements are time-aligned and recorded at comparable resolutions, allowing for meaningful correlations between environmental conditions, occupancy patterns, and energy use. For example, a rise in CO
2 concentration at the room level is contextualized in relation to HVAC operation at the building level and individual appliance activity at the microscale. This structure facilitates fault detection, occupancy inference, and behavioral diagnostics across domains. By aggregating and comparing data across spatial scales, the platform supports potential for targeted control and feedback strategies, such as selective ventilation, lighting adaptation, or load shifting, thereby improving both operational efficiency and user comfort. Such cross-scale coherence is particularly advantageous in retrofitted facilities, where system boundaries and control pathways are often fragmented and complex. Similarly, the self-consumption ratio (SCR) of on-site PV energy is disaggregated and interpreted at multiple scales, e.g., tracking how localized shifts in classroom consumption influence aggregate PV utilization, or how device-level activity contributes to daily SCR performance. To support multiscale data transparency, various node information is transferred bidirectionally from one scale to another, as presented later in
Section 2.6.
2.2. Parametric Mathematical Model
To support automated quality control and fault detection in the deployed monitoring platform, we implemented a lightweight statistical model designed to assess sensor accuracy, detect outliers, and verify consistency across redundant sensors. This framework enables data integrity without requiring centralized supervision or model-based forecasting. The approach is structured as follows.
Let
denote the acquisition from the sensor
in location
at time
. Each data sample is modeled as:
where
is an environmental or electrical state and
represents a zero-mean Gaussian measurement noise. This formulation is standard in environmental sensing literature and provides a baseline for downstream reliability and drift checks [
30].
Sensors’ readings are monitored in real time using a rolling window approach. For each window
, the
-score is computed as:
where
and
are the mean and standard deviation of recent measurements in the window
for sensor
in location
. A reading is flagged as an outlier if
, with
being commonly used threshold in time-series monitoring applications [
31]. To improve robustness to skewed or non-Gaussian distributions, the system is capable of alternatively applying the Median Absolute Deviation method, as
And classify an outlier if:
With a typical threshold
[
32].
In locations equipped with redundant sensors, agreement is monitored through pairwise distance
If
, an inconsistency is flagged. A reasonable bound
is defined based on the assumption that both adjacent sensors are independently calibrated, and exhibit known noise levels [
33]. Persistent deviations are used to detect drift or calibration loss.
To quantify each sensor’s operational consistency, a reliability score over an interval
is defined as:
where
is the number of flagged outliers and
is the total number of samples in the window
. Sensors with
below 0.9 are flagged for recalibration or exclusion from data aggregation. Similar uptime quality metrics are applied in sensor health monitoring literature [
34].
2.3. Sensor Integration and Data Acquisition
To support heterogeneity in retrofitted public buildings, the system introduces a modular, protocol-agnostic approach to sensor integration. Temperature, humidity, CO
2, PM2.5, VOC, solar irradiance, power, and surface temperature sensors are distributed across the three scales. These devices are connected through gateways that validate, timestamp, and forward data to both local and cloud databases, utilizing a hybrid communication infrastructure that accommodates wireless Wi-Fi, Bluetooth, and Zigbee, as well as legacy wired protocols (power line, 1-Wire). To maintain data integrity, the system synchronizes all sensors with NTP (Network Time Protocol) servers, applies inter-sensor calibration, and performs automated ongoing anomaly detection on incoming packets. Offline one-wire devices upload buffered data via converters when network connectivity is available. The generic interface enables the addition of new sensor types with minimal software changes. A summary of sensor types and communication protocols is given in
Table 2.
Such architecture ensures that the system remains scalable, replicable, and aligned with the functional realities of public-sector infrastructure.
The comparison reflects typical baseline configurations. While many features are technically supported by commercial systems [
38], they often require additional licensing, integration services, complicated customization, or proprietary hardware. The proposed platform prioritizes modularity, low-cost deployment, and retrofitting suitability in public-sector settings.
2.4. Communication and Connectivity Strategy
Continuous data flow in retrofitted schools requires a hybrid communication backbone. Wi-Fi is used where reliable coverage exists, enabling high-throughput transmission from smart plugs, IAQ sensors, and classroom controllers. In zones with poor wireless coverage or electromagnetic interference, Zigbee mesh networking offers multi-hop, low-power data transport. Power-line communication leverages existing wiring in basements or thick-walled areas where wireless solutions are impractical. Ultra-low-cost 1-wire probes operate in offline mode, with data collected via microcontroller bridges. At the gateway layer, all protocols are unified, as incoming streams are time-synchronized and buffered for failover operation, with dual-mode devices switching automatically between Zigbee and Wi-Fi. This multi-protocol strategy maximizes spatial coverage and reliability while allowing incremental retrofits in diverse building envelopes.
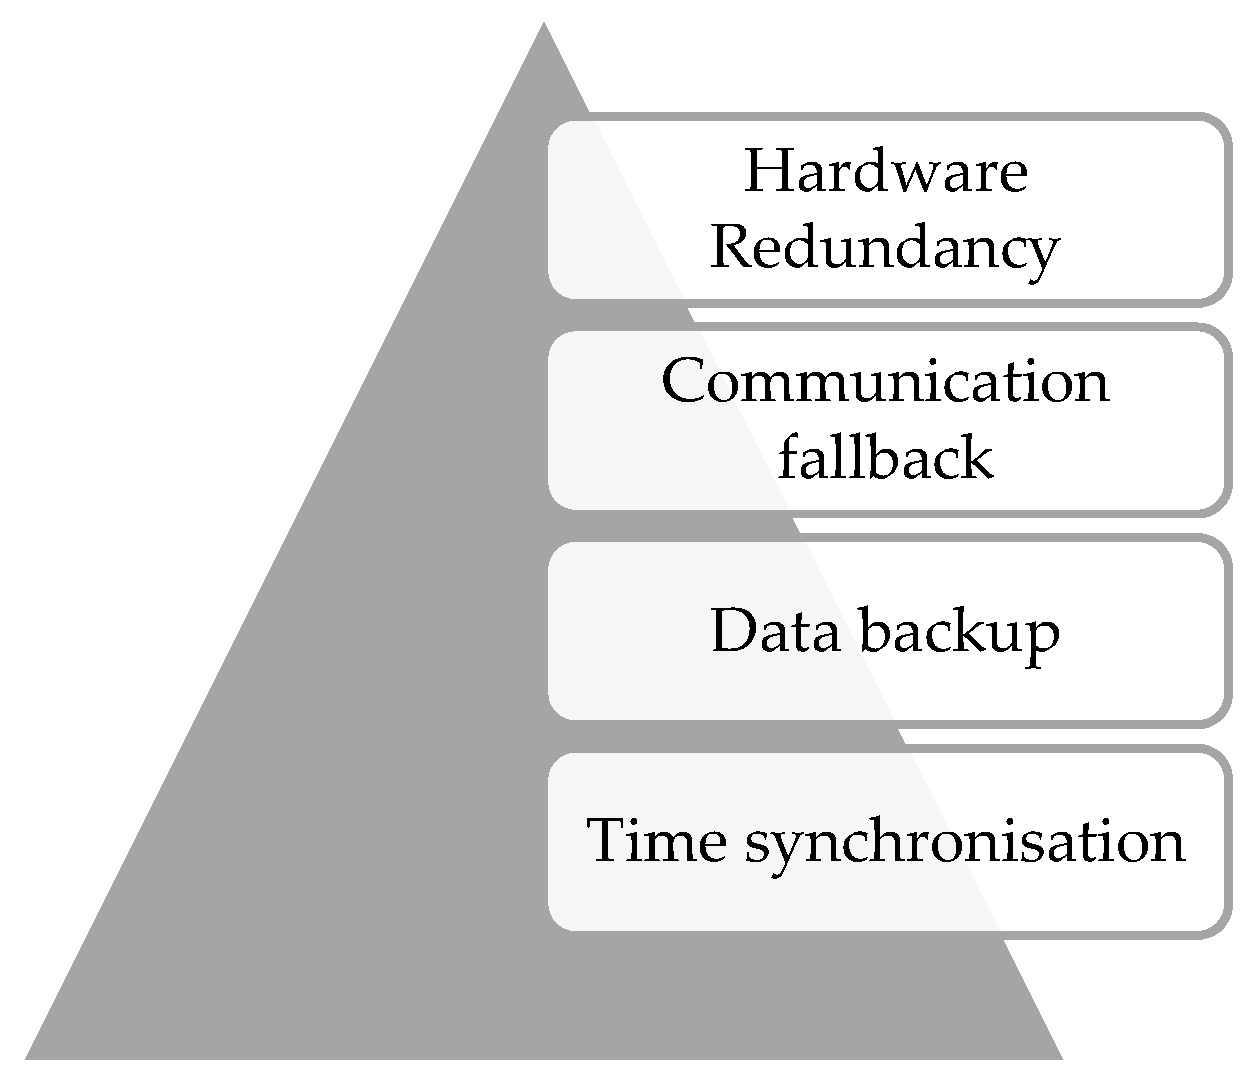
Figure 2 summarizes the key design features that guided the development of the proposed monitoring platform. It highlights the modular hardware structure, hybrid communication architecture, and fault-tolerant data-management strategy implemented through four reliability tiers. The figure also highlights the integration of role-adaptive dashboards, which transform raw sensor data into actionable feedback tailored to different user groups. Together, these principles provide the conceptual framework that links the detailed methodological steps described in the following subsections.
2.5. Redundancy, Calibration, and Data Integrity
Reliability is achieved through redundancy at both the hardware and network levels, as defined in
Figure 3. Critical zones are equipped with duplicate IAQ sensors, so that if one unit fails, the second maintains coverage and facilitates cross-validation. Devices capable of dual communication automatically switch between Zigbee and Wi-Fi when interference or dropout occurs. Data are backed up daily to secure cloud storage and weekly to off-site archives. Sensors and gateways synchronize with manufacturer-provided time servers to maintain consistent timestamps. Prior to deployment, all sensors are compared with reference-grade instruments to establish baseline accuracy, and redundant IAQ nodes are calibrated against each other to harmonize readings. For sensors prone to drift, such as low-cost-CO
2/VOC units, scheduled recalibration and trend checks against historical baselines are recommended. A multi-stage quality assurance pipeline flags out-of-range or outlier data and logs calibration metadata (date, model, and accuracy class) to ensure traceability.
The monitoring infrastructure is organized across three spatial scales: macroscale (building level), mesoscale (room level), and microscale (individual loads), with varying availability, resolution, and uncertainty for each sensor type, as summarized in
Table 3.
As an extension of the calibration protocol, CO
2 (Carbon dioxide) and PM2.5 (Particulate matter 2.5 µm) sensors are validated, as part of the type test procedure, against reference-grade portable instruments before deployment. Specifically, CO
2 sensors were cross-checked with a high precision reference devices, such as Testo 535 handheld CO
2 tester by Testo SE & Co. KGaA, Baden-Württemberg, Germany [
39], and a PM2.5 TSI DustTrak II photometer by TSI GmbH, Aachen, Germany [
40]. Post-deployment drift is monitored through co-located redundancy, ensuring that deviations exceeding ±10% from peer sensor averages over a 7-day rolling window trigger recalibration or exclusion from the aggregation process. These acceptance thresholds ensure measurement consistency while accounting for sensor type and application environment.
2.6. Dashboard Customization and User Roles
The platform generates role-specific dashboards from a common data layer, using templates and access controls to present information that matches each stakeholder’s needs (see some examples at
Figure 4). For school children, the interface displays intuitive icons and color-coded indicators of CO
2 concentration, temperature, and energy use, encouraging awareness and behavioral change. Technicians and teaching staff have access to more detailed tables, graphs, and alerts on sensor health, IAQ trends, and energy consumption, facilitating effective maintenance planning. Administrators receive monthly reports, anomaly summaries, and comparative metrics to support facility-level decisions. At the same time, policymakers view high-level key performance indicators, geospatial deployment maps, and benchmarking charts for regional planning. The same data layer supports localization, enabling dashboards to be translated, such as an underage-oriented interface in Hebrew. A summary of dashboard features per user group is given in
Table 4.
Each dashboard instance is generated dynamically from the same data layer using predefined templates and access controls.
2.7. Core System Algorithms
This subsection outlines the algorithmic workflow used to acquire, validate, synchronize, store, and present monitoring data under the four reliability tiers (redundancy, communication fallback, data integrity, and calibration). Pseudocode is technology-agnostic and abstracts protocol drivers (Wi-Fi, Zigbee, Powerline, 1-Wire, HTTP/REST, MQTT), as MQTT stands for Message Queuing Telemetry Transport, and HTTP/REST for Hypertext Transfer Protocol/Representational State Transfer. To maintain readability, only critical algorithms that emphasize the contribution of this research are showcased.
2.7.1. Acquisition Loop with Communication Fallback (Tier 2)
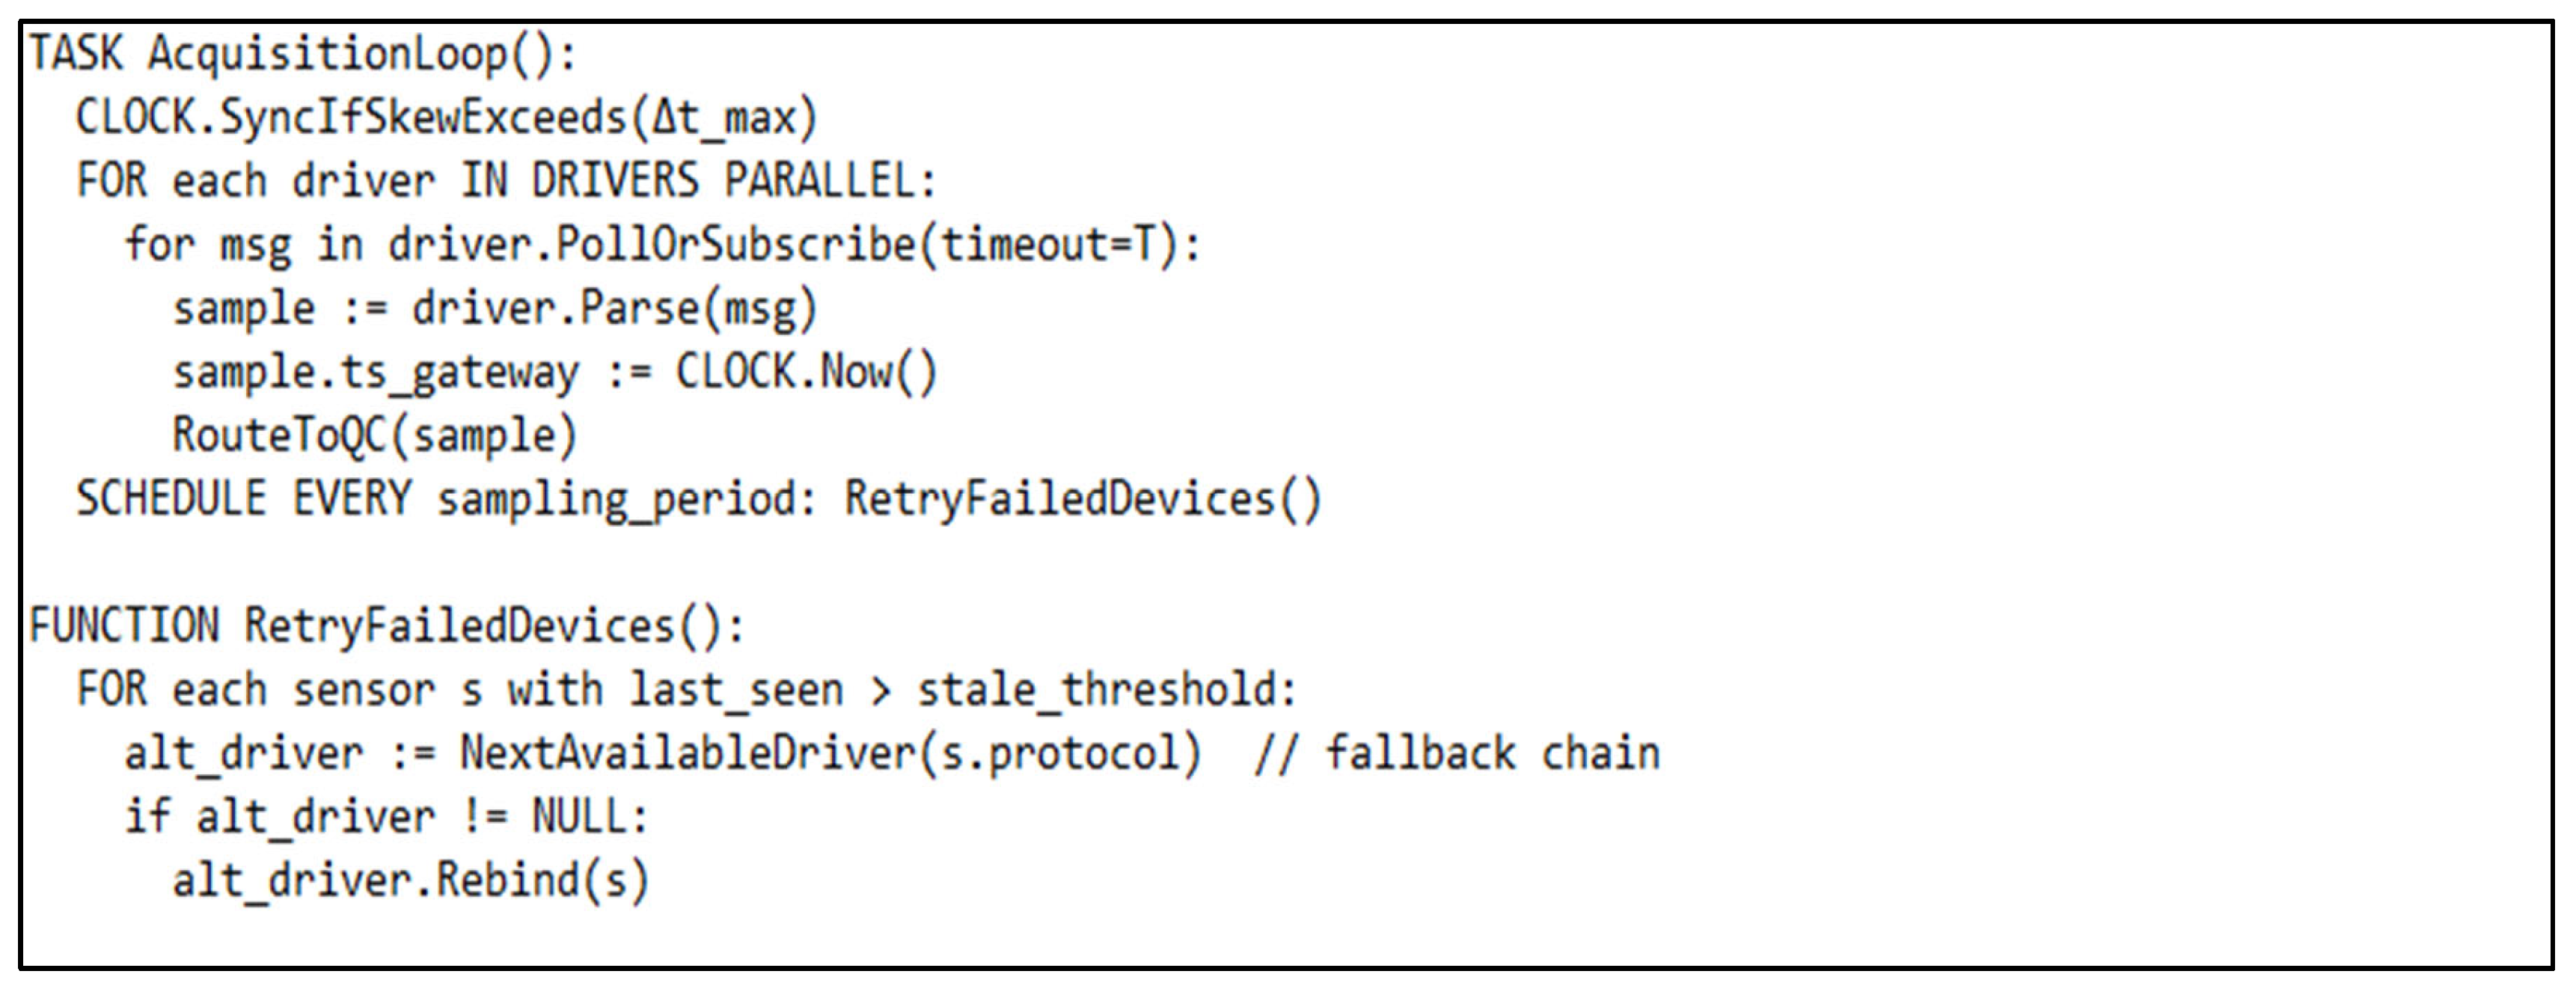
This routine governs real-time data acquisition across heterogeneous protocols. It periodically polls or subscribes to each network driver, parses messages, timestamps them, and invokes quality control.
If communication fails, an alternative protocol is automatically engaged to maintain continuous data flow, as described in
Figure 5.
2.7.2. Store-And-Forward, Safe Ingest, and Backups (Tier 3)
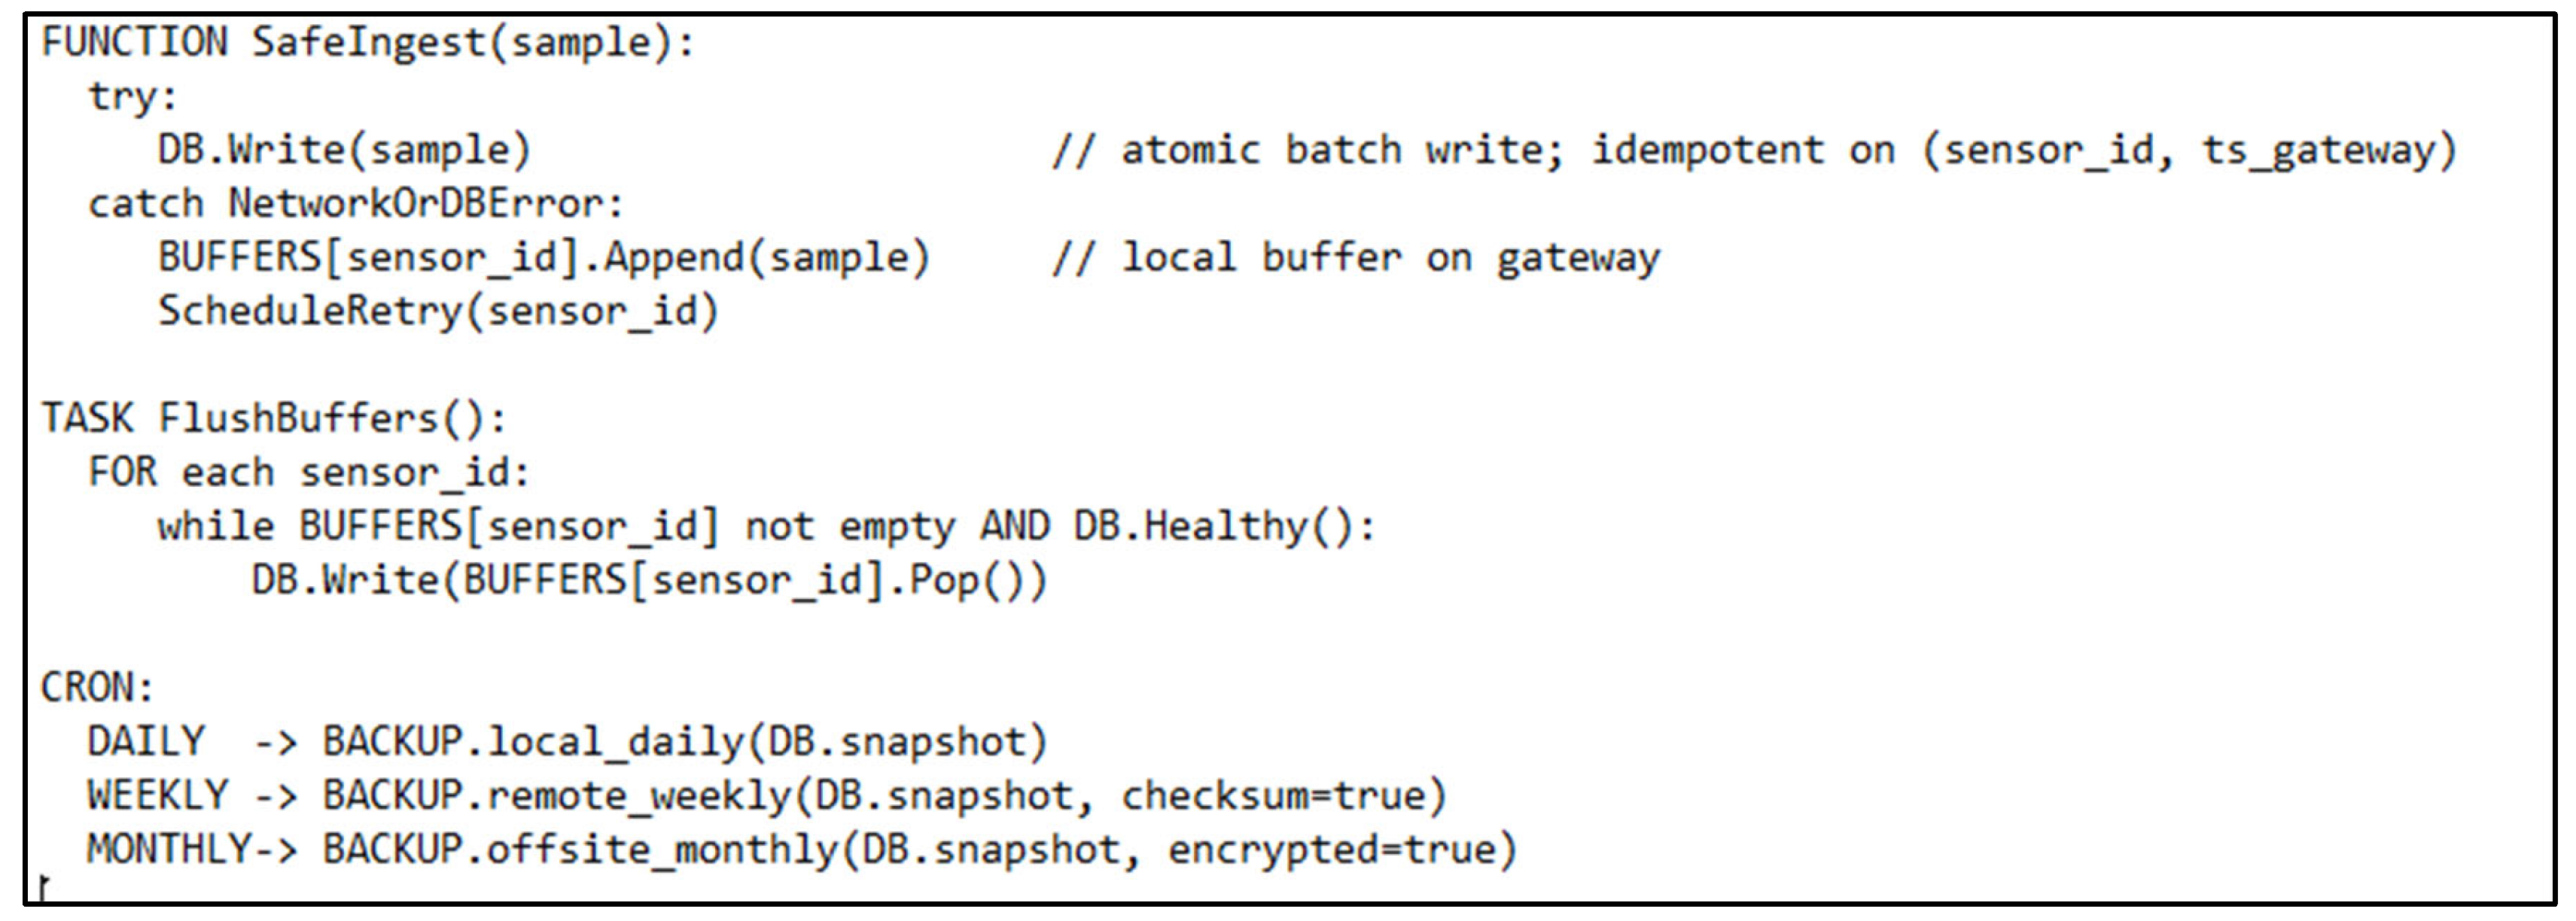
This block describes the data-integrity mechanisms that protect against network or database interruptions.
It implements buffering of unsent samples, automatic retries, and a three-level backup schedule (local, remote, and off-site), thereby guaranteeing data persistence and traceability, as depicted in
Figure 6.
2.7.3. Quality Control, Calibration, and Outlier Handling (Tier 4)
Here, the system applies validation rules and calibration coefficients to every incoming sample.
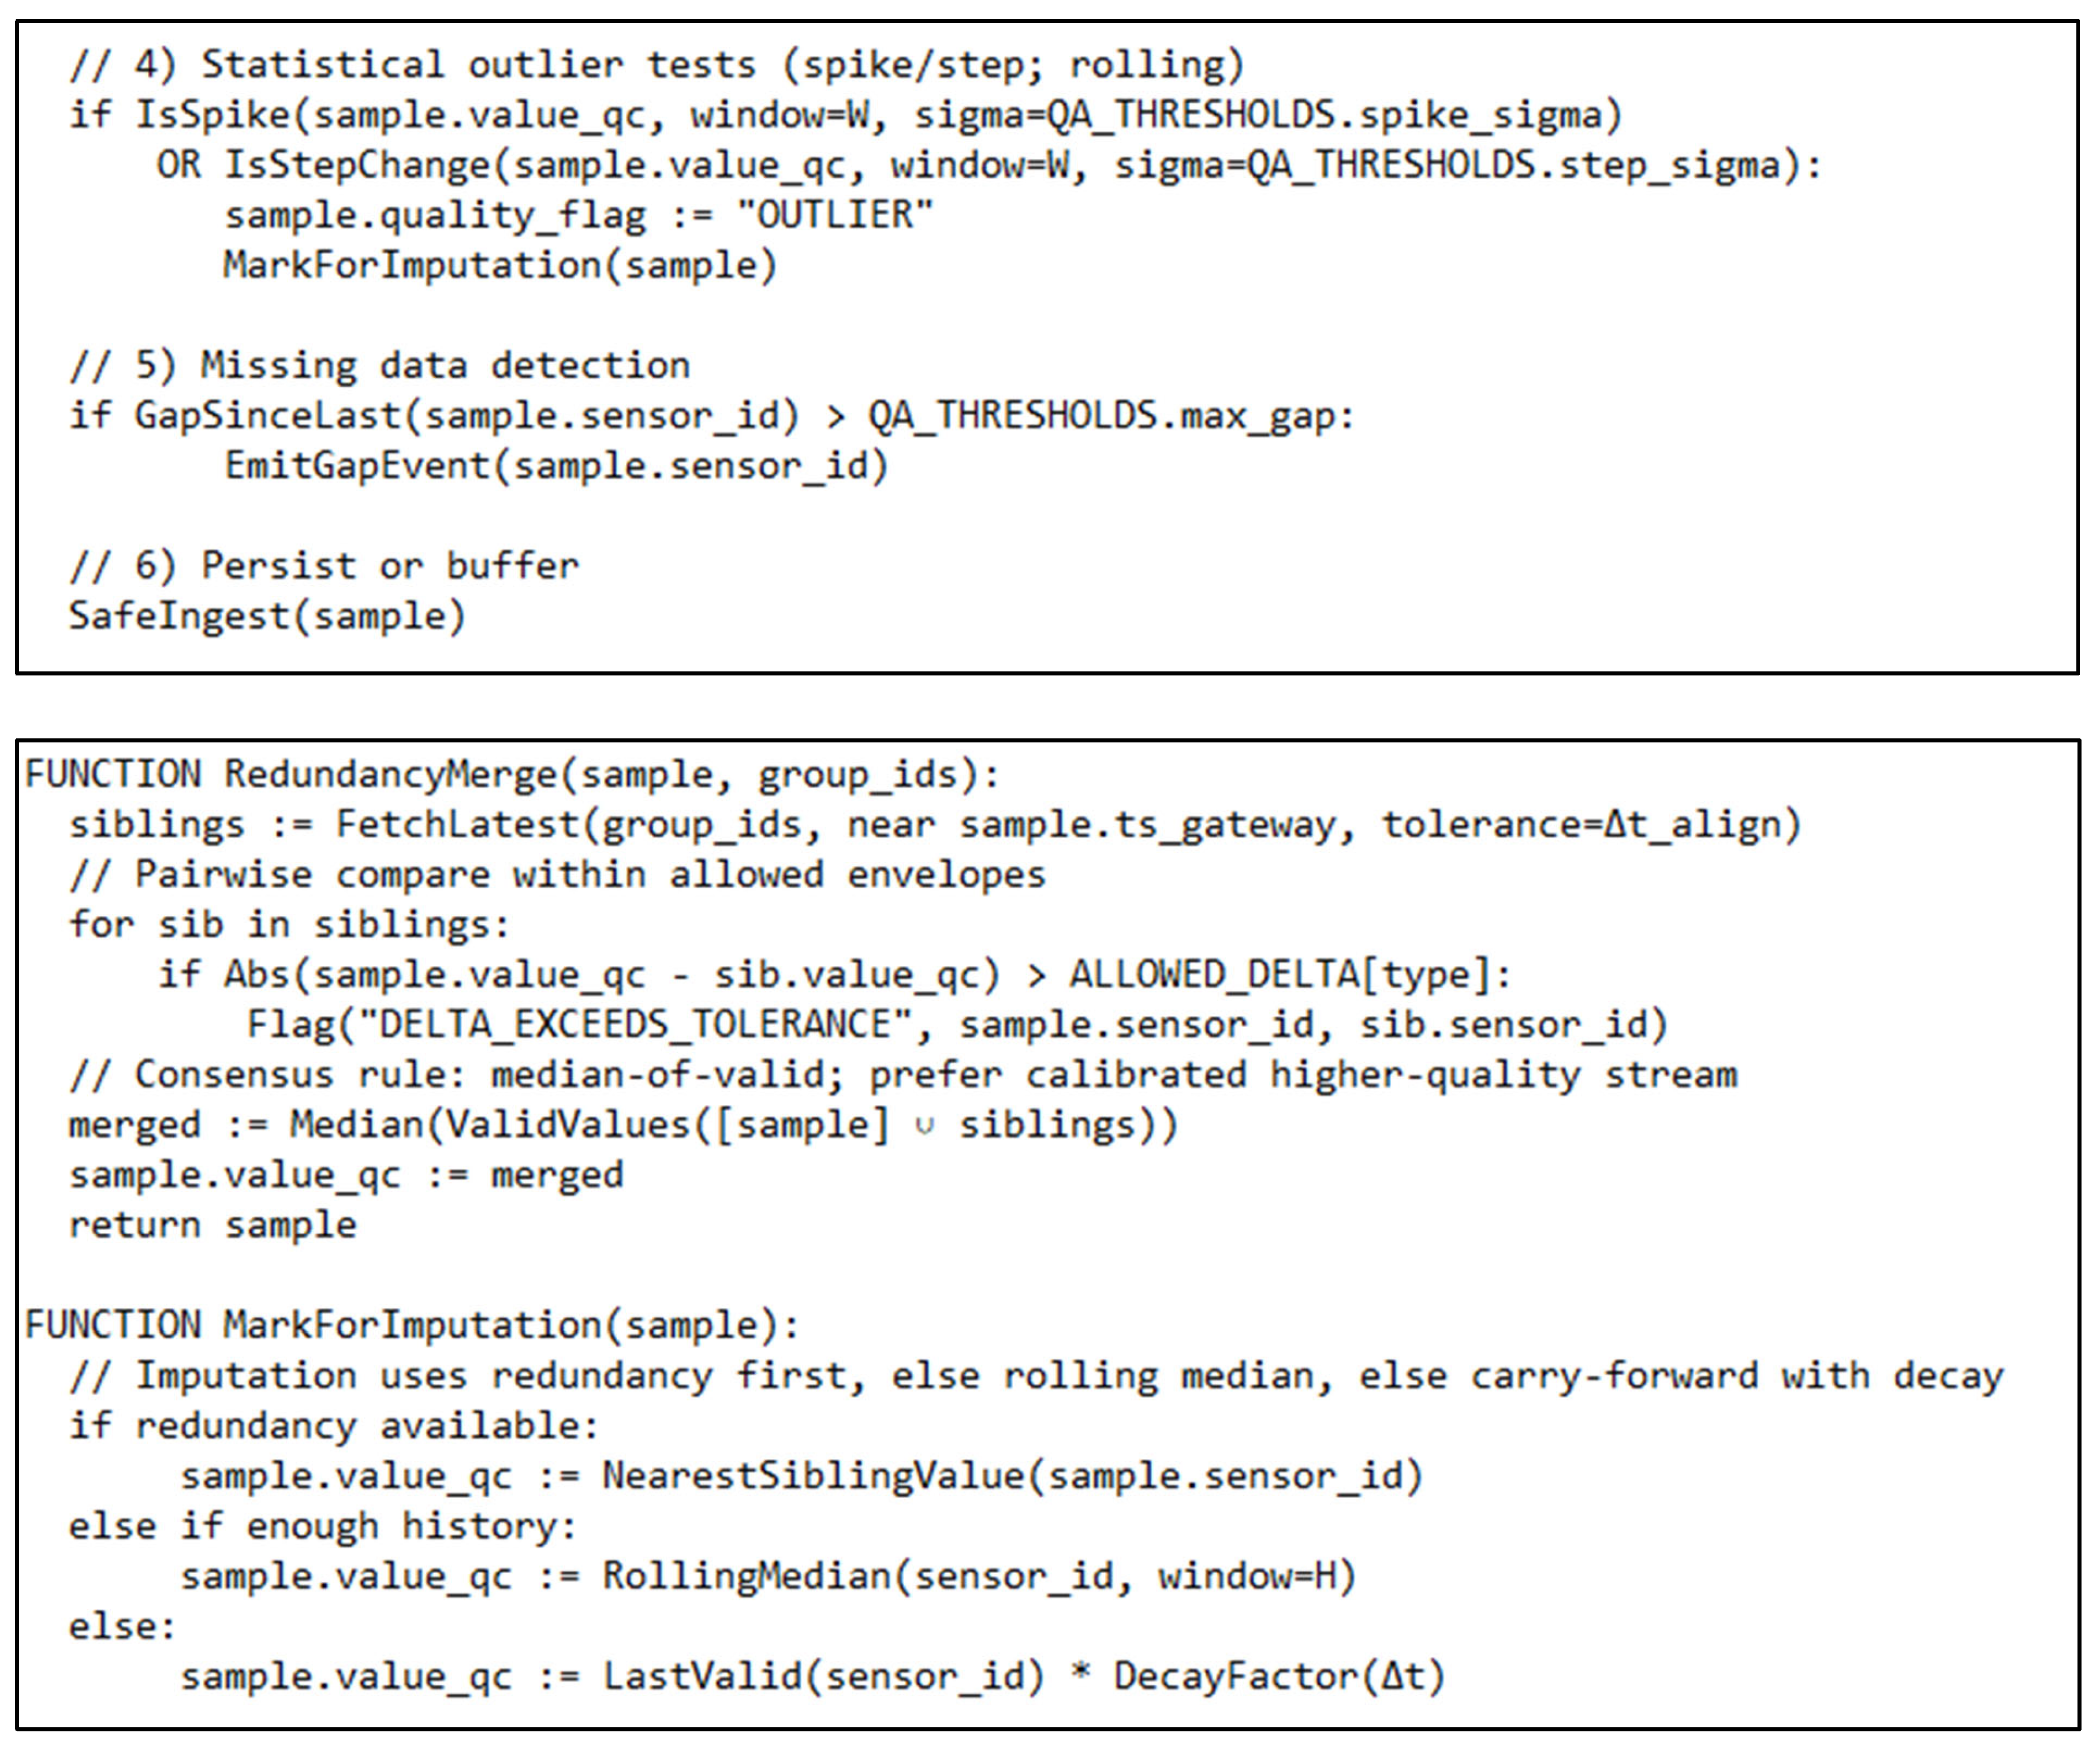
Figure 7 shows as it performs range checks, redundancy reconciliation between duplicate sensors, statistical outlier detection, and data imputation, ensuring accuracy and consistency of the stored measurements.
2.8. Energy Performance Evaluation
According to ISO 50001 [
41] and ASHRAE Guideline 14 [
42], According and ASHRAE Guideline 14, energy performance is compared on a common basis by adjusting for key driving factors, as weather and occupancy. ISO 50001 defines an energy baseline as a “quantitative reference for comparison of energy performance” and notes that this baseline can be normalized for variables such as production level or degree-days [
41]. Similarly, ASHRAE Guideline 14 prescribes a regression-based approach, building a statistical baseline model of energy use as a function of weather and other independent variables, and then using this model to project what energy would have been under current conditions.
In the present study, energy savings are attributed to operational changes, including shifting loads and behavioral feedback, without adjusting the baseline for differing weather or occupancy conditions. As such, the reduced consumption refers to the raw percentage changes observed during similar calendar periods, without explicit correction for weather or schedule variations. Thus, the study implies a comparison under comparable conditions of time, occupancy, and weather conditions, followed by a statistical significance test.
Specifically, energy performance is evaluated by comparing representative daily energy use before and after system deployment, using matched calendar periods. To validate the significance of observed changes, two-sample t-tests are conducted on daily energy consumption data.
Let
and
be the mean daily energy consumption values for the sensor
at location
during baseline (pre-) and post-deployment periods, respectively, computed over a time window
. Similarly,
and
are the corresponding standard deviations. The test statistic is defined as
where
and
are the number of samples in each period. Degrees of freedom are estimated using Welch’s method. This formulation ensures statistical validation using the same rolling window parameters adopted for outlier detection and reliability scoring, thus maintaining consistency in time-series processing [
43].
4. Results
4.1. Monitoring Coverage and System Performance
Monitoring equipment placement was carefully selected based on preliminary site surveys and consultations with school maintenance personnel. Sensors for indoor temperature, humidity, and CO
2 were positioned at standard occupant heights (approximately 1.5 m from the floor), away from direct airflow from HVAC units and windows, to capture representative indoor environmental conditions. As schematically presented in
Figure 10, adjacent IAQ sensors were installed to provide redundancy and improve data reliability.
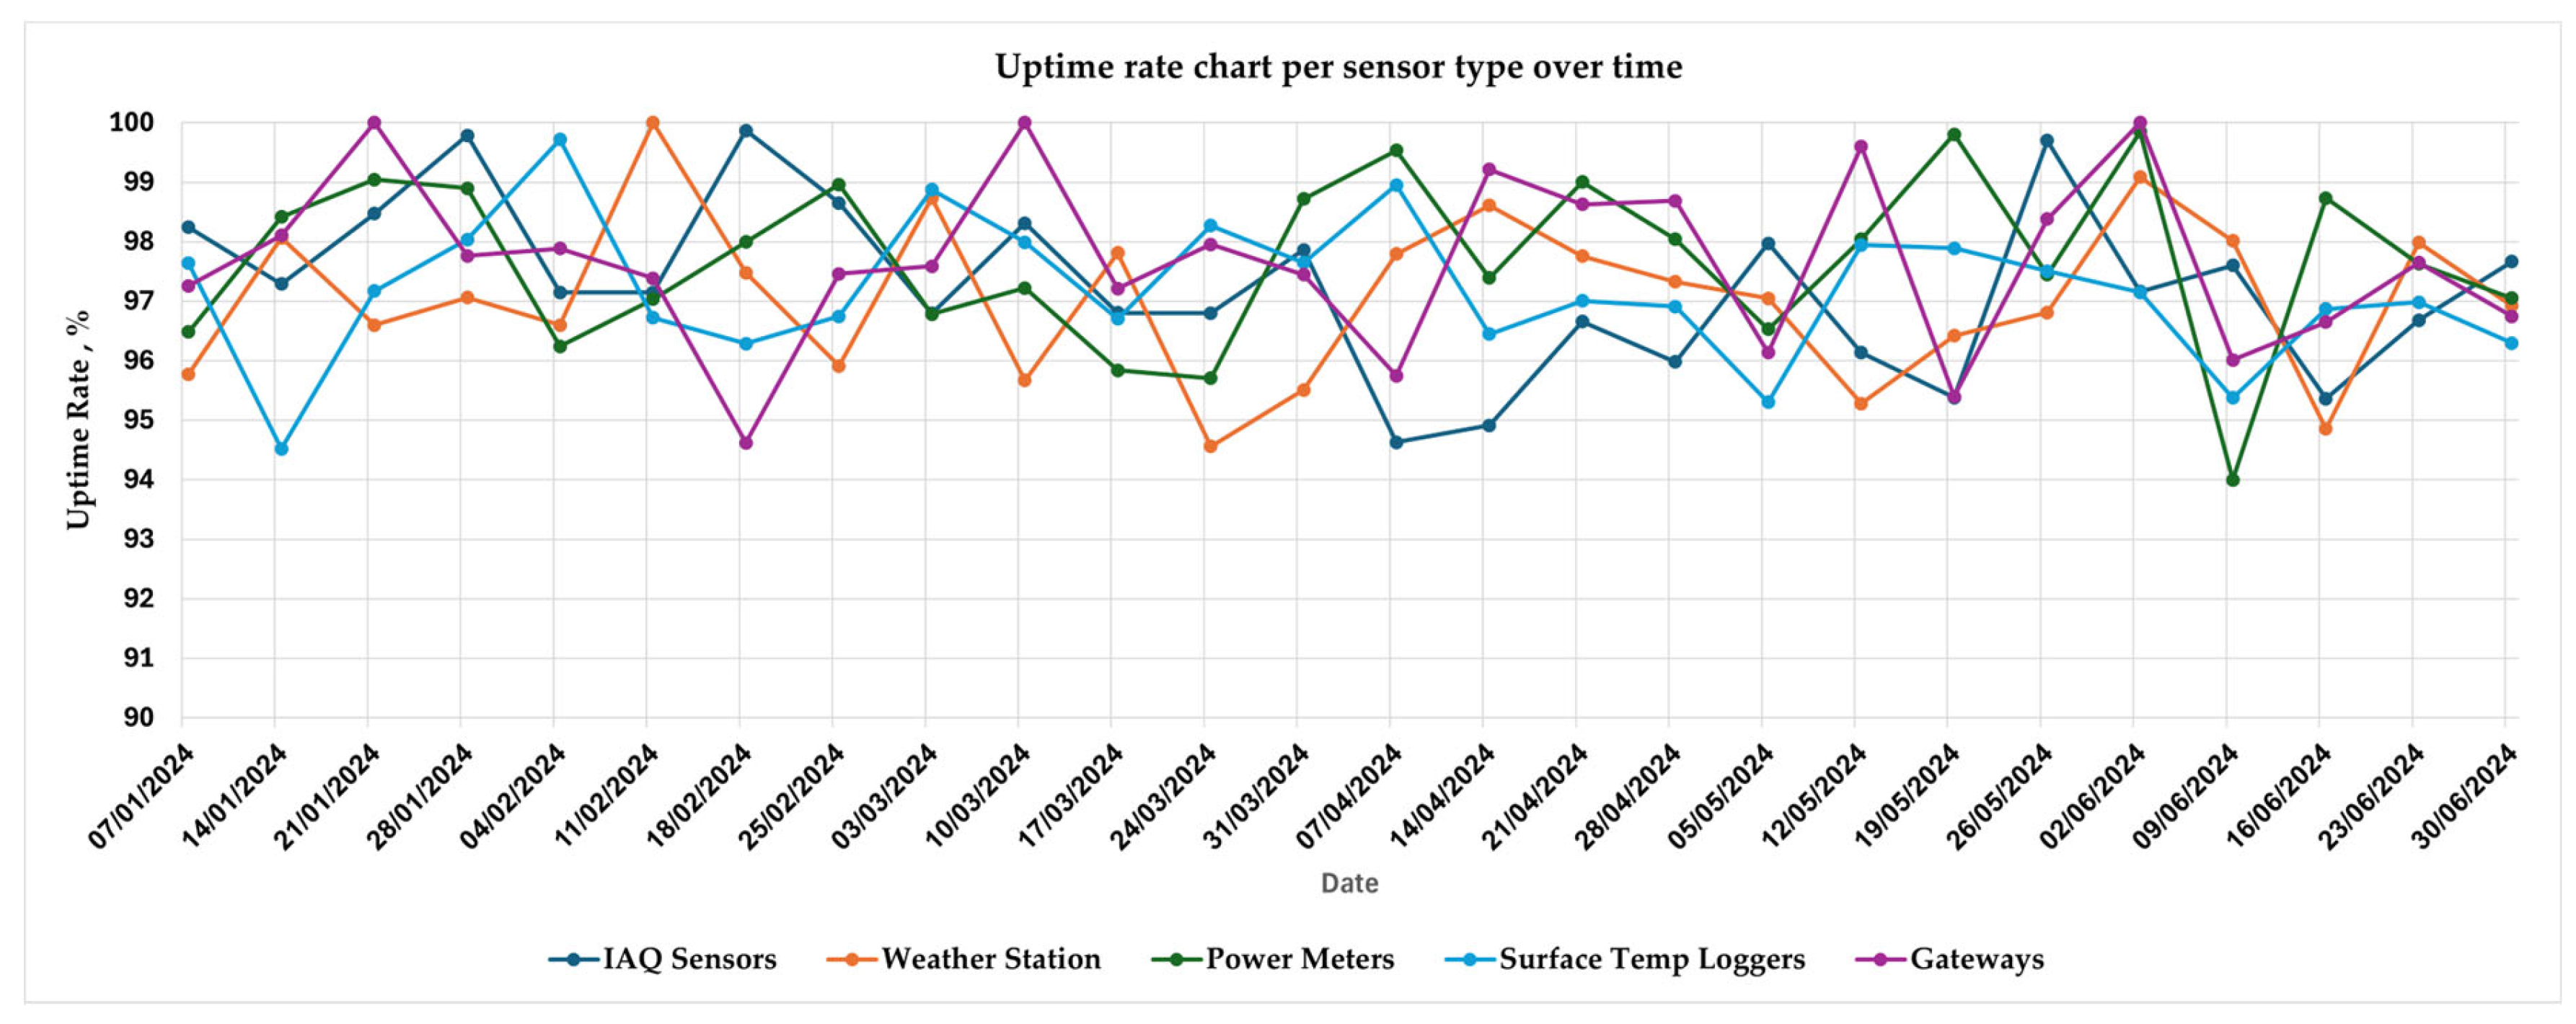
The twelve-month pilot deployments demonstrated high reliability and low power requirements. Across both schools, the platform maintained an average sensor uptime of 97.5%, with minimal disruptions at the field level. Communication was equally robust, as 98.9% of transmitted data packets were successfully received and synchronized. These metrics illustrate the effectiveness of the multi-layered redundancy and communication fallback strategies described in the methodology. The system’s power draw remained low, less than 8 W per building, excluding routers and external gateways, making it suitable for large-scale deployments in resource-constrained public facilities. Sensor uptime distributions over time are illustrated in
Figure 11.
During the 12-month deployment period, three primary categories of sensor node failures were observed:
Power Supply Interruptions—Approximately 40% of recorded failures were caused by depleted or unstable power sources. These included battery drainage in offline nodes and unstable USB power in indoor units connected to shared infrastructure. Most of these events were resolved through manual battery replacement or reconnecting the cable.
Wireless Signal Interference—Approximately 35% of downtime cases were attributed to communication issues, primarily due to degradation of Wi-Fi or Zigbee signals. These were often correlated with structural interference or temporary router outages. In some cases, reconnection occurred automatically; in others, it required reconfiguration or signal extension.
Sensor Malfunctions—About 25% of issues were due to sensor-specific faults. These included abnormal output drift, sensor freezing, or total signal loss. Faults were detected via cross-validation between redundant sensors or by threshold-based anomaly detection algorithms. Affected nodes were either recalibrated or replaced.
Across the monitoring period, 11 manual maintenance interventions were required, primarily due to isolated sensor faults or power interruptions. Notably, in all affected locations where sensor redundancy was implemented, i.e., zones equipped with two or more co-located sensors measuring the same parameter, no urgent maintenance action was needed to preserve data continuity or validity. In these cases, redundancy allowed for automated cross-verification and uninterrupted monitoring, as the system temporarily relied on the healthy node until the affected one was restored.
By contrast, single-sensor zones accounted for 9 of the 11 interventions, where immediate physical access was necessary to restore measurement capability. This contrast highlights the preventive value of redundancy, which reduced the frequency of critical maintenance actions and enabled more flexible scheduling of corrective responses. The redundancy strategy thus played a key role in sustaining high system availability with minimal intervention burden.
4.2. Energy Performance Metrics
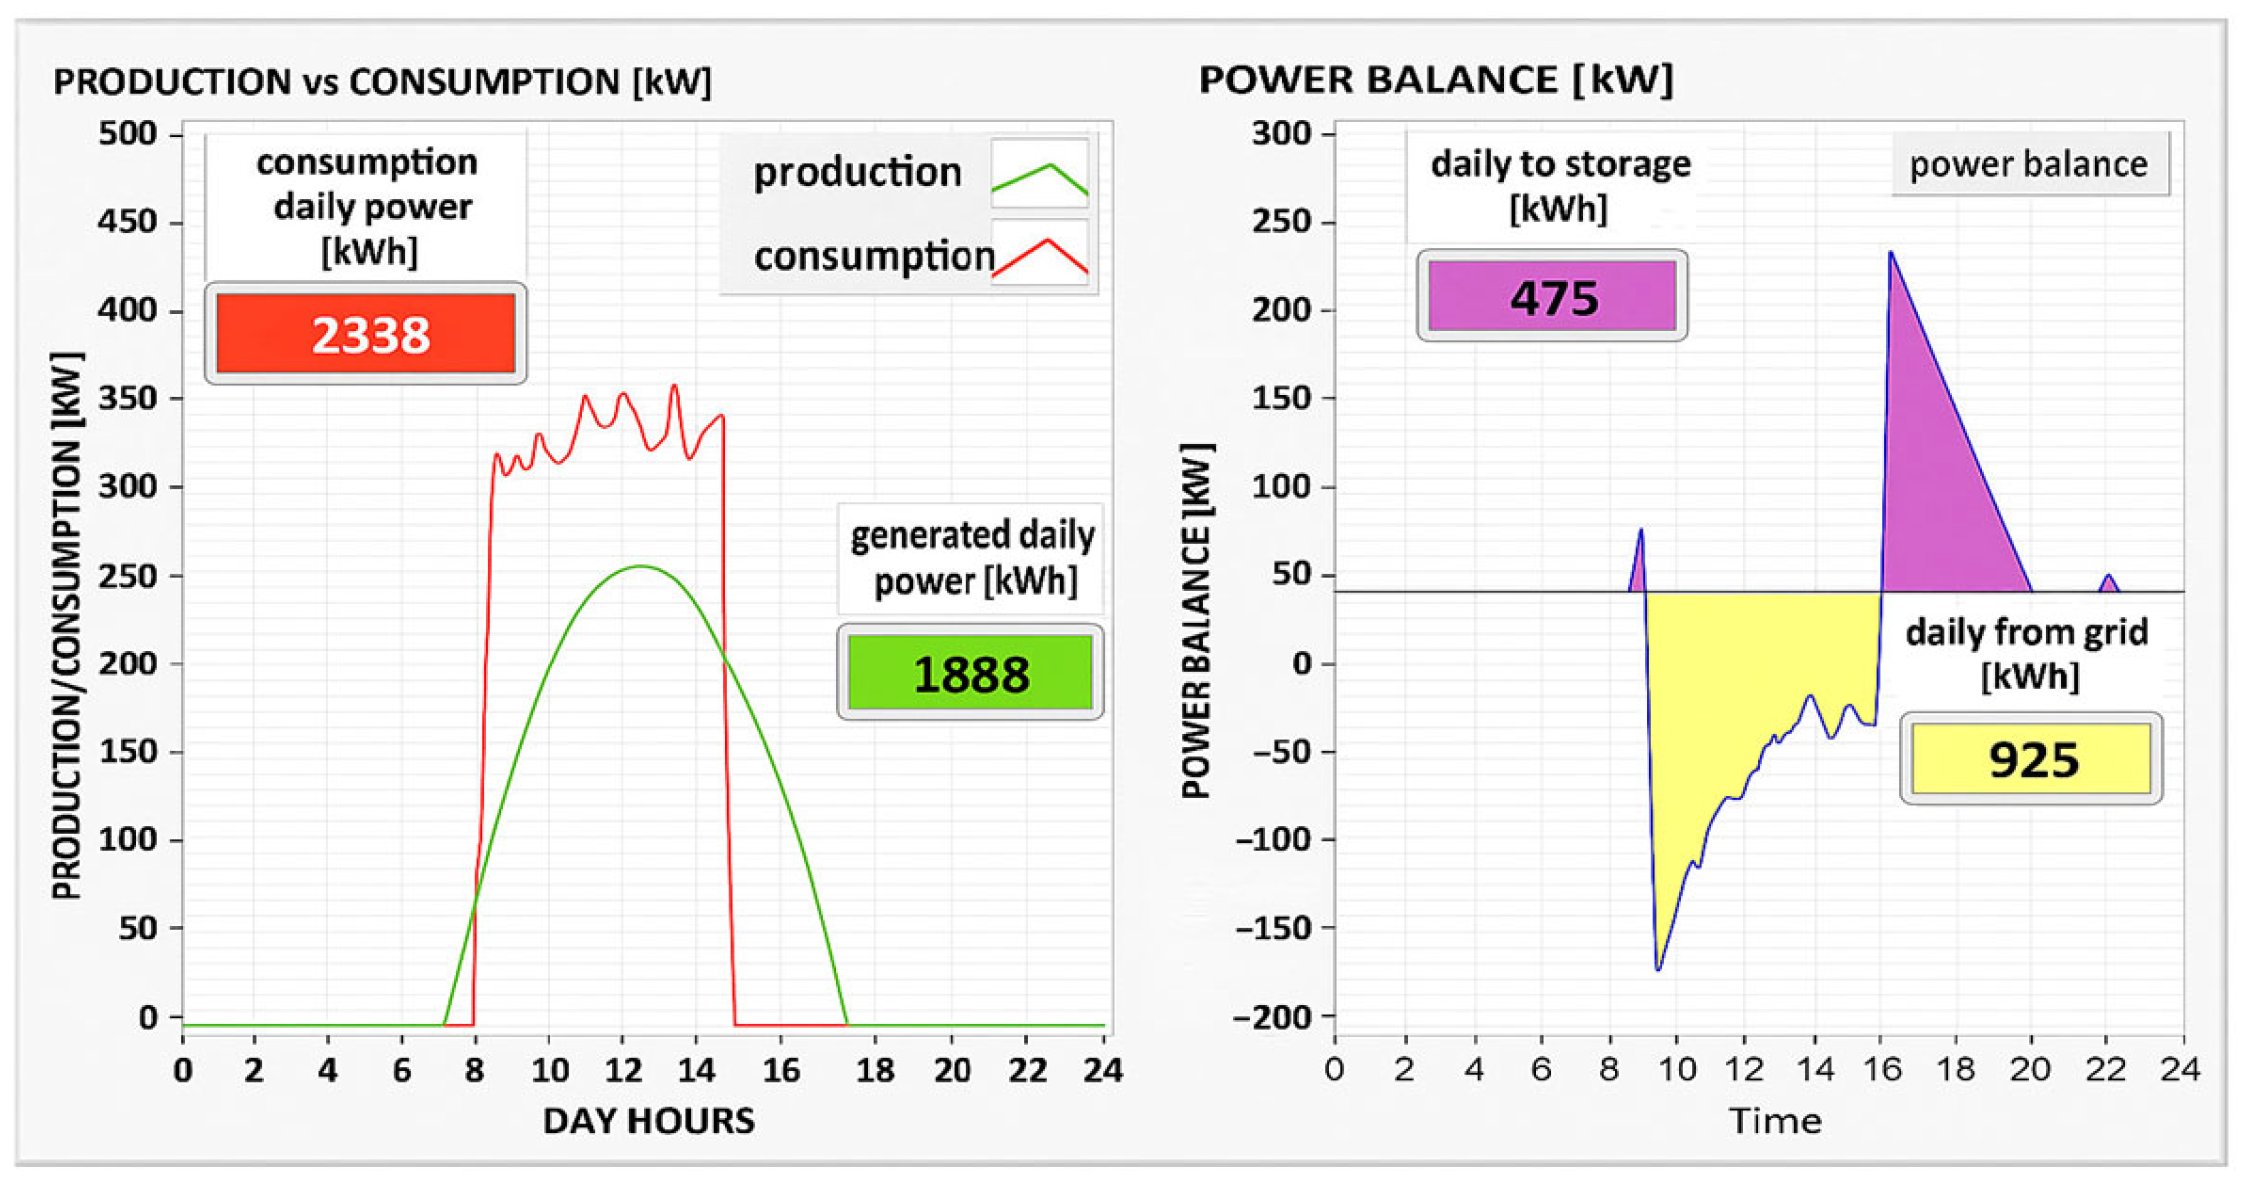
The monitoring data provided actionable insights into energy use, despite the rigid schedules typical of school environments. Analysis of building-level energy flows indicated that PV self-consumption, defined as the ratio of on-site PV energy used to total PV generation, was observed. We specify that 15 min resolution data was used, and that battery charge/discharge flows were included in the balance, increasing from roughly 60% to about 75% when on-site generation and storage were aligned with demand. This improvement was achieved by visualizing real-time solar production and adjusting operational patterns (e.g., shifting cooling loads to coincide with PV generation peaks). A power-balance plot summarizing daily production and consumption is provided in
Figure 12.
Daily SCR (Self-consumption ratio) in this study is evaluated from the data presented in
Figure 12, as follows:
where
and
are the daily consumed power
deducted by the grid imported portion
, and PV generated power, respectively.
The study reports that SCR increased from approximately 60% at baseline to approximately 75% after the retrofit was implemented. In absolute terms, the improvement is 20%, while in relative terms, this represents a 25% increase over the baseline. In general, the increase in PV self-consumption can be expressed as the difference (or relative change) in SCR between the intervention and baseline.
Lighting and plug-load data showed that aligning energy use with occupancy patterns offered additional savings. The lighting energy savings of up to 22% are achieved by comparing the average daily lighting consumption over a three-month baseline period (January to March 2023) with a matched three-month post-deployment period (January to March 2024). Classroom energy reduction of 10–15% was calculated using similar seasonal matching to control for external temperature and daylight variations. Although detailed weather normalization and occupancy tracking were not performed, the periods were selected to align with the academic calendar and climatic conditions, thereby minimizing bias. PV self-consumption was computed as the ratio of PV energy consumed on-site (either directly or after battery discharge) to total PV generation, using 15 min interval data collected from smart meters and storage inverters. Battery charging and discharging flows were accounted for using net energy fluxes recorded at the storage interface.
A statistical comparison is performed between daily energy consumption in the pre-deployment and post-deployment periods.
Table 7 summarizes the mean daily energy values, standard deviations, and the results of Welch’s two-sample
t-test for three key performance indicators: lighting energy consumption, total classroom-level energy use, and PV self-consumption ratio.
The outcome of Welch’s t-test, applied according to Equation (7), reveals p-values below , confirming that the reductions are unlikely due to random variation.
Additionally,
Figure 13 demonstrates a consistent downward trend in daily consumption, further supporting the robustness of the observed savings. These results validate the effectiveness of the monitoring platform in supporting behavioral change, load awareness, and local energy balancing strategies.
4.3. Indoor Air Quality Trends
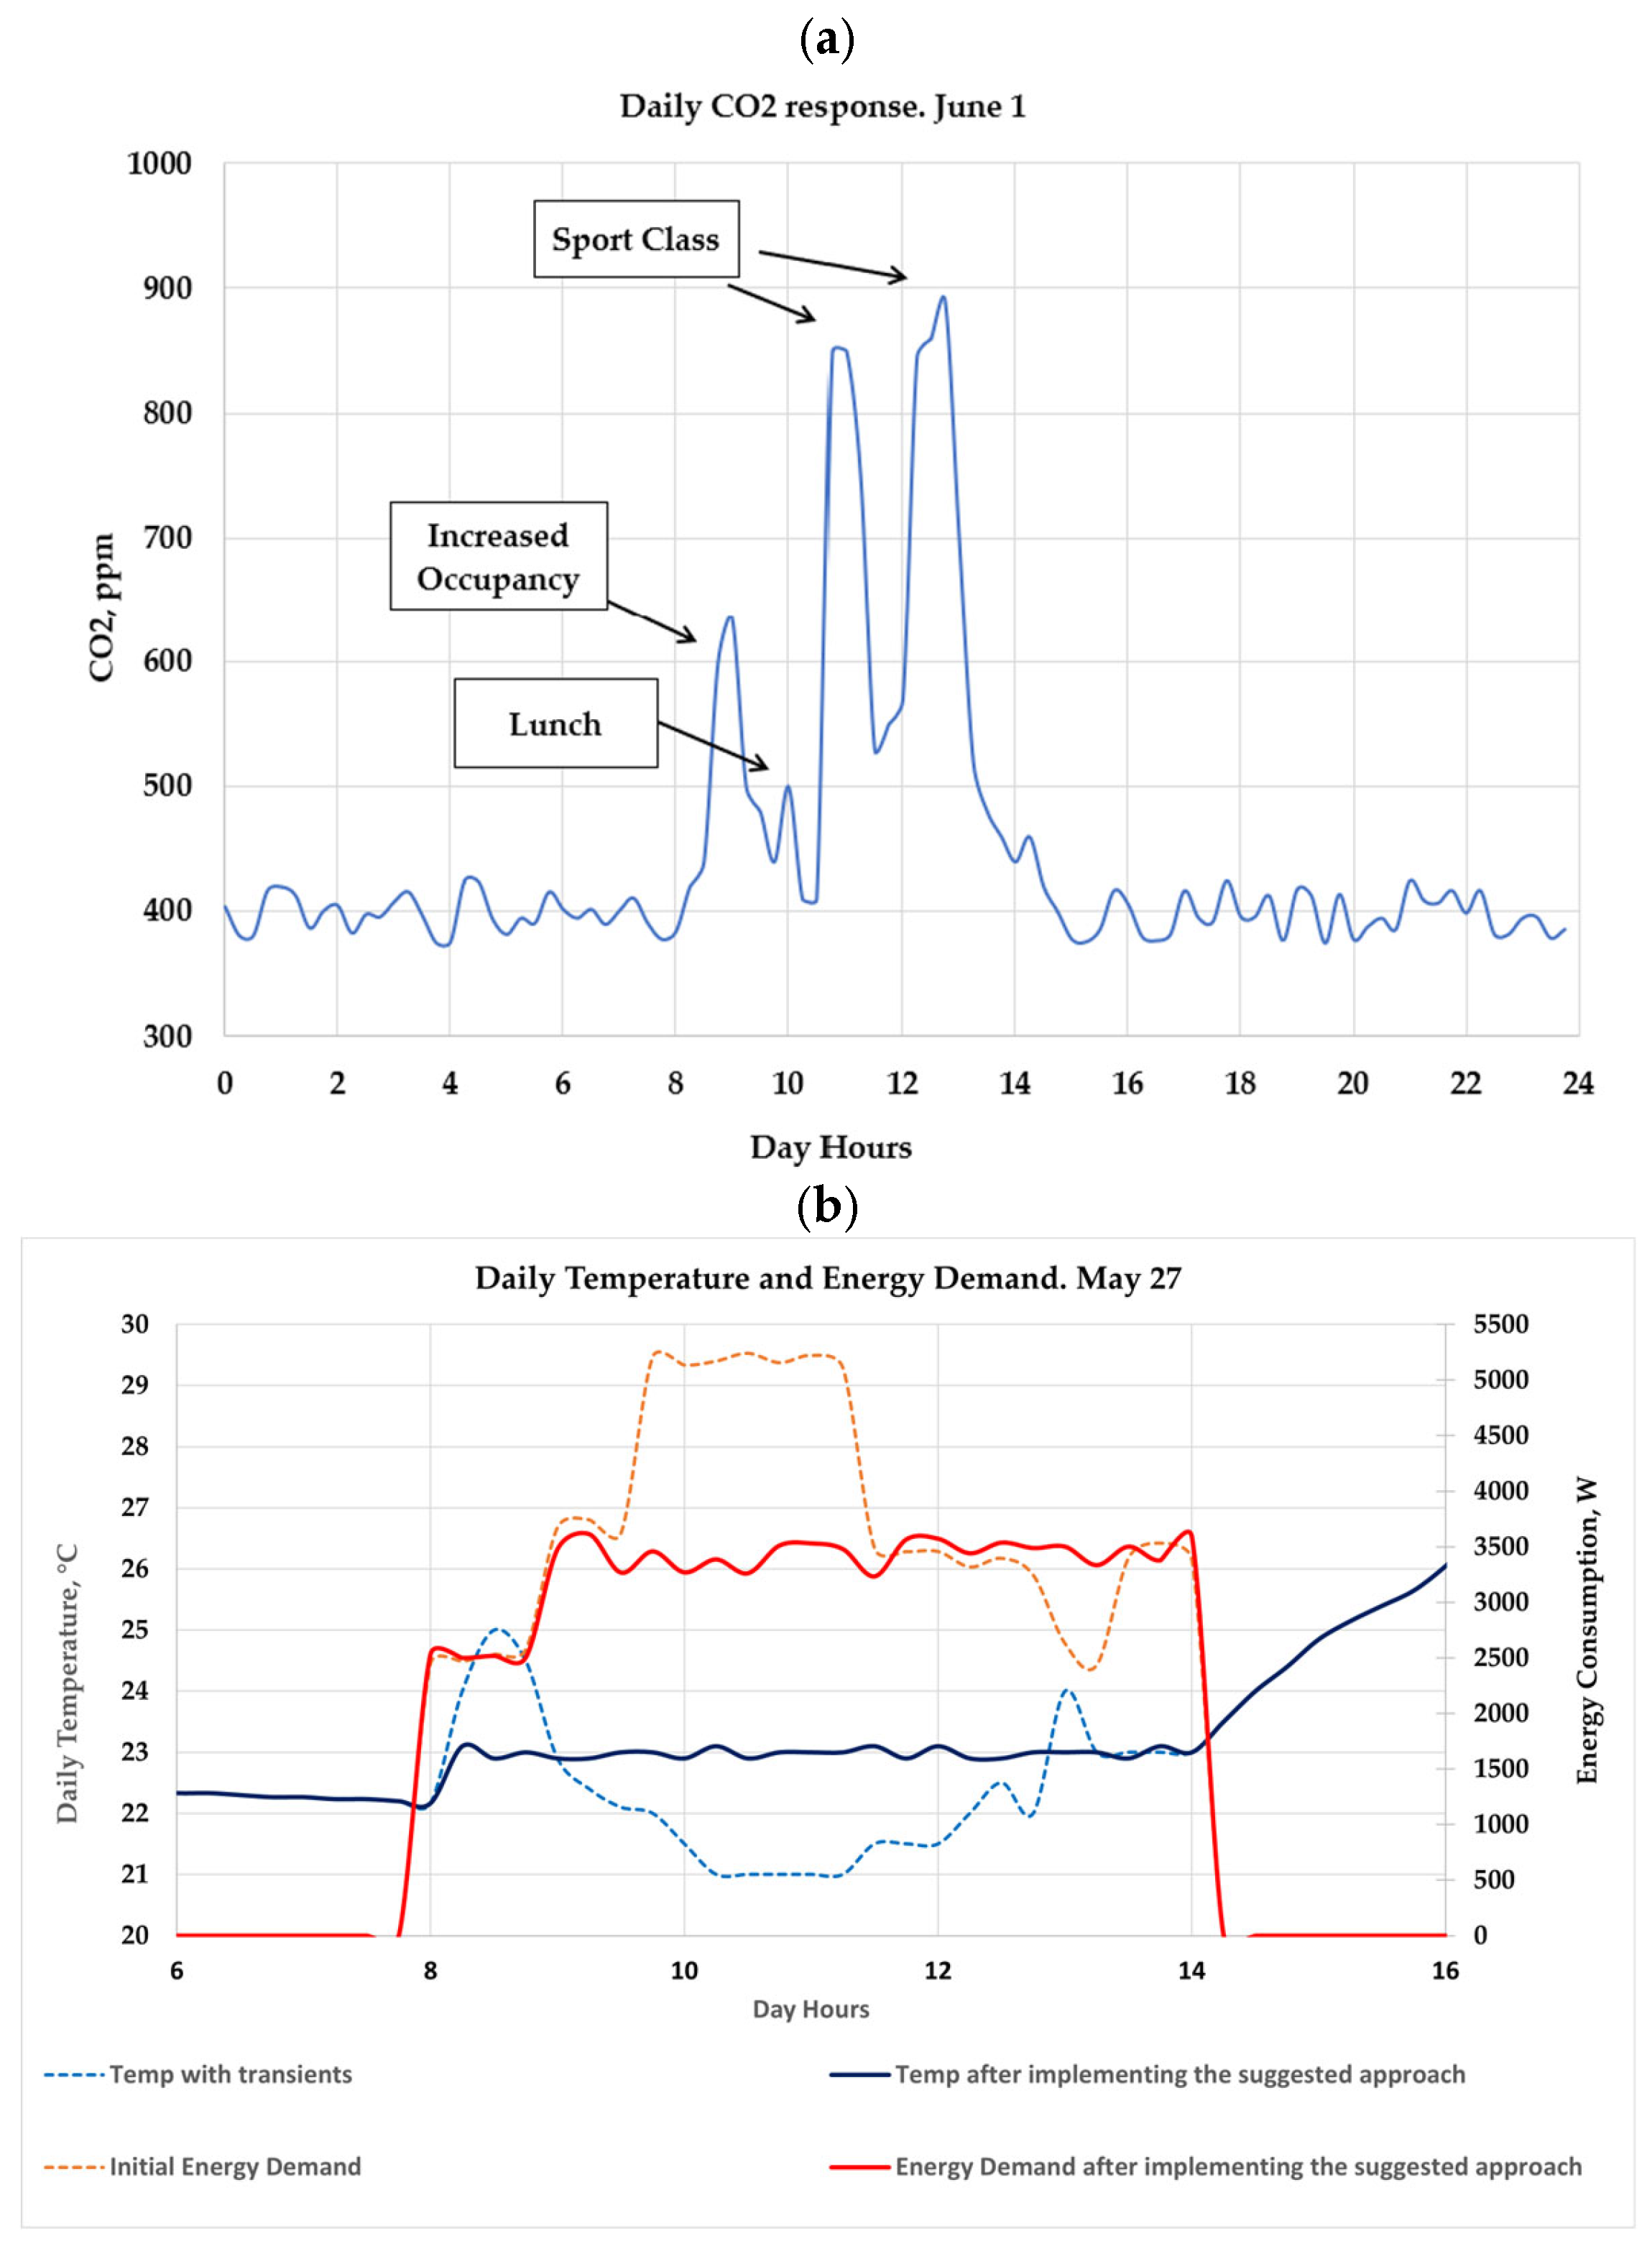
These results underscore the importance of integrating environmental and energy data into a single monitoring platform. The associated IAQ-energy transients are given in
Figure 14.
The platform captured detailed IAQ dynamics, revealing recurring transients correlated with occupancy cycles and ventilation practices. In classrooms, CO
2 concentrations regularly approached 1000 ppm within 60–90 min of continuous occupancy and sometimes exceeded 1400 ppm during certain activities. These values underscore the need for timely ventilation. By observing real-time CO
2 levels on dashboards, teachers and students were able to trigger short ventilation actions, such as opening windows, preventing prolonged exposures, and restoring acceptable air quality. Daily trends for CO
2 and particulate matter (PM2.5) are illustrated in
Figure 15.
Particulate matter trends were linked to specific activities and environmental conditions. Elevated PM2.5 levels occurred during morning cleaning, periods of high student movement, and days with high outdoor pollution. VOC concentrations were generally stable but occasionally spiked in enclosed staff areas, likely due to the use of cleaning agents or equipment in these areas. These observations demonstrate how continuous monitoring facilitates the identification of pinpointed, localized pollution sources and informs targeted interventions.
4.4. Measurement Reliability
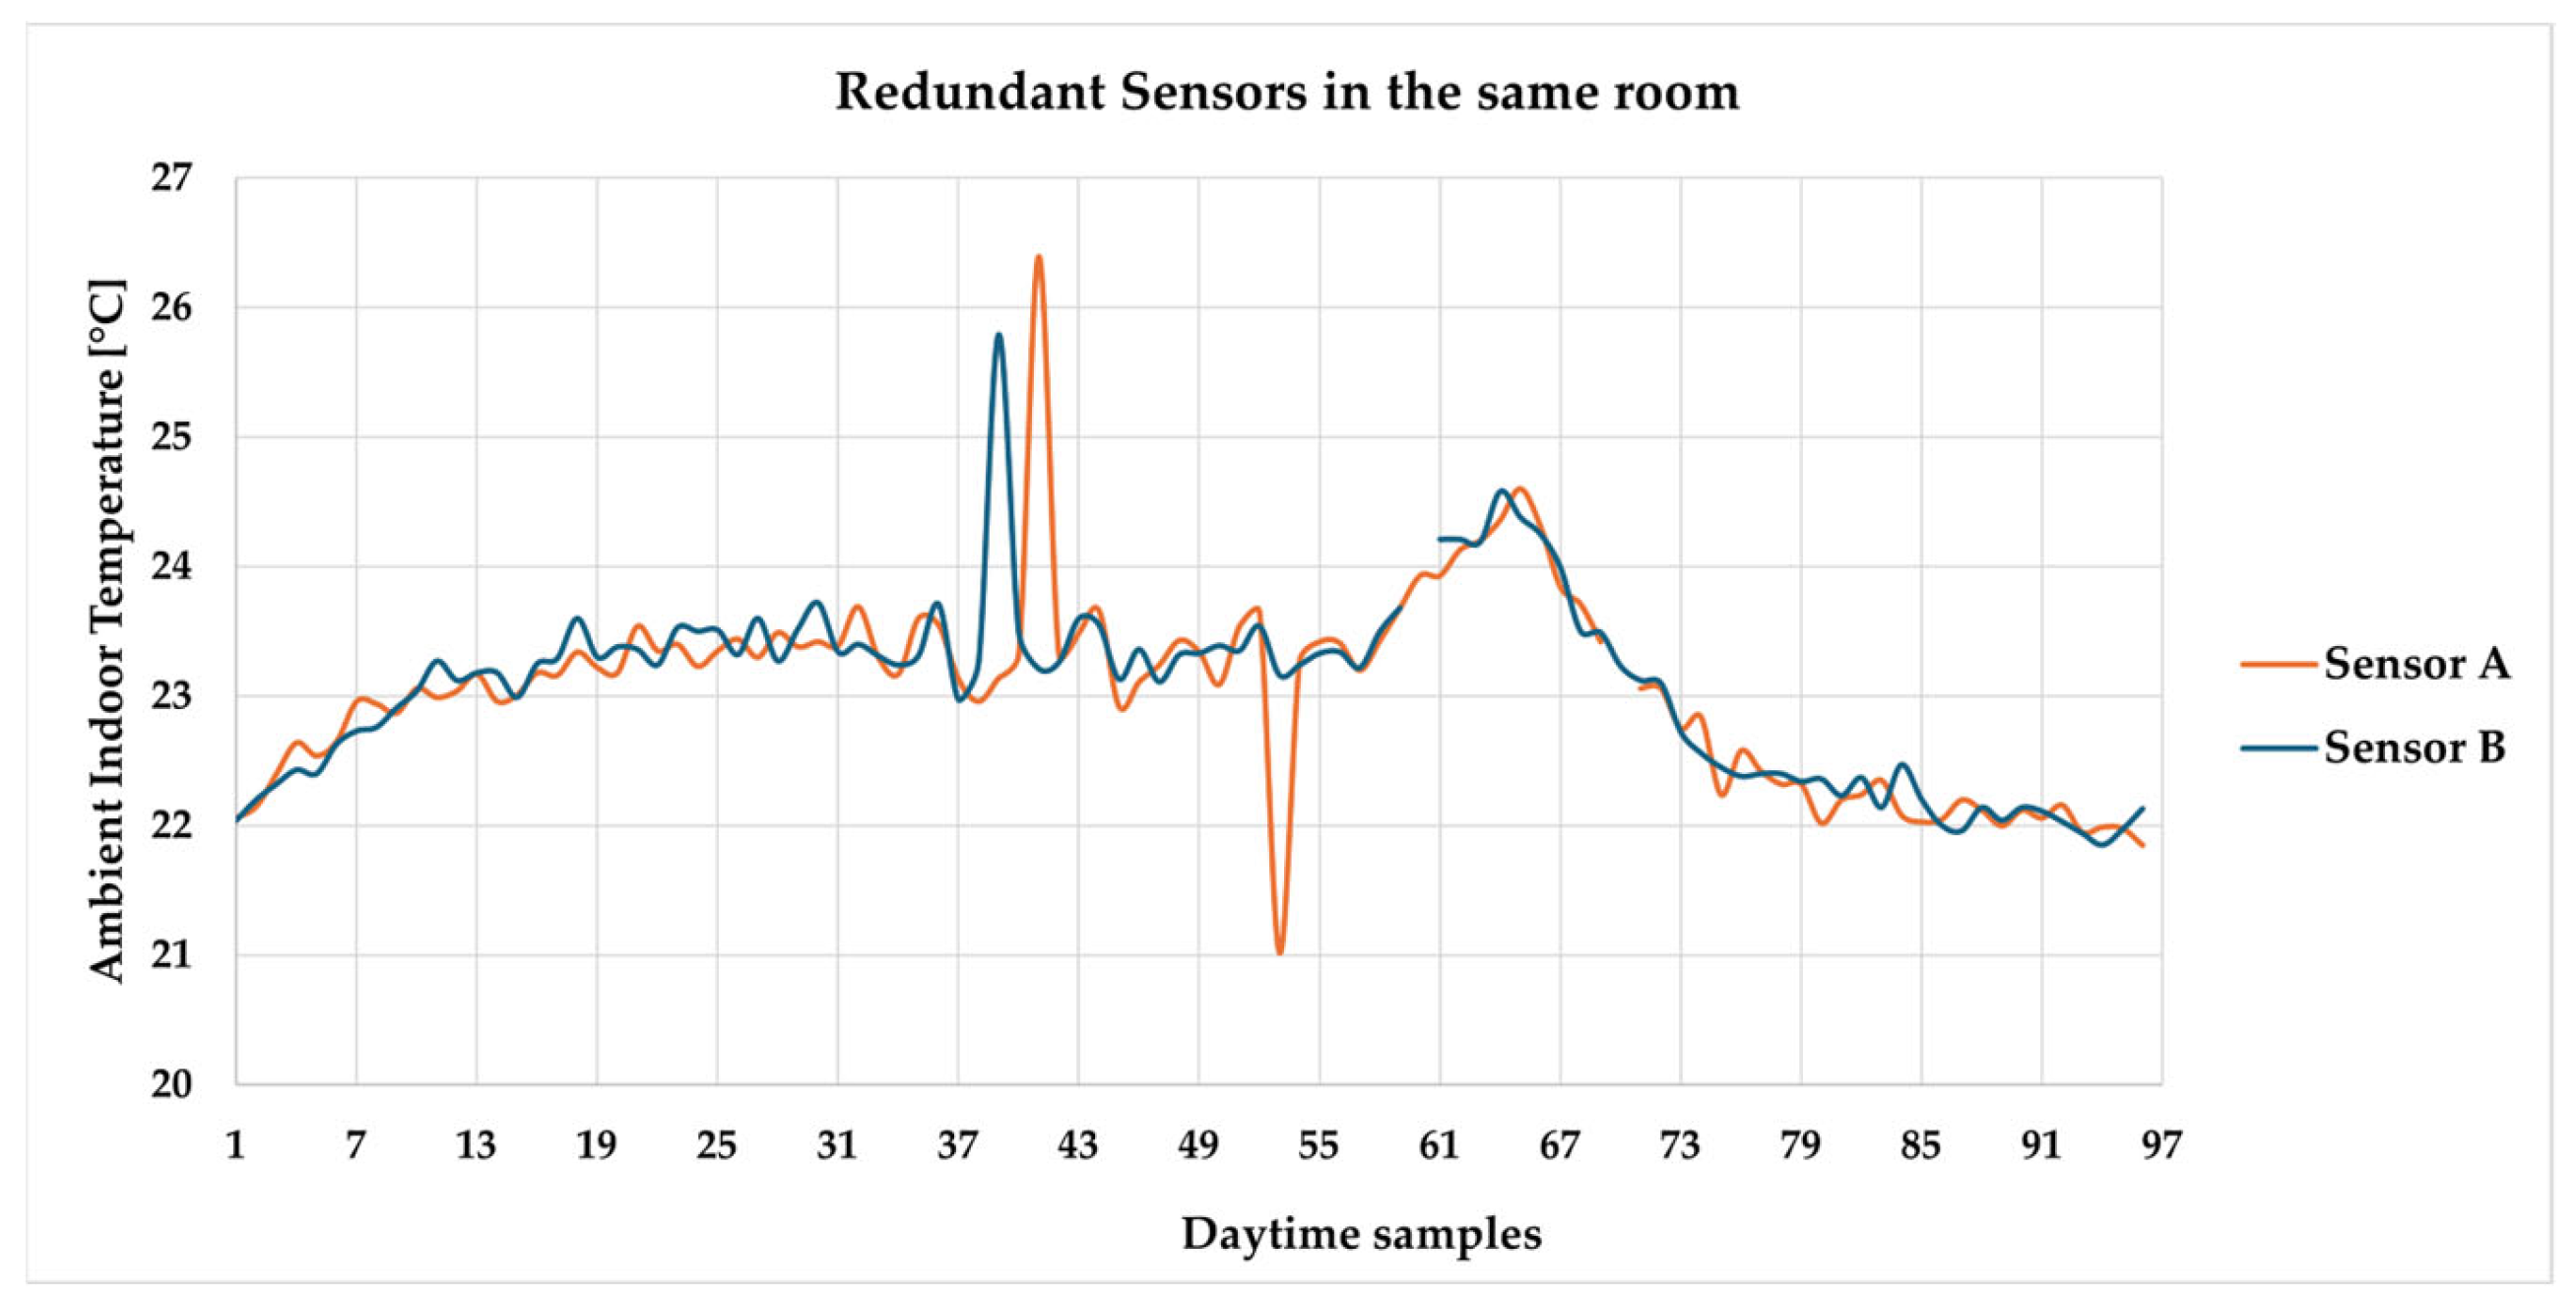
To verify measurement reliability under realistic conditions, temperature readings from redundant sensors were analyzed at 15 min intervals (96 samples per day).
Redundant sensors with outlier detection
Two identical temperature sensors were co-located in a classroom.
Figure 16 shows that both sensors follow the same temperature profile, but occasional anomalies occur on individual devices. The first sensor exhibits a sudden spike at sample 41 and a dip at sample 53, while the second sensor has different isolated anomalies. Since the used sensors are defined with uncertainty of ±0.3 °C (see
Table 3), differences outside this band are treated as outliers. Redundancy enables these faults to be detected and removed, preserving data integrity.
Each trace shows ambient indoor temperature across 96 samples. Anomalies, such as spikes, dips, or missing samples, appear on individual sensors but not on both simultaneously.
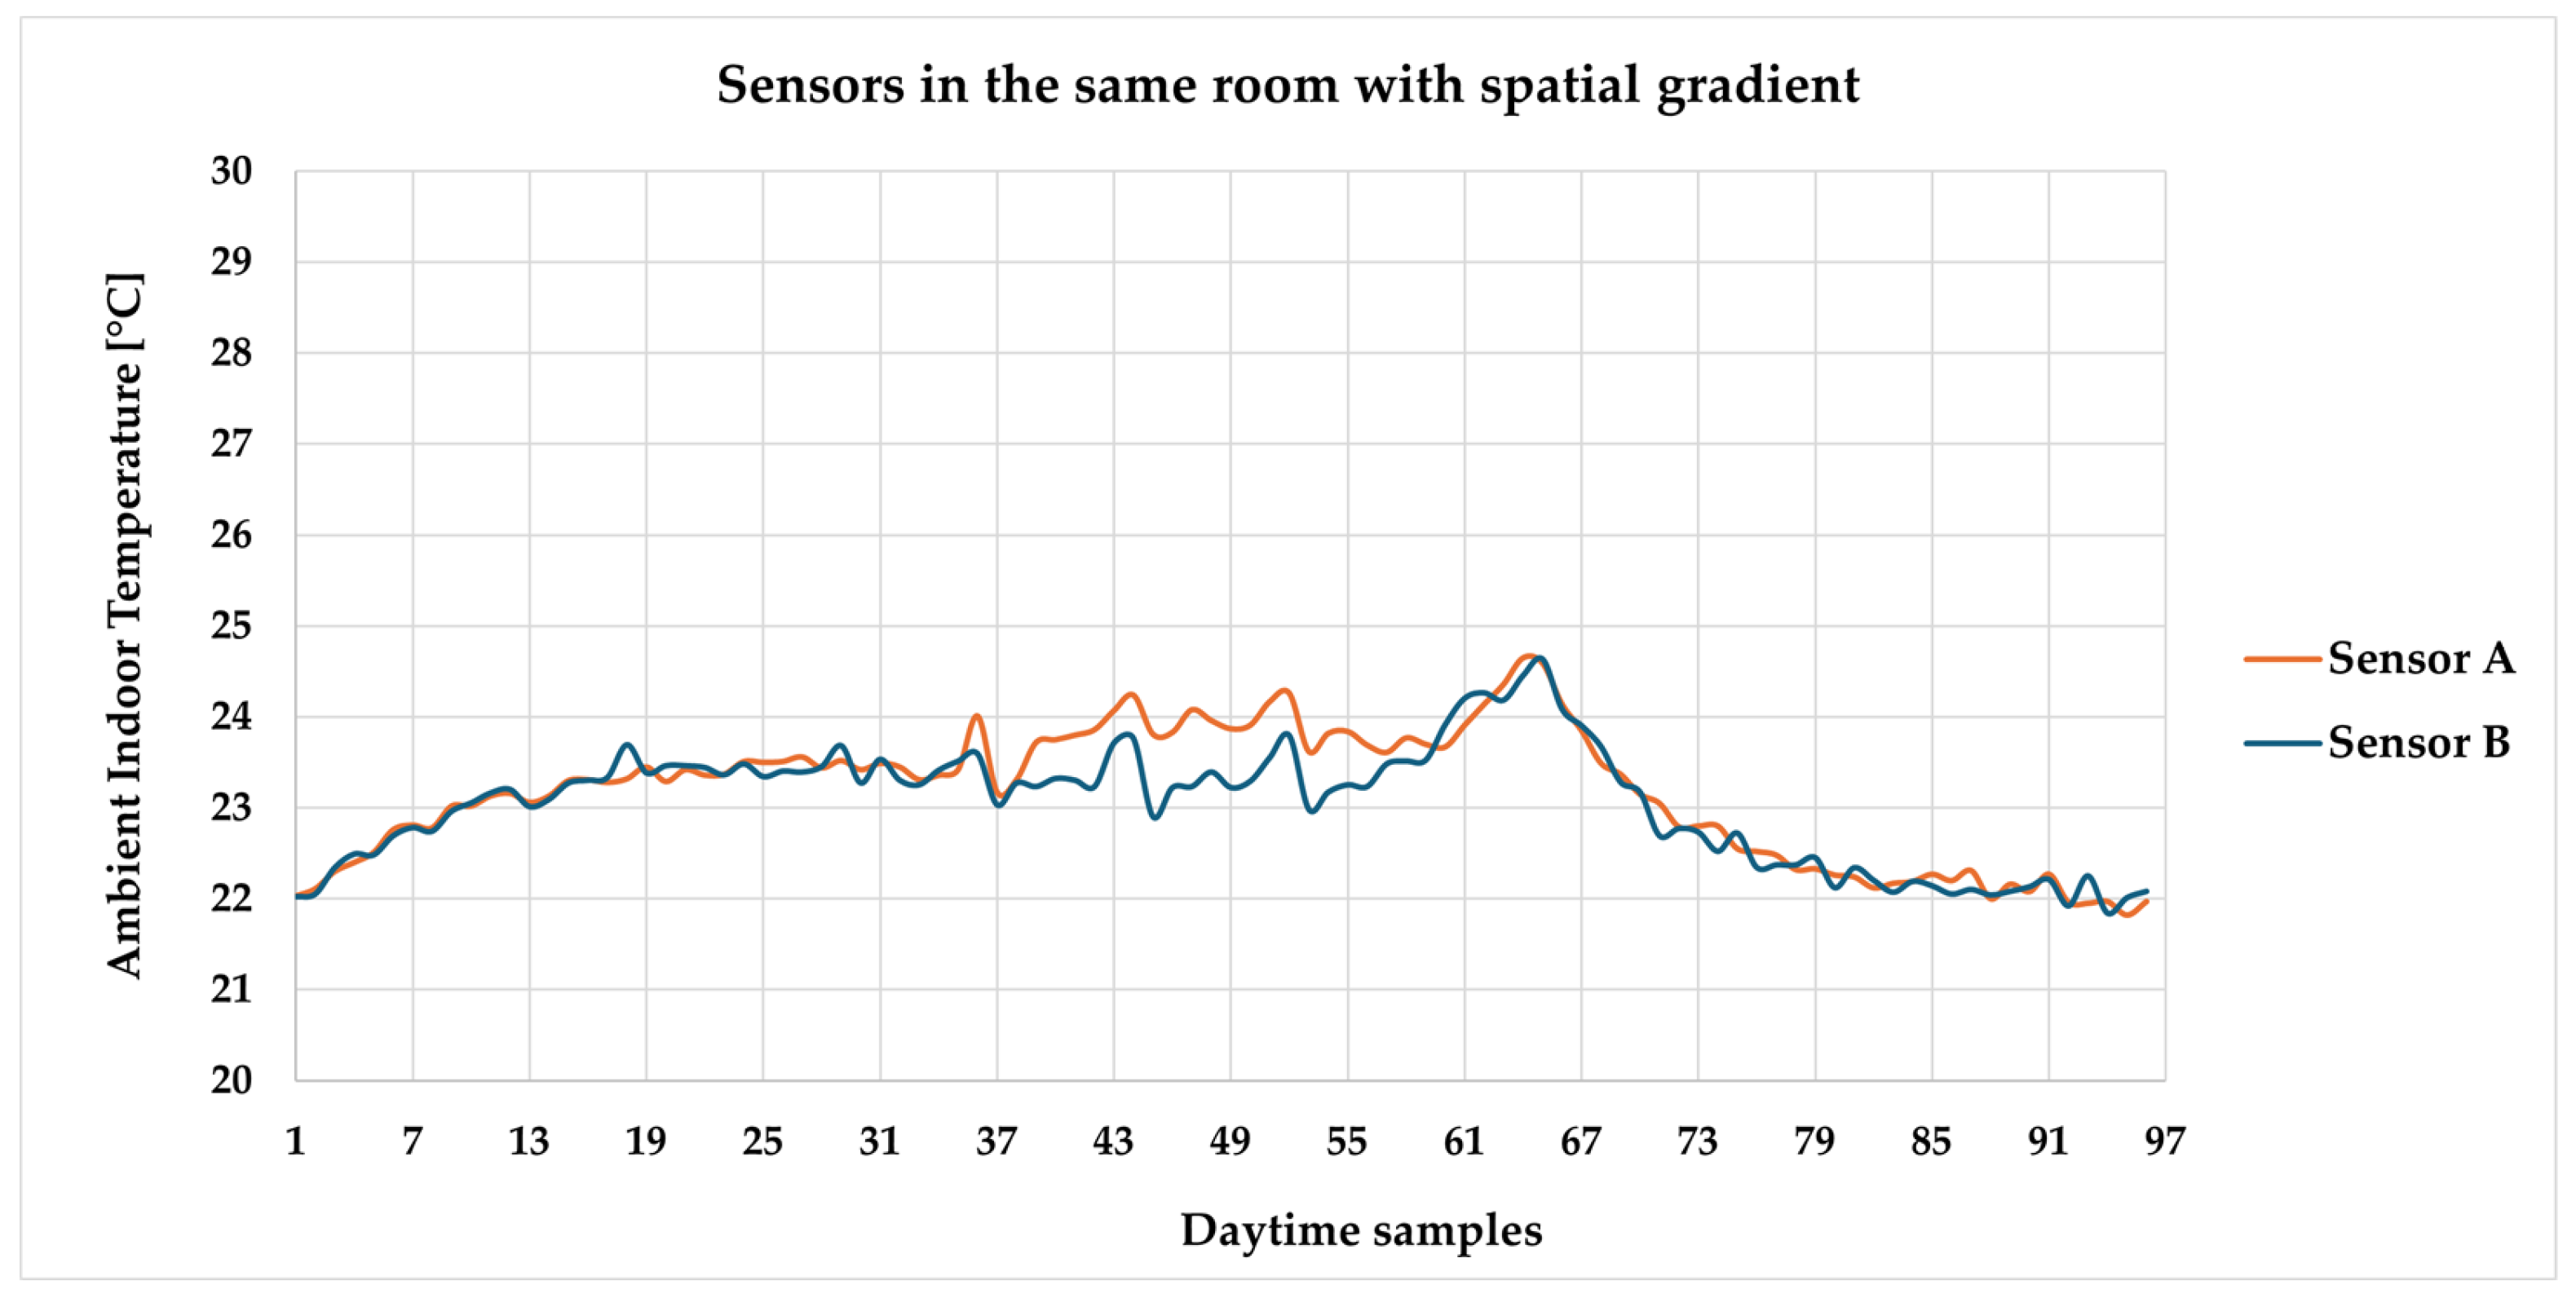
Spatial gradient within a room
When redundant sensors were placed at opposite ends of the same classroom, their readings diverged gradually over time.
Figure 17 illustrates that the temperature difference grew to about 0.5 °C by the end of the day, reflecting a spatial gradient caused by proximity to windows, HVAC vents, or occupants. As this divergence remains within the ±0.5 °C accuracy, it is considered acceptable. Nevertheless, the observed gradient underscores the importance of sensor placement and motivates ongoing research into intra-room temperature variation.
A gradual divergence of up to approximately 0.5 °C occurs over the course of the day, reflecting spatial gradients.
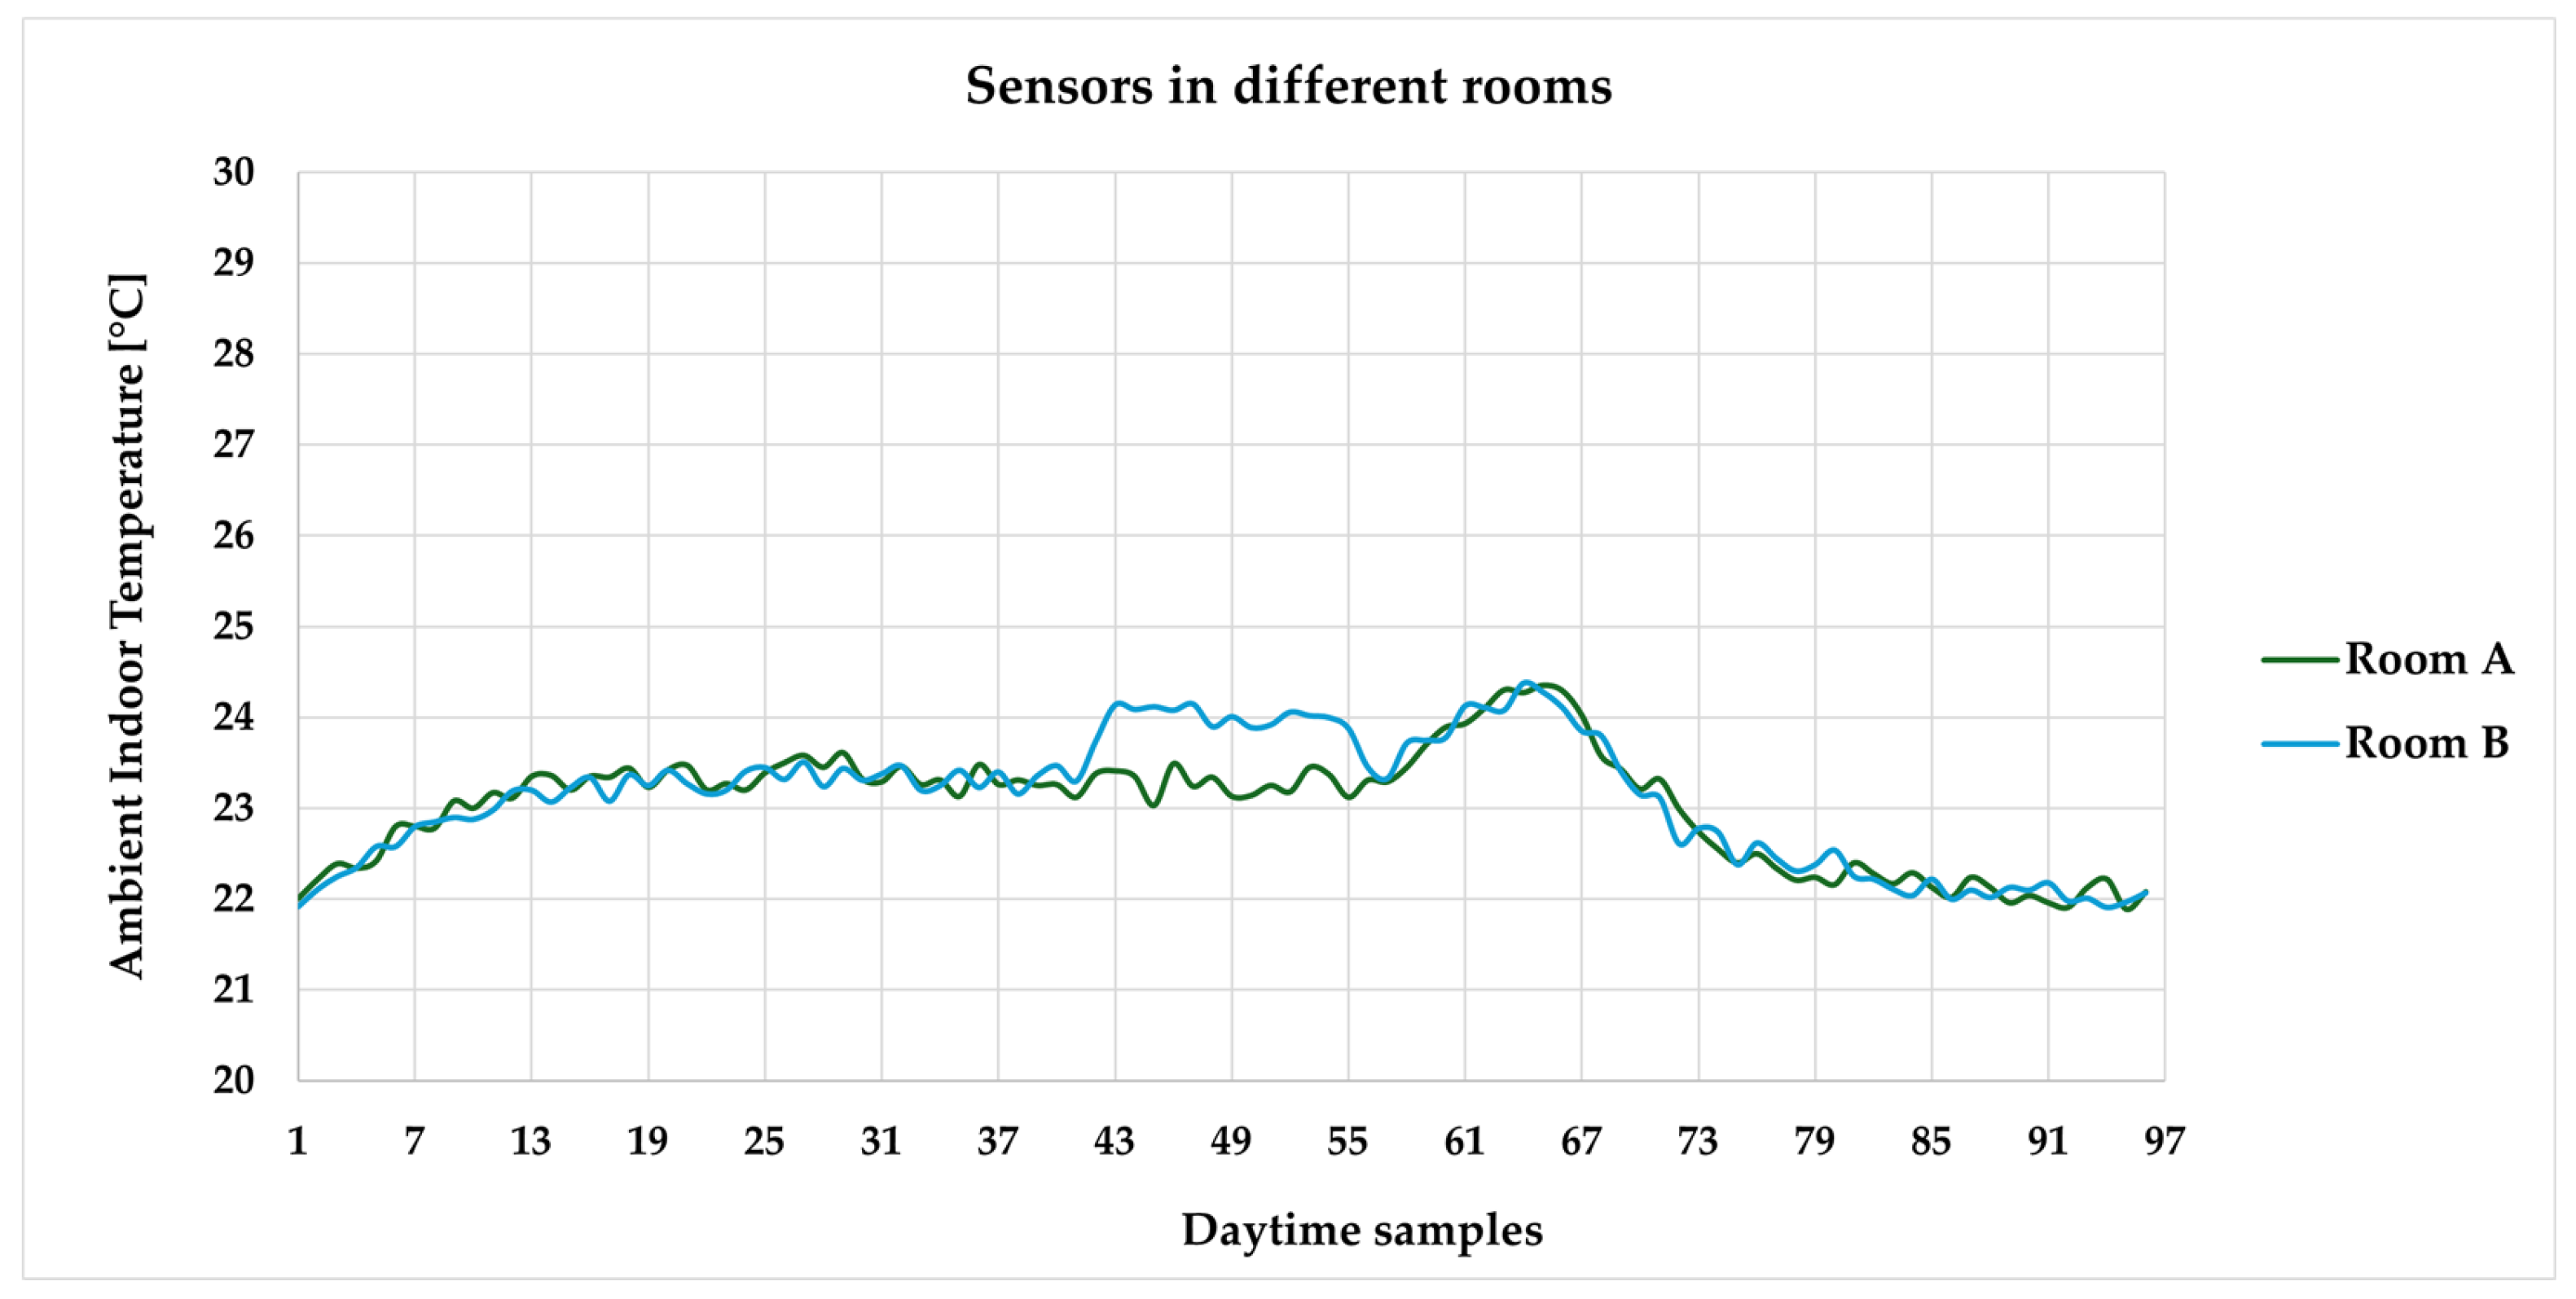
Comparing rooms with different HVAC regimes
Temperature sensors were installed in two adjacent classrooms that followed distinct HVAC schedules.
Figure 18 shows that during occupied hours (samples 33–56, corresponding to 08:00–14:00), one room maintained a stable set point while the other followed a variable schedule with higher temperatures early in the day and a dip before the end of class. At night and outside school hours, both rooms converge to the same baseline, indicating correct sensor alignment. The daytime discrepancies are therefore attributed to occupancy-related HVAC control rather than sensor drift.
During school hours (samples 33–56, equivalent to 08:00–14:00), the rooms display distinct temperature patterns. However, at night, both series align completely.
Together, these comparisons demonstrate that redundant sensors can identify outliers, reveal spatial gradients, and differentiate between sensor bias and operational differences, thereby enhancing confidence in the monitoring data.
4.5. User Engagement and Feedback
Post-deployment surveys and analytics evaluated system accessibility and stakeholder engagement. Teachers reported that real-time, localized IAQ data empowered them to make simple ventilation adjustments without technical training. They noted that color-coded indicators for CO2 and temperature provided clear guidance for ventilation during back-to-back lessons or in rooms with poor airflow. Students responded enthusiastically to the classroom displays; teachers observed that live environmental data stimulated curiosity and encouraged energy-saving behaviors such as turning off lights. Facility managers and technicians appreciated the dashboards for diagnosing sensor anomalies, identifying faulty loads, and reviewing historical IAQ and energy trends. Administrators valued automated monthly summaries and anomaly reports, which supported data-driven planning and budgeting. Collectively, these findings indicate that the platform’s role-specific visualization increased awareness and facilitated proactive actions across all user groups.
5. Discussion
5.1. Principal Findings
The pilot implementation of a multiscale monitoring platform in two retrofitted public schools demonstrated that a hybrid architecture can deliver high data reliability, low power consumption, and meaningful operational insights. Over the course of twelve months, sensor uptime averaged 97.5% and data packet success reached 98.9%, even in structures with challenging connectivity. The system also delivered real-time energy and IAQ data that enabled modest but measurable improvements. PV self-consumption increased from approximately 60% to 80% by better aligning loads with generation. Lighting savings of up to 22% were achieved by adjusting usage patterns, and classroom energy use dropped by an estimated 10–15% thanks to targeted ventilation interventions informed by IAQ measurements. Moreover, IAQ monitoring revealed daily CO2 transients, often exceeding 1000 ppm within 60–90 min of continuous occupancy, which prompted manual ventilation to maintain healthy indoor air quality conditions. User feedback highlighted strong engagement across all stakeholder groups; teachers and students valued intuitive indicators for CO2 and temperature, facilities managers used historical data to diagnose issues, and administrators benefited from automated summaries.
5.2. Interpretation and Implications
These results substantiate the hypothesis that an integrated, role-adaptable monitoring framework can enhance energy efficiency, indoor environmental quality, and stakeholder engagement in retrofitted public buildings. Unlike many commercial building management systems that focus solely on building-level metrics and require homogeneous infrastructures, the proposed system’s multiscale approach captures cross-scale interactions. It provides data tailored to occupants, technicians, administrators, and policymakers. The observed increase in PV self-consumption and the reduction in energy use demonstrate how synchronized energy and environmental data can inform demand-side strategies while maintaining indoor ecological comfort, as indicated by stable temperature, humidity, and CO
2 levels within accepted thresholds. These conditions are consistent with the thermal and air quality criteria defined in ASHRAE Standard 55 [
29] and ASHRAE Standard 62.1 [
44] for acceptable indoor environments. Real-time IAQ visualization empowered occupants to initiate low-cost interventions (such as window opening and scheduling breaks) that effectively mitigated CO
2 peaks and reduced unnecessary HVAC operation. These findings align with broader literature emphasizing the role of behavioral feedback in energy and IAQ management and highlight the value of granular monitoring in educational settings.
The strong user engagement underscores the importance of designing dashboards that are accessible and context-specific. Teachers utilized color-coded indicators to manage ventilation, and students developed an increased environmental awareness. They participated in energy-saving behaviors, and facility managers used the system to identify sensor anomalies and faulty loads. Such engagement not only supports operational improvements but also fosters a culture of shared responsibility, suggesting that monitoring systems can serve educational and behavioral purposes in addition to technical ones.
5.3. Deployment Challenges and Replicability
The discussion is informed by operational challenges encountered during the pilot and their resolution. Connectivity disruptions in older buildings with thick concrete walls necessitated the use of Zigbee mesh extenders and power-line communication adapters. Limited power availability in remote sensor zones was addressed using battery-operated devices and solar-assisted gateways. Data gaps during network congestion were mitigated through edge buffering at gateways, ensuring that unsent packets were retained for later upload. Sensor drift, particularly in low-cost IAQ devices, requires quarterly recalibration routines. Finally, early dashboards were too technical for non-experts; the adoption of role-specific, simplified interfaces improved usability and engagement.
These experiences informed guidelines for replication. Key enablers include plug-and-play sensor configuration via standardized APIs (Application Programming Interface), protocol bridges for legacy hardware, a centralized metadata registry to detect new devices, and an open-source visualization layer. When replicating the system in new buildings, designers should consider climate (including dust and humidity), structural materials (such as reinforced or dense concrete, which may require hybrid communications), the functional use (e.g., school, office, residential), and local regulations. A structured five-phase roadmap, spanning assessment, design, installation, validation, and operation, provides a practical guide for new deployments. These recommendations enhance system resilience and support scalability across varied public infrastructure.
5.4. Limitations and Future Work
While the monitoring platform achieved its primary objectives, several limitations remain. First, low-cost sensors require regular calibration to maintain accuracy, adding maintenance overhead. Second, the system currently provides monitoring and behavioral feedback but lacks closed-loop control; integrating automated HVAC and lighting responses will be a focus of future development. Third, intermittent internet connectivity can hinder centralized data management. However, local buffering mitigates some of its impacts. Finally, the pilot focused on two schools in a specific climate; broader validation is needed to generalize findings to other building types and geographic contexts.
The evaluation approach followed a comparative baseline method commonly applied in empirical field studies, but it does not currently incorporate statistical testing or formal normalization for occupancy or weather. While periods were seasonally aligned to reduce external variability, the absence of detailed normalization remains a limitation. Additionally, hypothesis testing, and quantification of performance uncertainty were not applied in the current analysis. Future work will explore the application of standardized evaluation protocols such as ISO 50001 and ASHRAE Guideline 14, and the integration of weather-adjusted benchmarks, to improve methodological rigor and reproducibility.
Future work will extend the platform to support smart control integration, feedback-driven interaction models, and gamified engagement strategies. Predictive analytics, utilizing machine learning, will be expanded for anomaly detection, forecasting, and optimization. A benchmarking module will enable inter-building performance comparisons. To foster wider adoption and collaborative improvement, the core software, APIs, and dashboard templates will be released under an open-source license. These enhancements aim to transform the monitoring system from a data collection tool into an active management platform that supports energy efficiency and healthy indoor environments across diverse public infrastructures.
While the findings demonstrate the platform’s effectiveness in two retrofitted public schools, both sites share similar characteristics: a Mediterranean climate, reinforced concrete structures, and a similar building typology. As such, the results may not directly generalize to buildings in colder climates, with different occupancy patterns, or alternative construction typologies. Nevertheless, the modular architecture of the system and its reliance on open-source technologies enable adaptation to diverse operational and regulatory contexts with minimal structural modification
6. Conclusions
This study designed, deployed, and validated a modular monitoring platform for retrofitted public buildings that integrates multiscale data collection, hybrid communication strategies, and role-specific dashboards. The twelve-month field trials in two Israeli elementary schools demonstrated that the platform could provide high data reliability, with sensor uptime averaging 97.5% and data packet success reaching 98.9%, while consuming less than 8 W per building. By aligning local PV generation with demand, the schools increased self-consumption from 60% to 80% and achieved up to 22% lighting savings and 10–15% reductions in classroom energy use through targeted ventilation. Real-time indoor air-quality monitoring revealed recurring CO2 peaks above 1000 ppm within 60–90 min of occupancy, prompting manual ventilation and underscoring the value of integrated IAQ feedback.
These findings confirm the hypothesis that a multiscale, role-adaptive monitoring system can enhance both energy efficiency and indoor environmental quality in retrofitted public buildings. Unlike conventional commercial platforms, the proposed solution accommodates a diverse range of sensors, protocols, and stakeholder needs, demonstrating robustness in settings with limited connectivity. Its success underscores the importance of contextual design, which involves tailoring sensor placement, communication schemes, and dashboard content to local infrastructure, occupant behavior, and educational objectives.
The study also acknowledges limitations. Low-cost sensors require regular recalibration to ensure accuracy. Closed-loop control mechanisms are not yet implemented, and the system depends on at least intermittent internet connectivity for centralized management. Addressing these constraints will be key to broader adoption.
Future work will extend the platform to integrate automated HVAC and lighting control based on occupancy and environmental data, incorporate feedback-driven and gamified interfaces to deepen user engagement, and deploy predictive analytics for anomaly detection and energy optimization. A benchmarking module is planned to enable inter-building comparisons, and the core software, APIs, and templates will be released as open-source to support community development and replication. With these enhancements, the platform aims to transition from monitoring to active management, supporting the development of sustainable and healthy public infrastructures at scale.
