Article

Assessment of 12 Ginsenosides and the Antioxidant Activity of Red Ginseng Sprout Extracts

1
Department of Food Biotechnology and Environmental Science, Kangwon National University, Chuncheon 24341, Republic of Korea
2
Atomy R&D Center, Gongju 32511, Republic of Korea
3
F&B Bio Co., Ltd., Cheonan 31005, Republic of Korea
4
Department of Digital Cooperative Management, Agricultural Cooperative University, Goyang 10292, Republic of Korea
5
College of Food Science and Technology, Guangdong Ocean University, Zhanjiang 524088, China
6
National Research and Development Centre for Egg Processing, College of Food Science and Technology, Huazhong Agricultural University, Wuhan 430070, China
*
Authors to whom correspondence should be addressed.
Appl. Sci. 2025, 15(23), 12467; https://doi.org/10.3390/app152312467
Submission received: 5 November 2025 / Revised: 19 November 2025 / Accepted: 22 November 2025 / Published: 24 November 2025
(This article belongs to the Section Food Science and Technology)

Abstract

This study aimed to establish a high-performance liquid chromatography coupled with photodiode array detection (HPLC–PDA) method for the simultaneous quantification of 12 ginsenosides in red ginseng sprout (RGS) extract produced from smart-farm-cultivated ginseng sprouts and to evaluate its antioxidant activity as part of a quality assessment framework. Twelve representative major and heat-transformed minor ginsenosides were selected to capture the characteristic protopanaxadiol and protopanaxatriol profiles of RGS. Hydroponically cultivated ginseng sprouts were subjected to nine cycles of steaming and drying, followed by pressurized extraction. The total ginsenoside content was 31.54 mg/g, with Re and Rd as the predominant ginsenosides. The extract exhibited a high total phenolic content (7.98 mg gallic acid equivalents per gram) and flavonoid content (4.65 mg rutin equivalents per gram). Antioxidant activity was evaluated using 2,2-diphenyl-1-picrylhydrazyl (DPPH IC50 = 7.88 mg/mL) and 2,2′-azino-bis(3-ethylbenzothiazoline-6-sulfonic acid) (ABTS IC50 = 24.81 mg/mL) radical scavenging assays. Pearson’s correlation analysis revealed strong positive correlations between ginsenosides (Re, Rg2, Rd, and Rh1), phenolic/flavonoid content, and antioxidant activity (R > 0.84, p < 0.01). This study provides an HPLC–PDA platform that achieves baseline-resolved, simultaneous quantification of 12 ginsenosides in RGS and links this compositional profile to antioxidant markers, supporting the quality control of smart-farm-derived ginseng products.

1. Introduction

Conventional red ginseng is produced through multiple cycles of steaming and drying of mature ginseng (Panax ginseng C.A. Meyer) roots to enhance ginsenoside bioactivity. Red ginseng sprouts (RGS) are harvested early during hydroponic cultivation and possess distinct advantages, such as a shorter growth cycle, enhanced reproducibility, and reduced contamination risk [1,2]. In regions such as Korea, where climate change and soil-borne diseases increasingly challenge open-field ginseng cultivation, hydroponic and smart farm systems are emerging as alternative production platforms for ginseng sprouts. Sprouts, including ginseng sprouts, accumulate high levels of antioxidant compounds, such as flavonoids, polyphenols, and saponins, during their early growth stages [3]. RGS, the young shoots of ginseng, have recently gained attention as a valuable source of bioactive phytochemicals [4]. Generally, the concentration of ginsenosides in ginseng roots used for red ginseng production increases with root age and a greater distribution of fine and lateral roots [5]. However, recent studies have reported that ginsenoside content is higher in leaves than in roots cultivated for the same period, with the highest concentration observed in the leaves of one-year-old ginseng plants [6,7]. Taken together, these findings suggest that smart-farm-derived RGS may provide a practical and efficient raw material for ginseng-based functional ingredients.
Ginsenosides, the principal bioactive components of ginseng, are dammarane-type triterpene saponins categorized into two main groups based on their aglycone skeletons: protopanaxadiol (PPD) and protopanaxatriol (PPT) [8,9,10]. Major ginsenosides, such as Rb1, Rc, and Rd (PPD-type), and Rg1 and Re (PPT-type), are commonly found in raw or steamed ginseng roots. Minor ginsenosides, such as Rg3, Rh1, F2, and compound K (CK), are often generated through heat or enzymatic bioconversion and are associated with enhanced bioavailability and pharmacological activity [11,12,13]. These minor ginsenosides have demonstrated antioxidant, anti-inflammatory, and anticancer effects in several studies [14,15]. Structure–activity studies indicate that partial deglycosylation and differences in the number and position of sugar moieties on the PPD or PPT backbone can influence membrane permeability and biological responses, including antioxidant-related effects. Ginseng sprouts have a total saponin content that is approximately six times higher than that of conventional ginseng roots, along with a significantly elevated level of vitamin C [16,17].
High-performance liquid chromatography coupled with photodiode array detection (HPLC-PDA) has been widely adopted to simultaneously analyze ginsenosides owing to its precision and reproducibility [18]. In recent years, advances in HPLC-based ginsenoside analysis have enhanced the detection sensitivity, throughput, and structural depth. For instance, Lin et al. (2025) reviewed the structural diversity and transformation pathways of ginsenosides, highlighting recent methodological optimizations in HPLC detection [19]. Other studies have synergistically combined HPLC-PDA with techniques such as electrospray ionization mass spectrometry (ESI-MS) or ultra-performance liquid chromatography with high-resolution mass spectrometry (UPLC-HRMS) to improve both selectivity and sensitivity in complex botanical matrices [20]. Xu et al. (2020) used flash extraction coupled with HPLC-Fourier-transform ion cyclotron resonance mass spectrometry (FT-ICR-MS) to identify 23 ginsenosides, illustrating how advanced instrumentation can broaden the detection of minor compounds [21]. However, such sophisticated platforms are not always accessible for routine quality control in industrial or agricultural settings, underscoring the need for practical HPLC-PDA-based approaches that can be applied to emerging ginseng materials such as RGS.
Antioxidant activity is commonly assessed using 2,2-diphenyl-1-picrylhydrazyl (DPPH) and 2,2′-azino-bis(3-ethylbenzothiazoline-6-sulfonic acid) (ABTS) radical scavenging assays, which evaluate the free-radical neutralization potential of phytochemicals and are often linked to the polyphenol and flavonoid contents [22]. Recent studies have also advanced our understanding of the antioxidant bioactivity of ginseng following processing. For example, Lee et al. (2024) examined changes in ginsenoside stability and antioxidant properties under different processing (steaming/drying) conditions in red ginseng, showing that optimized processing cycles can preserve antioxidant potency [23]. Other studies on ginseng sprouts or leaves have tracked changes in metabolite profiles (including ginsenosides, phenolics, and flavonoids) along with antioxidant assays, such as radical scavenging and correlation analysis [24].
Despite the increasing interest in RGS, few studies have employed HPLC-PDA methods to simultaneously quantify a broad range of ginsenosides in RGS while also evaluating antioxidant capacity and its relationship with phenolic and flavonoid contents, particularly in the context of smart-farm-derived materials. Therefore, this study aimed to provide a compositional and functional basis for the quality evaluation of smart-farm-derived RGS by quantifying 12 representative ginsenosides using an HPLC-PDA method applicable to simultaneous analysis and by assessing its antioxidant potential through DPPH, ABTS, total phenolic content (TPC), and total flavonoid content (TFC) assays.

2. Materials and Methods

2.1. Chemicals and Sample Preparation

Red ginseng sprout (RGS) samples were produced from hydroponically cultivated ginseng sprouts at F&B Bio Co., Ltd. (Cheonan, Republic of Korea). Ginseng seedlings were grown hydroponically in purified water at 19 ± 1 °C and 70–90% relative humidity. Plants were first maintained in the dark for 5 days and then cultivated under LED illumination for 16–20 days before harvest. Hydroponically cultivated ginseng sprouts were then harvested and separated into stem, root, and leaf portions. The portions were then washed using general- and high-pressure washers, then steamed at 92 ± 2 °C for 1 h, followed by a 30 min resting phase. After steaming, the samples were dried at 60 ± 2 °C for 3 h using a hot-air dryer until the moisture content reached 20–30%. The steaming and drying processes were repeated nine times. The final product was dried to a moisture content of 11–13%.
After nine cycles of steaming and drying, the ginseng sprouts were subjected to pressurized extraction using 50% ethanol (v/v) at a solid/solvent ratio of 1:20 at 105 ± 3 °C for 8 h. The extract was filtered through a mesh screen, concentrated using a vacuum concentrator, and sterilized at 95 ± 3 °C for 35 ± 10 min. The extract was then filtered using a 400-μm filter and stored until analysis.
The RGS extract (2 g) was mixed with 25 mL of distilled water and allowed to stand at room temperature for 1 h. The mixture was transferred to a 50 mL volumetric flask and diluted with 100% methanol. After sonication for 30 min, the solution was filtered and used for HPLC and antioxidant assays.
The standard ginsenosides Rg1, Re, Rh1, Rg2, Rb1, Rd, F1, F2, Rg3(S), CK, Rg5, and Rh2 were purchased from MedChem Express (Monmouth Junction, NJ, USA). Each compound (10 mg) was dissolved in methanol to prepare a 2 mg/mL stock solution. Equal volumes (0.75 mL) of each stock solution were combined in a 10 mL volumetric flask and diluted to volume with methanol to prepare the mixed standard solution.

2.2. HPLC-PDA Analysis of Ginsenosides

Quantification was performed using a Shimadzu LC-40B XR system equipped with an SPD-M40 photodiode array detector (Shimadzu Co., Ltd., Kyoto, Japan). Separation was achieved on a CAPCELL PAK C18 UG120 column (4.6 mm × 250 mm, 5 μm). The mobile phase consisted of solvent A (double-distilled water, DDW) and solvent B (acetonitrile), and ginsenosides were eluted using the following gradient program: 0 min, 80% A; 25 min, 75% A; 80 min, 72% A; 90 min, 65% A; 100 min, 50% A; 110 min, 50% A; 120 min, 35% A; 121 min, 10% A; 122–130 min, 80% A for column re-equilibration. The flow rate was 1.6 mL/min, the injection volume was 10 μL, and the column temperature was 40 °C. PDA spectra were recorded over 190–400 nm, and quantification was carried out at 203 nm. The detailed experimental conditions are listed in Table S1.
The mixed standard solution was diluted with methanol to final concentrations of 10, 25, 50, 100, and 150 μg/mL. Calibration curves were obtained by plotting peak areas against concentrations, and linearity was evaluated using correlation coefficients (R2).

2.3. Determination of the Total Polyphenol and Flavonoid Content

The TPC was determined using the Folin–Ciocalteu method [25]. Briefly, 1 mL of sample was mixed with 2% Folin–Ciocalteu reagent and 10% Na2CO3 in a 1:1:1 ratio. After 1 h at room temperature, the absorbance was measured at 750 nm using a microplate reader (Spectramax i3, Molecular Devices, Sunnyvale, CA, USA). The results are expressed as milligrams of gallic acid equivalents per gram (mg GAE/g).
The TFC was assessed by mixing 0.5 mL of the sample with 1.5 mL of 95% ethanol, 0.1 mL of 10% aluminum nitrate, 0.1 mL of 1 M potassium acetate, and 2.8 mL of distilled water. After 30 min of incubation at 25 °C, the absorbance was recorded at 415 nm. The results are expressed as milligrams of rutin equivalents per gram (mg RE/g).

2.4. DPPH Radical Scavenging Activity

To measure the DPPH radical scavenging activity, 200 μL of the sample was mixed with 800 μL of 0.4 mM DPPH solution. After 10 min of incubation in the dark, the absorbance was measured at 517 nm. The DPPH radical-scavenging activity was calculated using the following equation, and the results were expressed as the half-maximal inhibitory concentration (IC50).
DPPH radical-scavenging activity (%) = (Ablank − Asample)/Ablank × 100
where Ablank and Asample denote the absorbance of the control (blank) and the sample solution, respectively.

2.5. ABTS Radical Scavenging Activity

ABTS radicals were generated by incubating 7 mM ABTS with 2.45 mM potassium persulfate (2:1, v/v) in the dark for 16 h. The mixture was diluted with ethanol (1:88, v/v) before use. Ten microliters of the sample were added to 1 mL of diluted ABTS solution and allowed to react for 6 min in the dark. The absorbance was measured at 734 nm. The ABTS radical-scavenging activity was calculated using the same equation as in the DPPH assay (Equation (1)), and the results were expressed as the IC50.
For both DPPH and ABTS assays, antioxidant activity was expressed as IC50, defined as the sample concentration required to scavenge 50% of the radicals. IC50 values were obtained from concentration–response curves by regression analysis of radical-scavenging activity (%) versus sample concentration.

2.6. Statistical Analysis

All measurements were conducted in triplicate and are presented as the mean ± standard deviation (SD). Statistical differences among multiple groups were analyzed using Duncan’s multiple range test at p < 0.05, whereas pairwise comparisons of DPPH and ABTS radical scavenging activities between the RGS extract and ascorbic acid were performed using Student’s t-test. Pearson correlation coefficients were calculated to evaluate the relationships among variables. All statistical analyses were carried out using SPSS 24.0 (IBM Corp., Armonk, NY, USA).

3. Results

3.1. Qualitative Analysis of Ginsenoside Standards and Mixed Solutions

Twelve ginsenosides (Rg1, Re, Rh1, Rg2, Rb1, F1, Rd, F2, Rg3(S), CK, Rg5, and Rh2) were selected for simultaneous analysis. Peaks of the mixed standard solution were observed at 23.75, 24.78, 58.68, 60.37, 80.71, 83.36, 93.64, 99.59, 101.87, 110.31, 111.46, and 113.44 min. A comparison with standard chromatograms showed that the retention times of the individual ginsenosides were consistent, indicating reliable chromatographic separation and identification (Figure 1, Figures S1 and S2).

3.2. Quantitative Analysis of Ginsenosides in RGS Extract

The mixed standard solution was diluted to five concentrations (10–150 μg/mL) for calibration. The R2 for all ginsenosides exceeded 0.9994, indicating high linearity (Table 1).
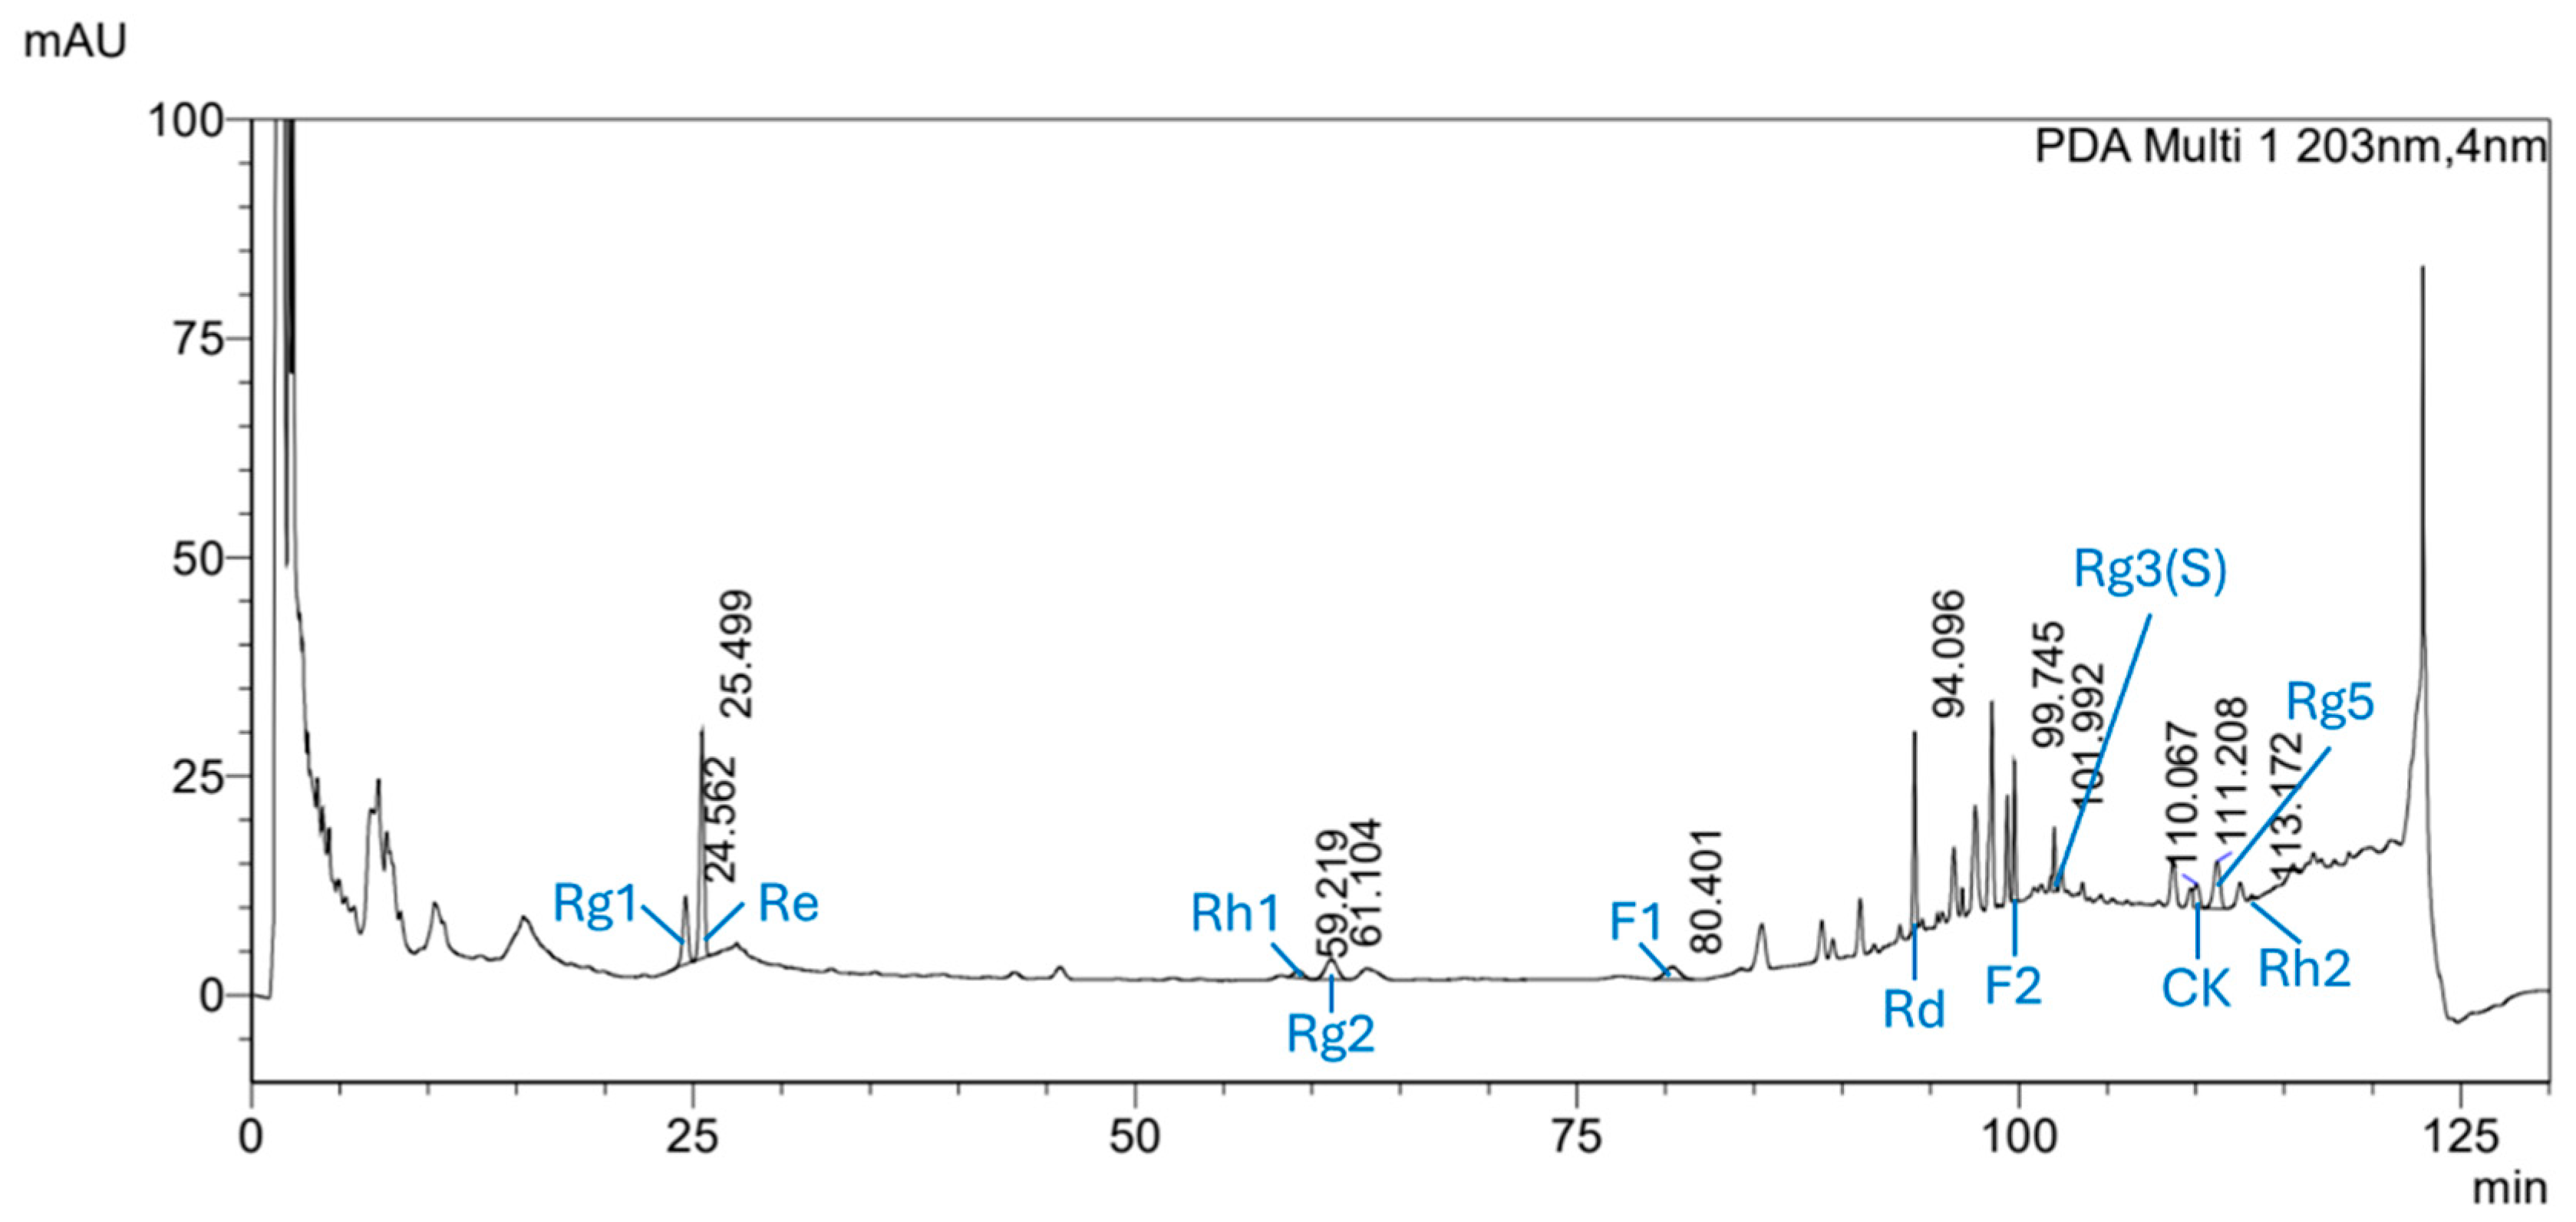
As shown in Figure 2 and Figure S3 and Table 2, the total ginsenoside content of the RGS extract was 31.54 ± 0.22 mg/g, with Re and Rd as the predominant components. These results indicate that the developed HPLC-PDA method can be applied to the simultaneous determination of 12 ginsenosides in RGS extract; however, further studies, including reproducibility and recovery assessments, are warranted to enhance analytical validation.

3.3. Total Polyphenol, Flavonoid Content and Antioxidant Activity

The TPC and TFC of the RGS extract were 7.98 ± 0.03 mg GAE/g and 4.65 ± 0.02 mg RE/g, respectively (Table 3).
Antioxidant capacity was assessed using DPPH and ABTS radical scavenging assays. The IC50 values for the RGS extract were 7.88 ± 0.01 mg/mL (DPPH) and 24.81 ± 0.05 mg/mL (ABTS) (Table 4). The results indicated that the samples followed the trend of DPPH > ABTS. Ascorbic acid, used as a positive control, exhibited much stronger activity (DPPH: 0.03 ± 0.00 μg/mL; ABTS: 0.42 ± 0.01 μg/mL).

3.4. Correlation Analysis

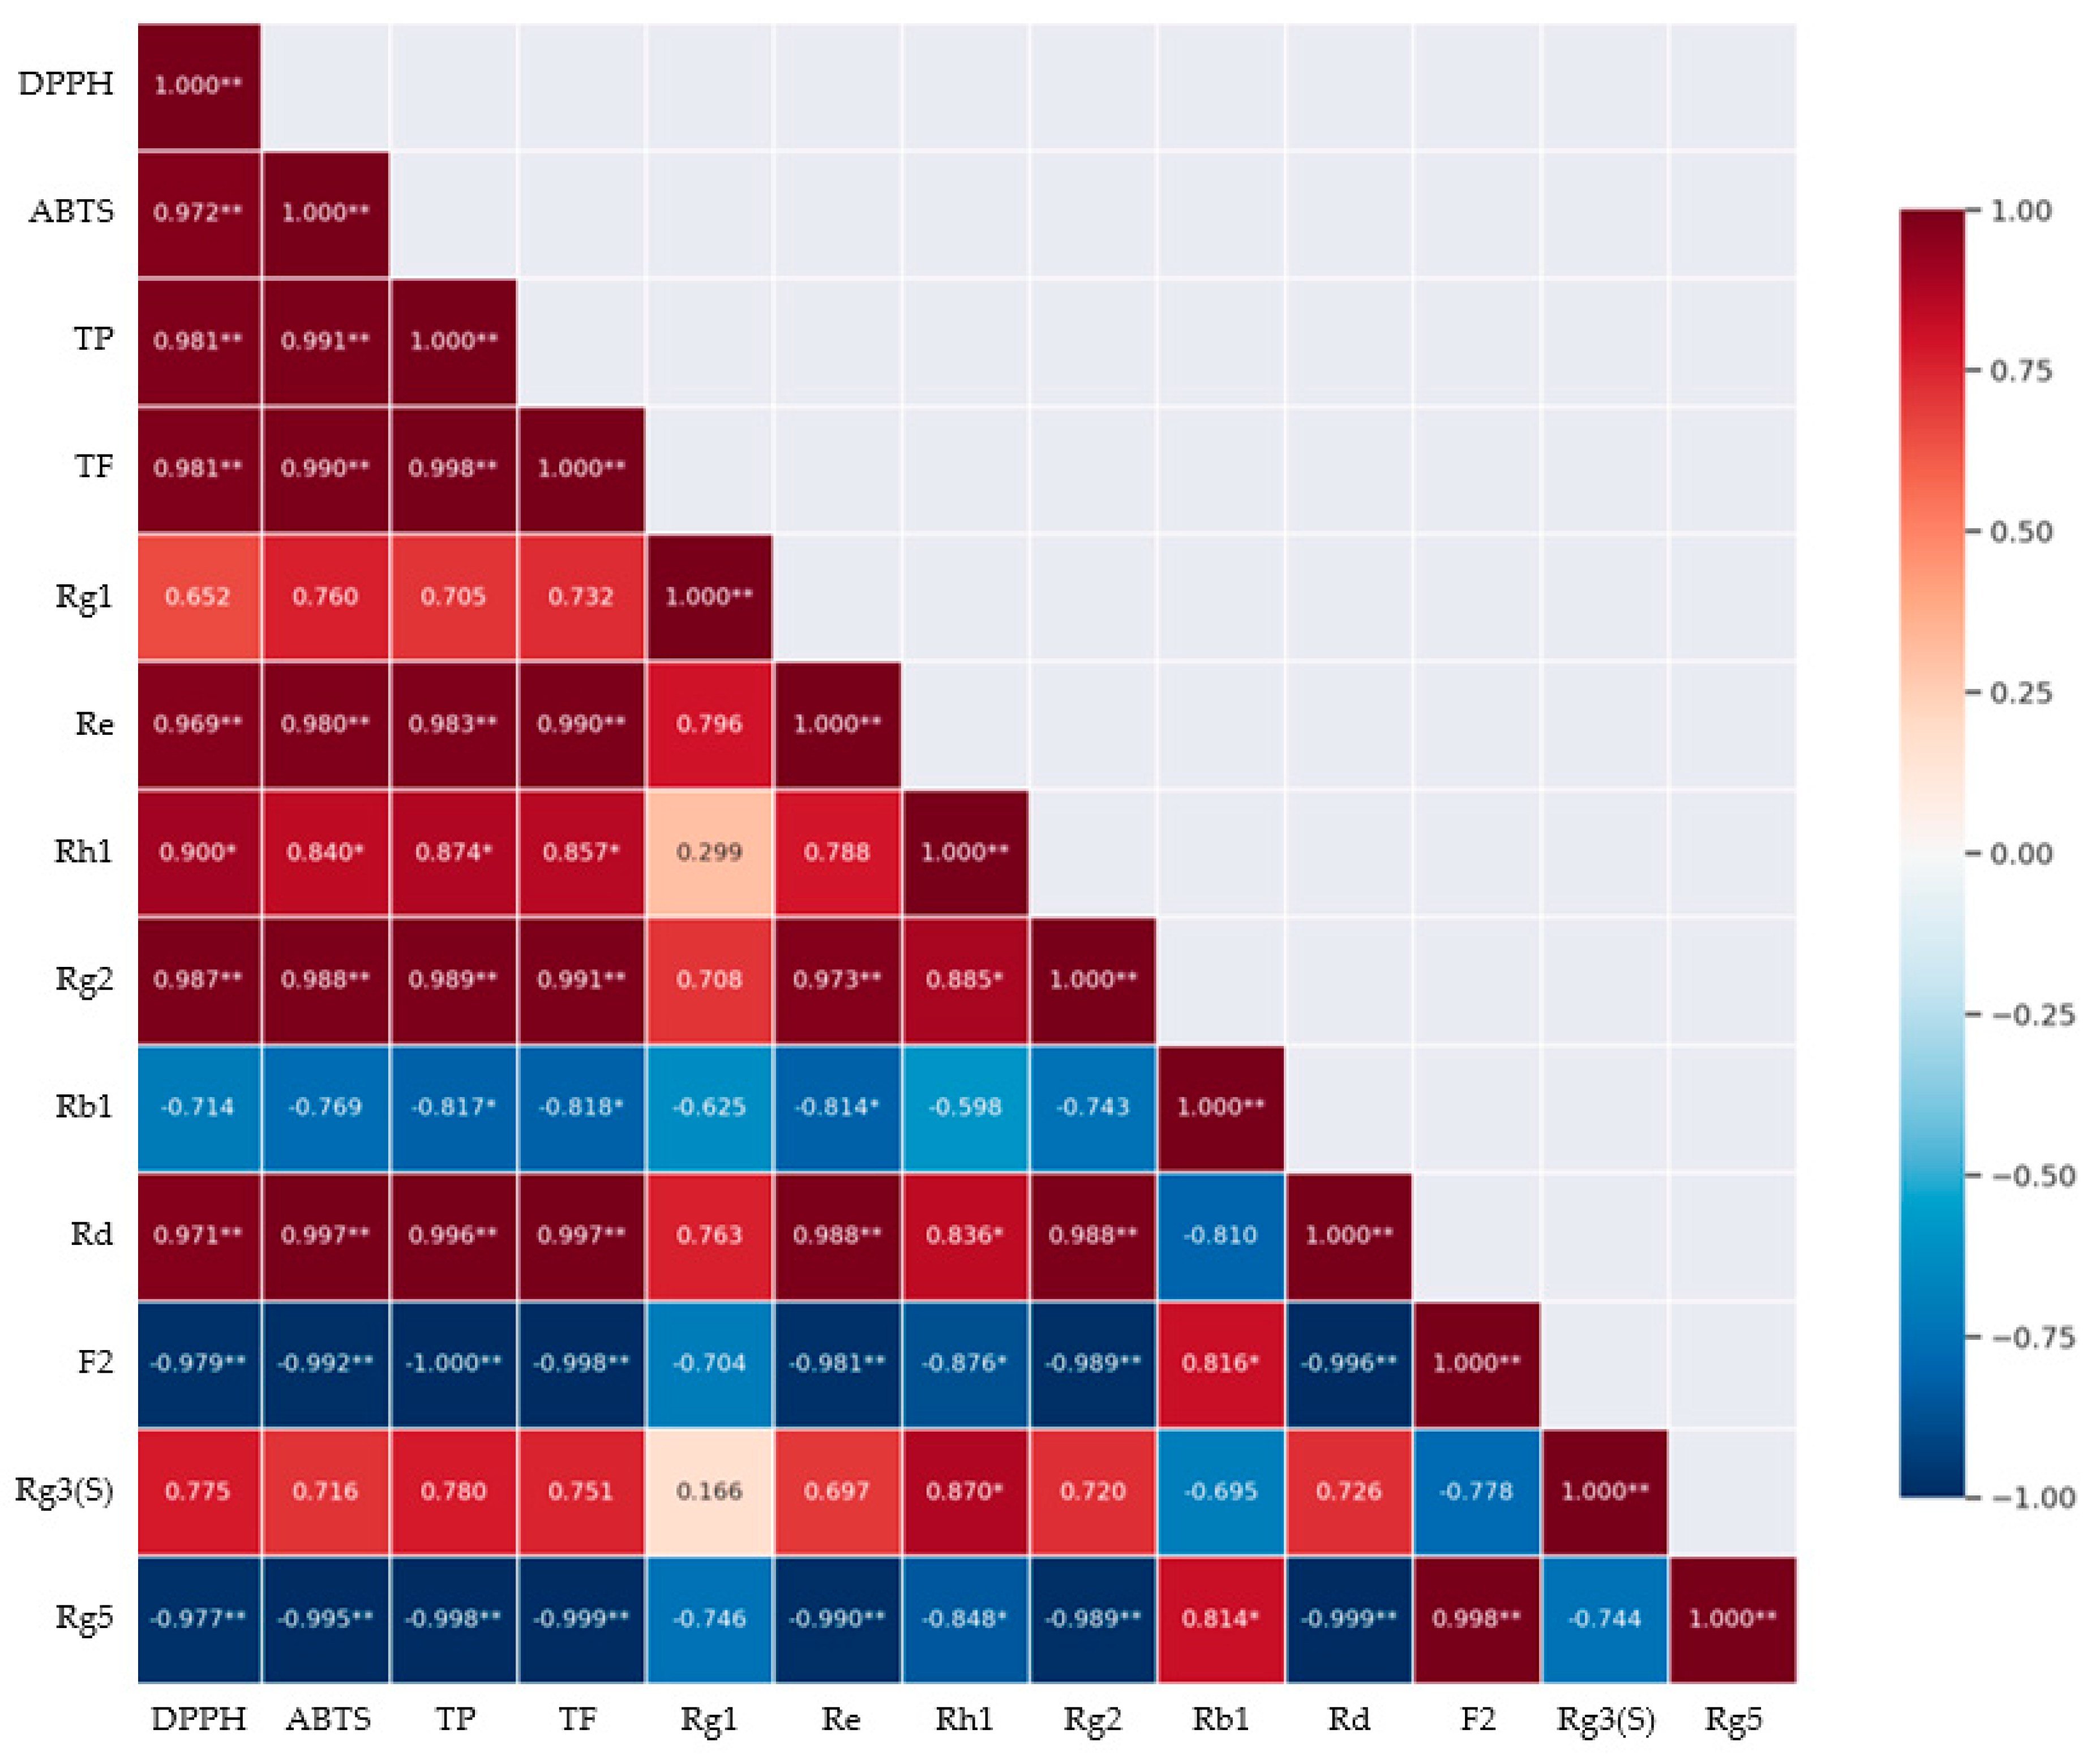
A heatmap of the Pearson correlation coefficients is shown in Figure 3. F1 was N.D. in the RGS extract, whereas ginsenoside CK and Rh2 were detected at the TR level; therefore, these compounds were excluded from the analysis. Strong positive correlations were observed among the antioxidant markers (TPC, TFC, DPPH, and ABTS), with R > 0.972 and p < 0.01. The TPC and TFC were highly significantly correlated (R = 0.998), supporting the close correlation between polyphenols, flavonoids, and antioxidant capacity.
Among the ginsenosides, Re, Rh1, Rg2, and Rd showed strong positive correlations (R > 0.840, p < 0.05) with antioxidant indicators. Ginsenoside Rg3(S) and Rg1 showed moderately positive correlations (R > 0.652). In contrast, ginsenoside F2, Rb1, and Rg5 exhibited negative correlations (R < −0.714), suggesting limited or opposing contributions to antioxidant capacity. The antioxidant markers formed a distinct cluster, whereas the ginsenosides were grouped according to their correlation strength and direction.

4. Discussion

HPLC-PDA methods are widely employed in laboratories because of their accessibility, low cost, and operational simplicity [26]. However, these methods exhibit inherent limitations when applied to multi-ginsenoside analysis, including low detection sensitivity for ginsenosides with weak ultraviolet (UV) absorption, long chromatographic run times, and difficulties in resolving isomeric or closely eluting compounds within complex botanical matrices [27]. For instance, many ginsenosides exhibit weak UV chromophores, which often result in high baseline noise and limited flexibility in solvent or modifier selection during UV detection [28]. Furthermore, because most ginsenosides share similar chemical structures, such as ginsenoside Rg1 and Re, the complete separation of individual peaks is often challenging [29]. In contrast, several studies utilizing UPLC-PDA systems have partially overcome these limitations. For example, Park et al. (2013) reported a method capable of simultaneously analyzing 30 ginsenosides within 40 min [30]. However, most previous HPLC-PDA methods have analyzed a smaller number of ginsenosides and have shown limited separation efficiency [18,29,31]. In a previously reported 90-min HPLC method for the quantification of 12 ginsenosides, the peaks of isomeric pairs such as Rg1/Re and Rh1/Rg2 were not completely resolved [18]. In contrast, in the present study, we optimized the gradient elution profile to enhance the resolution. Specifically, a shallower gradient was applied during the 0–25 min interval to achieve a clear separation between Rg1 and Re. From 25 to 80 min, the gradient slope was further reduced, and the analysis time was prolonged, which slowed the elution of mid-polarity ginsenosides, enabling the baseline separation of Rh1/Rg2 and F1/Rb1. Despite the extended total runtime of approximately 130 min, all 12 target ginsenosides were separated at baseline levels, demonstrating superior resolution and reproducibility compared to previously reported HPLC-PDA methods.
The developed HPLC-PDA method successfully quantified 12 ginsenosides in RGS extract with high reproducibility and linearity (R2 > 0.999). Re and Rd were the predominant ginsenosides, consistent with previous reports identifying Re as the major compound in young ginseng tissues [32]. In ginseng, the major ginsenosides, including Rb1, Rd, Re, and Rg1, generally comprise over 80% of the total ginsenoside content, whereas deglycosylated minor compounds, such as F1, F2, Rh1, Rh2, Rg3, and CK, tend to be present at minimal concentrations or may even be undetectable under standard analytical conditions [33]. Therefore, future research should focus on optimizing cultivation, elicitation, and postharvest processing strategies to enhance the biosynthesis or conversion of these minor ginsenosides, which are known for their higher bioavailability, and on performing more comprehensive validation to further strengthen the analytical robustness of this method.
The TPC and TFC values of the RGS extract (7.98 ± 0.03 mg GAE/g and 4.65 ± 0.02 mg RE/g, respectively) were relatively higher than those of other sprout-based materials. When compared with literature values for sprouts of other crops such as barley, buckwheat, broccoli, radish, and alfalfa, RGS extract exhibited higher TPC and TFC (7.98 mg GAE/g and 4.65 mg RE/g, respectively), whereas barley, buckwheat, broccoli, radish, and alfalfa sprouts showed TPCs of 3.85 mg GAE/g [34], 6.1 mg GAE/g [35], 5.8 mg GAE/g [36], 5.2 mg GAE/g [35], and 3.9 mg GAE/g [36], respectively. Furthermore, previous studies on white and red ginseng roots have generally reported total phenolic contents of approximately 3–6 mg GAE/g under conventional processing conditions, with higher values observed only after high-temperature or subcritical water treatments [37,38]. Thus, the TPC of RGS observed in this study (7.98 mg GAE/g) can be considered comparable to or greater than that of traditionally processed ginseng roots, despite being obtained under relatively mild extraction conditions.
Regarding antioxidant activity, RGS demonstrated the lowest DPPH radical scavenging IC50 value of 7.88 mg/mL, suggesting a stronger radical scavenging capacity than barley (9.5 mg/mL), buckwheat (8.6 mg/mL), broccoli (8.8 mg/mL), radish (9.1 mg/mL), and alfalfa (10.2 mg/mL) sprouts, although such comparisons should be interpreted with caution due to differences in experimental conditions among studies [35,36,39].
In the ABTS radical scavenging assay, RGS showed a lower IC50 value (24.81 mg/mL) than barley (30.8 mg/mL), buckwheat (27.5 mg/mL), broccoli (28.7 mg/mL), radish (29.1 mg/mL), and alfalfa (32.4 mg/mL) sprouts, indicating a relatively high antioxidant potential in comparison with these reported values [35,36,39]. The accumulation of phenolics in sprouts has been linked to stress response pathways activated during the early growth stages, making them valuable functional ingredients [40]. Phenolic compounds and flavonoids typically possess multiple hydroxyl groups and conjugated aromatic rings, which facilitate hydrogen atom transfer and single-electron transfer mechanisms and stabilize radical species such as DPPH· and ABTS·+ [41,42]. These structural features provide a mechanistic basis for their strong contribution to the overall radical-scavenging capacity of RGS. In addition, the flavanol content of sprout ginseng ranged from 272.35 to 338.6 μg/g, depending on the processing period [43]. This increase is likely attributable to the nine cycles of repeated steaming and drying involved in producing sprout red ginseng.
Efforts to identify antioxidant compounds and natural substances capable of scavenging reactive oxygen species (ROS) from food sources have been ongoing for several decades. Given that antioxidant activity involves complex mechanisms influenced by various factors, this property cannot be fully explained using a single analytical method [44]. Therefore, multiple assays evaluating different aspects of antioxidant capacity are essential to comprehensively elucidate the underlying mechanisms of antioxidant action [45]. Pearson’s correlation analysis revealed strong positive correlations among TPC, TFC, and antioxidant activity, supporting the important role of phenolic and flavonoid compounds in radical scavenging. This finding is consistent with studies on Gynura divaricata leaf extracts, where phenolic concentration was positively correlated with antioxidant responses [46]. Furthermore, individual ginsenosides, such as Rg2, Rh1, and Rd, were significantly correlated with DPPH and ABTS scavenging activities (R > 0.8, p < 0.05), suggesting their possible contribution to the overall antioxidant effect. Previous studies have shown that several ginsenosides can attenuate oxidative stress not only through direct radical scavenging but also by modulating endogenous antioxidant defenses, including Nrf2-dependent pathways and antioxidant enzymes, such as superoxide dismutase and catalase [47,48]. Differences in aglycone type (PPD vs. PPT) and the number and position of sugar moieties may also influence the polarity and membrane affinity of ginsenosides, thereby affecting their interactions with radical species and redox-sensitive cellular targets [49].
The superior antioxidant capacity observed in the RGS extract is likely associated with its high TPC, TFC, and ginsenoside concentrations. Previous studies have demonstrated that specific ginsenosides, such as Rg3 and Rb1, exhibit strong positive correlations with DPPH and ABTS radical scavenging activities [50]. Morshed et al. (2023) reported that ginsenosides contribute more significantly to the antioxidant activities of ginseng extracts than phenolic compounds [48]. In this study, RGS exhibited substantially lower IC50 values in both the DPPH and ABTS assays compared to the other sprouts, which may be attributed to the synergistic effects of major ginsenosides (Re, Rd, and Rg2) and minor ginsenosides accumulated during the steaming and drying processes, along with phenolic constituents. Therefore, the remarkable antioxidant activity of RGS is suggested to result from the combined influence of phenolic compounds and bioactive ginsenosides, rather than from phenolic content alone. Although DPPH and ABTS assays are widely used for the rapid screening of antioxidant activity, they are cell-free chemical tests that primarily reflect direct radical scavenging under specific conditions. Future cell-based or in vivo studies are required to confirm the physiological relevance of the observed effects.
The present study underscores the importance of correlation analysis in identifying marker compounds that drive biological activity. Such approaches are increasingly utilized in phytochemical research to connect chemical profiles to functional outcomes and are valuable for selecting quality indicators for smart-farm-derived ginseng products, such as RGS.

5. Conclusions

In this study, we established an HPLC–PDA method for the simultaneous quantification of 12 ginsenosides in red ginseng sprout (RGS) extract. The optimized gradient elution program afforded baseline separation of closely related ginsenosides, such as Rg1/Re and Rh1/Rg2, and produced linear calibration curves with correlation coefficients (R2 > 0.9994) over the tested range, indicating that the method is suitable for the quantitative profiling of ginsenosides in RGS. The RGS extract showed total phenolic and flavonoid contents and in vitro DPPH and ABTS radical-scavenging activities within the upper range of values reported for edible sprouts. Correlation analysis suggested that specific ginsenosides (Re, Rg2, and Rd), along with phenolic and flavonoid contents, are closely associated with the observed antioxidant responses, supporting their use as candidate marker compounds for evaluating the quality of smart-farm-derived RGS. These compositional and functional data provide a basis for applying the proposed method to the quality control and standardization of RGS and related ginseng products in functional food or phytopharmaceutical contexts. This study had several methodological limitations. Full validation parameters, including intra- and inter-day precision, recovery, and matrix effects, were not comprehensively assessed, and antioxidant activity was evaluated only by cell-free DPPH and ABTS assays without Trolox-equivalent expression or in vivo confirmation. Therefore, the antioxidant results should be interpreted as chemical screening data, and future studies should extend the validation and investigate the biological efficacy of RGS in cell and animal models to support the broader application of this method in routine quality control.

Supplementary Materials

The following supporting information can be downloaded at https://www.mdpi.com/article/10.3390/app152312467/s1. Table S1: HPLC-PDA condition for ginsenoside analysis; Figure S1: HPLC chromatogram of ginsenoside standards; Figure S2: UV spectrum of ginsenoside standards; Figure S3: UV spectra of RGS extract.

Author Contributions

Conceptualization, D.-S.L. and J.-H.I.; methodology, S.W. and I.-J.L.; software, G.O., J.-H.I., and Y.-S.S.; validation, J.-S.L. and Y.-S.S.; formal analysis, J.-W.C. and J.-S.L.; investigation, X.F. (Xiaolu Fu), M.-H.K., and S.W.; resources, D.-S.L.; data curation, S.W.P., X.F. (Xiaolu Fu), and X.F. (Xing Fu); writing—original draft preparation, G.O.; writing—review and editing, O.-H.L.; visualization, S.W.P., M.-H.K., and X.F. (Xing Fu); supervision, I.-J.L.; project administration, O.-H.L.; funding acquisition, J.-W.C. All authors have read and agreed to the published version of the manuscript.

Funding

This research was supported by the 2024 Research Grant from the Atomy R&D Center, the Basic Science Research Program (RS-2021-NR060130, NRF-2017R1D1A3B06028469), and the BK21 FOUR program (Grant No. 4299990913942) through the National Research Foundation of Korea (NRF), funded by the Ministry of Education (MOE, Republic of Korea).

Institutional Review Board Statement

Not applicable.

Informed Consent Statement

Not applicable.

Data Availability Statement

The original contributions presented in the study are included in the article/supplementary material, further inquiries can be directed to the corresponding author.

Conflicts of Interest

Im-Joung La and Do-Sang Lee were employed by the Atomy R&D Center, and Jong-Woo Chae was employed by F&B Bio Co., Ltd. The remaining authors declare that the research was conducted in the absence of any commercial or financial relationships that could be construed as potential conflicts of interest.

References

  1. Kim, J.H. Pharmacological and medical applications of Panax ginseng and ginsenosides: A review for use in cardiovascular diseases. J. Ginseng Res. 2018, 42, 264–269. [Google Scholar] [CrossRef]
  2. Je, J.; Kim, H.; Park, E.J.; Kim, S.R.; Dusabimana, T.; Jeong, K.; Yun, S.P.; Kim, H.J.; Cho, K.M.; Park, S.W. Fermentation of sprouted ginseng (Panax ginseng) increases flavonoid and phenolic contents to attenuate alcoholic hangover and acute liver injury in mice. Am. J. Chin. Med. 2021, 49, 131–146. [Google Scholar] [CrossRef] [PubMed]
  3. Baenas, N.; García-Viguera, C.; Moreno, D.A. Elicitation: A tool for enriching the bioactive composition of foods. Molecules 2014, 19, 13541–13563. [Google Scholar] [CrossRef]
  4. Chen, F.; Luo, J.-G.; Kong, L. Determination of 10 ginsenosides in Panax ginseng of different harvest times based on HPLC fingerprints and principal component analysis. Nat. Prod. Res. 2013, 27, 851–854. [Google Scholar] [CrossRef] [PubMed]
  5. Kim, Y.J.; Nguyen, T.K.L.; Oh, M.M. Growth and ginsenosides content of ginseng sprouts according to LED-based light quality changes. Agronomy 2020, 10, 1979. [Google Scholar] [CrossRef]
  6. Li, X.G.; Yan, Y.Z.; Jin, X.; Kim, Y.K.; Uddin, M.R.; Kim, Y.B.; Bae, H.; Kim, Y.C.; Lee, S.W.; Park, S.U. Ginsenoside content in the leaves and roots of Panax ginseng at different ages. Life Sci. 2012, 9, 670–683. [Google Scholar]
  7. Kim, G.S.; Hyun, D.Y.; Kim, Y.O.; Lee, S.E.; Kwon, H.; Cha, S.W.; Park, C.B.; Kim, Y.B. Investigation of ginsenosides in different parts of Panax ginseng cultured by hydroponics. Korean J. Hortic. Sci. Technol. 2010, 28, 216–226. [Google Scholar]
  8. Zhang, L.; Gao, X.; Yang, C.; Liang, Z.; Guan, D.; Yuan, T.; Qi, W.; Zhao, D.; Li, X.; Dong, H.; et al. Structural characters and pharmacological activity of protopanaxadiol-type saponins and protopanaxatriol-type saponins from ginseng. Adv. Pharmacol. Pharm. Sci. 2024, 2024, 9096774. [Google Scholar] [CrossRef]
  9. Yang, W.Z.; Shi, X.J.; Yao, C.L.; Huang, Y.; Hou, J.J.; Han, S.M.; Feng, Z.J.; Wei, W.L.; Wu, W.Y.; Guo, D.A. A novel neutral loss/product ion scan-incorporated integral approach for the untargeted characterization and comparison of the carboxyl-free ginsenosides from Panax ginseng, Panax quinquefolius, and Panax notoginseng. J. Pharm. Biomed. Anal. 2020, 177, 112813. [Google Scholar] [CrossRef]
  10. Piao, X.M.; Huo, Y.; Kang, J.P.; Mathiyalagan, R.; Zhang, H.; Yang, D.U.; Kim, M.; Yang, D.C.; Kang, S.C.; Wang, Y.P. Diversity of ginsenoside profiles produced by various processing technologies. Molecules 2020, 25, 4390. [Google Scholar] [CrossRef]
  11. Shin, B.K.; Kwon, S.W.; Park, J.H. Chemical diversity of ginseng saponins from Panax ginseng. J. Ginseng Res. 2015, 39, 287–298. [Google Scholar] [CrossRef]
  12. Attele, A.S.; Wu, J.A.; Yuan, C.S. Ginseng pharmacology: Multiple constituents and multiple actions. Biochem. Pharmacol. 1999, 58, 1685–1693. [Google Scholar] [CrossRef]
  13. Christensen, L.P. Ginsenosides chemistry, biosynthesis, analysis, and potential health effects. In Advances in Food and Nutrition Research; Elsevier: Amsterdam, The Netherlands, 2009; Volume 55, pp. 1–99. [Google Scholar] [CrossRef]
  14. Liu, C.X.; Xiao, P.G. Recent advances on ginseng research in China. J. Ethnopharmacol. 1992, 36, 27–38. [Google Scholar] [CrossRef] [PubMed]
  15. Kim, D.H. Chemical diversity of Panax ginseng, Panax quinquifolium, and Panax notoginseng. J. Ginseng Res. 2012, 36, 1–15. [Google Scholar] [CrossRef]
  16. Shi, W.; Wang, Y.; Li, J.; Zhang, H.; Ding, L. Investigation of ginsenosides in different parts and ages of Panax ginseng. Food Chem. 2007, 102, 664–668. [Google Scholar] [CrossRef]
  17. Jang, I.B.; Yu, J.; Suh, S.J.; Jang, I.B.; Kwon, K.B. Growth and ginsenoside content in different parts of ginseng sprouts depending on harvest time. Korean J. Med. Crop Sci. 2018, 26, 205–213. [Google Scholar] [CrossRef]
  18. In, G.; Ahn, N.G.; Bae, B.S.; Han, S.T.; Noh, K.B.; Kim, C.S. New method for simultaneous quantification of 12 ginsenosides in red ginseng powder and extract: In-house method validation. J. Ginseng Res. 2012, 36, 205–210. [Google Scholar] [CrossRef]
  19. Lin, L.; Liu, S.; Zhao, Y. Research progress of HPLC detection and analysis of ginseng rare saponins. J. Food Compos. Anal. 2025, 137, 106960. [Google Scholar] [CrossRef]
  20. Hsu, B.Y.; Jen, C.T.; Inbaraj, B.S.; Chen, B.H. A comparative study on analysis of ginsenosides in American ginseng root residue by HPLC-DAD-ESI-MS and UPLC-HRMS-MS/MS. Molecules 2022, 27, 3071. [Google Scholar] [CrossRef] [PubMed]
  21. Xu, L.; Xu, J.; Shi, G.; Xiao, S.; Dai, R.; Wu, S.; Sun, B.; Zhang, X.; Zhao, Y. Optimization of flash extraction, separation of ginsenosides, identification by HPLC-FT-ICR-MS and determination of rare ginsenosides in mountain cultivated ginseng. RSC Adv. 2020, 10, 44050–44057. [Google Scholar] [CrossRef]
  22. Sies, H. Oxidative stress: A concept in redox biology and medicine. Redox Biol. 2015, 4, 180–183. [Google Scholar] [CrossRef]
  23. Lee, K.Y.; Shim, S.L.; Jang, E.S.; Choi, S.G. Ginsenoside stability and antioxidant activity of Korean red ginseng (Panax ginseng CA meyer) extract as affected by temperature and time. LWT 2024, 200, 116205. [Google Scholar] [CrossRef]
  24. Lee, H.Y.; Cho, D.Y.; Kim, D.H.; Park, J.H.; Jeong, J.B.; Jeon, S.H.; Lee, J.H.; Ko, E.J.; Cho, K.M.; Lee, J.H. Examining the alterations in metabolite constituents and antioxidant properties in mountain-cultivated ginseng (Panax ginseng CA Meyer) organs during a two-month maturation period. Antioxidants 2024, 13, 612. [Google Scholar] [CrossRef]
  25. Duval, B.; Shetty, K. The stimulation of phenolics and antioxidant activity in pea (Pisum sativum) elicited by genetically transformed anise root extract. J. Food Biochem. 2001, 25, 361–377. [Google Scholar] [CrossRef]
  26. Yang, Y.; Ju, Z.; Yang, Y.; Zhang, Y.; Yang, L.; Wang, Z. Phytochemical analysis of Panax species: A review. J. Ginseng Res. 2021, 45, 1–21. [Google Scholar] [CrossRef]
  27. Zhao, N.; Liu, S.; Xing, J.; Pi, Z.; Song, F.; Liu, Z. Trace determination and characterization of ginsenosides in rat plasma through magnetic dispersive solid-phase extraction based on core-shell polydopamine-coated magnetic nanoparticles. J. Pharm. Anal. 2020, 10, 86–95. [Google Scholar] [CrossRef]
  28. Baek, S.H.; Bae, O.N.; Park, J. Recent methodology in ginseng analysis. J. Ginseng Res. 2012, 36, 119. [Google Scholar] [CrossRef]
  29. Shi, Y.; Sun, C.; Zheng, B.; Li, Y.; Wang, Y. Simultaneous determination of nine ginsenosides in functional foods by high performance liquid chromatography with diode array detector detection. Food chem. 2010, 123, 1322–1327. [Google Scholar] [CrossRef]
  30. Park, H.W.; In, G.; Han, S.T.; Lee, M.W.; Kim, S.Y.; Kim, K.T.; Cho, B.G.; Han, G.H.; Chang, I.M. Simultaneous determination of 30 ginsenosides in Panax ginseng preparations using ultra performance liquid chromatography. J. Ginseng Res. 2013, 37, 457. [Google Scholar] [CrossRef]
  31. Thu, D.T.; Anh, N.T.K.; Phuong, N.T.T.; Hanh, N.T.H.; Đat, N.T. Simultaneous determination of notoginsenoside R1 and ginsenosides Rg1, Re, Rb1 in dietary supplements by HPLC-DAD. Vietnam. J. Food Control 2021, 4, 160–170. [Google Scholar]
  32. Choi, J.; Kim, J.; Yoon, H.I.; Son, J.E. Effect of far-red and UV-B light on the growth and ginsenoside content of ginseng (Panax ginseng C.A. Meyer) sprouts aeroponically grown in plant factories. Hortic. Environ. Biotechnol. 2022, 63, 77–87. [Google Scholar] [CrossRef]
  33. Kim, S.Y.; Lee, H.N.; Hong, S.J.; Kang, H.J.; Cho, J.Y.; Kim, D.; Ameer, K.; Kim, Y.M. Enhanced biotransformation of the minor ginsenosides in red ginseng extract by Penicillium decumbens β-glucosidase. Enzym. Microb. Technol. 2022, 153, 109941. [Google Scholar] [CrossRef] [PubMed]
  34. Kim, G.S.; Yang, K.H.; Kim, H.K.; Kim, J.E.; Yun, H.N.; Yu, J.W.; Kim, B.S. Antioxidant and immunomodulatory effect of lactic acid bacteria fermented barley sprout hot water extract. J. Korean Soc. Food Sci. Nutr. 2022, 51, 1027–1035. [Google Scholar] [CrossRef]
  35. Liu, H.Y.; Liu, Y.; Li, M.Y.; Ge, Y.Y.; Geng, F.; He, X.Q.; Xia, Y.; Guo, B.L.; Gan, R.Y. Antioxidant capacity, phytochemical profiles, and phenolic metabolomics of selected edible seeds and their sprouts. Front. Nutr. 2022, 9, 1067597. [Google Scholar] [CrossRef]
  36. Ebert, A.W. Sprouts and microgreens—Novel food sources for healthy diets. Plants 2022, 11, 571. [Google Scholar] [CrossRef]
  37. Jung, K.H.; Hong, H.D.; Cho, C.W.; Lee, M.Y.; Choi, U.k.; Kim, Y.C. Phenolic acid composition and antioxidative activity of red ginseng prepared by high temperature and high pressure process. Korean J. Food Nutr. 2012, 25, 827–832. [Google Scholar] [CrossRef]
  38. Lee, J.H.; Ko, M.J.; Chung, M.S. Subcritical water extraction of bioactive components from red ginseng (Panax ginseng CA Meyer). J. Supercrit. Fluids 2018, 133, 177–183. [Google Scholar] [CrossRef]
  39. Oh, G.; La, I.J.; Lee, D.S.; Chae, J.W.; Im, J.H.; Park, S.W.; Fu, X.; Lim, J.S.; Kim, M.H.; Seong, Y.S.; et al. Assessment of bioactive compounds and antioxidant activity of barley sprouts. Separations 2025, 12, 68. [Google Scholar] [CrossRef]
  40. Randhir, R.; Lin, Y.T.; Shetty, K. Stimulation of phenolics, antioxidant and antimicrobial activities in dark germinated mung bean sprouts in response to peptide and phytochemical elicitors. Process Biochem. 2004, 39, 637–646. [Google Scholar] [CrossRef]
  41. Zeb, A. Concept, mechanism, and applications of phenolic antioxidants in foods. J. Food Biochem. 2020, 44, e13394. [Google Scholar] [CrossRef]
  42. Leopoldini, M.; Marino, T.; Russo, N.; Toscano, M. Antioxidant properties of phenolic compounds: H-atom versus electron transfer mechanism. J. Phys. Chem. A 2004, 108, 4916–4922. [Google Scholar] [CrossRef]
  43. Seong, J.A.; Lee, H.Y.; Kim, S.C.; Cho, D.Y.; Jung, J.G.; Kim, M.J.; Lee, A.R.; Jeong, J.B.; Son, K.H.; Cho, K.M. Changes of nutritional constituents and antioxidant activities by the growth periods of produced ginseng sprouts in plant factory. J. Appl. Biol. Chem. 2022, 65, 129–142. [Google Scholar] [CrossRef]
  44. El Jemli, M.; Kamal, R.; Marmouzi, I.; Zerrouki, A.; Cherrah, Y.; Alaoui, K. Radical-scavenging activity and ferric reducing ability of Juniperus thurifera (L.), J. oxycedrus (L.), J. phoenicea (L.) and Tetraclinis articulata (L.). Adv. Pharmacol. Pharm. Sci. 2016, 2016, 6392656. [Google Scholar] [CrossRef]
  45. Schlesier, K.; Harwat, M.; Böhm, V.; Bitsch, R. Assessment of antioxidant activity by using different in vitro methods. Free Radic. Res. 2002, 36, 177–187. [Google Scholar] [CrossRef]
  46. Wan, C.; Yu, Y.; Zhou, S.; Liu, W.; Tian, S.; Cao, S. Antioxidant activity and free radical-scavenging capacity of Gynura divaricata leaf extracts at different temperatures. Pharmacogn. Mag. 2011, 7, 40–45. [Google Scholar] [CrossRef] [PubMed]
  47. Saw, C.L.L.; Yang, A.Y.; Cheng, D.C.; Boyanapalli, S.S.S.; Su, Z.Y.; Khor, T.O.; Gao, S.; Wang, J.; Jiang, Z.H.; Kong, A.N.T. Pharmacodynamics of ginsenosides: Antioxidant activities, activation of Nrf2, and potential synergistic effects of combinations. Chem. Res. Toxicol. 2012, 25, 1574–1580. [Google Scholar] [CrossRef]
  48. Morshed, M.N.; Ahn, J.C.; Mathiyalagan, R.; Rupa, E.J.; Akter, R.; Karim, M.R.; Jung, D.H.; Yang, D.C.; Jung, S.K. Antioxidant activity of Panax ginseng to regulate ROS in various chronic diseases. Appl. Sci. 2023, 13, 2893. [Google Scholar] [CrossRef]
  49. Chen, S.; Li, X.; Wang, Y.; Mu, P.; Chen, C.; Huang, P.; Liu, D. Ginsenoside Rb1 attenuates intestinal ischemia/reperfusion-induced inflammation and oxidative stress via activation of the PI3K/Akt/Nrf2 signaling pathway. Mol. Med. Rep. 2019, 19, 3633–3641. [Google Scholar] [CrossRef] [PubMed]
  50. Kim, Y.J.; Zhang, D.; Yang, D.C. Biosynthesis and biotechnological production of ginsenosides. Biotechnol. Adv. 2018, 36, 68–78. [Google Scholar] [CrossRef] [PubMed]
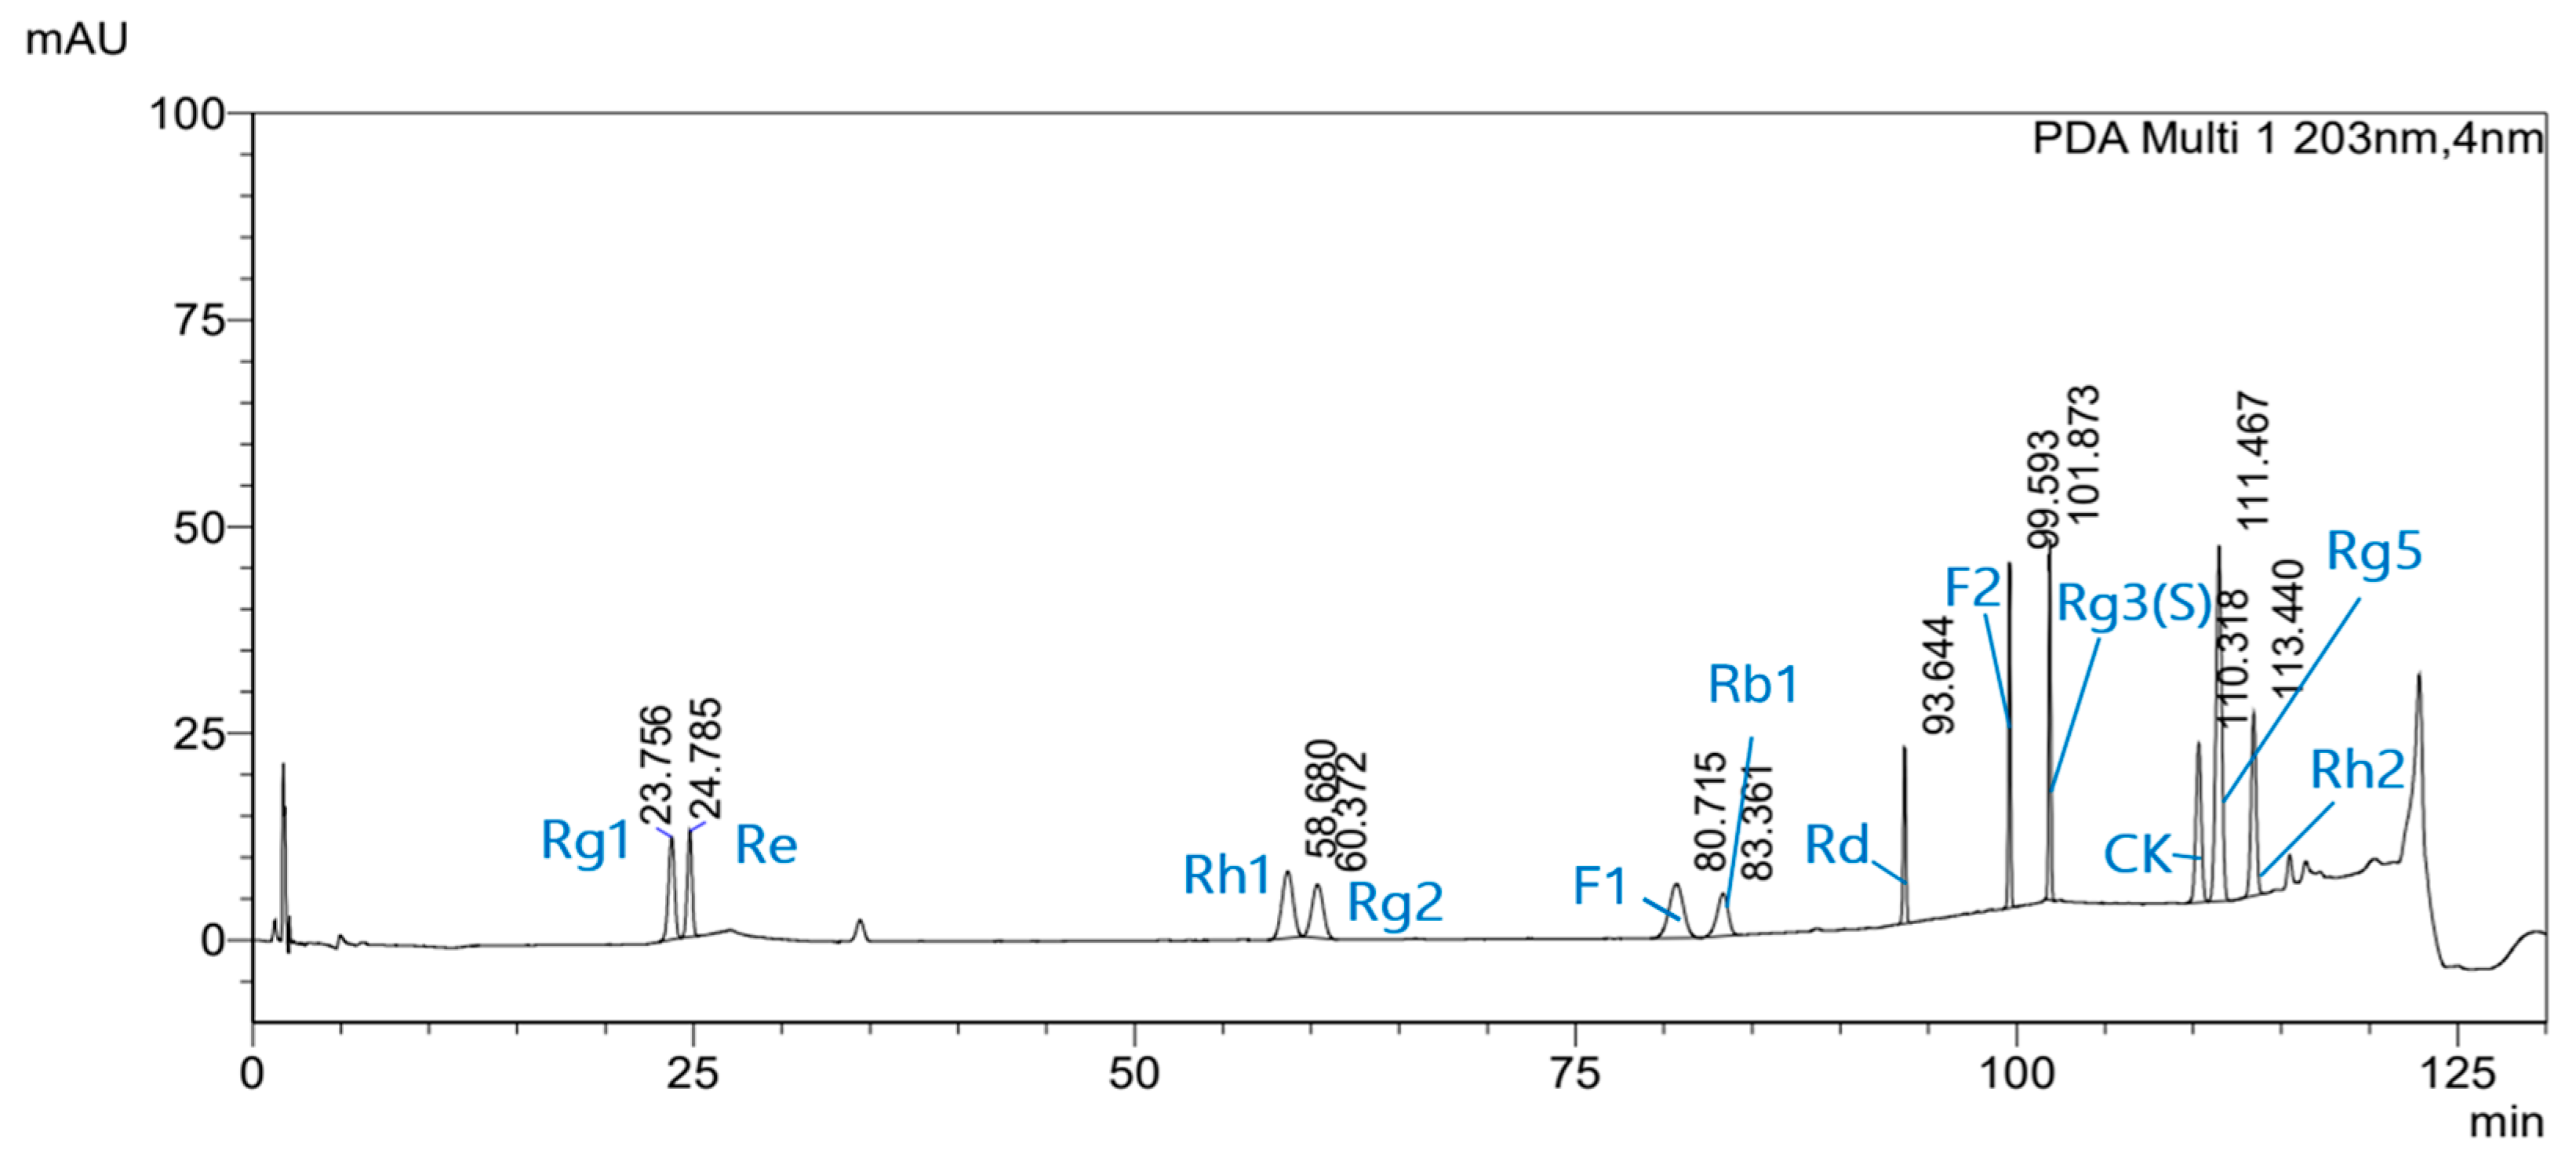
Figure 1. HPLC chromatogram of mixed standards. Rg1: ginsenoside Rg1; Re: ginsenoside Re; Rh1: ginsenoside Rh1; Rg2: ginsenoside Rg2; F1: ginsenoside F1; Rb1: ginsenoside Rb1; Rd: ginsenoside Rd; F2: ginsenoside F2; Rg3(S): ginsenoside Rg3(S); CK: ginsenoside Compound K; Rg5: ginsenoside Rg5; Rh2: ginsenoside Rh2.
Applsci 15 12467 g001
Figure 2. HPLC chromatograms of the RGS extract. Rg1: ginsenoside Rg1; Re: ginsenoside Re; Rh1: ginsenoside Rh1; Rg2: ginsenoside Rg2; F1: ginsenoside F1; Rd: ginsenoside Rd; F2: ginsenoside F2; Rg3(S): ginsenoside Rg3(S); CK: ginsenoside Compound K; Rg5: ginsenoside Rg5; Rh2: ginsenoside Rh2.
Applsci 15 12467 g002
Figure 3. Heatmap illustrating the correlation coefficients among total phenolic (TP) content, total flavonoid (TF) content, DPPH radical-scavenging activity (DPPH), ABTS radical-scavenging activity (ABTS), and ginsenoside content. Blue and red shades represent negative and positive correlations between the parameters, respectively. Statistically significant correlation differences are denoted by a white asterisk (* p < 0.05 and ** p < 0.01). Rg2: ginsenoside Rg2; Rh1: ginsenoside Rh1; Rg3(S): ginsenoside Rg3(S); Rd: ginsenoside Rd; Re: ginsenoside Re; Rg1: ginsenoside Rg1; F2: ginsenoside F2; Rb1: ginsenoside Rb1; Rg5: ginsenoside Rg5.
Applsci 15 12467 g003
Table 1. Linearity of the calibration curves for the mixed standard ginsenosides.
GinsenosideCalibration CurveR2LOD 1 (μg/mL)LOQ 2 (μg/mL)
Rg1y = 1989.9x − 1278.50.99971.023.1
Rey = 1602.1x + 51.40.99941.404.24
Rh1y = 2397.4x − 1117.30.99961.634.95
Rg2y = 1956x − 338.60.99940.240.74
Rb1y = 2493.6x − 3272.30.99973.5510.76
F1y = 1513.1x − 1813.00.99960.922.80
Rdy = 1458.3x + 7.00.99950.200.62
F2y = 2312.8x + 225.70.99960.431.31
Rg3(S)y = 2586.7x + 1528.30.99951.695.11
CKy = 6625.5x − 4058.90.99951.273.90
Rg5y = 2750.0x − 2035.50.99970.270.81
Rh2y = 2904.0x + 2154.20.99970.712.16
1 Limit of detection; 2 Limit of quantitation.
Table 2. Ginsenoside content of the RGS extract.
SampleGinsenosides Content (mg/g)
Rg1ReRh1Rg2F1Rb1RdF2Rg3(S)CKRg5Rh2Total
Extract
(49 brix°)
3.27 ± 0.02 c11.06 ± 0.02 a0.55± 0.01 g2.48 ± 0.02 dN.D. 11.07 ± 0.08 f7.14 ± 0.03 b1.58 ± 0.00 e1.05 ± 0.01 fTR 21.54 ± 0.01 eTR31.54 ± 0.22
The results are presented as the mean ± SD of three independent samples measured in triplicate. a–g Different lowercase letters in a table indicate statistical differences at p < 0.05. 1 Not detected; 2 Trace.
Table 3. Total polyphenol and flavonoid contents in the RGS extract.
SampleTotal Polyphenol Content (mg GAE 1/g)Total Flavonoid Content (mg RE 2/g)
Extract
(49 brix°)
7.98 ± 0.034.65 ± 0.02
The results are presented as the mean ± SD of three independent samples measured in triplicate. 1 GAE: gallic acid equivalents. 2 RE: rutin equivalent.
Table 4. Antioxidant activity of RGS extract.
CompoundDPPH 1 (IC50 2, mg/mL) *ABTS 3 (IC50, mg/mL) *
Extract (49 brix°) 7.88 ± 0.01 a24.81 ± 0.05 a
Ascorbic acid0.03 ± 0.00 b0.42 ± 0.01 b
The results are presented as the mean ± SD of three independent samples measured in triplicate. 1 2,2-diphenyl-1-picrylhydrazyl radical scavenging activity; 2 half maximal inhibitory concentration (IC50); 3 2,2′-azino-bis(3-ethylbenzothiazoline-6-sulfonic acid) radical scavenging activity; * Values with different letters in the same column differ significantly at p < 0.05.
Disclaimer/Publisher’s Note: The statements, opinions and data contained in all publications are solely those of the individual author(s) and contributor(s) and not of MDPI and/or the editor(s). MDPI and/or the editor(s) disclaim responsibility for any injury to people or property resulting from any ideas, methods, instructions or products referred to in the content.