Technical Note

A Study of Aircraft Wake Vortices at Hong Kong International Airport Using Short-Range LIDAR

1
Department of Physics, The Chinese University of Hong Kong, Hong Kong, China
2
Department of Physics, The University of Hong Kong, Hong Kong, China
3
Hong Kong Observatory, Hong Kong, China
*
Author to whom correspondence should be addressed.
Appl. Sci. 2025, 15(23), 12466; https://doi.org/10.3390/app152312466
Submission received: 16 October 2025 / Revised: 19 November 2025 / Accepted: 21 November 2025 / Published: 24 November 2025

Abstract

The wake vortex of an aircraft can be hazardous to aviation operations. Therefore, the International Civil Aviation Organization has established requirements regarding the separation of aircraft. In light of the current implementation of regulations, this systematic study was the first of its kind investigating wake vortices of aircraft at the new north runway of Hong Kong International Airport (HKIA). A short-range light detection and ranging (SR-LIDAR) system, previously installed by the Hong Kong Observatory at HKIA, performed range–height indicator scans at the recently commissioned north runway end to capture wake vortices of arriving aircraft. The lifetimes of the wake vortices were calculated, and the exit times of the vortices away from the runway were determined. Based on an analysis of data from a period of approximately eight weeks—mostly during summer with its prevailing southwestern monsoon—it was found that, as in a previous study, the displacement of vortices increased with the radial background velocity. Moreover, approximately 0.6% of aircraft may be susceptible to encountering the vortex left behind by the preceding aircraft. Analysis of data from a second period of approximately four weeks revealed that vortex lifetimes were negatively correlated with the magnitude of the turbulence intensity expressed in terms of the eddy dissipation rate. Correlations with various other meteorological and non-meteorological factors were not apparent. The results of the present study supplement previous work in Hong Kong with a site-specific dataset for the new commissioned north runway, provide validation of established principles with an initial assessment of operational risk of turbulence encounter, and pave the way for longer-term statistical analysis of the behaviour of aircraft wake vortices in the climate of Hong Kong.

1. Introduction

The wake vortex of an aircraft can be hazardous to aviation operations [1]. It has, over the past few decades, attracted great interest in collecting, studying, and modelling its characteristics. Hallock [2] published a report in 1991 summarizing the situation. In 2018 Hallock et al. [3] produced an update to the 1991 report. Readers can also refer to Gerz et al. [4] presenting a consolidated European view, and Breitsamter [5] for a brief overview of past and present research activities. The International Civil Aviation Organization (ICAO) has established requirements regarding the separation of aircraft [6] that any aircraft pair using the same runway (or closely spaced parallel runways) must maintain a minimum safe separation distance based on the respective categories of the current aircraft and the preceding aircraft to avoid the adverse effects of wake turbulence from the preceding aircraft. The wake vortex will dissipate or be carried by the background wind away from the runway. For busy airports that are close to the capacity limits, safely reducing the wake turbulence separation intervals is an important aspect for improving aircraft takeoff, landing efficiency, and thus airport capacity [3,7,8].
The problem of the dissipation of aircraft wake vortices has been studied extensively with the goal of predicting their lifetime and potential hazard. Theoretical research methods have been studied in depth to explore the characteristics of the evolutionary process of the wake vortex. Research methods of wake vortices include experiments conducted in wind tunnels [9]; field measurements using Radar [10], Light Detection and Ranging (LIDAR) [11,12], or acoustic methods such as Sound Detecting and Ranging (SODAR) [13]; theoretical modelling [2,3]; and computational simulations [14,15]. Idealized analytical models of simplified mathematical equations to describe the basic properties of a vortex pair are often used for initial analysis or to initialize more complex simulations. These include the Lamb–Oseen Model, Burnham–Hallock Model, and the Proctor Model, as summarized by Nashat and Proctor [16]. Depending on whether the vortex pair’s distance from the ground plane is above or below 1.5 b 0 (i.e., 1.5 times the initial separation of the vortex pair), wake vortices are classified into two types, namely out-of-ground-effect (OGE) and in-ground-effect (IGE). For IGE wake, they are heavily influenced by the ground surface roughness, headwind, crosswind, boundary layer turbulence, the generation of secondary vortical structures, and other meteorological conditions near the ground and can behave in such a complicated fashion that simple analytical models fail. Computational Fluid Dynamics (CFD) and Large Eddy Simulations (LES) are powerful methods for studying the evolution of wake vortices. LES models the large-scale turbulent eddies through Direct Numerical Simulations (DNS), providing a detailed account of the wake vortex’s transportation, near-surface rebound, dissipation, etc., under different atmospheric conditions [14,17,18,19]. Besides LES simulation using a solver on a meshed Eulerian coordinate system, simulations are also carried out using alternative Lagrangian vortex methods [20]. In either approach, large computational resources are required, namely, the mesh has to be fine enough or the number of Lagrangian vortex blobs has to be large enough in order to handle high-resolution turbulent structure successfully. With an increase in the use of CFD models for studying wake vortices, there have been attempts to develop a more economical computer process for the simulation [21]. While LIDAR is the primary equipment used for aircraft wake vortex detection, common methods used to detect the locations of the vortex pair include the velocity envelope (VE) method [11] and the radial velocity (RV) method [12]. The robustness and detection efficiency of these algorithms running on modern hardware are still marginally good enough for real-time applications. In recent years, the use of machine intelligence techniques has led to improvements in real-time detection and monitoring [22,23,24,25]. Almahadin [26] also presented machine learning-based methods to identify wake vortex encounters from aircraft data registered by the flight data recorder (FDR).
For real-life applications, the separation minima were redefined in 2013 by introducing “upper” and “lower” aircraft parts into ICAO heavy and medium aircraft categories. The result is a six-category separation standard instead of four to optimize the airport/runway throughput while maintaining an acceptable level of safety [27]. The new categorization (RECAT-EU) has since been deployed in several busy European airports.
In Hong Kong, the first observations of wake vortex using a Short-Range LIDAR (SR-LIDAR) system were made in 2014, and various field campaigns continued in subsequent years. Hon et al. provided an account of these efforts [28]. In 2018, an initiative was launched to study the applicability of the Eurocontrol Wake Vortex Re-categorisation (RECAT-EU) at the Hong Kong International Airport (HKIA) for the enhancement of runway capacity and operating efficiency, which covered the then two-runway system over a 12-month period. The findings were summarized by Hon et al. [29], which showed that the results were in reasonable alignment with the reasonable worst case (RWC) decay behaviour with the RECAT-EU reference. Subsequently, at HKIA, the enhanced Wake Turbulence Separation (e-WTS) was implemented in November 2020 for arrival flights, and then extended to departure flights as well [30]. In light of the current implementation of regulations and the commissioning of the three-runway system at HKIA, a short-range light detection and ranging (SR-LIDAR) system, previously installed by the Hong Kong Observatory at HKIA, was configured to perform range–height indicator scans at the new north runway end to capture wake vortices of arriving aircraft. The systematic study reported in this paper was the first of its kind investigating wake vortices of aircraft at the new north runway at HKIA. The lifetimes of the wake vortices were calculated, and the exit times of the vortices away from the runway were determined. Based on an analysis of data from a period of approximately eight weeks—mostly during summer with its prevailing southwestern monsoon—it was found that the displacement of vortices increased with the radial background velocity. Moreover, approximately 0.6% of aircraft may be susceptible to encountering the vortex left behind by the preceding aircraft. Analysis of data from a second period of approximately four weeks revealed that vortex lifetimes were negatively correlated with the magnitude of the turbulence intensity expressed in terms of the eddy dissipation rate, as found in previous studies. Correlations with various other meteorological and non-meteorological factors were not apparent. The results of the present study supplement previous work in Hong Kong with a site-specific dataset for the new commissioned north runway, provide validation of established principles with an initial assessment of operational risk of turbulence encounter, and pave the way for longer-term statistical analysis of the behaviour of aircraft wake vortices in the climate of Hong Kong.

2. Materials and Methods

2.1. Equipment

An SR-LIDAR system was installed at the western end of the northern runway of the HKIA. Range–height indicator (RHI) scans were performed every 10 s. The geometrical layout of the setup is illustrated in Figure 1. The SR-LIDAR system is located at approximately 345 m from the runway centreline, and scanning was performed for elevation angles from −1° (i.e., 1 deg. below the horizon) up to +19°.
The technical specifications of the SR-LIDAR system are presented in Table 1. The measurement range was approximately 3000 m from the SR-LIDAR system, and the radial resolution was approximately 12 m, which is considered sufficient to resolve the majority of the wake vortices. The laser beam of the system had a central wavelength of approximately 1.5 μm.

2.2. First Period: Determination of Wake Vortex Location and Data Analysis

A wake vortex of the aircraft appears as a pair of counter-rotating vortices in the Doppler velocity field obtained from the RHI scans of the SR-LIDAR system. In this study, a traditional RV-based method similar to Wu et al. [31] was adopted for determining the vortex locations. The method used in the study uses two metrics:
(1)
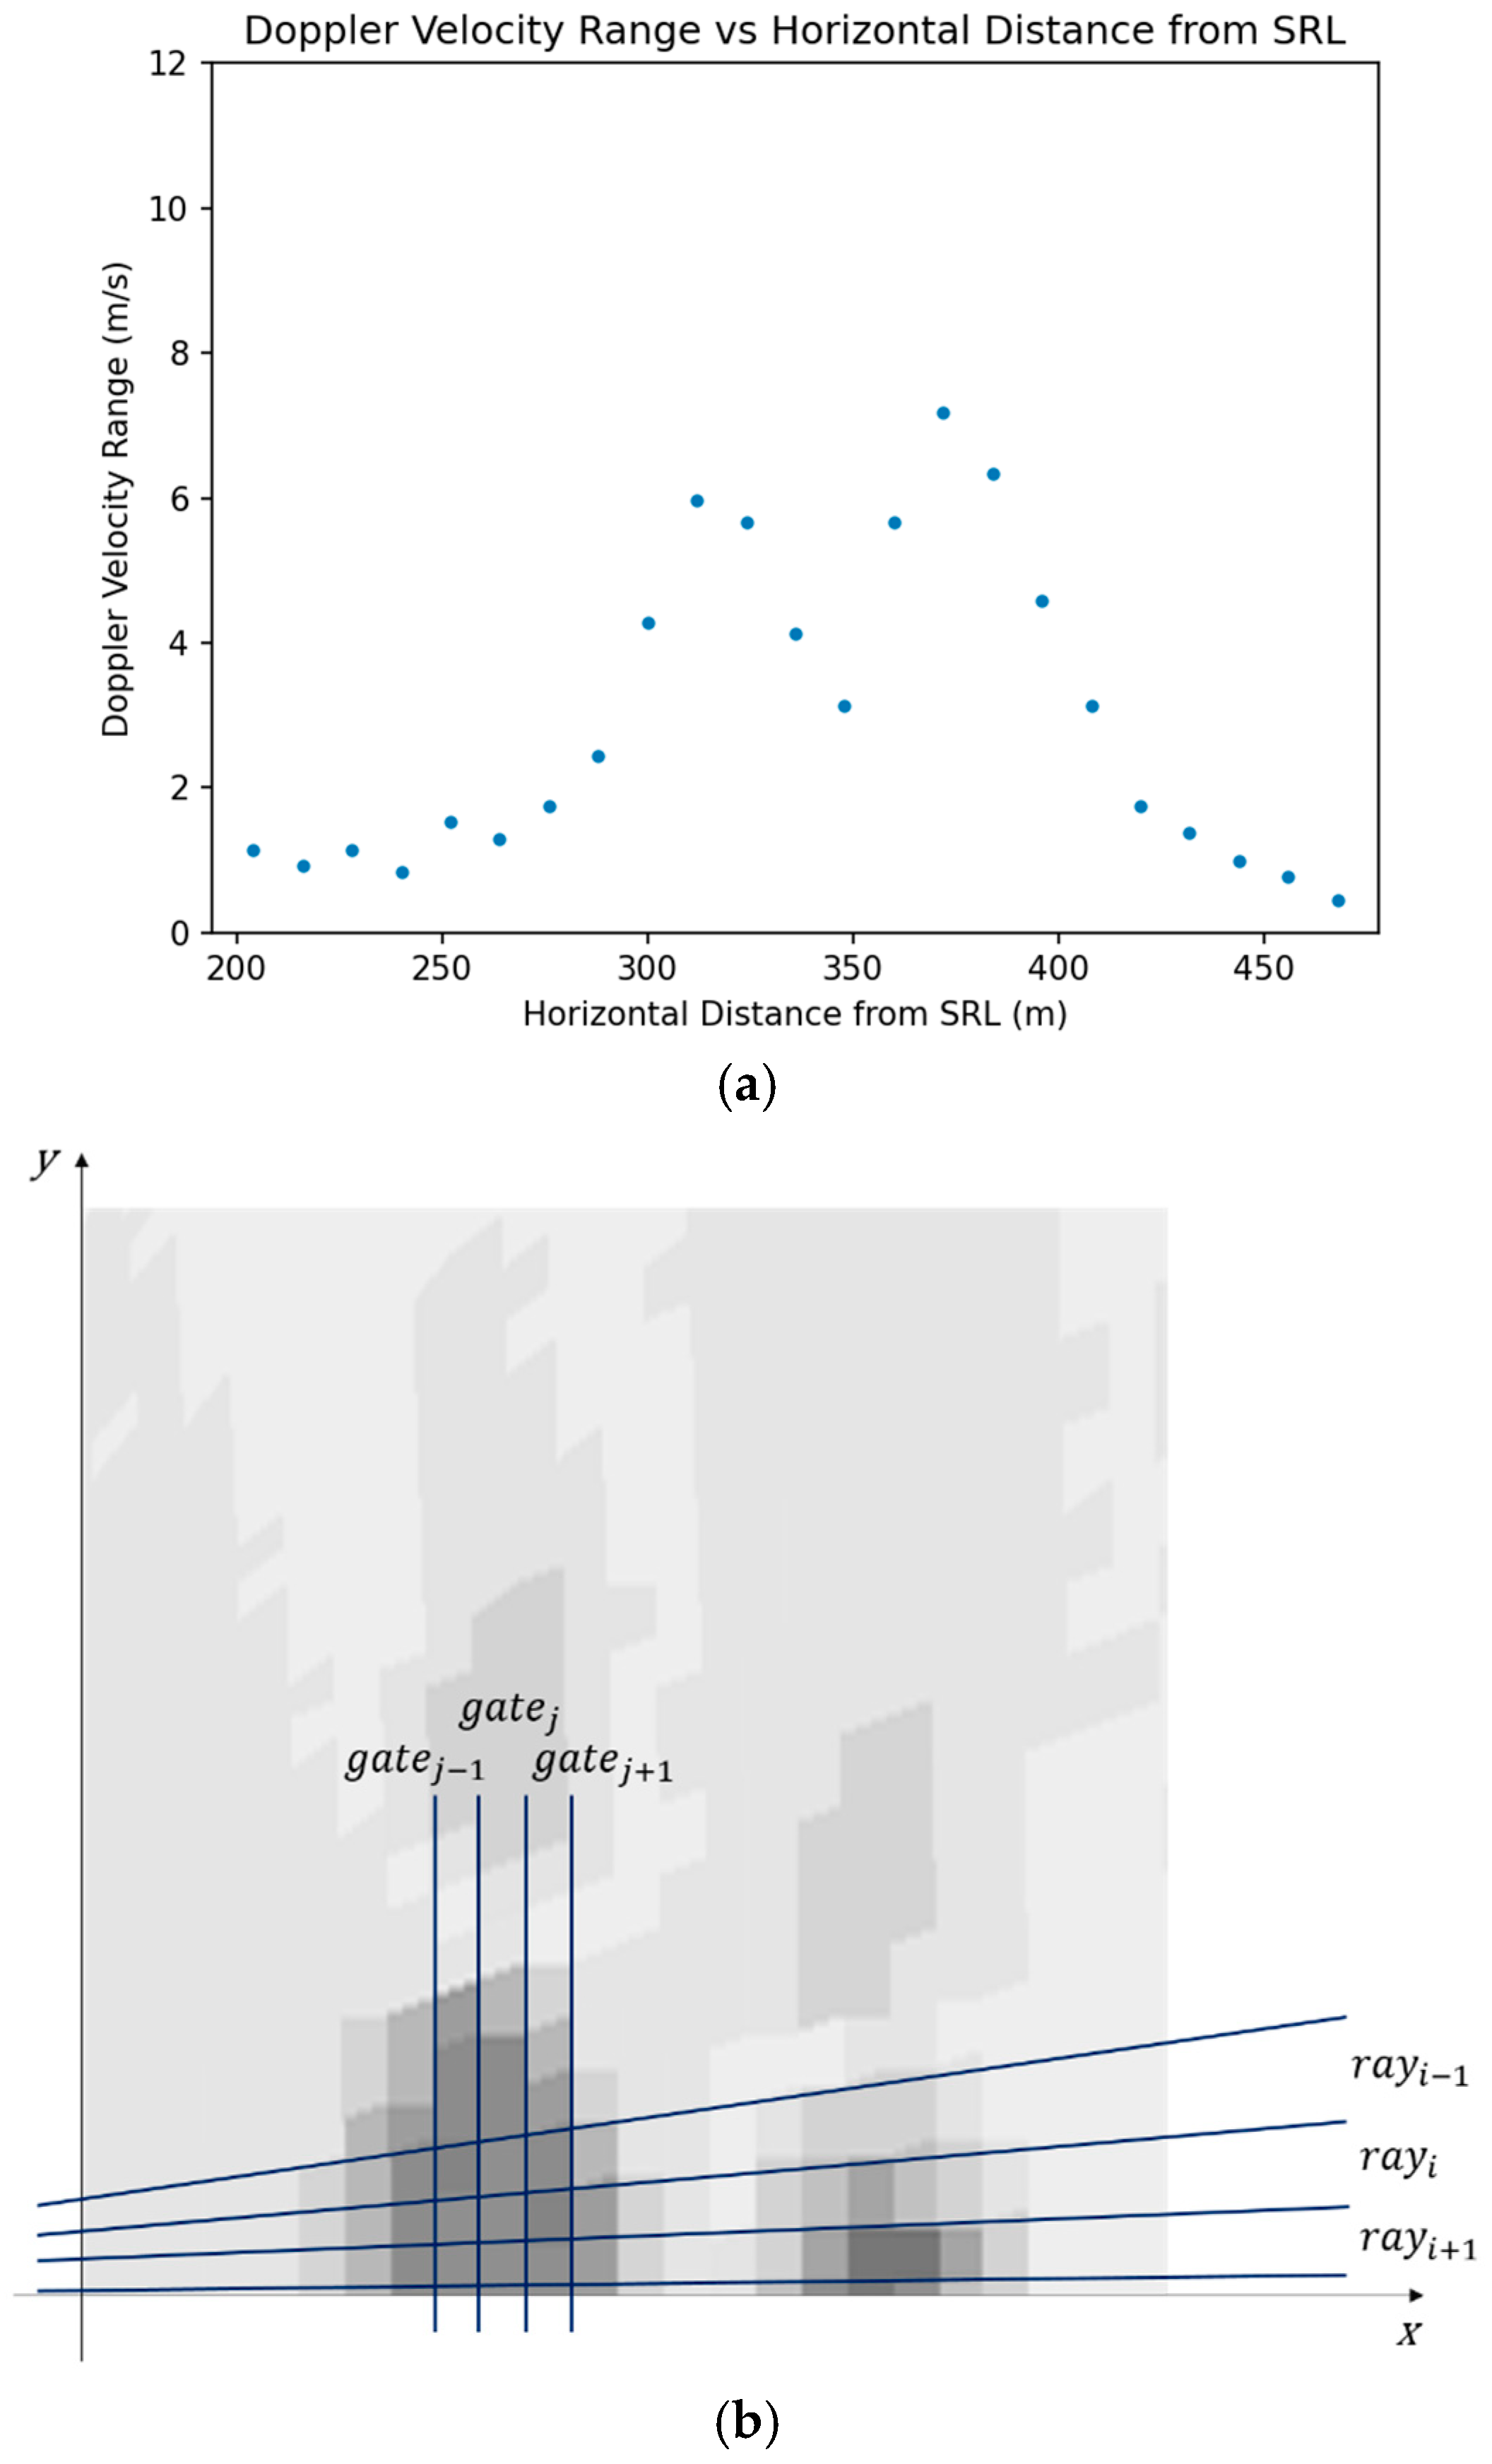
The Doppler velocity range, which is the difference between the maximum and the minimum Doppler velocities of a fixed gate (an example is given in Figure 2a), with the minimum Doppler velocity range fine-tuned to approximately 2.5 m/s.
(2)
The comparison between the maximum/minimum Doppler velocity and the velocity values of the adjacent radial gates along the same radial line, as well as those at the gates of the adjacent elevation angles (the so-called rays). The algorithm for this procedure is schematically illustrated in Figure 2b. A threshold was determined for the difference in Doppler velocities based on statistical analysis. Parameters relevant to the wake vortex that were identified were also considered, such as the separation between the pair of counter-rotating vortices and the height difference between the points of maximum and minimum Doppler velocities (both associated with the same vortex), with tunable thresholds for these parameters based on statistics.
Given the simplicity of the algorithm, it can complete the processing of each SR-LIDAR RHI scan in no more than a couple of seconds, which makes it a possible application scenario in a near-real-time information system of aircraft wake vortices, among other analytical methods.
Owing to the nature of the laser beam, the determination of the first appearance of a wake vortex in the RHI scanning plane was subject to disruption by the body of the aircraft acting as a hard target. As such, the “birth time” of a wake vortex—defined here as the time when the vortex passes through the RHI scanning plane—was also determined using location information from the aircraft based on automatic dependent surveillance-broadcast (ADS-B). This took place when the aircraft was passing through the runway end, which was collocated with the RHI scanning plane of the SR-LIDAR system for the first time.
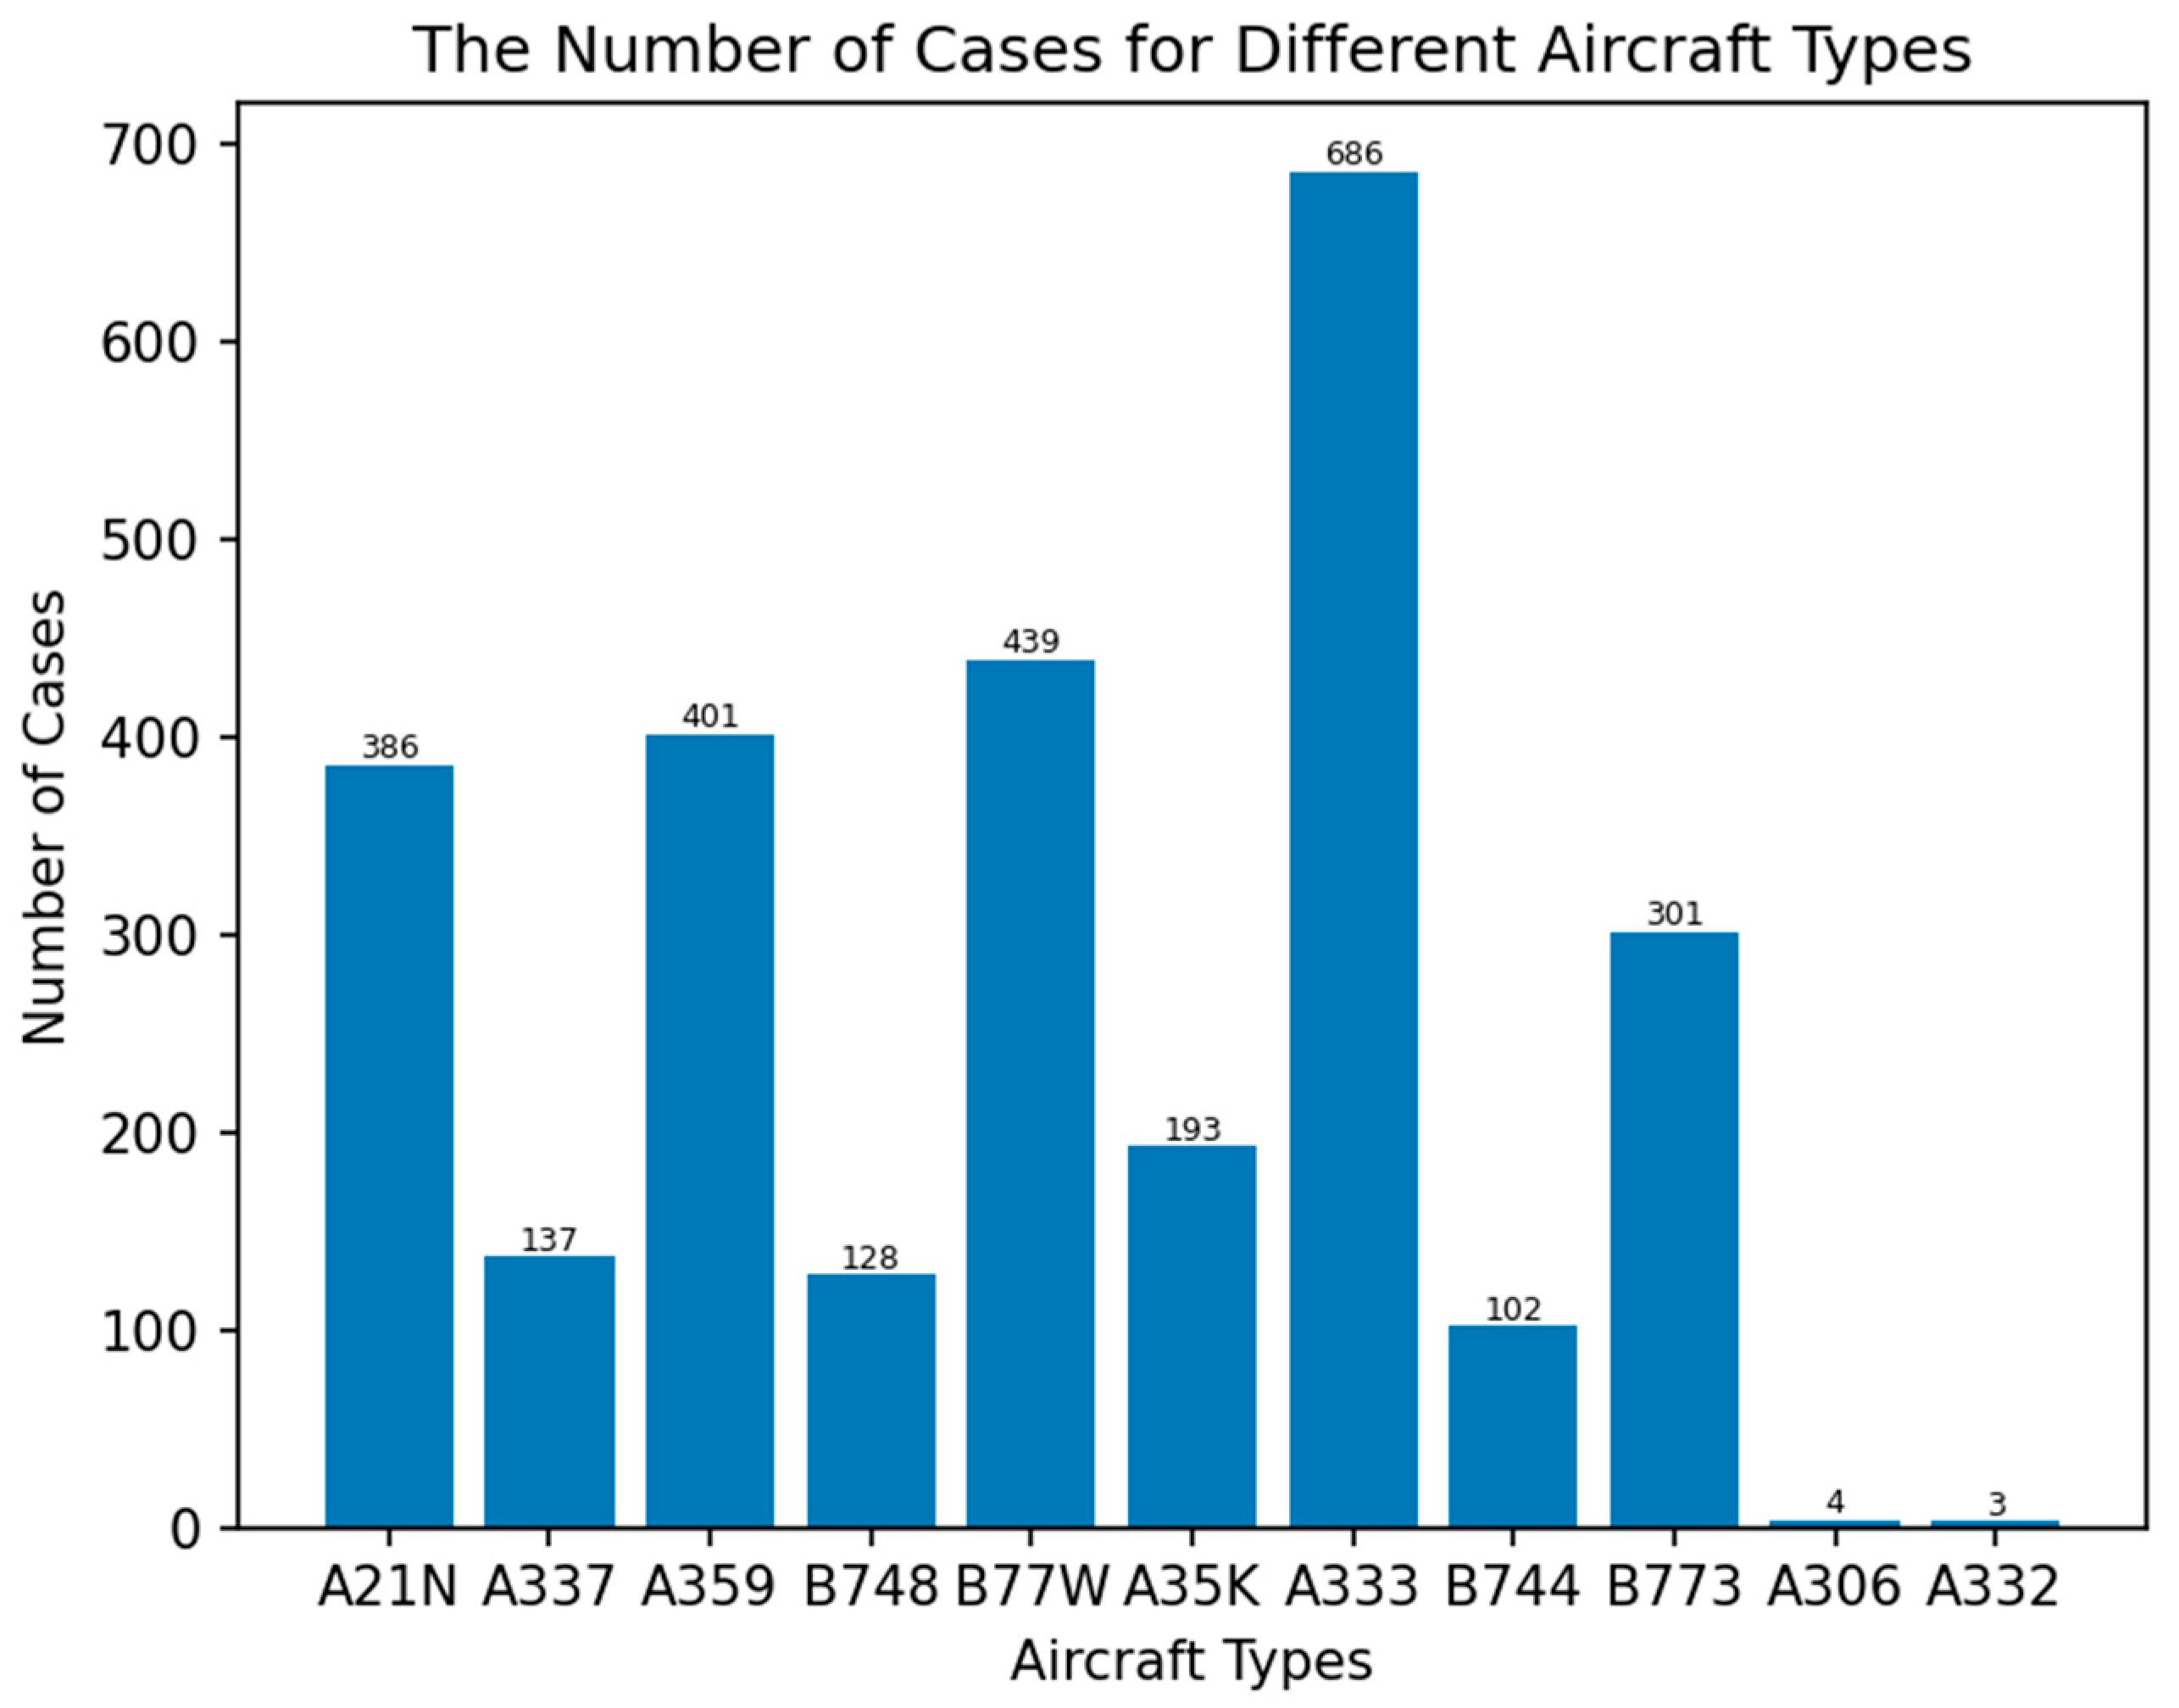
The primary period during which these methods were obtained spanned 3–20 August 2024 and 1 September–14 October 2024. This time was predominantly in summer, with a prevalence of the southwest monsoon, together with an early-season northeast monsoon originating from continental China. The wake vortex detection algorithm described above was applied to the data obtained during the main study period, and statistical analysis was conducted thereafter. Only the aircraft of a Hong Kong-based airline were considered. The frequencies of aircraft types considered in this study period are shown in Figure 3. The total number of aircraft considered was 2780.

2.3. Second Period: Aircraft-Specific EDR Analysis

The follow-up study period covered 20 June to 16 July 2025 and focused on the effects of turbulence on the lifetime of wake vortices. As a standardized, objective measure, the eddy dissipation rate (EDR) is used by the International Civil Aviation Organization for atmospheric turbulence. In this study, the EDR was calculated from the velocity structure function derived from long-range LIDAR data using the method of Chan [32]. Moreover, for the EDR analysis, background wind speed data was obtained from an anemometer near the northern runway at a height of 10 m above the ground.

2.4. Determination of Wake Vortex Lifetime

Because the SR-LIDAR system only performed RHI scans every 10 s, the time of the first frame capturing a vortex pair usually did not exactly match that at which they were generated at the RHI plane. A backward extrapolation was initially attempted as follows. The landing aircraft was assumed to travel along the glide path such that the vortices were generated at the middle of the runway. To determine the birth time, the positions of the midpoints of the left and right vortex cores in all vortex-capturing RHI frames and their least-squares regression lines were found. The fitted line was then extrapolated backward, and the time when it intersected the runway centreline was regarded as the birth time of the vortices.
The estimated birth time using the method above was not accurate in most cases, as it was only effective when the background wind was strong enough to pull vortices away from the runway centreline with a linear trajectory. Hence, an improved and intuitive method for determining the birth time was adopted. Using ADS-B data, the exact time when the aircraft appeared on the scanning plane was obtained by finding the time when the latitude and longitude of the aircraft corresponded most closely with those of the intersection of the runway centreline and the RHI scanning plane. The offset for the birth time calculation in seconds was simply the difference between the time of the first vortex-capturing frame and the exact time at which the aircraft passed through the RHI scanning plane. The above definition of the vortex birth time is under the assumption that the wake vortex pair came to exist in the SL-LDAR scan plan at the moment when the aircraft crossed this scan plane, which is not necessarily agreed upon by all. While aircraft generates wake vortex continuously during flight, the development of the pair of counter rotating vortices involves several stages: at the near-field where swirling air at the wing tips, flaps, and tail rolls up to form the immediate wake; extended near-field where the main pair of vortices are forming through merging and roll-up of multiple separate vortices; and mid-field/far-field and decay region [5]. So even when the SL-LIDAR happens to perform a scan right at the time when the aircraft has just passed the scan plane, it may not be able to identify any vortex signature. Having said that, the use of ADS-B data is a more robust method than the extrapolation method first tried, though it may introduce a positive error in the order of a couple of seconds in determining the wake lifetime.
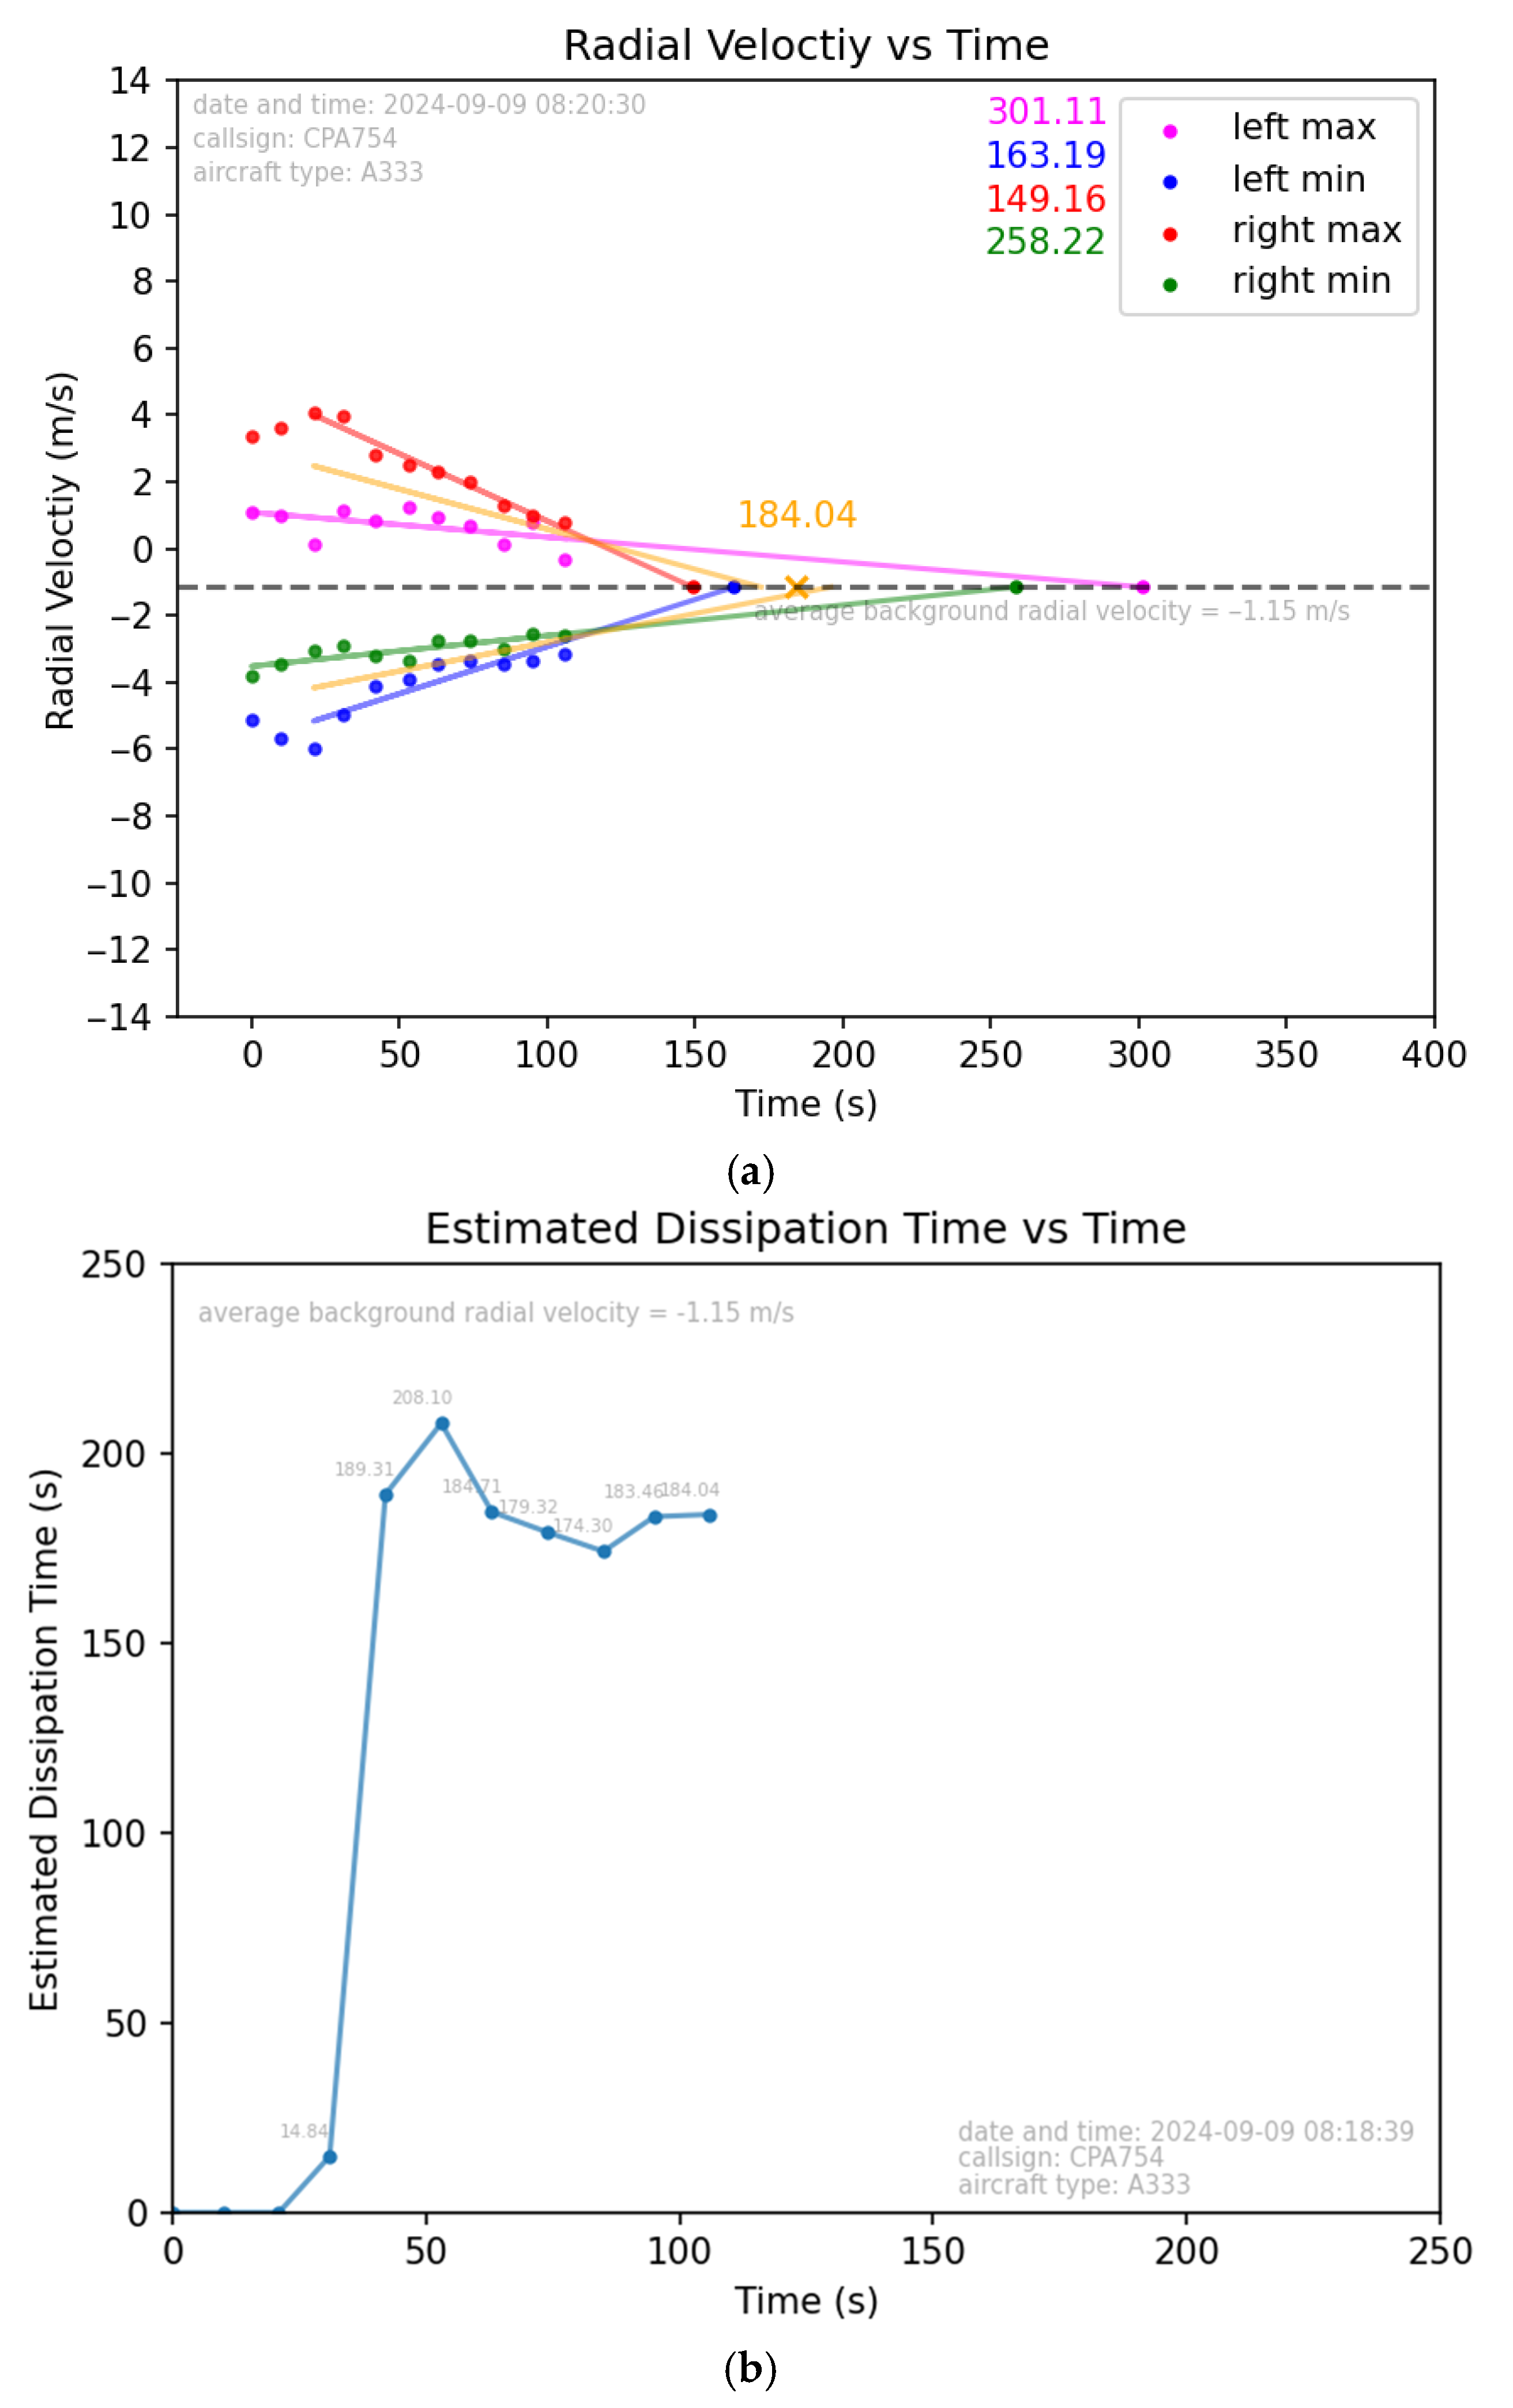
The dissipation time was defined as the time at which the wake vortex disappeared from the RHI scanning plane, which implies the time at which the radial velocities of the vortex extrema reached the same value as the background radial velocity. Because the trend of the radial velocities in the first three frames was neither significant nor stable, the calculation of the dissipation time started when four vortex-capturing frames accumulated, and lasted until the last vortex-capturing frame was captured. The least-squares regression lines of the four or more extrema were found and then extrapolated towards the value of the average background radial velocity of all captured frames, as shown in Figure 4a. The extrapolation process was repeated whenever a new vortex-capturing frame appeared. In general, after four to five frames, the estimated dissipation time stabilized (Figure 4b).
Another time of interest was when the vortices completely exited the runway. The exit time was defined as the time at which both the left and right vortices exited the runway. The positions were estimated using a least-squares regression line. If the vortices exited during the scan, the times at which the fitted lines and runway edges intersected were taken as the exit time. If the vortices had not exited before the last frame was captured, the fitted lines were extrapolated towards one of the runway edges depending on their potential trajectories. The time when both the trajectories met the runway edges was the estimated exit time.

2.5. Correlation Analysis

Correlations of wake vortex lifetime with various meteorological and non-meteorological factors were analyzed. The meteorological factors considered were as follows.
  • Background radial velocity, calculated by averaging radial velocity gates with ranges from 100 m to 850 m in the SR-LIDAR RHI scan. To avoid unrealistic values due to noise or clutter, the radial velocities in range were sorted, and the top and bottom hundred values were removed before performing the averaging. Due to the geometry of the RHI scan, it also represents the background crosswind.
  • Maximum radial velocity difference between the extrema of the vortices and the background radial velocity.
  • Relative humidity measured by a radiometer installed on HKIA, at a distance of approximately 6 km to the east/south-east of SRL-R3W. The mean value of relative humidity at the surface and at 118 m high is taken as the relative humidity at the typical height of vortices.
  • Instability, taken as the difference between the temperature reading from a transmissometer near the R3W site at around 10 m high and the temperature at 118 m high measured by the radiometer.
For non-meteorological factors, the vortex-related parameters include the wingspan of the aircraft, initial vortex circulation [33], and hour of day.

3. Results and Discussion

3.1. Detection and Analysis of Wake Vortices Encounter

By applying the wake vortex detection algorithm to all aircraft, 9895 pairs of vortices were captured (at least four consecutive frames) during the first study period. It was found that 134 aircraft arrived at the runway (SR-LIDAR system RHI scanning plane) before the vortices generated by the preceding aircraft dissipated. Among these, the number of cases with the previous vortices remaining on the runway was 58, that is, in 43.3% (58/134) of these cases, the vortices still have not exited the runway. Regarding these 58 cases, the separation between the birth times of the preceding and following vortices ranged between 72 s and 144 s. The chance of encountering wake vortices while landing was 0.586% (58/9895) based on the analysis.

3.2. Wake Vortex Lifetime and Influencing Factors

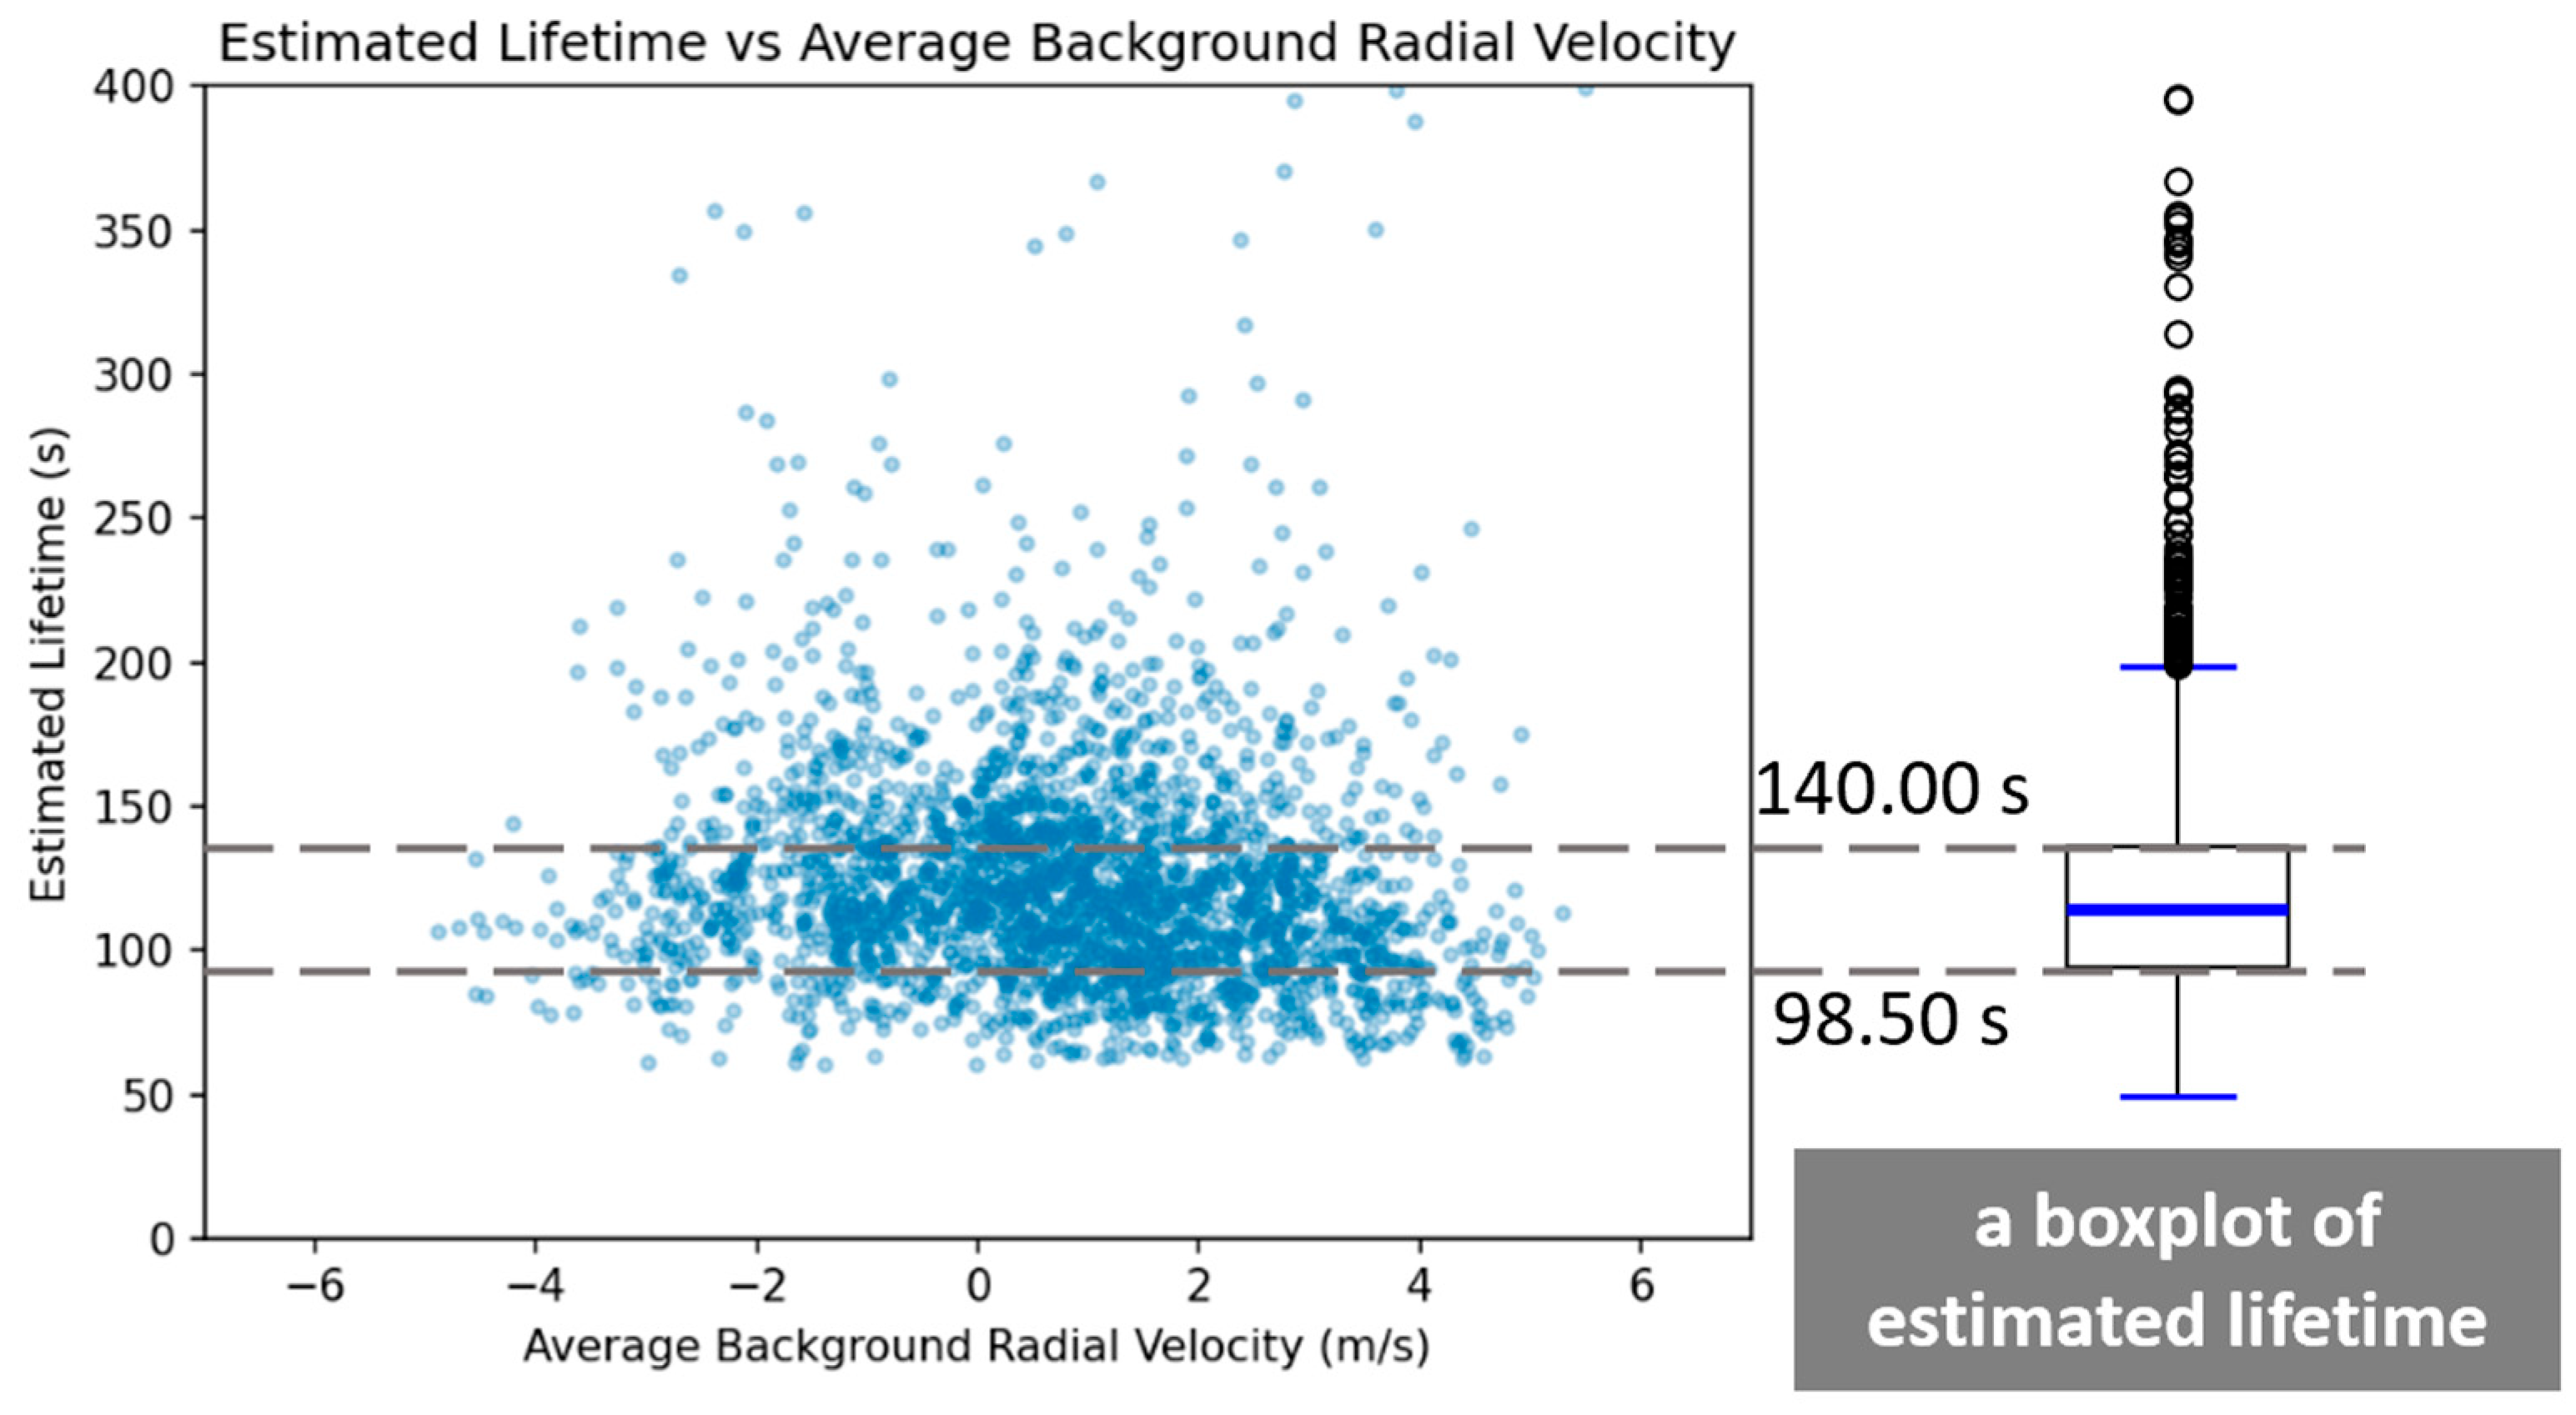
The lifetime of a wake vortex was defined as the time elapsed from birth time to dissipation time. A scatter plot of the wake vortex lifetime against the average background radial velocity from the SL-LIDAR RHI scan is shown in Figure 5, along with a box plot of the lifetime distribution. The scatter plot shows a weak correlation between the lifetime and the background radial velocity. The estimated vortex lifetime during the study period ranged between 54.00 and 399.00 s. The median was 118.00 s, whereas the 25th and 75th percentiles were 98.50 and 140.00 s, respectively. The lifetime dataset has several sources of error. The uncertainty in birth time was discussed in 2.4. For the dissipation time, the extrapolation of the vortex radial velocity can also be sensitive to the decaying process. Currently, a linear relationship with time is assumed, and the extrapolation was performed by simple regression of least squares fitting for four or more vortex-capturing frames in order to achieve a stable trend. Depending on whether the vortex frames captured were in the extended near-field, mid-field or far-field, the rate of change in the vortex radial velocity can be non-linear or at least can be at different rates; coupled with the ground effect, windshear, turbulence, and other factors, the extrapolation may not be reliable in some cases, especially for those outliers with very long lifetime. Cases with lifetimes longer than 202.25 s (the third quartile plus 1.5 times inter-quartile range, i.e., Q3 + 1.5 × IQR) were considered to be outliers.
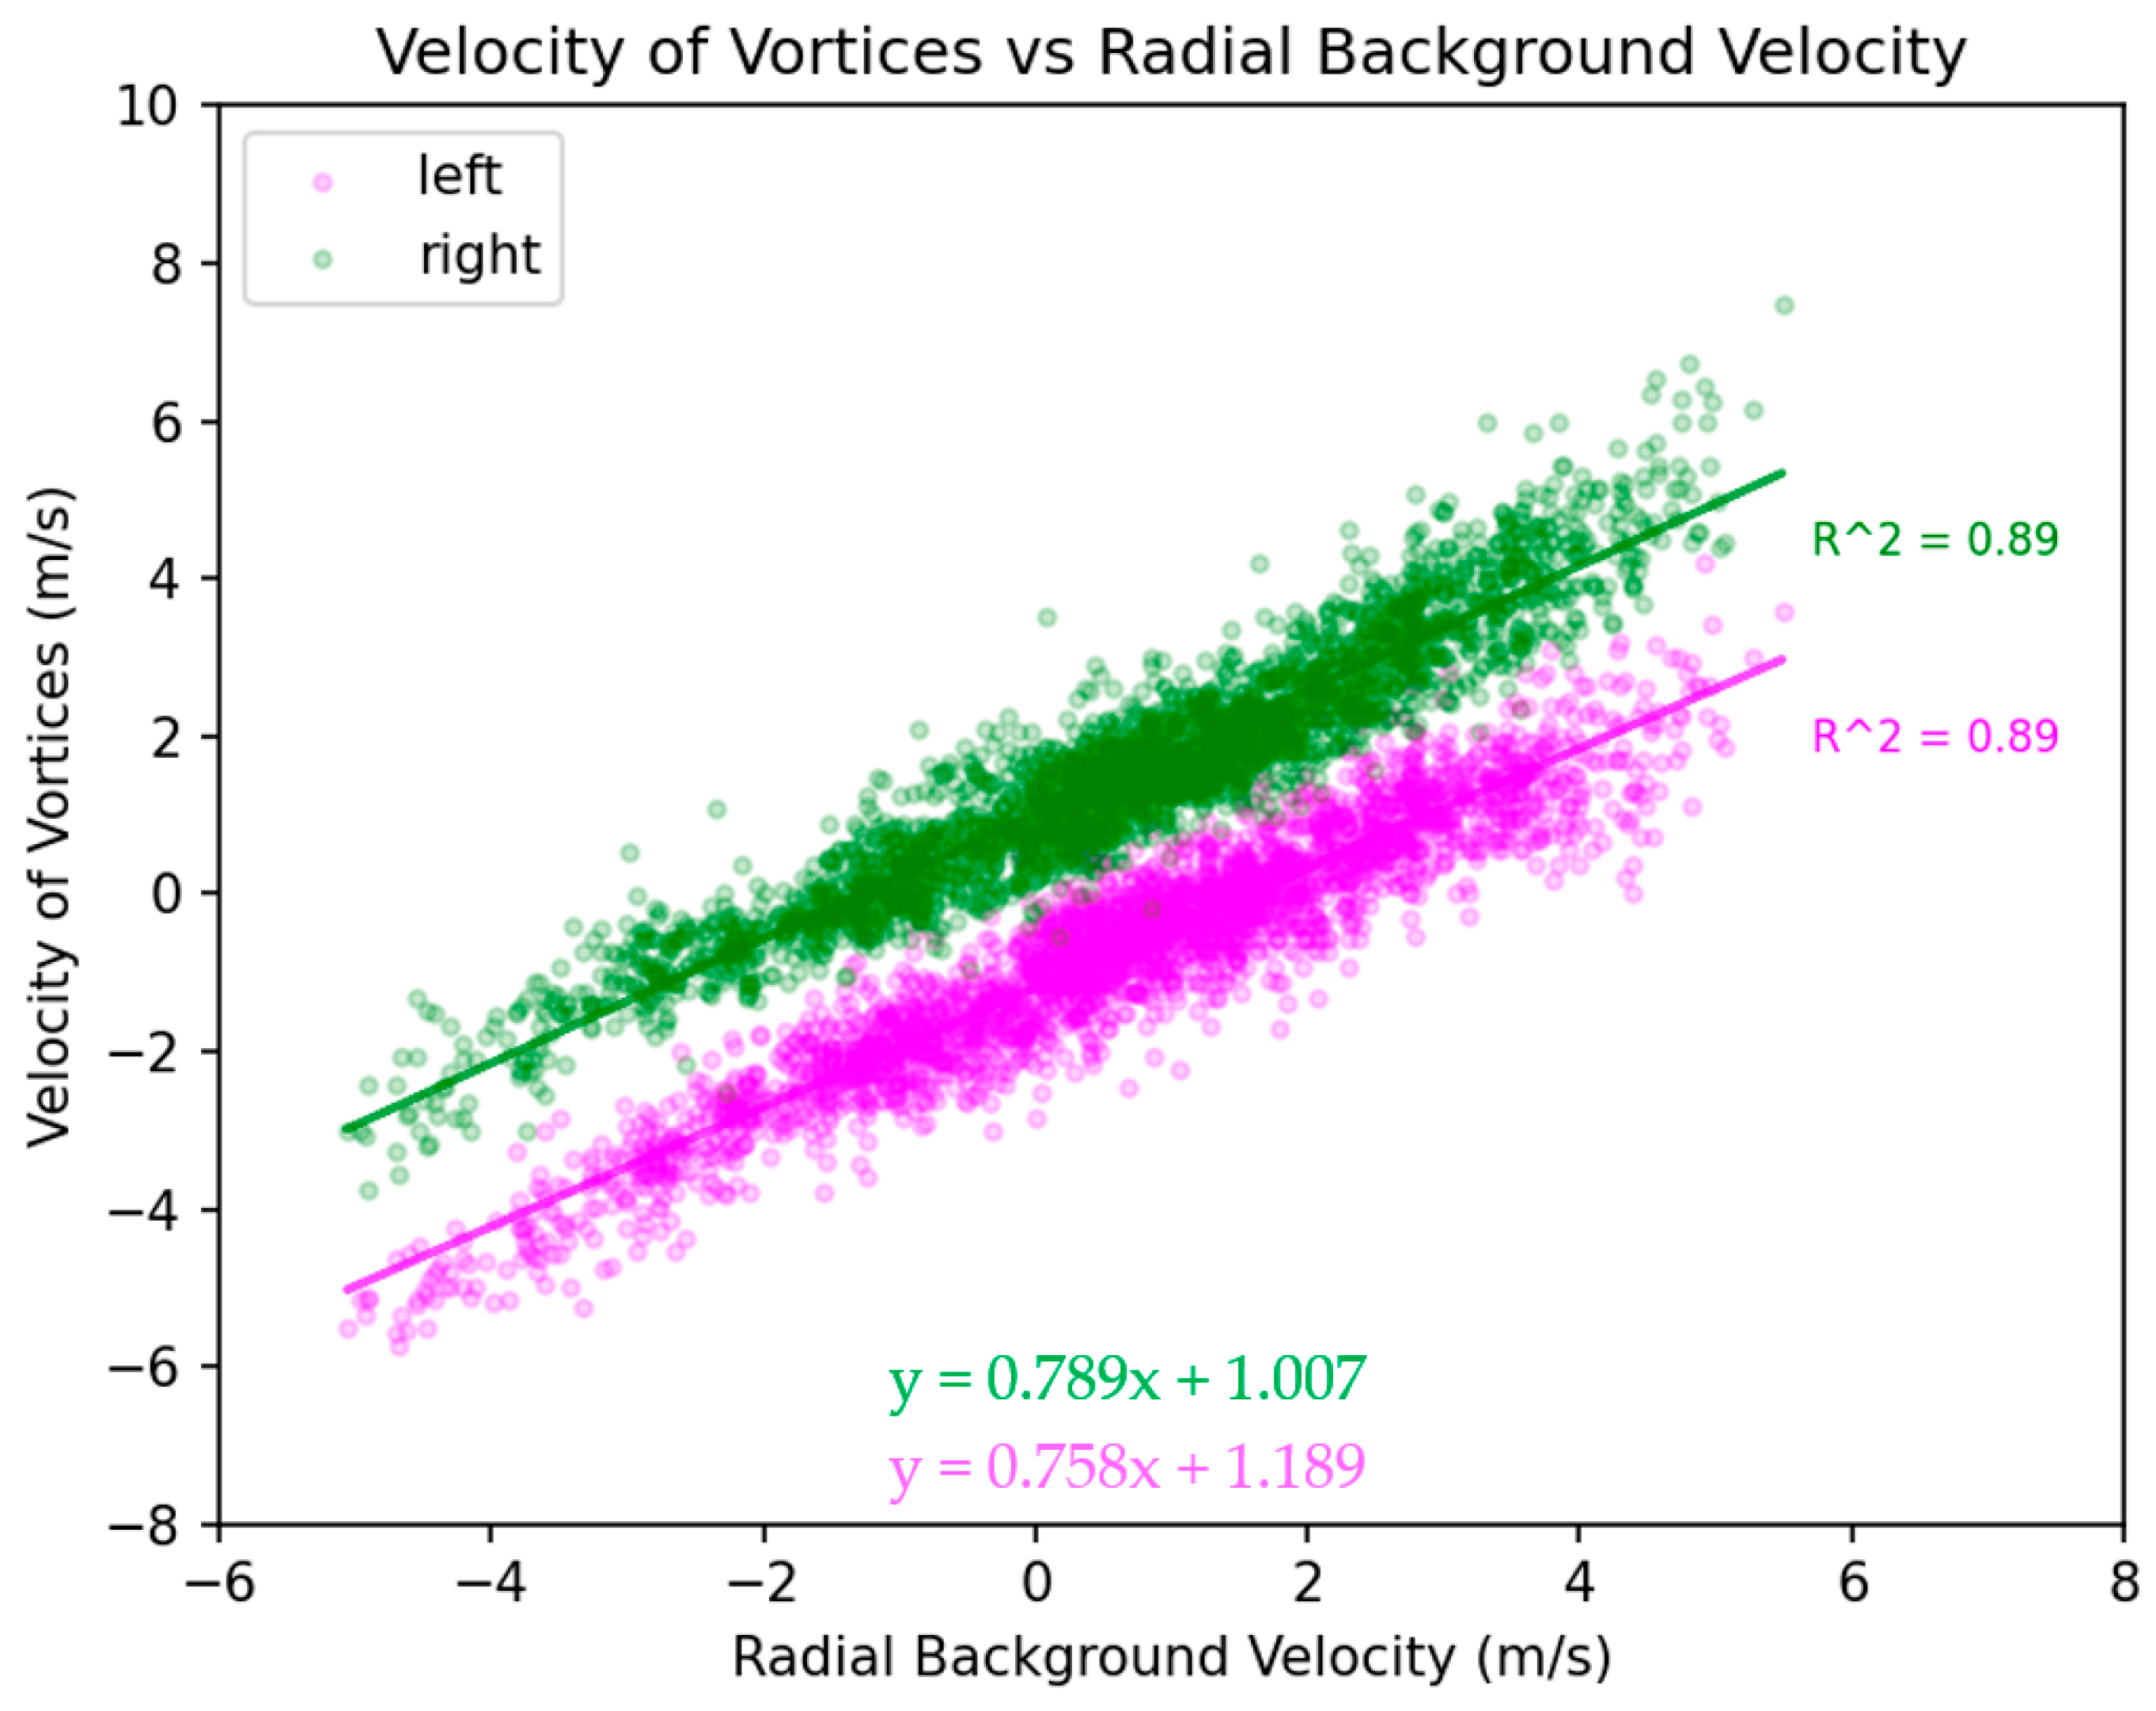
Correlations of wake vortex lifetime with various meteorological and non-meteorological factors were analyzed based on data from the first study period (Table 2). Only weak correlations were observed between vortex lifetime and parameters related to the background radial velocities of the SR-LIDAR system and vortex extrema, aircraft wingspans, initial vortex circulation, relative humidity, instability, and the hour of day. However, in general, the displacement of the vortices increased with the radial background velocity with a strong correlation (Figure 6); therefore, vortices generally moved with the background wind [34,35]. Since the radial velocity in the SR-LIDAR RHI measures only the crosswind on the runway due to the orientation of its scan, the effect of headwind/tailwind was not analyzed in this study. There is a wind mast close to the end of the runway; however, its wind measurement is not always representative of the wind at the altitude of the wake vortices.
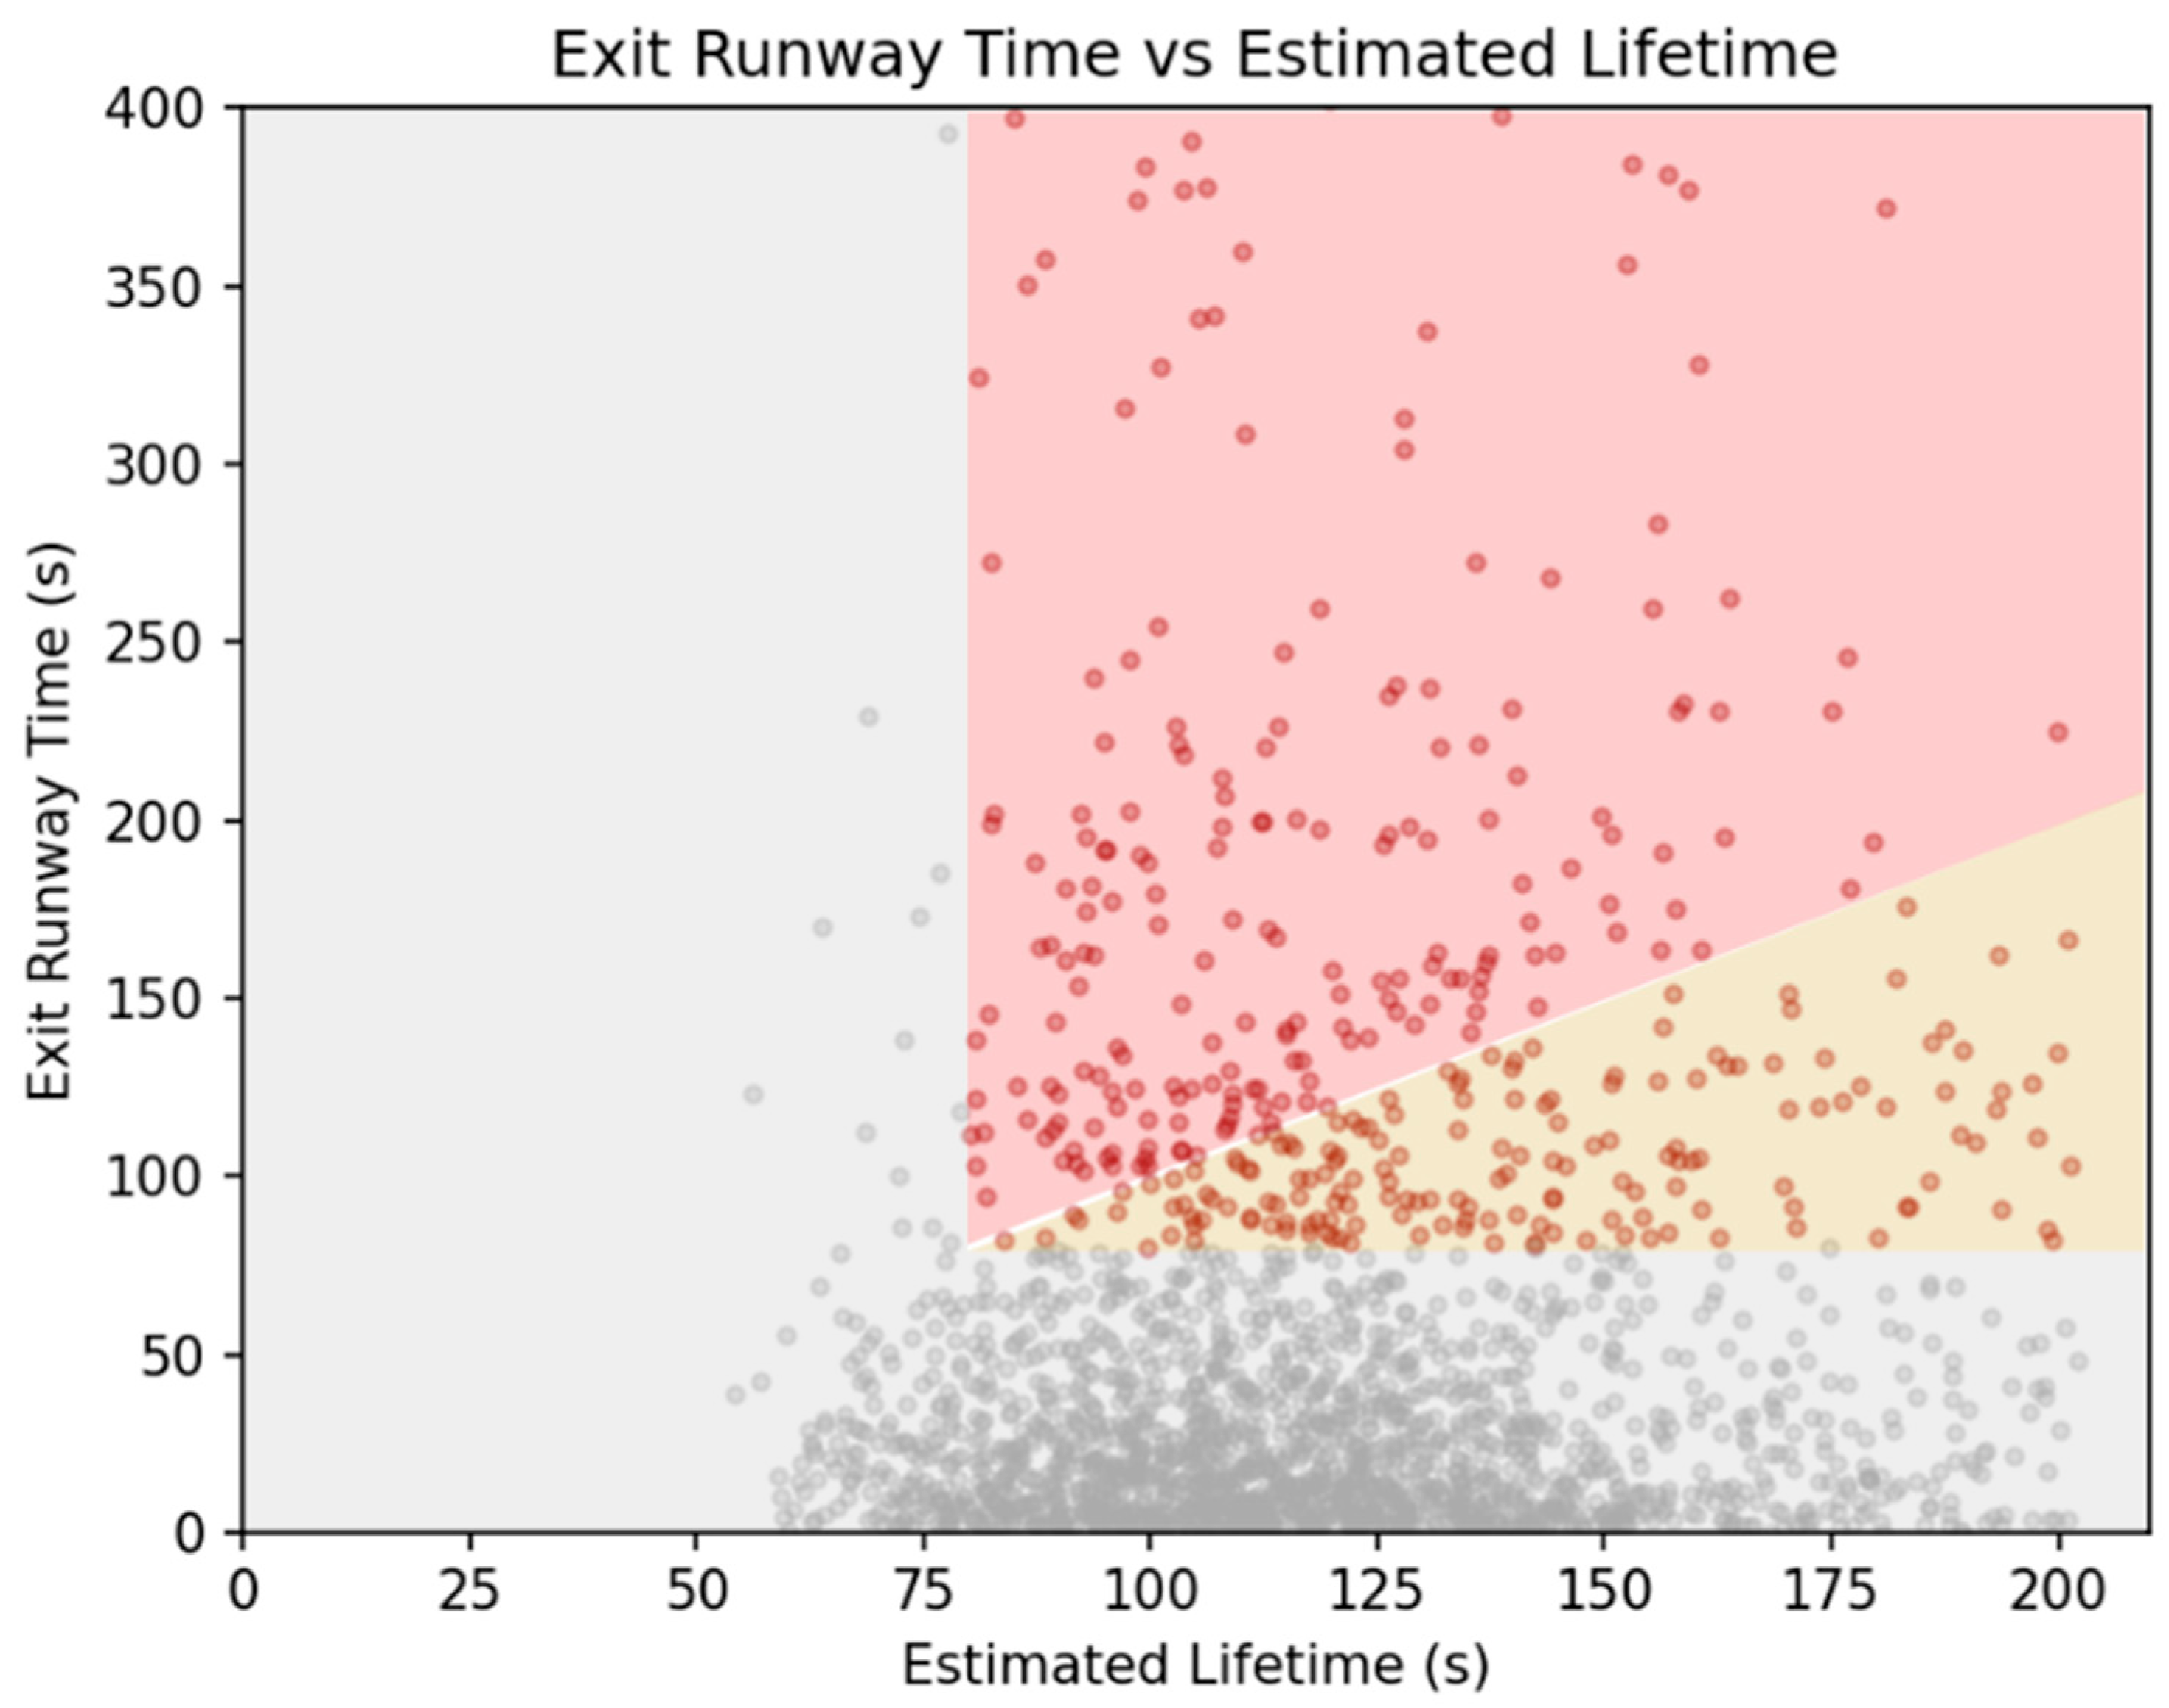
A scatter plot of the runway exit time versus the estimated lifetime of wake vortices is shown in Figure 7. This excludes the outliers of the lifetime shown in Figure 5. According to the ICAO time-based separation minima upon departure, the minimum separation time is 80 s. Vortices that had a lifetime and/or exit time of less than 80 s (grey area in Figure 7; 79.7%)—implying that they have dissipated and/or exited the runway before the arrival of the aircraft—would not have posed any danger to subsequent aircraft. Vortices that exited the runway before dissipation (yellow; 7.78%) would have affected the runway according to the exit times. Vortices that dissipated before exiting the runway (red; 12.5%) would have affected the runway according to their lifetimes. Therefore, the latter two types of vortices in the yellow and red areas in Figure 7 may have been a potential threat to subsequent aircraft.

3.3. Background Wind Measurements

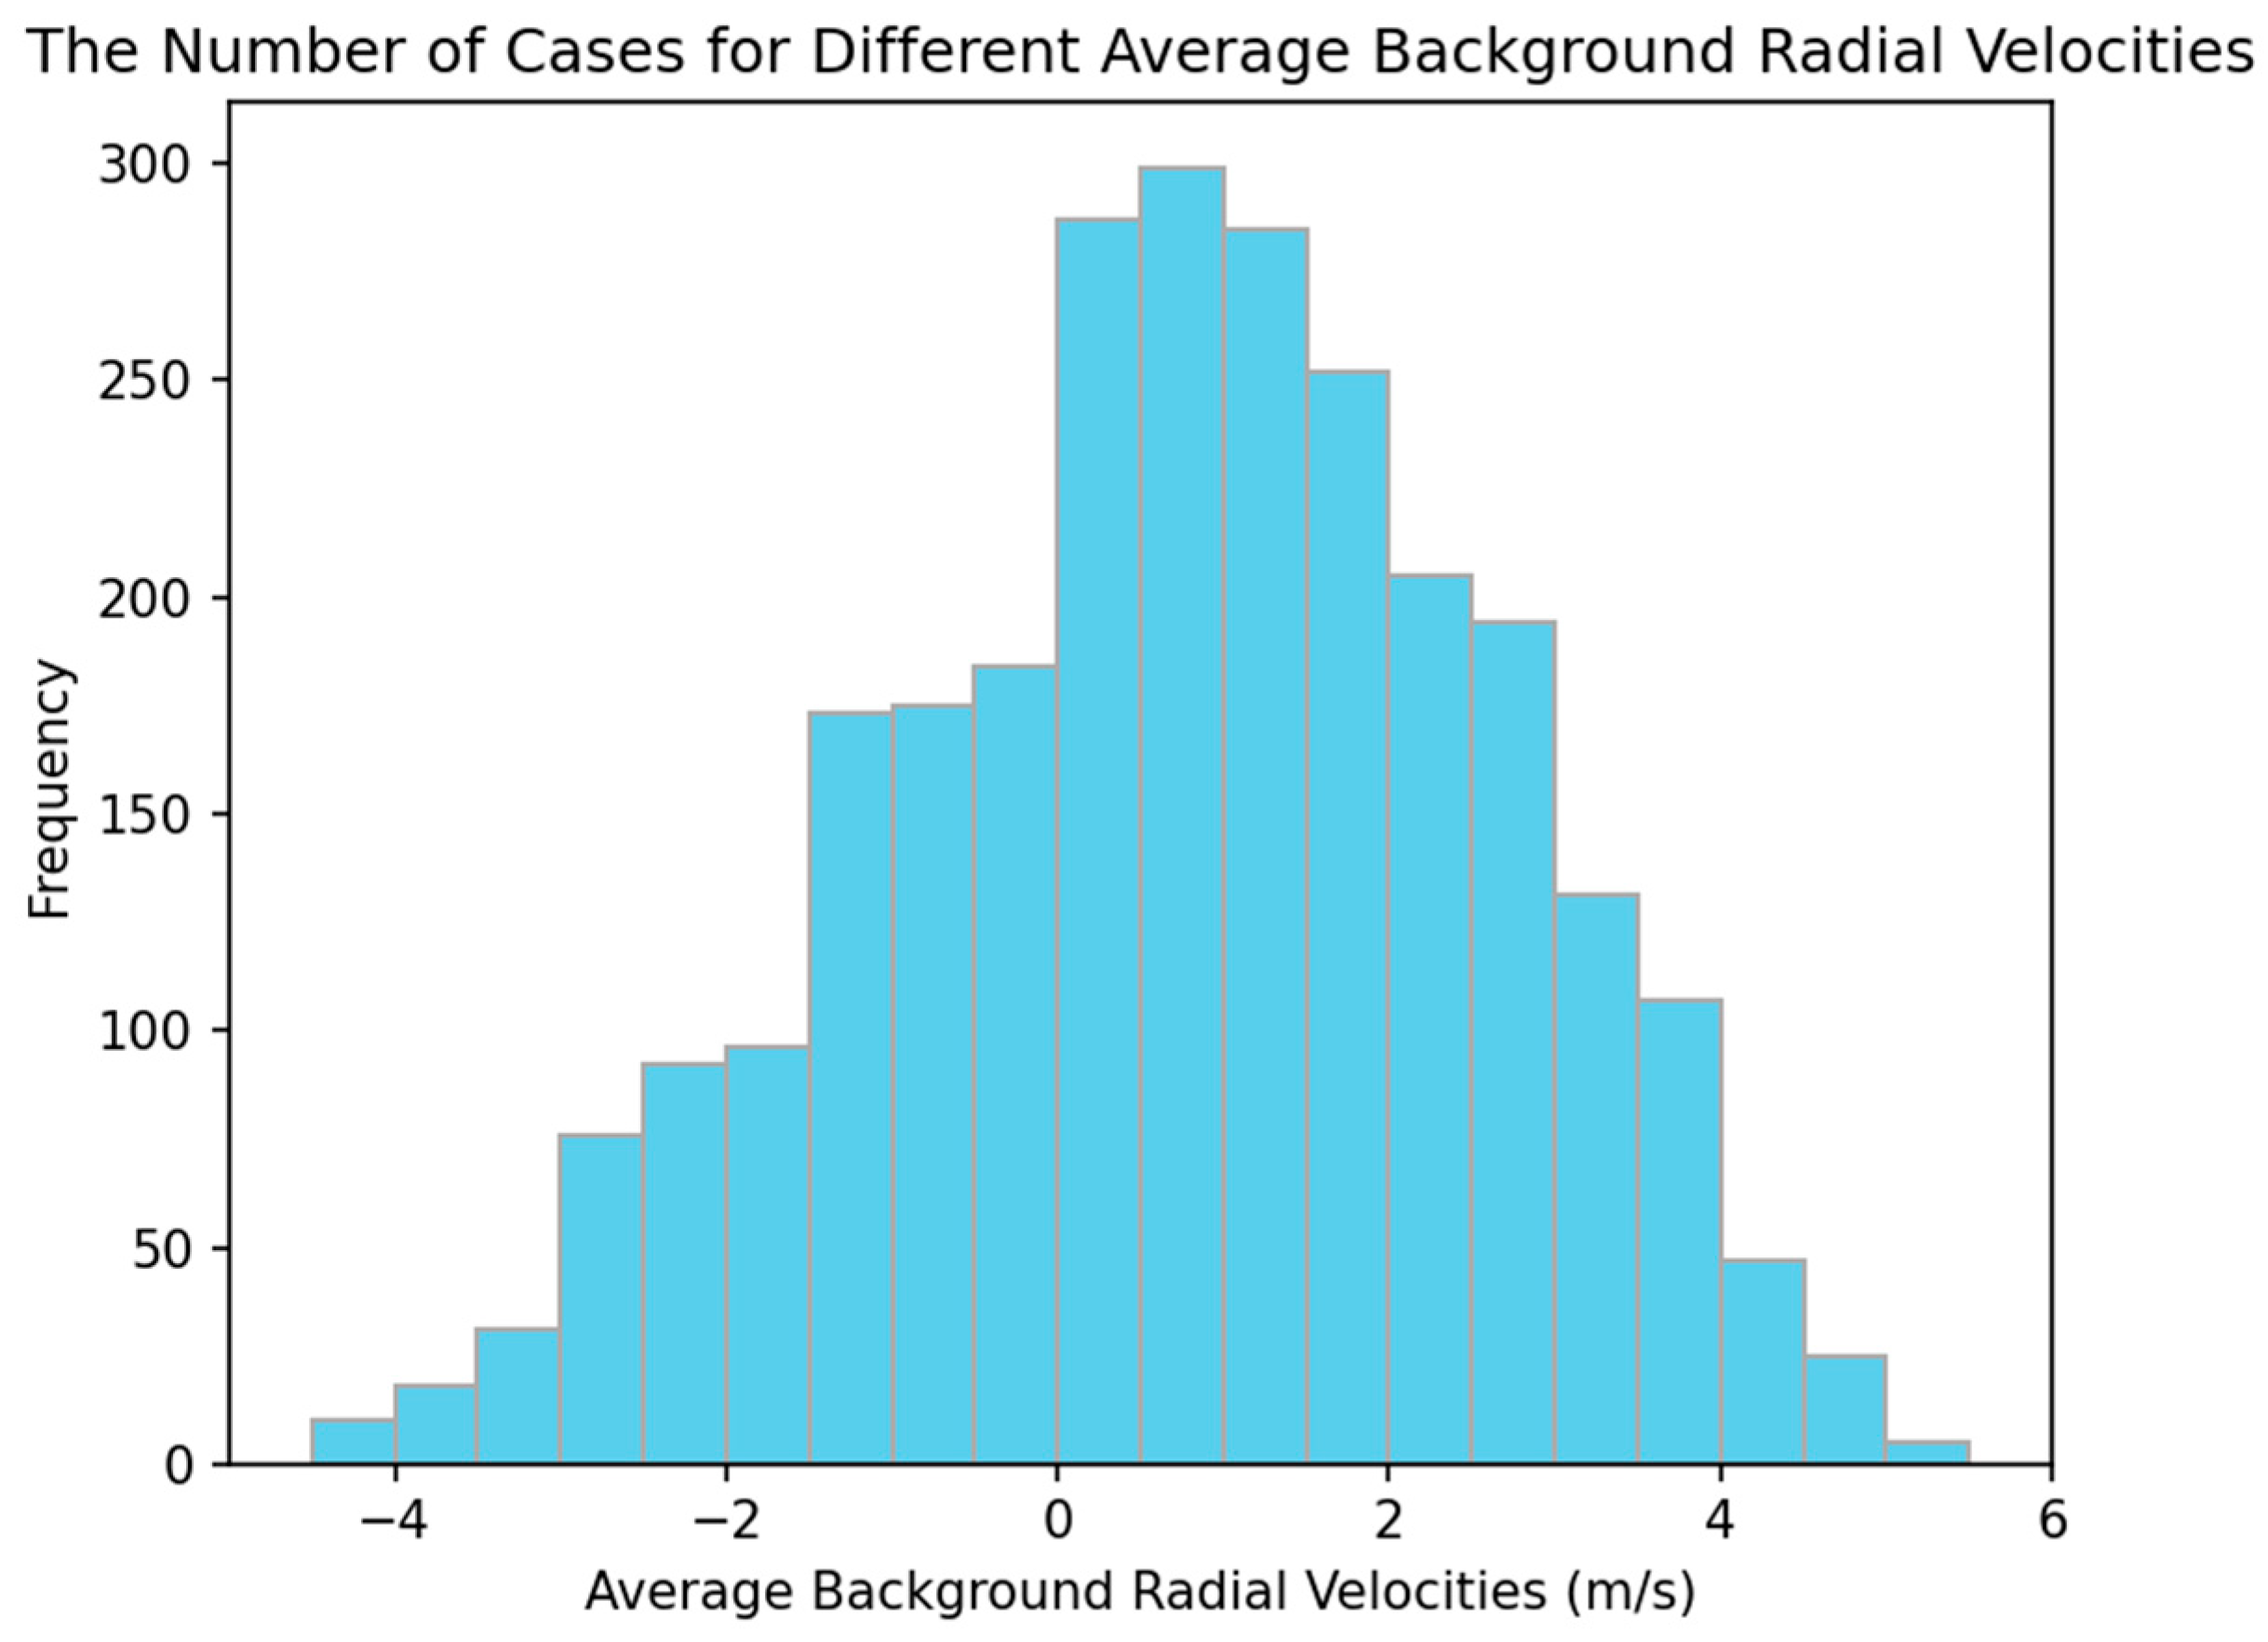
Because the first study period was mostly in late summer and weak southerly winds prevailed, the peak wind velocity was that of a weak wind (in the order of a few m/s) and outbound (southerly winds), as can be seen from the background Doppler velocity distribution (Figure 8). When the background wind was higher, the turbulence tended to be larger, which made it more difficult to track the wake vortices. The maximum magnitude of the Doppler velocity in this study period was only on the order of 5 m/s.

3.4. Dimensionless Analysis of Wake Vortex Lifetime Against EDR and Comparison with Previous Results

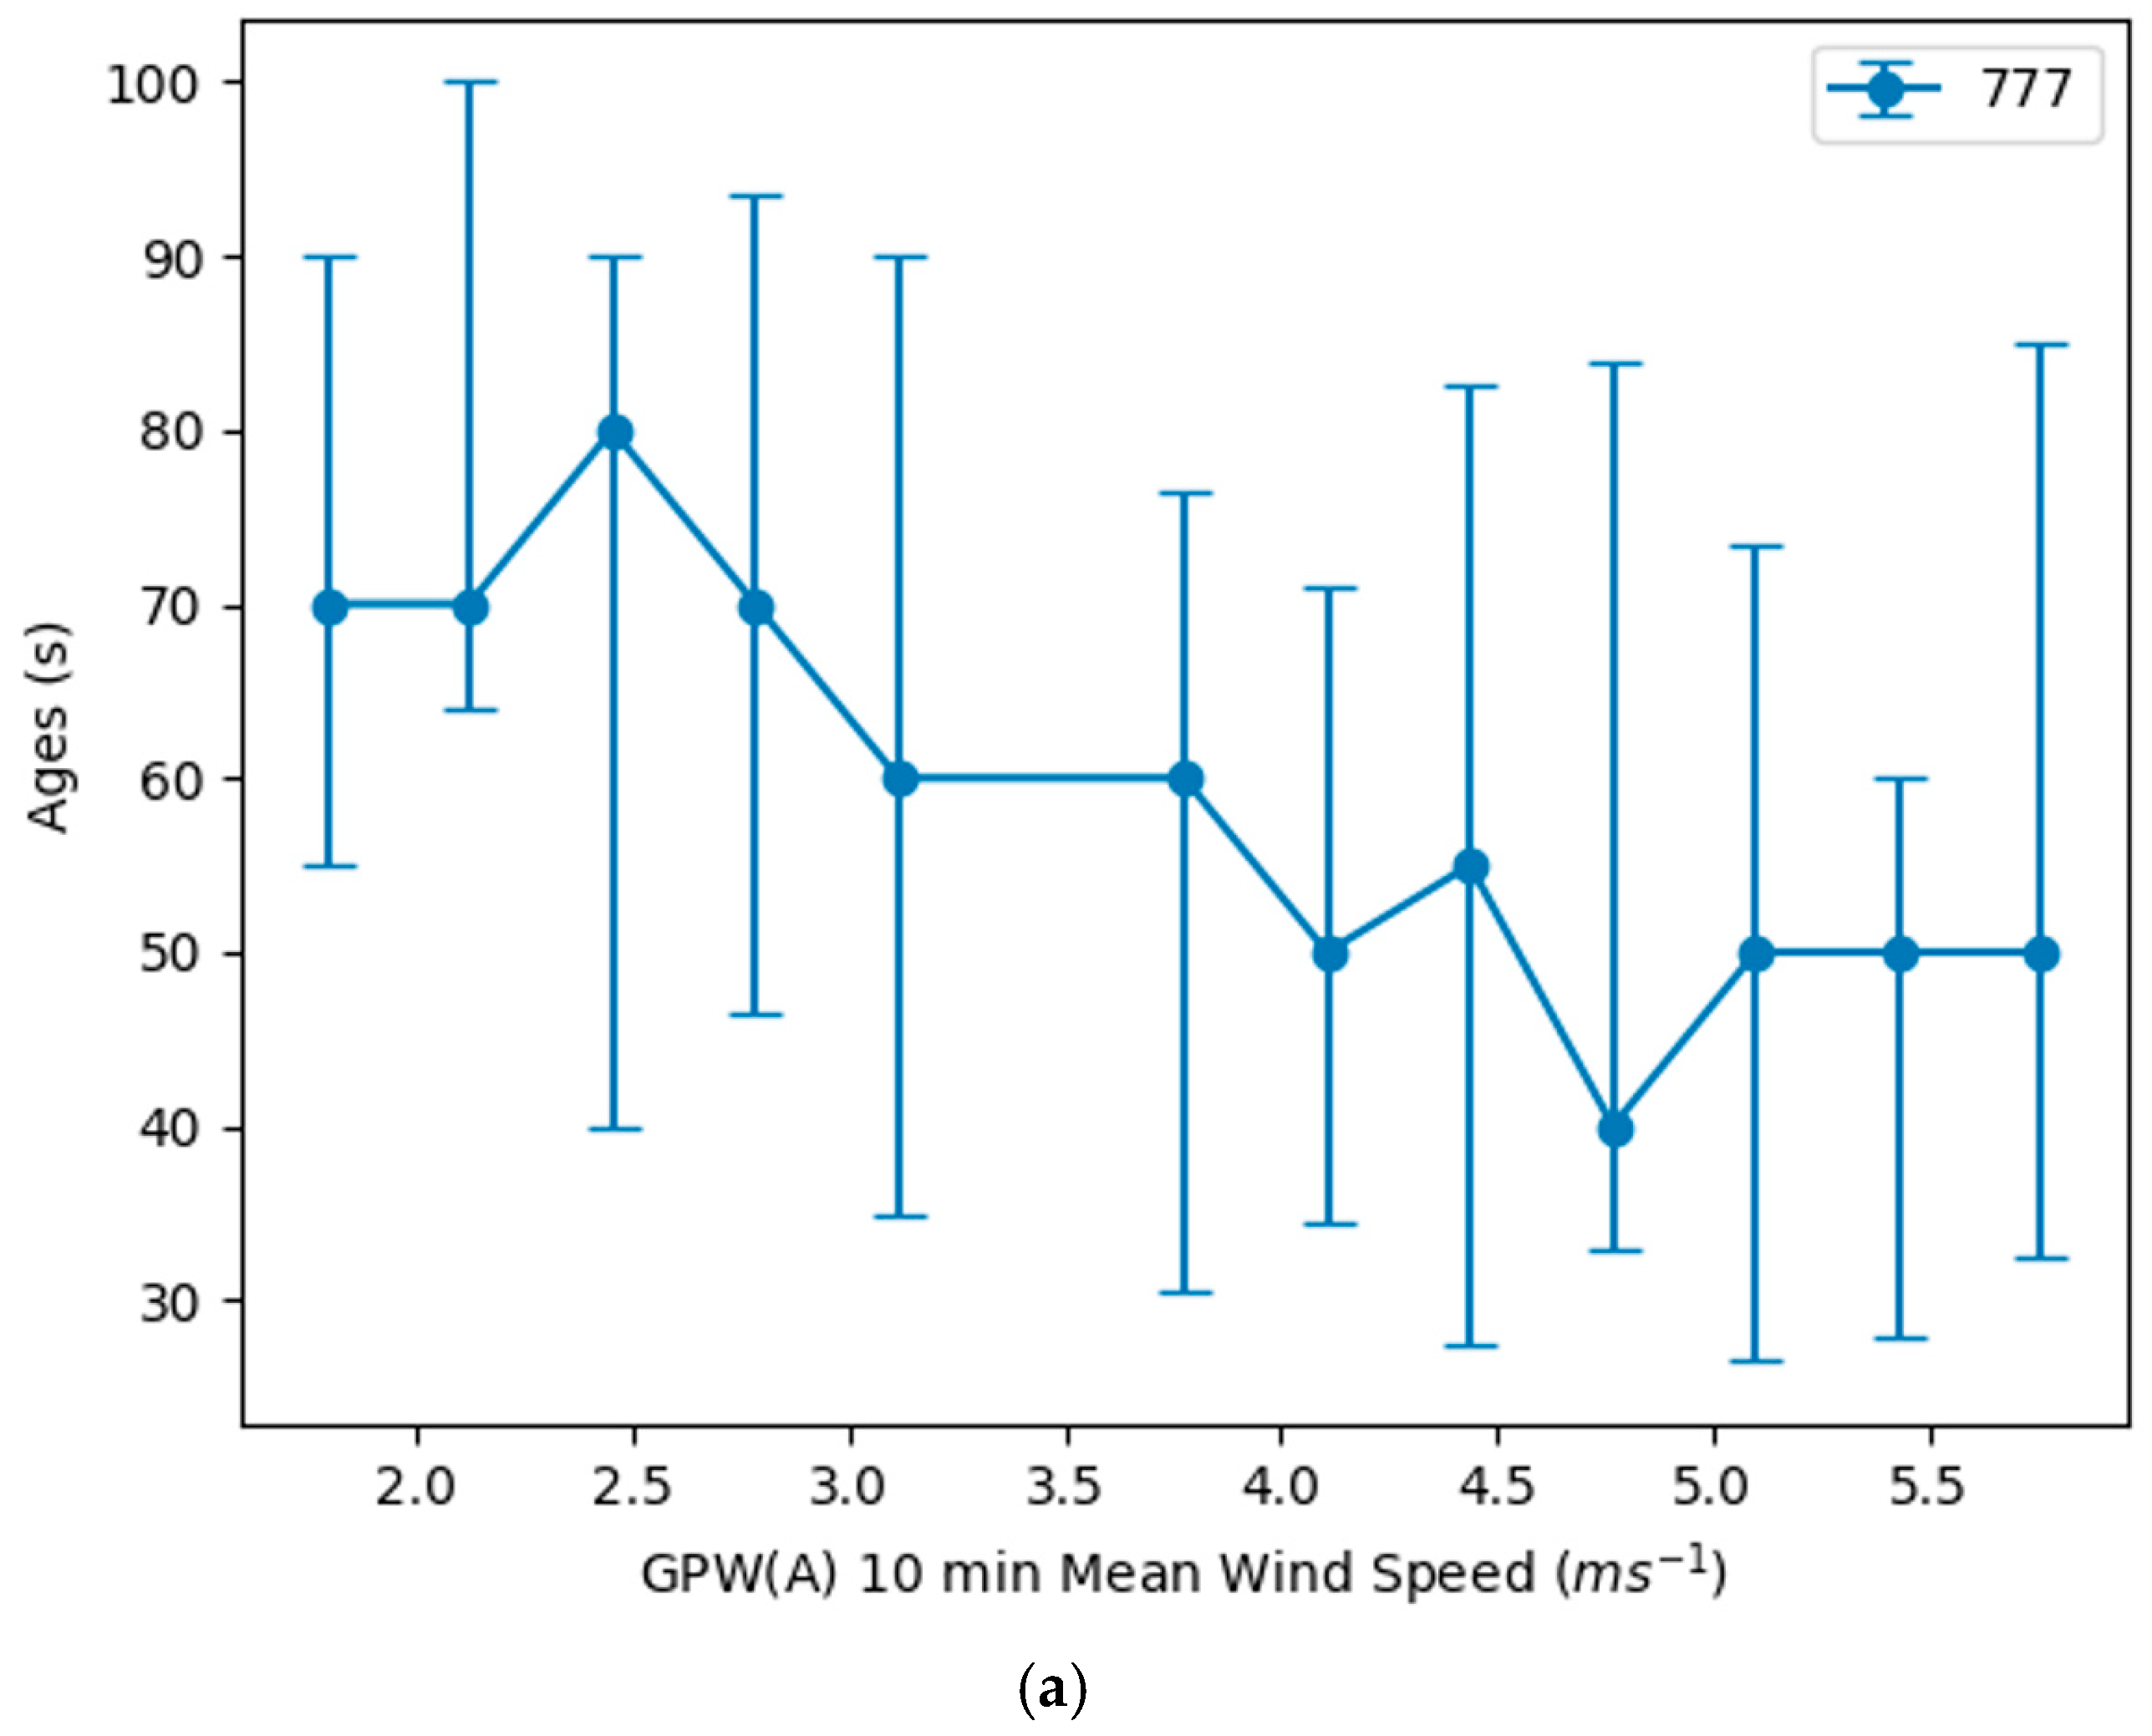
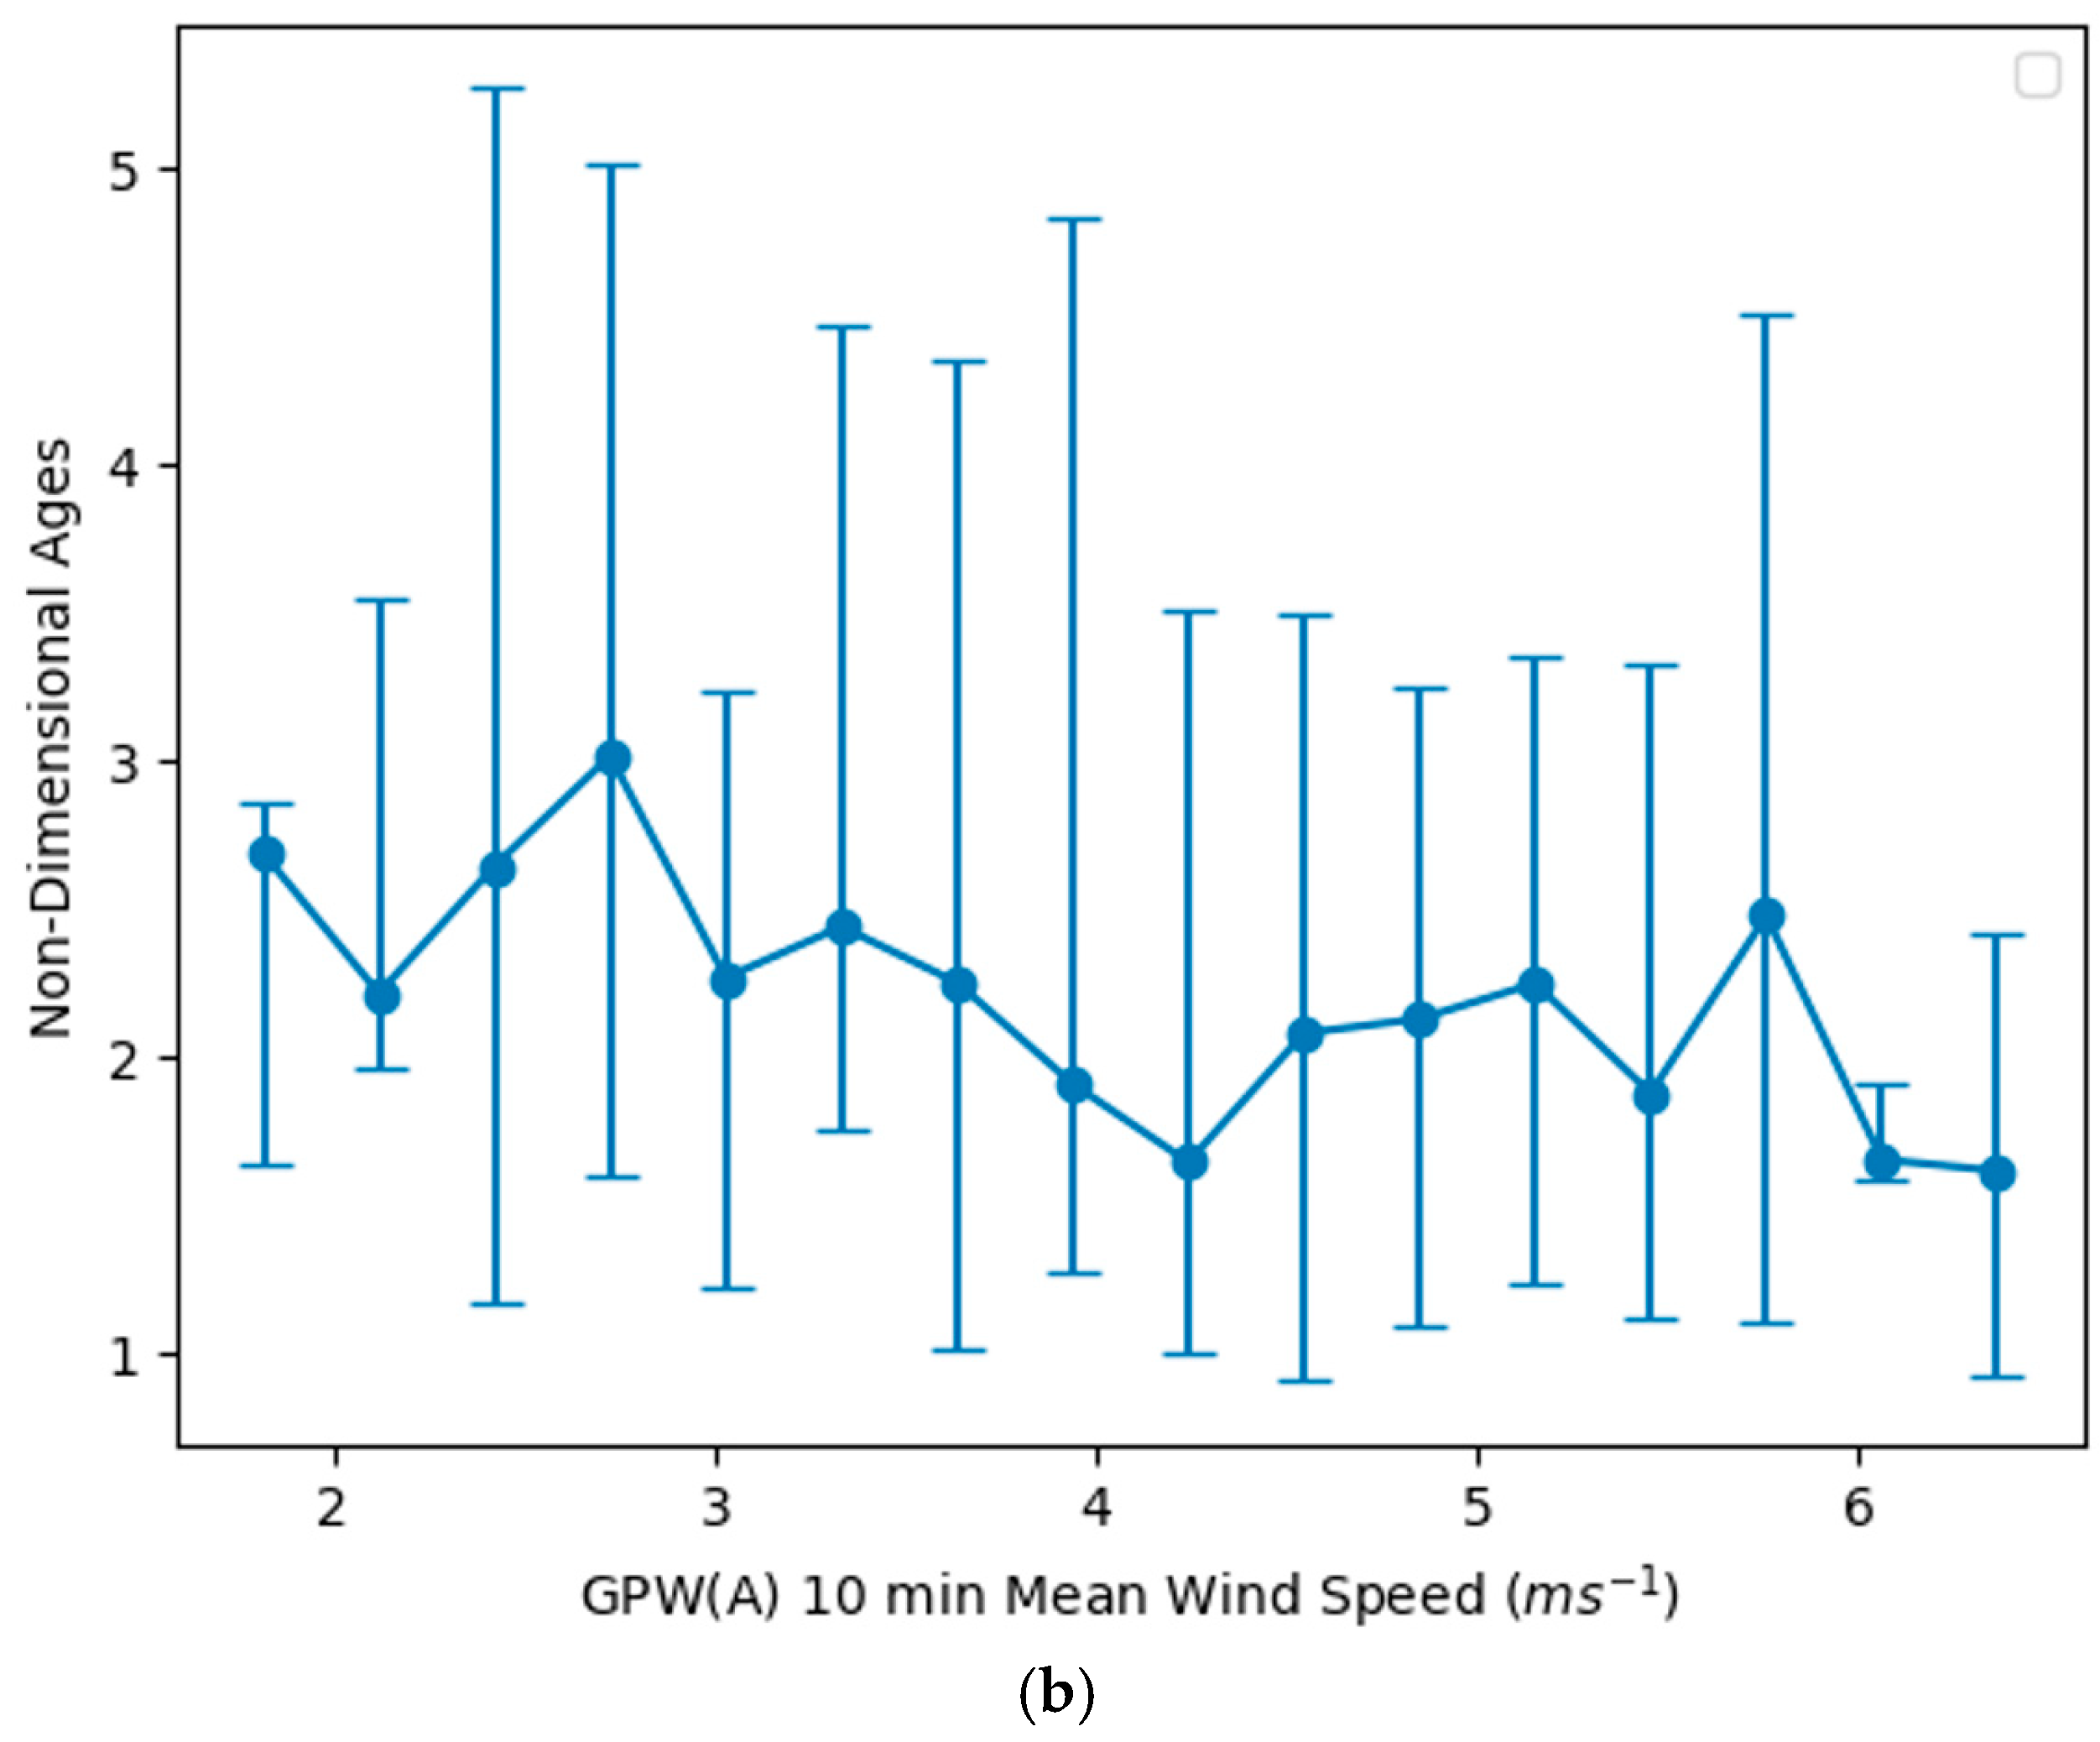
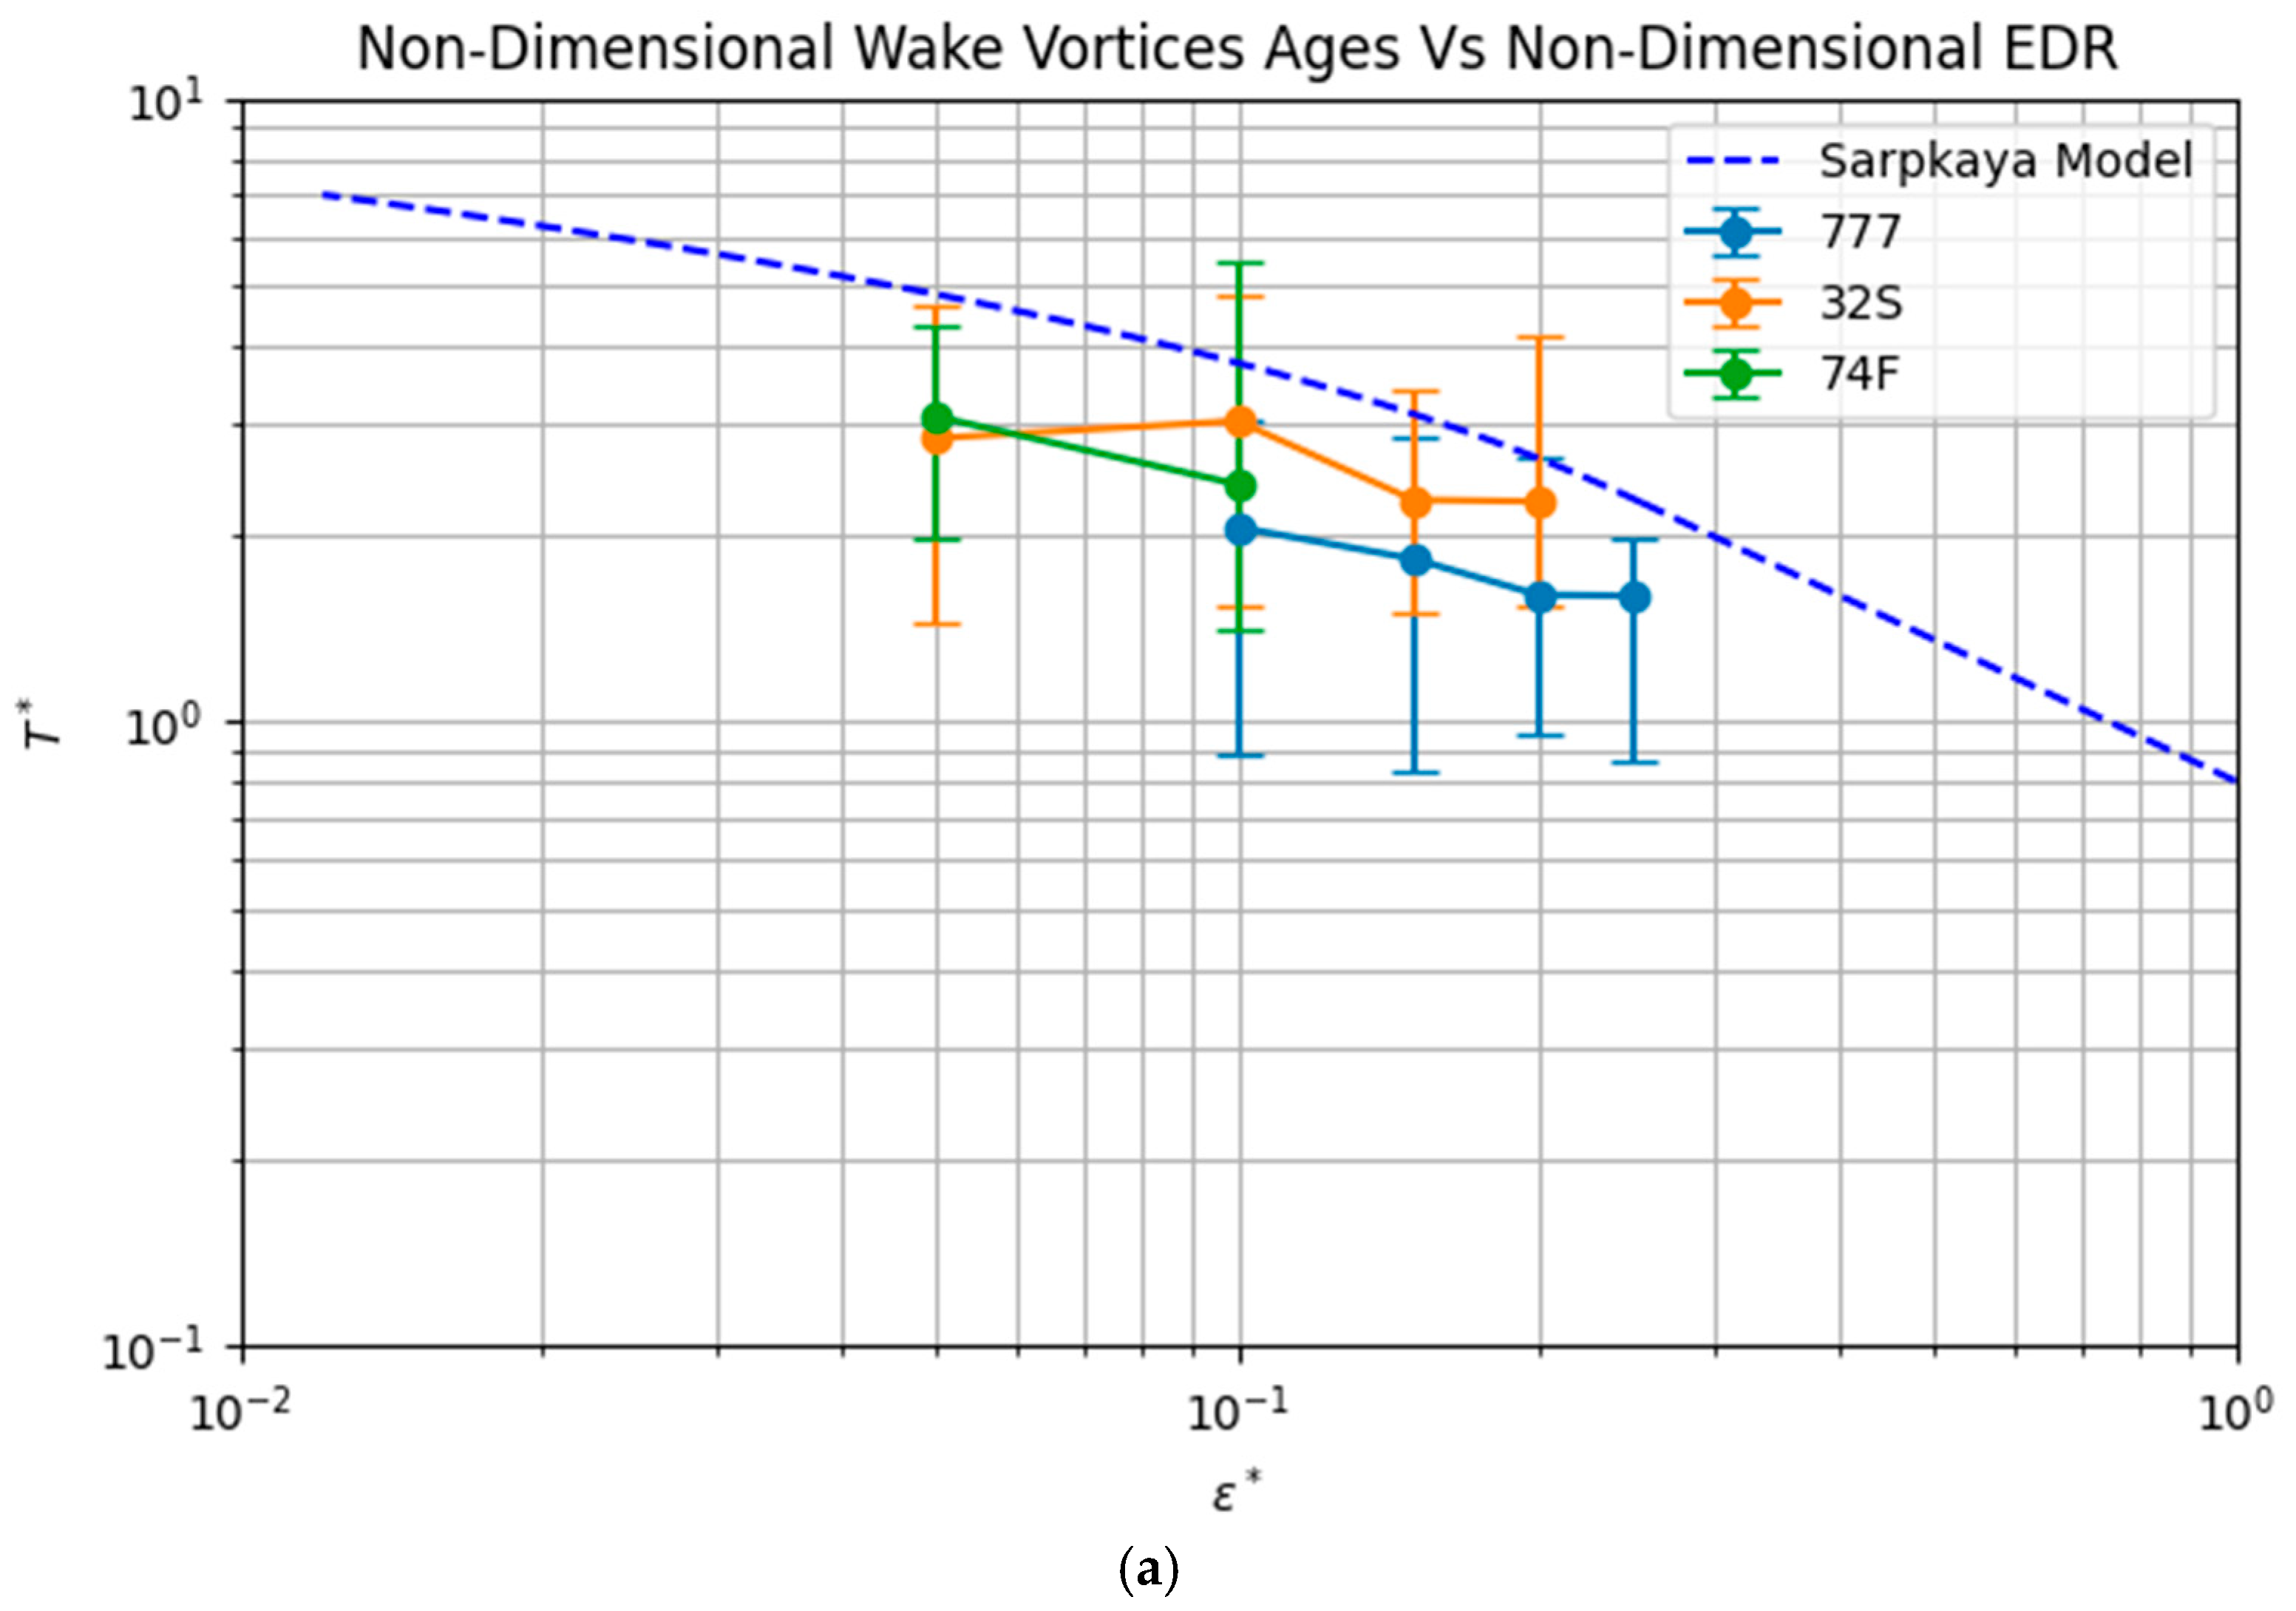
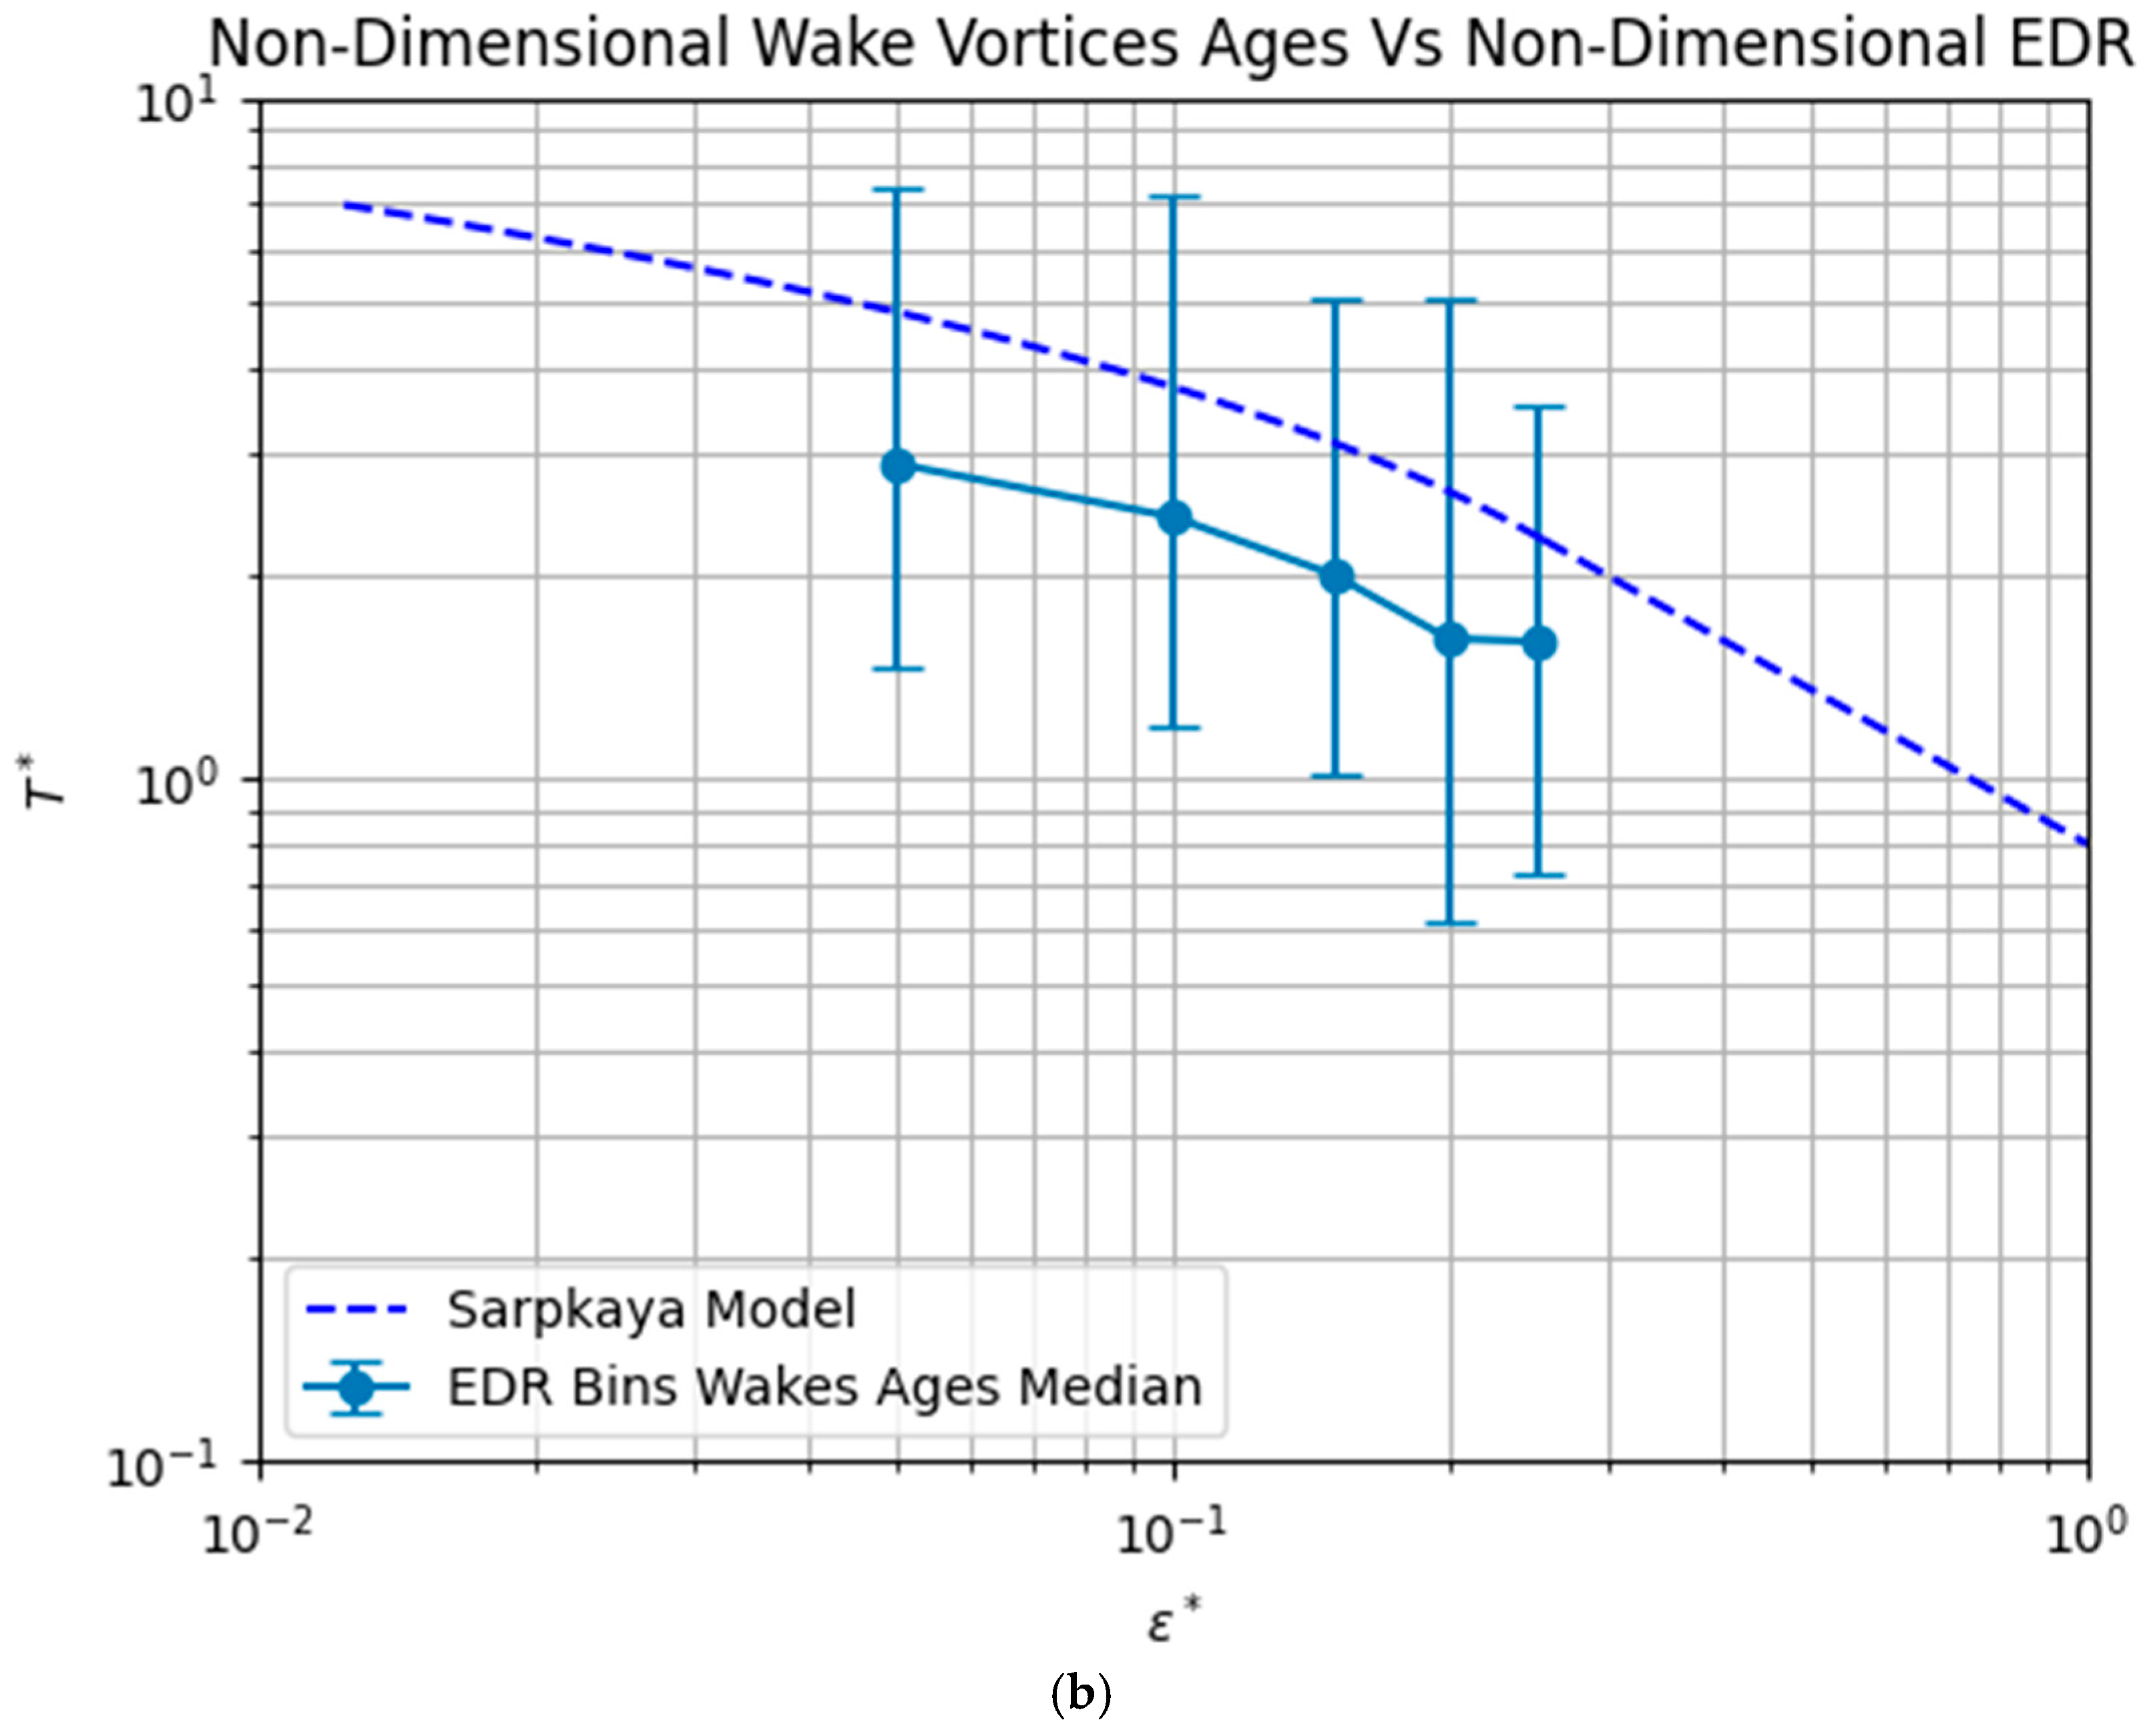
Wake vortices in more turbid air, in general, decay at a faster rate to reach the catastrophic state, but their response to atmospheric turbulence can be analyzed from multiple perspectives, not just the EDR. Thermal instability near the ground will trigger vertical air motion, which may reduce the vortex descent rate and introduce deformation; wind shear at the low level can cause vortex tilting and differential transport; and the presence of eddies in the turbulent background may interact with the vortex roll-up process, accelerating instability such as the Crow instability. We focus on the EDR in the second study period. The results of the present analysis on data collected in study period two regarding the relationship between wake vortex lifetime and atmospheric turbulence intensity measured by the EDR were also compared with existing results from the literature. The lifetimes of the wake vortices for both the original and non-dimensionalized values are plotted against the background wind speed from the nearby anemometer as shown in Figure 9a and Figure 9b, respectively. In comparison with results from a previous study by Wassaf [36], the trend was similar; that is, the lifetime decreases as the background wind speed increases. However, the decreasing trend with wind speed was less steep in the present study. The data was also analyzed following the study of Sarpkaya [37] for examining the wake vortex eddy dissipation model, which predicts that the decay of the vortex pair follows an exponential form as e x p ( C T T c * ) , with C being a constant and T c * a dimensionless time determined by the normalized eddy dissipation rate. A plot of dimensionless lifetime against the non-dimensionalized EDR is presented in Figure 10, together with the results from the study by Sarpkaya [37]. Considering the model curve falls within the error bars, the present results are generally consistent with those of Wassaf and Sarpkaya [36,37]. Given the short period of time covered in the second study period, the results based on the limited dataset, though in agreement with the previous studies, are not statistically robust, and further confirmation with a larger sample size spanning different seasons throughout the year is needed.

4. Conclusions

This study was the first of its kind for aircraft wake vortices at the new north runway of HKIA using RHI scans of an SR-LIDAR system scanning at the runway end. It fills the gaps regarding the lack of wake data for the commissioned north runway at HKIA with the first localized dataset, which is essential for validating and potentially optimizing separation standards. The lifetimes and exit times of the vortices were calculated, and correlations with various meteorological and non-meteorological factors were analyzed. The displacement of the vortices increased with the radial background velocity, and the lifetime, in general, was negatively correlated with the turbulence intensity in terms of the EDR, which is consistent with the results from the literature. It was found that approximately 0.6% of arriving aircraft may be susceptible to the wake vortices left behind by the preceding aircraft. The results of the present study pave the way for longer-term statistical analysis of the behaviour of aircraft wake vortices in the climate of Hong Kong.
The data in this study cover two periods of approximately eight and four weeks, respectively, mostly from summer to early autumn. A similar study should be conducted in the future to cover a much longer period (for example, covering other seasons of the year) using a significantly larger dataset. The behaviour of wake vortices should also be compared with similar studies from other major airports worldwide. In particular, it should be investigated whether there are any observations of wake vortex rebound from the ground under a stable atmospheric boundary layer. The results of such studies will benefit the enhancement of the safety and efficiency of HKIA operations. In this study, the traditional Doppler velocity-thresholding method was adopted. In future studies, the use of AI methods such as those in Ma et al. [38] will become a more viable option for covering data over a much longer period.

Author Contributions

Conceptualization, P.-W.C.; methodology, T.-K.S. and L.-Y.N.; software, T.-K.S. and L.-Y.N.; validation, T.-K.S., L.-Y.N. and P.C.; formal analysis, T.-K.S., P.-W.C., L.-Y.N. and P.C.; investigation, P.-W.C.; resources, P.-W.C.; data curation, T.-K.S. and L.-Y.N.; writing—original draft preparation, T.-K.S. and P.-W.C.; writing—review and editing, P.-W.C. and P.C.; visualization, T.-K.S. and L.-Y.N.; supervision, P.-W.C. and P.C.; project administration, P.C.; funding acquisition, not applicable. All authors have read and agreed to the published version of the manuscript.

Funding

This research received no external funding.

Institutional Review Board Statement

Not applicable.

Informed Consent Statement

Not applicable.

Data Availability Statement

The data presented in this study are not yet available for use by others presently. (The data are part of an ongoing study.)

Conflicts of Interest

The authors declare no conflict of interest.

Abbreviations

CADCivil Aviation Department
HKIAHong Kong International Airport
EDREddy Dissipation Rate
ICAOInternational Civil Aviation Organization
LIDARLight Detection and Ranging
RECAT-EUEuropean Wake Turbulence Categorisation and Separation Minima on Approach and Departure
RHIRange Height Indicator
SR-LIDARShort-range LIDAR

References

  1. Federal Aviation Administration (FAA). Aircraft Wake Turbulence; AC 90-23G; U.S. Department of Transportation: Washington, DC, USA, 2014.
  2. Hallock, J.N. Aircraft Wake Vortices: An Assessment of the Current Situation; U.S. Department of Transportation Report, DOT-FAA-RD-90; U.S.; Department of Transportation: Washington, DC, USA, 1991.
  3. Hallock, J.N.; Holzäpfel, F. A Review of Recent Wake Vortex Research for Increasing Airport Capacity. Prog. Aerosp. Sci. 2018, 98, 27–36. [Google Scholar] [CrossRef]
  4. Gerz, T.; Holzäpfel, F.; Darracq, D. Commercial aircraft wake vortices. Prog. Aerosp. Sci. 2002, 38, 181–208. [Google Scholar] [CrossRef]
  5. Breitsamter, C. Wake vortex characteristics of transport aircraft. Prog. Aerosp. Sci. 2011, 47, 89–134. [Google Scholar] [CrossRef]
  6. International Civil Aviation Organisation (ICAO). Doc 4444, Procedures for Air Navigation Services—Air Traffic Management; International Civil Aviation Organisation (ICAO): Montreal, QC, Canada, 2016. [Google Scholar]
  7. Holzäpfel, F.; Strauss, L.; Schwarz, C. Assessment of Dynamic Pairwise Wake Vortex Separations for Approach and Landing at Vienna Airport. Aerosp. Sci. Technol. 2021, 112, 106618. [Google Scholar] [CrossRef]
  8. Zhang, C.; Pan, W.; Zhu, Y.; Jiang, Y.; Wang, X. Theoretical Assessment of Runway Capacity for Training and Transport Airport Considering Wake Vortex Encounter Safety: A Case Study of Luoyang Beijiao Airport. Appl. Sci. 2025, 15, 11273. [Google Scholar] [CrossRef]
  9. Brandon, J.M.; Jordan, F.L., Jr.; Stuever, R.A.; Buttrill, C.W. Application of Wind Tunnel Free-Flight Technique for Wake Vortex Encounters; No. NAS 1.60: 3672; NASA Center for AeroSpace Information: Linthicum Heights, MD, USA, 1997. [Google Scholar]
  10. Barbaresco, F.; Wasselin, J.P.; Jeantet, A.; Meier, U. Wake vortex profiling by Doppler X-band radar: Orly trials at initial take-off and ILS interception critical areas. In Proceedings of the Radar Conference, Rome, Italy, 26–30 May 2008; Institute of Electrical and Electronics Engineers: New York, NY, USA, 2008. [Google Scholar] [CrossRef]
  11. Köpp, F.; Rahm, S.; Smalikho, I.N. Characterization of aircraft wake vortices by 2-µ m pulsed doppler lidar. J. Atmos. Ocean. Technol. 2004, 21, 194–206. [Google Scholar] [CrossRef]
  12. Smalikho, I.N.; Banakh, V.; Holzäpfel, F.; Rahm, S. Method of radial velocities for the estimation of aircraft wake vortex parameters from data measured by coherent doppler lidar. Opt. Express 2015, 23, A1194–A1207. [Google Scholar] [CrossRef]
  13. George, R.; Yang, J. A Survey for Methods of Detecting Aircraft Vortices. In Proceedings of the 24th Conference on Mechanical Vibration and Noise, Chicago, IL, USA, 12–15 August 2012; pp. 14–50. [Google Scholar] [CrossRef]
  14. Kovalev, D.A.; Vanhoenacker-Janvier, D.; Billuart, P.; Duponcheel, M.; Winckelmans, G. Modeling of Wake Vortex Radar Detection in Clear Air Using Large-Eddy Simulation. J. Atmos. Oceanic Technol. 2019, 36, 2045–2062. [Google Scholar] [CrossRef]
  15. Zhang, Z.; Li, D.; Zhou, J.; Pan, W.; Xu, Z.; Cai, J. Numerical simulation of wake vortex for the flight near the ground with different boundary conditions. Eng. Appl. Comput. Fluid Mech. 2022, 16, 484–500. [Google Scholar] [CrossRef]
  16. Ahmad, N.N.; Proctor, F. Review of Idealized Aircraft Wake Vortex Models. In Proceedings of the 52nd Aerospace Sciences Meeting, National Harbor, MA, USA, 13–17 January 2014. [Google Scholar]
  17. Hennemann, I.; Holzäpfel, F. Large-eddy simulation of aircraft wake vortex deformation and topology. Proc. Inst. Mech. Eng. 2011, 225, 1336–1350. [Google Scholar] [CrossRef]
  18. Vechtel, D.; Stephan, A.; Holzäpfel, F. Simulation Study of Severity and Mitigation of Wake-Vortex Encounters in Ground Proximity. J. Aircr. 2017, 54, 1802–1813. [Google Scholar] [CrossRef]
  19. Yuan, J.; Liu, J.; Li, C.; Zhao, Z. Numerical Study of Aircraft Wake Vortex Evolution under the Influence of Vertical Winds. Appl. Sci. 2024, 14, 86. [Google Scholar] [CrossRef]
  20. Carvalho, G.F.M.d.; Vidille, M.F.; Bimbato, A.M.; Alcântara Pereira, L.A. Lagrangian Vortices Interactions Using Large-Eddy Simulation (LES) and Surface Roughness Model—Application for Aircraft Wake Vortices with Crosswind. Appl. Sci. 2023, 13, 12336. [Google Scholar] [CrossRef]
  21. Duró, J.M.; Bergadà, J.M. Airplane Vortices Evolution Near Ground. Appl. Sci. 2021, 11, 457. [Google Scholar] [CrossRef]
  22. Pan, W.; Yin, H.; Leng, Y.; Zhang, X. Recognition of Aircraft Wake Vortex Based on Random Forest. IEEE Access 2022, 10, 8916–8923. [Google Scholar] [CrossRef]
  23. Niklas, W.; Stephan, A.; Holzäpfel, F.; Rotshteyn, G. Characterizing aircraft wake vortex position and strength using LiDAR measurements processed with artificial neural networks. Opt. Express 2022, 30, 13197–13225. [Google Scholar] [CrossRef]
  24. Ma, Y.; Tang, X.; Shi, Y.; Chan, P.-W. YOLOv8n–CBAM–EfficientNetV2 Model for Aircraft Wake Recognition. Appl. Sci. 2024, 14, 7754. [Google Scholar] [CrossRef]
  25. Wartha, N.; Stephan, A.; Holzäpfel, F. Wake vortex lidar measurement processing with large-eddy simulations and machine learning. Opt. Express 2025, 33, 26473–26498. [Google Scholar] [CrossRef] [PubMed]
  26. Aziz, A.; Mohammad, A. Automatic Recognition of Airliners Wake Turbulence Using Various Tech-niques of Machine Intelligence. Results Eng. 2024, 23, 102624. [Google Scholar] [CrossRef]
  27. Rooseleer, F.; Treve, V. RECAT-EU—European Proposal for Revised Wake Turbulence Categorisation and Separation Minima on Approach and Departure; Eurocontrol Technical Report; Eurocontrol: Brussels, Belgium, 2013; p. 32. [Google Scholar]
  28. Hon, K.K.; Chan, P.W. Aircraft Wake Vortex Observations in Hong Kong. J. Radars 2017, 6, 709–718. [Google Scholar] [CrossRef]
  29. Hon, K.K.; Chan, P.W.; Chim, K.C.Y.; De Visscher, I.; Thobois, L.; Rooseleer, F.; Troiville, A. Wake Vortex Measurements at the Hong Kong International Airport. In Proceedings of the AIAA SCITECH 2022 Forum, San Diego, CA, USA, 3–7 January 2022. [Google Scholar] [CrossRef]
  30. Civil Aviation Department (CAD). Aeronautical Information Publication, ENR 1.6. CAD, HKSARG. 2025. Available online: https://www.ais.gov.hk (accessed on 12 November 2025).
  31. Wu, S.; Zhai, X.; Liu, B. Aircraft Wake Vortex and Turbulence Measurement Under near-Ground Effect Using Coherent Doppler Lidar. Opt. Express 2019, 27, 1142–1163. [Google Scholar] [CrossRef] [PubMed]
  32. Chan, P.W. Generation of an Eddy Dissipation Rate Map at the Hong Kong International Airport Based on Doppler Lidar Data. J. Atmos. Ocean. Technol. 2011, 28, 37–49. [Google Scholar] [CrossRef]
  33. Holzäpfel, F. Analysis of potential wake vortex encounters at a major European airport. Aircr. Eng. Aerosp. Technol. Int. J. 2017, 89, 634–643. [Google Scholar] [CrossRef]
  34. Burnham, D.C.; Hallock, J.N. Wind Effects on the Lateral Motion of Wake Vortices; DOT/FAA/AAR-99/DOT; Volpe National Transportation Systems Center: Cambridge, MA, USA, 1999. [Google Scholar]
  35. Holzäpfel, F.; Steen, M. Aircraft wake-vortex evolution in ground proximity: Analysis and parameterization. Am. Inst. Aeronaut. Astronaut. J. 2007, 45, 218–227. [Google Scholar] [CrossRef]
  36. Wassaf, H.S.; Wang, F.Y.; Soares, M. Atmospheric Turbulence Effects on Near-Ground Wake Vortex Demise. In Proceedings of the American Meteorological Society 13th Conference on Aviation, Range, and Aerospace Meteorology, New Orleans, LA, USA, 21–24 January 2008. [Google Scholar]
  37. Sarpkaya, T.; Robins, R.E.; Delisi, D.P. Wake-Vortex Eddy-Dissipation Model Predictions Compared with Observations. J. Aircr. 2001, 38, 687–692. [Google Scholar] [CrossRef]
  38. Ma, Y.; Zhao, J.; Han, H.; Chan, P.W.; Xiong, X. Aircraft Wake Recognition Based on Improved ParNet Convolutional Neural Network. Appl. Sci. 2023, 13, 3560. [Google Scholar] [CrossRef]
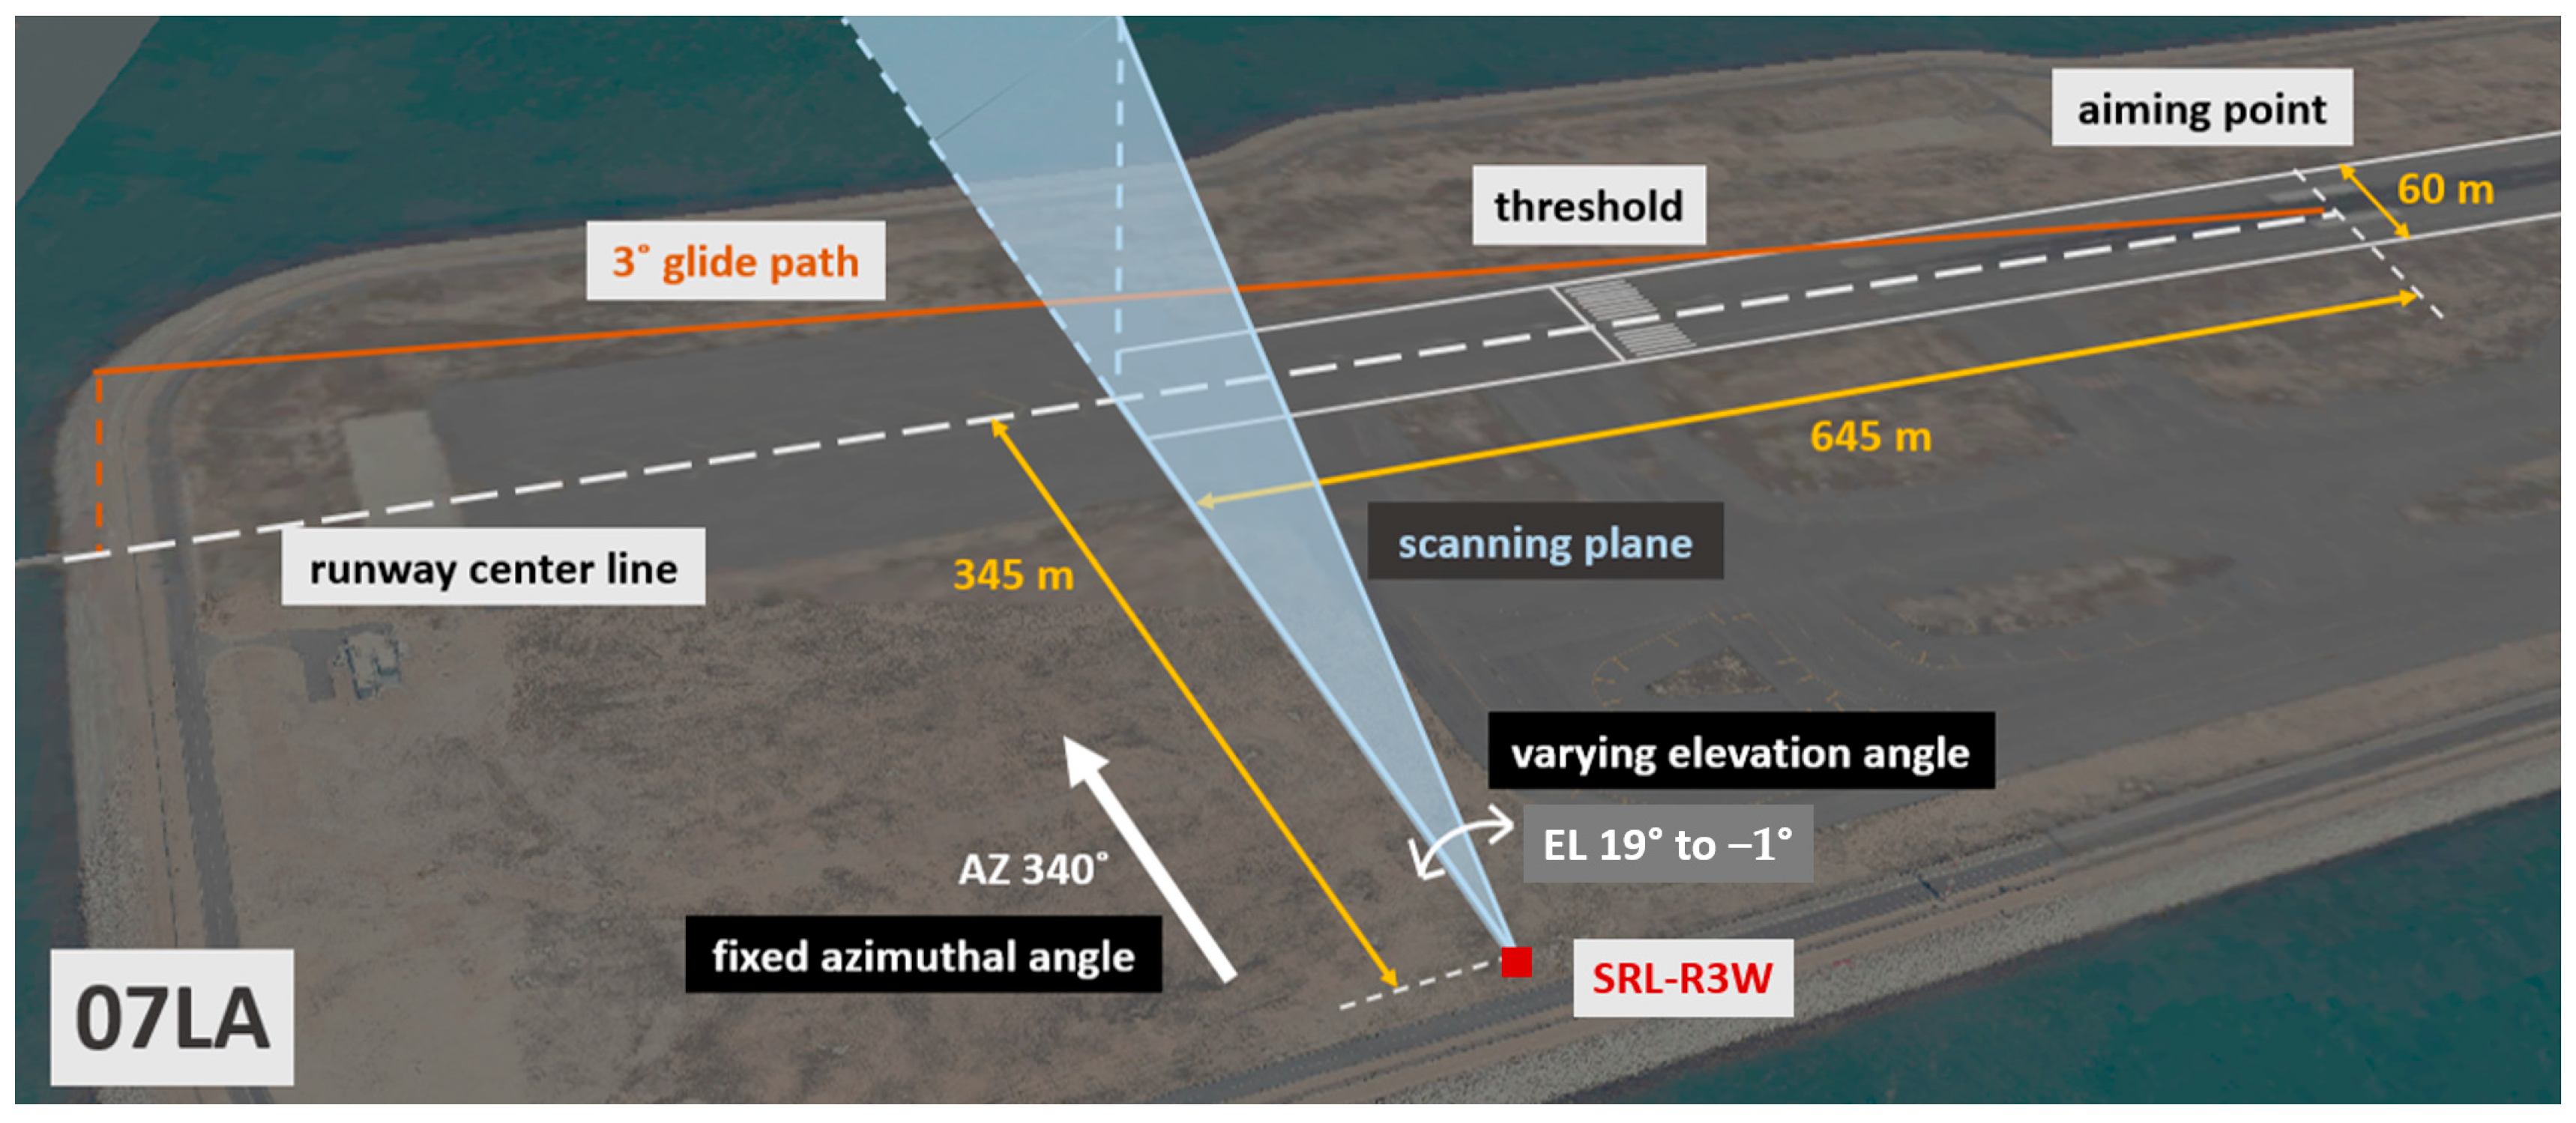
Figure 1. Location of the SR-LIDAR system, marked as SRL-R3W, at the northern runway of Hong Kong International Airport, its geometric position relative to the runway, and range-height indicator scanning plan.
Applsci 15 12466 g001
Figure 2. (a) Typical double-peak structure shown on the Doppler-velocity-range profile from the range–height indicator scan when it contains a pair of trailing vortices from the aircraft, and (b) the schematic diagram of the automatic algorithm to identify the location of true extrema of the detected wake vortices by comparing the radial velocities with surrounding cells, i.e., adjacent gates and rays.
Applsci 15 12466 g002
Figure 3. Categorical distribution of different aircraft types in the dataset of the first study period.
Applsci 15 12466 g003
Figure 4. Case of type A333 aircraft showing (a) extrapolation for determining the wake dissipation time, and (b) time series of estimated dissipation time from different scans.
Applsci 15 12466 g004
Figure 5. Wake vortex lifetime against the averaged SR-LIDAR system background radial velocity. The boxplot on the right-hand side shows the statistical distribution of all data collapsed onto a single axis, and the median, 25th, and 75th percentile values are shown.
Applsci 15 12466 g005
Figure 6. Left and right vortex velocity plotted against background radial velocity from the SR-LIDAR system.
Applsci 15 12466 g006
Figure 7. Time for wake vortices to exit the runway against the corresponding wake lifetime. Long-life vortices remaining on the runway for extended periods of time are of greatest concern to subsequent landing aircraft. Vortices in the grey area had a lifetime and/or exit time of less than 80; vortices in the yellow area exited the runway before dissipation; and vortices in the red area dissipated before exiting the runway.
Applsci 15 12466 g007
Figure 8. Average background radial velocities.
Applsci 15 12466 g008
Figure 9. Wake lifetime against wind speed recorded at the nearby anemometer for (a) lifetime in seconds and (b) lifetime converted to dimensionless units.
Applsci 15 12466 g009aApplsci 15 12466 g009b
Figure 10. Plots and fitted curves for dimensionless wake lifetimes against dimensionless eddy dissipation rate for (a) individual aircraft types and (b) a combination of all aircraft types. T* and ε* indicate dimensionless age and eddy dissipation rate, respectively.
Applsci 15 12466 g010aApplsci 15 12466 g010b
Table 1. Specifications of the SR-LIDAR system used for the study.
DescriptionSpecification
Location (Latitude, Longitude)(22.3181 N, 113.8815 E)
Scanning modeRange–height indicator (RHI)
Radial range3000 m
Gate length12 m
Doppler range38.0 to −38.0 ms−1
Resolution0.1 ms−1 (approx.)
Scanning rate10 s/scan
Azimuthal angle340°
Elevation angle19° to −1°
Angular resolution0.5° (approx. 40 rays/frame)
ManufacturerHALO Photonics, Lumibird Group
ModelStreamline XR
Table 2. Correlation between wake vortex lifetime and various meteorological and non-meteorological parameters.
FactorsCorrelation
rp-Value
Background radial velocity in the SR-LIDAR scan−0.0970.000
Maximum radial velocity difference between extrema of vortices and background radial velocity−0.2470.000
Relative humidity0.0920.106
Instability−0.0330.437
Wingspan−0.0150.452
Initial circulation0.1590.000
Hour of the day0.0040.827
Disclaimer/Publisher’s Note: The statements, opinions and data contained in all publications are solely those of the individual author(s) and contributor(s) and not of MDPI and/or the editor(s). MDPI and/or the editor(s) disclaim responsibility for any injury to people or property resulting from any ideas, methods, instructions or products referred to in the content.