Article

Implementing Decentralised Mechanical Ventilation Systems in Existing School Classrooms: A CFD-Based Performance Assessment

1
Department of Architecture, Built Environment and Construction Engineering Politecnico di Milano, 20133 Milan, Italy
2
Department of Energy Efficiency ENEA, 00123 Rome, Italy
*
Author to whom correspondence should be addressed.
Appl. Sci. 2025, 15(23), 12350; https://doi.org/10.3390/app152312350
Submission received: 24 October 2025 / Revised: 14 November 2025 / Accepted: 19 November 2025 / Published: 21 November 2025

Abstract

The COVID-19 pandemic has renewed focus on the essential role of ventilation in maintaining good indoor air quality and low airborne transmission risks in school buildings, thereby supporting occupant well-being. However, many European classrooms still depend on natural ventilation, which often proves insufficient, especially during the heating season. Consequently, the integration of Mechanical Ventilation Systems (MVSs) with heat recovery in existing classrooms has become increasingly adopted, and decentralised MVS solutions, favoured for their minimal installation impact, have gained particular traction. Yet, despite their widespread implementation, a notable gap remains in the investigations into their air distribution efficiency and overall ventilation performance. To address this gap in the literature, this study offers a systematic assessment of the ventilation effectiveness for air distribution schemes related to decentralised MVSs. Computational Fluid Dynamics simulations were performed in a standard classroom, while statistical methods were used to established significant differences among the schemes. The optimal performances were observed with a single air inlet/outlet positioned on the long side of the room, providing CO2 ≈ 1088 ppm and a mean local air change efficiency of 1.23. Ceiling-standing units installed in the room show CO2 levels around 1200 ppm, with mean local air change efficiency between 1.02 and 1.07, whereas the floor-standing unit yields ventilation effectiveness lower than that of ideal mixing conditions. The results deliver an actionable ranking and design trade-offs to guide school retrofits.

1. Introduction

Ensuring healthy lives and well-being is one of the United Nations’ (UN) Sustainable Development Goals (SDGs) [1]. Global health crises such as COVID-19 [2] underscore the worldwide threat faced and highlight the indispensable need for robust preparedness [3]. In this regard, the importance of adequate ventilation in indoor environments has been increasingly recognised as a critical strategy to mitigate the risk of airborne virus transmission among occupants [4,5]. In particular, airborne spread via fine respiratory aerosols has been identified as a primary transmission pathway indoors [6,7], posing significant concerns in densely occupied settings such as classrooms. Nonetheless, ventilation in school environments is frequently inadequate, leading to the deterioration of children’s health [8] and learning performance [9]. According to the SINPHONIE project [10], approximately 86% of European classrooms displayed ventilation rates below the recommended threshold for human health of 4 L/s per person [11]. This issue is often associated with a reliance on natural ventilation, which is generally limited by user behaviour, especially during the heating season, when manual airing may cause thermal discomfort [12,13,14].
To address this, several studies have advocated for the adoption of Mechanical Ventilation Systems (MVSs) equipped with heat recovery in classrooms [15,16,17,18], also highlighting their beneficial impact in terms of primary energy savings [19]. Furthermore, their implementation has been made compulsory in public building retrofits in certain countries, including Italy [20]. A fundamental aspect of effective MVS design is the choice of air distribution system, which significantly influences the system’s ability to dilute or remove airborne contaminants [4,21,22] and improve indoor air quality (IAQ) [23].
The ventilation effectiveness of air distribution systems could be assessed by evaluating the ability of a system to exchange the air in the room or the ability to remove airborne contaminants [23]. In the latter case, specific indices are used, e.g., the contaminant removal effectiveness, which are highly influenced by the characteristics of the contaminant source (location, emission rate, particle sizes, etc.) [24], while the indices related to the former could be used as overall ventilation effectiveness metrics to compare different air distribution systems regardless of pollutant characteristics [25]. To this aim, the air change efficiency (ACE) is frequently employed to quantify how effectively fresh air replaces room air, compared to an ideal, perfectly mixed system [26]. ACE is calculated using the Local Mean Age (LMA) of air, which measures the average time needed for supply air to reach specific points within the room [27]. Furthermore, the concept of ACE can be expressed by considering single points in the space, referring to the Local Air Change Effectiveness (LACE). To evaluate these indices, common assessment methods refer to both experimental and Computational Fluid Dynamics (CFD) techniques. However, experimental methods such as the tracer gas [28] and the aerosol [29] techniques may face practical limitations in replicating the environmental conditions, making these techniques inconvenient to test different scenarios [30]. On the other hand, CFD simulations have full control over the boundary conditions, making them more suitable for parametric investigations of various cases [31].
According to several literature review findings, total volume air distribution systems promoting vertical or horizontal airflow, such as displacement ventilation, underfloor air distribution, confluent jet ventilation, and stratum ventilation, achieve higher performance compared to conventional Mixing Ventilation (MV) systems [32,33,34]. Furthermore, personal ventilation devices can further improve local ventilation effectiveness [35]. However, the integration of these air distribution systems, mainly associated with a centralised MVS, into existing classrooms is often hindered by technical and architectural constraints, which can be avoided by adopting ventilation units serving single classrooms, i.e., decentralised MVS. Indeed, the integration of decentralised MVSs in classrooms has become increasingly popular in recent school building refurbishment interventions due to their minimal invasiveness, as reported from recent studies [36,37,38,39,40]. In one of the largest school building refurbishments [40], covering 155 school buildings in Italy, 98% of the classrooms were equipped with decentralised MVSs located inside the classrooms or outside in the corridor.
However, despite the widespread use of decentralised MVSs in classrooms, there is a conspicuous lack of research specifically focused on their air distribution efficiency, which could support better-informed design in classroom retrofit projects. To fill this knowledge gap, this study provides a systematic comparison of the ventilation performances of air distribution schemes based on decentralised MVSs, specifically designed for retrofitting existing classrooms. Beyond evaluating the CO2 and ventilation effectiveness distributions through CFD-based analysis and statistical methods, the resulting framework provides actionable guidance for the selection of proper solutions in school retrofit application contexts. In particular, a set of schemes was considered based on the ventilation unit location and the air supply/exhaust grilles’ position. Investigations were carried out using a reference classroom model representative of the Italian school building stock, focusing on the horizontal plane referred to as the breathing zone. The study was built upon prior research conducted by the authors [41].

2. Materials and Methods

This work employs CFD simulations and statistical methods to assess and compare the performance of different air distribution schemes applicable to existing classroom environments. For CFD simulations, the MicroFlow module within the Integrated Environmental Solutions Virtual Environment (IESVE) software [42] was selected. The numerical approach in MicroFlow is based on the Reynolds-Averaged Navier–Stokes (RANS) equations, which are solved under turbulent flow conditions using a standard k-ε model, providing steady-state distributions of velocity, temperature, and scalar concentrations within the analysed domain. Although commercial CFD platforms such as ANSYS Fluent [43] and Star-CCM+ [44] offer more advanced turbulence models and refined grid-control capabilities, the present study is aimed at a comparative assessment of the general room airflow in a design phase, rather than at resolving highly/local complex airflow structures. Indeed, previous applications and validation studies support the suitability of MicroFlow for general room airflow assessments [45,46,47,48]. Additionally, a comparative study involving MicroFlow and more advanced solvers shows that, while high-end CFD codes are better for complex flow problems, MicroFlow, thanks to a quick setup of geometrical models and boundary conditions, captures the main airflow features with enough accuracy for engineering design assessments [49]. Hence, MicroFlow provides a practical compromise between computational speed and result reliability, especially suitable for early-stage design exploration, such as in the case of the present study.

2.1. Classroom Geometry and Air Distribution Schemes

A reference classroom setting (Figure 1) was defined to represent a common layout related to school building classrooms, according to [50]. The room has a rectangular shape with a floor area of 48.0 m2 and a height of 3.0 m. The long side is 8.0 m while the short side is 6.0 m. Windows are placed on one of the long sides. The presence of 25 students and 1 teacher has been assumed as the maximum occupancy allowed in Italian classrooms [51]. Focusing on air distribution layout effects, furniture (desks, cabinets, etc.) was intentionally omitted to avoid case-specific configurations, given their high layout variability.
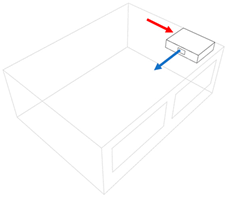
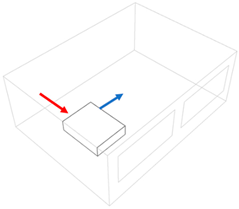
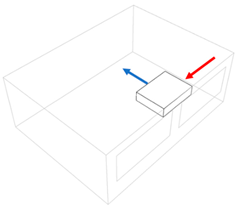
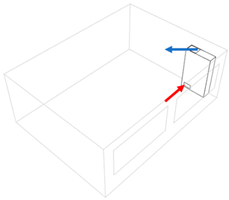
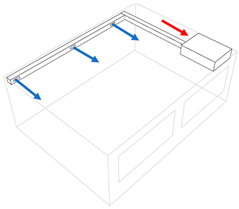
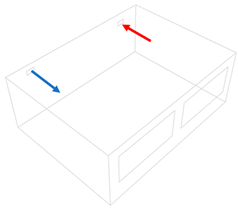
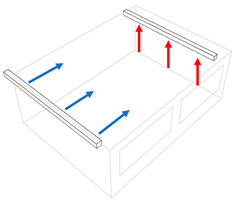
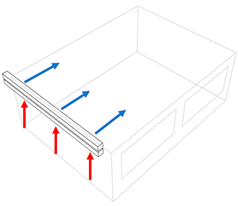
In this classroom configuration, different air distribution schemes were proposed based on installation criteria suitable for existing classrooms, considering decentralised units placed inside or outside the classroom, as reported in Table 1. In the former case, as ducts are required to connect the unit to the outdoors, the unit locations have been considered near the external wall. Three positions for the ceiling standing unit (I1, I2, and I3) have been tested to assess the effects of different air supply points (near the two corners and in the centre of the external wall), while for the floor standing unit (I4), only the location at the back of the classroom has been considered, as on the teacher’s side, the wall is usually occupied by blackboards and furniture. Furthermore, implementations of ceiling units with a supply duct (I5) have been considered to assess potential benefits on airflow patterns. In the latter case, air distribution schemes referred to as low-invasive interventions were considered, i.e., with supply and extraction ducts positioned close to the ceiling height. In this regard, the position of the intake and extraction vents is limited to the short sides (O3 and O4) and the long, non-windowed side (O1 and O2), since the presence of windows in the external wall could represent an installation constraint. Schemes O3 and O4 imply an airflow along the long side of the classroom but differ in the location of the exhaust vents, positioned on the opposite wall in the former, and on the same wall in the latter. Conversely, scheme O2 defines an airflow along the short side of the classroom. Finally, scheme O1 was defined to test the installation of a single inlet and outlet vent to generate a semi-circular airflow pattern within the classroom.

2.2. Boundary Settings

According to a default winter scenario, the indoor thermal environment was standardised by setting both air and internal surface temperatures to an operative value of 20 °C, following Category II indoor conditions defined by EN 16798-1 [11]. The internal occupancy was modelled to represent a generalised occupant distribution and avoid specific seating layouts, given their case-by-case variability. To this end, two equivalent volumetric sources representing both heat and CO2 emissions were introduced within the occupied zone, obtained as the volume enclosed within a height of 1.25 m above the floor level and at a distance of 0.6 m from the room walls (consistent with the conventional zone occupied by seated persons). The defined occupied volume was subdivided between students and the teacher by assuming an area of approximately 1 m2 per student, assigning the remaining area to the teacher.
Each occupant was assigned a sensible heat output of 90 W (encompassing both convective and radiative components), aligned with EN 16798-1 [11] recommendations. Consequently, total heat gains of 2000 W and 90 W were attributed to the student and teacher zones, respectively. CO2 generation rates were determined based on children’s anthropometric characteristics (height and weight), body surface area, and metabolic activity, applying the equations found in the ASHRAE Handbook of Fundamentals [52]. Average values for children’s anthropometry were taken from European school-age data reported in [53]. A metabolic rate of 1.4 Met was adopted for students engaged in sedentary classroom tasks (e.g., reading and writing), while 1.7 Met was used for teachers, whose activity involves alternation between sitting, standing, and walking [54,55]. Details on source volumes have been reported in Table 2.
Ventilation system design followed the parameters of EN 16798-1 [11] for Category II environments and low-polluting buildings, resulting in a required airflow of 648 m3/h. Given that the schemes are based on MV, a typical supply velocity of 2 m/s was assumed for sizing air terminals [56]. Accordingly, the inlet and outlet dimensions were set to meet these specifications. Outdoor air supplied to the room was assumed to have a baseline CO2 concentration of 400 ppm, as recommended by the standard [11] when site-specific data are unavailable. The outdoor air temperature representative of typical classroom hours (assumed as 8:00–13:00) was obtained from the Rome weather file included in the IES-VE climate data library [42], serving as a reference for a mid-range Italian climate. To account for the minimum heat recovery efficiency as required by EU Regulation No. 1253/2014 (set at 73%) [57], the supply air temperature was calculated to be 18.6 °C. Details on the supply air are reported in Table 3.

2.3. Computational Solver

The airflow distribution within the classroom environment was simulated using the commercial CFD module MicroFlow, integrated into the IESVE. This solver is based on the finite volume method for the discretisation of the governing equations for mass, momentum, and energy conservation. Specifically, it provides a steady-state solution of the RANS equations coupled with the three-dimensional convective–conductive heat transfer equations, allowing the prediction of airflow patterns under stationary conditions. To model turbulence, the standard k-ε model was adopted across all simulation scenarios. This model, widely recognised for its robustness and computational efficiency in handling internal flows, has been reported to provide satisfactory accuracy in previous research involving similar indoor airflow problems [58,59,60]. Regarding the spatial discretisation, mesh quality was ensured by constraining the maximum cell aspect ratio to 10:1, following the recommendations provided in [61]. Convergence criteria were set by monitoring the residuals of the continuity, momentum, turbulence, and energy equations. Numerical convergence was considered achieved when all residuals dropped below the threshold of 1 × 10⁻⁴.

2.4. Ventilation Performance Assessment

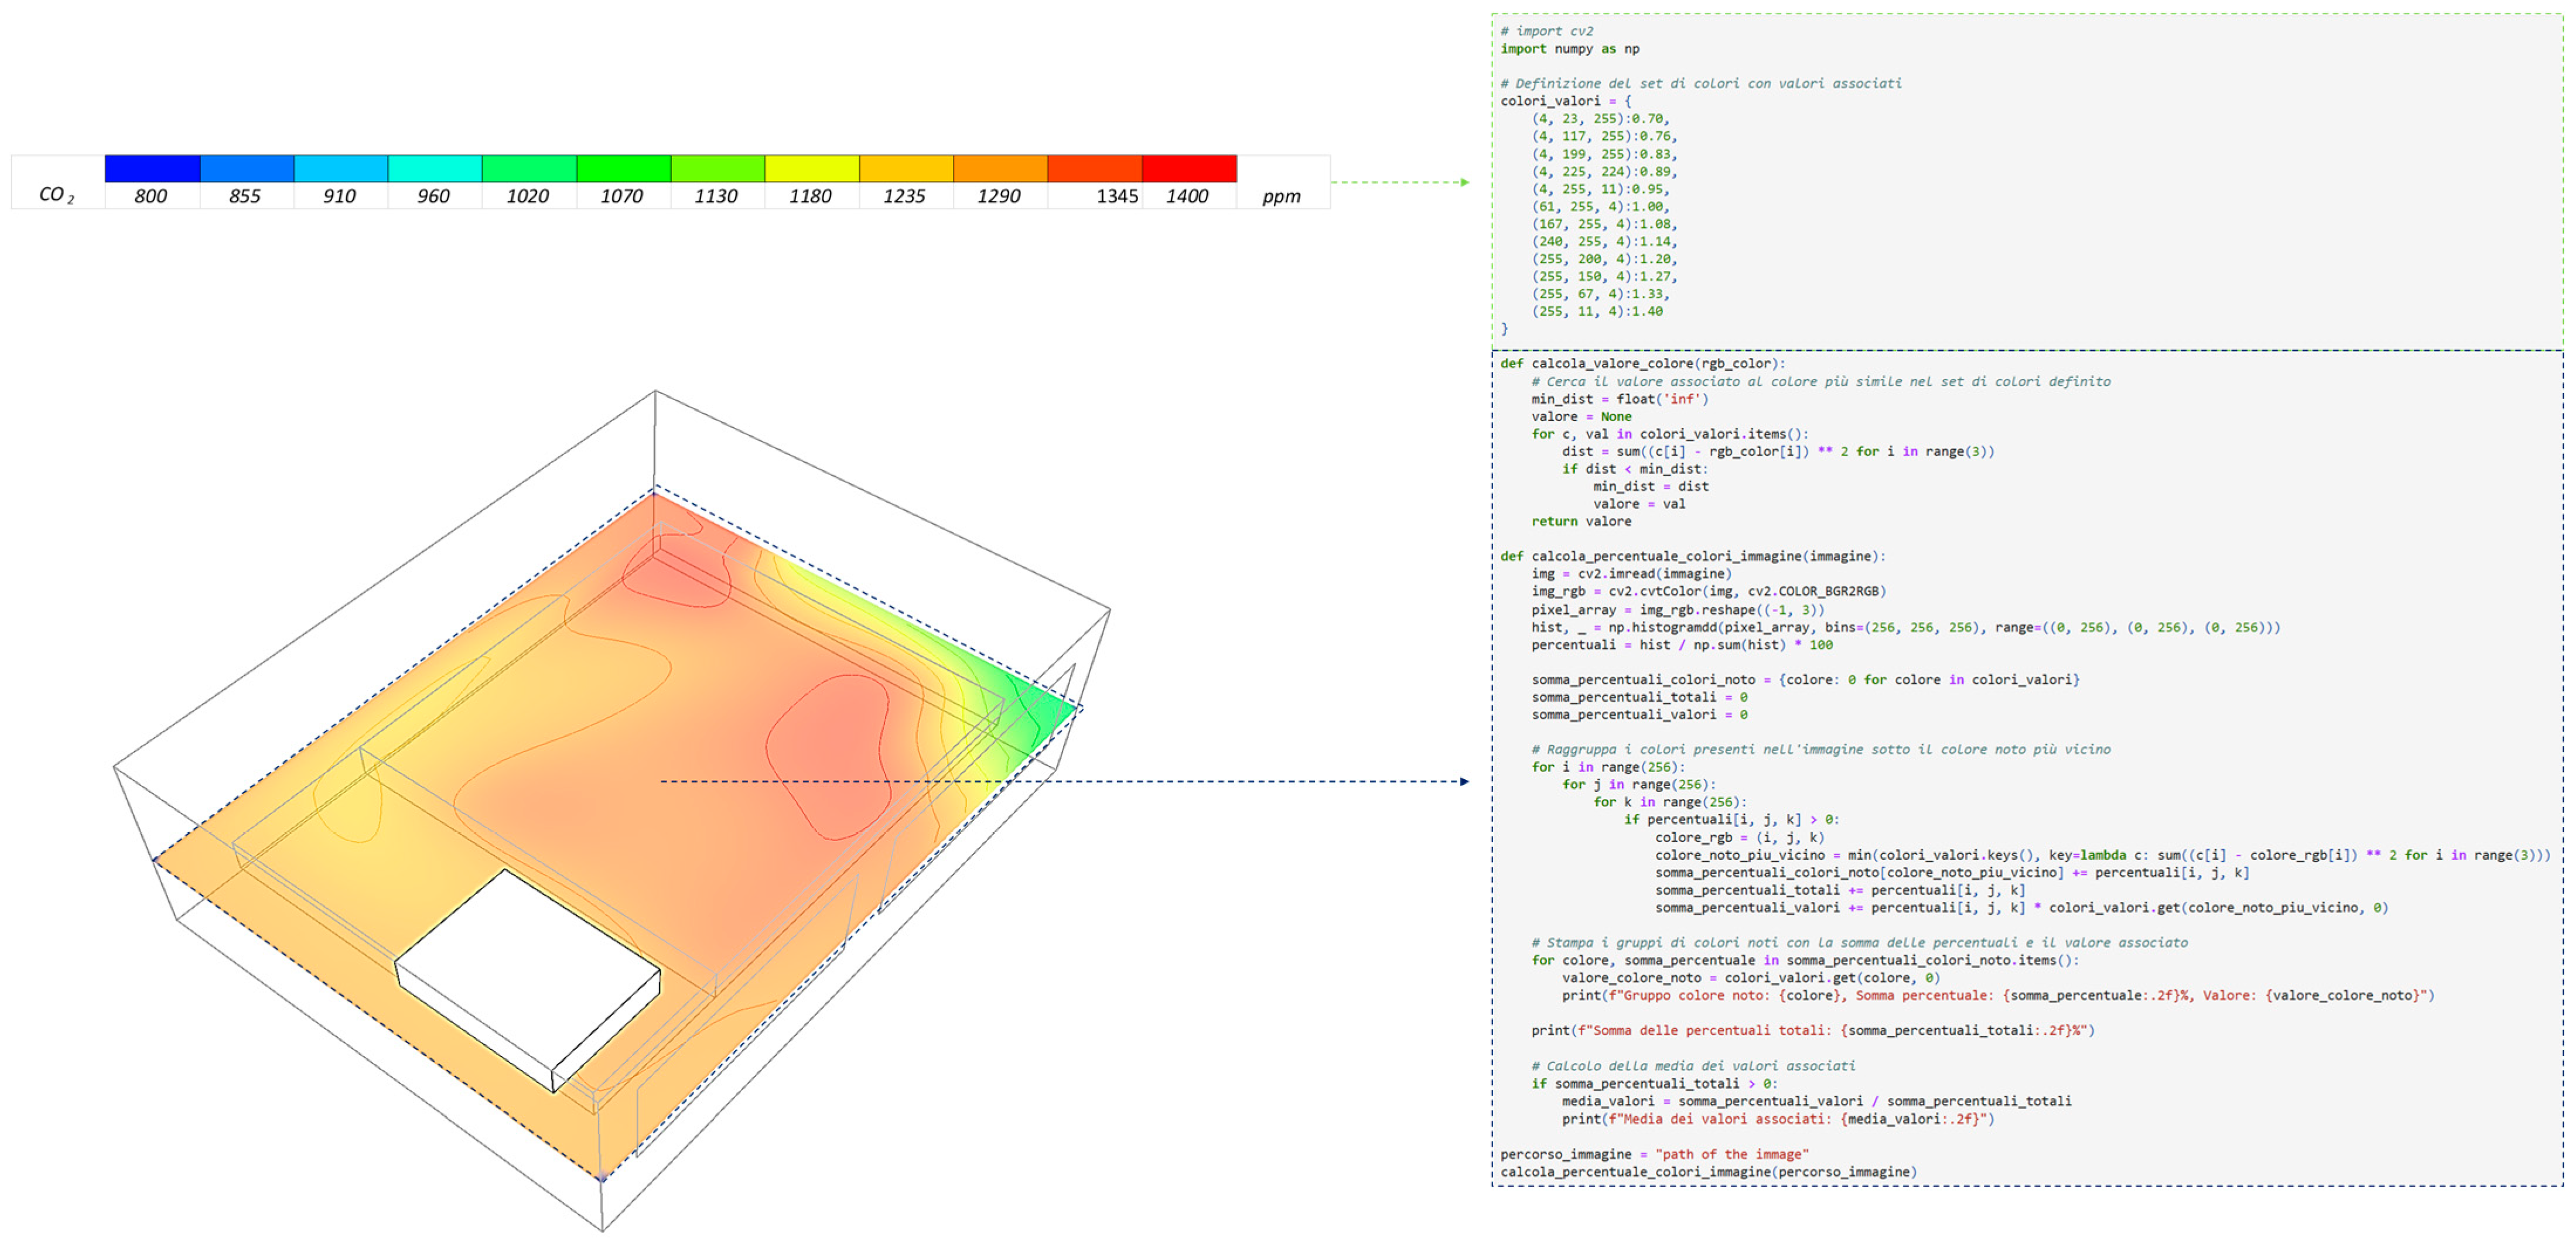
To assess the ventilation effectiveness of the air distribution schemes, the LACE was used as an index. Furthermore, the indoor CO2 concentration was assessed. Through the “Microflow viewer”, it is possible to view the space distribution of the parameters mentioned above. However, precise point values at any location can only be obtained for air speed and temperature, while for the other parameters, the point values can be approximately estimated on the distribution profile (legend), which is not precise enough for proper assessment. To overcome this problem, an algorithm was developed in Python [62] to convert the ranges of the results mapped in the Microflow viewer into detailed values (Figure 2). In particular, the code can recognise the point-by-point values and return the percentage of the presence of these values, starting from a plane picture and known values taken from the Microflow viewer. Therefore, through the algorithm, it is possible to conduct a space distribution analysis of the variables and compare different air distribution schemes. Using this method, the distributions of the parameters of interest (CO2 and LACE) for the different air distribution schemes were evaluated. The values and their distributions have been derived in relation to the horizontal plane positioned 1.25 m above the ground as a representative plane of the breathing zone. Subsequently, the distributions were analysed through the parameters of the descriptive statistic, involving commonly adopted tests to evaluate statistical significance differences among the distributions, e.g., Kruskal–Wallis H test and Mann–Whitney U tests [63,64], adopting a level of significance of 0.05.
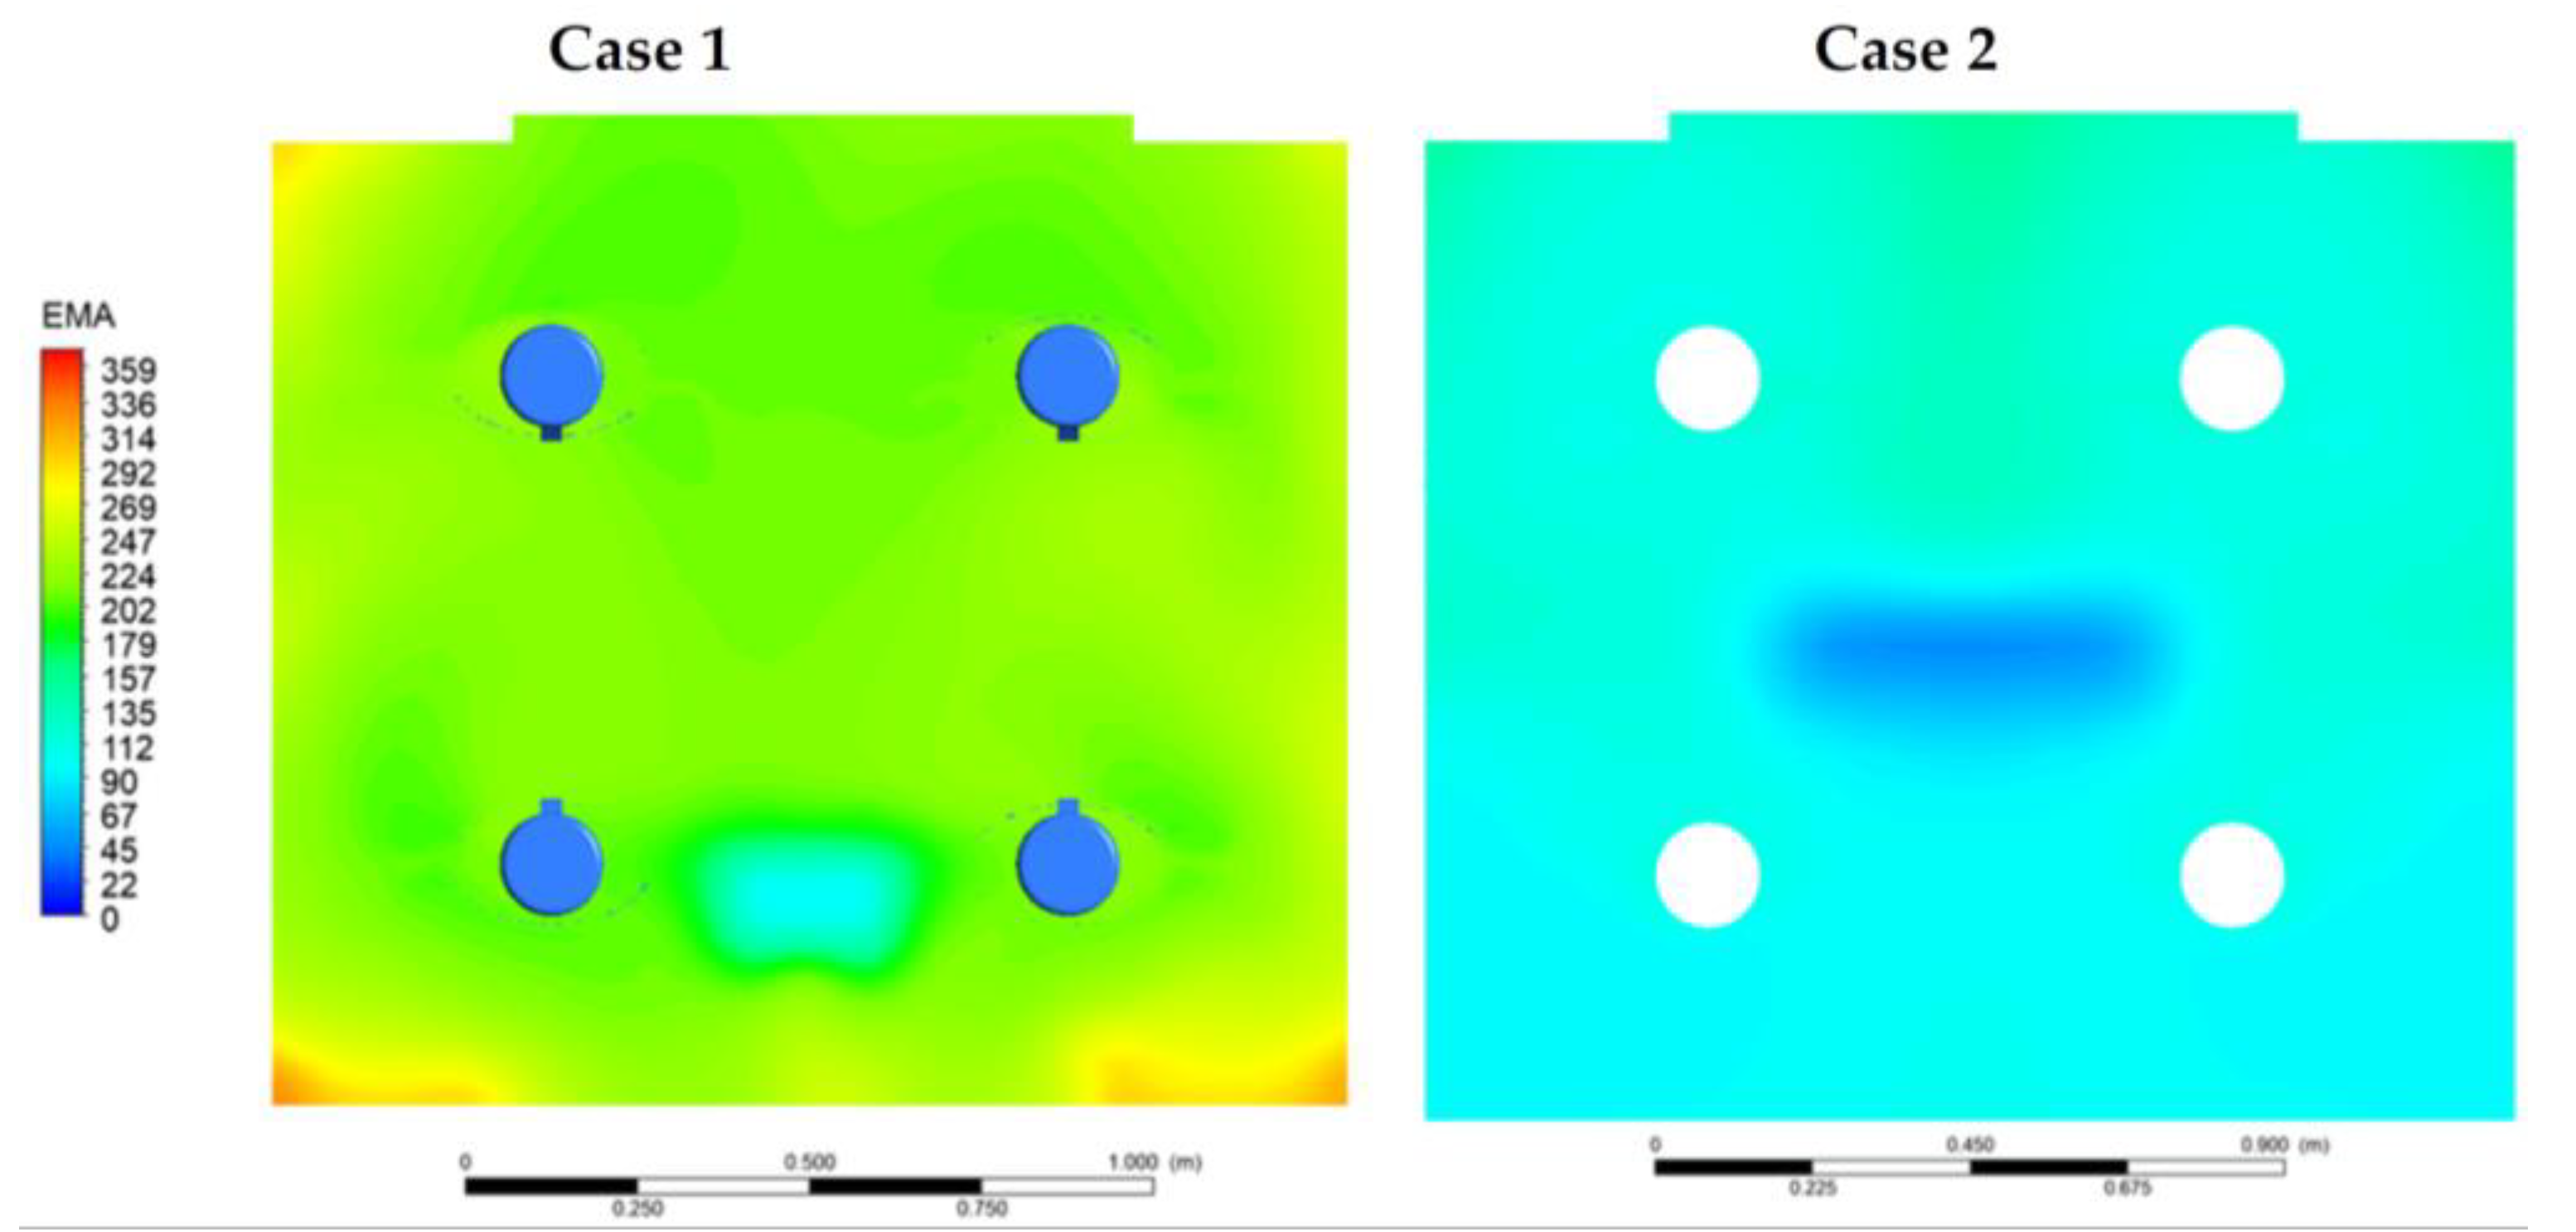
The accuracy of the data extraction through the algorithm was tested using a case study with known numerical average values of LMA of the air reported in [65]. To this end, the algorithm was applied to the colour-filled contour plots of the two cases provided in the study (Figure 3), representing the LMA distribution of air on the horizontal plane. As a result, an average LMA of the air of 246.7 and 135.14 s for case 1 and case 2, respectively, was assessed. Comparing these results with the numerical ones provided in the study (250 s for case 1 and 135 s for case 2), an accuracy of about 99% was found, highlighting the reliability of the proposed algorithm.

2.5. Grid Analysis

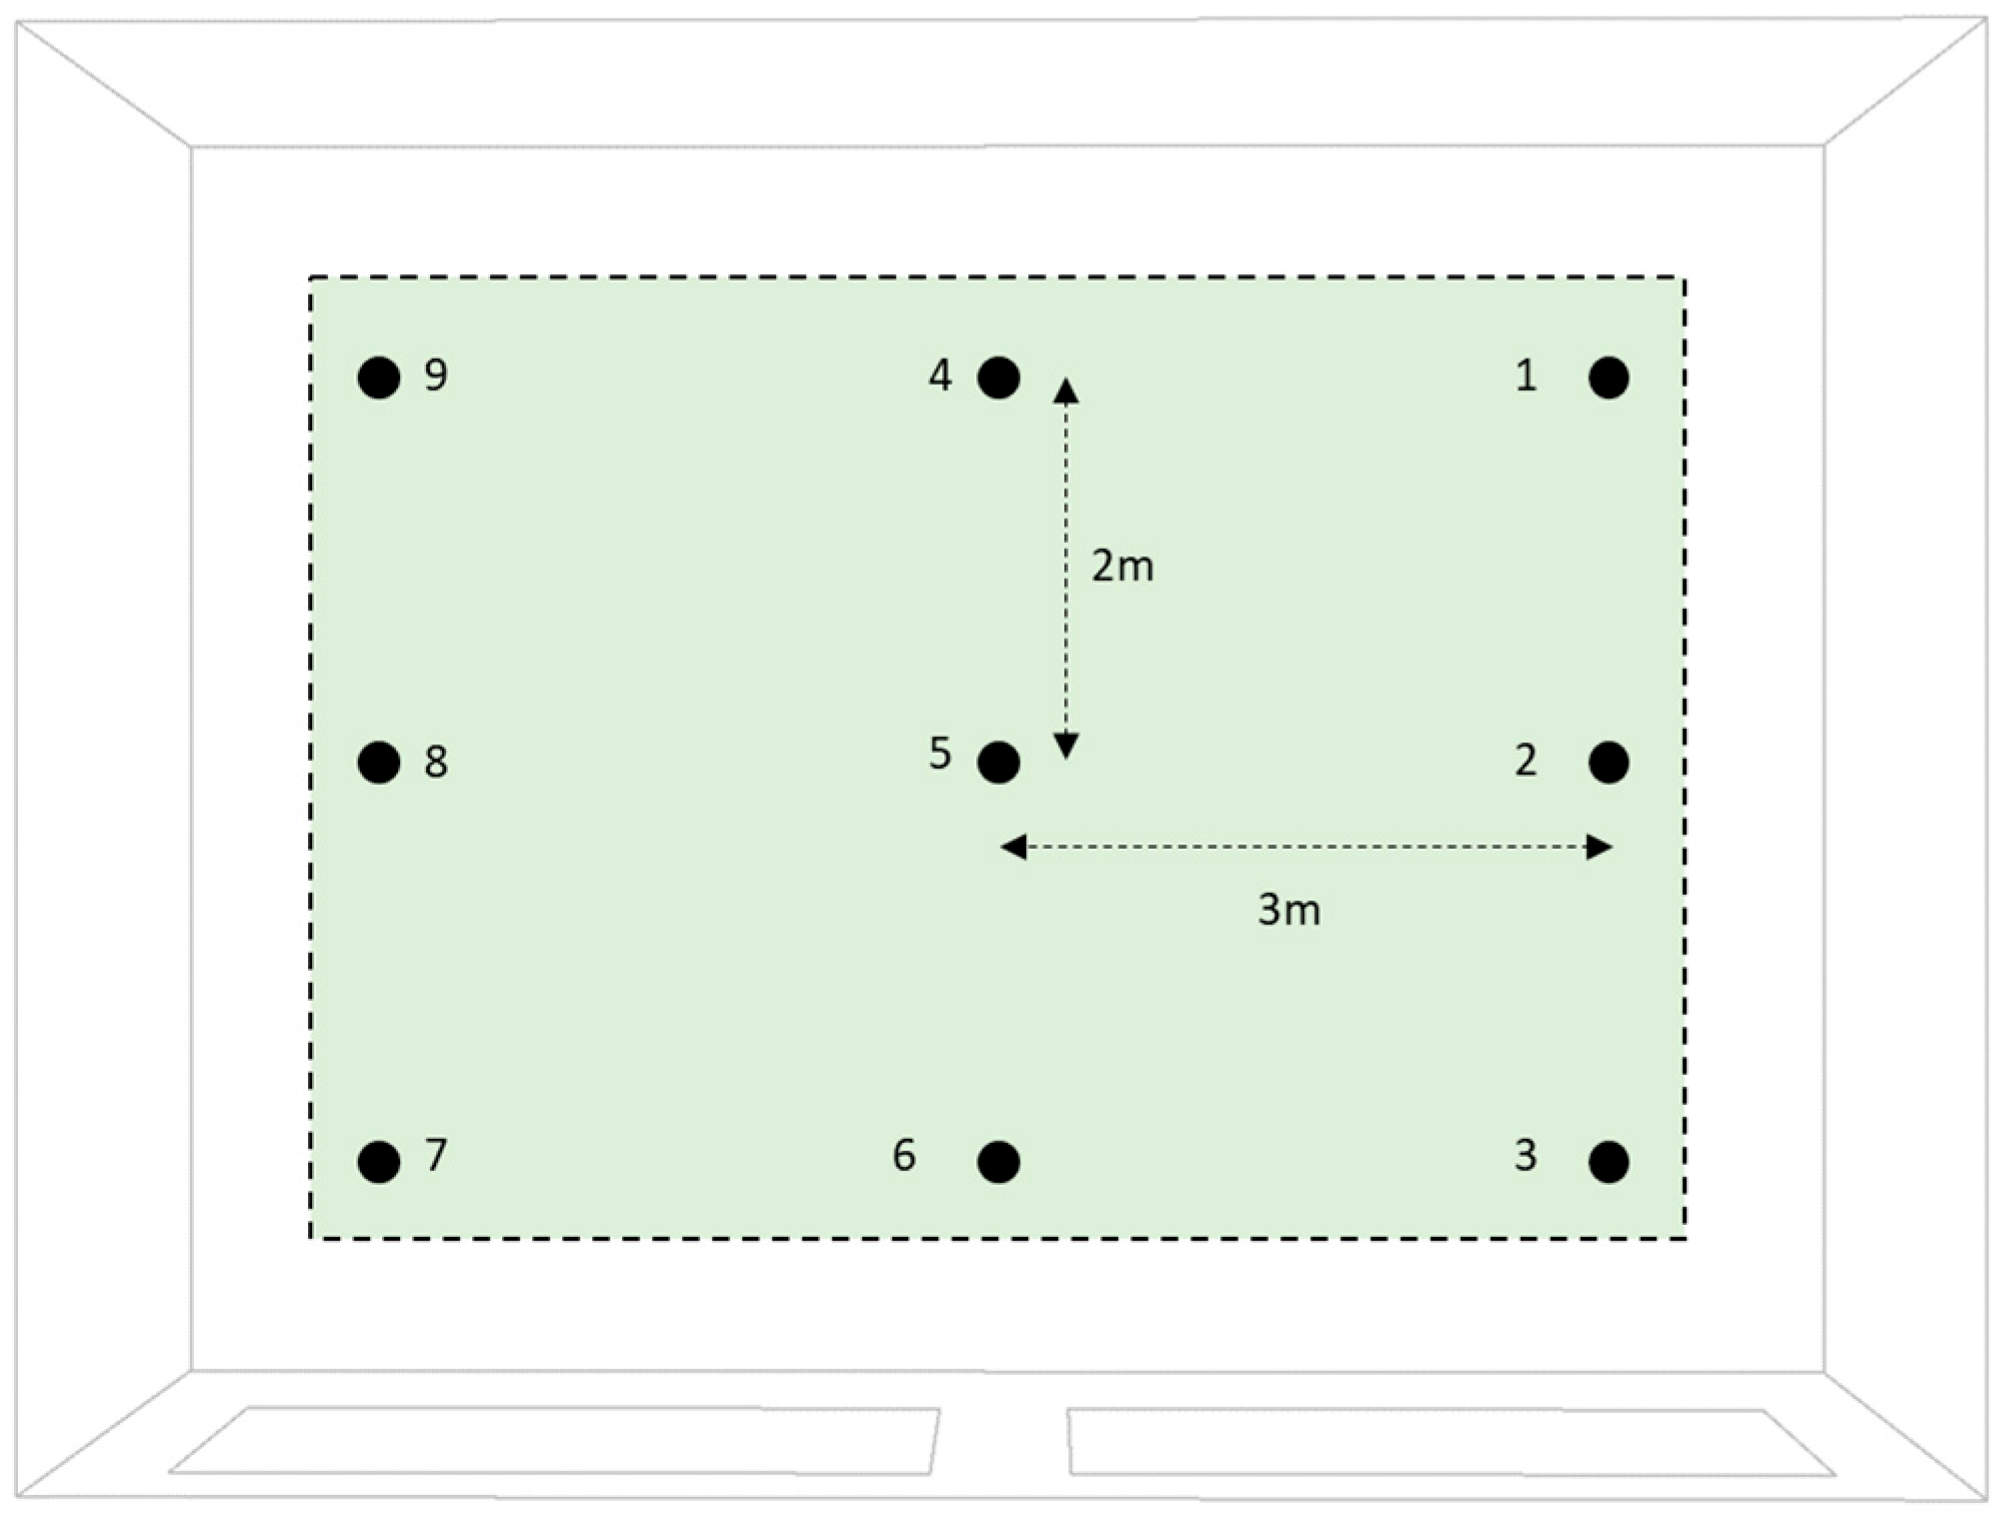
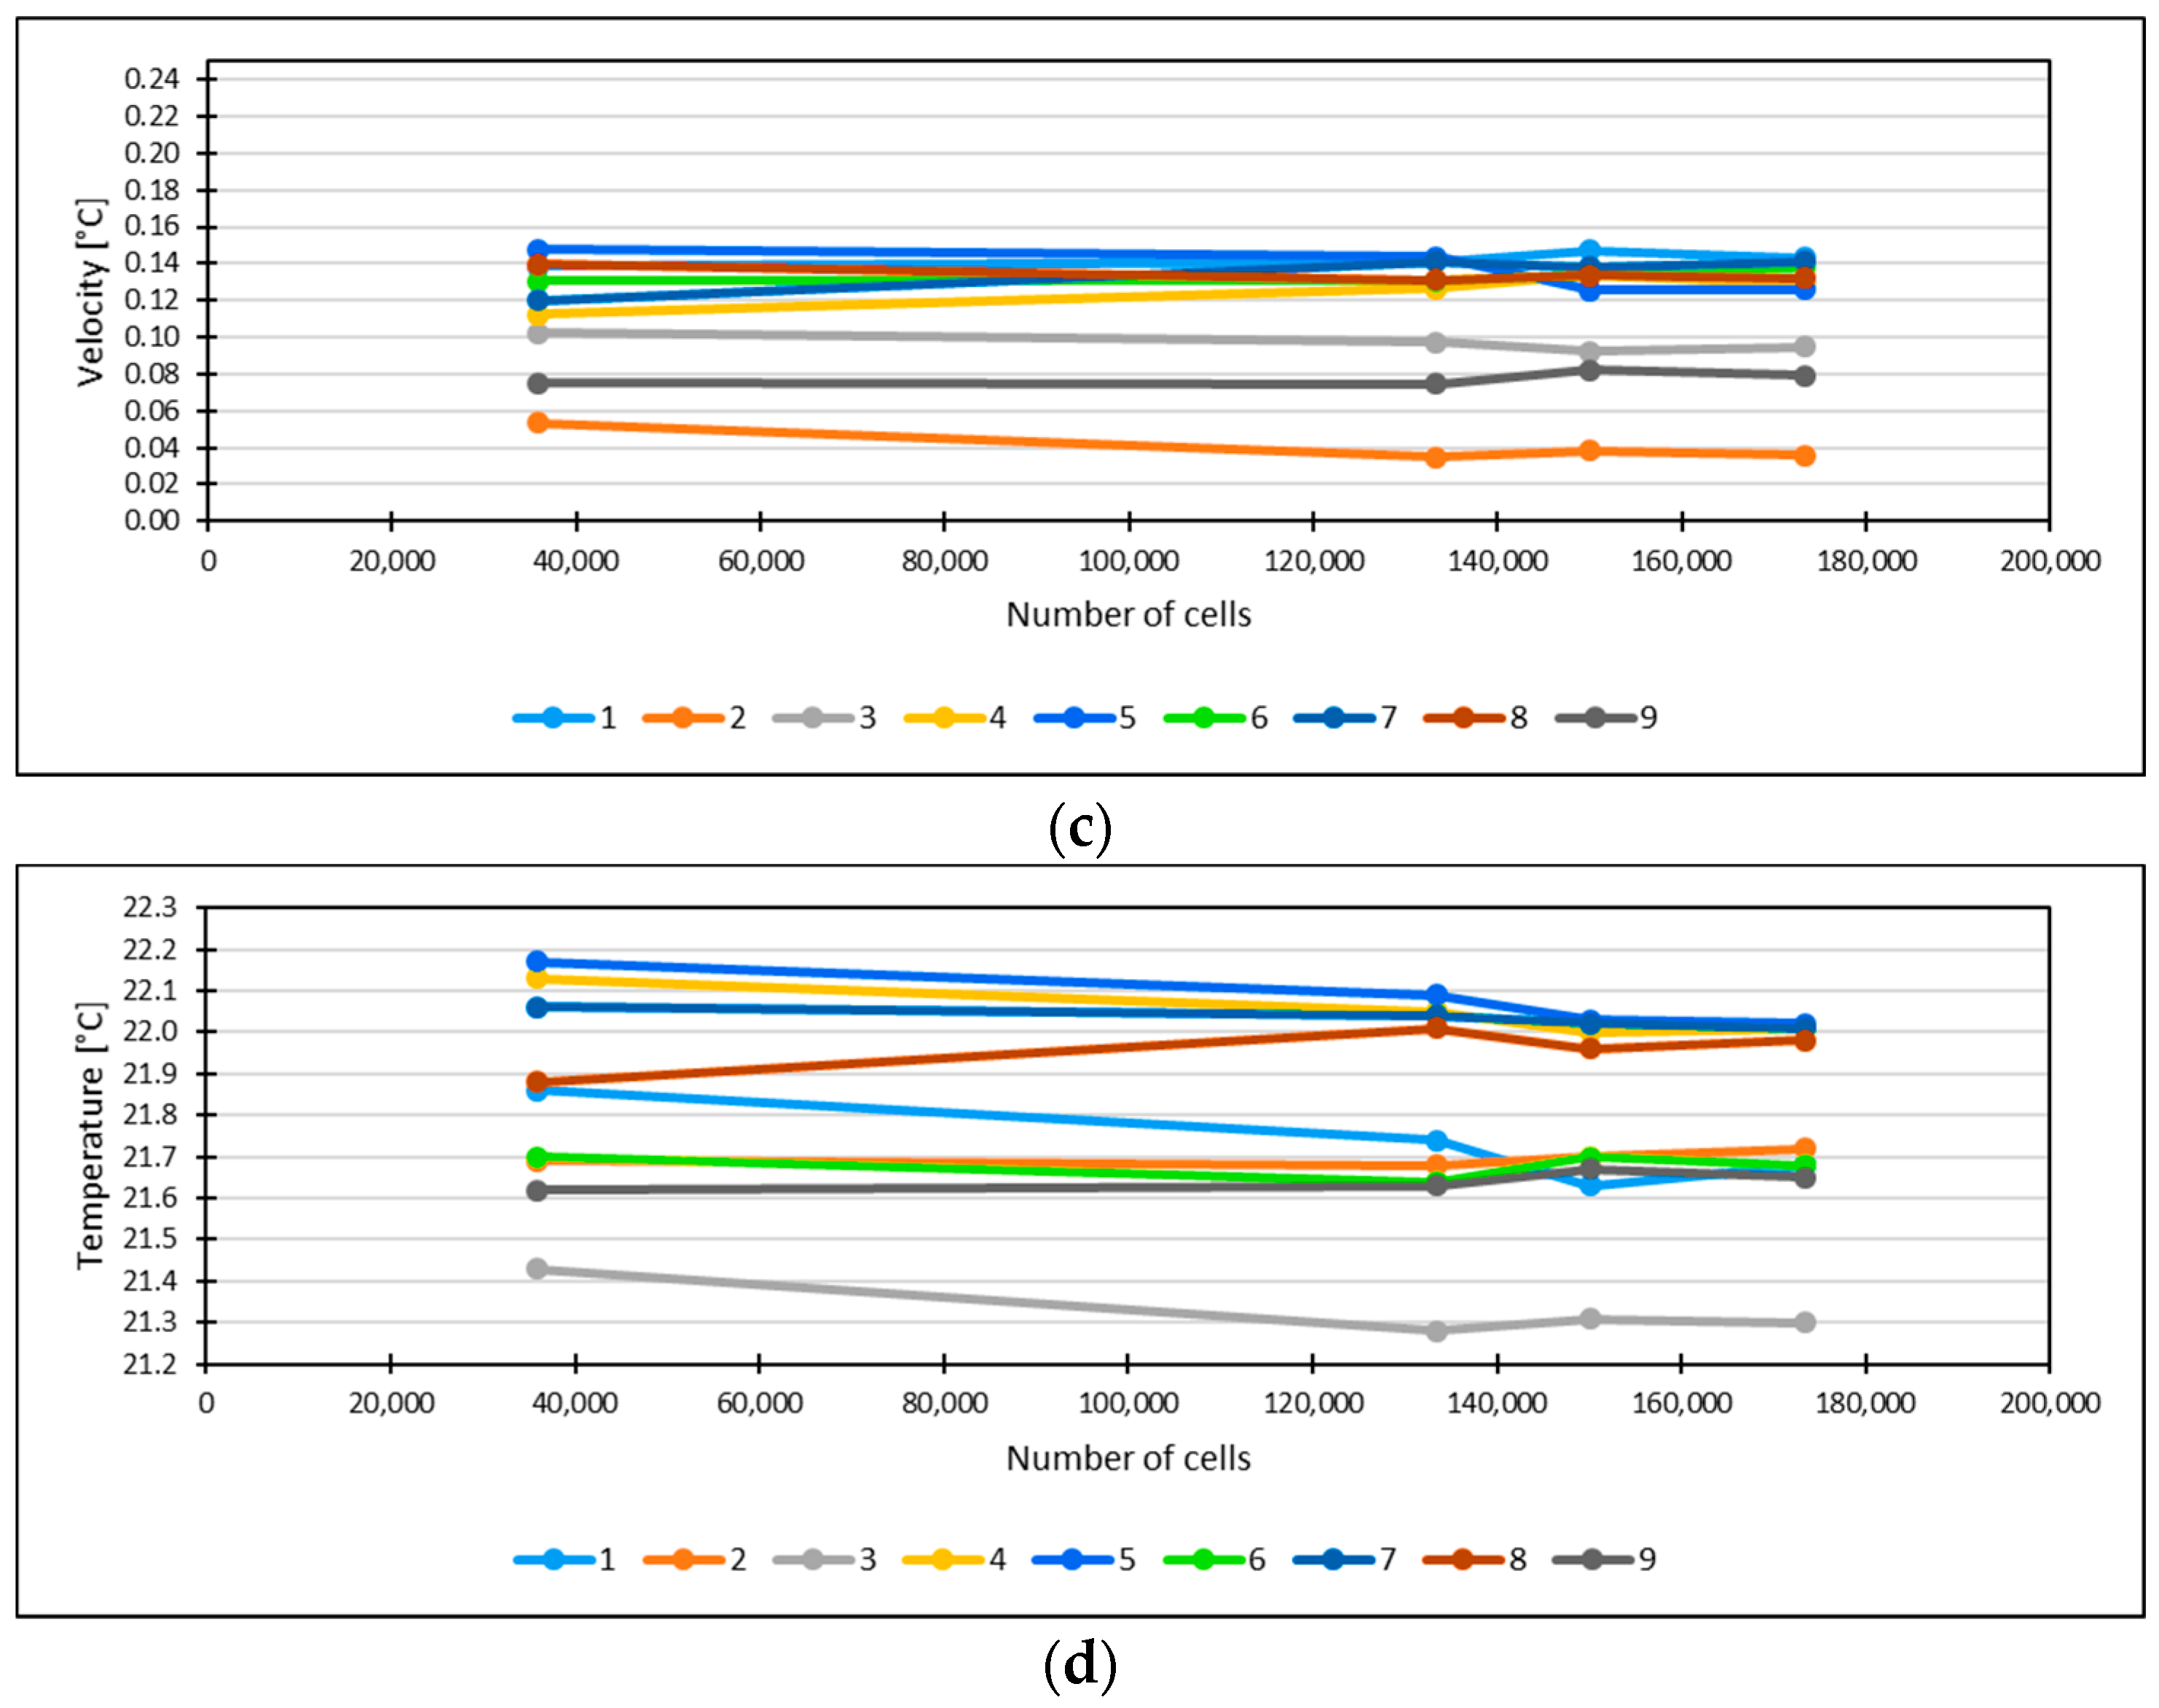
Microflow has its meshing tool, i.e., the “CFD Grid”, to generate and edit the space grid. The tool only allows generating an orthogonal structured non-uniform Cartesian grid, selecting a default grid space and tolerance. To assess the required grid resolution, an independency study was carried out with different mesh grid dimensions, focusing on the vertical distribution of air velocity and air temperature within the centre of the classroom (at 0.1 m, 0.5 m, 1.0 m, 1.5 m, 2.0 m, and 2.5 m from the floor), and a points grid in the reference horizontal plane of the breathing zone placed at a height of 1.25 m (Figure 4).
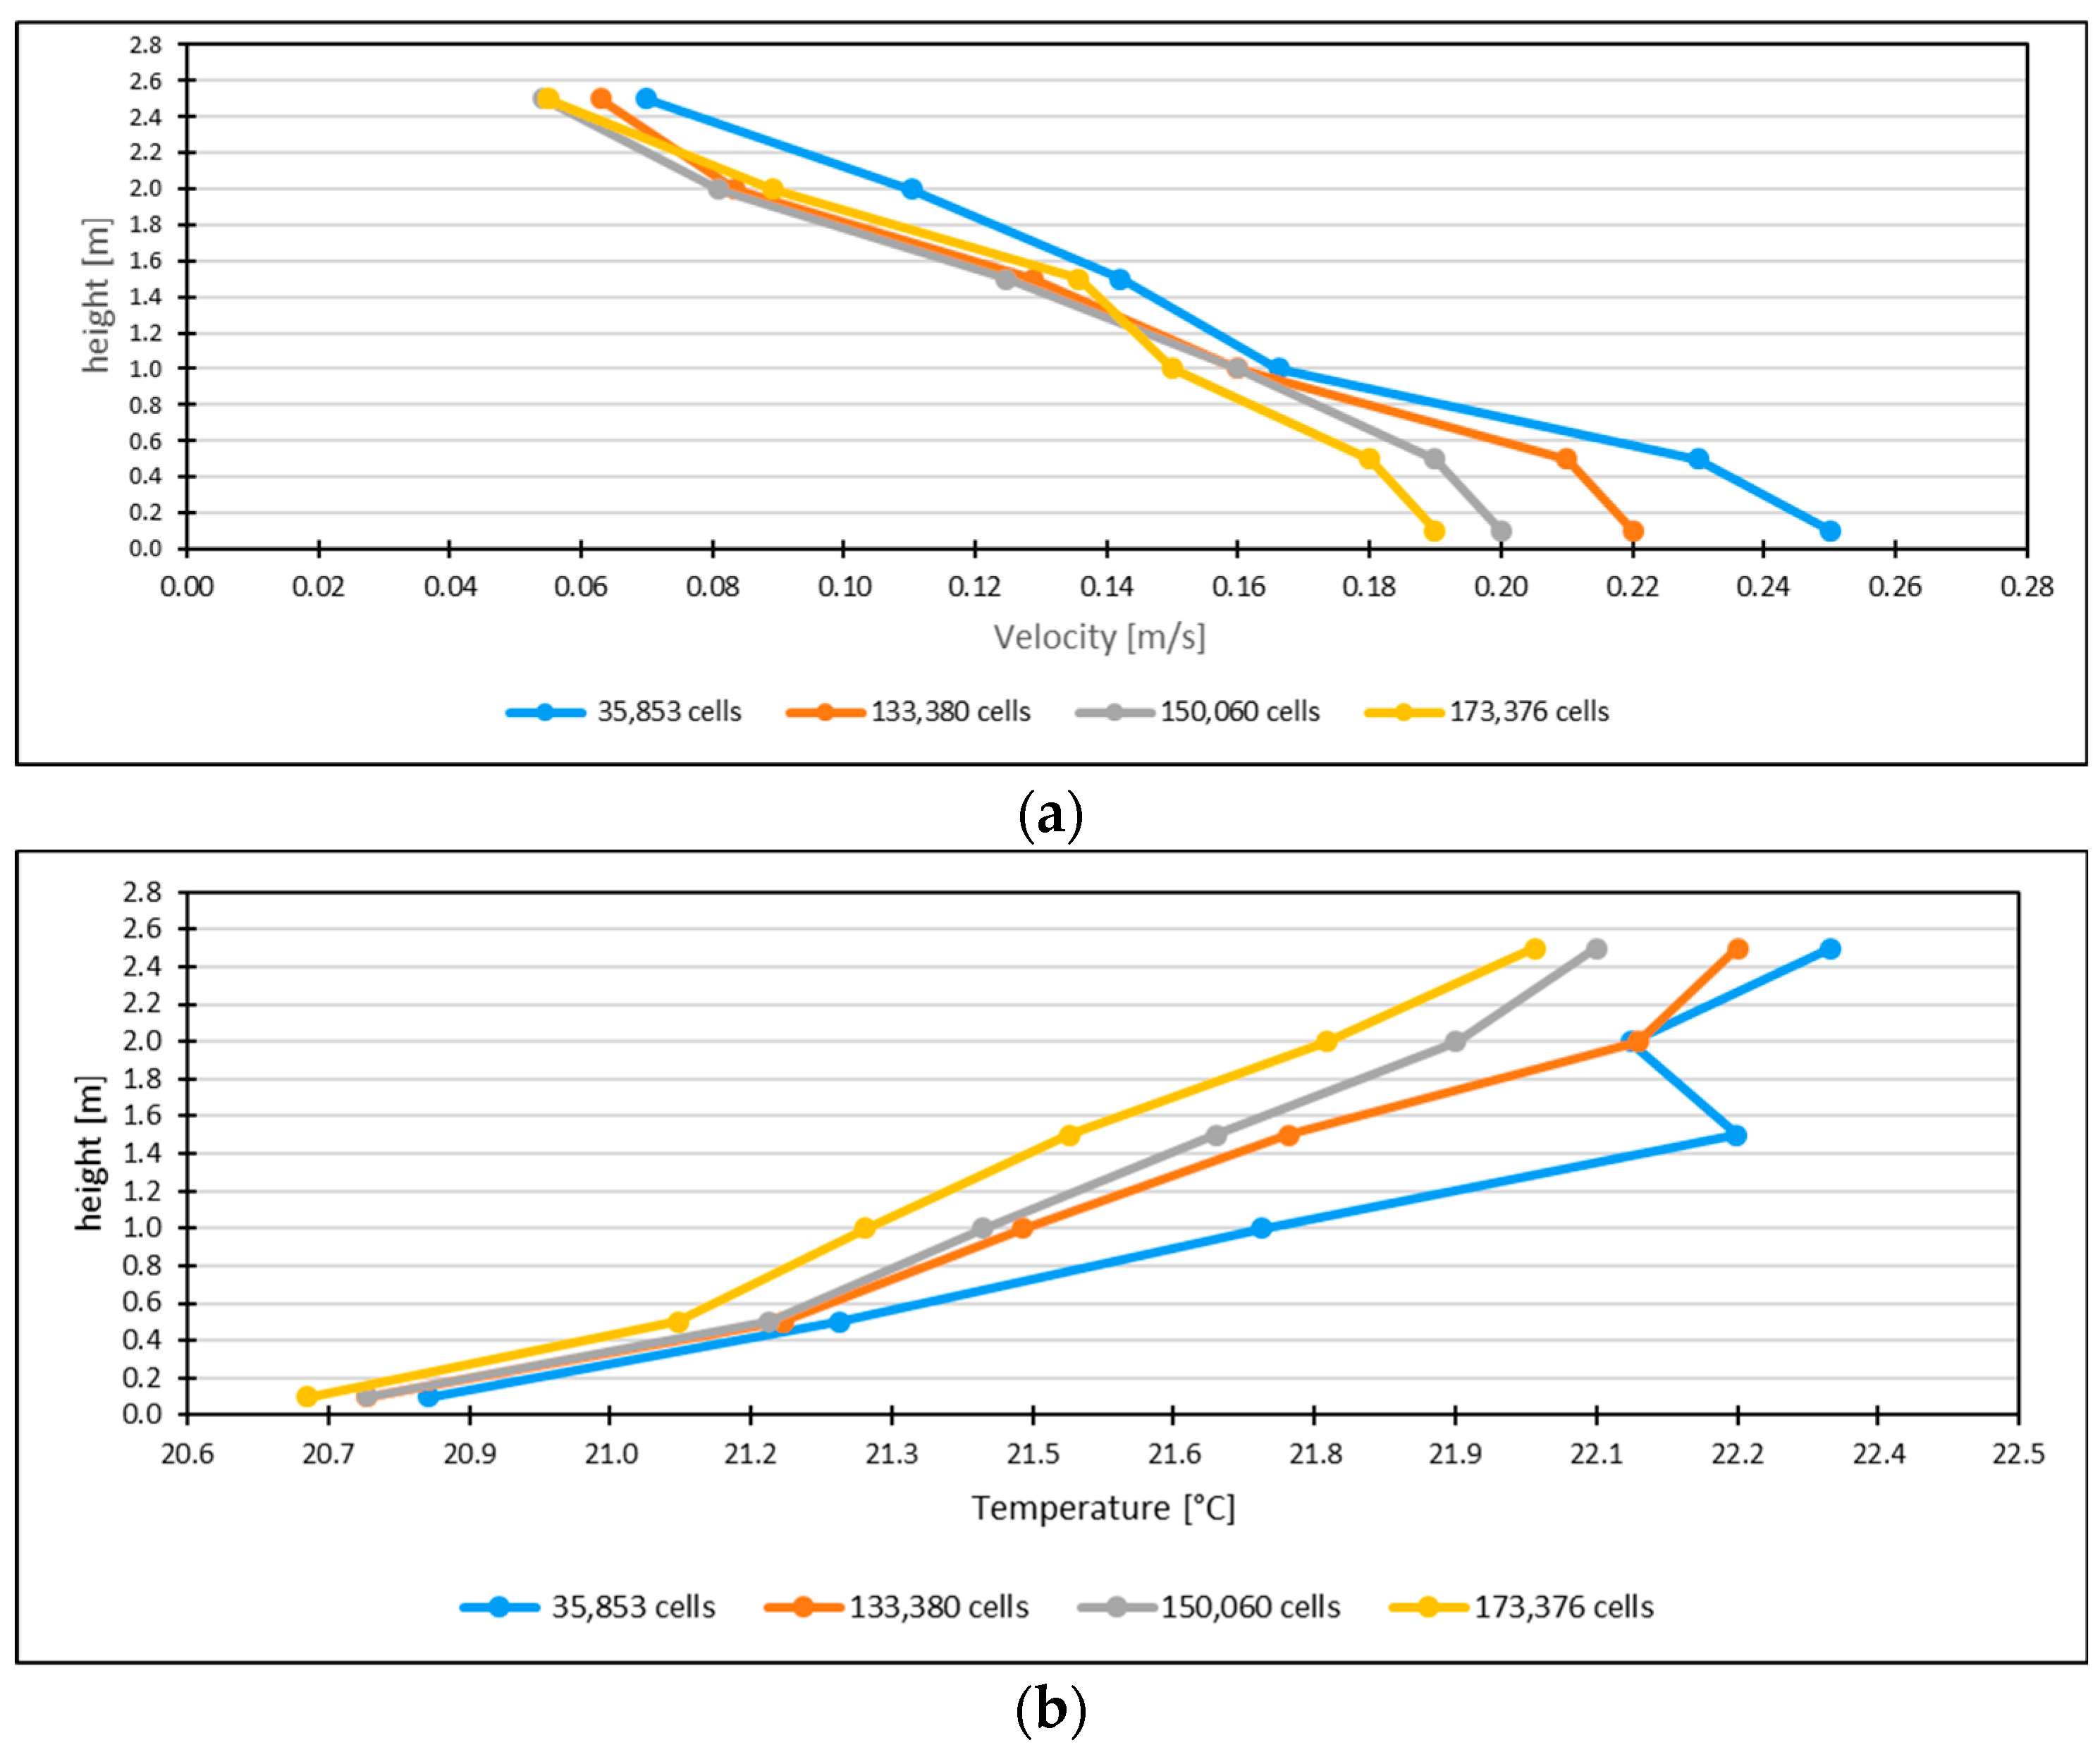
A total of four grid resolutions were tested, accounting for 35,853 (G1), 133,380 (G2), 150,060 (G3), and 173,376 (G4) elements. Results are reported in Figure 5, revealing an average percentage difference between G3 and G4 of lower than 9% and 1% for air velocity and air temperature, respectively. Therefore, the grid of 150,060 elements was used for the analyses to reduce the computational resources. Notably, this grid has a default grid spacing of 9 cm, in line with the typical value for 3 m high rooms [61].

3. Results and Discussion

This Chapter reports and discusses the main outcomes obtained through the CFD simulations and statistical analyses carried out in this work. The findings are structured as follows: (i) assessment of potential discomfort due to high air velocity within the occupied volume, (ii) assessment of CO2 distribution among the breathing zone, and (iii) assessment of ventilation effectiveness among the breathing zones.

3.1. Air Velocity in the Occupied Volume

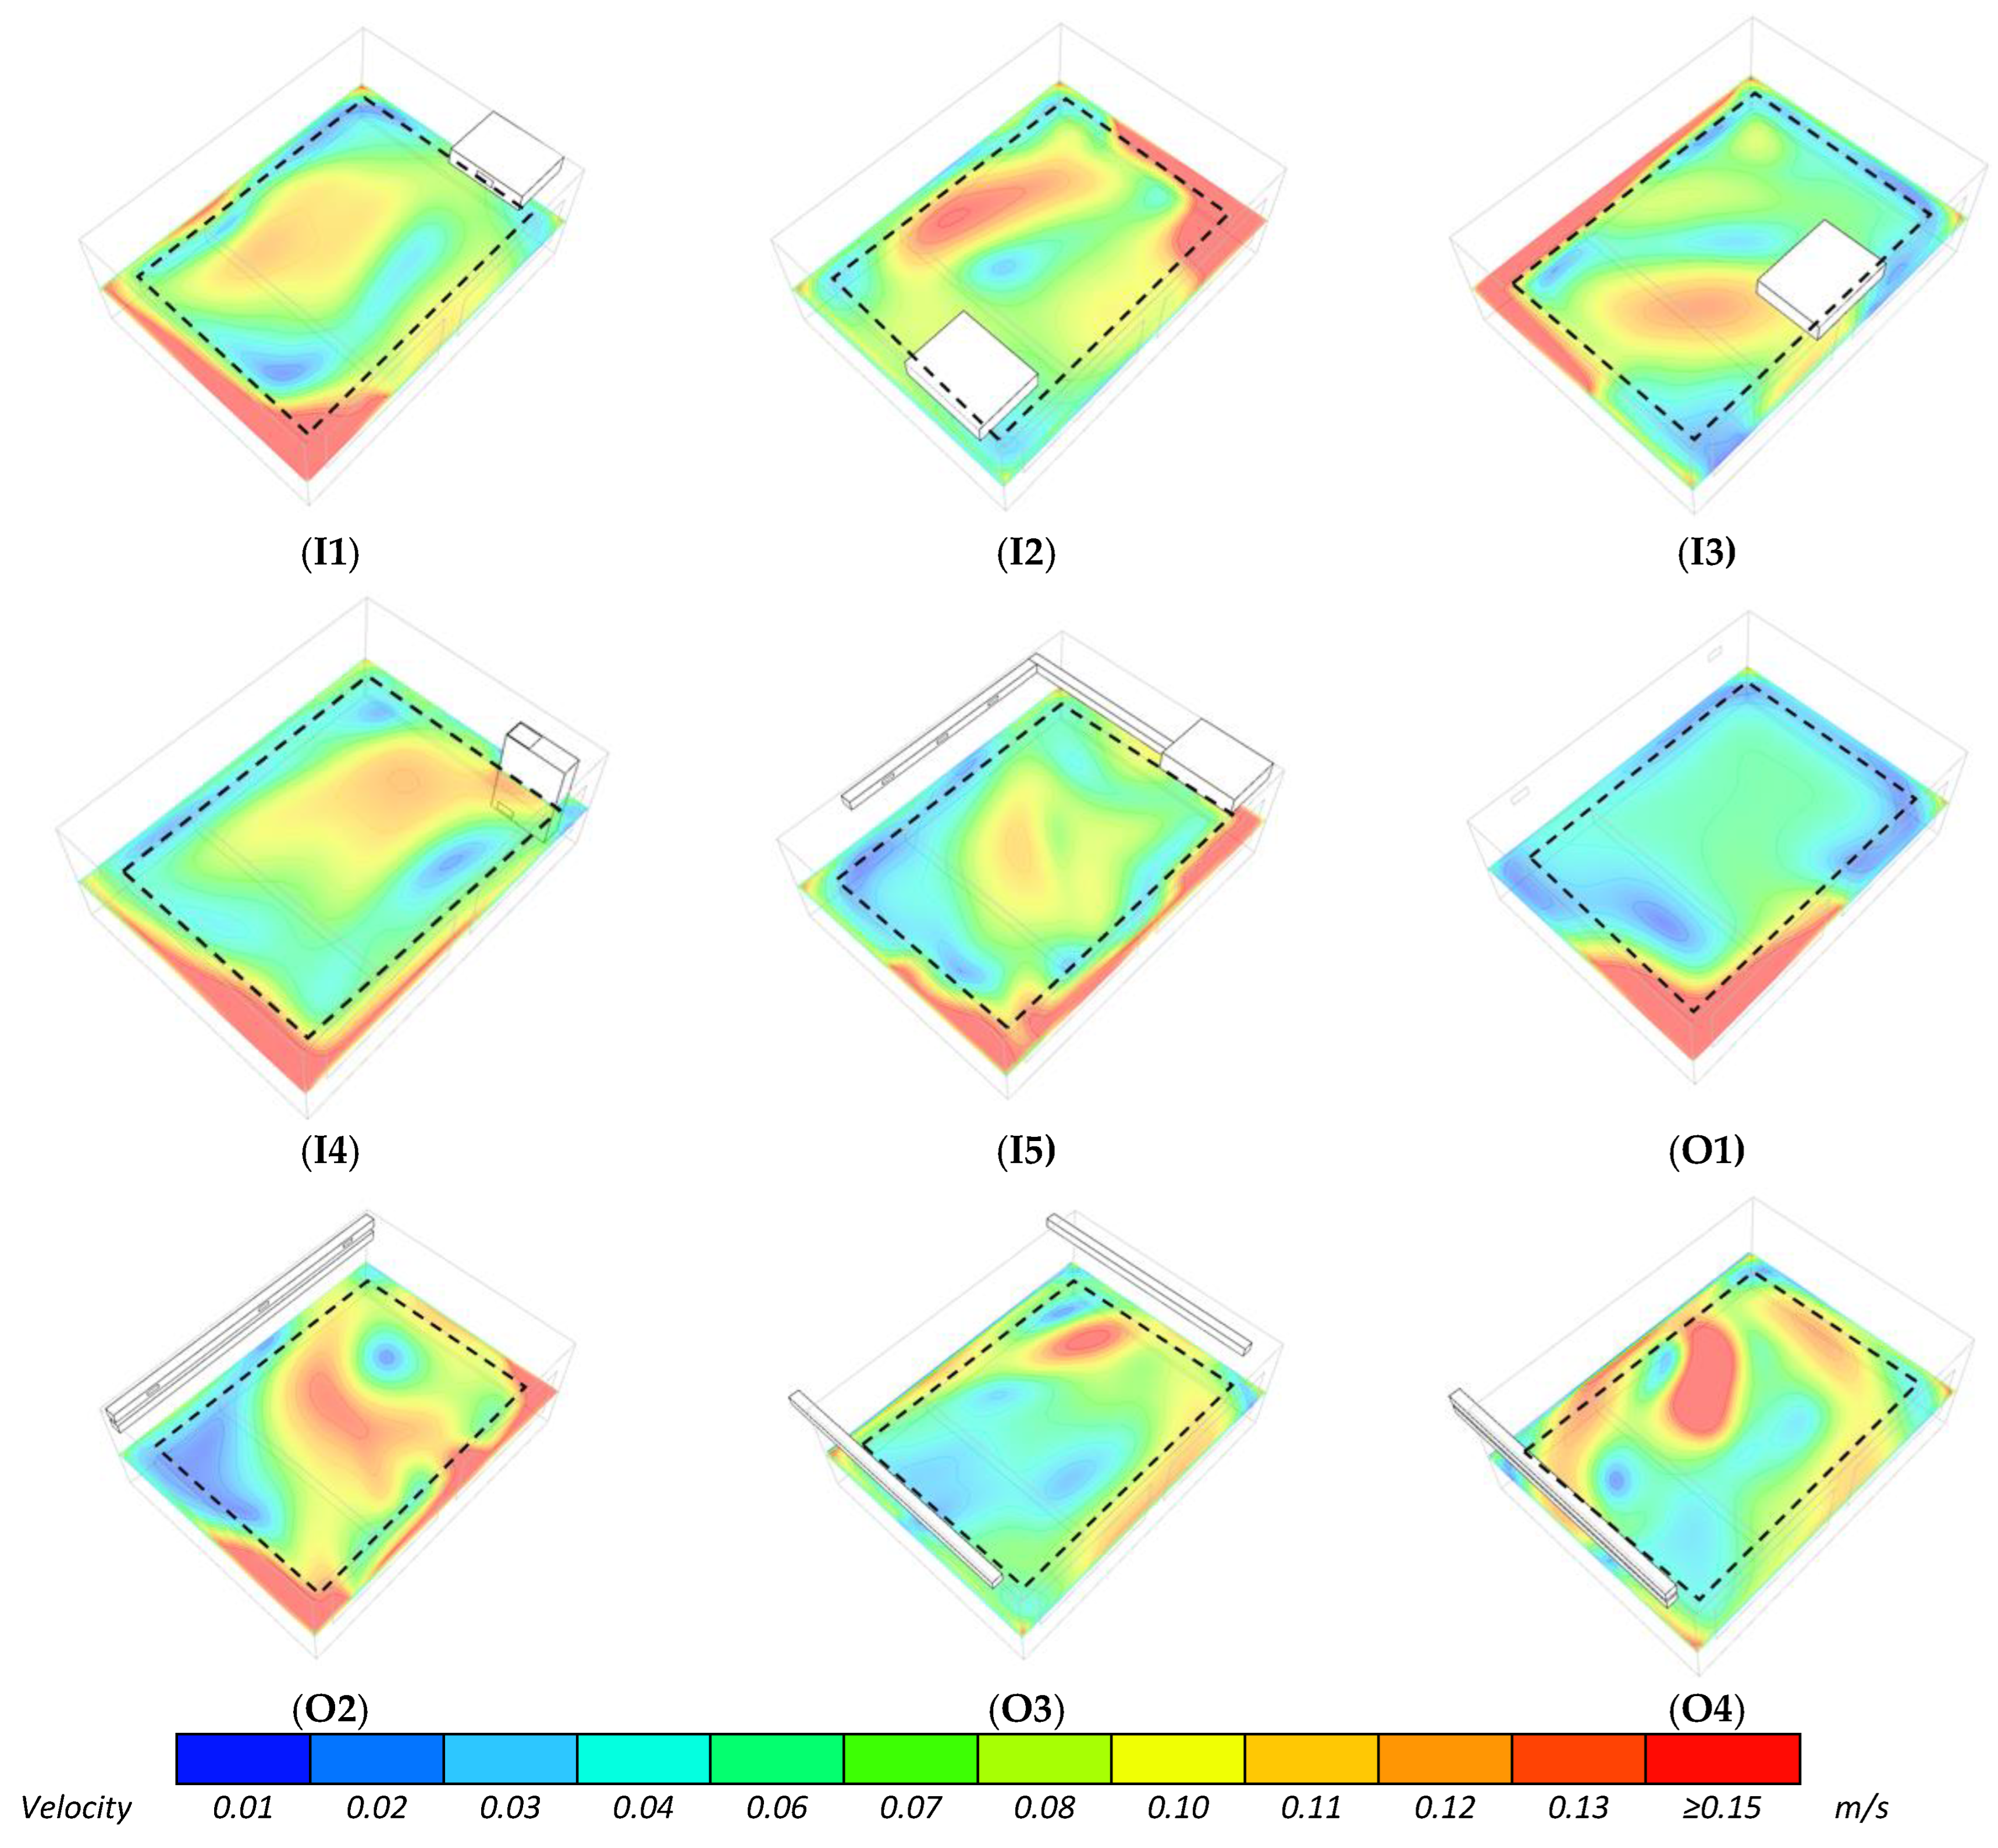
The air distribution in rooms should avoid discomfort among occupants due to air draught (excessive air movement in an occupied enclosure causing discomfort), providing air velocities lower than a reference value (typically 0.15 m/s) within the occupied zone, which is commonly defined as the space extending up to 0.6 m from the walls and a height from the floor based on the activity (standing, sitting, etc.). In all the air distribution schemes, air is supplied above the occupied volume; therefore, its upper boundary (considered at a height of 1.2 m from the floor due to common classroom activities) represents the most critical surface for air draught.
In Figure 6, the air distribution velocity on this surface was plotted for each air distribution scheme to assess the potential for localised discomfort due to air draught. The dotted line defines the edges of the upper boundary of the occupied volume, and the red areas indicate regions where the air velocity equals or exceeds 0.15 m/s. As can be seen, the reference limit value is exceeded in areas located outside the occupied volume upper boundary, except for schemes I2, O2, O3, and O4, where some regions reveal potential discomfort for the occupant. These results confirm that the defined air distribution schemes, despite local velocity peaks in some cases, do not compromise comfort within the primary occupied space.

3.2. Carbon Dioxide Concentration

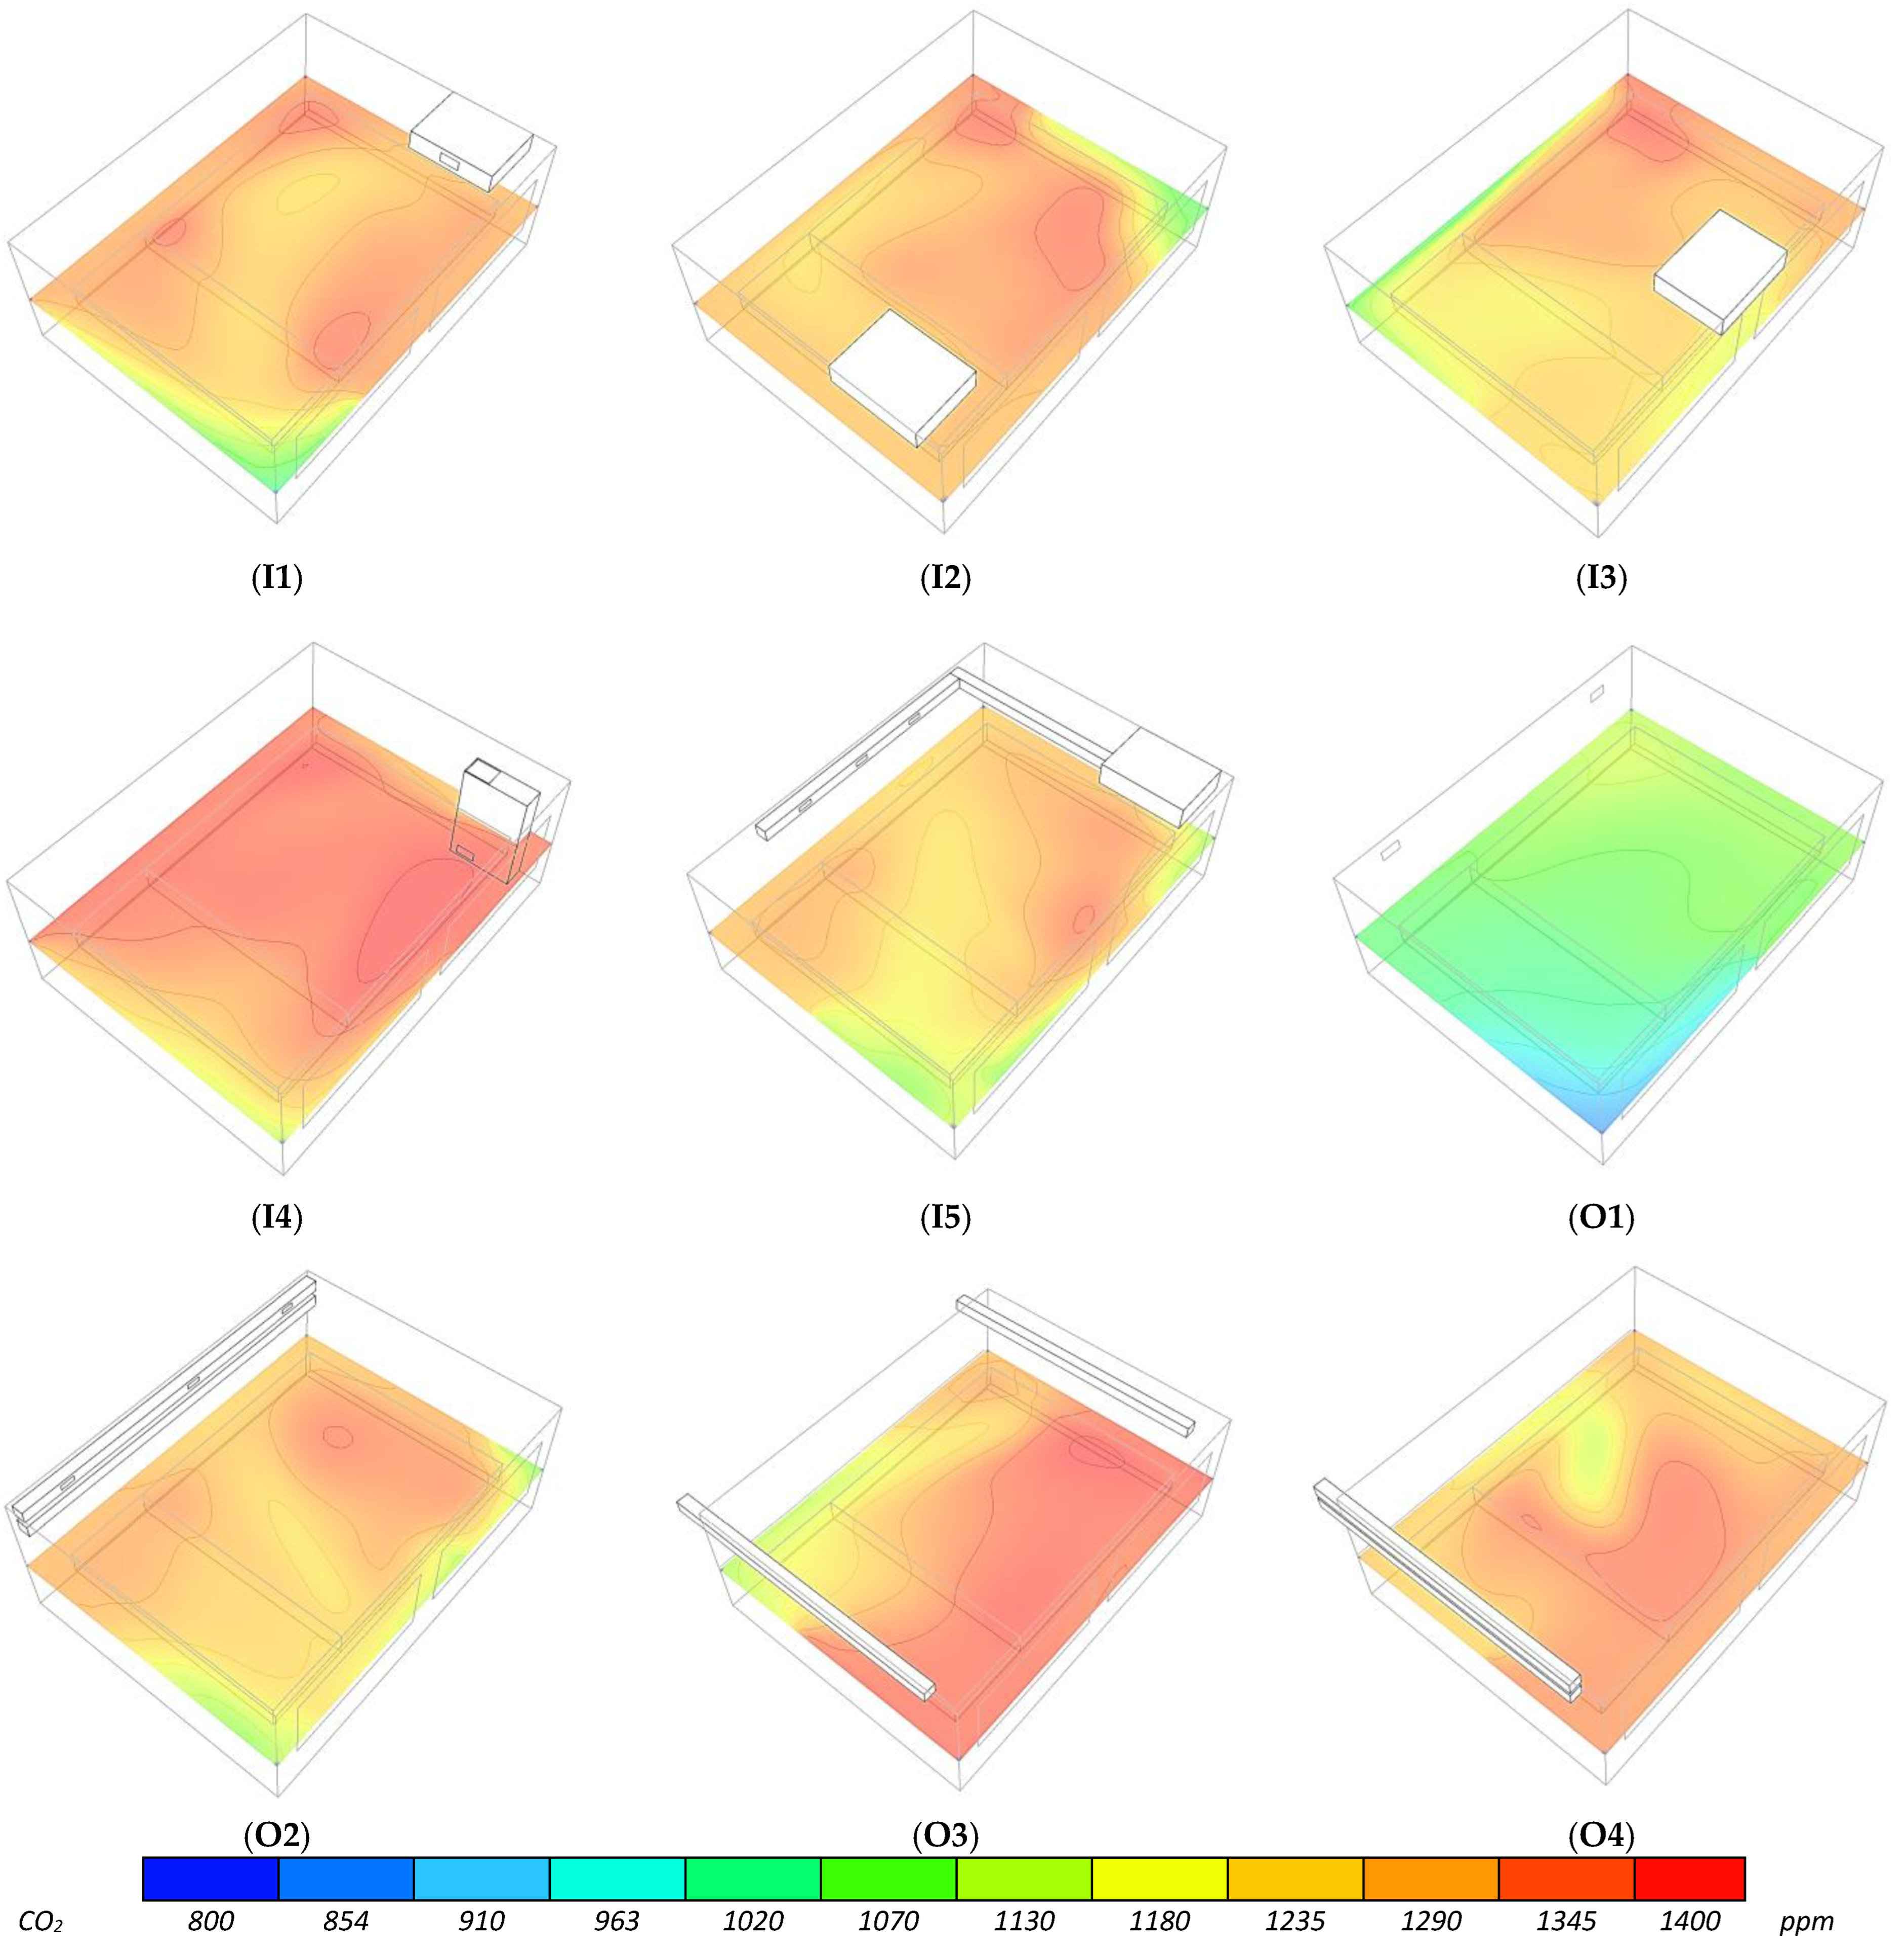
Figure 7 illustrates the spatial distribution of CO2 concentration (in ppm) on the reference horizontal plane across the tested air distribution schemes. Overall, most configurations result in average concentrations near the benchmark of 1200 ppm, which aligns with the expected values under the assumed ventilation and occupancy conditions [11]. Scheme O1 distinctly performs better, showing consistently lower and more homogeneous CO2 levels across the occupied zone, with values well below the reference threshold. This indicates an effective dilution of exhaled pollutants and efficient airflow distribution. Conversely, configurations such as O3 and I4 exhibit higher and more variable concentrations, with localised peaks approaching the upper limit of the scale (1400 ppm), likely due to limited air mixing and suboptimal circulation patterns.
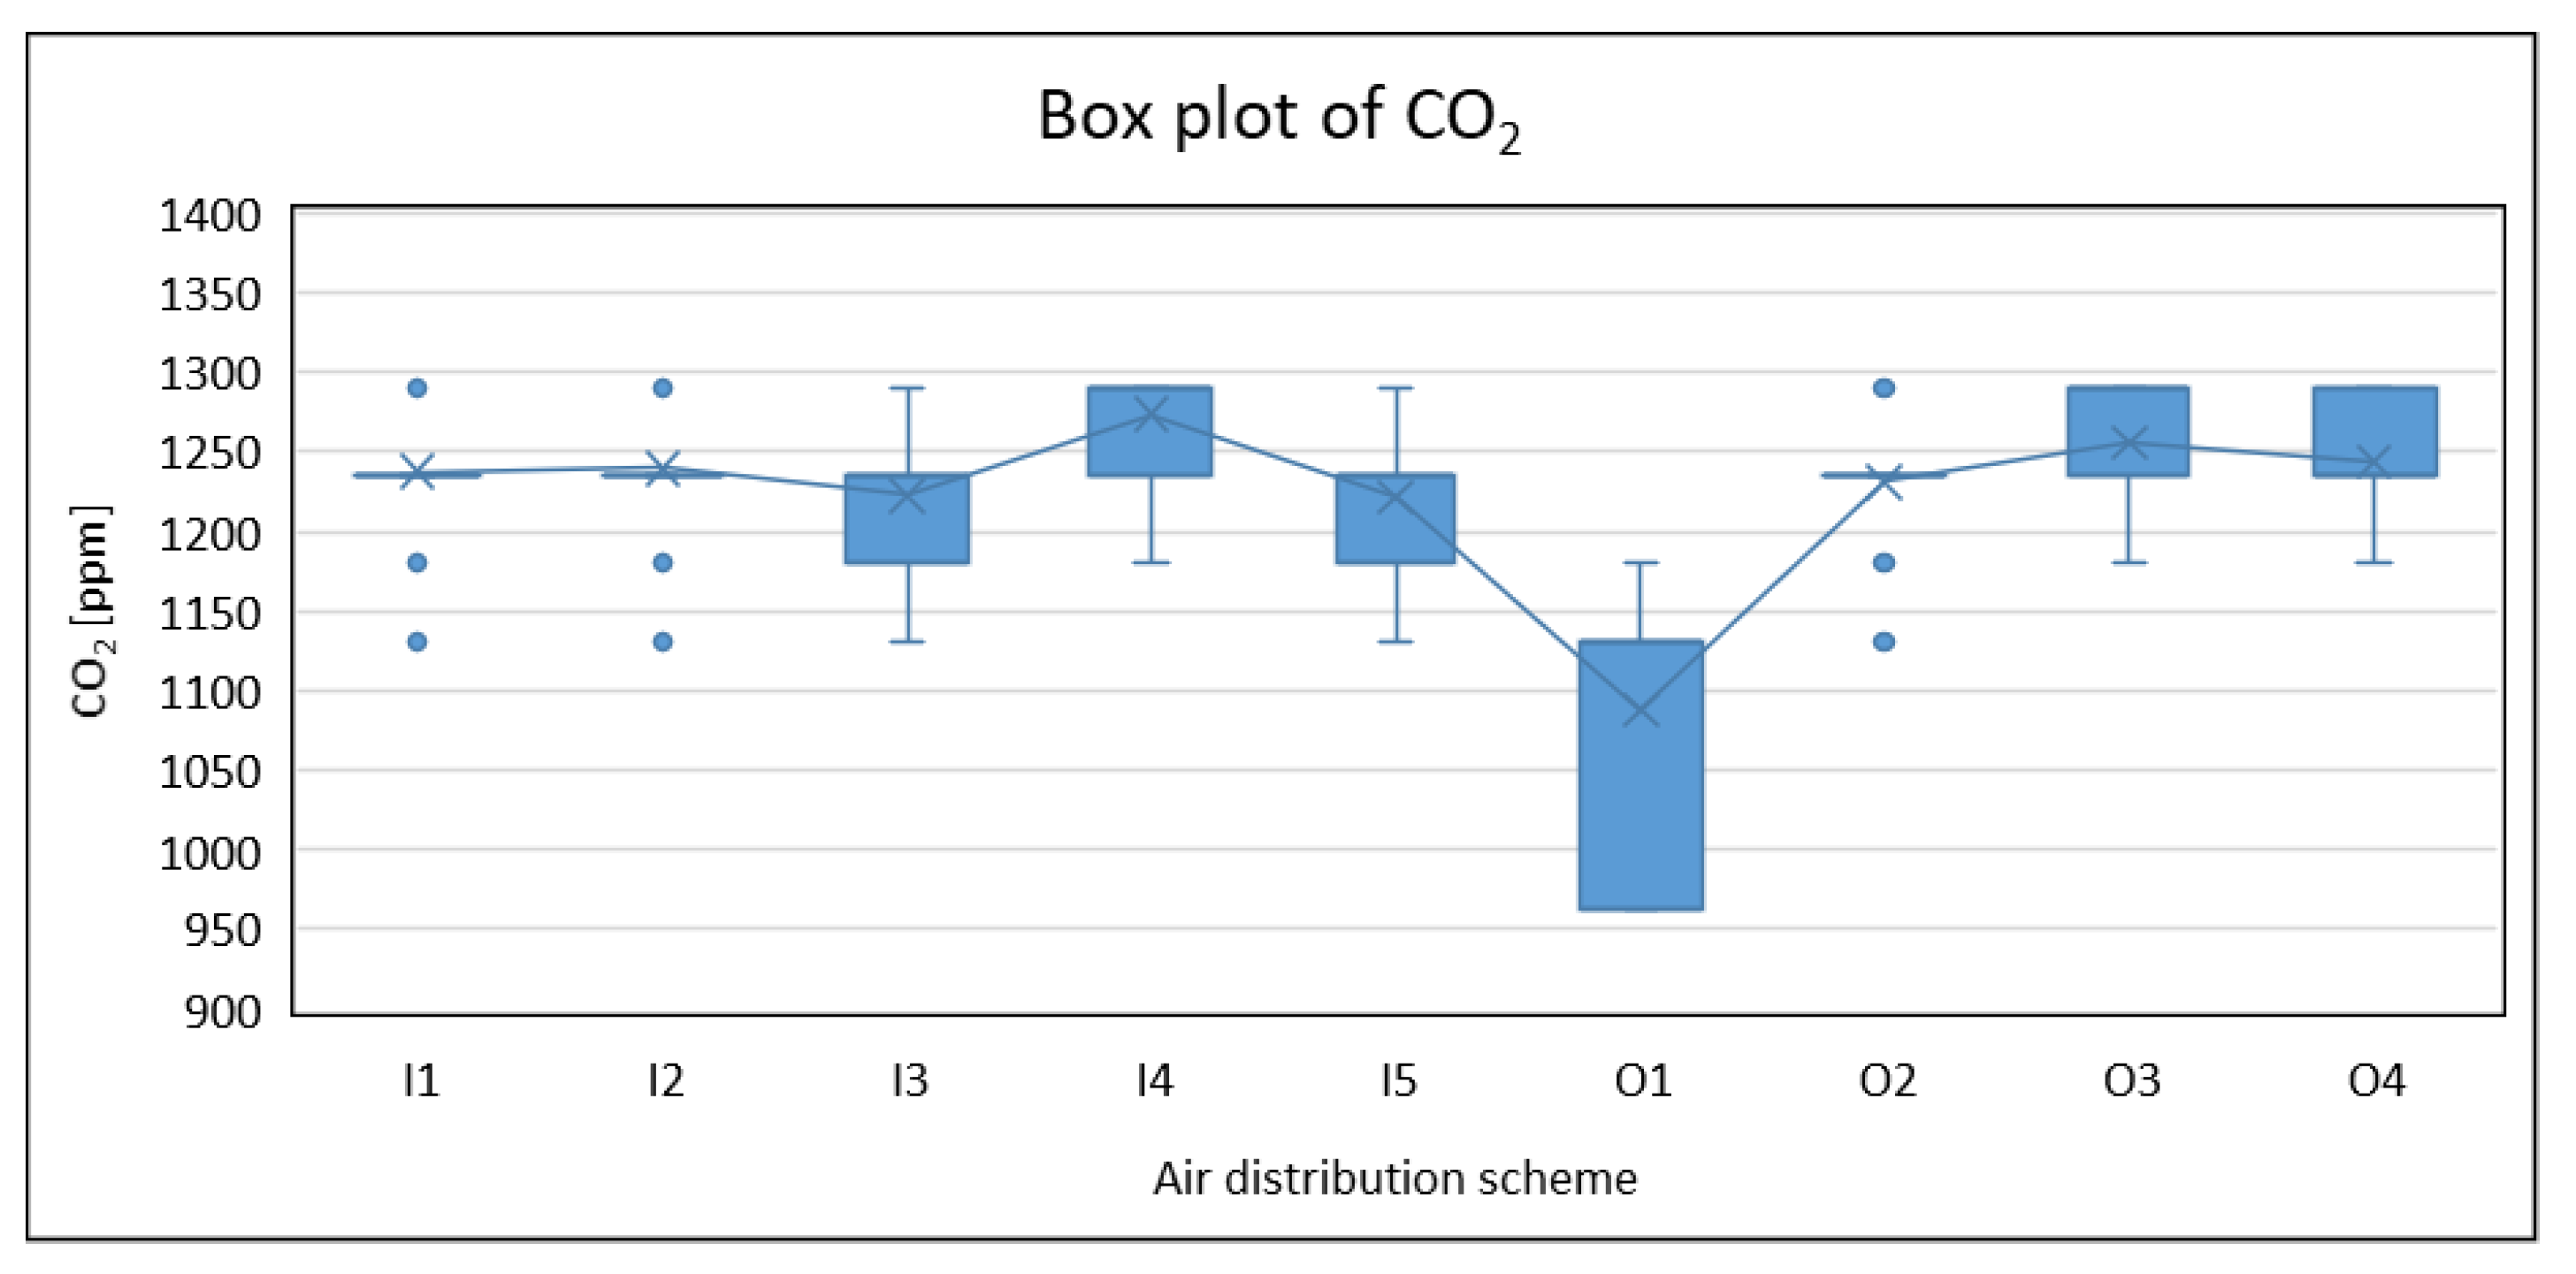
To detail the CO2 concentrations in classrooms across the schemes, the relative distributions were plotted in Figure 8, while Table 4 summarises the main statistical parameters. The box plots highlight four distinct behaviours among air distribution schemes. Configurations I1, I2, and O2 show narrow interquartile ranges and similar median concentrations of around 1250 ppm, indicating comparable and stable CO2 levels. Schemes I3 and I5 exhibit similar central dispersion, with about 1220 ppm concentrations. Configurations I4, O3, and O4 share a comparable spread but are shifted towards higher CO2 values (1250–1300 ppm). Finally, O1 displays a markedly different distribution, with substantially lower mean and median concentrations and a wider IQR, standing out from all other schemes. Preliminary visual inspection of the box plots revealed noticeable spread and asymmetry, further supported by skewness and kurtosis values indicating deviations from normality. This preliminary evidence was then corroborated by the Shapiro–Wilk test (Table 4), which, for all ventilation configurations, indicated a significant distance from normality (p < 0.001), confirming the presence of skewed and/or heavy-tailed distributions.
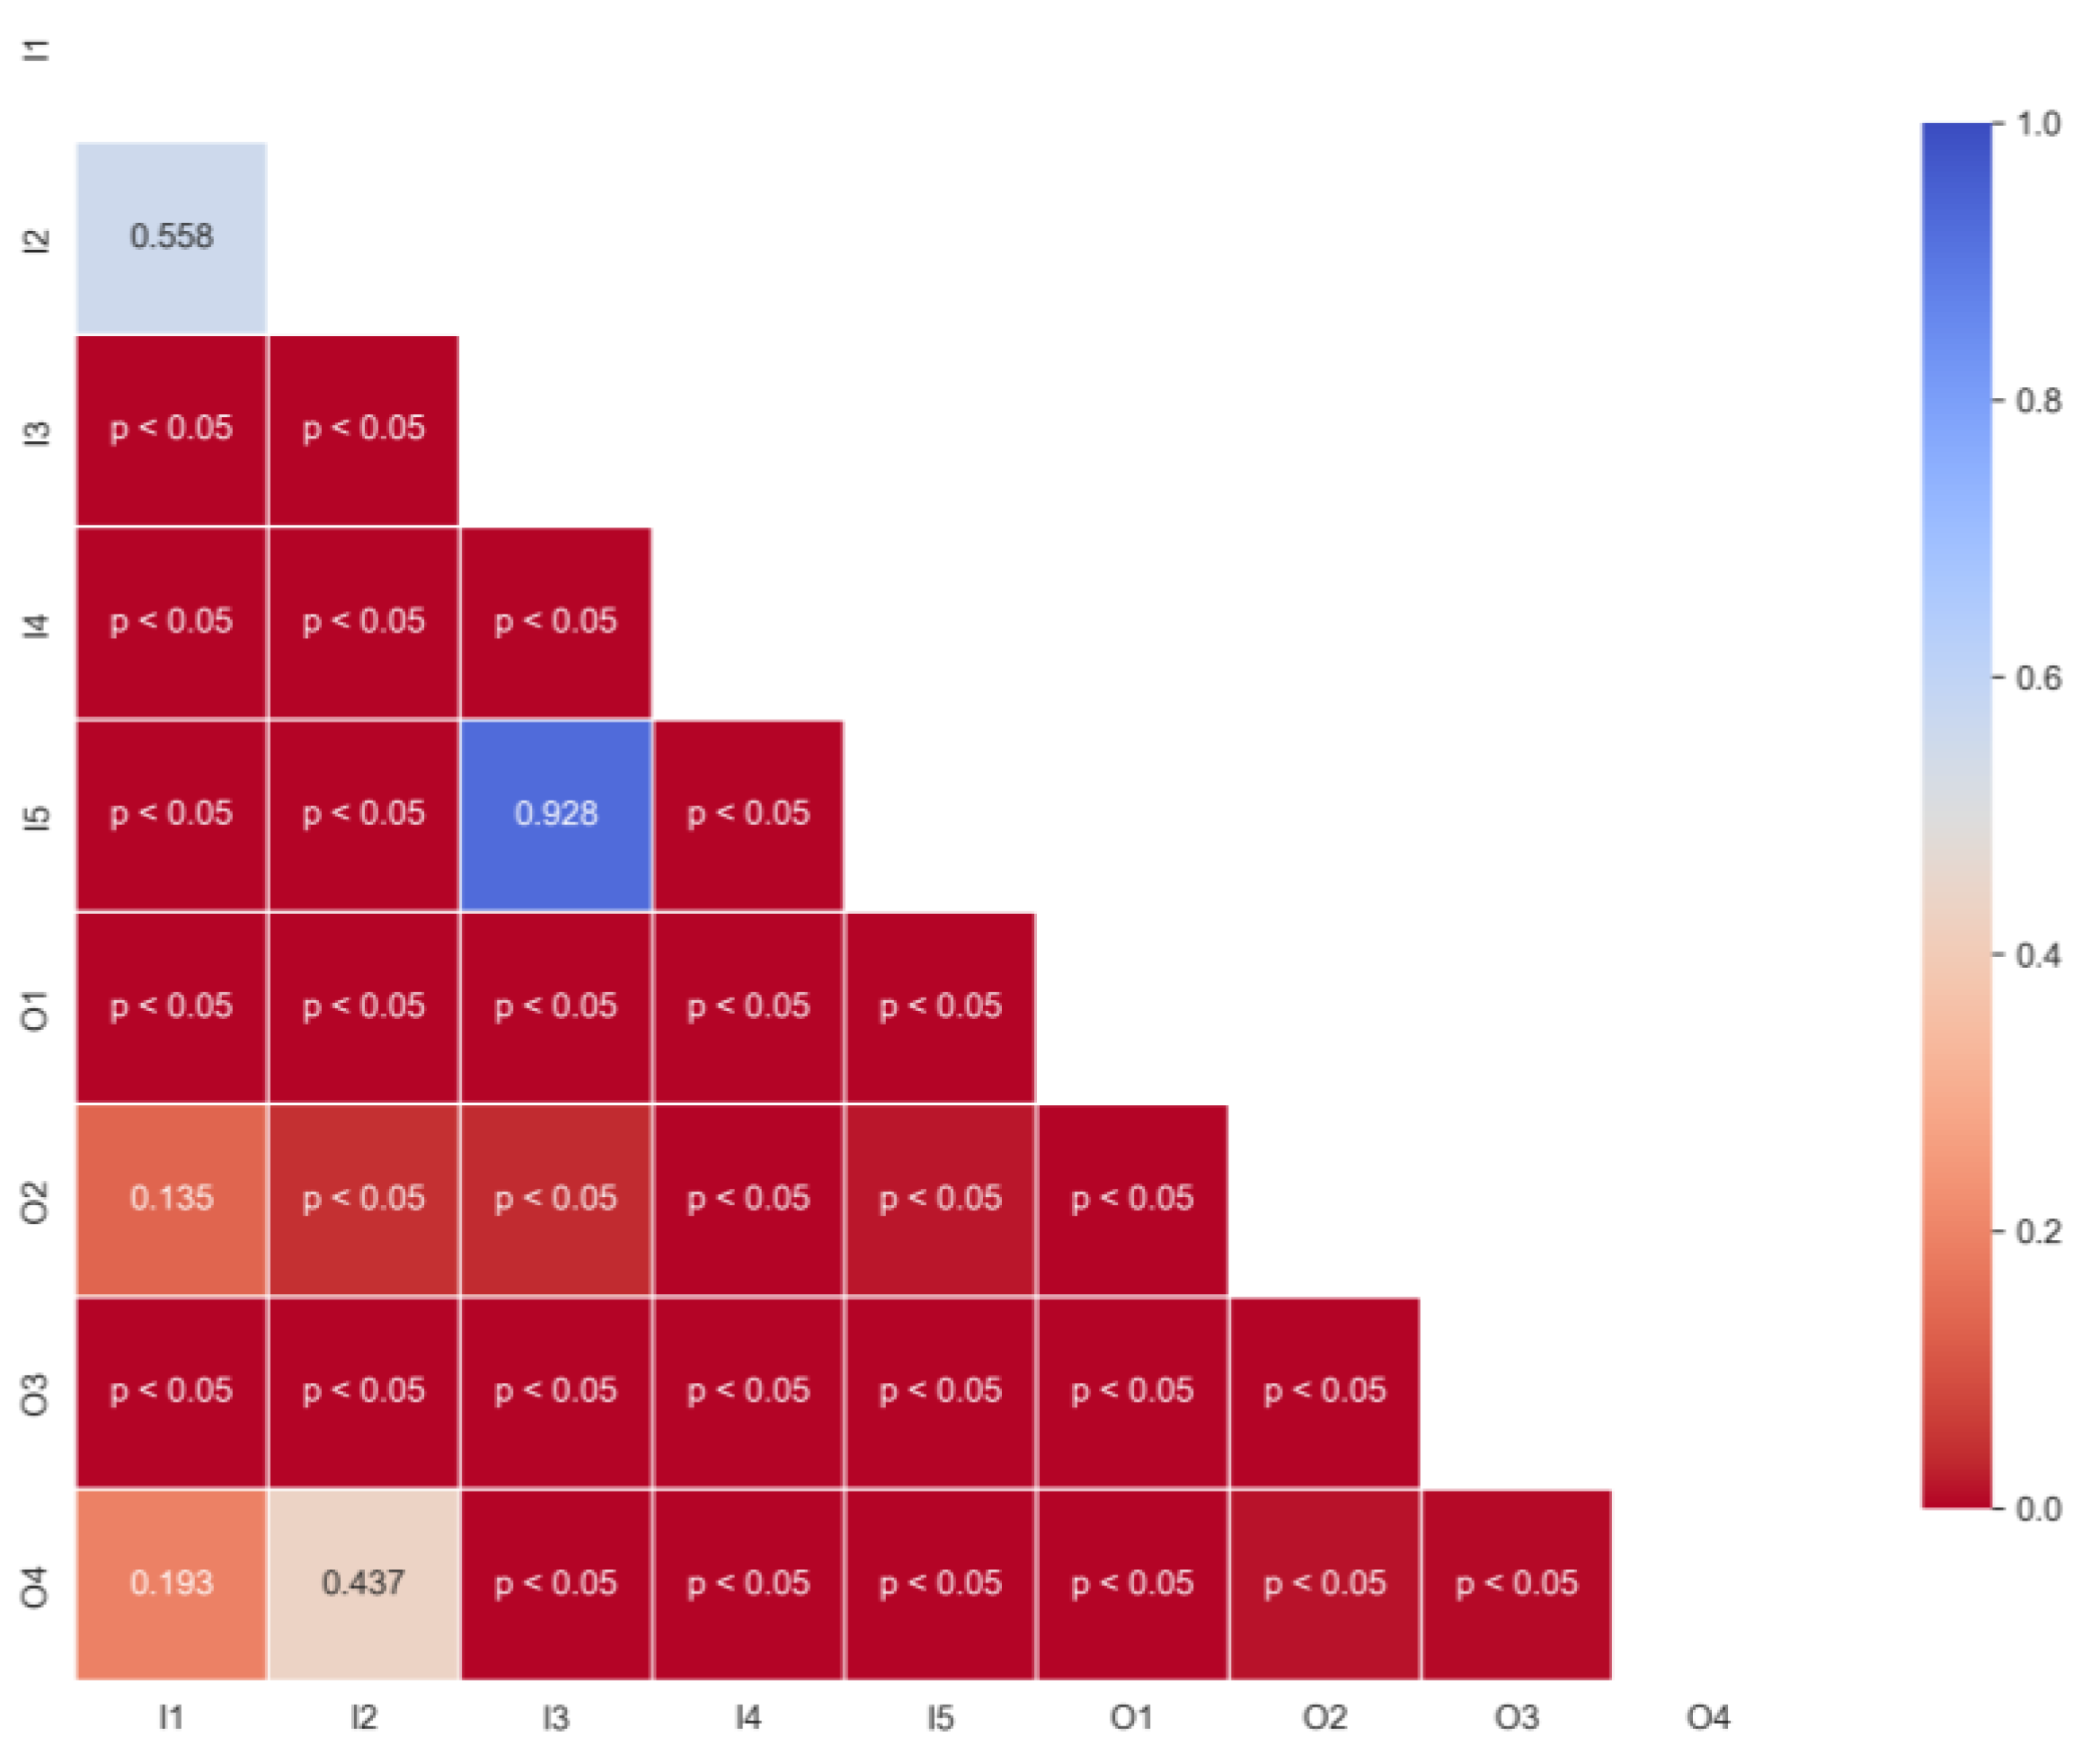
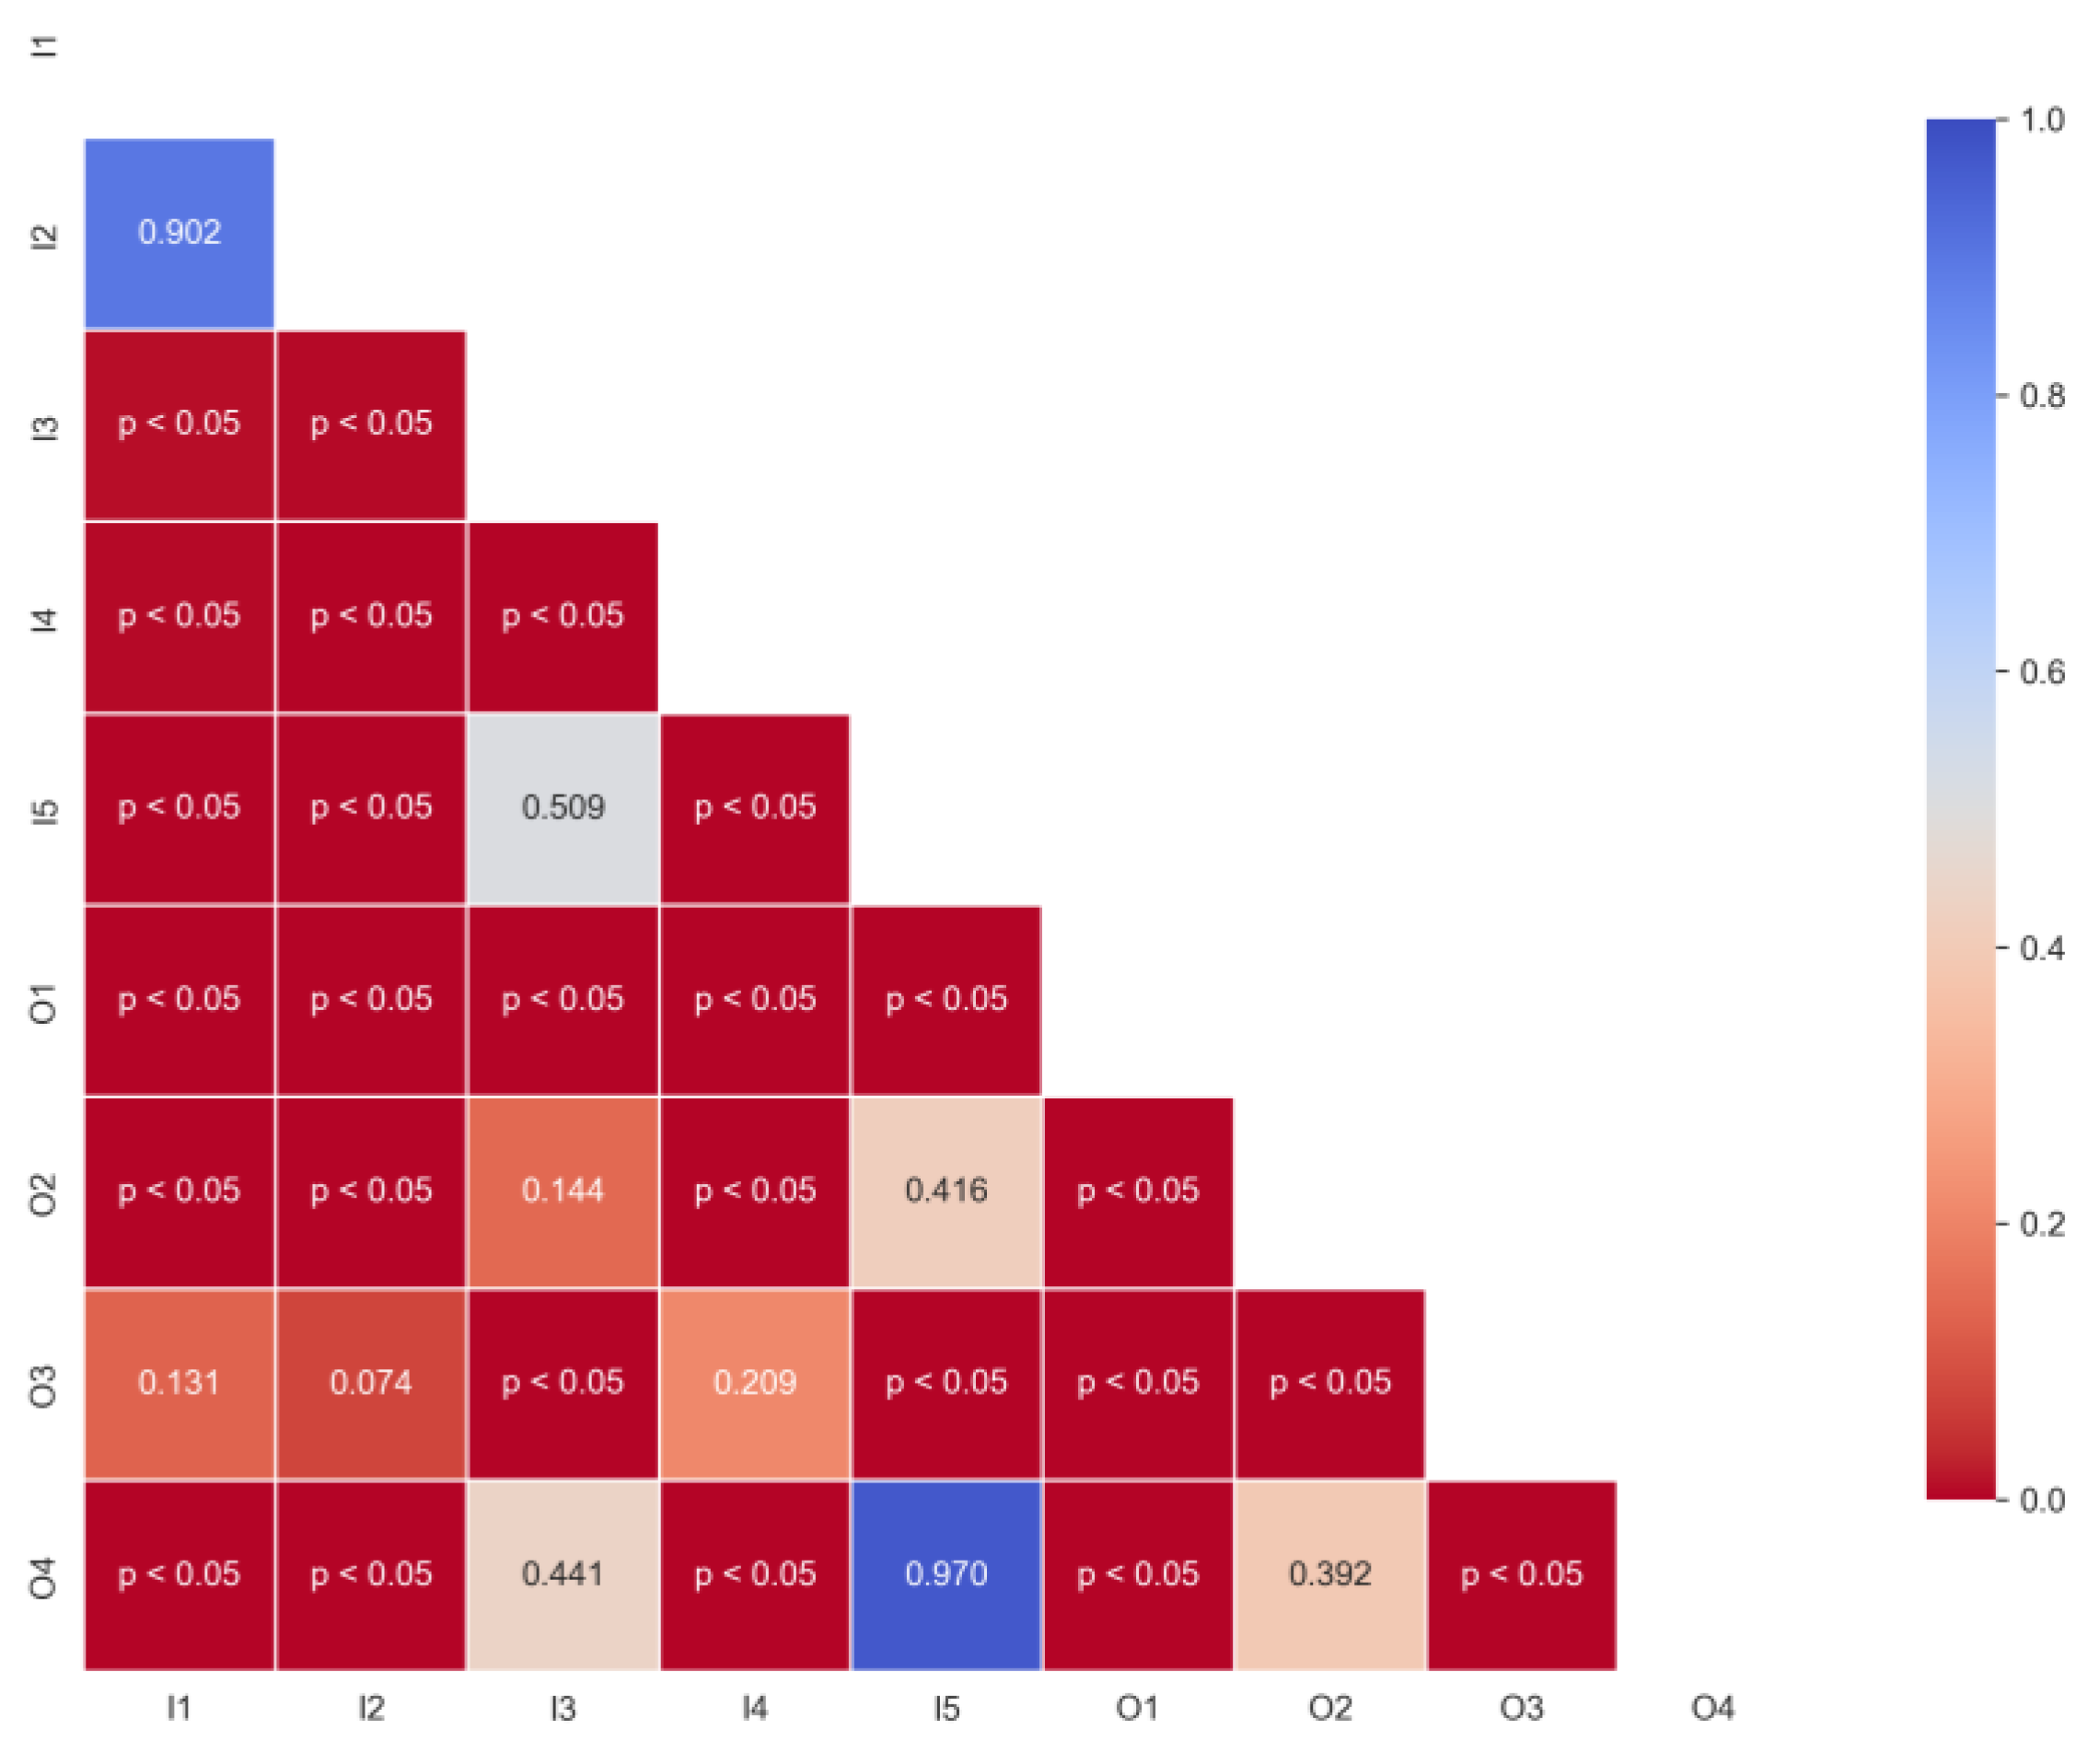
Consequently, the statistical differences between CO2 distributions were evaluated using a non-parametric test, followed by appropriate post hoc comparisons. To assess whether significant differences existed among the distributions, a Kruskal–Wallis H-test was performed. The resulting statistic was H = 426.9 with a corresponding p-value < 0.001, confirming that at least one distribution significantly differs from the others. To further explore the pairwise differences and identify which schemes are statistically distinct, a Mann–Whitney U test was applied to all combinations of air distribution schemes. The outcomes are visualised in the heatmap shown in Figure 9, where cells marked “p < 0.05” indicate statistically significant differences. Based on this analysis, schemes O1, O3, and I4 exhibit differences with all other schemes (p < 0.05), indicating distinct CO2 distribution behaviours and justifying their interpretation as a separate performance pattern. In contrast, schemes I3 and I5 do not differ significantly from one another (p = 0.928), supporting their classification as a homogeneous group with comparable concentration profiles. Similarly, several comparisons among I1, I2, O2, and O4 yield non-significant p-values (p ≥ 0.05), suggesting broadly similar distributions for these schemes and motivating their grouping as a second cluster.
Overall, the conducted analyses indicate that none of the air distribution schemes results in CO2 concentrations significantly exceeding the reference threshold, with concentrations up to about 1300 ppm. Based on the statistical analyses, O1 and I4 can be identified as the best and worst performing schemes, respectively. Scheme O1 exhibits by far the lowest CO2 levels, with a mean concentration of 1088 ppm and a median of 1130 ppm, clearly below all other schemes, while I4 shows the highest concentrations, with a mean of 1273 ppm and a median of 1290 ppm, systematically above the reference value of 1200 ppm. These differences, corroborated by the non-parametric post hoc tests, are statistically significant.

3.3. Air Ventilation Effectiveness

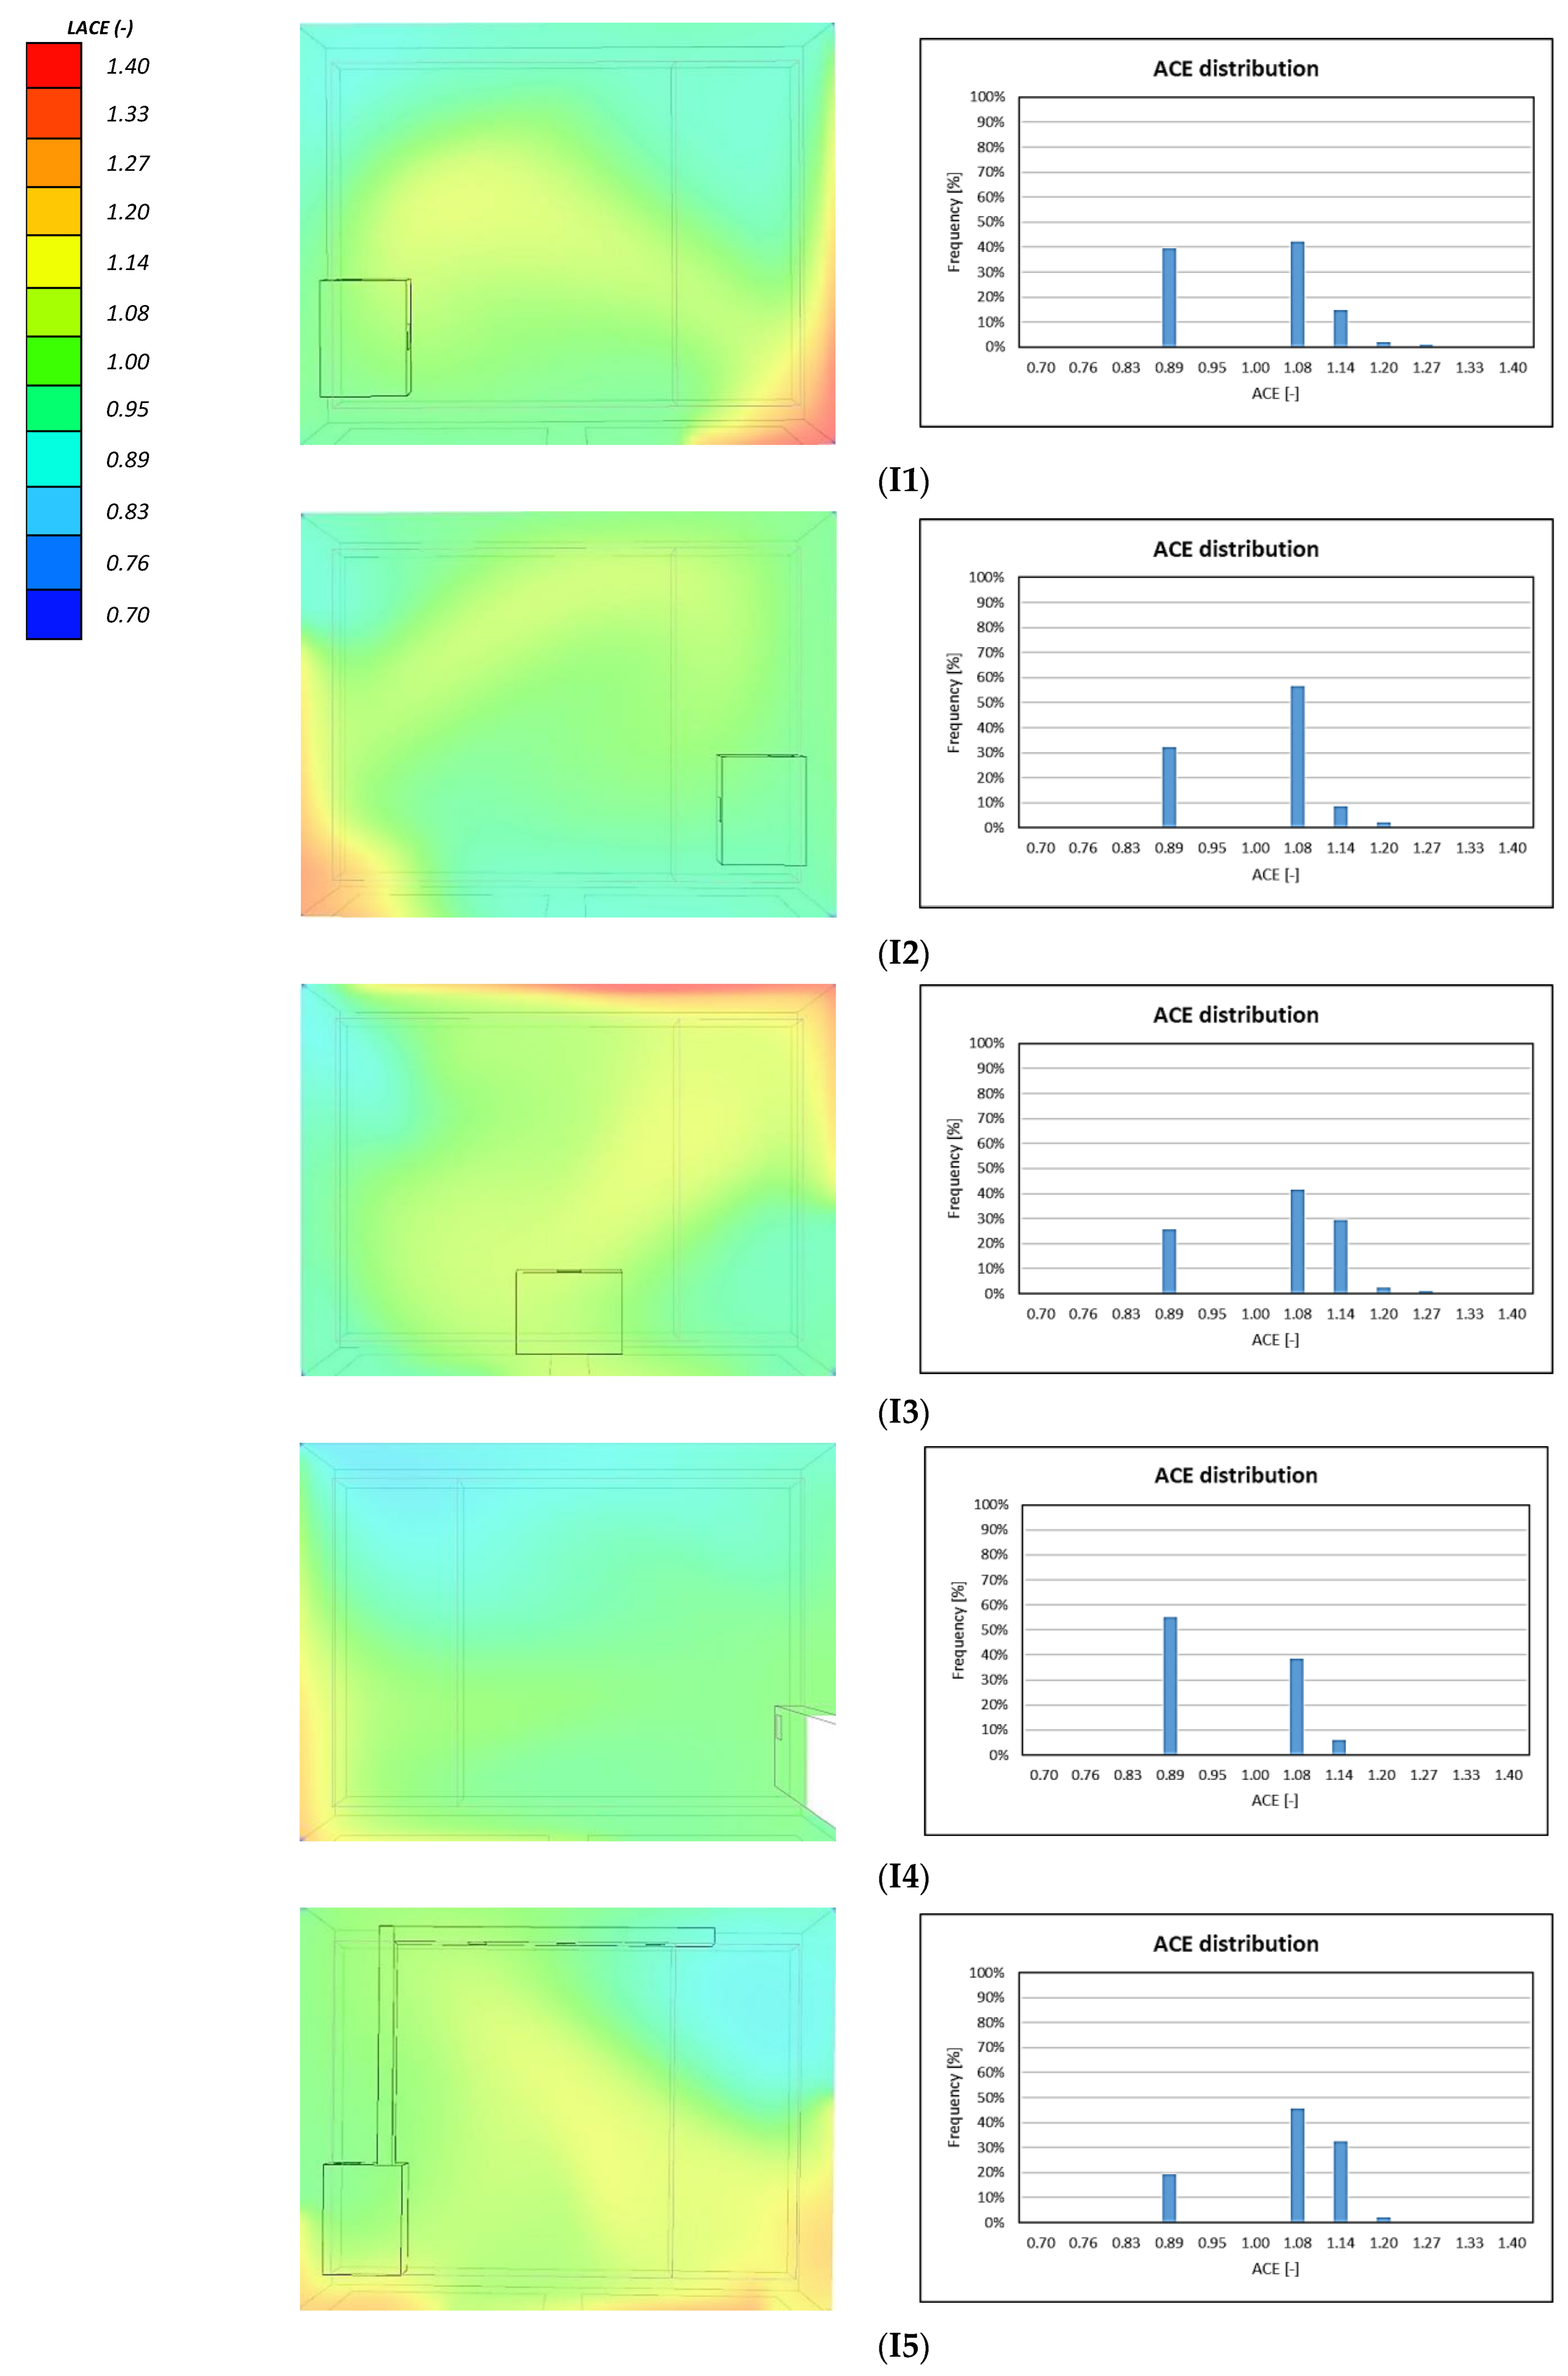
The ventilation effectiveness distribution of the tested schemes is analysed concerning the LACE, as it is a dimensionless index for a direct comparison with the ideal condition of perfect mixing (LACE = 1), regardless of the room volume. In this regard, the distribution of the LACE in the reference horizontal plane, along with charts indicating the percentage occurrence of each value within the plane, is reported in Figure 10 and Figure 11 for the air distribution schemes with inside and outside units, respectively. In the I1 scheme, a low LACE region (LACE < 1) is observed within the long side of the classroom opposite to the windows, which expands particularly in the corner opposite to the location of the ventilation unit. The zone occupied by the students reveals values between 1.08 and 1.14, as the related thermal load generates an upward convective motion that favours the circulation of the air toward the exhaust vent (located over the students’ zone). Conversely, in the I2 scheme, where the corner opposite to the ventilation unit location reveals a low LACE region (LACE < 1), the student’s thermal load acts against the airflow path, leading to a reduced LACE also in front of the ventilation unit. Scheme I3, featuring a supply vent in the middle of the windowed long side of the classroom, achieves a relatively symmetrical distribution of LACE, with about 70% of the values ranging from 1.08 to 1.14. However, LACE values lower than 1 are still present in three of the four classroom corners, while the corner adjacent to the teacher’s zone shows higher values. Indeed, the spatial asymmetry of the thermal load, greater within the student’s zone, induces a curvature of the supply airflow toward the teacher’s side, increasing the local air exchange. The I5 scheme shows an improved LACE distribution compared to I3, due to the extended number of supply points, which enables a more homogeneous delivery of fresh air along the room’s length. However, a confined area, limited to approximately 20% of the total plane, located within the corner opposite the extraction point, shows LACE values below 1. This highlights that, in addition to the more homogeneous delivery of fresh air along the room’s length, the airflow pattern generated does not involve the entire room volume. A stagnant zone persists as the exhaust grille is not located at the end of the effective airflow path. On the other hand, scheme I4 has the worst ventilation effectiveness among the schemes related to the internal units. In this scheme, the supply vent is positioned so that it introduces air towards the ceiling to exploit the Coanda effect (flow adhesion to the surface and fluid acceleration) and maximise distribution. This configuration should move the air in the room and push it towards the return grille positioned near the floor. However, this logic, although it leads to LACE values between 1.08 and 1.14 in the longitudinal band of the class comprising the ventilation unit, leads to a large region of LACE values lower than 1, localised near the long side of the classroom without windows (as for scheme I1).
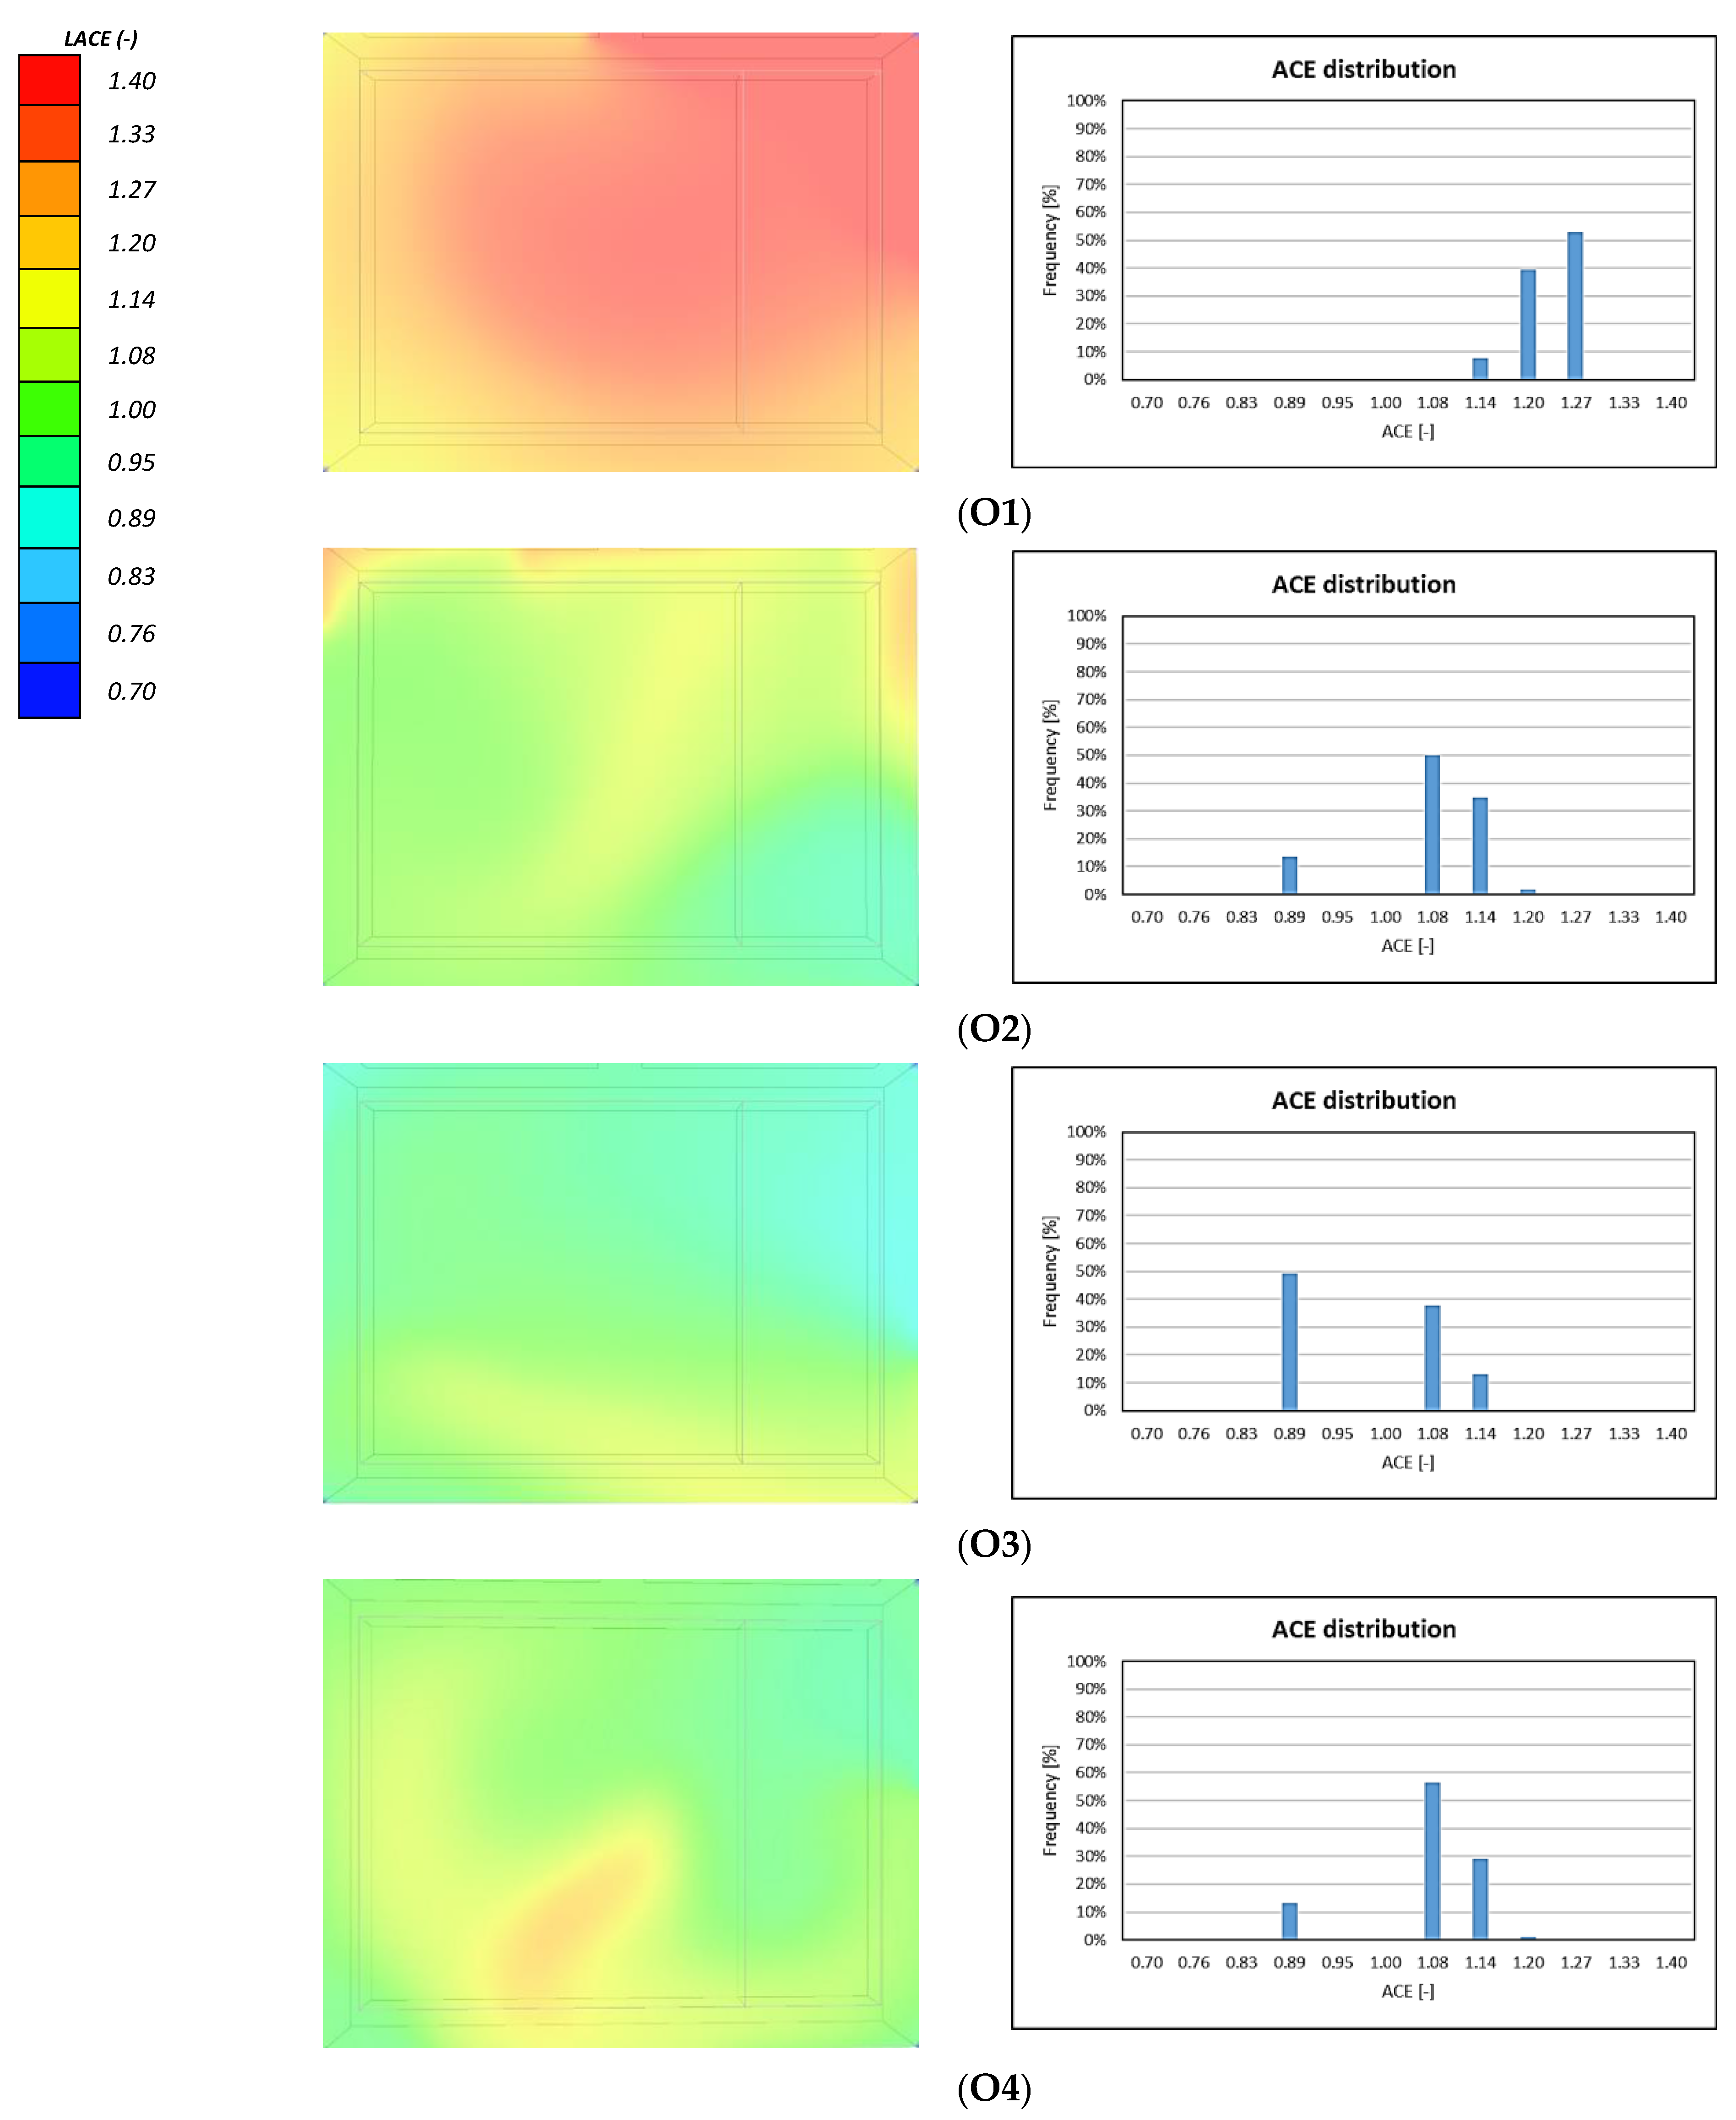
The schemes O2 and O4 reveal a similar LACE distribution, with about 10% of low LACE value (<1) regions. However, scheme O2 shows a higher LACE that is resealable as the supplied air travels through the smaller dimension of the room before being removed, thus generating a more rapid air exchange. Thanks to the distributed supply and exhaust grilles aligned on the same side, both schemes lead to a more uniform air exchange than schemes I1, I2, and I3 with a single supply and exhaust. Comparing schemes I5 and O2, where the supply grilles are similar, it can be noted how the location of the exhaust grilles in line with the supply airflow path can improve the air exchange in the room, reducing the potential stagnation zone by 10%.
On the contrary, in scheme O3, the arrangement of the supply and exhaust terminals placed on opposite sides causes a direct path between inlets and outlets, promoting airflow short-circuiting and minimal room air entrainment. Consequently, the LACE distribution reveals limited effectiveness, with up to 50% of the reference plane showing LACE < 1, revealing an overall underperformance in relation to the other schemes with outside units. Scheme O1 produces the best overall performance, with the LACE distribution showing widespread values above 1 (almost between 1.20 and 1.27) and no stagnation zones. The enhanced performance is attributable to two main factors. First of all, the arrangement of the supply and the exhaust vents, which are placed at the opposite ends of the long side, leads to a well-oriented ventilation path that travels the full depth of the room. The second factor is the greater momentum flow of the single jet in relation to multiple jets (as the air speed is the same in both cases), which improves entrainment and mixing of the air within the room.
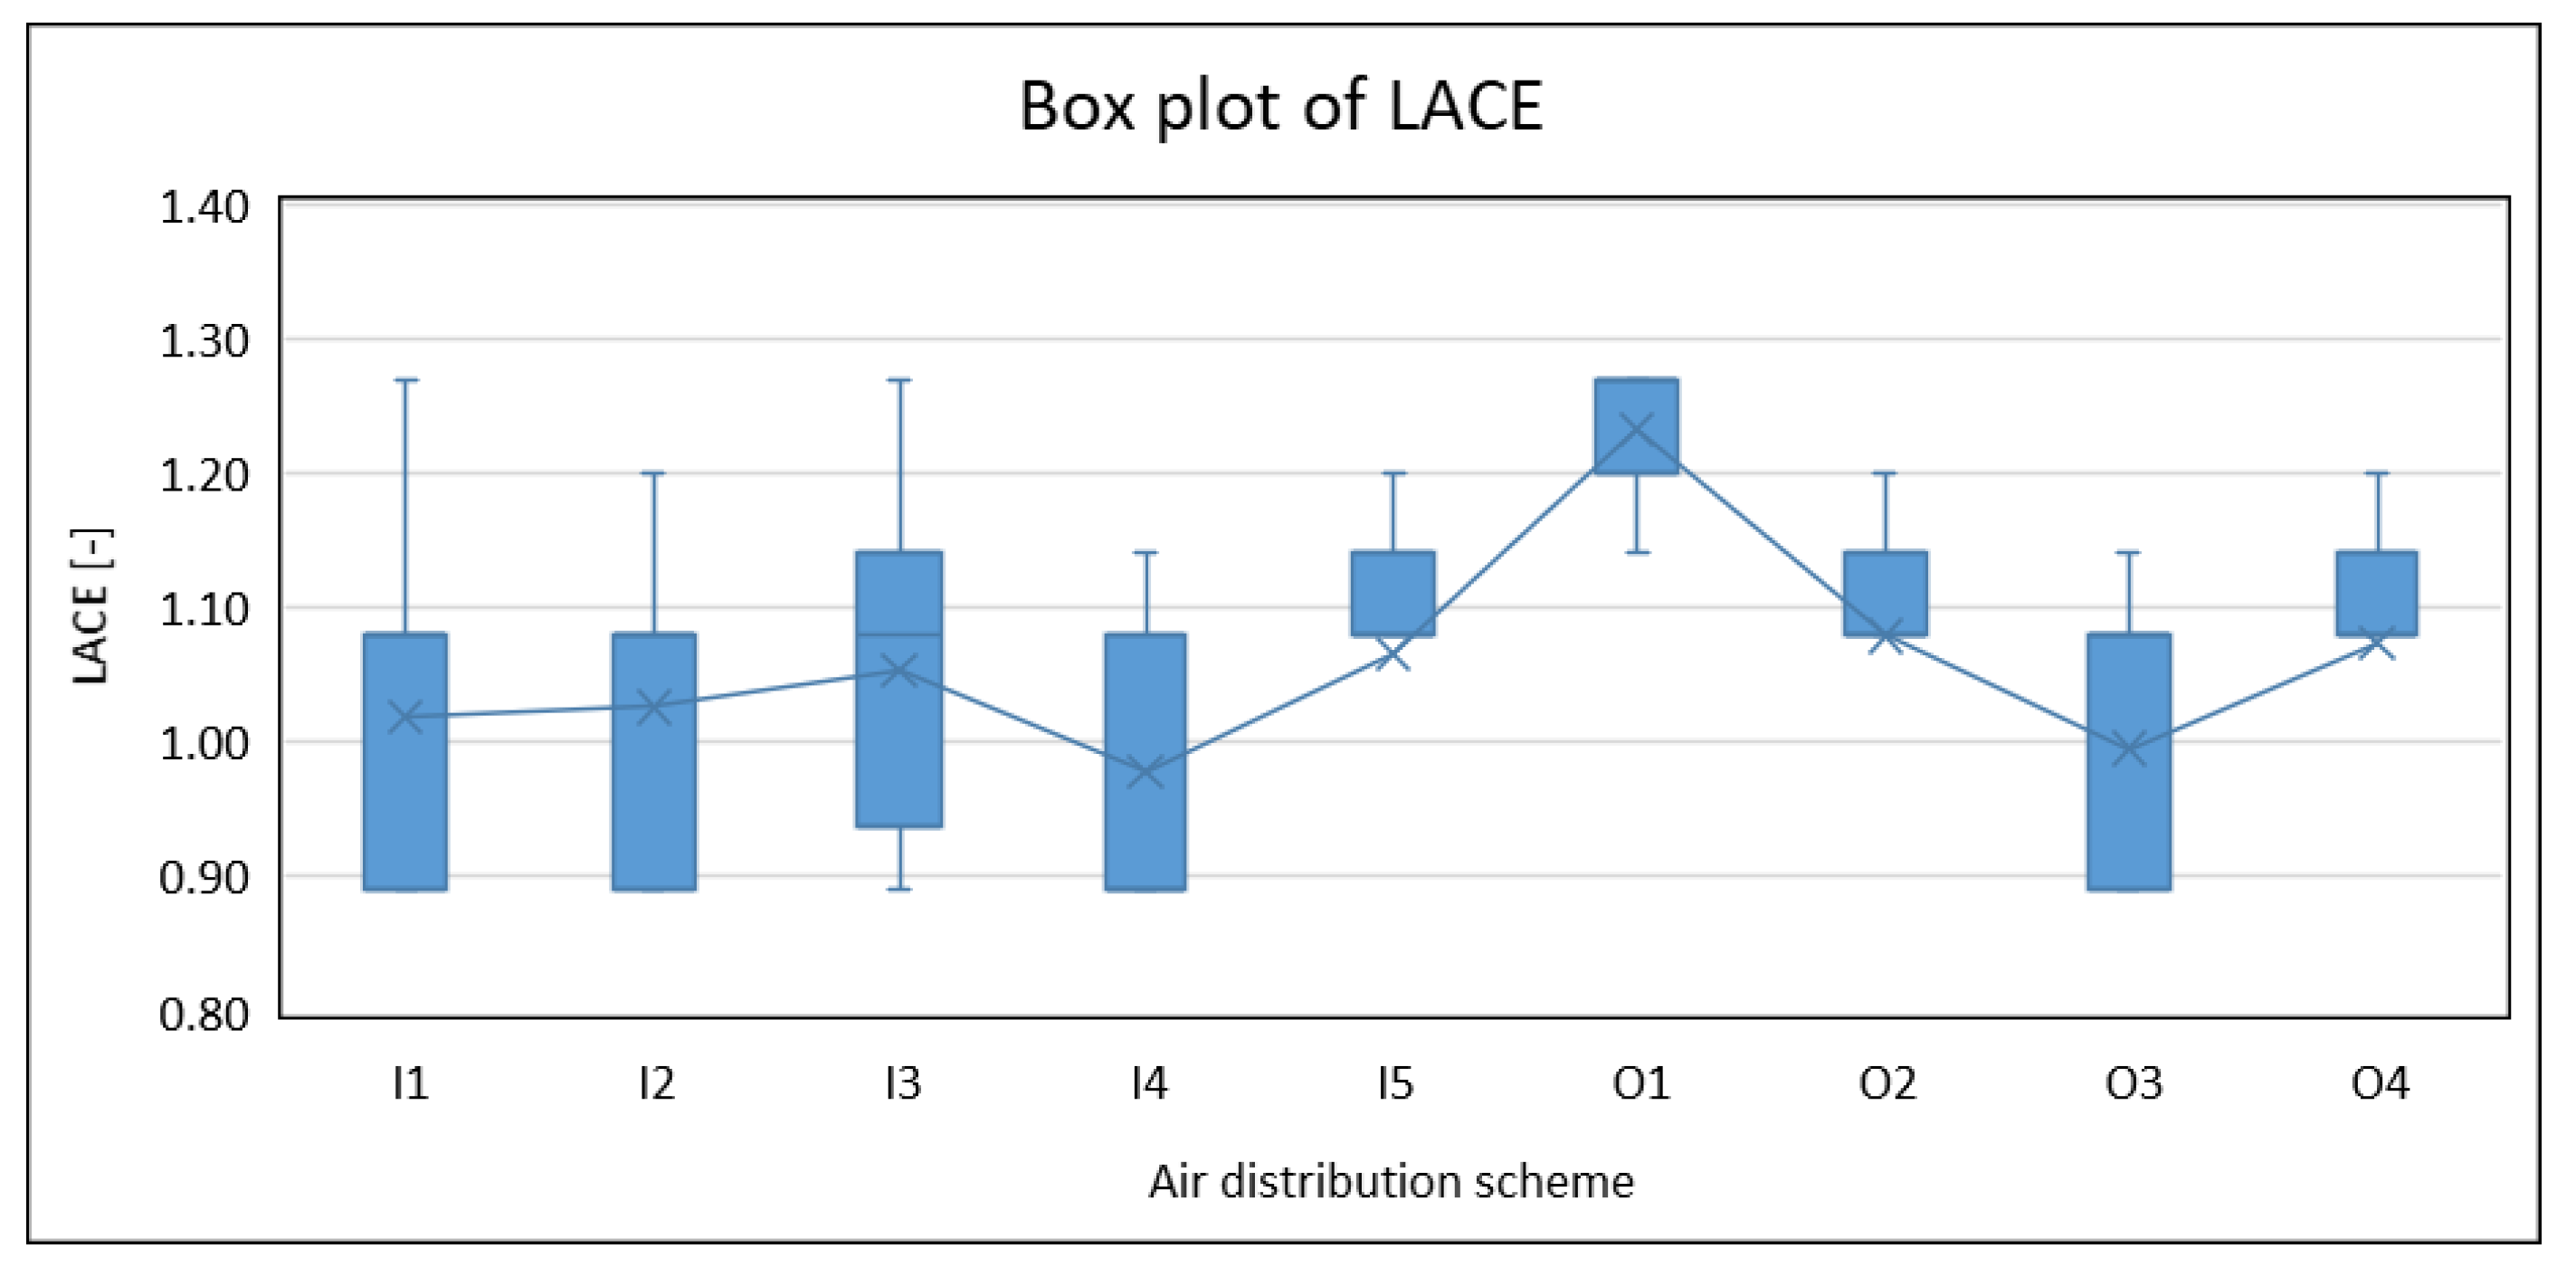
The box plots (Figure 12) and descriptive statistics (Table 5) for LACE indicate distinct behaviours among the air distribution schemes. In addition, most configurations exhibit median values close to 1.08 (I1, I2, I3, I5, O2, O3, and O4), and two clusters with different interquartile ranges could be recognised. Schemes I1, I2, and O3 show almost identical distributions (means 0.99–1.03, same median 1.08, and IQR 0.19), while I5, O2, and O4 cluster around slightly higher values (means approximately 1.07–1.08, medians 1.08, and relatively small IQRs). Scheme I3 shows a higher mean value than schemes I2 and I3 but presents the same IQR. In contrast, scheme O1 clearly stands out, with the highest mean and median LACE (1.23 and 1.27, respectively) and limited dispersion (0.07), denoting consistently superior air exchange efficiency.
Conversely, I4 is the only configuration with a mean LACE below unity (0.98) and a markedly lower median (0.89), indicating persistently poorer performance. Consistent with the CO2 analysis, the Shapiro–Wilk test rejects normality for all LACE distributions (p < 0.001), motivating the use of non-parametric procedures to assess the statistical significance of the differences between the distributions.
The Kruskal–Wallis test, followed by the Mann–Whitney test (Figure 13), was then used to verify whether the clusters identified from the descriptive analysis correspond to statistically significant differences between schemes. The heatmap shows that most pairwise comparisons are significant (p < 0.05), confirming substantial differentiation among the LACE distributions, while a limited number of non-significant comparisons (p ≥ 0.05) support the presence of homogeneous subgroups: in particular, I1, I2, and O3 are statistically indistinguishable, as are I3, I5, O2, and O4, indicating overlapping performance within these pairs. O1 shows distinct differences from all other schemes, consistently demonstrating its superior air exchange efficiency. Similarly, I4 stands out from most distributions, underscoring its designation as the least effective scheme.
The combined analyses of CO2 concentration and LACE distributions provide a coherent picture of the relative performance of the investigated air distribution schemes, offering quantitative guidance for designers. Across all metrics, scheme O1 clearly emerges as the best-performing configuration. In terms of CO2, O1 achieves the lowest mean concentration (≈1088 ppm) and median concentration (1130 ppm), substantially lower than all other schemes, which cluster above 1200 ppm; in parallel, it exhibits the highest LACE values, with a mean of 1.23, a median of 1.27, and a very narrow IQR, indicating both highly effective and spatially robust air renewal. Non-parametric tests (Kruskal–Wallis followed by Mann–Whitney) confirm that these differences are statistically significant, with O1 outperforming all alternative schemes in ventilation performances. From a fluid dynamic viewpoint, this result is consistent with the airflow pattern: the single supply jet preserves sufficient momentum along the classroom depth, promoting entrainment and mixing across the occupied zone while avoiding pronounced stagnation regions and short-circuiting between supply and extract, thereby ensuring that the fresh air is effectively delivered where occupants are located without excessive air velocity. Beyond its technical superiority, O1 also offers relevant practical advantages. Unlike the other schemes with outside units, O1 does not require supply and extract ducts within the classroom, reducing invasiveness and limiting additional suspended elements. This layout simplifies maintenance (access from the corridor without disturbing lessons) and, crucially, mitigates noise issues frequently reported in the literature for in-room units in school applications [66], as the main sound sources are physically separated from the occupied space.
When installation in the corridor is not feasible due to limited corridor sizes or structural constraints, schemes I3 and I5 should be considered, as they exhibit the most favourable behaviour among the schemes with an inside unit. Both achieve mean CO2 levels around the reference limit and LACE values close to or above unity; the pairwise Mann–Whitney tests indicate no statistically significant difference between I3 and I5. However, I5 combines a higher mean LACE (1.07) with reduced dispersion, indicating more stable and predictable ventilation effectiveness across the room than scheme I3. From an airflow perspective, this can be associated with a more favourable interaction between the multiple supply jet trajectories and the extraction location, which promotes mixing and less stagnation zones. Furthermore, I5 is strengthened by the possibility of integrating the unit within an acoustically insulated suspended ceiling, which is particularly relevant to match the acoustic comfort requirements, as reported in [67]. Inside ceiling-standing solutions, however, are not universally applicable. In some retrofitting scenarios, structural capacity, available ceiling height, interaction with existing elements (e.g., luminaires or false ceilings), or seismic design requirements may limit or preclude the adoption of ceiling-standing solutions. In such cases, floor-standing schemes (I4) remain the only realistic option. Scheme I4 is identified as the least effective configuration, with the highest mean CO2 concentration (≈1273 ppm), a median close to 1290 ppm, and a LACE mean below unity (0.98), with a markedly low median (0.89). Statistical testing confirms that I4 differs significantly from the alternative schemes tested in this study, and its behaviour is consistent with the predicted airflow field, where the relative position of supply and extract favours leaves about 50% of the occupied zone weakly ventilated. Nonetheless, I4 may still be considered a viable alternative in highly constrained contexts.

4. Conclusions

This study presented a robust comparative assessment of different air distribution schemes of decentralised Mechanical Ventilation Systems (MVSs) for better-informed design decisions in classroom ventilation upgrades, guiding the selection of the most suitable one based on the application context. CFD simulations were carried out in a reference classroom representative of the Italian school building stock, and the performance of each configuration was evaluated in terms of CO2 concentration and Local Air Change Effectiveness (LACE) in the breathing zone. The analyses systematically combined CFD techniques with statistical methods to distinguish meaningful performance differences and to identify robust clusters of solutions. Within this scope, the main findings and practical implications for designers can be summarised as follows:
  • All schemes maintain air velocities below the discomfort threshold of 0.15 m/s within the occupied volume, with some schemes (I2, O2, O3, and O4) showing relatively small areas of potential local discomfort near the edges of the occupied zone;
  • Statistical analysis confirms that O1 performs significantly better than all other configurations in terms of both CO2 distribution and ventilation effectiveness. Most configurations exhibit average CO2 levels around or slightly above 1200 ppm, while scheme O1 maintains substantially lower concentrations (mean value of 1088 ppm) across the breathing zone. In parallel, O1 achieves the highest ventilation effectiveness, with LACE values between 1.20 and 1.27. In addition to overcoming potential acoustic discomfort, often associated with in-room units, O1 is the least invasive among the outside solutions, as it avoids the installation of ductwork in the classroom.
  • Among the in-room unit schemes, I3 and I5 show better performances, without significant differences between them in statistical terms (mean CO2 concentration of about 1220 ppm and the same median value of 1.08 for LACE). Nevertheless, I5 exhibits a slightly higher mean LACE (1.07 instead of 1.05) and lower dispersion, indicating more stable and predictable effectiveness. Moreover, in scheme I5, the unit can be integrated into an acoustically insulated suspended ceiling, improving noise control. Thus, when installation in the corridor is not feasible, I5 (and, secondarily, I3) should be selected.
  • The floor-standing scheme I4 displays the poorest performance, with the highest median CO2 concentration (1290 ppm) and LACE below unity (median value of 0.89). Non-parametric tests confirm that I4 is significantly less effective than the other tested schemes. However, I4 implies simpler installation and maintenance and may become a viable solution under stringent constraint contexts, e.g., interference with existing services or structural/seismic limitations.
The results should be interpreted as screening-level and comparative, rather than case-specific predictions, providing outputs suitable for ranking air distribution schemes in terms of relative ventilation effectiveness within the occupied zone. Indeed, as different distributions of occupants and furniture in classrooms affect the local airflow, an empty classroom was modelled for a generalisable comparison of the air distribution schemes, focusing on the diffuser’s arrangement.
Furthermore, simulations have not been experimentally validated. However, the robustness of the results has been verified through iterative convergence, grid-independence tests, statistical significance, and plausibility checks against ranges reported in prior studies.
Future work could conduct targeted experimental campaigns in test rooms to validate the numerical models and calibrate key assumptions. Furthermore, different occupancy and furniture configurations could be tested to assess the pathogen-specific exposure and infection-risk metrics, directly linking air distribution schemes to airborne transmission risk. Such developments would consolidate and broaden the applicability of the present outcomes, providing designers with an increasingly robust and operationally relevant basis for selecting air distribution schemes in school classroom refurbishment projects.

Author Contributions

Writing—original draft, R.C.; writing—review and editing, R.C. and S.F.; formal analysis, R.C.; methodology, R.C.; software, R.C.; validation, R.C. and S.F.; investigation, R.C.; data curation, R.C.; visualisation, R.C.; resources, R.C.; conceptualization, R.C. and S.F.; supervision, S.F. and G.P.; project administration, S.F. and G.P. All authors have read and agreed to the published version of the manuscript.

Funding

This research received no external funding.

Institutional Review Board Statement

Not applicable.

Informed Consent Statement

Not applicable.

Data Availability Statement

The original contributions presented in this study are included in the article. Further inquiries can be directed to the corresponding author.

Conflicts of Interest

The authors declare no conflicts of interest.

References

  1. United Nations (UN). Transforming Our World: The 2030 Agenda for Sustainable Development. 2025. Available online: https://sdgs.un.org/2030agenda (accessed on 21 October 2025).
  2. Wang, L.; Wang, Y.; Ye, D.; Liu, Q. Review of the 2019 novel coronavirus (SARS-CoV-2) based on current evidence. Int. J. Antimicrob. Agents 2020, 55, 105948. [Google Scholar] [CrossRef]
  3. Morawska, L.; Cao, J. Airborne transmission of SARS-CoV-2: The world should face the reality. Environ. Int. 2020, 139, 105730. [Google Scholar] [CrossRef] [PubMed]
  4. Ferrari, S.; Blázquez, T.; Cardelli, R.; Puglisi, G.; Suárez, R.; Mazzarella, L. Ventilation strategies to reduce airborne transmission of viruses in classrooms: A systematic review of scientific literature. Build. Environ. 2022, 222, 109366. [Google Scholar] [CrossRef] [PubMed]
  5. Li, Y.; Leung, G.M.; Tang, J.W.; Yang, X.; Chao, C.Y.H.; Lin, J.Z.; Lu, J.W.; Nielsen, P.V.; Niu, J.; Qian, H.; et al. Role of ventilation in airborne transmission of infectious agents in the built environment ? a multidisciplinary systematic review. Indoor Air 2007, 17, 2–18. [Google Scholar] [CrossRef] [PubMed]
  6. Bulfone, T.C.; Malekinejad, M.; Rutherford, G.W.; Razani, N. Outdoor Transmission of SARS-CoV-2 and Other Respiratory Viruses: A Systematic Review. J. Infect. Dis. 2021, 223, 550–561. [Google Scholar] [CrossRef]
  7. Shen, J.; Kong, M.; Dong, B.; Birnkrant, M.J.; Zhang, J. Airborne transmission of SARS-CoV-2 in indoor environments: A comprehensive review. Sci. Technol. Built Environ. 2021, 27, 1331–1367. [Google Scholar] [CrossRef]
  8. Chithra, V.S.; Shiva Nagendra, S.M. A Review of Scientific Evidence on Indoor Air of School Building: Pollutants, Sources, Health Effects And Management. Asian J. Atmos. Environ. 2018, 12, 87–108. [Google Scholar] [CrossRef]
  9. Wargocki, P.; Porras-Salazar, J.A.; Contreras-Espinoza, S.; Bahnfleth, W. The relationships between classroom air quality and children’s performance in school. Build. Environ. 2020, 173, 106749. [Google Scholar] [CrossRef]
  10. European Commission; Joint Research Centre; Institute for Health and Consumer Protection; European Commission; Directorate General for Health and Consumers; Regional Environmental Centre for Central and Eastern Europe. SINPHONIE: Schools Indoor Pollution & Health Observatory Network in Europe: Final Report; Publications Office of the European Union: Luxembourg, 2014; Available online: https://data.europa.eu/doi/10.2788/99220 (accessed on 24 October 2023).
  11. EN 16798-1:2019; Energy Performance of Buildings. Ventilation for Buildings Indoor Environmental Input Parameters for Design and Assessment of Energy Performance of Buildings Addressing Indoor Air Quality, Thermal Environment, Lighting and Acoustics. CEN: Brussels, Belgium, 2019. Available online: https://www.en-standard.eu/?gad_source=1&gad_campaignid=22489671069&gbraid=0AAAAAD6CNv-AdtfBPR4lLyIHySF7cGkGL&gclid=CjwKCAjwr8LHBhBKEiwAy47uUicJ3OaWuQgQLnqPtRp-SgYRcZez5l2opkq4BT6qi1kEWfVwnXqJnBoCIeIQAvD_BwE (accessed on 5 June 2025).
  12. Escandón, R.; Ferrari, S.; Cardelli, R.; Blázquez, T.; Suárez, R. How Do Natural Ventilation Strategies Affect Thermal Comfort in Educational Buildings? A Comparative Analysis in the Mediterranean Climate. Appl. Sci. 2025, 15, 6606. [Google Scholar] [CrossRef]
  13. Alonso, A.; Llanos, J.; Escandón, R.; Sendra, J.J. Effects of the COVID-19 Pandemic on Indoor Air Quality and Thermal Comfort of Primary Schools in Winter in a Mediterranean Climate. Sustainability 2021, 13, 2699. [Google Scholar] [CrossRef]
  14. Meiss, A.; Jimeno-Merino, H.; Poza-Casado, I.; Llorente-Álvarez, A.; Padilla-Marcos, M.Á. Indoor Air Quality in Naturally Ventilated Classrooms. Lessons Learned from a Case Study in a COVID-19 Scenario. Sustainability 2021, 13, 8446. [Google Scholar] [CrossRef]
  15. Stabile, L.; Dell’Isola, M.; Frattolillo, A.; Massimo, A.; Russi, A. Effect of natural ventilation and manual airing on indoor air quality in naturally ventilated Italian classrooms. Build. Environ. 2016, 98, 180–189. [Google Scholar] [CrossRef]
  16. Stabile, L.; Dell’Isola, M.; Russi, A.; Massimo, A.; Buonanno, G. The effect of natural ventilation strategy on indoor air quality in schools. Sci. Total Environ. 2017, 595, 894–902. [Google Scholar] [CrossRef]
  17. Stabile, L.; Pacitto, A.; Mikszewski, A.; Morawska, L.; Buonanno, G. Ventilation procedures to minimize the airborne transmission of viruses in classrooms. Build. Environ. 2021, 202, 108042. [Google Scholar] [CrossRef] [PubMed]
  18. Ferrari, S.; Blázquez, T.; Cardelli, R.; De Angelis, E.; Puglisi, G.; Escandón, R.; Suárez, R. Air change rates and infection risk in school environments: Monitoring naturally ventilated classrooms in a northern Italian urban context. Heliyon 2023, 9, e19120. [Google Scholar] [CrossRef]
  19. Ferrari, S.; Puglisi, G.; Cardelli, R. Heat Recovery Ventilation in School Classrooms Within Mediterranean Europe: A Climate-Sensitive Analysis of the Energy Impact Based on the Italian Building Stock. Energies 2025, 18, 5069. [Google Scholar] [CrossRef]
  20. Ministero della Transizione Ecologica. 2022. Available online: https://www.gazzettaufficiale.it/eli/id/2022/08/06/22A04307/sg (accessed on 10 May 2025).
  21. Qian, H.; Zheng, X. Ventilation control for airborne transmission of human exhaled bio-aerosols in buildings. J. Thorac. Dis. 2018, 10, S2295–S2304. [Google Scholar] [CrossRef]
  22. Son, S.; Jang, C.-M. Air Ventilation Performance of School Classrooms with Respect to the Installation Positions of Return Duct. Sustainability 2021, 13, 6188. [Google Scholar] [CrossRef]
  23. Cao, G.; Awbi, H.; Yao, R.; Fan, Y.; Sirén, K.; Kosonen, R.; Zhang, J. (Jensen) A review of the performance of different ventilation and airflow distribution systems in buildings. Build. Environ. 2014, 73, 171–186. [Google Scholar] [CrossRef]
  24. Mundt, E.; Mathisen, H.M. Ventilation Effectiveness. In REHVA GUIDEBOOK; No. GUIDEBOOK NO 2. Finland; 2004; Available online: https://www.rehva.eu/eshop/detail/no02-ventilation-effectiveness (accessed on 3 January 2024).
  25. Novoselac, A.; Srebric, J. Comparison of Air Exchange Efficiency and Contaminant Removal Effectiveness as IAQ Indices. Trans.-Am. Soc. Heat. Refrig. Air Cond. Eng. 2003, 109, 339–349. [Google Scholar]
  26. Clifford, C. Federspiel Air-Change Effectiveness: Theory and Calculation Methods. Indoor Air 1999, 9, 47–56. [Google Scholar]
  27. Li, X.; Li, D.; Yang, X.; Yang, J. Total air age: An extension of the air age concept. Build. Environ. 2003, 38, 1263–1269. [Google Scholar] [CrossRef]
  28. Liu, L.; Li, Y.; Nielsen, P.V.; Wei, J.; Jensen, R.L. Short-range airborne transmission of expiratory droplets between two people. Indoor Air 2017, 27, 452–462. [Google Scholar] [CrossRef]
  29. Sze To, G.N.; Wan, M.P.; Chao, C.Y.H.; Fang, L.; Melikov, A. Experimental Study of Dispersion and Deposition of Expiratory Aerosols in Aircraft Cabins and Impact on Infectious Disease Transmission. Aerosol Sci. Technol. 2009, 43, 466–485. [Google Scholar] [CrossRef]
  30. Ai, Z.T.; Melikov, A.K. Airborne spread of expiratory droplet nuclei between the occupants of indoor environments: A review. Indoor Air 2018, 28, 500–524. [Google Scholar] [CrossRef]
  31. Nielsen, P.V. Fifty years of CFD for room air distribution. Build. Environ. 2015, 91, 78–90. [Google Scholar] [CrossRef]
  32. Al-Rikabi, I.J.; Karam, J.; Alsaad, H.; Ghali, K.; Ghaddar, N.; Voelker, C. The impact of mechanical and natural ventilation modes on the spread of indoor airborne contaminants: A review. J. Build. Eng. 2024, 85, 108715. [Google Scholar] [CrossRef]
  33. Yang, B.; Melikov, A.K.; Kabanshi, A.; Zhang, C.; Bauman, F.S.; Cao, G.; Awbi, H.; Wigö, H.; Niu, J.; Cheong, K.W.D.; et al. A review of advanced air distribution methods—Theory, practice, limitations and solutions. Energy Build. 2019, 202, 109359. [Google Scholar] [CrossRef]
  34. Fan, M.; Fu, Z.; Wang, J.; Wang, Z.; Suo, H.; Kong, X.; Li, H. A review of different ventilation modes on thermal comfort, air quality and virus spread control. Build. Environ. 2022, 212, 108831. [Google Scholar] [CrossRef]
  35. Ding, E.; Zhang, D.; Bluyssen, P.M. Ventilation regimes of school classrooms against airborne transmission of infectious respiratory droplets: A review. Build. Environ. 2022, 207, 108484. [Google Scholar] [CrossRef]
  36. Kuivjõgi, H.; Sarevet, H.; Thalfeldt, M.; Kurnitski, J. Heat recovery ventilation solutions for school building renovation: Case study. In Proceedings of the CLIMA 2022 Conference, Rotterdam, The Netherlands, 15–18 May 2022. [Google Scholar] [CrossRef]
  37. Calama-González, C.M.; León-Rodríguez, Á.L.; Suárez, R. Indoor Air Quality Assessment: Comparison of Ventilation Scenarios for Retrofitting Classrooms in a Hot Climate. Energies 2019, 12, 4607. [Google Scholar] [CrossRef]
  38. Rosbach, J.T.; Vonk, M.; Duijm, F.; Van Ginkel, J.T.; Gehring, U.; Brunekreef, B. A ventilation intervention study in classrooms to improve indoor air quality: The FRESH study. Environ. Health 2013, 12, 110. [Google Scholar] [CrossRef]
  39. Stabile, L.; Buonanno, G.; Frattolillo, A.; Dell’Isola, M. The effect of the ventilation retrofit in a school on CO2, airborne particles, and energy consumptions. Build. Environ. 2019, 156, 1–11. [Google Scholar] [CrossRef]
  40. Summa, S.; Remia, G.; Di Perna, C.; Stazi, F. Mechanically ventilated classrooms in central Italy’s heritage school buildings: Proposal of archetypes and CO2 prediction models. Build. Environ. 2024, 265, 111963. [Google Scholar] [CrossRef]
  41. Cardelli, R.; Rotich, F.; Puglisi, G.; Ferrari, S. Air distribution criteria for existing school classrooms: A comparative CFD study on ventilation performances. In Digital Proceedings SDEWES Conferance, Rome, 2024; Faculty of Mechanical Engineering and Naval Architecture: Zagreb, Croatia, 2024. [Google Scholar]
  42. McLean, D. Integrated Environmental Solutions Virtual Environment (IESVE). Computer Software, Glasgow, Scotland, UK. 1994. Available online: https://www.iesve.com/ (accessed on 15 September 2025).
  43. Swanson, J.A. Ansys Fluent; Ansys, Inc.: Canonsburg, PA, USA; Available online: https://www.ansys.com/it-it/products/fluids (accessed on 5 August 2025).
  44. Simulation of Turbulent flow in Arbitrary Regions—Computational Continuum Mechanics (STAR-CCM+). CD-Adapco. Available online: https://plm.sw.siemens.com/it-IT/simcenter/fluids-thermal-simulation/star-ccm/ (accessed on 5 August 2025).
  45. Kurniawan, I.; Faridah; Utami, S.S. Characterizing of climate chamber thermal environment using the CFD simulation method using IES VE. In Proceedings of the International Energy Conference Astechnova 2019, Yogyakarta, Indonesia, 30–31 October 2019; p. 050010. [Google Scholar] [CrossRef]
  46. Bay, E.; Martinez-Molina, A.; Dupont, W.A. Assessment of natural ventilation strategies in historical buildings in a hot and humid climate using energy and CFD simulations. J. Build. Eng. 2022, 51, 104287. [Google Scholar] [CrossRef]
  47. Iskandar, L.; Bay-Sahin, E.; Martinez-Molina, A.; Toker Beeson, S. Evaluation of passive cooling through natural ventilation strategies in historic residential buildings using CFD simulations. Energy Build. 2024, 308, 114005. [Google Scholar] [CrossRef]
  48. Mathew, J.; Subbaiyan, G. Investigation of Ventilation Performance to Improve the Indoor Air Quality of Institutional Kitchens. J. Daylighting 2024, 11, 39–54. [Google Scholar] [CrossRef]
  49. Li, N. Comparison Between Three Different CFD Software and Numerical Simulation of an Ambulance Hall. Master’s Thesis, KTH Royal Institute of Technology, Stockholm, Sweden, 2015. [Google Scholar]
  50. Fondazione Giovanni Agnelli. Rapporto Sull’edilizia Scolastica (in English: Report on School Buildings); Laterza: Rome, Italy, 2020. [Google Scholar]
  51. Ministero dell’Interno. Decreto Ministeriale 26 Agosto 1992—Norme di Prevenzione Incendi per L’edilizia Scolastica; Ministero dell’Interno: Rome, Italy, 1992. [Google Scholar]
  52. 2021 ASHRAE Handbook. Fundamentals; Inch-Pound edition; ASHRAE: Peachtree Corners, GA, USA, 2021. [Google Scholar]
  53. d’Ambrosio Alfano, F.R.; Bellia, L. Indoor Environment and Energy Efficiency in Schools: Part 1 Principles; REHVA (Federation of European Heating, Ventilation and Air-Conditioning Associations): Brussels, Belgium, 2010. [Google Scholar]
  54. Ridley, K.; Ainsworth, B.E.; Olds, T.S. Development of a Compendium of Energy Expenditures for Youth. Int. J. Behav. Nutr. Phys. Act. 2008, 5, 45. [Google Scholar] [CrossRef]
  55. Shephard, R.J. 2011 Compendium of Physical Activities: A Second Update of Codes and MET Values. Yearb. Sports Med. 2012, 2012, 126–127. [Google Scholar] [CrossRef]
  56. Muller, D.; Kandzia, C. Mixing Ventilation: Guide on Mixing Air Distribution Design; Volume GUIDEBOOK NO 19; REHVA (Federation of European Heating, Ventilation and Air-Conditioning Associations): Brussels, Belgium, 2013. [Google Scholar]
  57. European Parliament. Commission Regulation (Eu) No 1253/2014 of 7 July 2014 Implementing Directive 2009/125/EC of the European Parliament and of the Council with Regard to Ecodesign Requirements for Ventilation Units; European Parliament: Strasbourg, France, 2014. [Google Scholar]
  58. Su, W.; Yang, B.; Melikov, A.; Liang, C.; Lu, Y.; Wang, F.; Li, A.; Lin, Z.; Li, X.; Cao, G.; et al. Infection probability under different air distribution patterns. Build. Environ. 2022, 207, 108555. [Google Scholar] [CrossRef]
  59. Lin, Z.; Tian, L.; Yao, T.; Wang, Q.; Chow, T.T. Experimental and numerical study of room airflow under stratum ventilation. Build. Environ. 2011, 46, 235–244. [Google Scholar] [CrossRef]
  60. Zhao, B.; Li, X.; Ren, H.; Guan, P. Air Supply Opening Model of Ceiling Diffusers for Numerical Simulation of Indoor Air Distribution under Actual Connected Conditions, Part I: Model Development. Numer. Heat Transf. Part A Appl. 2006, 50, 45–61. [Google Scholar] [CrossRef]
  61. Nielsen, P.V.; Allard, F. Computational Fluid Dynamics in Ventilation Design; Volume Guidebook No 10; REHVA (Federation of European Heating, Ventilation and Air-Conditioning Associations): Brussels, Belgium, 2007. [Google Scholar]
  62. Van Rossum, G. Pyhton. Python Software Foundation. [Multy Platform]. 9 April 2024. Available online: https://www.python.org/ (accessed on 2 February 2023).
  63. Nguyen, T.-K.; Ahmad, Z.; Nguyen, D.-T.; Kim, J.-M. A remaining useful lifetime prediction model for concrete structures using Mann-Whitney U test state indicator and deep learning. Mech. Syst. Signal Process. 2025, 222, 111795. [Google Scholar] [CrossRef]
  64. Jamil, M.A.; Khanam, S. Influence of One-Way ANOVA and Kruskal–Wallis Based Feature Ranking on the Performance of ML Classifiers for Bearing Fault Diagnosis. J. Vib. Eng. Technol. 2024, 12, 3101–3132. [Google Scholar] [CrossRef]
  65. Aguirre, J.D.; Sánchez, E.J.; Amaris, C.; Jaramillo-Ibarra, J.E.; González-Estrada, O.A. Evaluation of Airflow Distribution, Temperature, and Mean Age of Air Control in an Elevator Cabin. Eng 2025, 6, 45. [Google Scholar] [CrossRef]
  66. Pellegatti, M.; Torresin, S.; Visentin, C.; Babich, F.; Prodi, N. Indoor soundscape, speech perception, and cognition in classrooms: A systematic review on the effects of ventilation-related sounds on students. Build. Environ. 2023, 236, 110194. [Google Scholar] [CrossRef]
  67. Serpilli, F.; Di Loreto, S.; Lori, V.; Di Perna, C. The impact of mechanical ventilation systems on acoustic quality in school environments. E3S Web Conf. 2022, 343, 05002. [Google Scholar] [CrossRef]
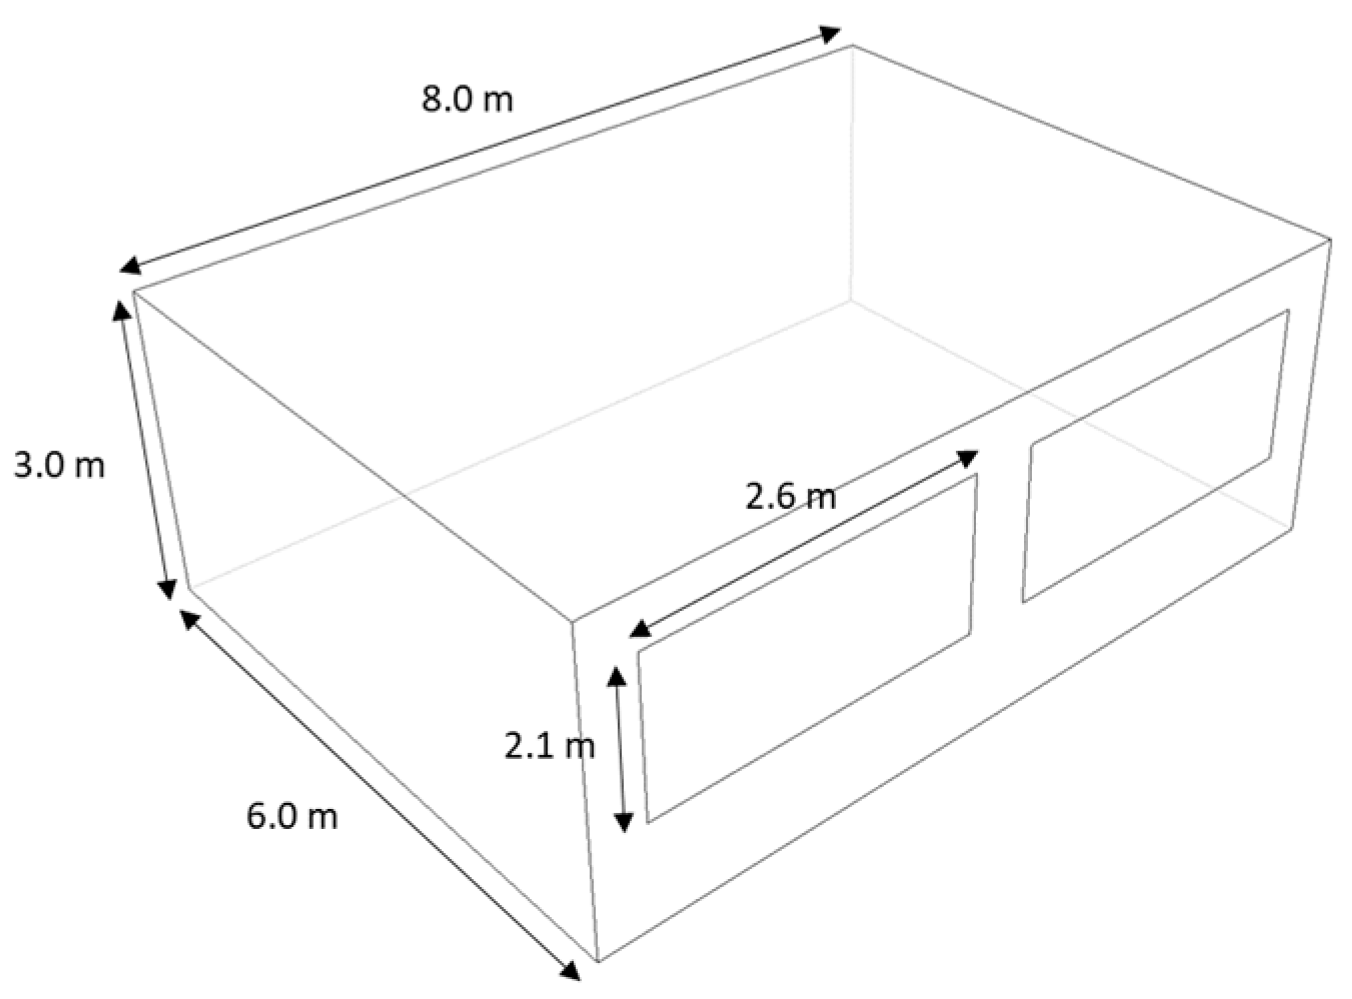
Figure 1. Classroom configuration.
Applsci 15 12350 g001
Figure 2. Illustrative scheme of the Python algorithm to assess the variable distribution within the reference horizontal plane. The coloured dashed lines highlight the sections of the code where the legend data (green line) and the image of the horizontal reference plane (blue line) are inserted.
Applsci 15 12350 g002
Figure 3. Colour-filled contour plots of the LMA of air in a horizontal plane related to ref. [65] used to assess the accuracy of the developed Python algorithm.
Applsci 15 12350 g003
Figure 4. Points grid in the reference horizontal plane of the breathing zone used for the mesh independence study. Arrows represent the distances between the points in the two directions of the plane, while numbers refers to the code of the points.
Applsci 15 12350 g004
Figure 5. Grid analysis: (a) air velocity distribution profile along the centred vertical line, (b) air temperature distribution profile along the centred vertical line, (c) air velocity among the 9 points in the reference horizontal plane of the breathing zone, and (d) air temperature among the 9 points in the reference horizontal plane of the breathing zone.
Applsci 15 12350 g005aApplsci 15 12350 g005b
Figure 6. Plot of the velocity contour in the reference horizontal plane across the air distribution schemes. (I1) Inside unit ceiling standing—back; (I2) Inside unit ceiling standing—front; (I3) Inside unit ceiling standing—centre; (I4) Inside unit floor standing; (I5) Inside unit ceiling standing—inlet canalised; (O1) Outside unit long side air distribution—single inlet/outlet; (O2) Outside unit long side air distribution—multi inlet/outlet; (O3) Outside unit short side air distribution—multi inlet/outlet, opposite sides; (O4) Outside unit short side air distribution—multi inlet/outlet, same sides.
Applsci 15 12350 g006
Figure 7. Plot of CO2 contour in the reference horizontal plane across the air distribution schemes. (I1) Inside unit ceiling standing—back; (I2) Inside unit ceiling standing—front; (I3) Inside unit ceiling standing—centre; (I4) Inside unit floor standing; (I5) Inside unit ceiling standing—inlet canalised; (O1) Outside unit long side air distribution—single inlet/outlet; (O2) Outside unit long side air distribution—multi inlet/outlet; (O3) Outside unit short side air distribution—multi inlet/outlet, opposite sides; (O4) Outside unit short side air distribution—multi inlet/outlet, same sides.
Applsci 15 12350 g007
Figure 8. Box plot of CO2 of the air distribution schemes. For each scheme the figure reports the IQR (box), mean value (cross), whiskers (vertical lines), and outliers (points). The mean values are connected by a solid line.
Applsci 15 12350 g008
Figure 9. Results of the Mann–Whitney test for CO2 distributions: heatmap of p-value.
Applsci 15 12350 g009
Figure 10. LACE distribution in the reference horizontal plane and percentage occurrence of each value related to inside unit configurations. (I1) Inside unit ceiling standing—back; (I2) Inside unit ceiling standing—front; (I3) Inside unit ceiling standing—centre; (I4) Inside unit floor standing; (I5) Inside unit ceiling standing—inlet canalised.
Applsci 15 12350 g010
Figure 11. LACE distribution in the reference horizontal plane and percentage occurrence of each value related to outside unit configurations. (O1) Outside unit long side air distribution—single inlet/outlet; (O2) Outside unit long side air distribution—multi inlet/outlet; (O3) Outside unit short side air distribution—multi inlet/outlet, opposite sides; (O4) Outside unit short side air distribution—multi inlet/outlet, same sides.
Applsci 15 12350 g011
Figure 12. Box plot of LACE of the air distribution schemes. For each scheme the figure reports the IQR (box), mean value (cross), and whiskers (vertical lines). The mean values are connected by a solid line.
Applsci 15 12350 g012
Figure 13. Results of the Mann–Whitney test for LACE distributions: heatmap of p-value.
Applsci 15 12350 g013
Table 1. Air distribution schemes tested in the classroom configuration. Blue and red arrows are related to outlet and inlet vents, respectively.
Applsci 15 12350 i001Applsci 15 12350 i002Applsci 15 12350 i003
Inside unit ceiling standing—back (I1)Inside unit ceiling standing—front (I2)Inside unit ceiling standing—centre (I3)
Applsci 15 12350 i004Applsci 15 12350 i005Applsci 15 12350 i006
Inside unit floor standing (I4)Inside unit ceiling standing—inlet canalised (I5)Outside unit long side air distribution—single inlet/outlet (O1)
Applsci 15 12350 i007Applsci 15 12350 i008Applsci 15 12350 i009
Outside unit long side air distribution—multi inlet/outlet (O2)Outside unit short side air distribution—multi inlet/outlet, opposite sides (O3)Outside unit short side air distribution—multi inlet/outlet, same sides (O4)
Table 2. Characteristics of source volumes.
Reference SourceCO2 Emission (kg/h)Heat Emission (W)Dimension (m)
Students0.7520005.0 × 4.8 × 1.0
Teacher0.05901.8 × 4.8 × 1.0
Table 3. Air supply characteristics.
Ventilation Rate
(m3/h)
Air Speed
(m/s)
Air Temperature
(°C)
CO2 Concentration
(PPM)
Single inlet/outlet648.02.018.6400
Multi Inlet/outlet
Table 4. Statistical parameters of the CO2 distribution across the air distribution schemes.
Air Distribution SchemeMeanMedianSt. devIQRMaxMinSkewnessKurtosisShapiro–Wilk p
I11237.31235.029.80.01290.01130.0−0.63.19.1 × 10−14
I21239.51235.030.70.01290.01130.0−0.62.72.3 × 10−13
I31222.31235.033.855.01290.01130.0−0.30.25.5 × 10−11
I41273.31290.030.813.81290.01180.0−1.72.11.3 × 10−15
I51221.41235.029.355.01290.01130.0−0.81.01.9 × 10−13
O11088.11130.078.7167.01180.0963.0−0.9−1.07.3 × 10−14
O21231.11235.030.10.01290.01130.0−0.41.41.3 × 10−12
O31256.11290.041.455.01290.01180.0−0.8−0.84.3 × 10−12
O41243.31235.033.755.01290.01180.0−0.1−0.43.3 × 10−11
Table 5. Statistical parameters of the LACE distribution across the air distribution schemes.
Air Distribution SchemeMeanMedianSt. devIQRMaxMinSkewnessKurtosisShapiro–Wilk p
I11.021.080.110.191.270.89−0.15−1.475.1 × 10−11
I21.031.080.100.191.200.89−0.56−1.311.7 × 10−12
I31.051.080.100.201.270.89−0.74−0.774.2 × 10−11
I40.980.890.100.191.140.890.29−1.842.8 × 10−13
I51.071.080.090.061.200.89−1.170.032.4 × 10−12
O11.231.270.040.071.271.14−0.61−0.834.7 × 10−12
O21.081.080.100.061.200.89−1.601.741.6 × 10−12
O30.991.080.080.191.140.890.06−1.885.1 × 10−14
O41.071.080.080.061.140.89−1.561.612.1 × 10−13
Disclaimer/Publisher’s Note: The statements, opinions and data contained in all publications are solely those of the individual author(s) and contributor(s) and not of MDPI and/or the editor(s). MDPI and/or the editor(s) disclaim responsibility for any injury to people or property resulting from any ideas, methods, instructions or products referred to in the content.