Article

Numerical Simulation of Clay Layer Permeability Failure Under Loose Strata: Effects of Mining-Induced Fracture Width

1
School of Resources and Geosciences, China University of Mining and Technology, Xuzhou 221116, China
2
Geological Exploration Research Institute of Guizhou Coalfield Geological Bureau, Guiyang 550081, China
3
School of Urban Geology and Engineering, Hebei GEO University, Shijiazhuang 050031, China
*
Author to whom correspondence should be addressed.
Appl. Sci. 2025, 15(22), 12318; https://doi.org/10.3390/app152212318
Submission received: 6 October 2025 / Revised: 14 November 2025 / Accepted: 17 November 2025 / Published: 20 November 2025
(This article belongs to the Special Issue Hydrogeology and Regional Groundwater Flow)

Abstract

Based on the problem of water and sand inrush caused by the infiltration and failure of the clay layer at the bottom of the loose layer in shallow coal seam mining in eastern China, this study adopts the Particle Flow Code numerical simulation method to conduct multi-physics field coupling analysis. Based on the geological conditions of Taiping Coal Mine in Shandong Province, a two-dimensional water sand clay coupling model was constructed to systematically simulate the entire process of permeability failure of clay layers under different mining crack widths (5–20 mm). The permeability failure mechanism was revealed through porosity distribution, particle contact number, and contact force evolution laws. The numerical simulation results show that with the increase in crack width, the speed of contact reduction is faster, the speed of water and inrush is faster, and the time is shorter. The process of infiltration failure can be divided into two stages: the first stage is the clay infiltration deformation stage, and the second stage is the water inrush and sand collapse stage. In addition, the larger the width of the crack, the greater the contact force, and the shorter the time of infiltration failure and water and sand bursting experienced. The quantitative relationship between the width of mining induced cracks and permeability failure was revealed, and a critical discrimination index for permeability failure in clay layers was established, providing theoretical support for optimizing safe mining parameters and preventing water and sand inrush disasters in porous aquifers.

1. Introduction

The stability of clay layers acting as aquitards is a critical concern in geotechnical engineering and mining safety worldwide [1]. These layers serve as vital natural barriers against water and sediment inrush in various subsurface operations, including mining, tunneling, and infrastructure development beneath aquifers [2]. However, the permeability failure of these clay barriers, often triggered by anthropogenic activities like mining that induce fractures, poses a universal threat. Such failures can lead to catastrophic accidents, resulting in significant economic losses and casualties, as evidenced by incidents in mining regions across different countries [3]. Despite its global relevance, predicting the failure mechanism remains challenging due to the complex interplay between mining-induced fracture networks and the hydro-mechanical properties of clay. This challenge is particularly acute in China.
Coal is an important industrial resource in China, serving as a primary energy source supporting the development of the national economy [4,5]. China is the world’s largest producer and consumer of coal, and its energy endowment of rich coal, poor oil, and limited gas determines that coal plays an important role in China’s primary energy consumption. Its position as the main energy source in China will not change in the short term [6,7,8]. However, from 2014 to 2023, a total of 64 coal mine water accidents occurred nationwide, resulting in 270 deaths, as shown in Figure 1 [9,10]. A mine water inrush disaster is a catastrophic event where a large volume of groundwater from an aquifer or surface water source suddenly floods into underground mine workings through geological fractures or mining-induced pathways. This rapid and uncontrolled influx of water can quickly submerge mining tunnels and equipment, posing an extreme life-threatening risk to miners and causing severe economic losses through mine closure and damage. These disasters are often triggered by mining activities that unintentionally penetrate water-bearing structures, connect to old flooded mine workings, or weaken the protective rock barrier between the mine and a major water source. Overall, water inrush accidents account for a small proportion of coal mine accidents, but a large proportion of casualties. Therefore, water accidents remain an important factor threatening coal mine safety production [11,12,13,14].
In recent years, shallow coal resources in the eastern region of China have gradually decreased and are on the verge of depletion, leading to a trend of polarization between deep and shallow coal mining. To extend the production life of existing mines, it has become essential for many mining operations to efficiently exploit shallow coal resources, especially those located under buildings, water bodies, and railways in areas with thin bedrock [15,16,17]. More than 90% of China’s coal mines are covered by porous aquifers from the Quaternary and Neogene periods. The geological structure of bedrock loose layer is formed on the roof of the coal mine working face. During the coal mining process, mining activities near the loose layer are prone to triggering water inrush and sand bursting disasters [18,19]. Some coal seams in the eastern region of China are shallowly buried, thicker, and have thin roof bedrock, making them suitable for multi seam, large-scale, and wide face mining [20]. With the increase in mining intensity, the economic benefits of coal mines have also significantly improved. However, during the mining of shallow coal seams, the presence of porous aquifers in the Quaternary system makes disasters such as water inrush, sand bursting, and roof collapse highly prone to occur. These incidents can immediately disrupt normal operations at the working face and lead to the scrapping of machinery. Ultimately, they may result in serious accidents with substantial casualties and significant economic losses [21,22,23]. For example, in August 2021, due to incomplete drainage of water at the top of the working face, the Chaidar coal mine in Haibei Autonomous Prefecture, Qinghai Province, experienced abnormal water seepage and roof pumping, resulting in sudden water, sand and mud bursting accidents, causing 20 deaths and direct economic losses of over 50 million yuan [24]. In July 2021, a water inrush and sand bursting accident occurred at the 30108 fully mechanized mining face of Haojialiang Coal Mine in Shaanxi Province, affecting the roadway and working face. The water inrush and sand bursting sources of the accident were pore flow in the alluvial layer, pore fissure groundwater in the loess layer, weathered bedrock fissure water in the coal seam roof, and surface water in the tributaries of the Shibadun River valley. The accident caused a water inrush and sand collapse channel in the 30108 working face due to mining induced fractures (pumping channels), which collapsed into the working area and resulted in 5 deaths and the scrapping of the working face. The direct economic loss was over 10 million yuan [25]. Currently, due to the gradual depletion of coal resources in the eastern region, most mines have started to extract shallow coal seams, which are gradually affected by the loose aquifer of the Quaternary or Neogene overlying the coal seams [26,27,28]. The probability of coal seam roof water inrush and sand collapse accidents also increases accordingly. Therefore, when mining coal under loose water layers, ensuring safe and efficient coal mining and reducing the occurrence of water inrush and sand collapse accidents are currently key issues facing the study of overburden and water sand transport laws [5].
In the eastern region of China, there is usually a layer of clay distributed at the bottom of the Quaternary loose layer. This layer of clay, due to its strong plasticity, weak permeability, and strong binding with water, serves as a stable impermeable layer in coal mining and a good protective layer in mine mining. It can effectively isolate the direct contact between the upper loose layer and the lower rock layer, prevent the water conducting fracture zone from directly connecting to the loose layer aquifer after the overlying rock is damaged in coal mining, and prevent water inrush and sand collapse accidents [29,30,31]. However, due to the high susceptibility of the clay layer to damage caused by crustal movement and fault structures, it loses its ability to retain water in the layer above, resulting in water and sand from the upper loose aquifer flowing into the mine through cracks or faults, causing water inrush and sand collapse accidents. In addition, when the water head of the loose aquifer is large enough, the clay layer will gradually lose its impermeable performance under the action of water pressure, resulting in infiltration damage. The sand in the upper loose aquifer will also enter the mine through the water channel under the action of water pressure, causing water inrush and sand collapse accidents [32,33,34]. Therefore, conducting research on the infiltration and failure effects of clay layers and loose layers is of great significance for safe coal mining. However, currently, due to the randomness and complexity of the infiltration failure mechanism, research on the infiltration failure of porous aquifers on clay layers only stays at the description of phenomena, and there is relatively little analysis and research on the infiltration failure mechanism. Nevertheless, a large number of scholars have begun to conduct extensive research on the formation mechanism of infiltration failure, but the exploration of infiltration failure mechanism is still in the exploratory stage. In recent years, scholars have conducted preliminary analysis on the critical conditions for seepage failure of cohesive and non-cohesive soils, and have achieved certain results. However, there is still no recognized opinion on the critical conditions for the failure of clay aquitards by the upper loose aquifer, and further research is needed [35,36].
Therefore, based on existing theoretical foundations, this article takes Taiping Coal Mine in Shandong Province as the research background to further study the critical conditions for the infiltration and failure of the upper loose aquifer on the clay layer, providing guidance for safe mining of coal mines, a theoretical basis for the infiltration and failure of clay, and ultimately the scientific theory and technical basis for the prevention of coal seam water inrush and sand collapse disasters.

2. Methodology

2.1. Study Area

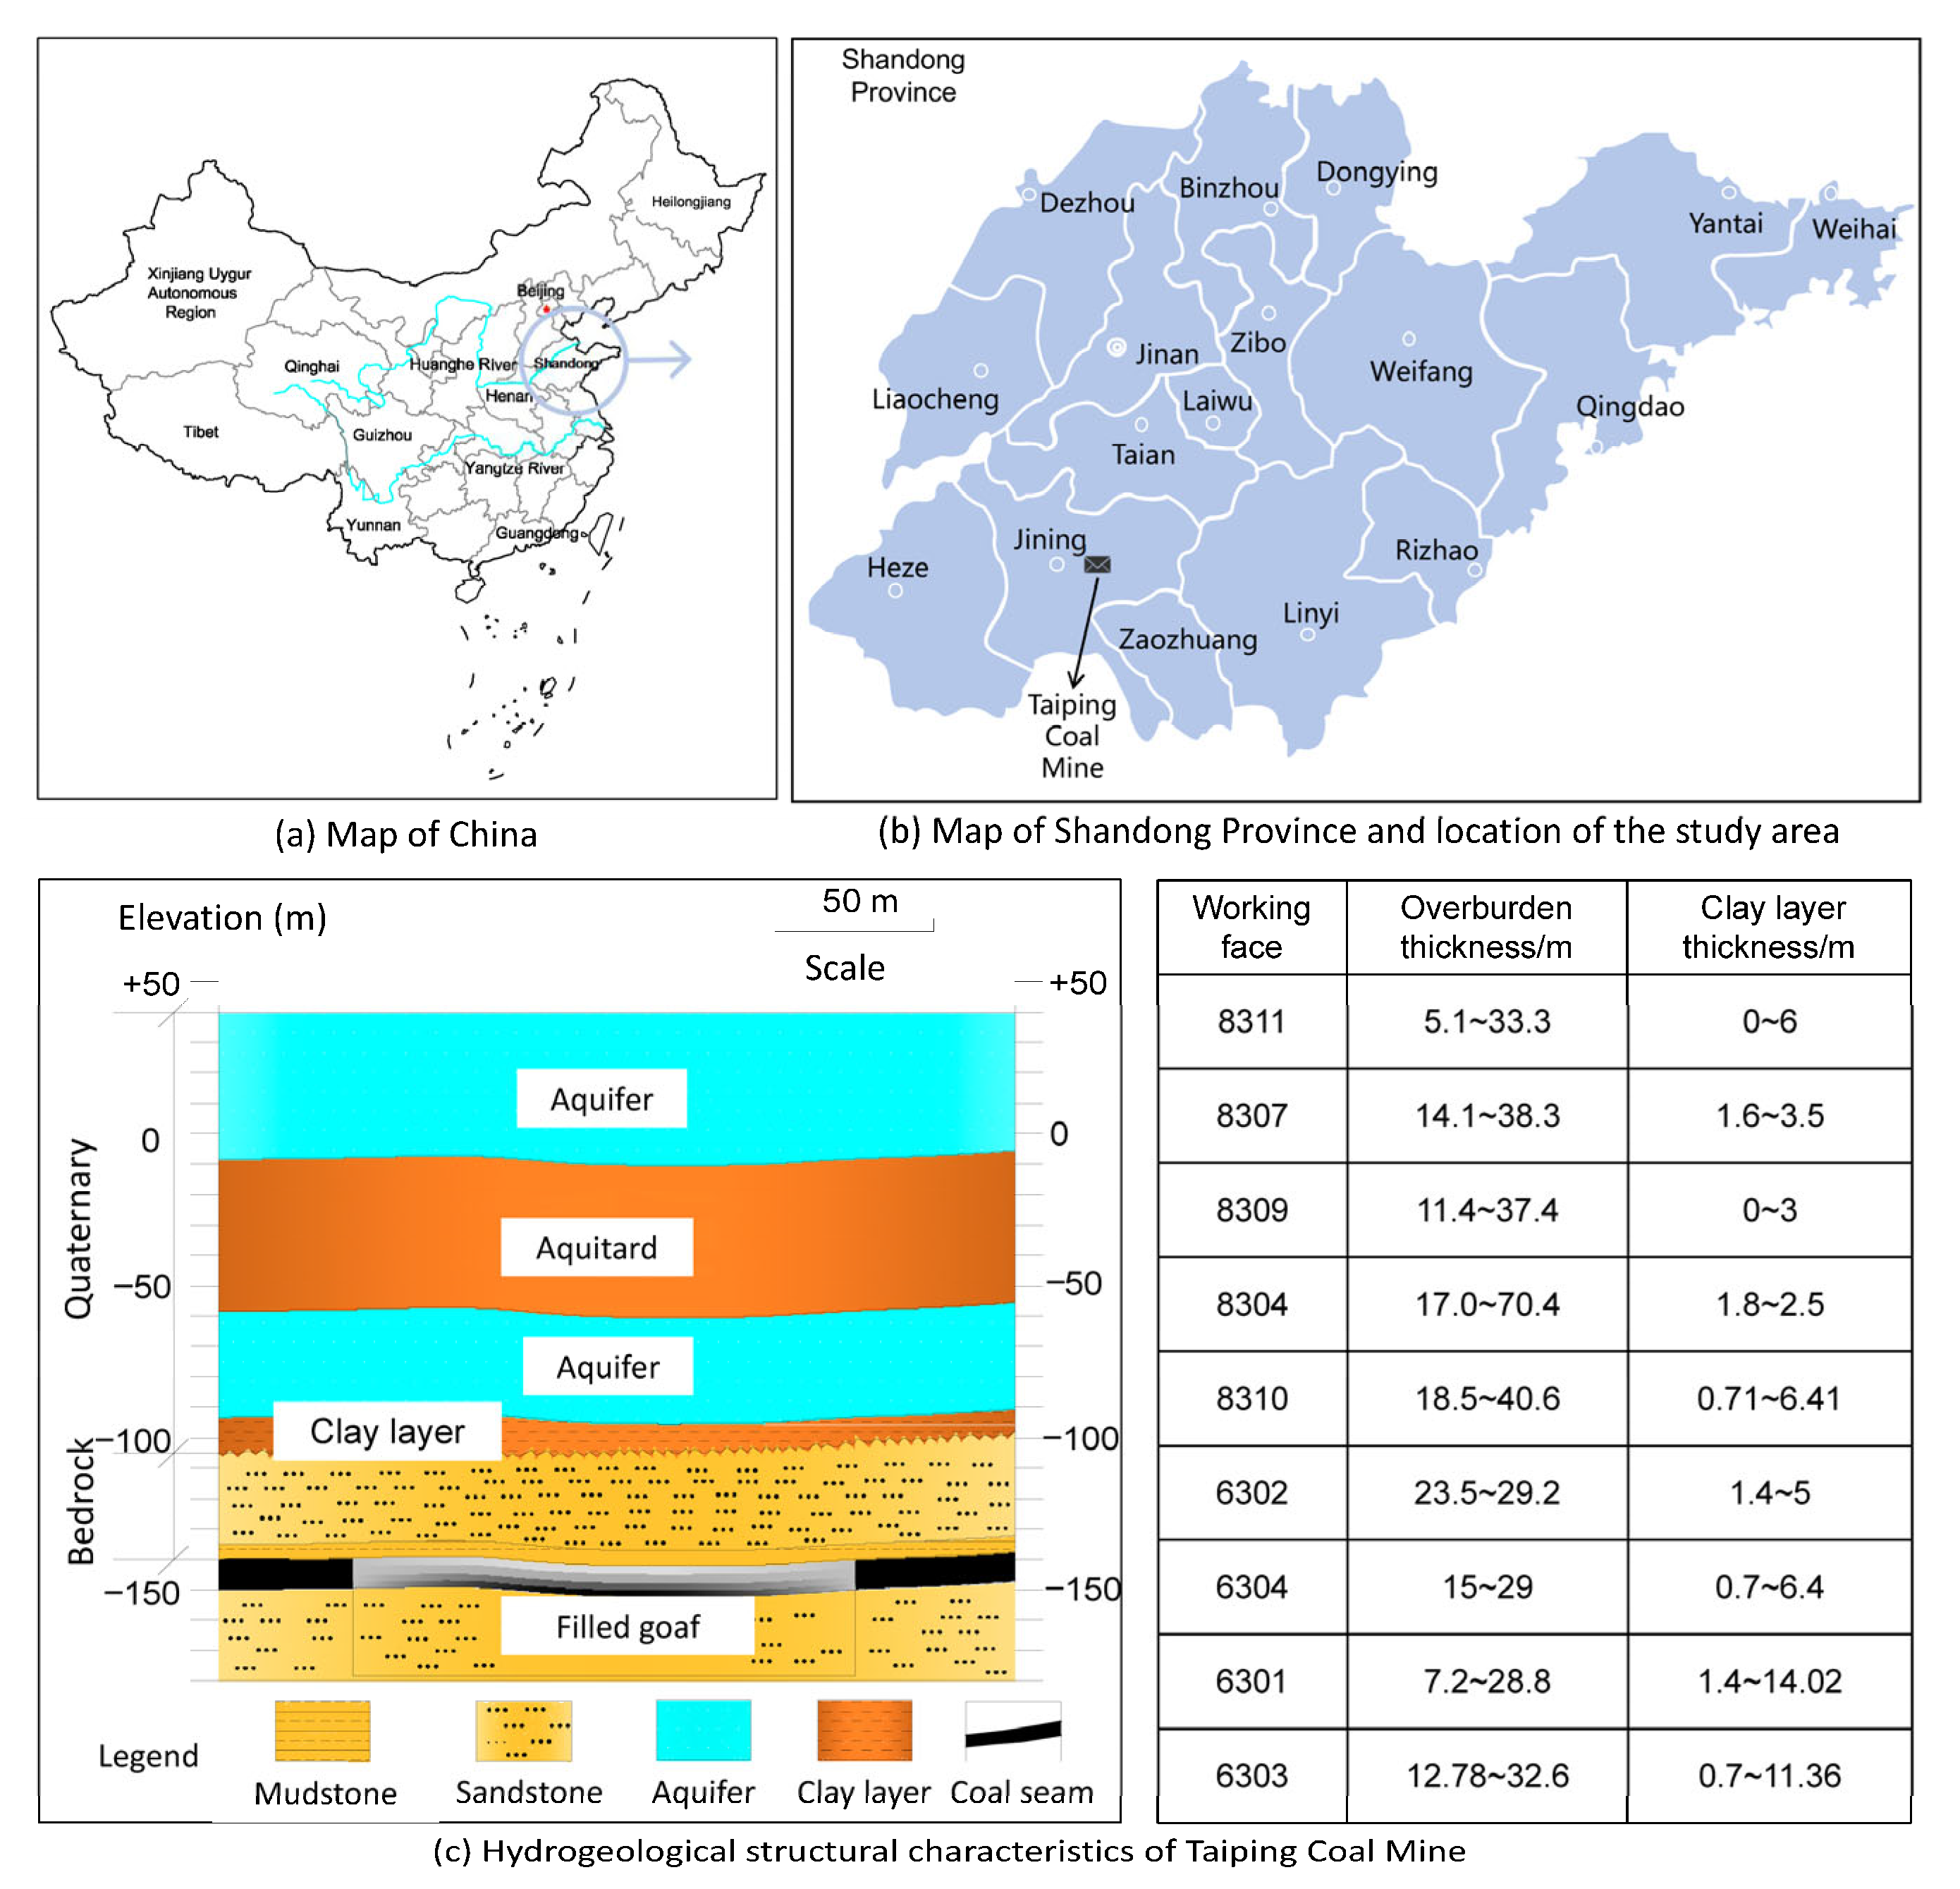
This numerical simulation takes the Banan Mining Area of Taiping Coal Mine in Jining City, Shandong Province, China, as the research object. The engineering and hydrogeological structures have been generalized, as shown in Figure 2. The main mining seam of Taiping Coal Mine is the 3rd coal seam. After the working face is excavated, the overlying strata are disturbed, leading to the development of a caved zone and a water-conducting fracture zone. When the water-conducting fracture zone extends into the bottom of the loose layer, under the combined action of water and sand, the sand from the loose layer is carried by water through the fractures into the working face, resulting in a water and sand inrush disaster.
The main coal seam is the Permian Shanxi Formation 3 coal seam, which is the main coal seam of the mine. It has a simple and stable structure and belongs to semi bright coal, with bright coal as the main and dark coal as the secondary. The thickness is 8.5~9.2 m, with an average coal thickness of 8.8 m. The structure is simple, and the hardness coefficient f is 1.5. According to the analysis of laboratory results, coal seam 3 belongs to gas coal, with a combustible volatile matter content of 37~38% and a maximum thickness of 8~10 mm for the gelatinous layer. This article mainly studies the bottom aquifer and clay aquitard of loose layers. Therefore, this numerical simulation is based on the geological, engineering geological, and hydrogeological conditions of the Banan mining area of Taiping Coal Mine in Jining City, Shandong Province, China. The schematic diagram of the drilling structure of the bottom loose aquifer and bottom clay layer is shown in Figure 2c. The thickness and lithology of the loose aquifer and clay aquitard at the bottom of each borehole are shown in Figure 2c. The Taiping Coal Mine has an average unconsolidated layer thickness of 150 m in the Quaternary, which is in unconformable contact with the underlying thin bedrock. The aquifer sand layers and clay layers are distributed alternately, forming a spatial distribution pattern of “three aquifers and three aquicludes”. Among these, the bottom aquifer exhibits moderate to weak water richness, making it a potential hazard source for water and sand inrush during coal seam mining. The numerical model specifically focuses on the challenge of water and sand inrush caused by the seepage failure of the clay layer at the bottom of the loose layer during shallow coal seam mining.

2.2. Characteristics of the Method

The core functionality of Particle Flow Code (PFC) resides in its precise computational capacity to simulate the dynamic interactions and motion characteristics of a large number of spherical particles. The interparticle contacts act as transmissive media for internal forces and bending moments, facilitating mechanical interactions between adjacent particles through contact bonding and force chains. The interactions between particles are governed by contact mechanics principles, specifically manifested in the interaction laws regulating internal forces and bending moments between adjacent particles, while strictly complying with Newton’s laws of motion.
In essence, PFC functions as an advanced numerical simulation tool that enables accurate modeling of granular system kinematics through the precisely calibrated physical properties of individual particles and micromechanical parameters governing interparticle interactions. The theoretical foundation of PFC rests upon Newton’s second law of motion, which quantitatively establishes that alterations in particles’ motion states are intrinsically linked to the applied external forces and their inherent mass. Through this computational methodology, PFC facilitates the elucidation of interparticle interaction mechanisms, thereby revealing the complex mechanical behaviors exhibited by granular systems at the macroscopic scale.

2.3. Basic Assumptions of the Model

The model typically consists of multiple independently moving circular spherical particles, while the interparticle contact properties and boundary walls defining the system’s periphery constitute key elements that characterize the model structure.
(1)
Assumptions about particles
When modeling granular materials as rigid entities, the mechanical behavior of the entire system is entirely governed by both the motion states of individual particles and the contact forces at particle interfaces. These interparticle kinematic relationships and interaction forces are fundamentally governed by the principles of Newton’s second law of motion. The force system within granular models can exist in two distinct states: static equilibrium where particles exhibit no relative motion, and dynamic processes involving continuous interparticle interactions. When simulating physical particle contacts, engineers should implement contact formulations with reduced normal stiffness parameters, permitting adjacent particles to exhibit minor overlap near contact points while maintaining stable system behavior. This approach effectively achieves flexible contact mechanisms through controlled interpenetration. For more complex mechanical behaviors, interparticle bonded contacts can be implemented to simulate such phenomena. When the applied forces exceed the bond strength, these contacts fracture, enabling the simulation of tensile stresses that may develop between particles.
In the computational framework of discrete element simulations, the following fundamental assumptions are established for discrete particle handling:
① The particle rigidity assumption implies that individual particles maintain their geometric integrity and do not undergo deformations when subjected to external forces;
② In two-dimensional modeling frameworks, fundamental particles are represented as circular disks with finite thickness while maintaining two-dimensionality constraints;
③ Particle contacts are confined to extremely small regions where interactions occur.
These fundamental assumptions constitute the underlying framework for PFC-based numerical modeling of particle motion and interactions, thereby enabling accurate elucidation of the mechanical behaviors exhibited by granular systems.
(2)
Assumptions for walls
In PFC numerical simulations, the wall model serves as a crucial component for constraining and restricting the boundaries of particle assemblies. The assumptions regarding wall models are primarily grounded in the fundamental principles of the Discrete Element Method (DEM) and the computational characteristics of numerical simulation software.
① Rigid body assumptions: In PFC simulations, walls are modeled as rigid bodies since they remain undeformed and intact during numerical computations;
② Infinite mass assumption: In PFC simulations, walls are typically modeled as rigid bodies with infinite mass and remain stationary, being immune to the forces exerted by particles;
③ Contact interactions: The contact interactions between rigid walls and particles are governed by specific contact constitutive models;
④ Zero-thickness assumptions: In PFC simulations, walls are treated as zero-thickness boundaries since their physical thickness is not accounted for in computational models.
In summary, the modeling assumptions for walls in PFC simulations are based on four fundamental principles: rigid body assumption, infinite mass assumption, specific contact constitutive models, and zero-thickness boundary conditions. These theoretical premises enable accurate modeling of boundary conditions for particle assemblies, thereby achieving precise simulation and analysis of granular flow dynamics and interparticle interaction mechanisms.
(3)
Assumptions on the contact model
To enhance the efficiency of managing contact model assignments, PFC has introduced a new feature called the “Contact Model Assignment Table.” By leveraging the contact distance detection functionality inherent in contact activation routines, precise control over relevant contact property values can be achieved. The methodology for regulating contact types through the Contact Model Assignment Table is systematically outlined below:
① Each memory cell stores a specific contact model along with its associated contact properties and methods.
② When a newly generated contact is identified, it undergoes matching with a designated memory cell within the Contact Model Assignment Table. Subsequent data allocation for the corresponding contact model—including its associated properties and methodologies—is executed based on the archived parameters within the matched memory cell.
③ When accessing memory cells, non-default units are inspected in a predetermined sequence. When a contact condition matches the stored parameters within a specific memory cell, the system assigns the corresponding contact model parameters from that cell to the active contact instance.
④ When a contact condition fails to match parameters in all non-default memory cells, the system automatically assigns the contact type archived in the designated default memory cell.
The interparticle contact characteristics are modeled using a linear parallel bond model, which binds adjacent basic particle units through cementation to form an integrated structural framework, thereby simulating the mechanical behavior of natural soil particles. The interparticle contacts exhibit non-cohesive properties, while this study employs a linear contact model to characterize such interactions. This modeling approach enables accurate representation of both interparticle interactions and mechanical behavior of granular materials.
(4)
Contact constitutive model
In PFC, contact properties are centrally configured via the Contact Model Assignment Table. The software natively incorporates three fundamental contact constitutive models: namely, the contact rigid model, sliding model, and bonded model. These three constitutive models enable the simulation of distinct mechanical behaviors characterizing interparticle interactions in granular systems. When analyzing the research subject, two fundamental contact archetypes are identified: sphere-sphere contacts and sphere-boundary interactions.

2.4. Multi-Physics Coupling

In PFC, the incorporation of a Computational Fluid Dynamics module can significantly enhance the ability to simulate interactions between particle flow and fluid systems. The Computational Fluid Dynamics module enables the simulation of fluid flow behavior within particle assemblies, as well as interactions between fluid and particles.
The Computational Fluid Dynamics module employs numerical methods to solve fluid dynamics equations, thereby simulating the motion characteristics of fluid systems. In PFC, this computational methodology can be integrated with Discrete Element Method simulations to establish a multi-physics coupling framework. Through this model, the dynamic behavior of particle aggregates under fluid action can be simulated, as well as the impact of fluid on particle distribution and motion.
Furthermore, the Computational Fluid Dynamics module enables analysis of interfacial forces between fluid and particles. By calculating critical parameters such as drag force and lift force, this module facilitates more accurate predictions of particle motion trajectories and spatial distribution patterns within fluid systems. This methodology provides critical insights into the transport, deposition, and mixing mechanisms of particulate systems within fluidic environments.
In PFC, fluid flow is calculated by solving the conservation of mass and momentum equations for a fluid continuum within the porous medium formed by the particle assembly. The model domain is discretized into fluid cells. The key equations are as follows: (1) Mass Conservation: ∂()/∂t + ∇(ρq) = 0, which for incompressible flow simplifies to ∂n/∂t + ∇q = 0; (2) Momentum Conservation: Governed by Darcy’s law, q = −(k/μ)∇p, where q is the Darcy velocity. The porosity (n) within each cell is dynamically updated based on the solid volume fraction occupied by particles. The permeability (k) is not constant but is calculated from the evolving porosity using the Kozeny-Carman equation, kn3/(1 − n)2. The resulting fluid pressure gradient generates a drag force on particles, while particle movement conversely alters the porosity field, creating a fully coupled two-way interaction. In PFC, the governing equations of particle motion are derived from the software’s standard formulation, with fluid-particle interactions incorporated through body forces and surface tractions.
υ t = f m e c h + f f l u i d m + g ω t = M I
where v is the particle velocity, m/s; t is the time, s; ffluid is the total force exerted by the fluid on particles, kN; fmech is the sum of external forces acting on particles, kN; g is the gravitational acceleration, m/s2; ω is the angular velocity of rotating particles, rad/s; I is the moment of inertia, kg·m2; and M is the torque acting on the particles, N·m.
The interaction force between fluid and particles is composed of the drag force of the fluid and the pressure gradient force. The formula for calculating drag force is as follows:
f d r a g = 1 2 C d ρ π r 2   |   u v   |   u v n e λ
where ρ is the fluid density, kg/m3; u is the particle velocity, m/s; v is the fluid velocity, m/s; r is the particle radius, m; neλ is an empirical coefficient that considers local porosity.
Drag coefficient:
C d = 0.63 + 4.8 R e p
Experience coefficient:
λ = 3.7 0.65 e x p 1.5 l g R e p 2 2
Particle Reynolds number:
R e p = 2 ρ r u v μ
where µ is the fluid viscosity coefficient.
According to the above formula, the force of fluid on particles in the software is:
f f l u i d = f d r a g + 4 π r 3 p ρ g 3

3. Results and Discussion

3.1. Establishment and Monitoring of the Model

In the indoor model test, the clay particles used were prepared based on the original physical and mechanical properties of the prototype using bentonite (400 mesh), with an average particle size of 0.04 mm. In numerical simulations, performing discrete element numerical simulations with the original particle sizes would subject the computer to excessive computational loads, making it impossible to obtain simulation results. Therefore, to ensure simulation accuracy while improving computational efficiency, the particle diameters in the numerical model were intentionally enlarged to 10 times the actual experimental sand particle diameters. Through this approach, modeling authenticity can be preserved while effectively alleviating computational burdens, thereby enabling more efficient investigation of clay particles’ mechanical behavior. Based on empirical porosity values of sand and clay layers combined with software-based parameter optimization, the porosities were determined as 0.35 for the sand layer and 0.16 for the clay layer. Furthermore, the mesoscopic parameters for water, sand, and retaining walls are comprehensively presented in Table 1, while those for clay are provided in Table 2.
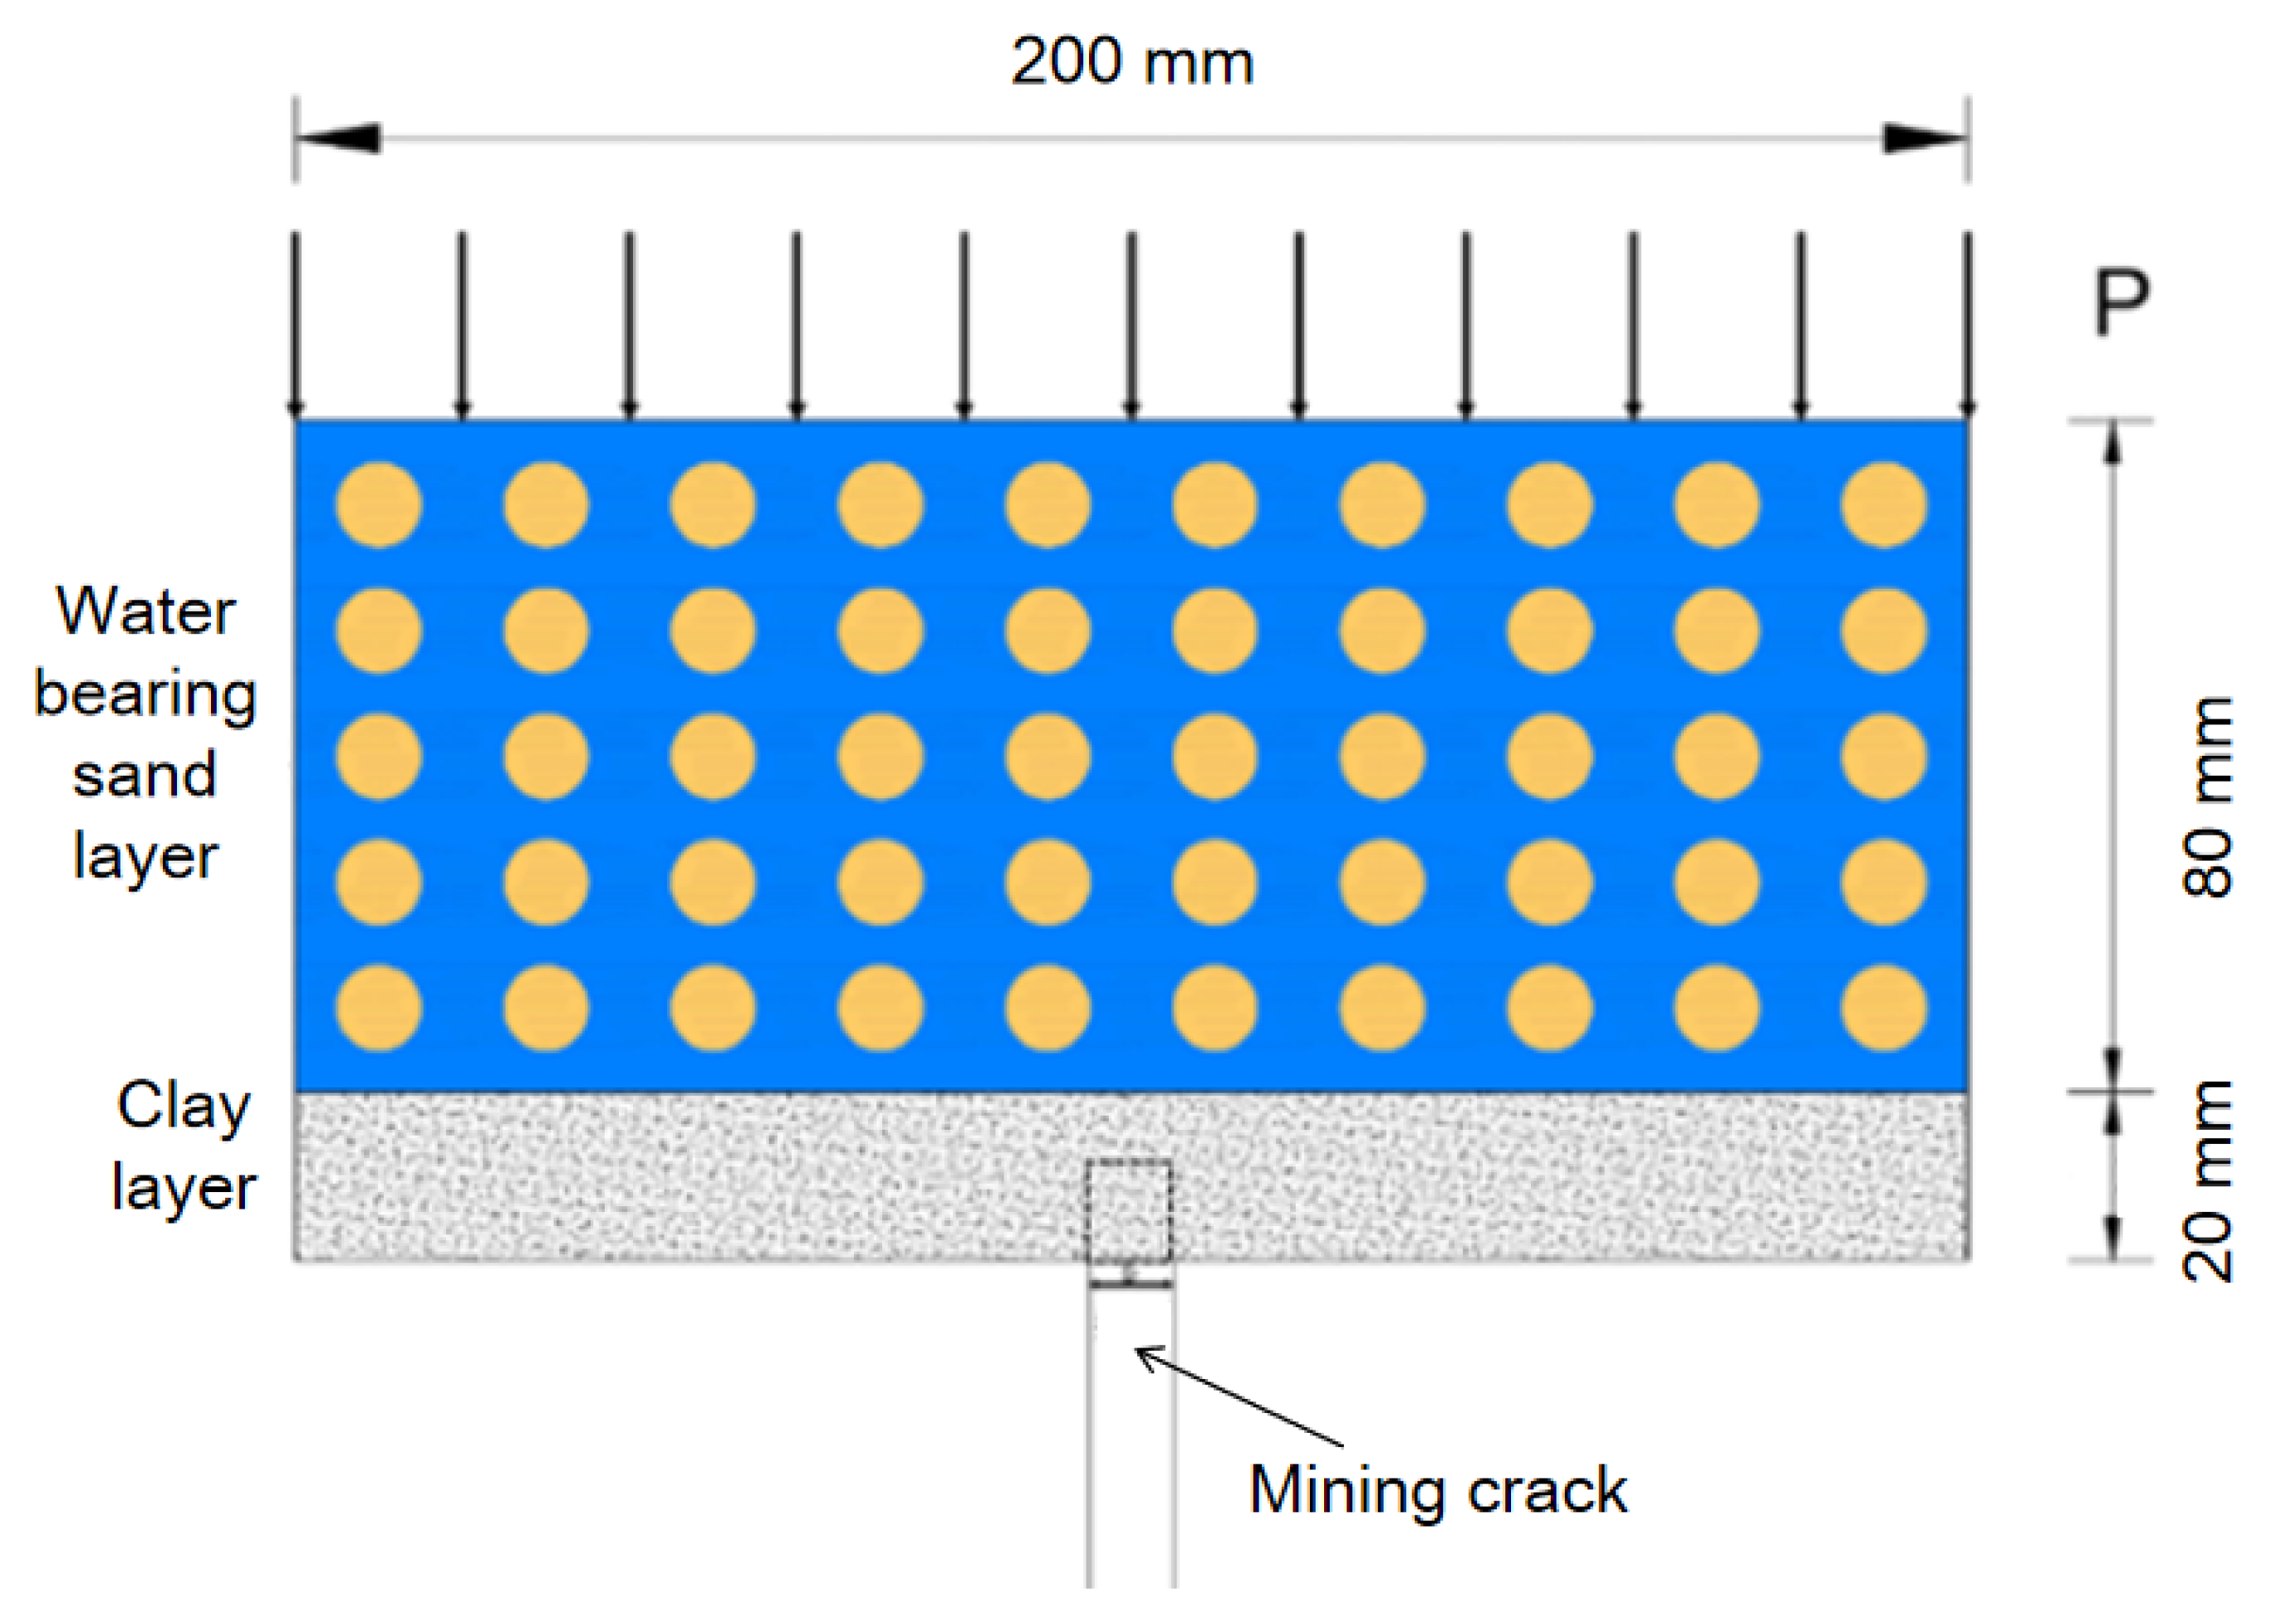
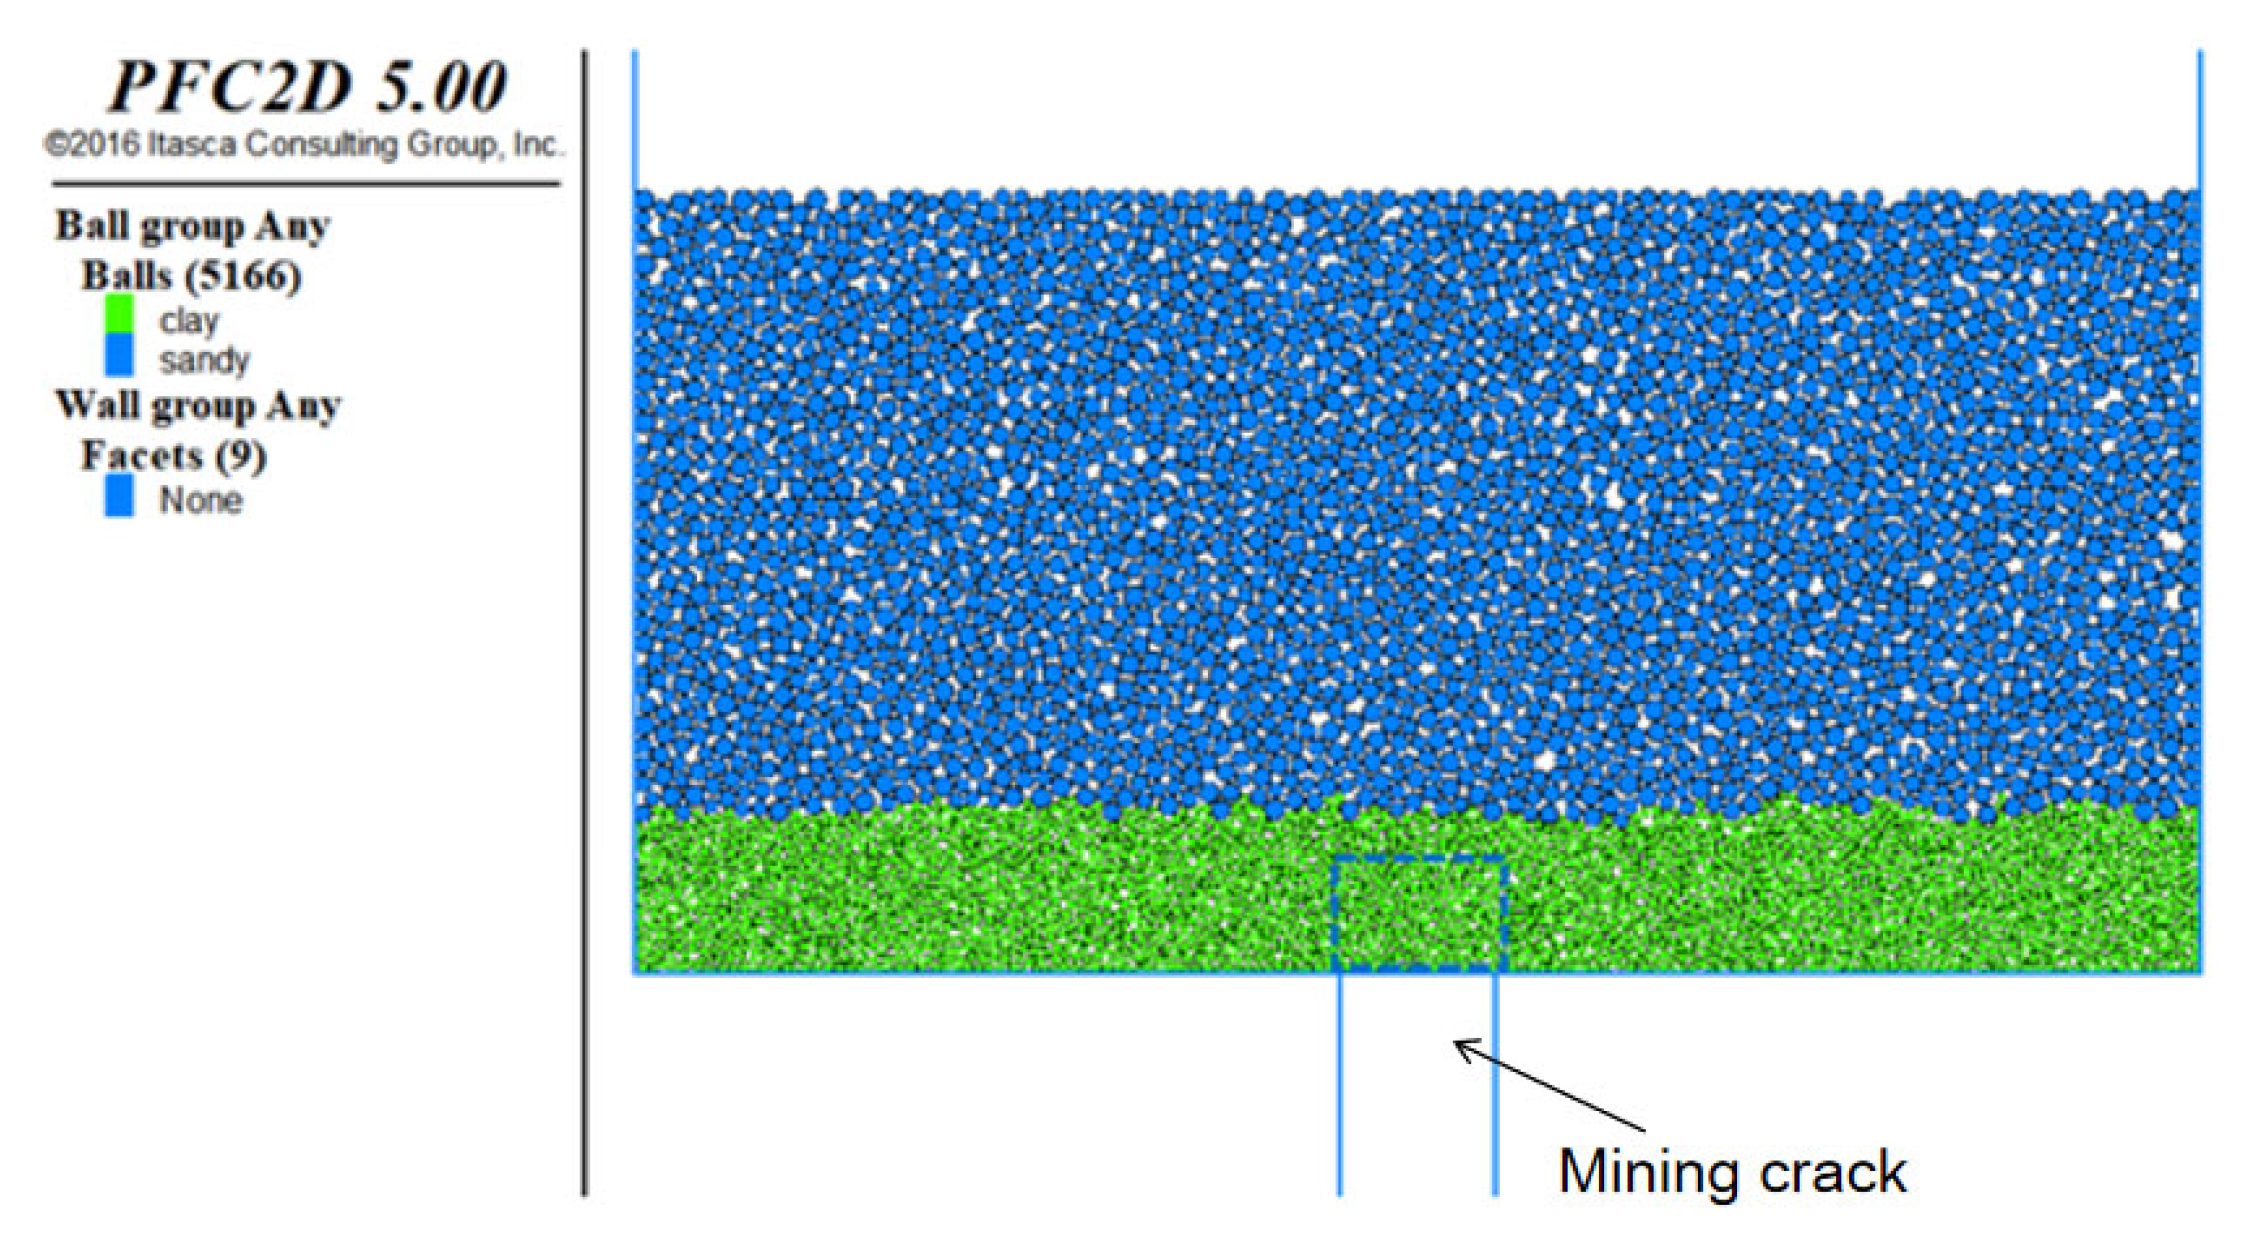
The numerical model construction is based on fundamental physical parameters. The primary objective of this modeling effort is to investigate seepage-induced failure mechanisms through systematic simulation. Therefore, building upon the foundation of laboratory model experiments, we designed a small-scale two-dimensional model with dimensions of 0.20 m (length) and 0.10 m (width). Based on the particle sizes determined during the parameter calibration phase, a total of 5166 particles were generated and subsequently divided into two distinct groups: one containing sand particles and the other clay particles. A fissure was positioned at the central base of the model, with both its width and sand particle size adjustable according to practical requirements. The schematic diagram of the model is illustrated in Figure 3, where b denotes the mining crack width. The physically constructed model configuration is presented in Figure 4.
Measurement circle deployment: During numerical simulations of water and sand inrush induced by clay permeability failure, sufficient measurement circles should be strategically deployed within the numerical model to acquire precise temporal–spatial variations in critical parameters including porosity and contact forces. In this simulation, 200 measurement circles with 0.01 m diameter spheres were automatically deployed to acquire comprehensive parameter variation data throughout the model. The spatial distribution pattern of these monitoring points is systematically presented in Figure 5.
The time step, a fundamental discretization parameter in numerical simulations, represents the temporal segmentation of system evolution processes through predefined intervals. Numerical simulations implement temporal discretization by dividing the problem’s time domain into consecutive small intervals, each designated as a time step to facilitate system state tracking. Within each time step, the system state undergoes progressive updates through rigorous application of governing physical laws and numerical computational methods. Simulation duration exhibits direct proportionality with time step size, where increased time step values result in longer computational times. This study employs 100 discrete time steps, establishing the fundamental relationship:
Time step × Duration = Computational times.

3.2. Infiltration Damage Simulation Result Analysis

The cracks formed within the rock mass after mining-induced overburden failure; different crack sizes lead to different seepage velocities and particle transport scales. Based on the analysis identifying crack width at the clay layer’s base as the primary controlling factor for seepage-induced failure capacity, this study systematically investigates the influence of varying crack widths (5 mm, 10 mm, 15 mm, and 20 mm) through four experimental groups. The configuration scheme was specifically developed considering model dimensional constraints, with complete experimental parameters detailed in Table 3.
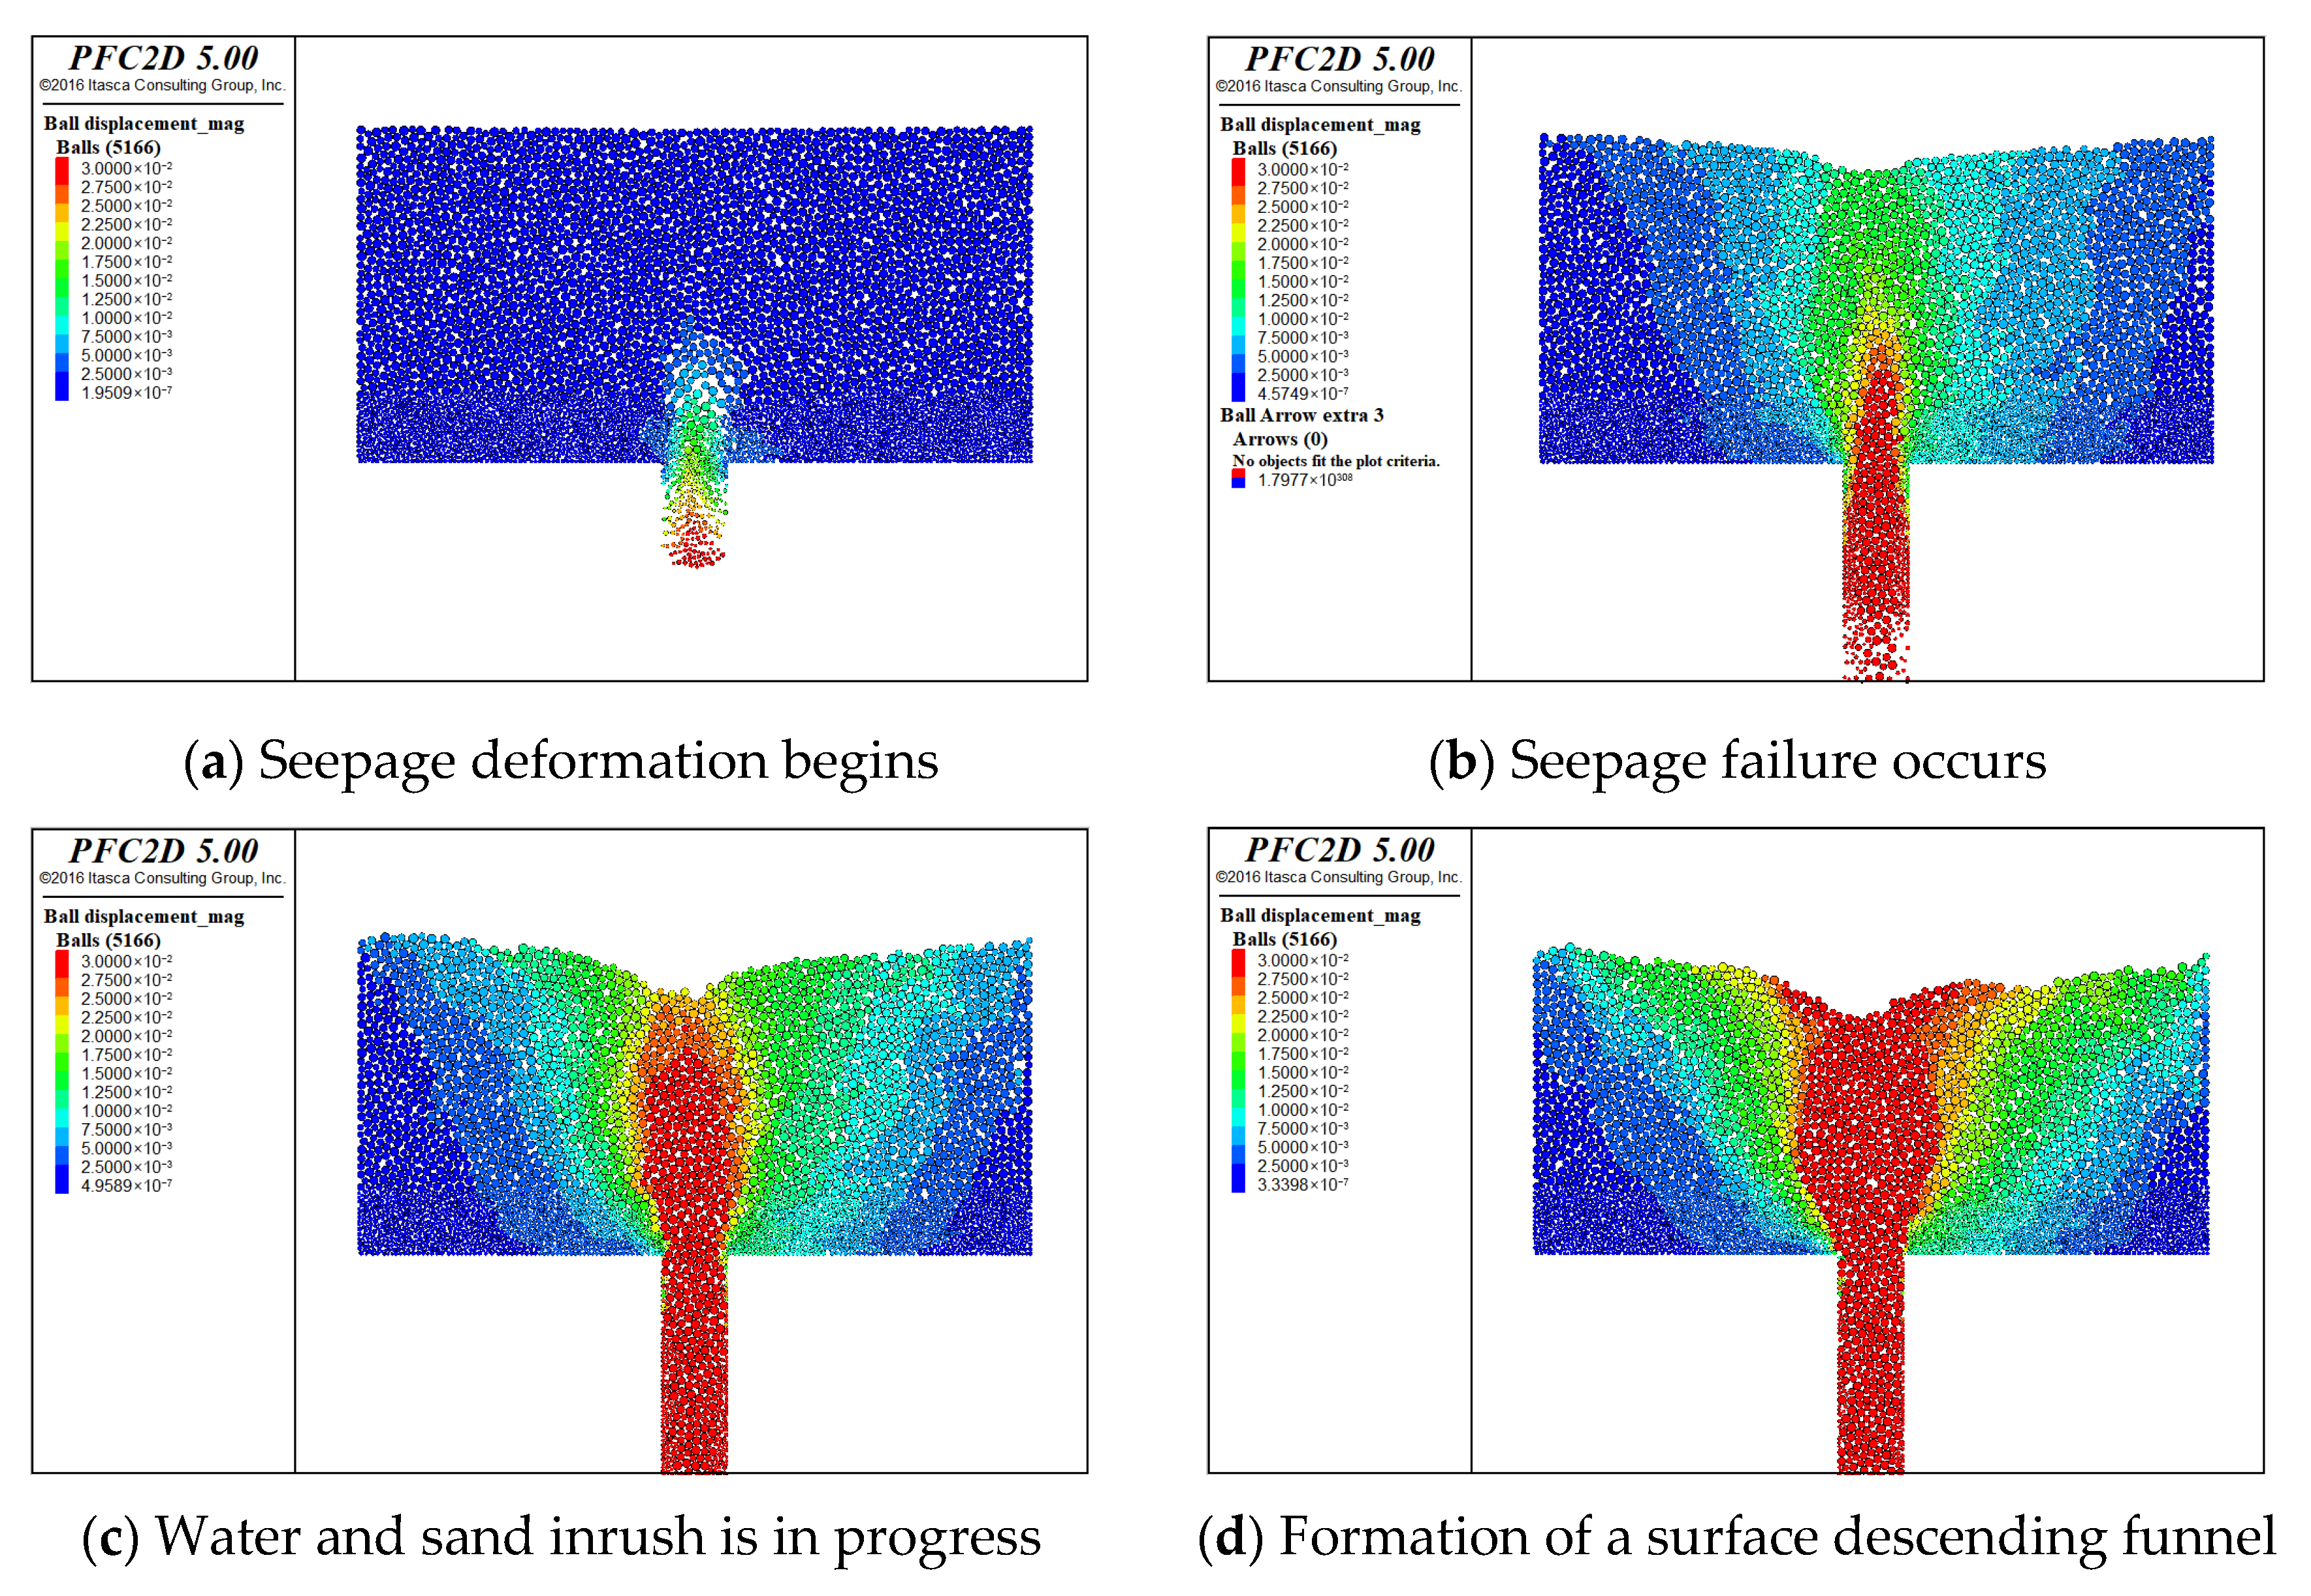
After the occurrence of seepage failure, Test 4 was selected for in-depth analysis. Based on the observation of particle motion patterns, the following conclusion can be drawn: when the simulation reached 10,000 time steps, the beginning of movement in the basal clay particles was observed, attributed to the combined effects of gravitational forces and pore water pressure. At this point, particles near the fracture mouth begin to move first, with the most significant particle displacement observed at these locations, while the clay layer begins to exhibit permeation-induced deformation. As the permeation deformation progresses, the clay layer undergoes permeation failure. By 100,000 time steps, migrating particles gradually propagate upward from the fracture location until they cover the central portion of the model. Simultaneously, the model’s upper portion begins to subside downward, gradually forming a subsidence funnel; water and sand inrush initiates at this stage. By 200,000 time steps, migrating particles further propagate laterally from the model’s central zone toward both flanks, while the subsidence funnel attains its basic morphology. Ultimately, at 300,000 time steps, the displacement subsidence funnel becomes fully developed, while particles from both flanks and the upper portion continuously migrate toward the central convergence zone. Following this developmental pattern, the water and sand inrush will continue unabated until all particles have outflowed through the fracture, at which point the inrush phenomenon ceases entirely. The process of seepage failure is shown in Figure 6.
(1)
Analysis of porosity variation
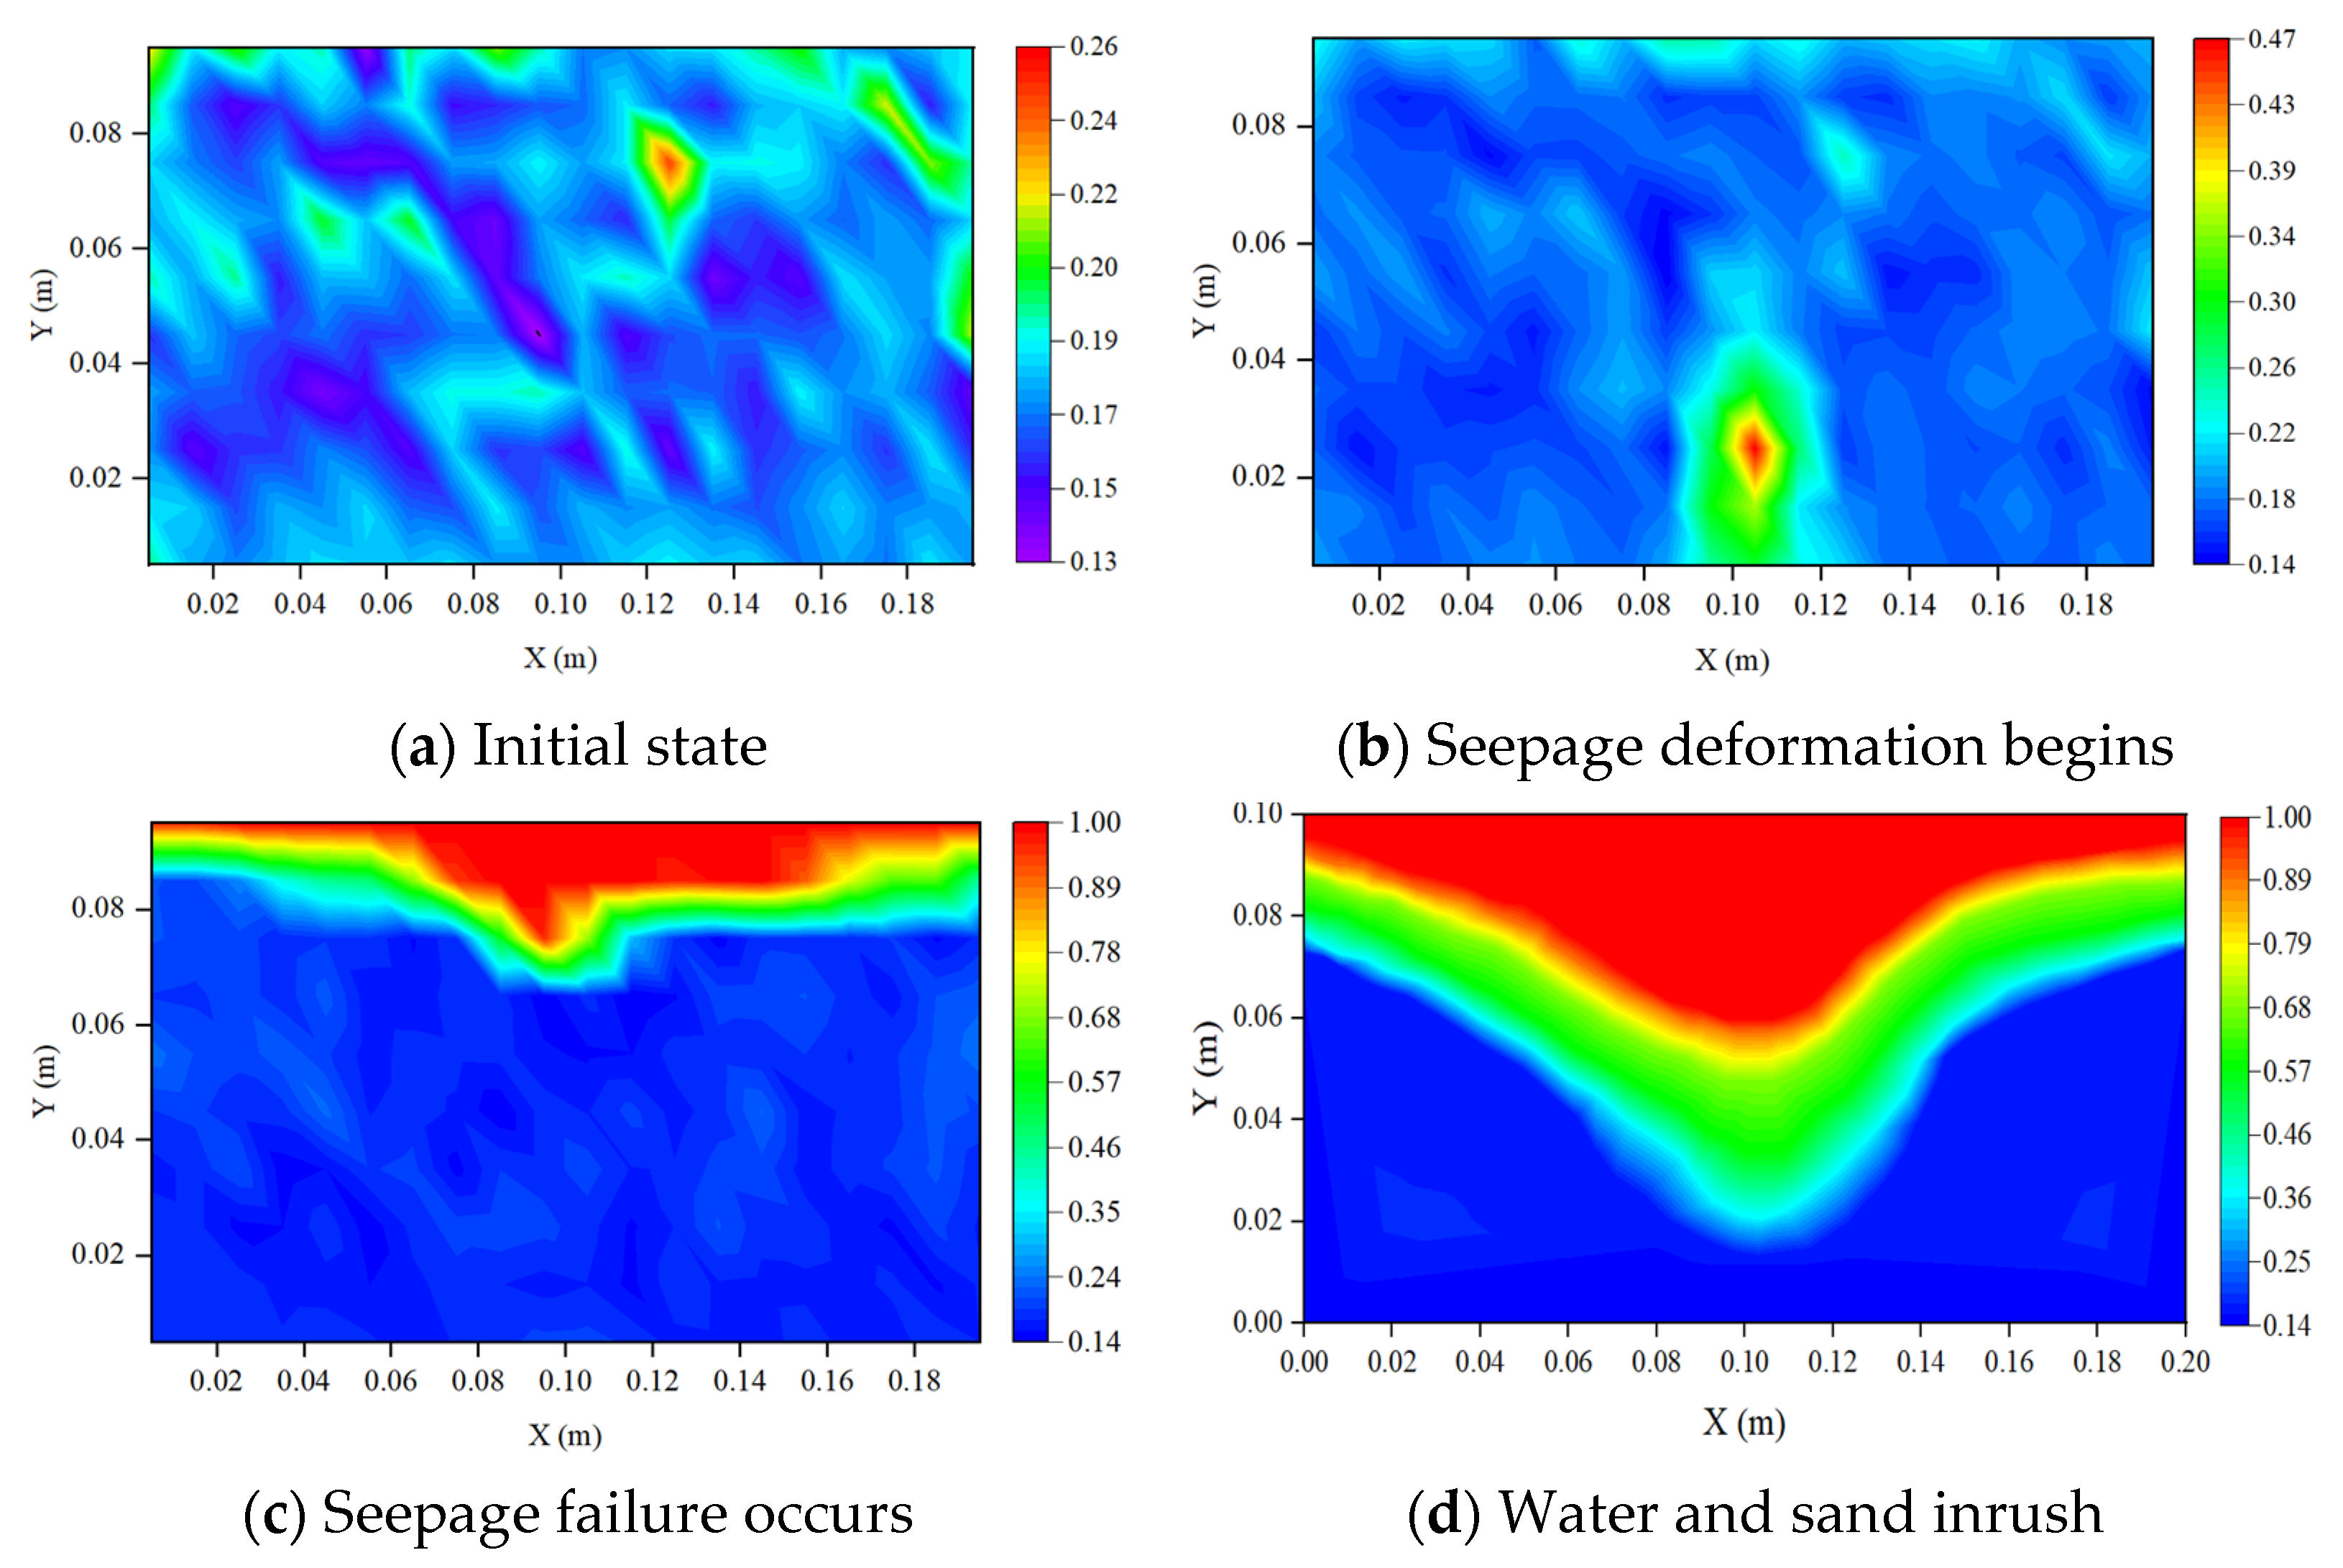
For instance, taking a 20 mm wide coarse sand permeation failure test model as an example, data exports were conducted every 20,000 time steps. The most representative time nodes were selected to generate porosity variation contour maps of the model via Origin software, as illustrated in Figure 7. During the initial phase of numerical simulation, the porosity values for both clay and sand particles were uniformly initialized to 0.16 (as shown in Figure 7a) to reduce computational load and ensure smooth model execution. In the longitudinal cross-section of the model, the porosity distribution exhibits relative uniformity, with most regions clustering around the 0.16 baseline value. During the initiation phase of permeation failure (Figure 7b), clay particles migrate downward along fractures, while shear-induced movement at the clay-sand interface drives sand particle displacement. At both the interface and the basal fracture mouth, particle depletion creates localized porosity enhancement. Simultaneously, upper-layer particles descend under combined hydraulic pressure and self-weight, progressively increasing porosity in the model’s upper regions. With progressive development of permeation failure (Figure 7c,d), the model’s upper-region porosity escalates to 1 while propagating downward. Concurrently, particle depletion at the upper and lateral boundaries induces radial migration of particles toward the central axis. Due to the protective effect of the clay layer and fracture aperture constraints, sand particles progressively migrate toward the central axis. This particle redistribution causes porosity to escalate to 1 at the model’s upper regions and lateral boundaries, while concluding the water and sand inrush process.
(2)
Analysis of the variation in the number of contacts between clay and sand particles
The relationship between the number of contacts between clay particles and sand particles and the time step is shown in Figure 8. By conducting monitoring and analysis of contact numbers between particles, the entire process from the initiation of seepage-induced failure to the cessation of water and sand inrush can be observed through variations in contact numbers. Following the initiation of seepage-induced failure in the clay layer and subsequent loss of its support capacity for the overlying aquifer sand layer, a significant reduction in particle contact numbers is observed. This figure illustrates that the curve slope increases markedly following the onset of seepage-induced failure. The progressive outflow of internal water and sand particles through the fracture aperture leads to a continuous reduction in contact numbers, while the sand inrush rate exhibits significant deceleration until complete particle expulsion from the fracture occurs. The gradual depletion of contact numbers indicates that the entire water and sand inrush process concludes following seepage-induced failure.
Based on the analysis of the curves in Figure 8, three distinct phases can be identified in the development process. The first phase exhibits a relatively stable trend, corresponding to slow particle migration within the clay layer during seepage-induced failure, where the structural integrity of the clay matrix maintains restraint effects. The second phase demonstrates a marked increase in curve slope, indicating that the clay’s anti-seepage capacity has been compromised, thereby initiating the water and sand inrush process. Under water flow action, the massive outflow of sand and clay through the fracture aperture causes a rapid reduction in particle contact numbers. However, for 5 mm fractures, this figure shows no significant change in curve slope, which is attributed to the fracture width affecting the velocity of seepage-induced failure. The restricted passage at the fracture mouth limits particle expulsion rate, thereby constraining contact number reduction; The slope of the curve gradually decreases in the third phase, marking the final stage of the water and sand inrush. While the majority of clay and sand have been flushed out through the fissure outlets during the water and sand inrush process, a minor portion remains combined due to the viscous adhesion between clay particles and sand grains, which significantly slows down the inrush rate. Under sustained hydraulic action, the remaining clay and sand gradually drain out through fissure outlets until no remaining contact exists within the model, marking the conclusion of the water and sand inrush process following penetration failure.
Additionally, Figure 8 demonstrates through its x-axis that the time required for contact count reduction to zero exhibits a progressive trend under varying fracture widths. It can be observed that larger fracture widths result in shorter time step durations for the water and sand inrush process to complete after penetration failure, as evidenced by the decreasing time intervals recorded in the experimental data. This indicates that under equal hydraulic pressure conditions, fracture width variation influences model runtime.
(3)
Analysis of the variation in contact forces between clay and sand particles on both sides of the fissure
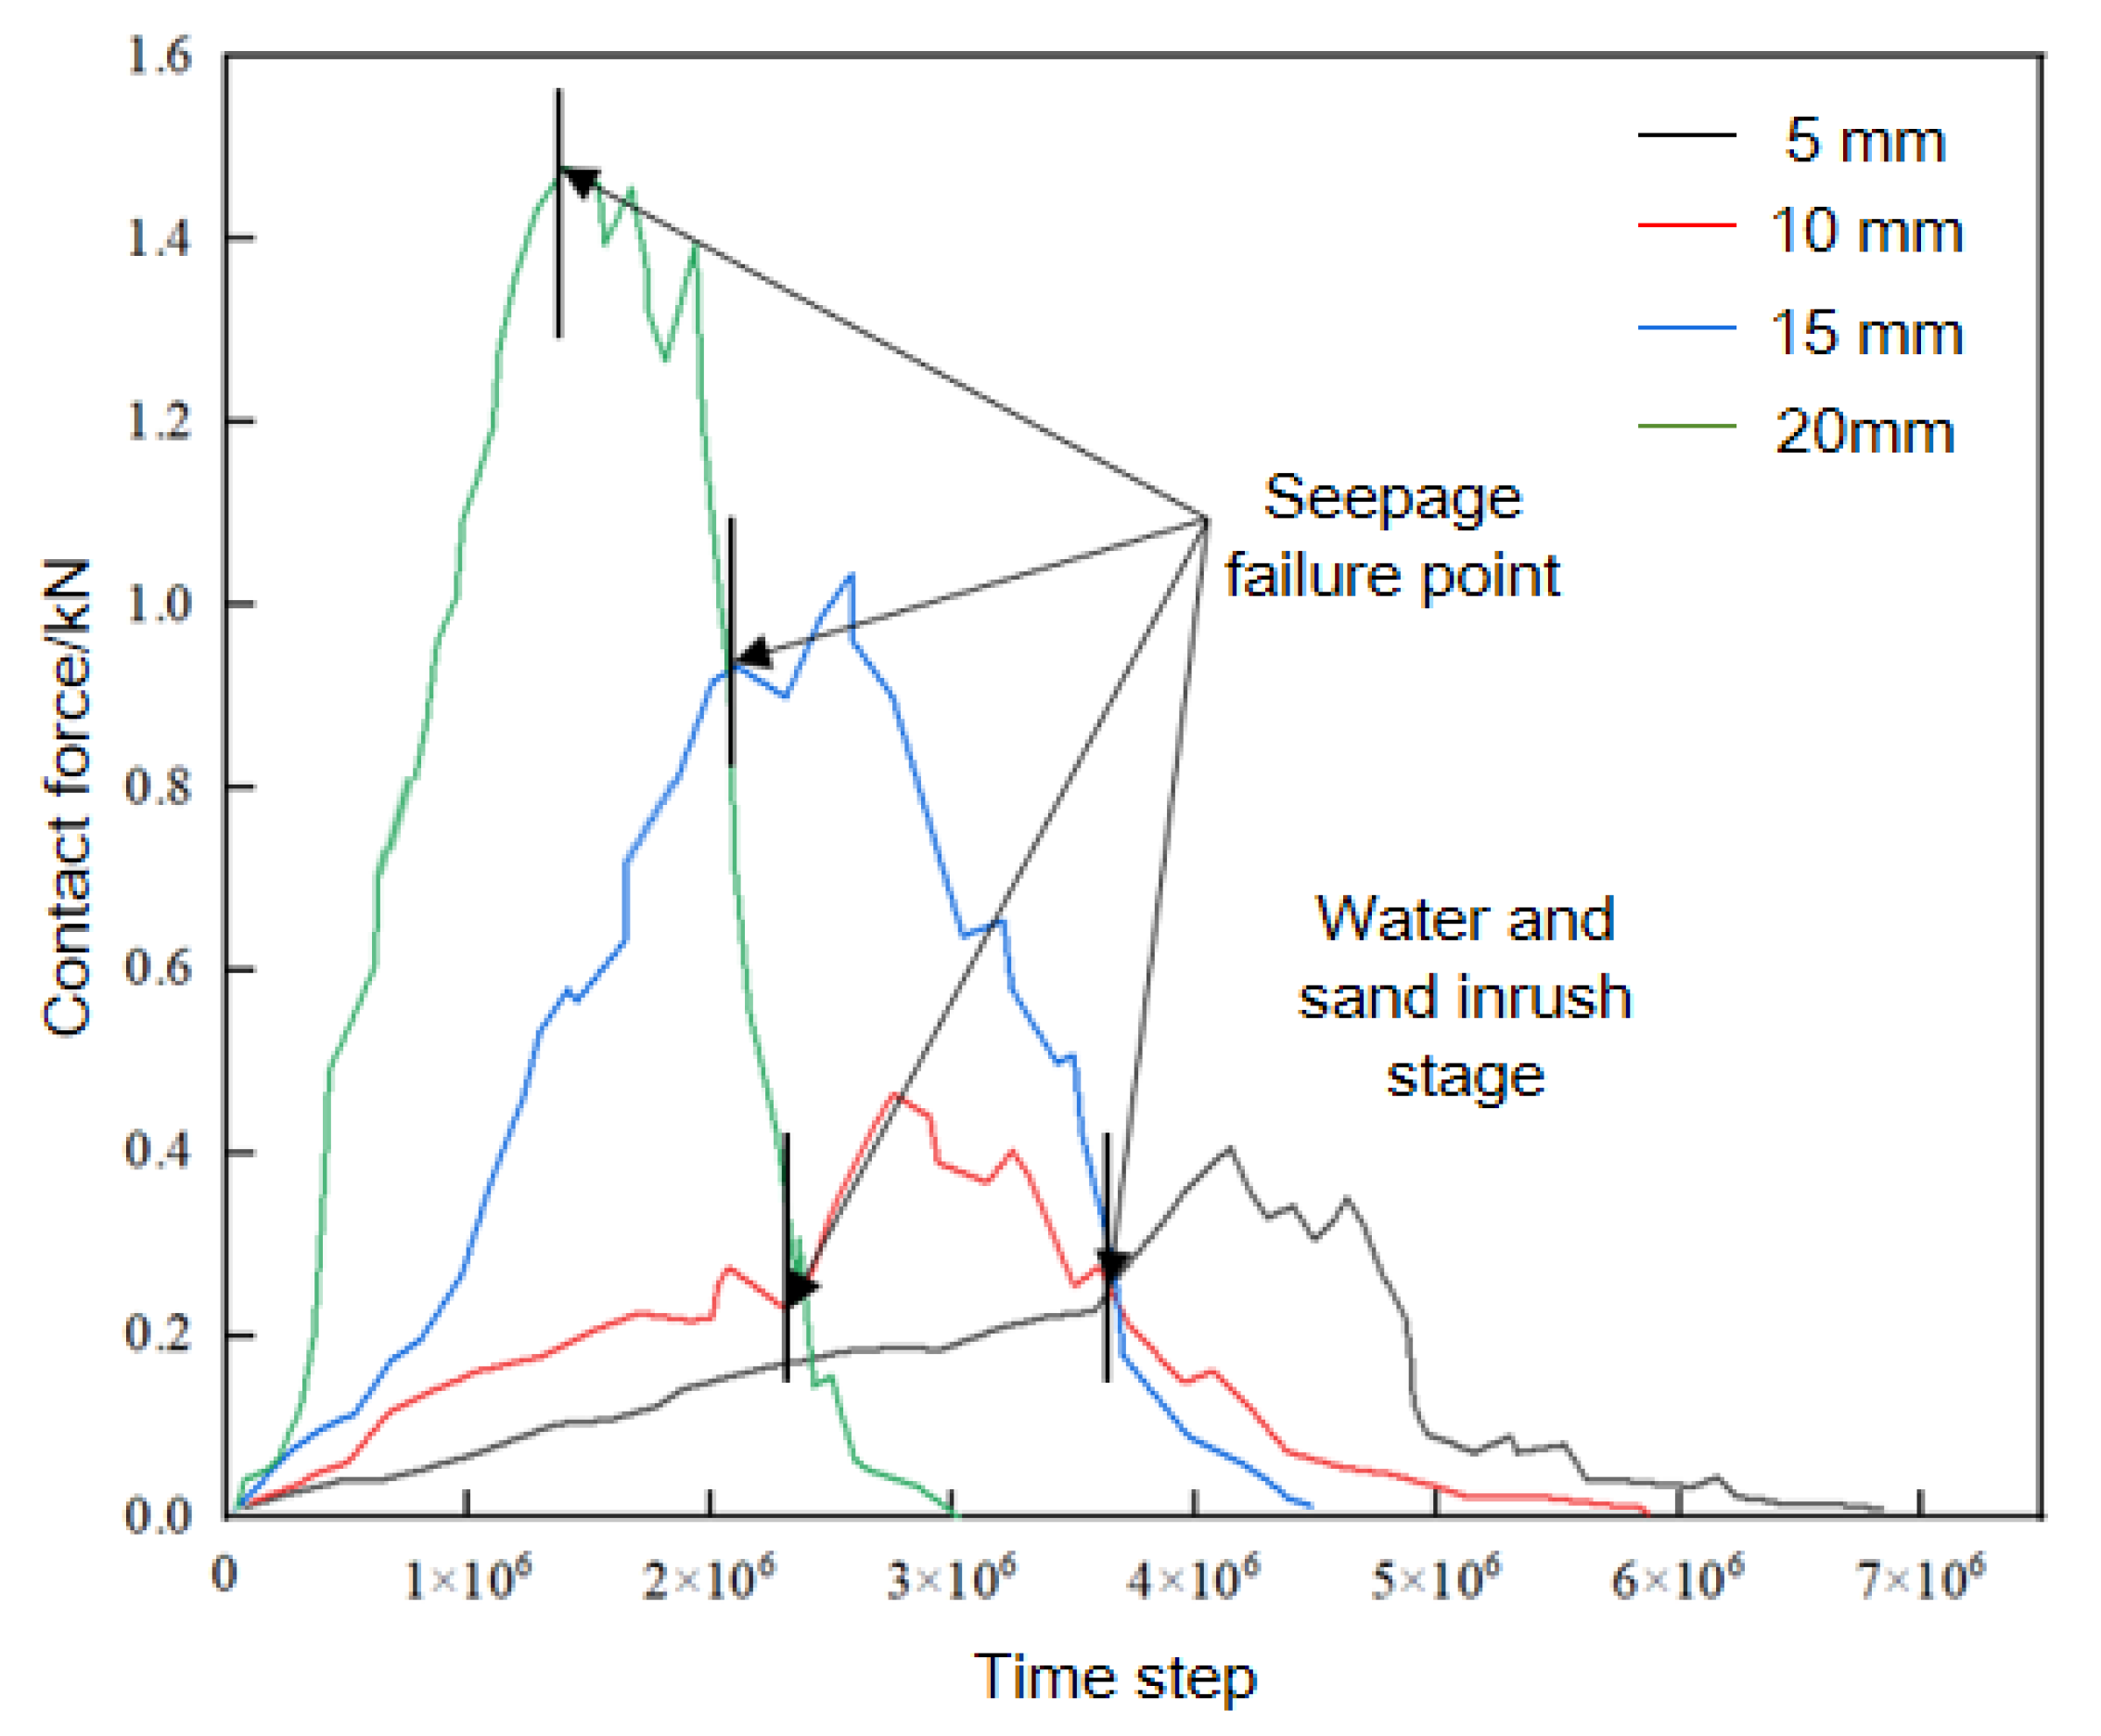
Under the combined effect of water pressure and the gravity of the overlying sand layer, clay within the clay layer will first surge out through fissure openings. Both sides of the fissure mouth will be subjected to the force exerted by the escaping clay. After complete expulsion of clay through fissure openings, the water and sand inrush phenomenon initiates. Particles within the upper sand layer are expelled through the fissure openings under the dual mechanisms of hydraulic pressure and self-gravity. When water and sand inrush occurs, both sides of the fissure are subjected to instantaneous forces exceeding those generated during clay expulsion events. When the overlying strata fail and the water-conducting fracture zone impacts the clay layer, both sides of the fracture become the primary contact zones for the water-sand mixture. Therefore, monitoring contact forces on both sides of fractures is critically important during water and sand inrush process simulations. Results demonstrating variation patterns of contact forces at fracture openings with time step under varying fracture widths are presented in Figure 9.
Figure 9 illustrates the contact force variation curves on both sides of fracture openings under varying fracture width conditions. This figure further demonstrates that larger fracture widths correspond to greater peak contact forces at fracture openings, while resulting in earlier occurrences of water and sand inrush induced by clay permeation failure.
Furthermore, the permeation failure process can be divided into two distinct stages based on the curves. Stage 1: Clay Permeation Failure Stage. When identical hydraulic pressures are initially applied to the model, clay slowly emerges through fissure openings under the combined effects of gravitational forces on sand grains in the upper sand layer and applied hydraulic pressure. During this stage, contact forces at both sides of the fissure exhibit a gradually increasing trend. Water and sand inrush will not occur provided that the applied pressures remain below the clay layer’s permeation resistance capacity. Stage 2: Water and Sand Inrush Stage. Once the clay layer has lost its permeation resistance capacity, it gradually exits through fracture openings. Water and sand inrush begins immediately after the complete emergence of the clay layer from the fracture openings. At this stage, both sides of the fracture openings experience rapid increases in contact forces due to instantaneous impacts from the water-sand mixture. Subsequently, these forces stabilize within a persistently elevated fluctuation range. As the water-sand mixture diminishes, the forces exerted by the water-sand mixture on both sides of the fracture openings gradually weaken, leading to a progressive reduction in contact forces. When the contact forces on both sides approach zero, the absence of sustained water-sand mixture action marks the completion of the water and sand inrush process.

4. Conclusions and Future Work

This article simulates the entire process of water and sand inrush induced by seepage failure in the Quaternary system’s basal unconsolidated aquifer and underlying basal clay layer through a numerical modeling approach. Using the established numerical model, systematic monitoring and analysis were conducted on porosity evolution, contact count dynamics, and contact force variations during post-failure seepage events. Through quantitative analysis of parameter variation curves, these investigations yielded the following key findings:
(1)
Based on the porosity distribution analysis using the 20 mm fissure model’s numerical results, it was revealed that clay particles at the base fissure mouth initiated movement first, accompanied by a progressive increase in local porosity. As the seepage-induced failure progresses, continuous migration of clay particles through the fracture aperture is observed, accompanied by initiation of mobilization for upper sand layer particles due to the loss of underlying particles. Systematic monitoring reveals progressive increases in porosity within both upper and lateral model regions, with quantitative documentation of upward propagation dynamics. Following the initiation of water and sand inrush, continuous centripetal migration of sand particles towards the central axis leads to gradual depletion of particle concentration at the sand layer’s upper surface and lateral margins. This dual-phase process results in progressive porosity expansion within the collapsing zone, accompanied by downward propagation that ultimately develops into pit-like morphological structures. As the sand inrush phenomenon gradually ceases, the pit morphology on both sides of the model expands upward through continuous particle loss mechanisms.
(2)
By monitoring the total contact numbers between clay and sand particles in the model and analyzing their variation patterns over time steps, it is observed that the contact number variation curve exhibits a linear decreasing trend. The results indicate that with increasing joint width, both the rate of contact number reduction and water and sand inrush velocity accelerate, while the duration of failure initiation shortens correspondingly.
(3)
Based on the analysis of contact force variation curves between clay and sand particles and fracture mouth over time steps, the entire seepage failure process reveals two distinct developmental stages. Phase I corresponds to clay permeation-induced deformation stage, during which the contact forces at both sides of the fracture mouth exhibit a gradual increasing trend that remains below the clay layer’s anti-seepage failure capacity, thereby preventing water and sand inrush occurrence. Phase II corresponds to water and sand inrush stage. When the clay layer completely loses its anti-seepage failure capacity, the entire clay mass erupts through the fracture mouth, initiating active water and sand inrush. At this critical stage, the contact forces between particles at both sides of the fracture mouth exhibit rapid increase while maintaining continuous fluctuations. Analysis of the curves reveals that larger fracture widths correspond to increased contact forces, while the durations of seepage failure and water and sand inrush processes decrease accordingly.
(4)
Future work will prioritize developing 3D models and conducting field validation to improve the practical application of these findings in mine water inrush disaster prevention. Such works will be crucial for translating the quantitative relationships between fracture width and seepage failure dynamics into reliable early-warning systems and operational guidelines for mining safety.

Author Contributions

Conceptualization, software, numerical simulation, project administration, and writing—original manuscript preparation, Y.H. and J.L.; methodology, conceptualization and supervision, writing—review and editing, S.Y.; formal analysis, software, investigation, D.Z. and C.W. All authors have read and agreed to the published version of the manuscript.

Funding

The authors received financial support for this work from the National Natural Science Foundation of China, with grant No. 42130706, and the Science Research Project of Hebei Education Department (No. BJ2025131).

Institutional Review Board Statement

Not applicable.

Informed Consent Statement

Not applicable.

Data Availability Statement

The original contributions presented in this study are included in this article. Further inquiries can be directed to the corresponding author.

Acknowledgments

The authors express their gratitude to the anonymous reviewers for their detailed comments and suggestions, which have greatly enhanced the quality of this paper.

Conflicts of Interest

Jinwei Li was employed by Geological Exploration Research Institute of Guizhou Coalfield Geological Bureau. The remaining authors declare that the research was conducted in the absence of any commercial or financial relationships that could be construed as potential conflicts of interest.

References

  1. Keawsawasvong, S.; Likitlersuang, S. Undrained stability of active trapdoors in two-layered clays. Undergr. Space 2021, 6, 446–454. [Google Scholar] [CrossRef]
  2. Alagha, A.S.N.; Chapman, D.N. Numerical modelling of tunnel face stability in homogeneous and layered soft ground. Tunn. Undergr. Space Technol. 2019, 94, 103096. [Google Scholar] [CrossRef]
  3. Kumar, R.; Verma, A.K. Water barrier pillar design for safety in underground coal mines: A review. Mine Water Environ. 2025, 44, 203–225. [Google Scholar] [CrossRef]
  4. Liu, J.; Sui, W. Evolution and quantitative characterization of stress and displacement of surrounding rock structure due to the multiple layers backfill mining under loose aquifers. Water 2024, 16, 2574. [Google Scholar] [CrossRef]
  5. Liu, Y.; Liu, J.; Yang, B.; Yuan, S. Assessing water and sand inrushes hazard reductions due to backfill mining by combining GIS and entropy methods. Mine Water Environ. 2021, 40, 956–969. [Google Scholar] [CrossRef]
  6. Xie, K. China’s energy development for 2035: Strategic thinking and suggestions. Strateg. Study CAE 2022, 24, 1–7, (In Chinese with English Abstract). [Google Scholar] [CrossRef]
  7. Qian, M.; Xu, J.; Wang, J. Further on the sustainable mining of coal. J. China Coal Soc. 2018, 43, 1–13, (In Chinese with English Abstract). [Google Scholar]
  8. Liu, F.; Guo, L.; Zhang, J.; Wang, L. Synergistic mode of digitalization-intelligentization-greeniation of the coal industry and it’s path of building new coal productivity. J. China Coal Soc. 2024, 49, 1–15, (In Chinese with English Abstract). [Google Scholar]
  9. Lin, G.; Dong, D.; Li, X.; Fan, P. Accounting for mine water in coal mining activities and its spatial characteristics in China. Mine Water Environ. 2020, 39, 150–156. [Google Scholar] [CrossRef]
  10. Sun, W.; Li, W.; Wu, Q.; Zhao, S.; Liu, W.; Wang, C. Unraveling the spatio-temporal pattern of mine water accidents in China. Mine Water Environ. 2025, 44, 226–238. [Google Scholar] [CrossRef]
  11. Yuan, S.; Han, G. Combined drilling methods to install grout curtains in a deep underground mine: A case study in Southwest China. Mine Water Environ. 2020, 39, 902–909. [Google Scholar] [CrossRef]
  12. Yuan, S.; Han, G.; Liu, D.; Zhang, A. Multicriteria risk assessment of water inrush in underground mines with large-scale curtain grouting: A mine disaster risk reduction strategy. Geomat. Nat. Hazards Risk 2024, 15, 2409200. [Google Scholar] [CrossRef]
  13. Xia, R.; Wang, H.; Hu, T.; Yuan, S.; Huang, B.; Wang, J.; Ren, Z. A risk assessment of water inrush in deep mining in metal mines based on the coupling methods of the Analytic Hierarchy Process and Entropy Weight method: A case study of the Huize lead-Zinc Mine in Northeastern Yunnan, China. Water 2025, 17, 643. [Google Scholar] [CrossRef]
  14. Liang, Y.; Yuan, S.; Ma, S.; Han, G.; Shi, J. Migration of water and sand inrush through the mining-induced caving zone: Insights from model test and numerical analysis. Water 2024, 16, 2527. [Google Scholar] [CrossRef]
  15. Cai, G.; Sui, W.; Wu, S.; Wang, J.; Chen, J. On-site monitoring for the stability evaluation of a highway tunnel above goaves of multi-layer coal seams. Appl. Sci. 2021, 11, 7383. [Google Scholar] [CrossRef]
  16. Tong, L.; Liu, L.; Yu, Q. Highway construction across heavily mined ground and steep topography in southern China. Bull. Eng. Geol. Environ. 2014, 73, 43–60. [Google Scholar] [CrossRef]
  17. Li, Q.; Sui, W. Risk evaluation of mine-water inrush based on principal component logistic regression analysis and an improved analytic hierarchy process. Hydrogeol. J. 2021, 29, 1299–1311. [Google Scholar] [CrossRef]
  18. Sui, W.; Zhang, D.; Cui, Z.C.; Wu, Z.; Zhao, Q. Environmental implications of mitigating overburden failure and subsidences using paste-like backfill mining: A case study. Int. J. Min. Reclam. Environ. 2015, 29, 521–543. [Google Scholar] [CrossRef]
  19. Yang, B.; Sui, W.; Liu, J. Application of GIS-based decision-making model to evaluate safety of underground mining under Neogene aquifers. Int. J. Oil Gas Coal Technol. 2019, 22, 40–63. [Google Scholar] [CrossRef]
  20. Yang, B.; Yuan, S.; Liang, Y.; Liu, J. Investigation of overburden failure characteristics due to combined mining: Case study, Henan Province, China. Environ. Earth Sci. 2021, 80, 143. [Google Scholar] [CrossRef]
  21. Yin, H.; Zhou, W.; LaMoreaux, W. Water inrush conceptual site models for coal mines of China. Environ. Earth Sci. 2018, 77, 746. [Google Scholar] [CrossRef]
  22. Liu, R.; Zhi, G.; Yang, S.; Xu, X. Investigation on mining-induced floor water inrush from column and its control based on microseismic monitoring. Adv. Civ. Eng. 2023, 2023, 3754079. [Google Scholar] [CrossRef]
  23. Wu, J.; Xu, S.; Zhou, R.; Qin, Y. Scenario analysis of mine water inrush hazard using Bayesian networks. Saf. Sci. 2016, 89, 231–239. [Google Scholar] [CrossRef]
  24. Sui, W. Evaluation method of resistance to seepage failure due to mining near unconsolidated aquifers I: Critical hydraulic gradient. Coal Geol. Explor. 2023, 51, 175–186, (In Chinese with English Abstract). [Google Scholar]
  25. Sui, W.; Liang, Y.; Zhang, X.; Jain, R.; Zhu, T. An experimental investigation on the speed of sand flow through a fixed porous bed. Sci. Rep. 2017, 7, 54. [Google Scholar] [CrossRef]
  26. Hu, Y.; Chen, L.; Shi, Y.; Hou, X.; Zhang, M.; Ou, Q.; Wu, M.; Huang, P. Layered damage evolution mechanism of an underground waterproof grouting curtain wall under hydrodynamic-hydrochemical coupling. Constr. Build. Mater. 2025, 458, 139725. [Google Scholar] [CrossRef]
  27. Sui, W.; Hang, Y.; Ma, L.; Wu, Z.; Zhou, Y.; Long, G.; Wei, L. Interactions of overburden failure zones due to multiple-seam mining using longwall caving. Bull. Eng. Geol. Environ. 2015, 74, 1019–1035. [Google Scholar] [CrossRef]
  28. Hang, Y.; Sui, W.; Yuan, S. Experimental investigation of the seepage failure between bulkheads and surrounding rocks in deep underground mines. Bull. Eng. Geol. Environ. 2022, 81, 362. [Google Scholar] [CrossRef]
  29. Ji, Y.; Yu, L.; Wei, Z.; Ding, J.; Dong, D. Research progress on identification of mine water inrush sources: A visual analysis perspective. Mine Water Environ. 2025, 44, 3–15. [Google Scholar] [CrossRef]
  30. Du, Z.; Wu, Q.; Zhao, Y.; Zhang, X.; Yao, Y. A multi-constraint and multi-objective optimization layout method for a mine water inrush monitoring network. Sci. Rep. 2023, 13, 11817. [Google Scholar] [CrossRef]
  31. Ma, D.; Duan, H.; Li, Q.; Wu, J.; Zhong, W.; Huang, Z. Water–rock two-phase flow model for water inrush and instability of fault rocks during mine tunnelling. Int. J. Coal Sci. Technol. 2023, 10, 77. [Google Scholar] [CrossRef]
  32. Hang, Y.; Jin, L.; Yang, B.; Li, N.; Yuan, S.; Gao, Z.; Sun, L.; Zheng, S.; Hu, M. Evaluation of water retention capacity of bulkheads in underground coal mines. Adv. Civ. Eng. 2021, 2021, 6612498. [Google Scholar] [CrossRef]
  33. Zhao, Z.; Gu, J. Risk evaluation of mine-water inrush based on comprehensive weight method. Geotech. Geol. Eng. 2023, 41, 189–203. [Google Scholar] [CrossRef]
  34. Lu, C.; Li, P.; Xu, J.; Chai, J. Knowledge map analysis of coal mine water disaster prevention and control in China from 2000 to 2023. Earth Sci. Inform. 2024, 17, 2791–2799. [Google Scholar] [CrossRef]
  35. Dong, G.; Sui, W.; Li, Y.; Yao, J.; Guo, H.; Fu, W. Evaluation method of anti-seepage failure due to mining near unconsolidated layers Ⅱ: Hydraulic gradient analytical method. J. Eng. Geol. 2023, 31, 1486–1493, (In Chinese with English Abstract). [Google Scholar]
  36. Sui, W. Catastrophic mechanism and its prevention and control of seepage deformation and failure of mining rock mass Ⅲ: A review of water retention bulkhead. Coal Sci. Technol. 2023, 51, 36–43, (In Chinese with English Abstract). [Google Scholar]
Figure 1. Statistics on coal mine water inrush accidents and fatalities in China in the past decade [9,10].
Applsci 15 12318 g001
Figure 2. The location and hydrogeological structure characteristics of the study area.
Applsci 15 12318 g002
Figure 3. A schematic diagram of the numerical model.
Applsci 15 12318 g003
Figure 4. Numerical model.
Applsci 15 12318 g004
Figure 5. A layout diagram of measuring circles with a diameter of 0.01 mm.
Applsci 15 12318 g005
Figure 6. Process of seepage failure (Unit: m).
Applsci 15 12318 g006
Figure 7. Changes in porosity during seepage damage.
Applsci 15 12318 g007
Figure 8. Relationship between contact quantity and time step for different crack widths.
Applsci 15 12318 g008
Figure 9. Changes in contact force on both sides of a sand breach under different crack widths.
Applsci 15 12318 g009
Table 1. Mesoscopic parameters of water and sand.
MaterialsRadius
/mm
Density
/kg·m−3
Coefficient of FrictionStiffness RatioDynamic Viscosity Coefficient/Pa·s
Sand1.0~1.526000.41.5/
Water////0.001
Table 2. Mesoscopic parameters of clay.
Radius
/mm
Density
/kg·m−3
Coefficient of FrictionStiffness RatioContact Modulus/MPaParallel Bond Modulus/MPaParallel Bonding Stiffness RatioParallel Bonding Tangential Strength/MPaParallel Bonding Normal Strength/MPa
0.5~0.827000.52.08.08.02.00.40.4
Table 3. Numerical simulation test plan.
Test NumberSand Particle Size/mmMining Crack Width/mm
10.25~0.55
20.25~0.510
30.25~0.515
40.25~0.520
Disclaimer/Publisher’s Note: The statements, opinions and data contained in all publications are solely those of the individual author(s) and contributor(s) and not of MDPI and/or the editor(s). MDPI and/or the editor(s) disclaim responsibility for any injury to people or property resulting from any ideas, methods, instructions or products referred to in the content.