Article

Research on the Stability and Support Effect of a Tunnel Excavated by a Mechanical Drilling Method: Insights from a PFC3D-FLAC3D Coupling Simulation

1
Beijing General Research Institute of Mining & Metallurgy, Beijing 102628, China
2
Zijin School of Geology and Mining, Fuzhou University, Fuzhou 350108, China
*
Author to whom correspondence should be addressed.
Appl. Sci. 2025, 15(22), 12309; https://doi.org/10.3390/app152212309
Submission received: 17 October 2025 / Revised: 31 October 2025 / Accepted: 12 November 2025 / Published: 20 November 2025
(This article belongs to the Special Issue Recent Research on Tunneling and Underground Engineering)

Abstract

This study employs a three-dimensional numerical simulation based on the discrete–finite element coupled method to investigate the mechanical excavation of a tunnel and its influence on the support structures. The discrete element method accurately reproduces the mechanical cutting procedure during excavation, and the finite element model covers the majority volume of the model for reflecting the response of far-field rock. The main conclusions drawn from this research are as follows: (1) Under true triaxial loading conditions, the influence of the inclined interface between the rock strata on the tunnel’s displacement and stress field is relatively low, and the uniform displacement and stress field are formed around the tunnel. (2) The detailed mechanical excavation and rock-breaking process is simulated, and a secondary crack layer (shear failure dominates) with a thickness of about 30 cm formed on the surrounding rock of the tunnel; secondary tensile and shear cracks present different distributions and orientations, which are caused by the mechanical drilling and cutting processes. (3) Although over 60% of the lengths of the anchor rods in the tunnel-side walls reach the yield strength of the Q235 steel rod, the anchor rod system is relatively safe (lower than the tensile strength) and plays a positive role on rock stability; however, the anchor rods in the tunnel roof are safer because the low deformation (about 50% compared to the rods in the side walls), and only a minority of the anchor rods exceed the yield stress.

1. Introduction

Mineral resources are inherently non-renewable. To exploit underground resources efficiently, mining operations have progressively extended in both depth and spatial extents, which has introduced significant challenges for underground safety, particularly regarding the stability of tunnels. Consequently, the selection of the excavation method and the design of the support structure are essential for the safety construction of tunnels [1,2,3,4,5]. For example, Hashemnejad et al. [6] demonstrated the influence of fluids on the physical and mechanical properties of the surrounding rock during tunnel excavation. Under these conditions, traditional drilling and blasting methods cannot be used to excavate tunnels, and fluids at different temperatures will cause significant fluctuations in mechanical excavation efficiency. Deng et al. [7] conducted dynamic loading tests to quantitatively analyze the secondary damage effects of blasting loads on jointed rock masses, and found that the loss of joint strength is not permanent, and its main impact is reflected in the period when the free surface has just formed. Therefore, mechanical excavation has significant safety advantages compared to traditional drilling–blasting excavation [8,9,10,11].
In recent years, advances in computational hardware and software have enabled the widespread application of numerical simulation technologies for the pre-validation of construction plans. Modern models now achieve high geometric accuracy, and can incorporate detailed physical and mechanical parameters, as well as realistic construction processes. Various numerical approaches can be tailored to specific research objectives; for example, the discrete element method (DEM) is often employed to analyze fracture locations and intensities, whereas the finite element method (FEM) is used to evaluate plastic failure zones and displacement fields. Bai et al. [12] developed a PFC3D (particle flow code 3D)–FLAC3D (Fast Lagrangian Analysis of Continuum) coupled algorithm based on the overlapping domain method, enabling integrated macro–micro analysis. This model accurately represents stress distributions in surrounding rock and simulated crack initiation and propagation, substantially enhancing the analysis of tunnel disturbance processes. Hou et al. [13] proposed a Novel Elastic Visco-Plastic Damage (NEVPD) model, implemented using the FLAC3D secondary development interface, to predict the time-dependent deformation behavior of deep tunnels. The model effectively captures both the local damage and time-dependent responses of the surrounding rock. Min et al. [14] applied a 3D finite discrete element method (3D-FDEM) accelerated by a graphics processing unit (GPGPU) to simulate rock peeling and fracture under dynamic tensile loads. Their numerical results closely matched experimental observations in terms of fracture modes and particle velocity fields, demonstrating the method’s reliability for dynamic fracture analysis.
Research on rock mechanics has revealed the failure mechanisms and anisotropic characteristics of the surrounding rock from multiple perspectives. Zheng et al. [15] conducted true triaxial dynamic-static combined loading tests using PFC3D software, systematically examining the influence of principal stresses on the dynamic disturbance behavior of gabbro. Their results indicate that increasing σ1 or decreasing σ2 and σ3 significantly reduced the rock’s disturbance resistance and shifted crack modes from intergranular shear to intragranular extension. Song et al. [16] investigated composite rocks under triaxial compression using 3D DEM modeling and found that increasing confining pressure caused secondary cracks distributed concentratedly, with the bedding plane dip angle controlling crack initiation and propagation. The influence of heterogeneity and microstructure has also been highlighted. Sun et al. [17] studied the size effects in crystalline rocks containing artificial defects, reconstructing mineral microstructures based on particle models and summarizing the influence of size on strength and fracture modes.
In engineering applications, numerous studies combine model validation with practical construction scenarios. Xu et al. [18] simulated the complete evolution of slopes under seismic loads—from cracking and propagation to sliding and sedimentation—demonstrating the improved FDEM’s accuracy and robustness. Their study quantified dynamic stability using factors such as the dynamic safety factor and critical failure surfaces, recommending increases in cutting through failure surfaces and kinetic energy as standards for simulating a slope’s dynamic instability. Zhao et al. [19] examined rock fracture in rectangular voids using biaxial compression tests and DEM simulations in progressive mining with variable aspect ratios. They found that, under consistent burial depth, the void’s aspect ratio directly influenced the depth and distribution of final V-shaped failure grooves, while low confining pressures produced strip cracks at arch positions.
In summary, discrete element–finite element coupled numerical simulation is a mature and robust tool for addressing both engineering and scientific problems in geotechnical and mining research. Accordingly, this study aims to develop scientifically informed tunnel excavation strategies through simulations of excavation and the detailed mechanical drilling–cutting process. Specifically, it focuses on understanding the mechanisms of surrounding rock failures, structural response characteristics, and micro-disturbance excavation behavior. The findings are expected to provide design guidance for construction under analogous working conditions.

2. Methodology

2.1. Engineering Background

The background of this study comes from the Phosphate Mine of Wengfu Group, Guizhou Province, China. The main orebody status of the mining area where this research is located is shown in Figure 1a, and the thin lines at the right side of the figure represent the existing mining tunnels at different depths. The maximum burial depth of the existing tunnels is about 500 m, and most existing tunnels are parallel to the strike direction of the orebody. A diagram of the three-arc tunnel section is shown in Figure 1b, which is 4.5 m wide and 4.1 m high. Because the fracture structures are densely distributed in the rock mass (Figure 1c), the traditional drilling–blasting excavation method cannot by applied (invisible secondary cracks impact the stability of the tunnel).
The orebodies under development are ordered from deep to shallow as A and B, respectively. The A orebody extends approximately 750 m along the strike and 424 m along the dip within the design boundaries, with a thickness varying from 18.70 m to 29.29 m and an average thickness of 24.97 m. The B orebody exhibits a similar strike length of 750 m and a dip width of 392 m, with an average thickness of 16.81 m. Therefore, we set the target depth of the tunnel construction in this study as 400 m.
The “one excavation, one support” approach was employed during tunnel construction, with support primarily provided by full-length bonded anchor rods in side wall and roof positions. The physical and mechanical properties of the rock mass, obtained from field samples, are summarized in Table 1. Based on these data, the present study focuses on the relatively weaker B orebody and its adjacent rock mass as the primary research target.

2.2. Modeling of the Inclined Strata

Because the far-field stress was not measured in the mining area, while near-field stress is prone to errors caused by mining operations; therefore, this research selected the geo-stress statistical formula used in Chinese Mainland [20] to use in the model. The average density of the rock mass is taken as 2.8 g/cm3 (based on Table 1), and the final stress state of the model at a depth of 400 m is obtained:
σ v = 0.02532 H + 0.8177 = 10.95   M P a
σ h m a x = 0.02989 H + 2.7984 = 14.75   M P a
σ h m i n = 0.01766 H + 1.0583 = 8.12   M p a
To simultaneously consider the secondary damage behavior of the near-field surrounding rock during tunnel excavation, as well as the possible loose stress zone and large deformation zone of the far-field rock mass, this study uses the DEM-FEM coupling method to carry out simulation work, which is conducted using the PFC3D and FLAC3D software (7.0 version) produced by Itasca. Several key advantages of this are as follows:
(1)
Micro–macro cross-scale analysis capability: PFC3D can simulate micro-mechanical behaviors such as rock fragmentation and particle flow within a discrete particle system, while FLAC3D efficiently models large-scale deformation and stress propagation using continuum theory. Coupling these two approaches allows for the synchronous analysis of local failure mechanisms and overall mechanical responses through the exchange of interface data.
(2)
Efficient computation and parameter optimization: By employing a partitioned coupling strategy, FLAC3D handles macroscopic calculations in regions of low strain, whereas PFC3D focuses on microscopic simulations in areas of high deformation gradients. This division substantially reduces the computational cost compared with purely discrete element models.
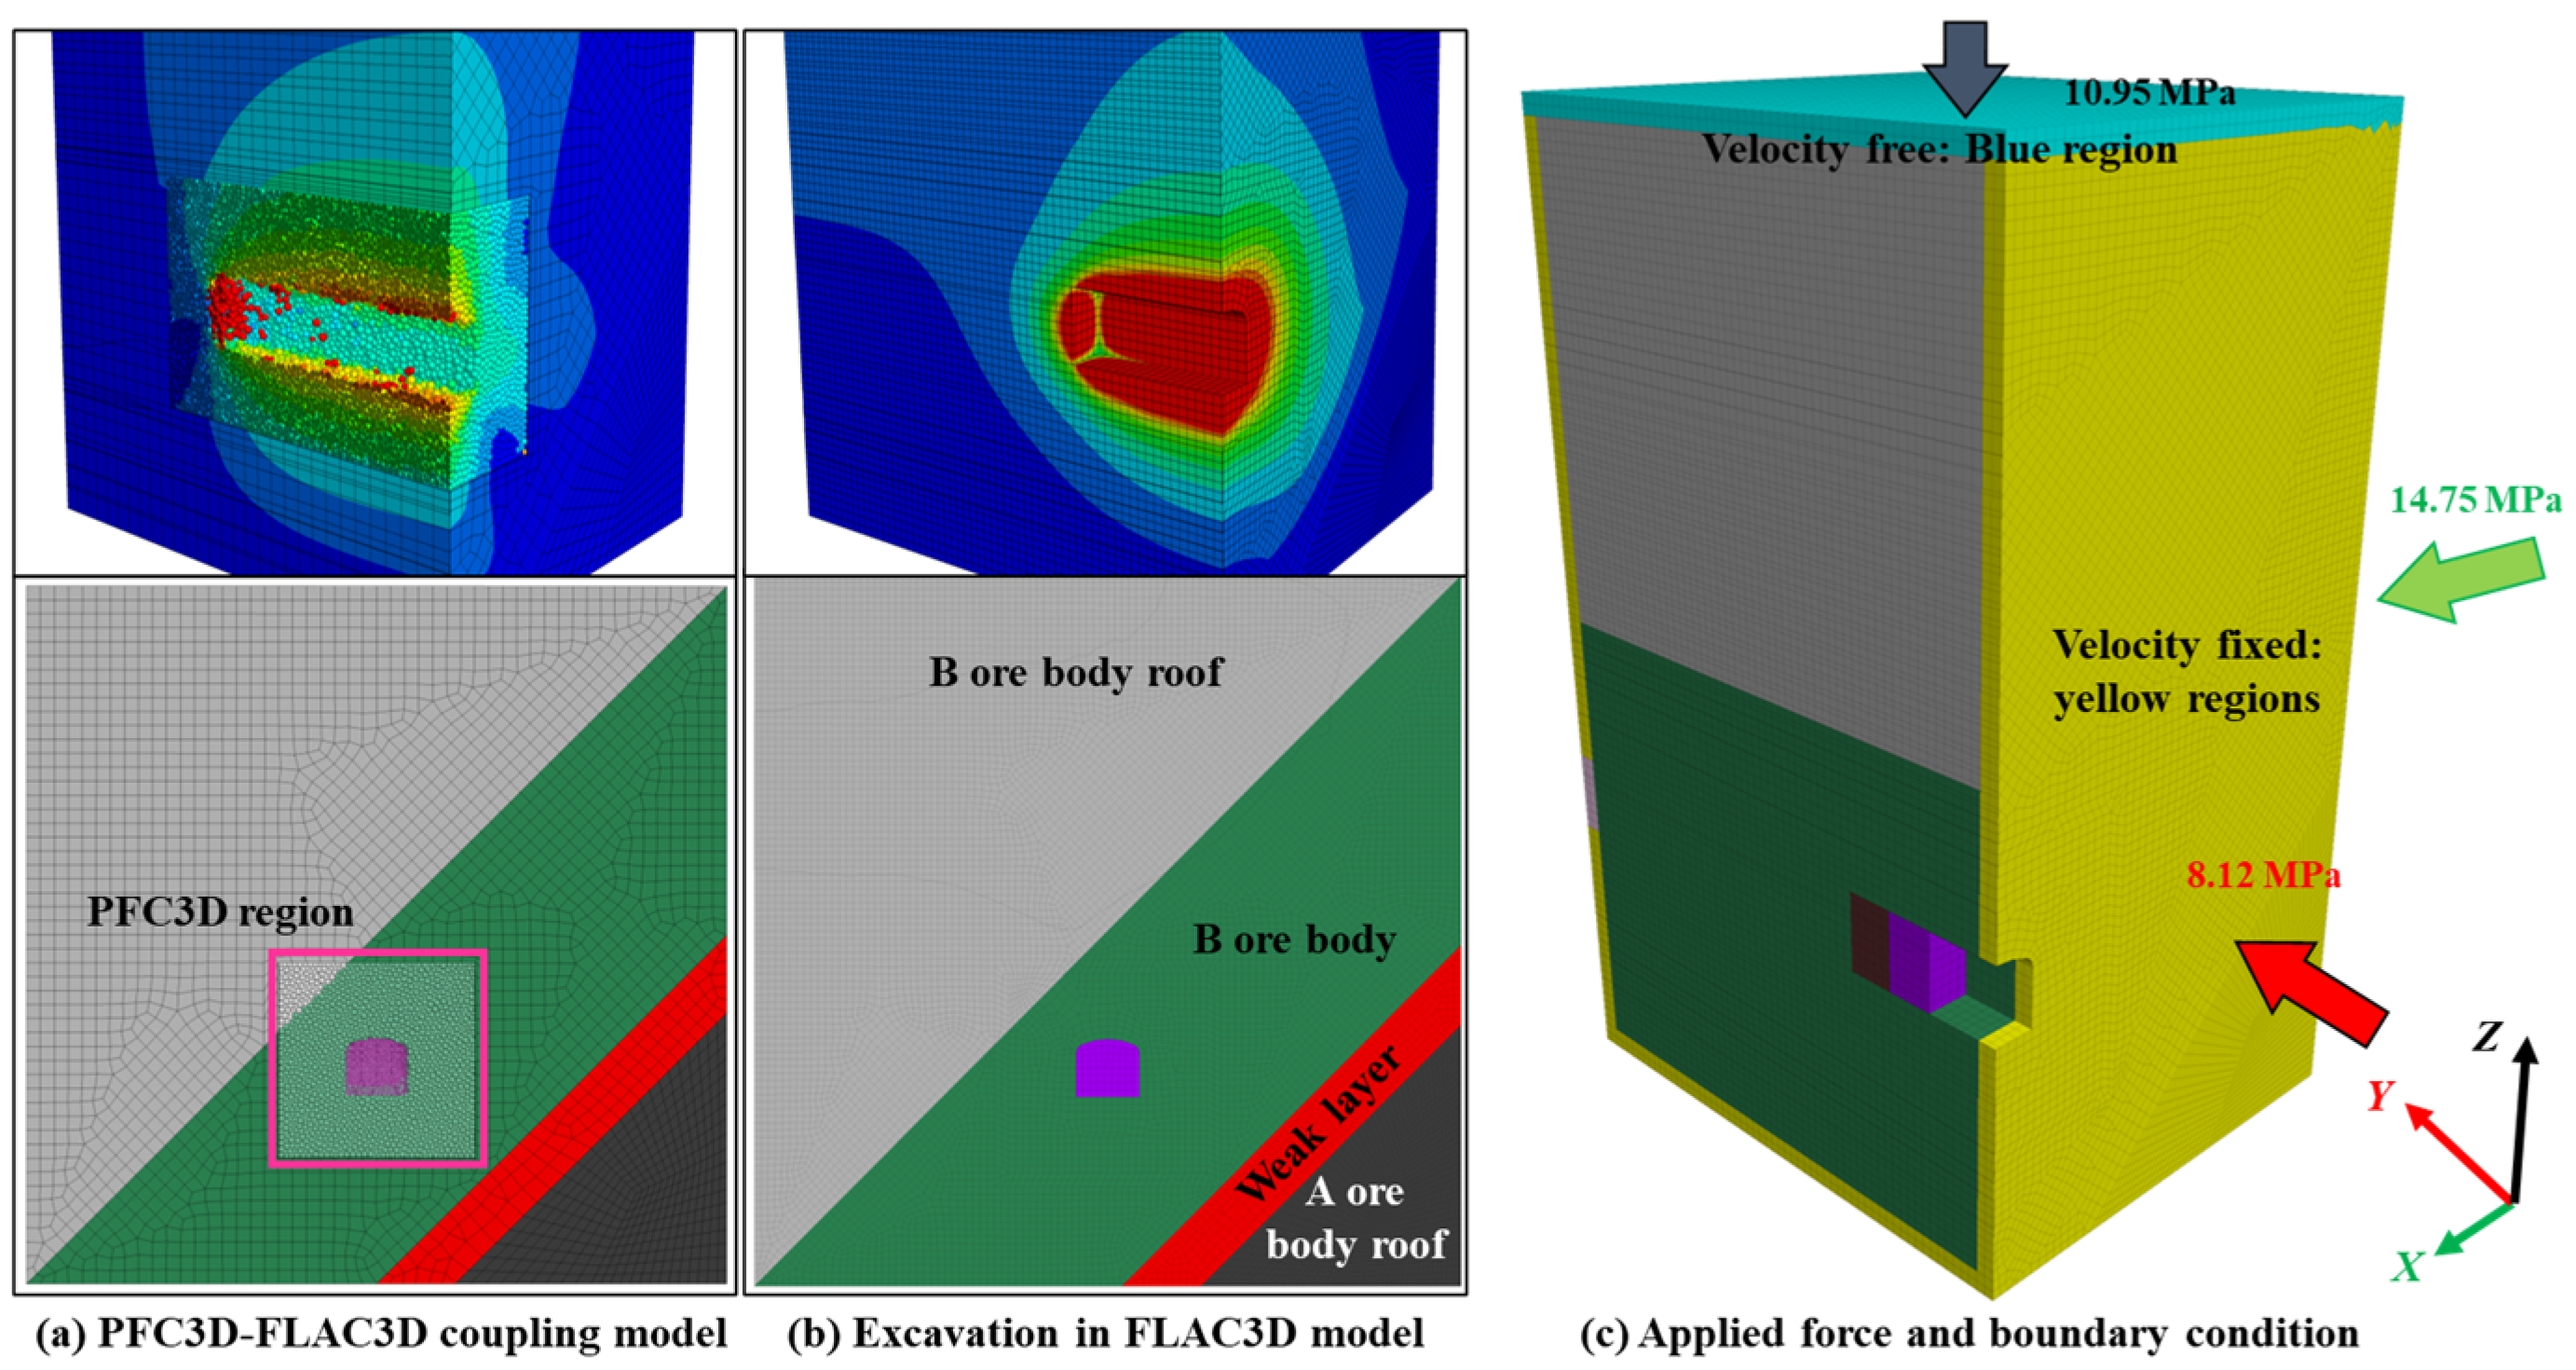
For the engineering context of this project, the Dem model domain is defined with dimensions of 14 m × 14 m × 20 m (length × height × depth), whereas the surrounding FEM model is set to 50 m × 50 m × 80 m. The DEM and FEM models are combined by the ‘wall zone create’ command in the software. The resulting coupled model is illustrated in Figure 2a. In this configuration, the tunnel is situated within the relatively stable A orebody, which is overlain by a weak interlayer and then the B orebody. The stratum exhibits a dip angle of 45°, with the tunnel orientation parallel to the orebody strike. The velocities of zone block horizontal surface and bottom surface is fixed, and the true-triaxial compressive stress are applied on the horizontal and top boundaries (Figure 2c).
For comparison, we still employ the FLAC3D model to establish a tunnel excavation model in inclined strata and completes the excavation process using conventional simulation methods (Figure 2b), and the main parameters are listed in Table 2. In addition, the maximum mesh length of the coupling model is 1 m and the mesh length of the FLAC3D model is squeezed to 0.5 mm to adapt the excavation boundary of the tunnel.
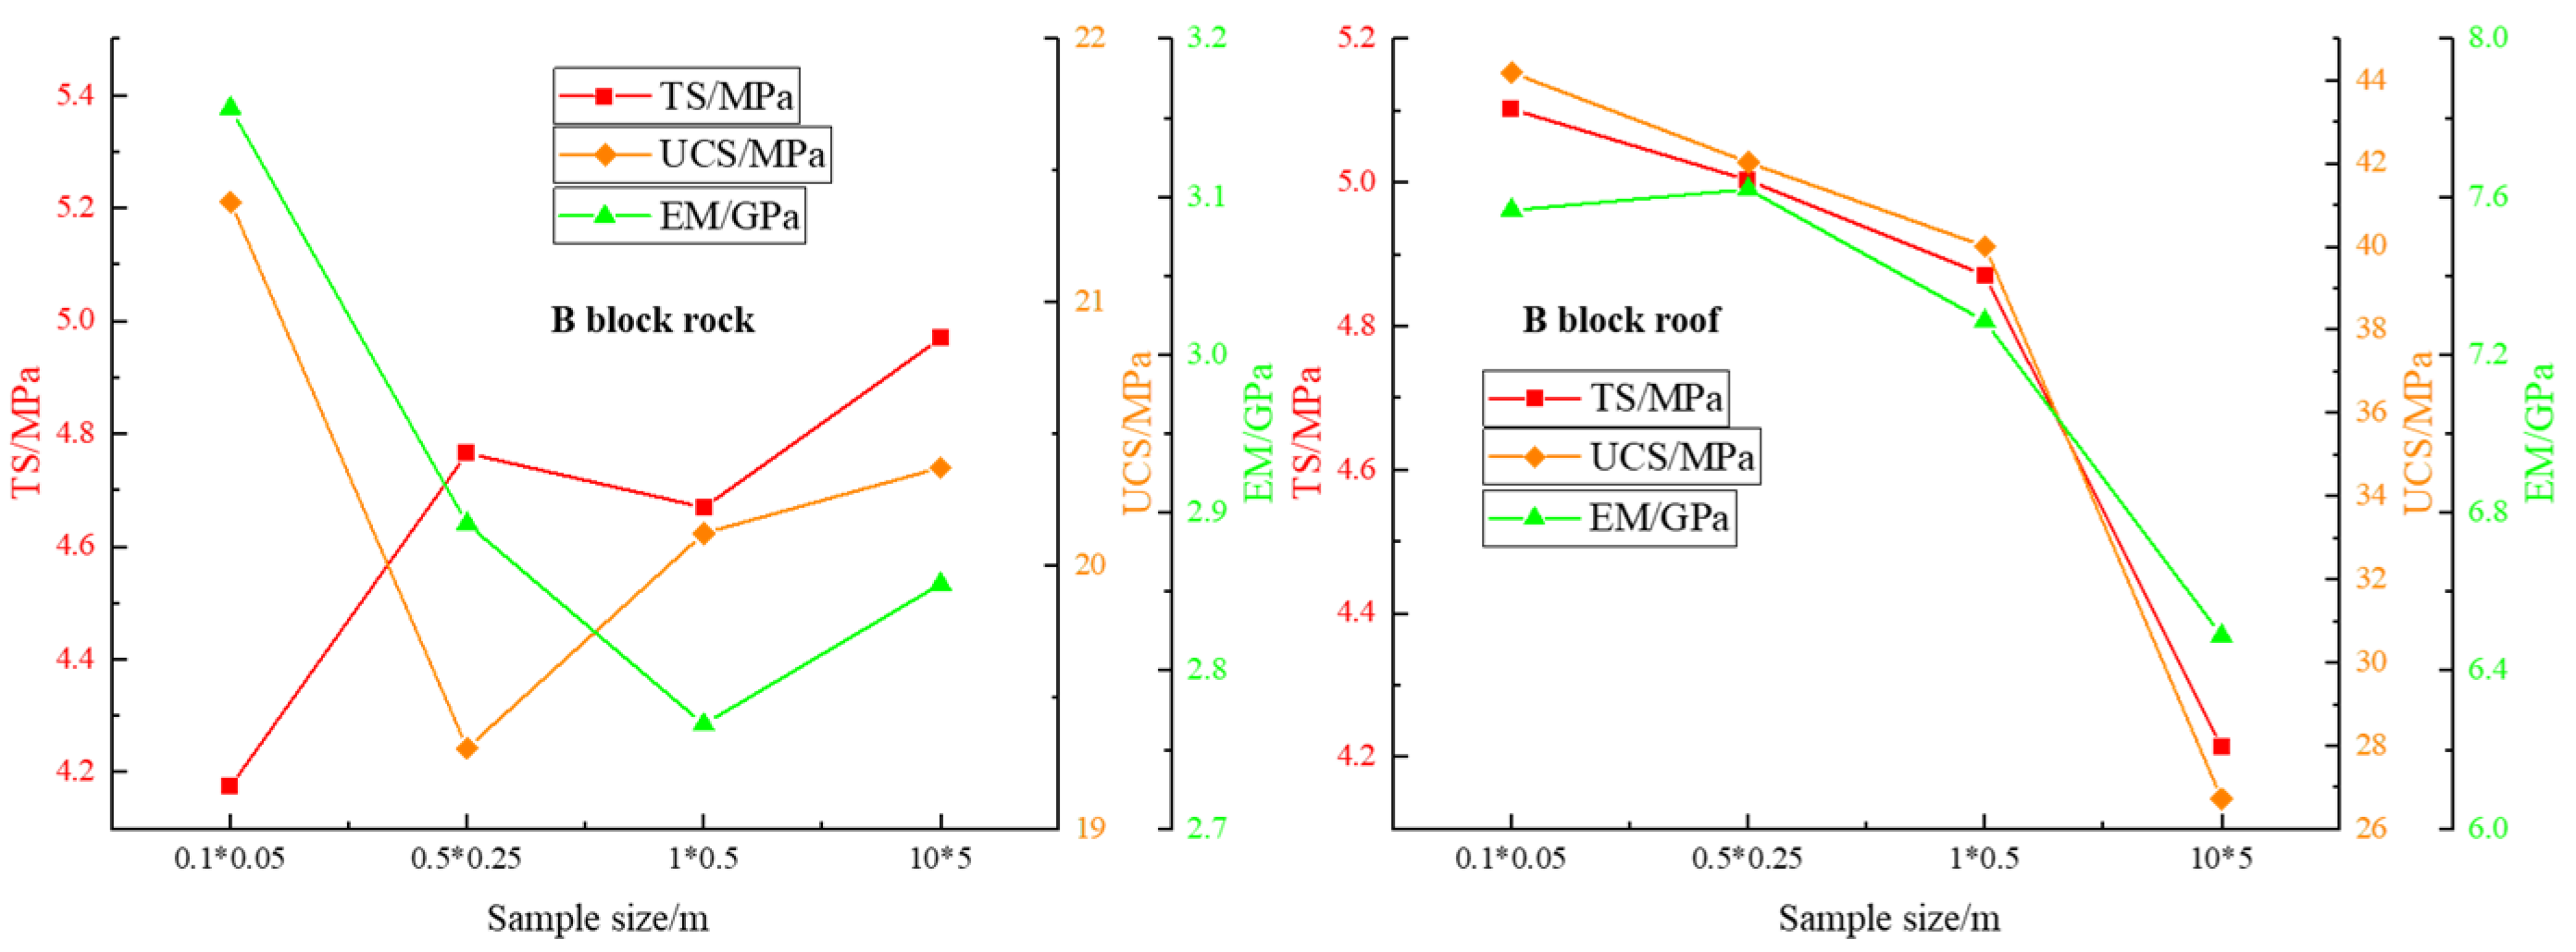
The PFC3D modeling employed a parallel-bonded constitutive model to simulate the near-field surrounding rock, with the macroscopic rock mass parameters calibrated using a trial-and-error procedure [21,22]. The resulting microscopic particle parameters are summarized in Table 3. Calibration was conducted in accordance with ISRM-recommended laboratory tests, including uniaxial compression and direct tensile tests. Because the PFC3D calibrations are based on standard ISRM samples, extending the parameters to engineering scales may reduce rock mass strength to varying degrees. To address this, five sets of simulations were performed to verify the strength characteristics of the PFC rock model at different scales. The corresponding statistical curves are presented in Figure 3. The automatic mechanical time-step is applied in the numerical models, and the balance average-ratio is 1 × 10⁻⁵ to achieve a stable status.

2.3. Simulation of Excavation and Supporting System

Due to the limitations of the surrounding rock conditions and equipment cutting depth, the excavation cycle footage is 2.5 m, and the support structures are installed immediately after excavation. The current tunnel in the numerical model adopts a “disturbance free” excavation mode (simulated by the ‘model null’ command), and, after excavation, it runs for 3000 steps before installing the anchor rod system, and then calculates the equilibrium. After the calculation is completed, reset the displacement and velocity to zero, and a new stage of mechanical excavation simulation can be carried out.
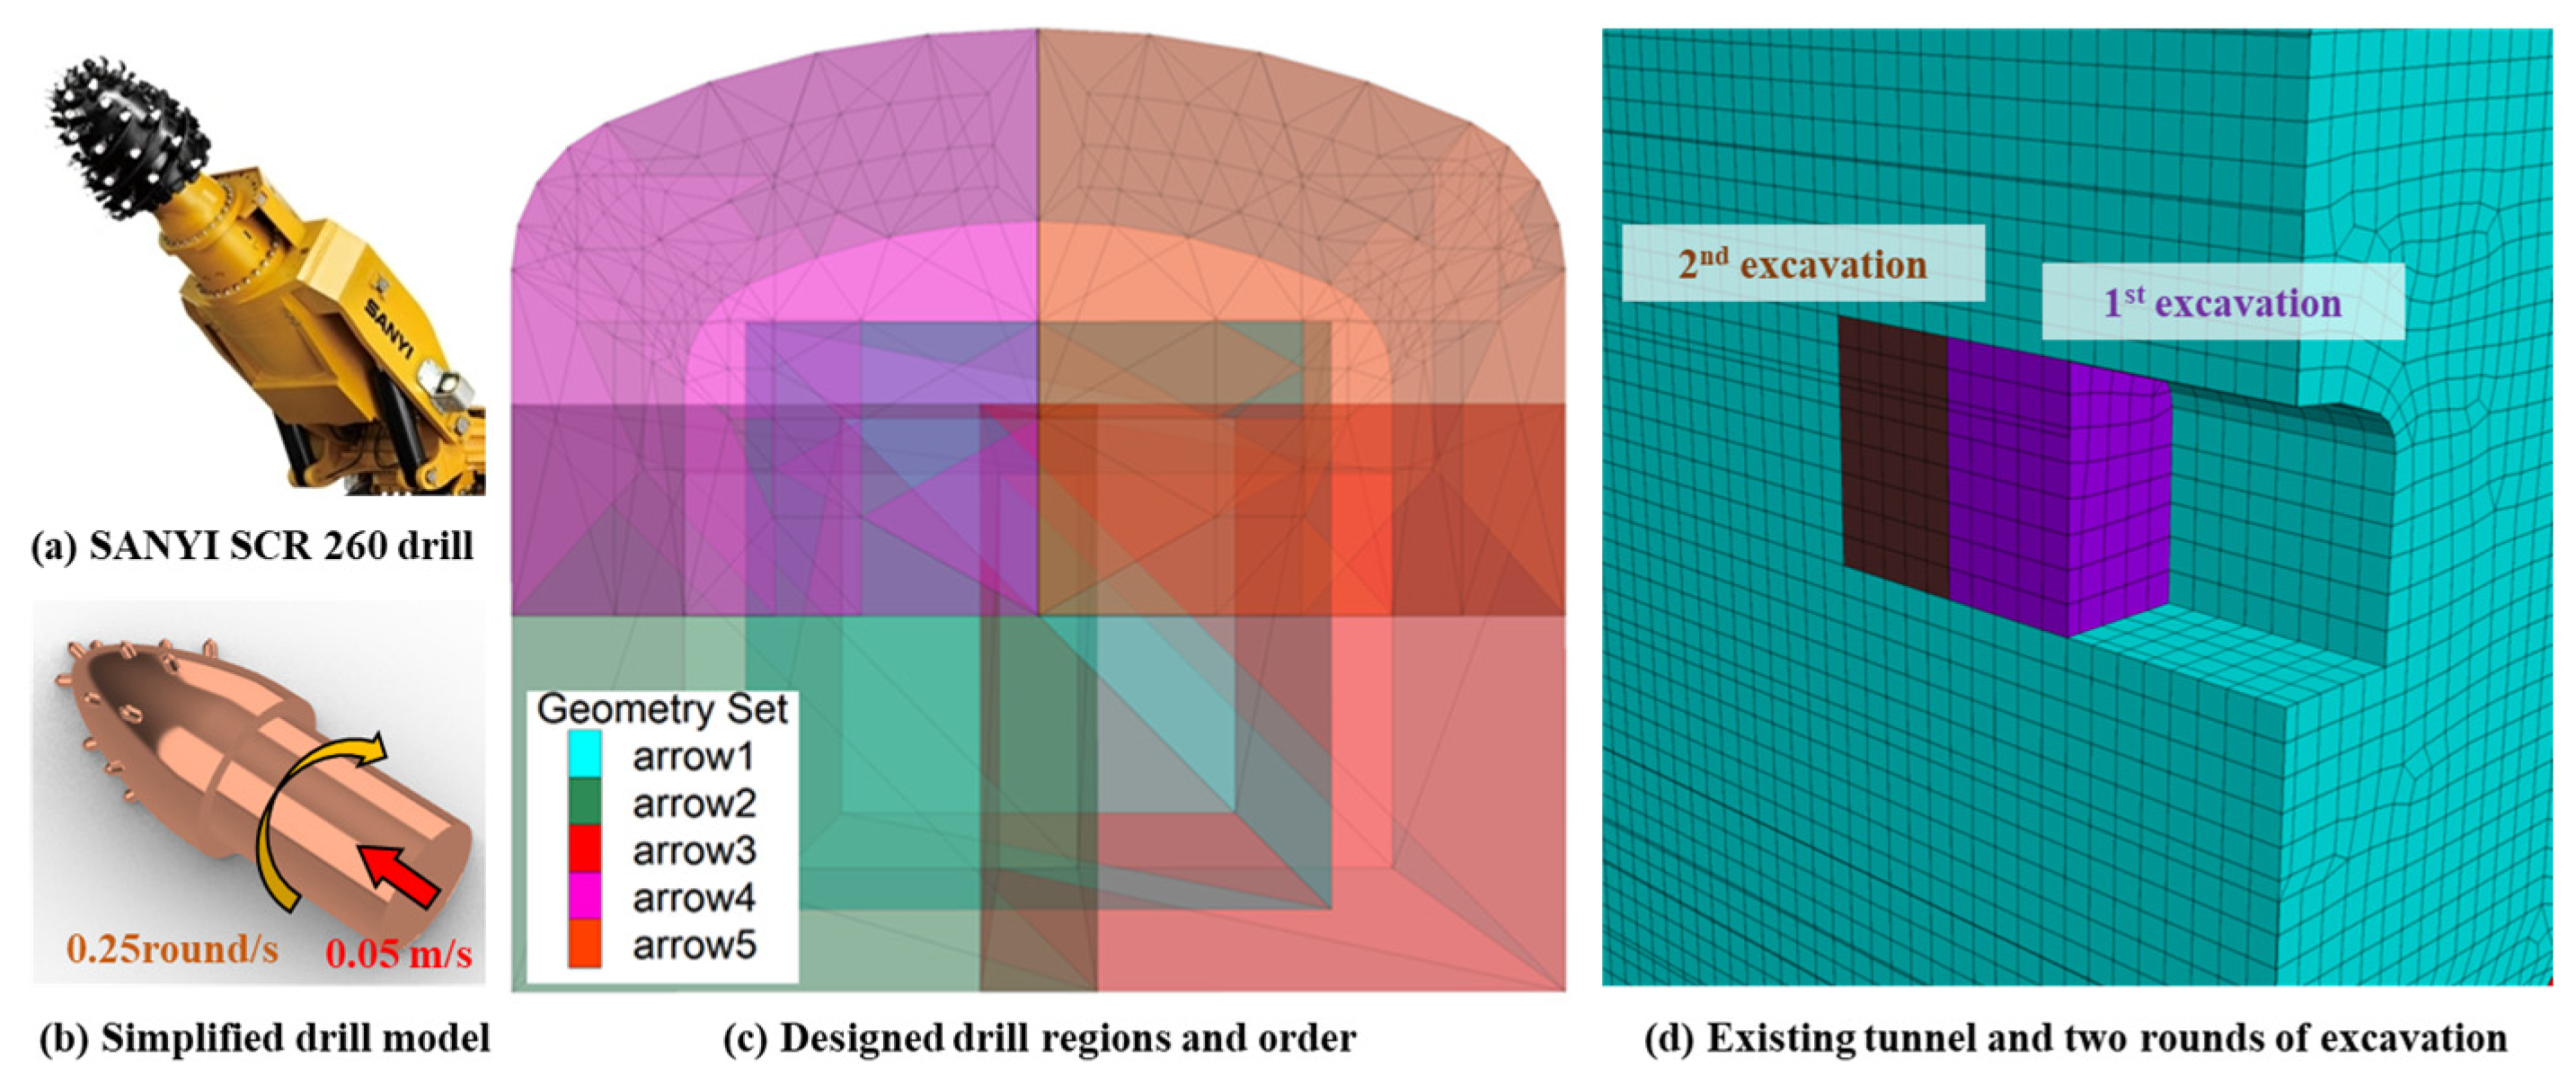
For the FLAC3D-PFC3D coupling model, to simulate the mechanical rock-breaking process during tunnel excavation, a simplified three-dimensional drill-bit model was constructed (same size with fewer cutting heads), and the model was saved in STL format; we imported the geometry model into PFC3D and defined it as a wall, then applied the axial velocity (0.05 m/s) and clockwise rotation (0.25 round/s) to reproduce the rock-squeezing and fragmentation process (Figure 4). In a mechanical tunnel excavation, the cutting sequence is critical. To replicate a staged excavation, five partially overlapping zones were defined, with the excavation proceeding from the center toward the periphery. The zoning and sequence are illustrated in Figure 4c. At this stage, the tunnel adopts a three-center-arch cross-section, with a width of 4.5 m and a height of 4.1 m. The length of existing tunnel is 4 m, the footage of new excavation is 2.5 m, and the two rounds of excavation are finished.
The simulation method of the anchor rod used in the numerical study directly impacts the research conclusion, such as the dynamic response [2,3], deformation feature [23,24], and shear and energy absorption capacity [25]. Two primary approaches are applied in PFC3D for simulating the anchor rod system: (1) the “composite particle anchor rod,” formed by bonded particle chains, and (2) the hybrid bolt method, based on ITASCA structural elements. Hybrid bolt elements directly establish the contacts between the anchor rods and the surrounding rock particles, allowing for an efficient representation of the anchoring systems and a substantial reduction in modeling complexity. When simulating the rock bolts intersecting joints or structural planes, the cable elements provide shear resistance and reproduce the mechanical behavior of the bolts. The parameters of the cable units used in this study are summarized in Table 4.

3. Tunnel Stability Analysis Based on a Traditional FLAC3D Simulation

3.1. Physical Responses During the Excavation

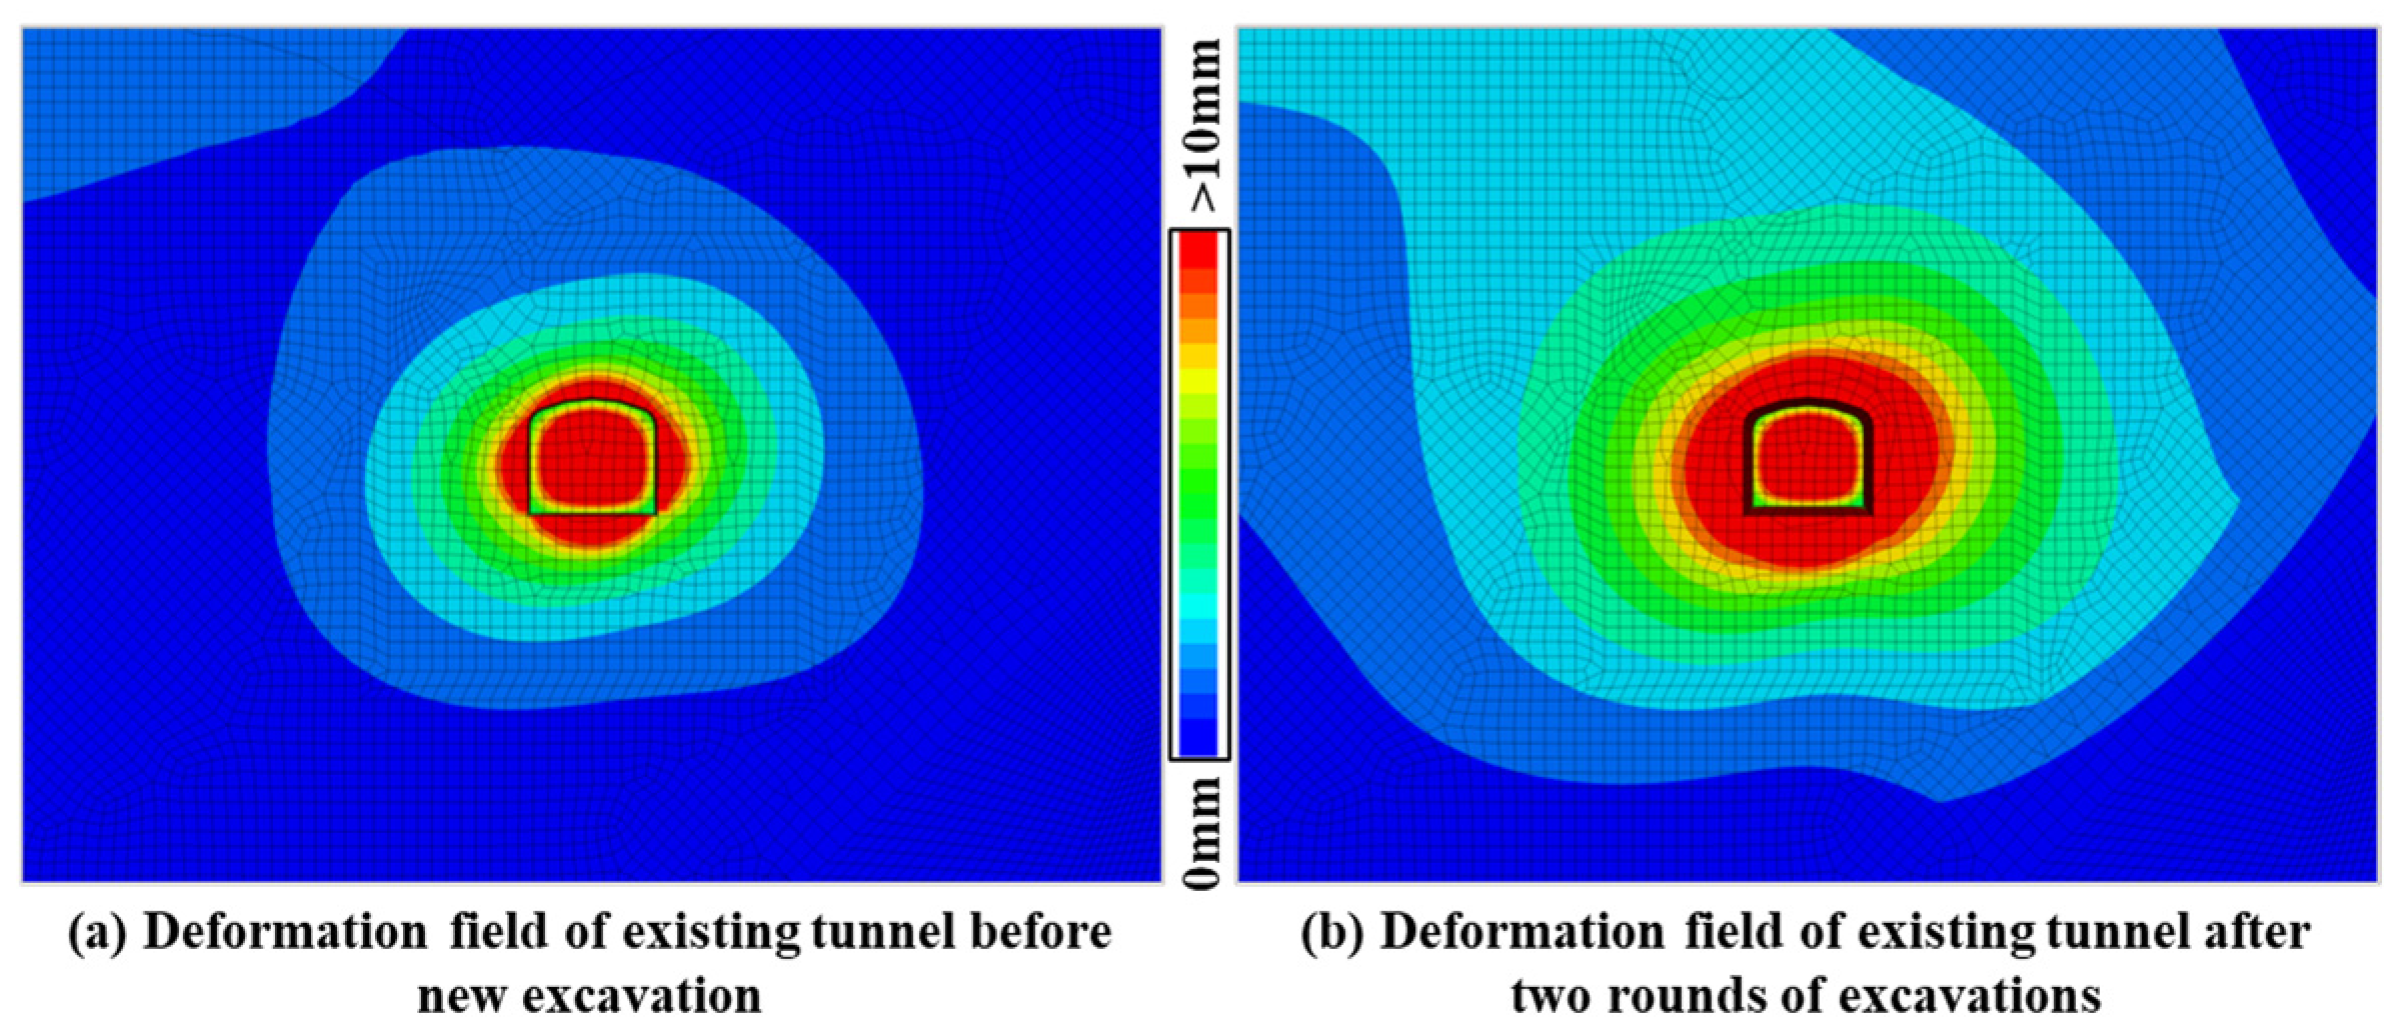
The displacement field and displacement vector state of the tunnel simulated using FLAC3D are shown in Figure 5 and Figure 6. From Figure 5, it can be seen that, although there is a significant dip angle in the rock strata, the deformation of the surrounding rock of the tunnel is relatively uniform, showing an approximately concentric elliptical distribution within two times the tunnel diameter (in the green area in the figure); only after the excavation of the new tunnel is completed does the far-field surrounding rock show a clear straight boundary line in the lower right corner of the tunnel, and the deformation in the upper left corner of the tunnel is slightly greater than that in the upper right corner.
The above phenomenon occurs because the model is under true triaxial loading conditions, and the effect of discontinuous surfaces is weakened by triaxial compressive stress, resulting in approximately uniform material properties.
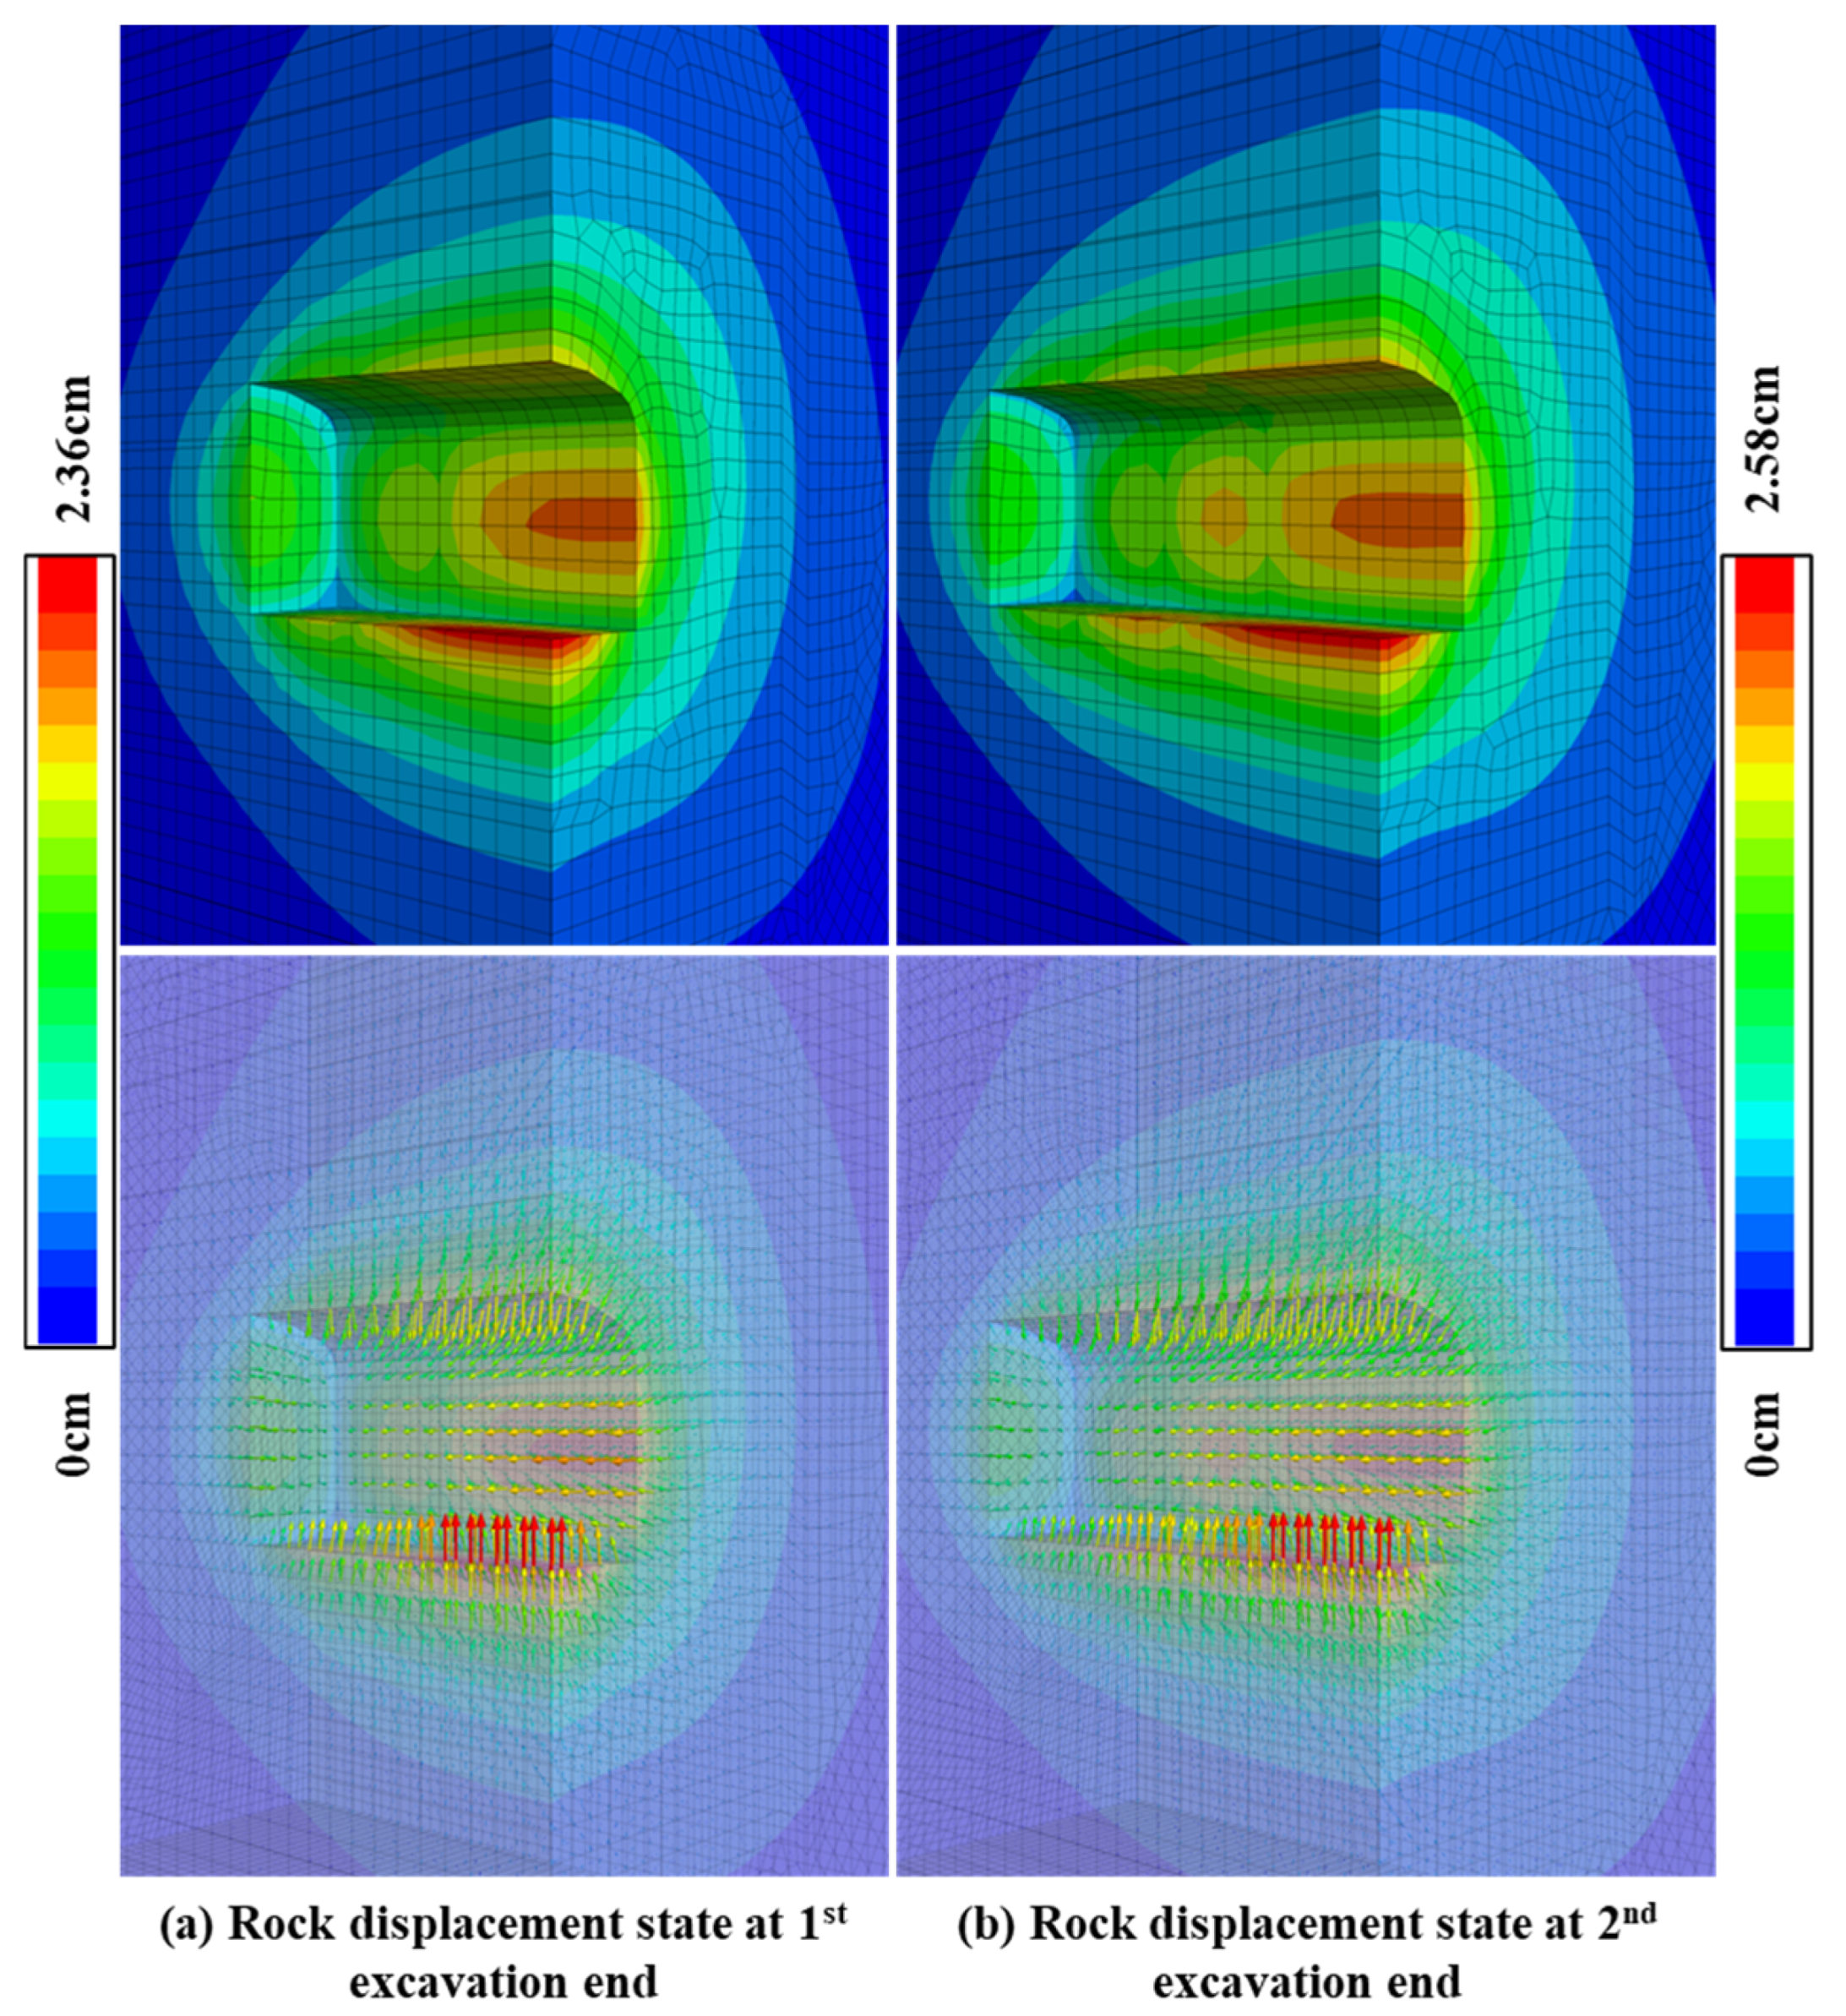
Due to the horizontal symmetry of the near-field displacement, Figure 6 selects the displacement field on the right half of the tunnel for discussion. On the left side of Figure 6, the state of the tunnel at the end of the first excavation is shown. Currently, the peak deformation of the tunnel occurs at the bottom plate position of the existing tunnel, corresponding to a value of 2.36 cm. At the same time, there is also significant deformation in the middle of the side wall, showing a similar rod-shaped distribution from the center to the outside; the deformation of the surrounding rock at the position of the tunnel face is relatively small, and the surrounding rock is in a stable state. When both excavations are completed, the peak deformation of the tunnel still occurs in the existing tunnel (but the increase in deformation is relatively small, less than 10%); there is a significant amount of deformation at the center of the first excavation area (the orange circular area in the center of Figure 6b, as well as the position of the tunnel floor); similarly, the tunnel face still maintains a small deformation, and the entire tunnel is in a safe state.
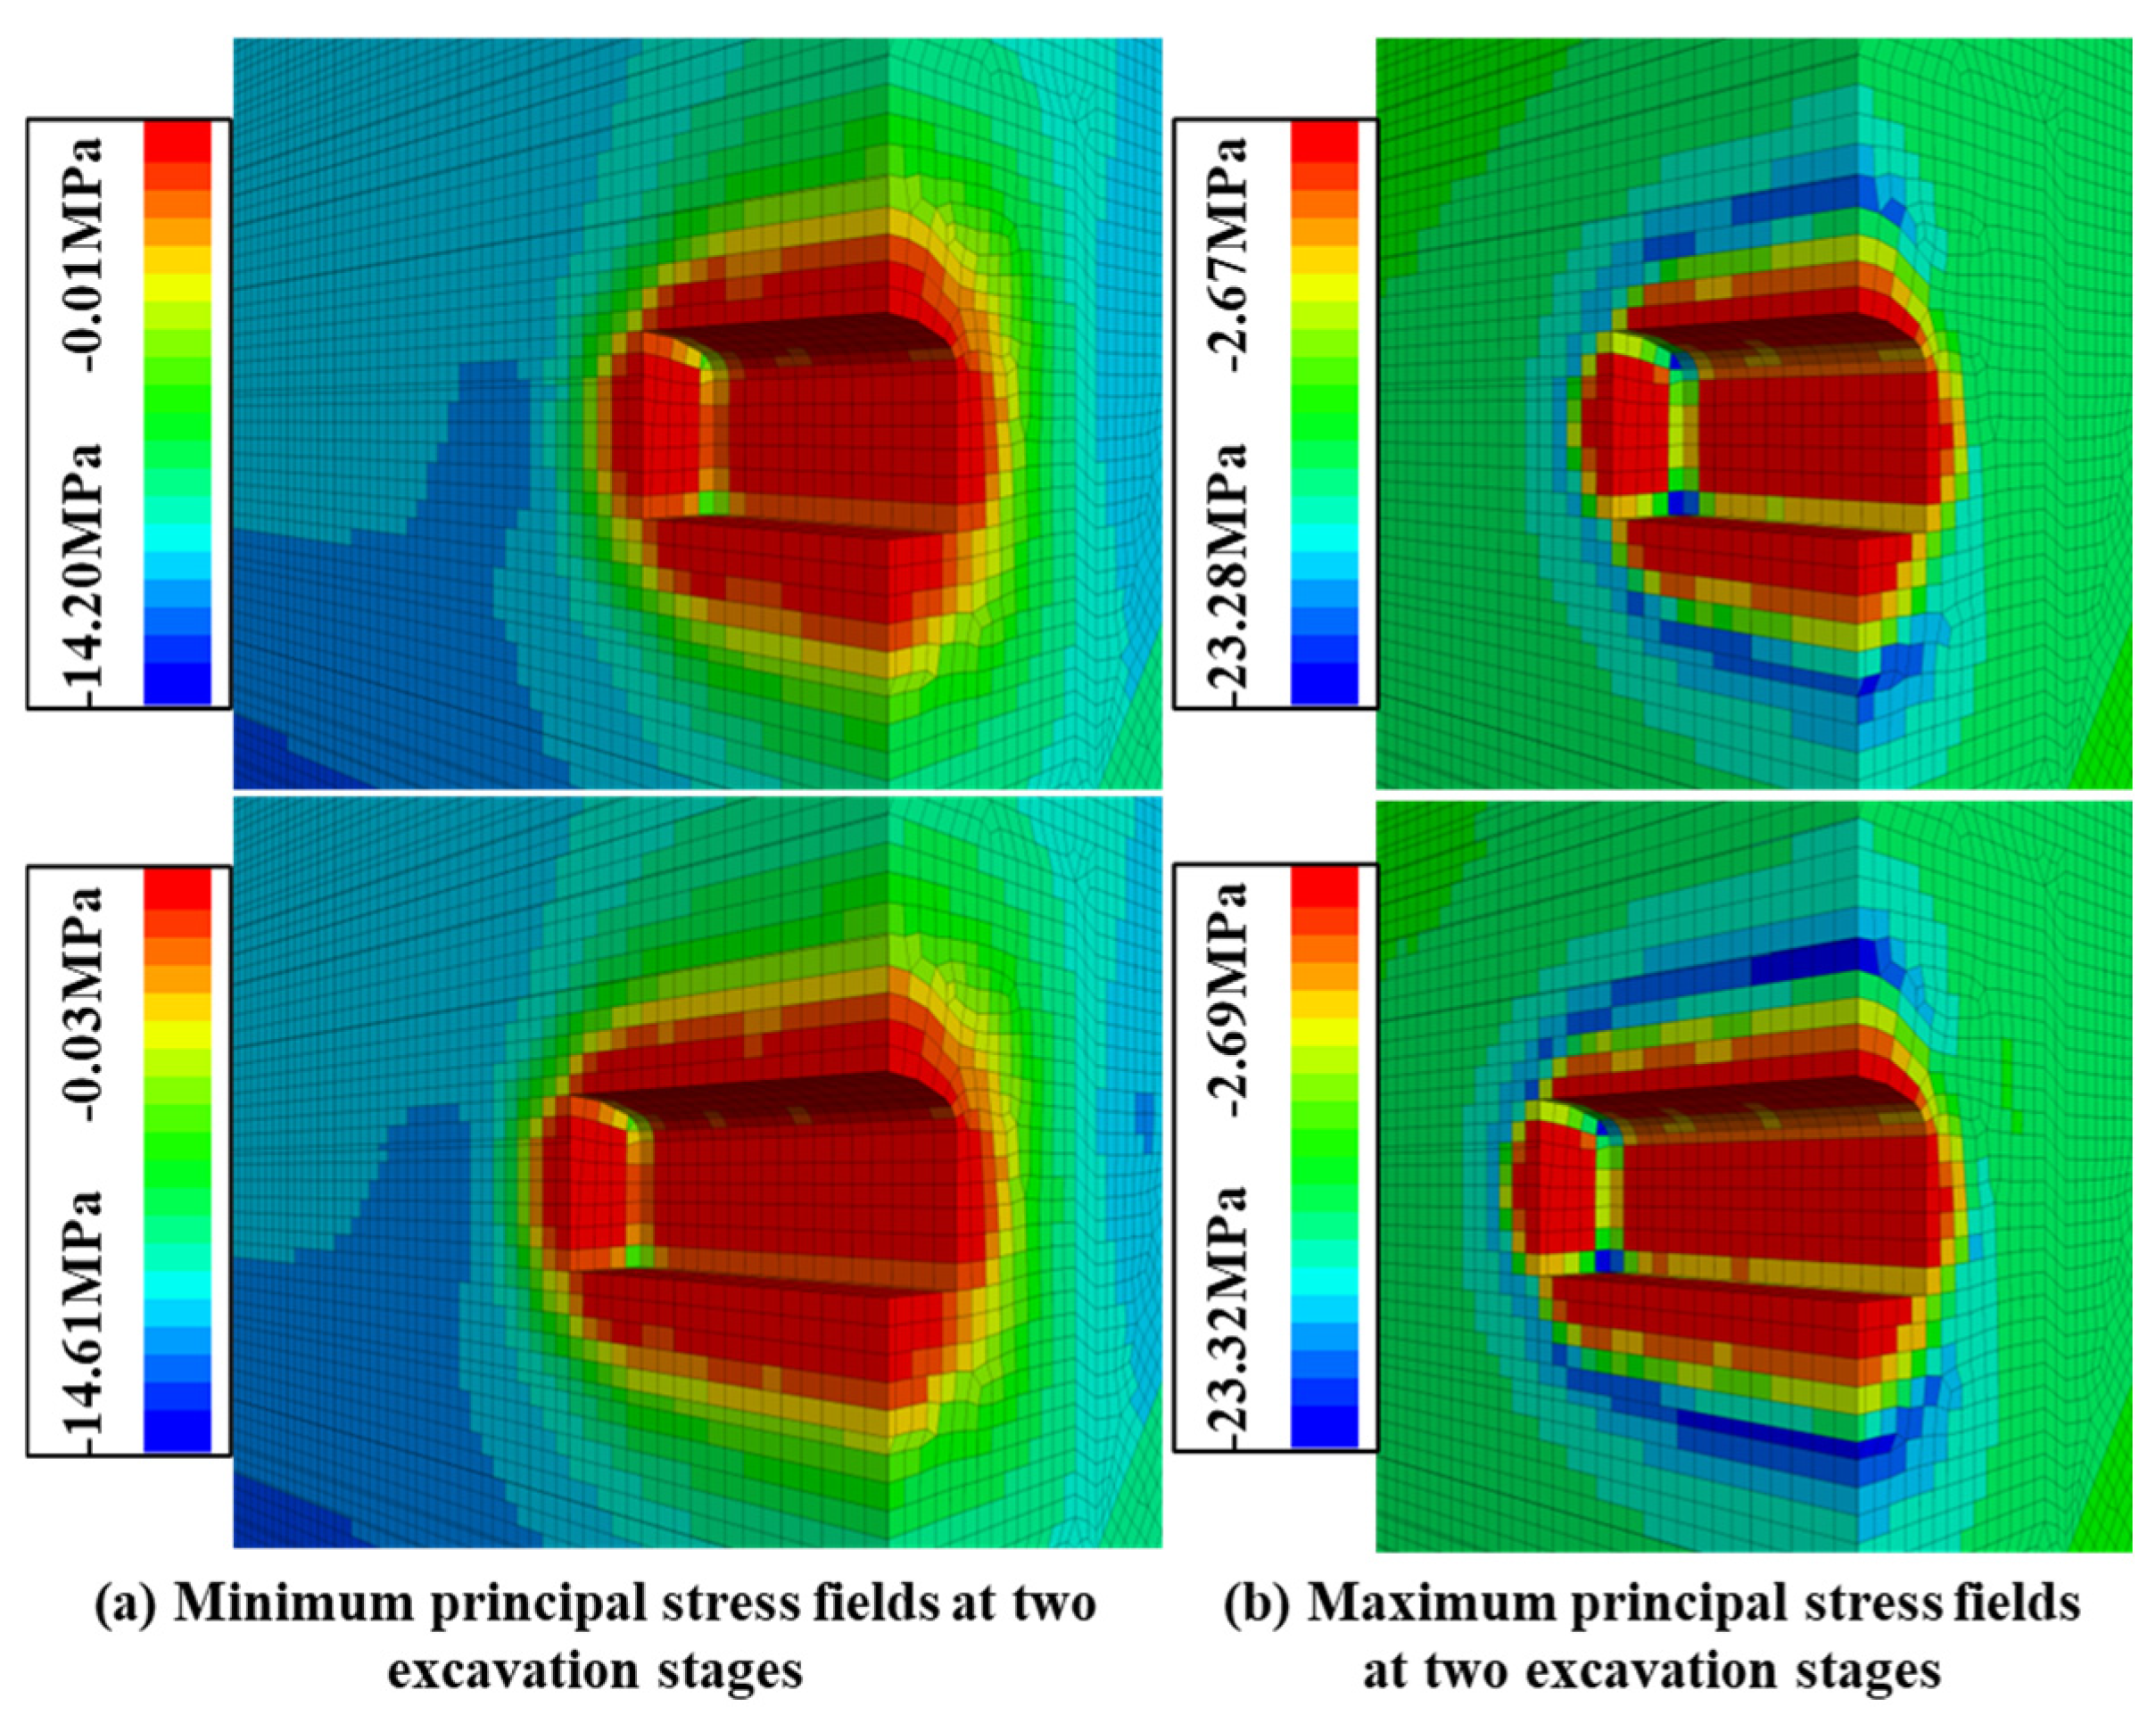
The principal stress state is also an important basis for evaluating the safety status of tunnel surrounding rock. Figure 7 shows the distribution of the maximum and minimum principal stress fields of the surrounding rock after two excavations. It can be inferred that, after the tunnel reaches a stable state, the minimum principal stress remains relatively low in the circumferential surrounding rock with a thickness of 2–3 m, corresponding to a stress value below 2 MPa; the rock mass on the front face presents a low stress zone that is approximately hemispherical in shape, with a thickness of about 1.5–2 m; the minimum principal stress at the boundary of the front face is significantly higher than at other locations (shown in yellow, with a value higher than 4 MPa).
On the other hand, the maximum principal stress also shows a lower value (less than 5 MPa) in the circumferential surrounding rock, with a thickness of about 1 m, and the area of the low stress zone at the top and bottom of the tunnel is larger than that at the side walls, which may be related to the maximum far-field stress in the x-direction; the maximum principal stress in the middle of the tunnel front face is generally lower than 5 MPa, but there is a significant stress concentration phenomenon at the front face boundary, especially at the corner position (exceeding 15 MPa). Combined with the minimum principal stress state, it can be concluded that the corner position of the front face is a relatively dangerous area. There is a local stress accumulation phenomenon in the tunnel outside the loose zone (peak value exceeding 20 MPa), which is the blue area within 3–5 m outside the surrounding rock at the top and bottom of the tunnel; this phenomenon also occurs in front of the excavation face (forming a hemispherical area), but the peak stress (exceeding 10 MPa) is lower than the peak stress inside the surrounding rock in the circumferential direction, further returning the stress state of the rock mass to the far-field stress level.
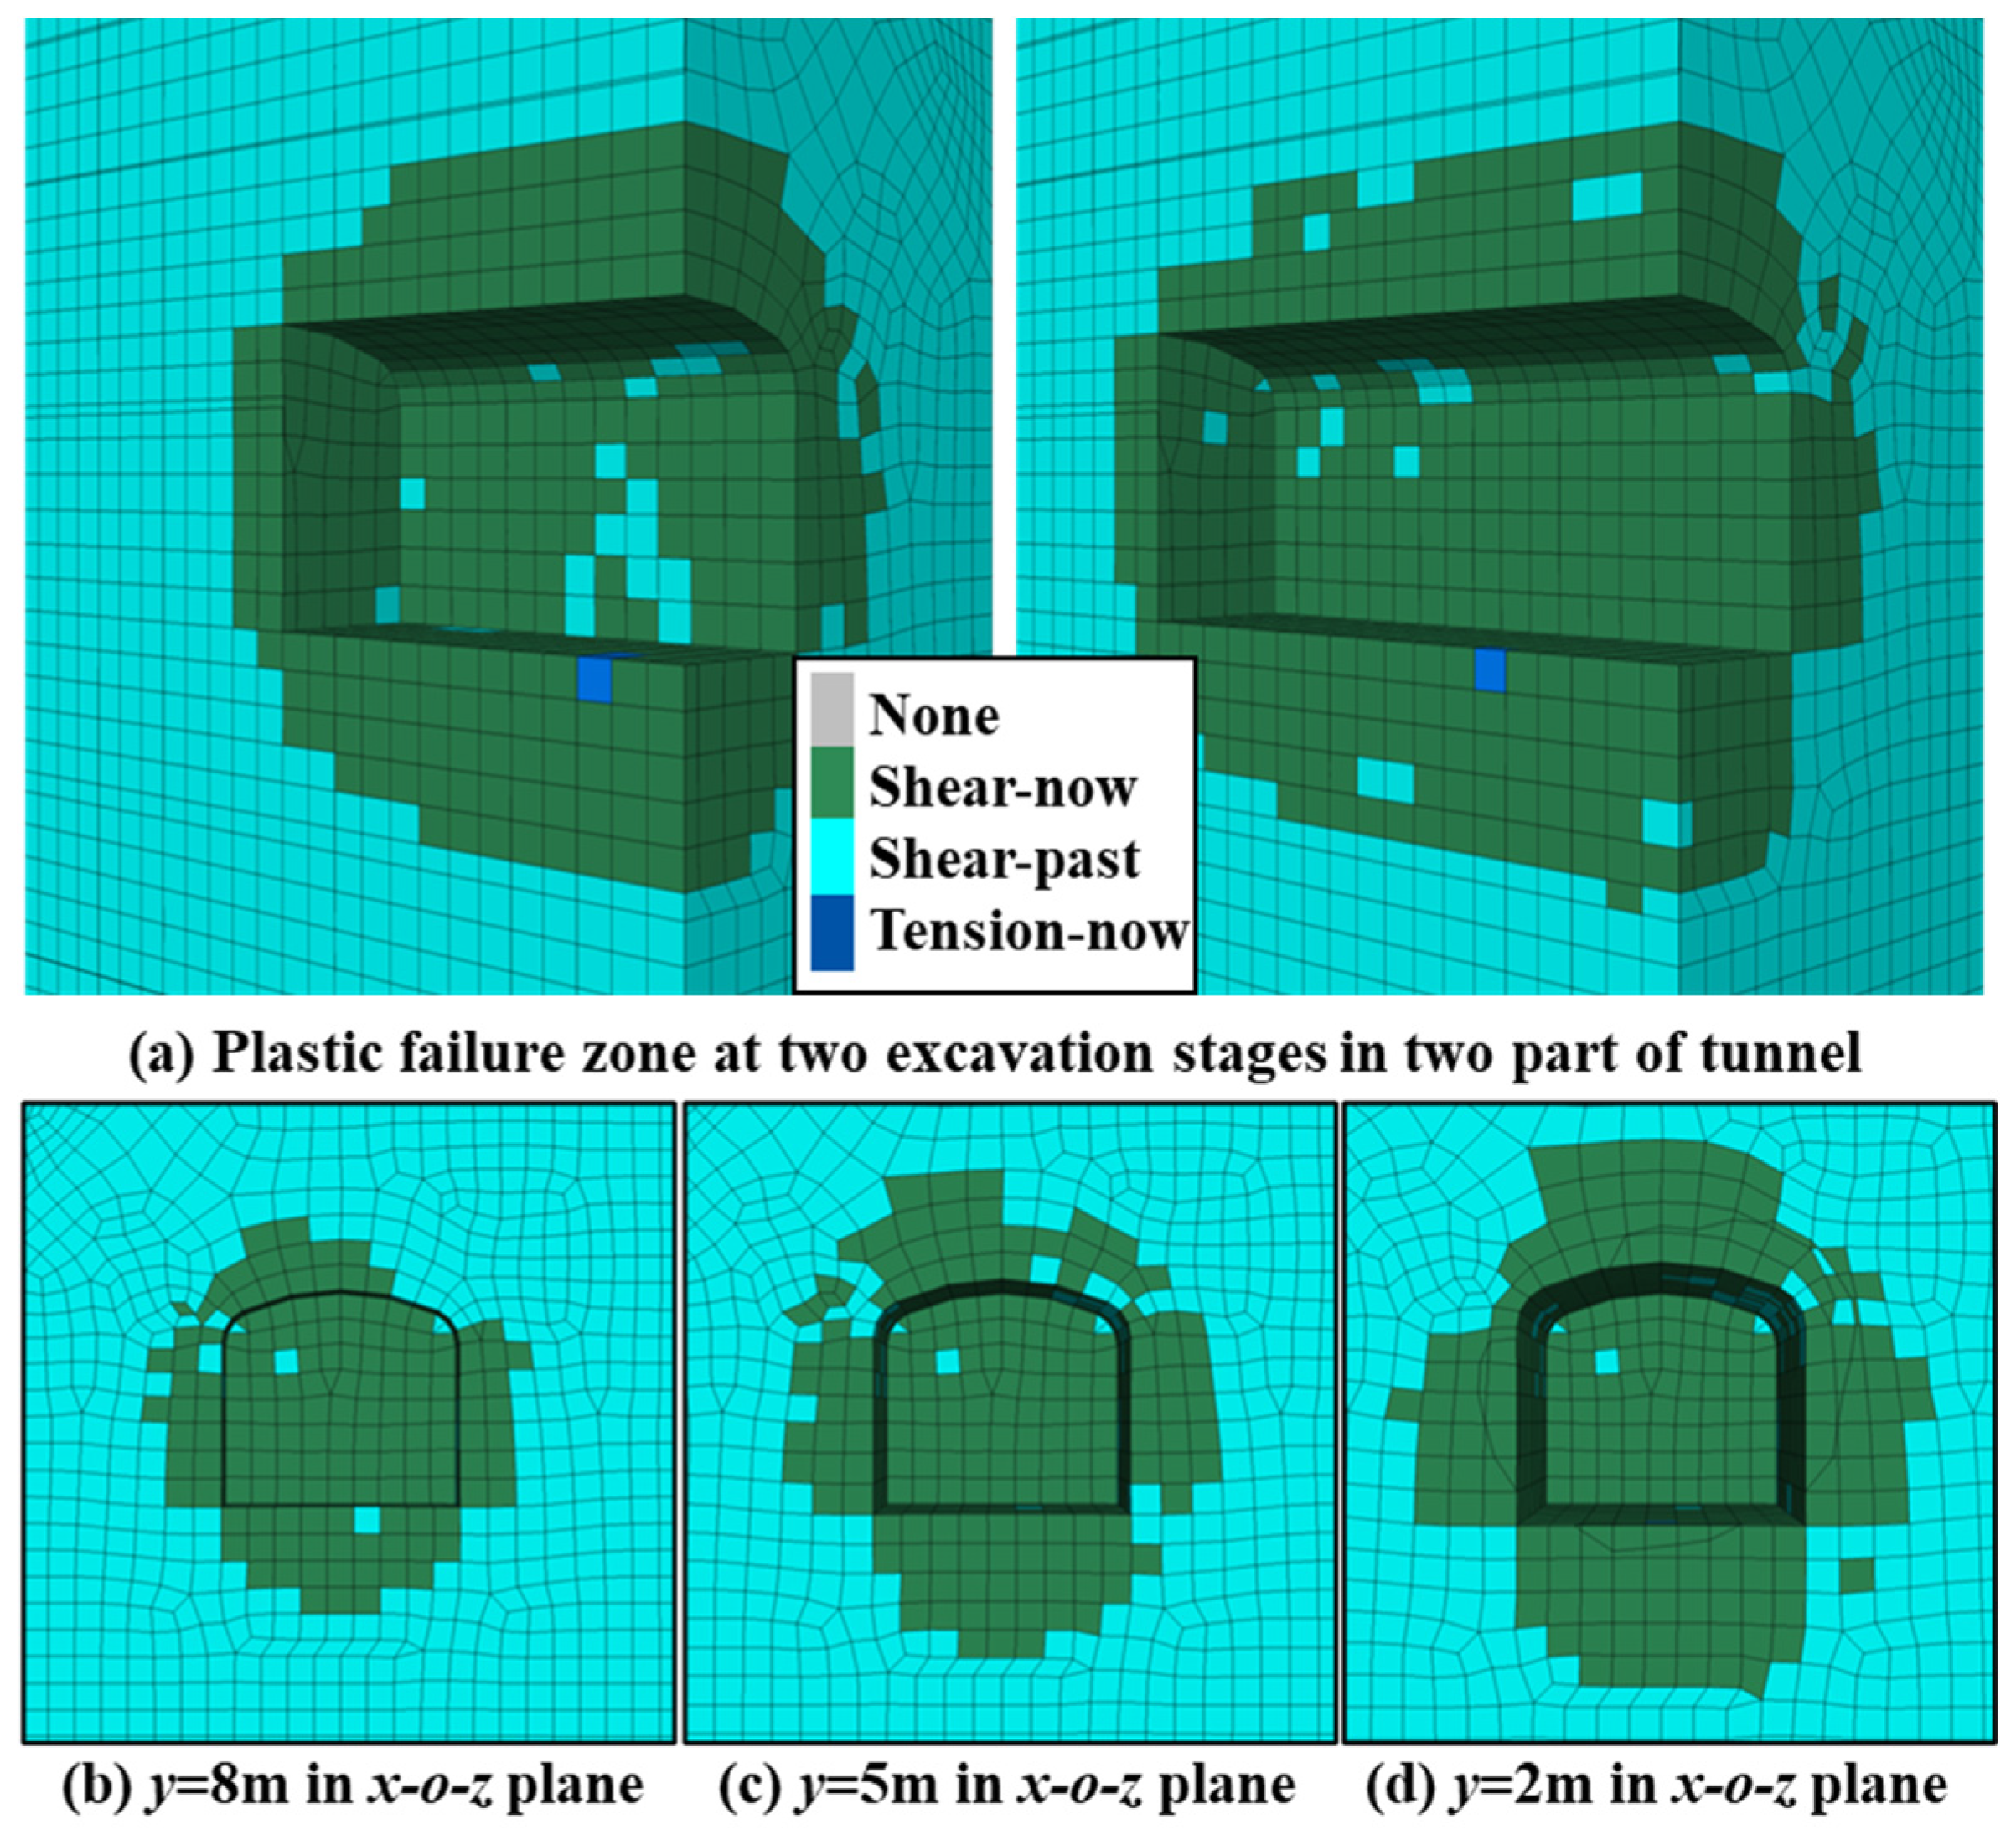
Figure 8 shows the distribution of the plastic zones obtained by FLAC3D. There is a shear failure zone in the surrounding rock, with a thickness of 2.5 m at the bottom of the tunnel and 2.0 m at the top. The thickness of the side wall is the smallest (average 1.5 m). When approaching the free surface of the tunnel, the range of the secondary damage zone rapidly shrinks and stops at the boundary of the face, and the overall distribution of the area is conical (Figure 8b–d). The thickness of the rock mass failure zone in front of the excavation face is relatively small (with an average thickness of 1 m), and the thickness of the failure zone at different positions remains basically unchanged. In addition, sporadic tensile failure zones appeared at the bottom of the constructed tunnel.
Based on the distribution characteristics of the deformation, stress, and plastic zone mentioned above, it can be concluded that the secondary damage distribution range of the tunnel after completing “undisturbed” excavation is about 2–3 m in the circumferential direction, with the maximum damage range being the bottom plate and the minimum damage range being the side wall. In addition, the damage area of the excavation face is relatively small, and the stress and deformation are low, which proves that the front tunnel surface is in a safe state.

3.2. Responses of the Structural Elements

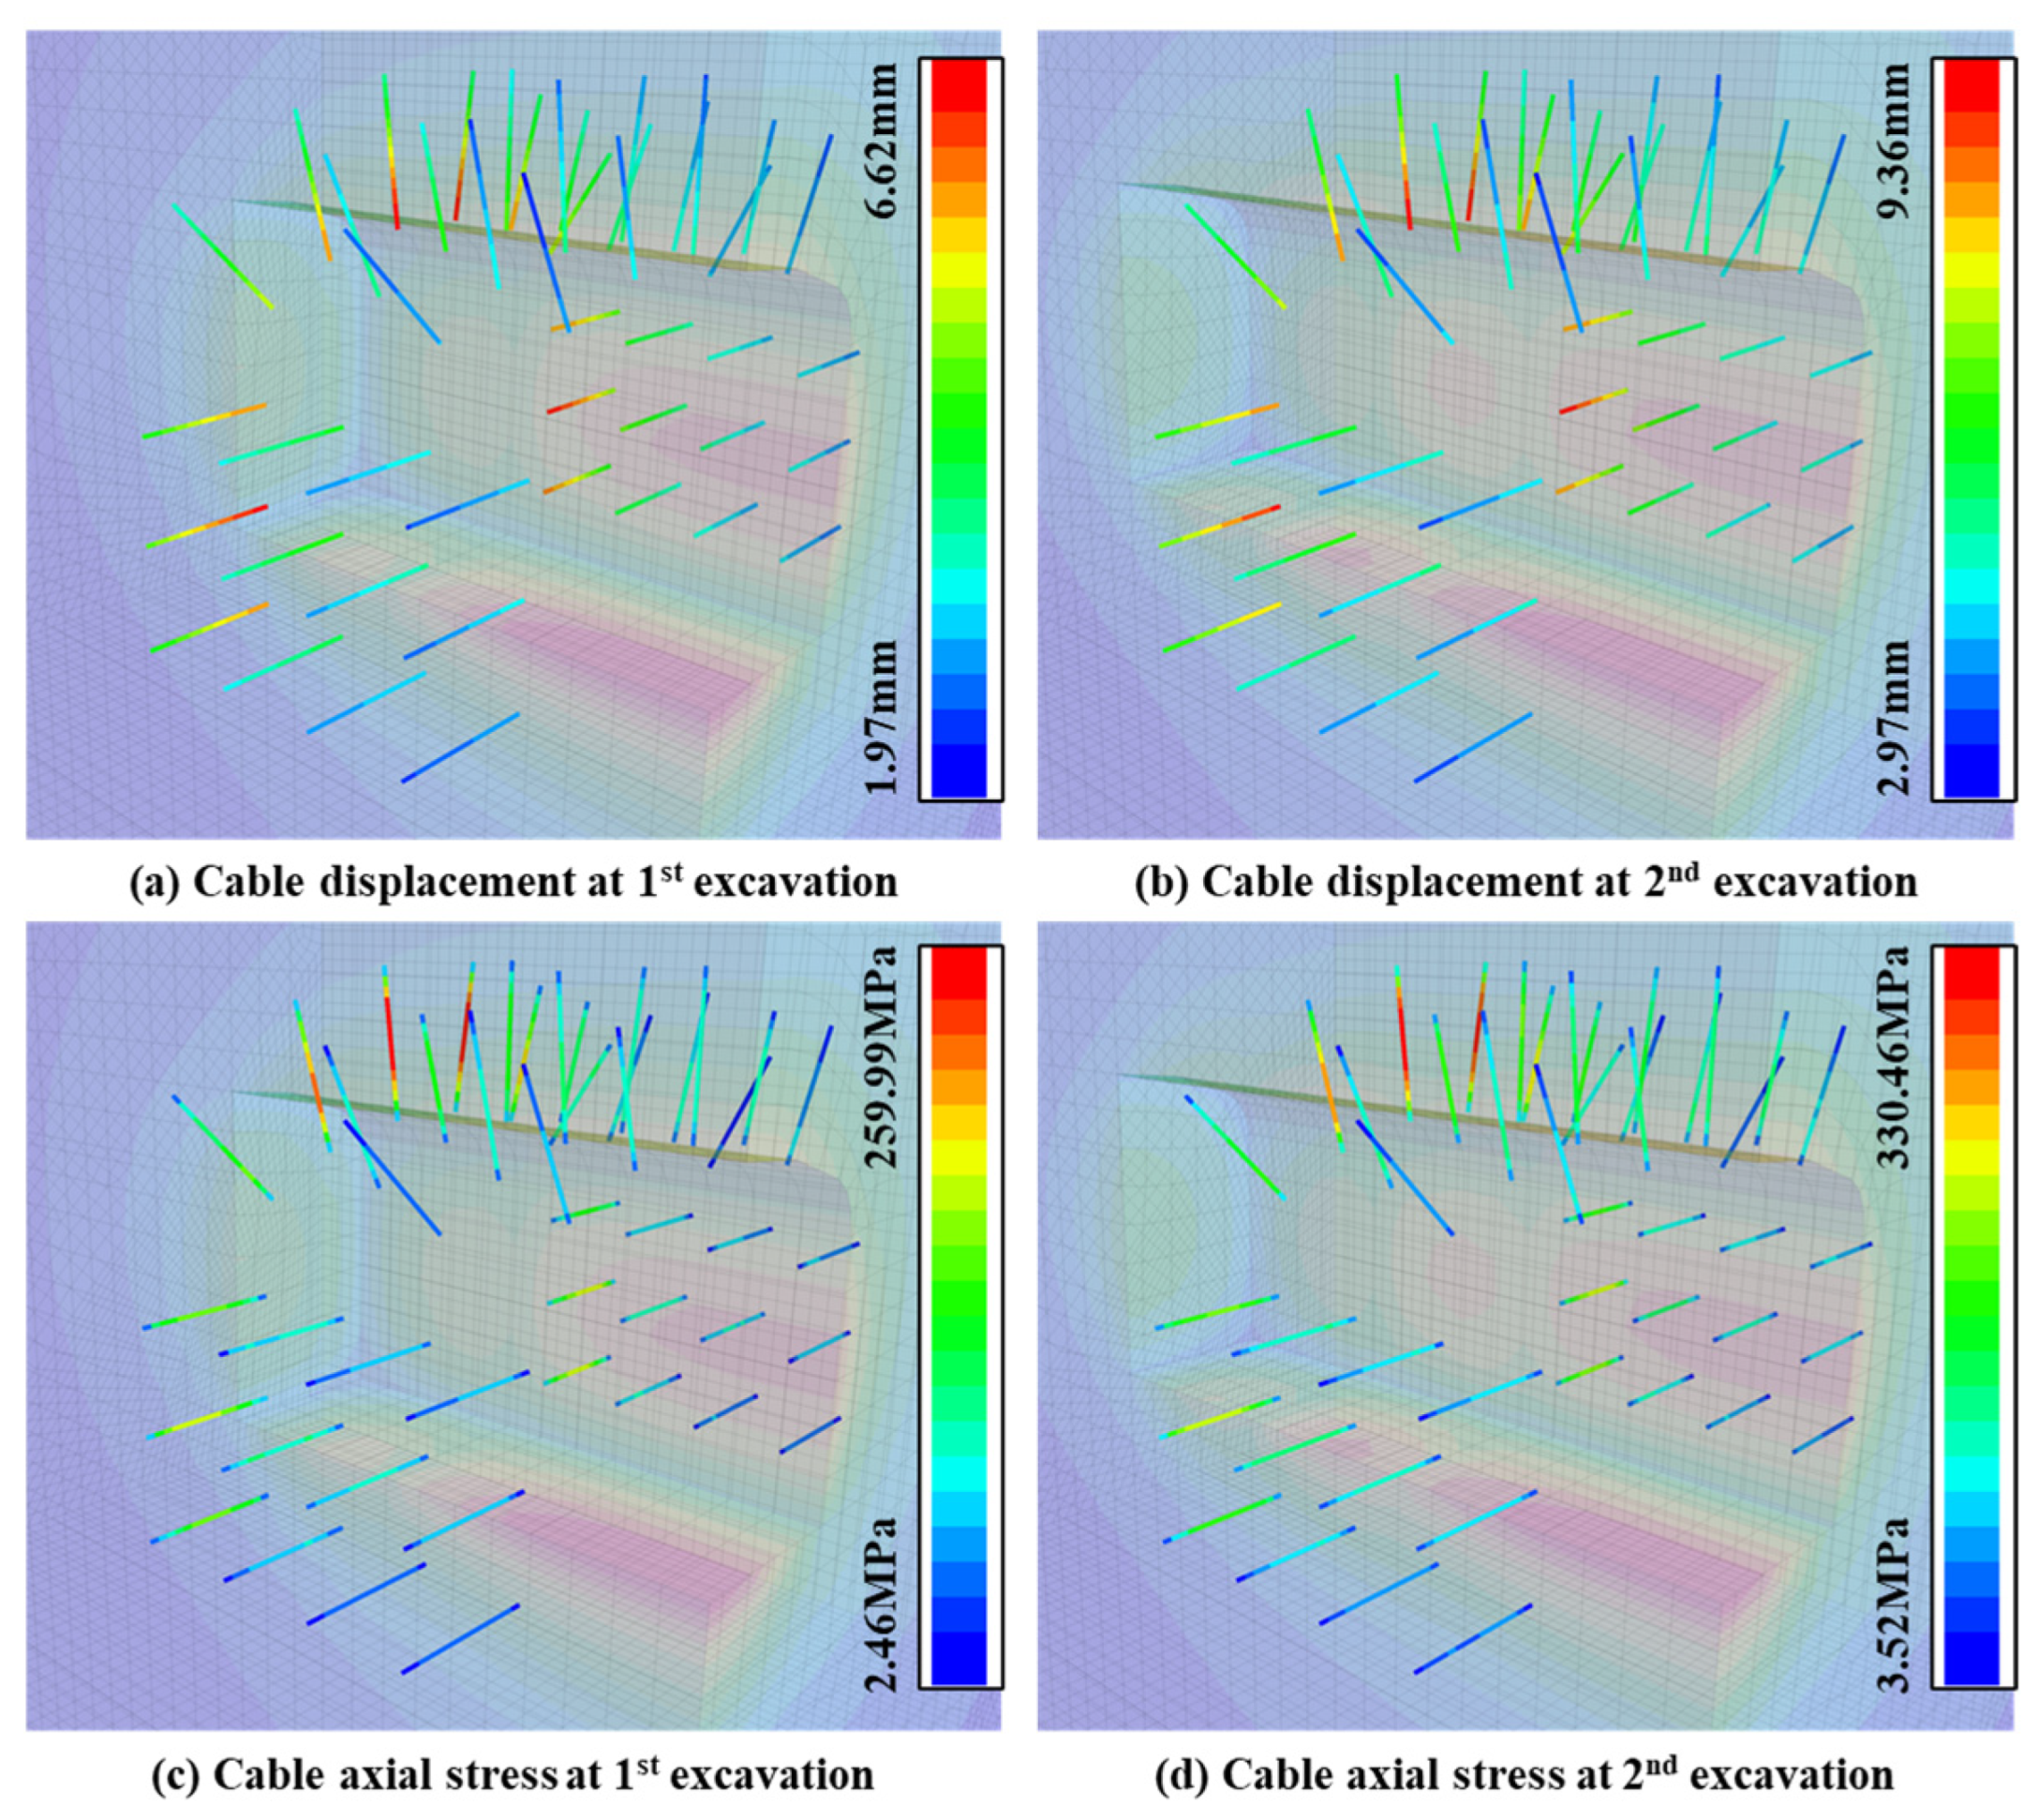
The response status of the anchor rods in the constructed tunnel is shown in Figure 9. From subgraphs a and c, it can be observed that, after the first round of excavation, significant deformation occurred in the anchor bolts near the new excavation area. The closer the anchor bolts are to the free face, the greater the axial deformation, and the closer they are to the transverse and longitudinal axis of the tunnel, the greater the displacement of the anchor bolts. Based on the axial stress, it can be inferred that the anchor rods in the left row bear a significant tensile stress at the arch position, while the peak stress does not exceed the tensile strength of the anchor rods (buts exceeds the yield stress of Q235 steel, 250 MPa), indicating that the tunnel is still in a safe state.
After the completion of the second stage of excavation (subfigures b and d), the peak deformation of the anchor rod increased by about 50%, but the overall distribution characteristics did not change significantly; however, the peak tensile stress at the middle position of the anchor rods on both sides of the central axis of the arch exceeds 330 MPa, which is still less than the tensile strength of Q235 anchor rods of 400 MPa, but greater than the yield limit of the material. This phenomenon indicates that there are certain safety hazards in the anchor rods near the central axis of the tunnel in the future, and the support operation should be completed in a timely manner.

3.3. Limitations of the Finite Element Method When Simulating Tunnel Excavation

The method used in the FLAC3D tunnel excavation simulation process in this article is currently the most used “direct deletion method”, which completely ignores the secondary damage that may occur in the tunnel during excavation due to operational disturbances. All secondary damage comes from the stress transformation and deformation behavior after the tunnel excavation.
Obviously, this setting is unreasonable. Even if the mechanical excavation method with minimal disturbance is chosen for tunnel excavation instead of the drilling and blasting method with a large disturbance, the surrounding rock of the tunnel will be disturbed and directly subjected to mechanical effects during the process of cutting and stripping rocks, which cannot be ignored. As shown in Figure 10 [26], during the rock-breaking process of the rolling cutter, in addition to directly cutting the rock with the cutting head, secondary damage will continue to extend into the rock mass through stress conduction. Therefore, it is of great significance to use the appropriate methods to simulate the real failure state of the tunnel’s surrounding rock after mechanical excavation, and the small-scale mechanical cutting research [27] can be referenced.

4. Application of the PFC3D-FLAC3D Simulation to the Mechanical Drilling and Excavation of a Tunnel

4.1. Deformation and Stress Characteristics of the Surrounding Rock

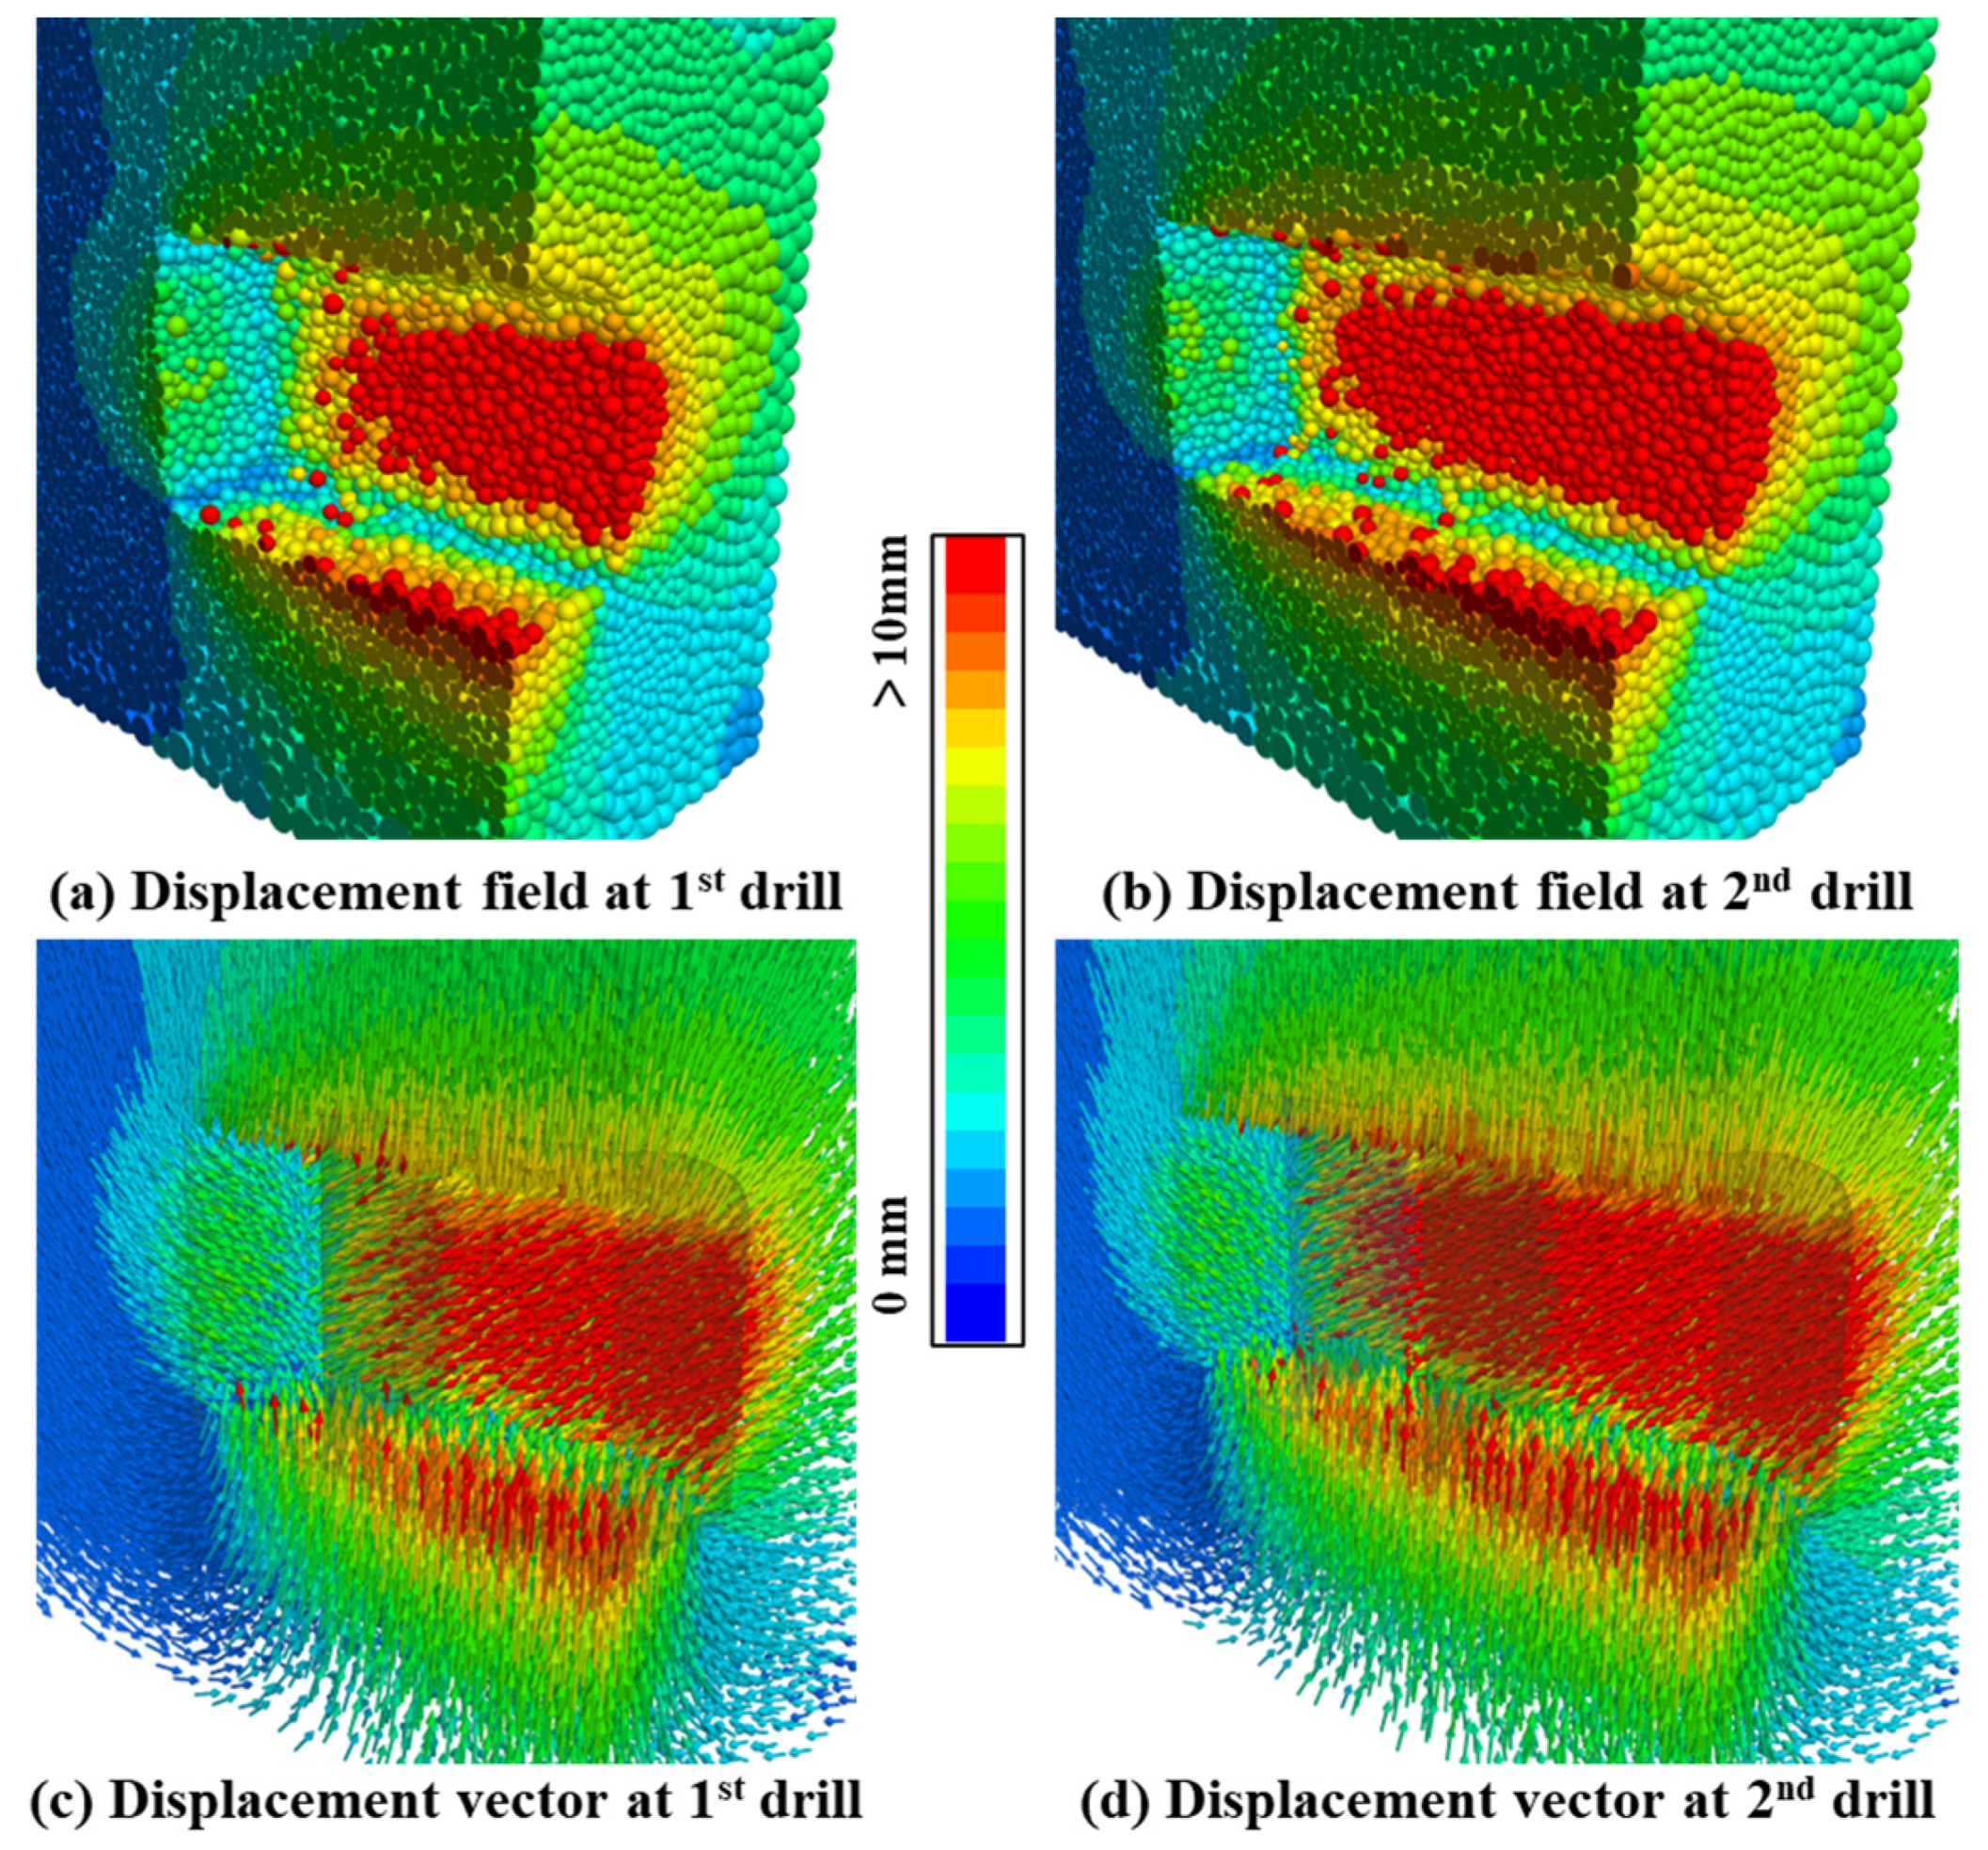
Figure 11 shows the deformation field and deformation vector field of the tunnel after two rounds of excavation. Like the results obtained from FLAC3D in Section 3.1, there is a significant degree of deformation observed in the middle of the tunnel floor and side walls, while the deformation at the excavation face position is relatively small (both less than 6 mm), and the deformation at the corners of the tunnel is very small. On the other hand, in addition to the widely moving surrounding rock, some red particles appear on the surface of the newly excavated tunnel, and there may be local dense damage in the corresponding area.
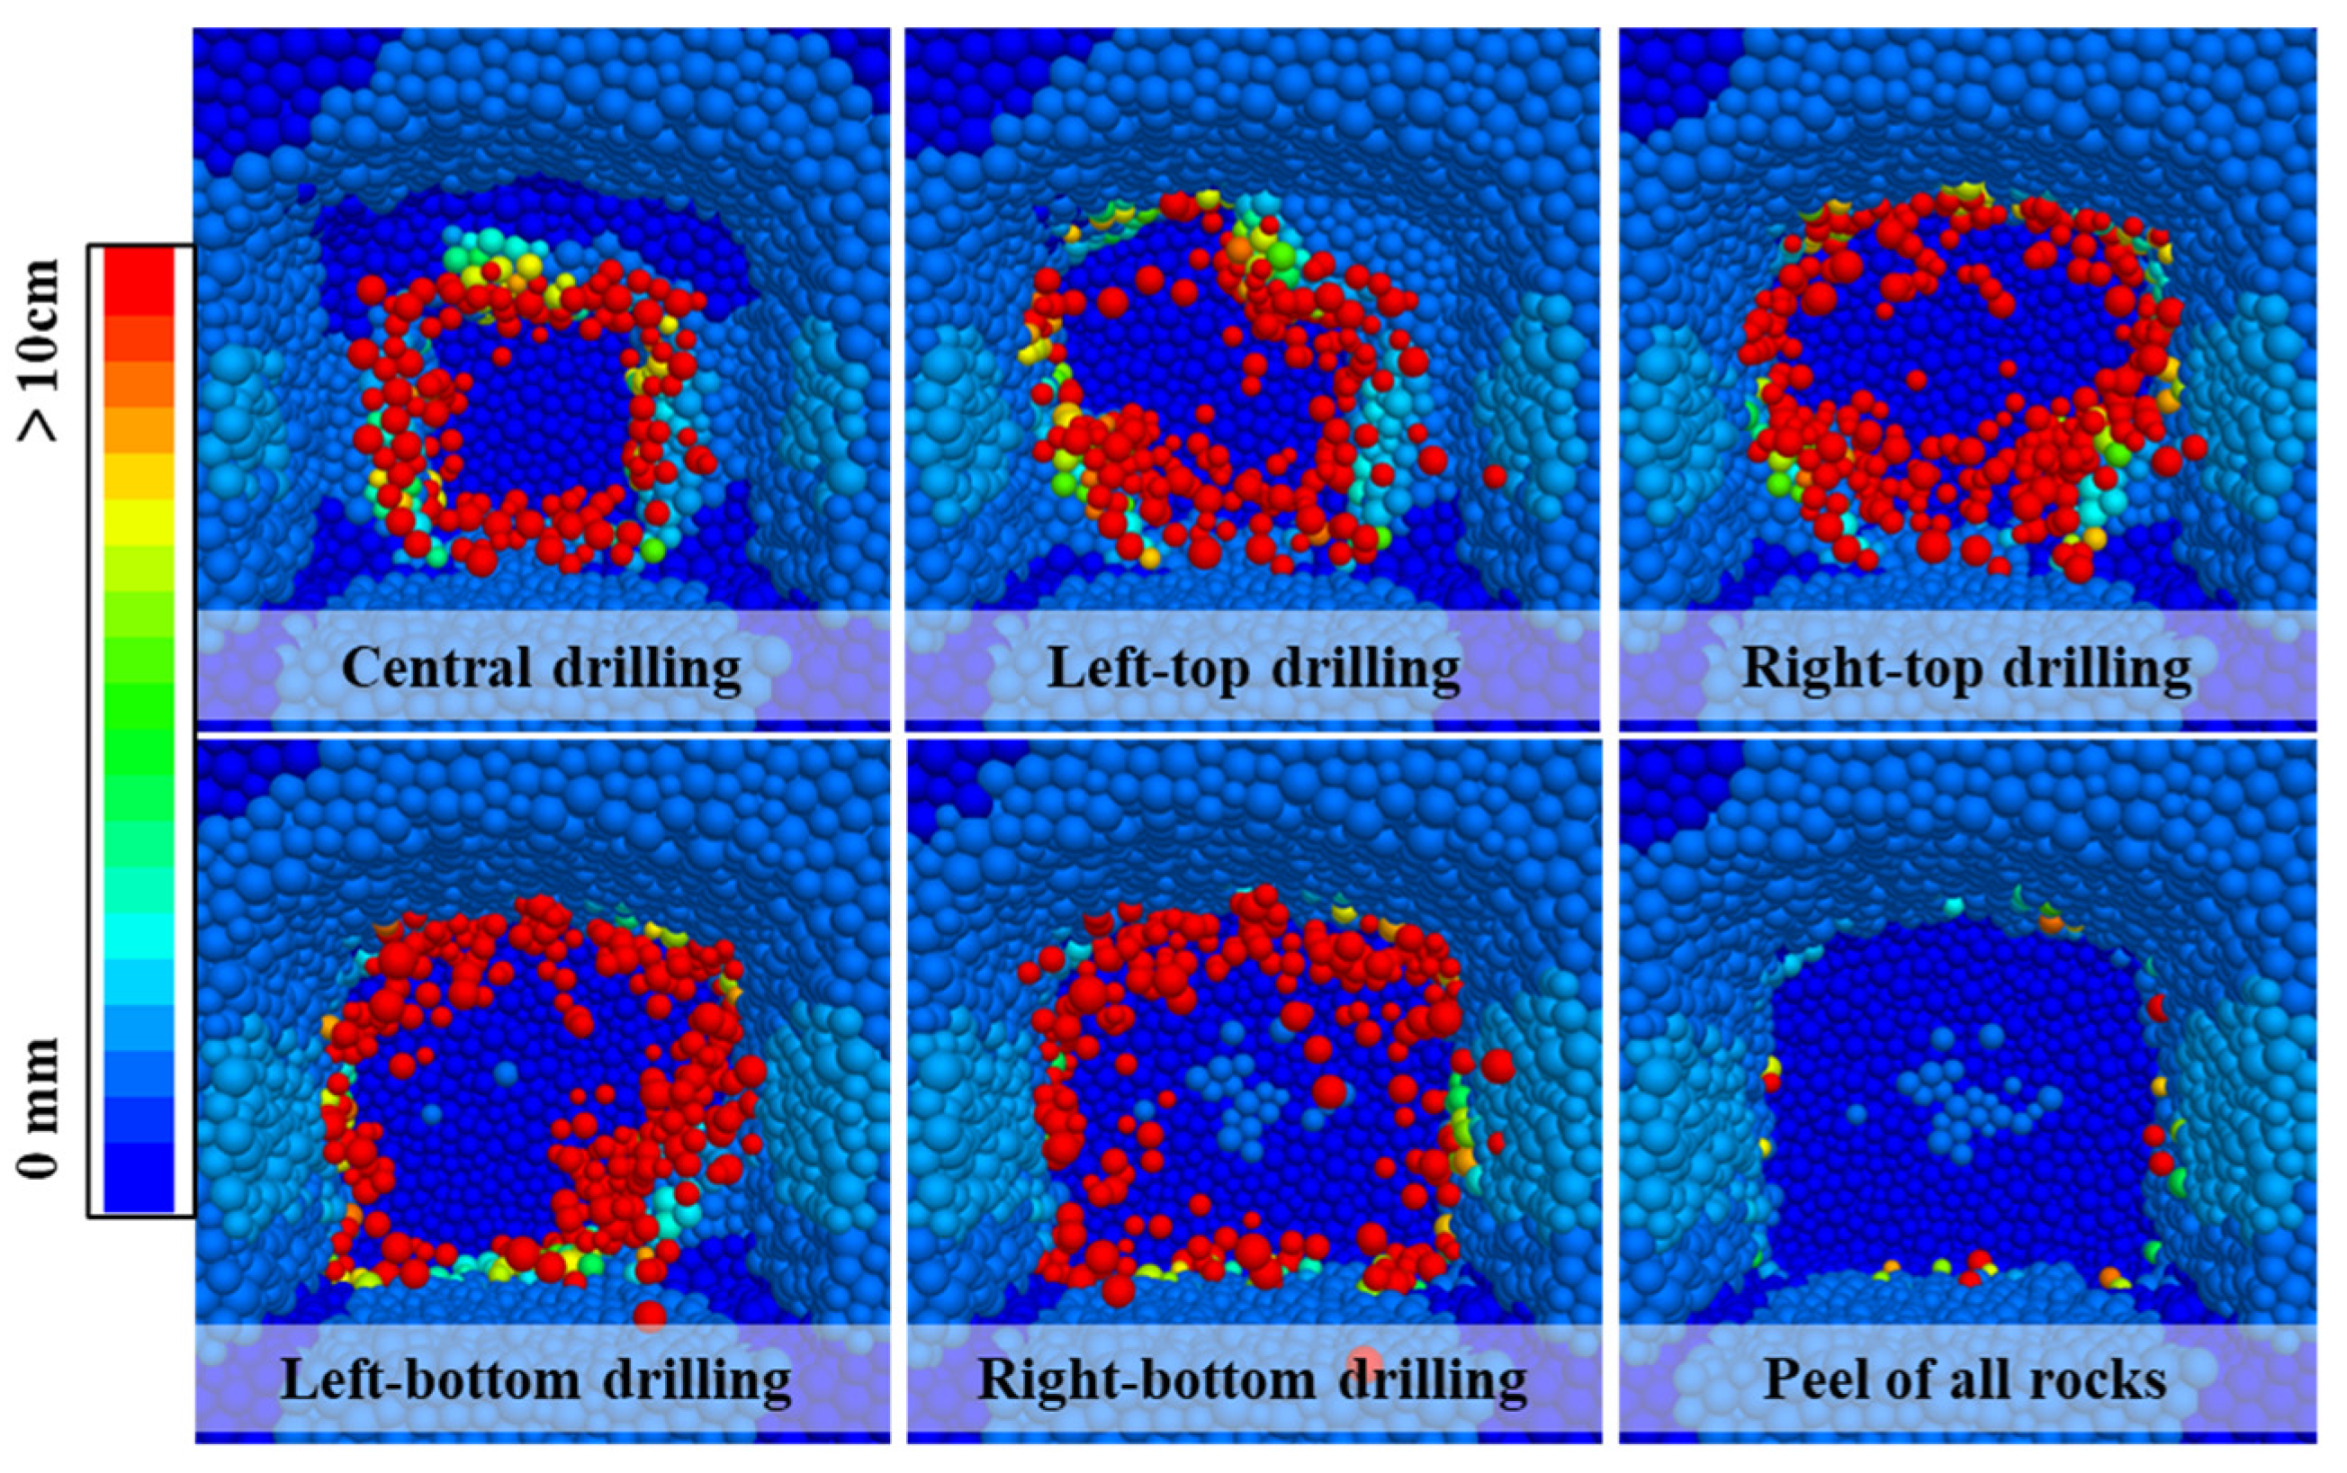
To investigate the cause of this phenomenon, Figure 12 shows five specific steps during a round of tunnel excavation, with displacements greater than 10 cm as the basis for determining the peeling and splashing particles (red particles).
After the first round of central excavation, the remaining rock mass showed varying degrees of damage, with red particles appearing around the newly excavated area. There are still a few red particles remaining on the roof of the new tunnel when second round of excavation finished, and some particles are falling; the number of red particles in the lower left corner of the front face has surged. After the third round of excavation in the upper right corner of the tunnel, red particles are falling from above the tunnel, and the number of red particles in the unexcavated area of the tunnel is increasing. When the fourth and fifth rounds of excavation are completed, there are still some suspended particles in the tunnel; therefore, we removed the particles with a displacement greater than 10 cm and used the ‘solve average ratio 1 × 10⁻⁵’ command to calculate the balance, ultimately obtaining the final surrounding rock state in the lower right corner. At this point, new particles with larger displacements (red and orange particles) appeared again in the tunnel, which may be due to new secondary damage caused by the stress balance process.
In summary, when using the PFC3D method combined with the wall model to simulate the mechanical excavation of drill bits, significant deformation and non-direct contact failure behavior are bound to occur in the adjacent rock mass (particles), which is closer to real working conditions (compared to the simulation method in Section 3).
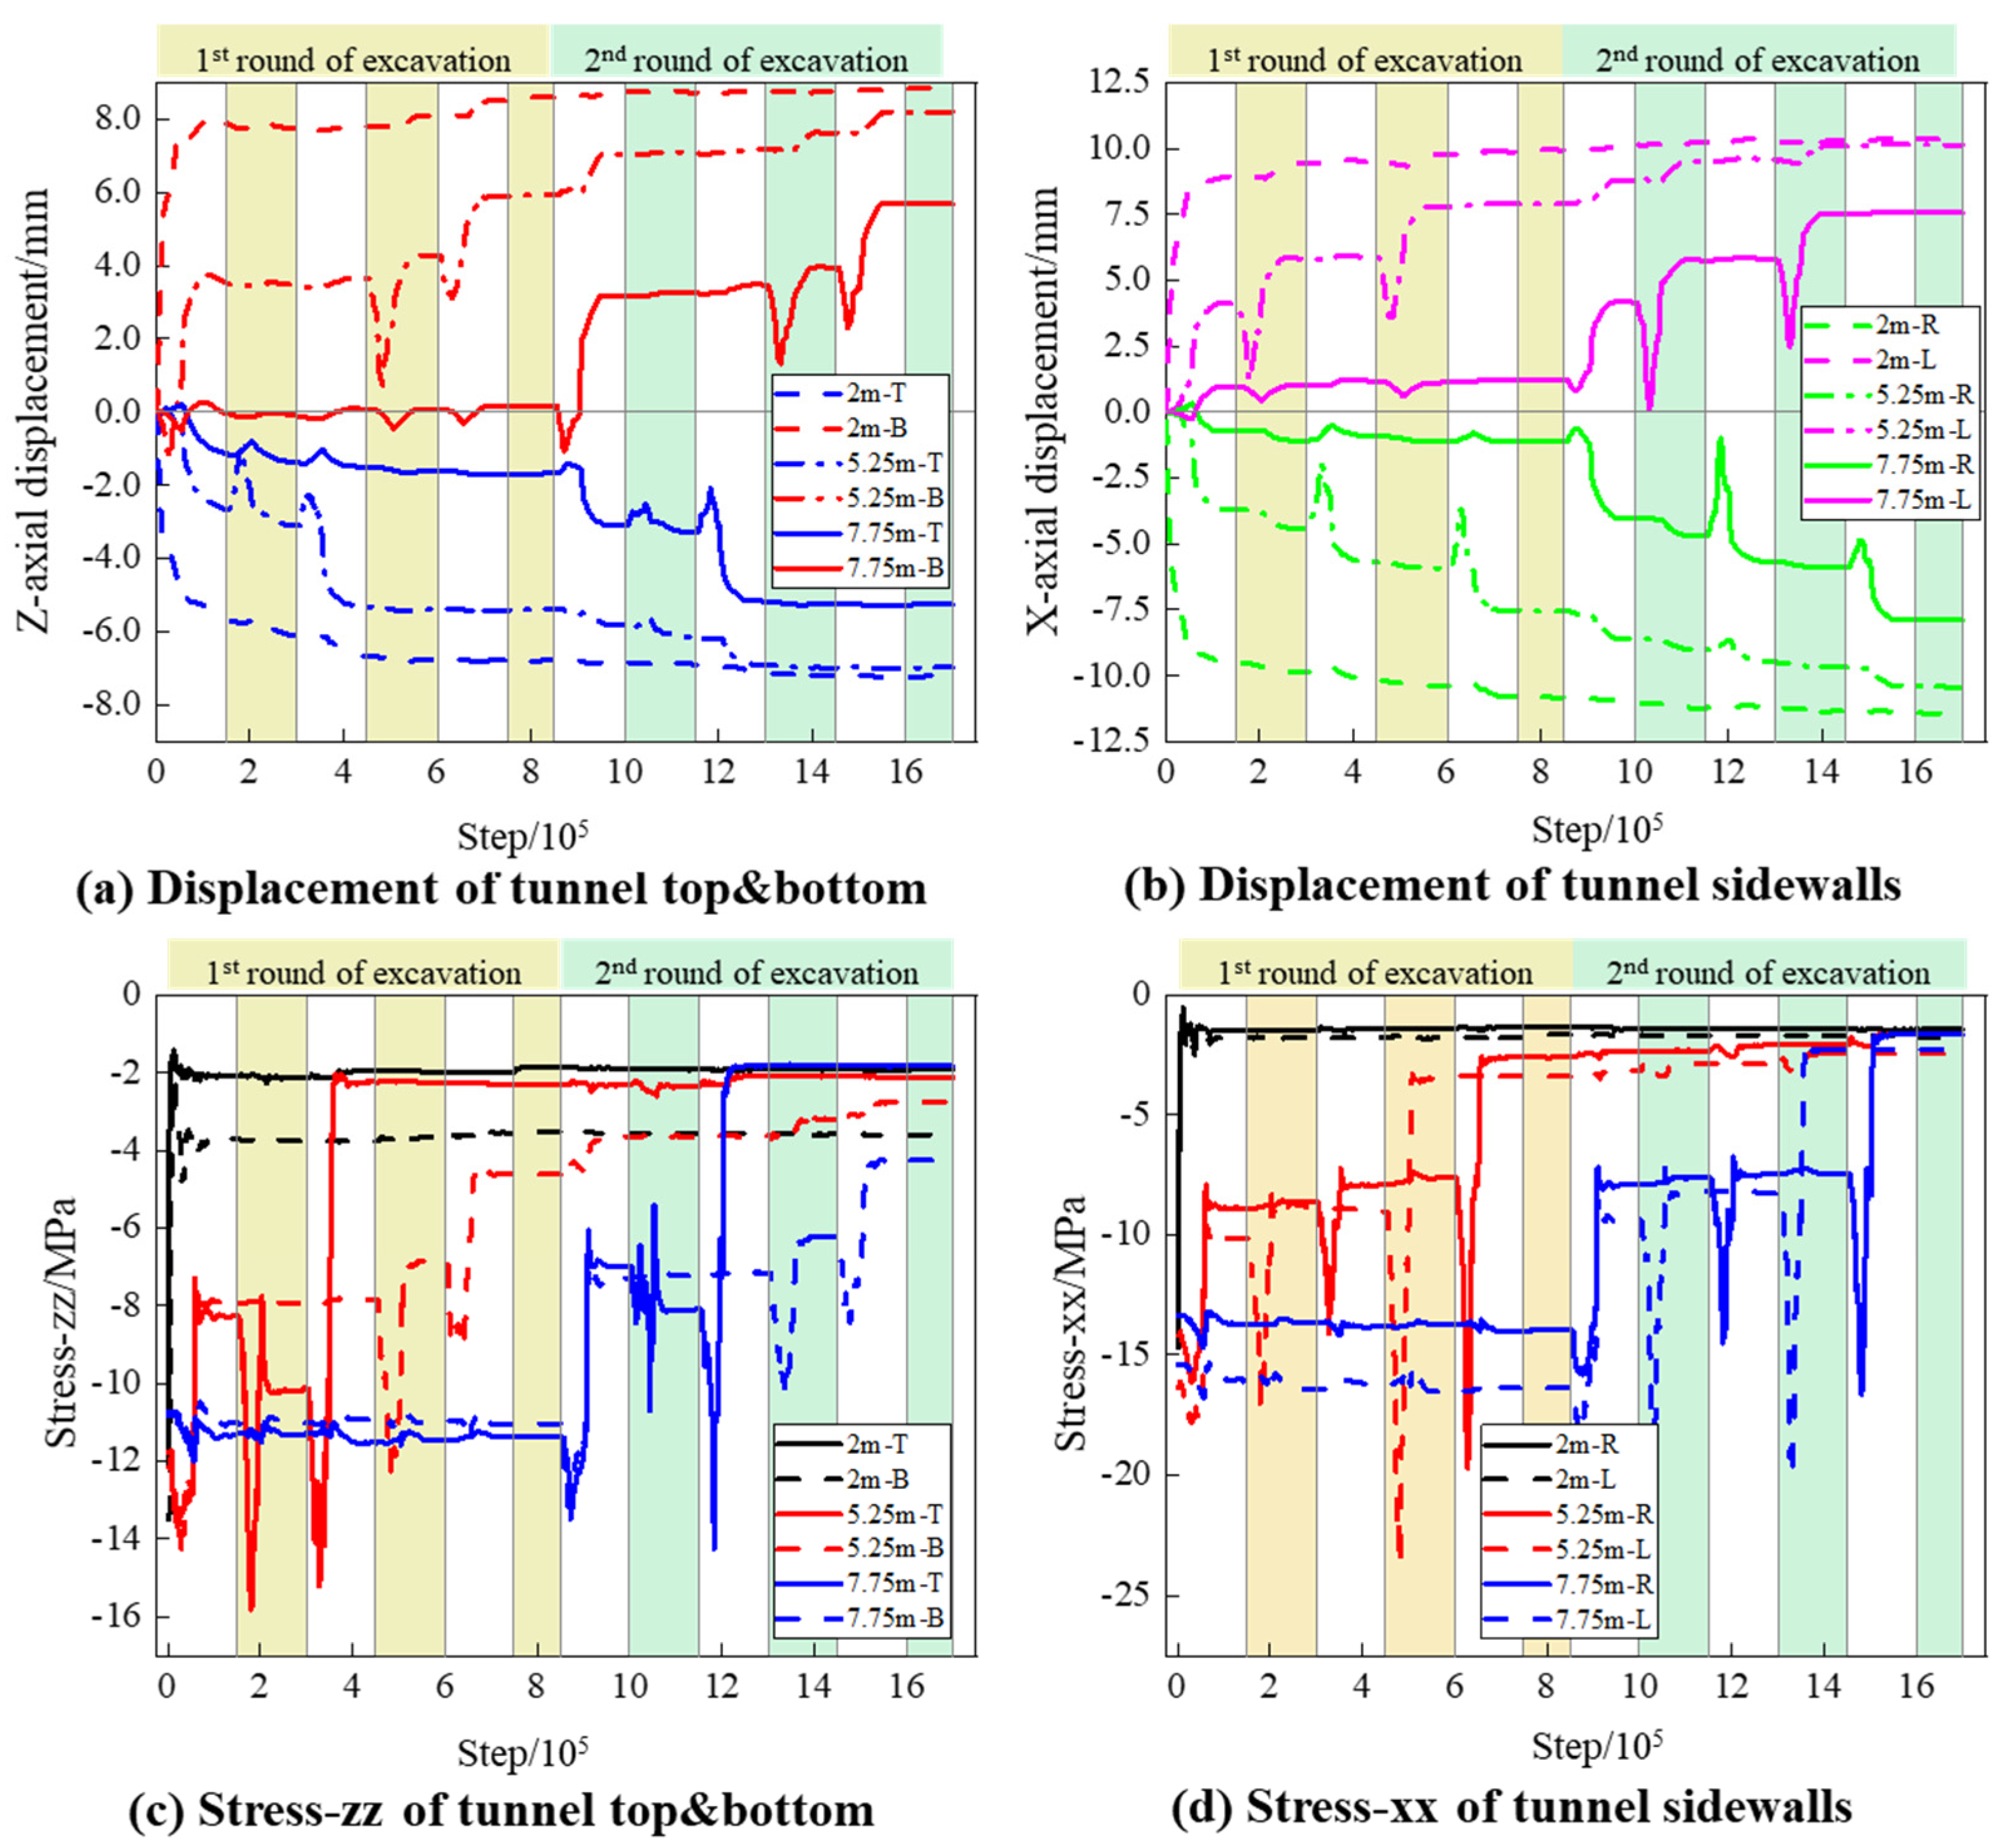
We extracted the displacement and normal stress information of the monitoring points around the tunnel to draw Figure 13. The abbreviation of the legend is divided into two parts: the first half, ‘2 m’, represents the y-axis coordinate of the detection point, and the second half, T, B, L, and R, represent the top, bottom, left, and right, respectively. Y = 2 m/5.25 m/7.75 m, respectively, represent the axial center point positions of the constructed tunnel, the first round of the excavation tunnel, and the second round of the excavation tunnel.
Subfigures a and b, respectively, show the deformation curves of the monitoring points at the top and bottom of the tunnel, as well as the monitoring points on the left and right walls. After the first round of excavation in the center area of the tunnel face, the measuring point at y = 2 m experienced significant deformation, reaching 85–90% of the final deformation; the deformation curve of the measuring point y = 5.25 m shows significant differences in the time step of sudden changes due to the influence of excavation sequence; the measuring point of y = 7.75 m remained basically stationary in the early stage. The displacement curve of the measuring point with y = 7.75 m did not start to change until the second round of excavation began, and there were differences in the corresponding time steps for the change; the y = 2 m measuring point shows slight deformation, but the deformation quickly tends to stabilize; the vertical deformation amplitude of the measuring point with y = 5.25 m is relatively large, but the deformation on the right side always increases in the horizontal direction, while the deformation on the left side shows a periodic “rising-stable-rising” process.
Compared to the regular changes in displacement curves, the frequency of stress state changes, shown in subgraphs c and d, is relatively low. The normal stress at the measuring point y = 2 m rapidly decreases after the first excavation and remains stable thereafter, while the stress on the bottom plate of the tunnel is always lower than that on the top plate; the other two measuring points gradually completed stress release during the cyclic excavation process, and the normal stress of the surrounding rock in the arch and left and right walls eventually tended to be unified. The stress at the bottom plate position differed significantly, which may be caused by the distribution range of the support structure. In addition, when the adjacent rock mass is in the process of excavation, there will be an instantaneous surge in stress at the measuring point, and the stress will be quickly released after the tunnel is fully excavated. The rapid accumulation and release of this stress is independent of the displacement at the corresponding position.

4.2. States of the Structural Elements

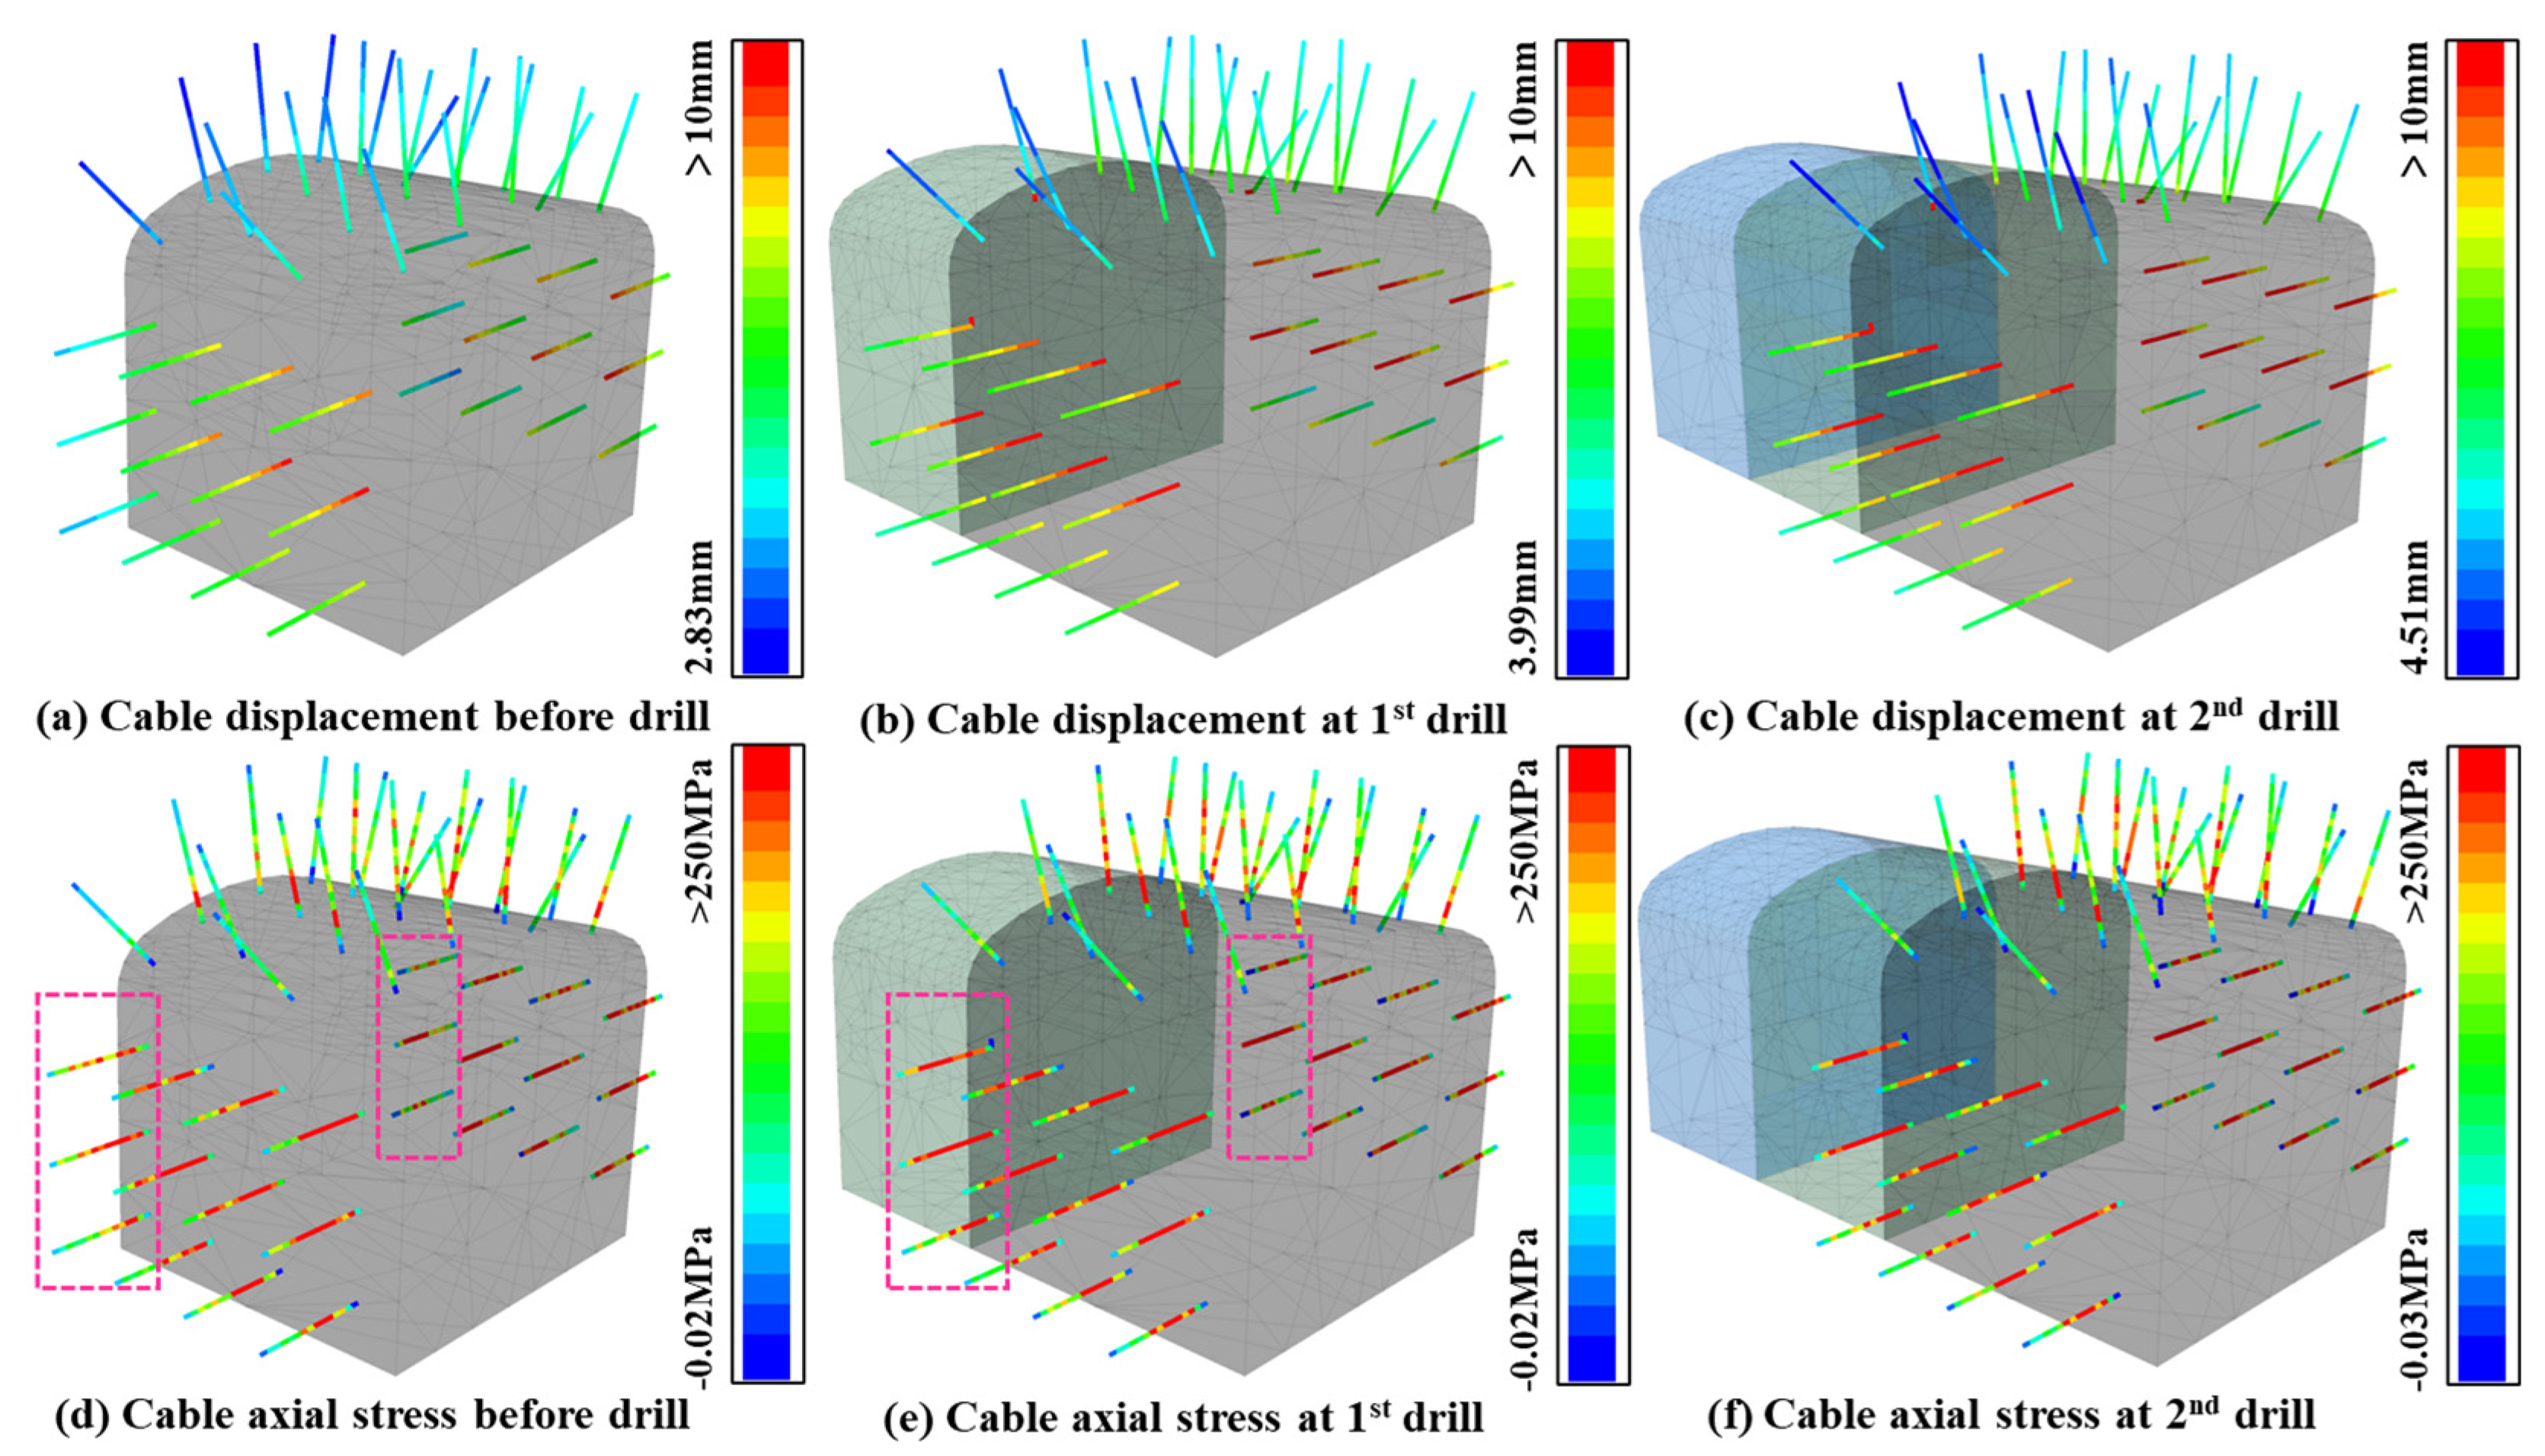
Regarding the simulation of mechanical excavation in the tunnel, the response status of the anchor rods in the existing tunnel is shown in Figure 14. Unlike the results obtained from FLAC3D, the overall deformation of the anchor rods in the side walls of the tunnel in this model is greater than other positions (subfigures a–c) and the direction of the maximum deformation is the same as the direction of the maximum external load (both in the horizontal × direction). During the two rounds of excavation, the displacement of the anchor rods near the newly excavated tunnel gradually increases, and the deformation of the surface anchor rods is generally greater than that of the deep anchor rods.
Based on the yield stress of the Q235 steel anchor rod (250 MPa), most of the middle area of the transverse anchor rod in the tunnel was already in a yielding state before excavation, and some nodes of the arch top anchor rod show yielding. When the first excavation finished, the number of nodes in a yielding state gradually increased, especially the anchor rods in the left and right walls, which are adjacent to the new tunnel surface (the orange and red regions increased in the pink frames in Figure 14d,e). The second round of excavation did not impact the stress status of the anchor rods, but slightly increased the axial deformation of the horizontal rods.
To accurately calculate the stress state of the anchor rod system, we calculated the proportion of the length exceeding the yield stress to the total length of the anchor rod. In the current tunnel, 61.9% length of the anchor rods in the side walls have yielded; after the new tunnel is constructed, this proportion increased to 73.5%. On the other hand, the yield length ratio of anchor rods in the tunnel roof before and after excavation is not significantly different, only increasing from 15.5% to 18.8%. Overall, the tensile stress borne by the side wall anchor rods is higher than that at the arch position. It is also worth noting that the anchor rod at the arch shoulder position exhibits both low deformation and stress values, indicating that the rock mass at this position has fully utilized its self-supporting capacity and that the constraint effect of the anchor rod is relatively weak.
In summary, under current conditions, although many anchor rods have reached the yield stress, their axial stress is still less than the tensile strength (400 MPa), so the anchoring system still plays a positive role. However, it is still necessary to promptly install new anchor rods in the new tunnel to prevent the existing anchor rods from being subjected to stress exceeding the threshold.

4.3. Local Concentration and Axis Rotation of Principal Stress in the Near-Field

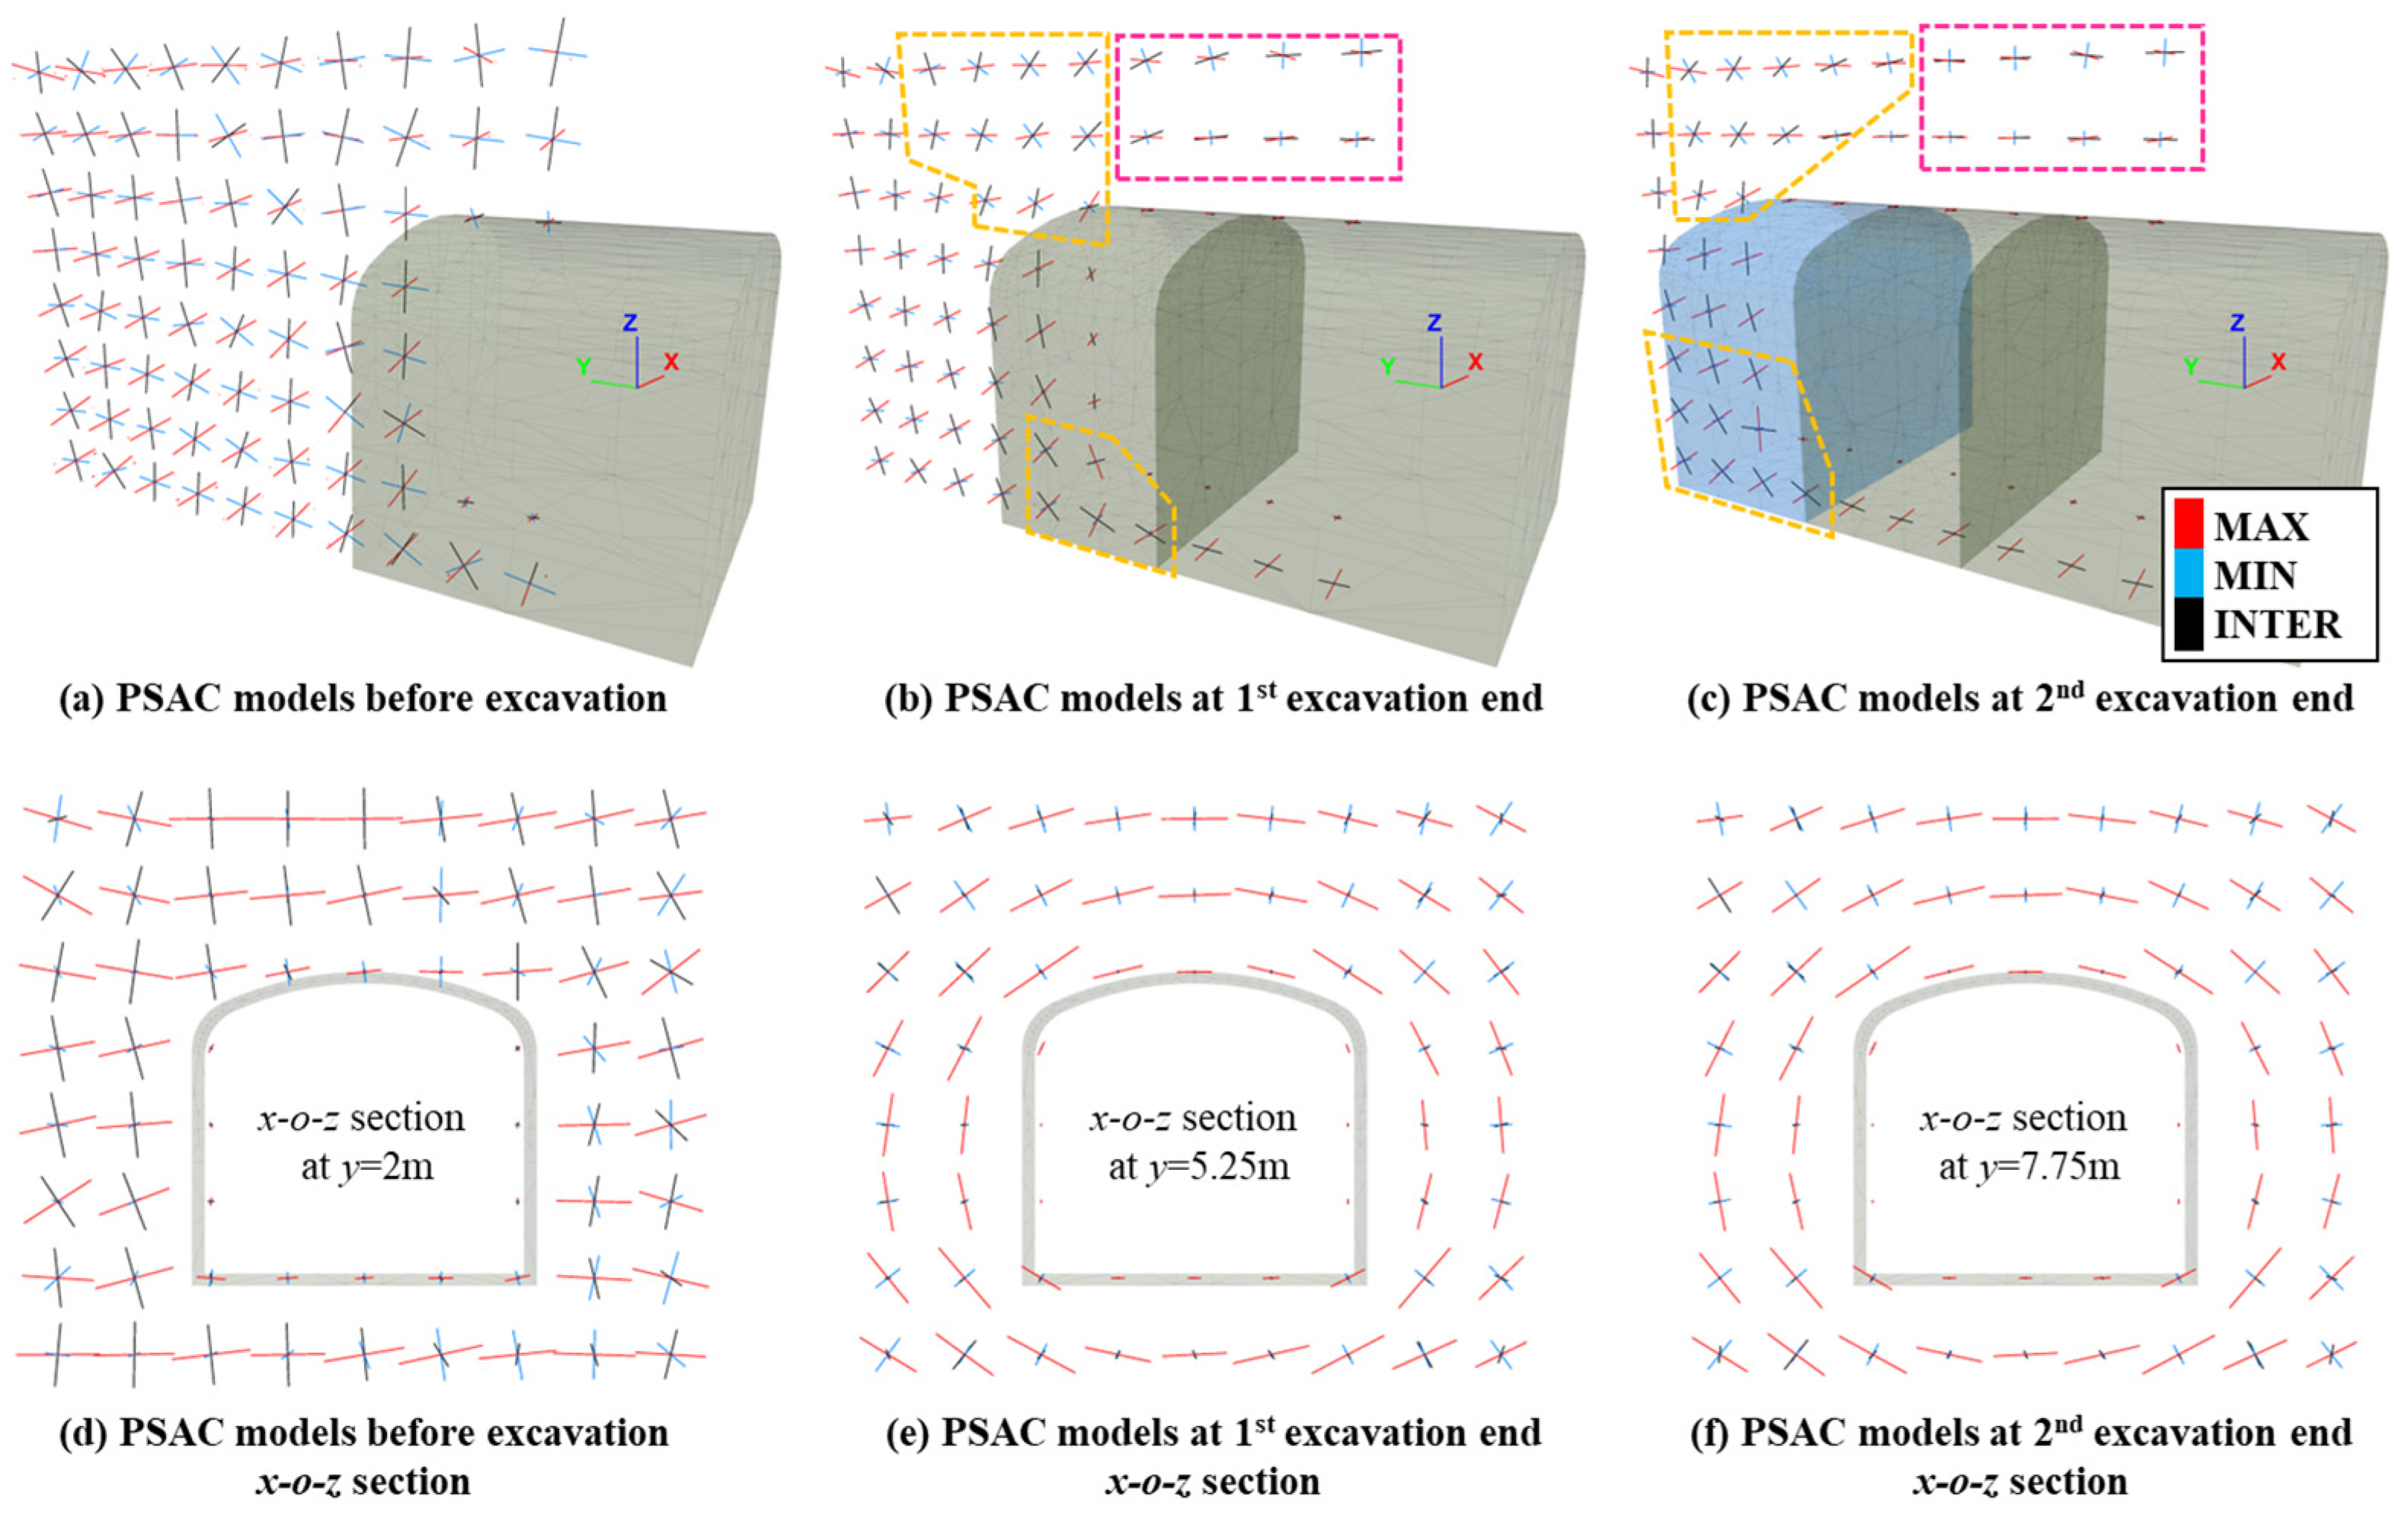
The analysis of principal stress deflection employs a three-dimensional principal stress cross model [20] where the length of each line segment corresponds to the magnitude of the respective principal stress (Figure 15). The red, black, and blue lines represent the axial of maximum principal stress, intermediate principal stress, and minimum principal stress, respectively.
From Figure 15a, it can be seen that the unexcavated deep rock mass still maintains a far-field true triaxial stress state, with the maximum principal stress along the x direction and the minimum principal stress along the y direction; the minimum principal stress, represented by the blue line, is perpendicular to the free surface of the tunnel in the shallow surrounding rock, and the intermediate principal stress is approximately parallel to the direction of the tunnel in these areas; the above phenomenon is due to the redistribution of stress after excavation and conforms to the laws obtained from previous relevant research results.
As excavation progresses (subfigures b and c), the direction of the maximum principal stress in front of the face remains in the x-direction, but there is a significant deviation in the middle principal stress at the top and bottom positions of the face (within the orange dashed box in subfigures b and c), and this deviation also exists in the far-field surrounding rock; the principal stress cross located directly above the tunnel always maintains the maximum principal stress of x and the minimum principal stress of y.
In the circumferential surrounding rock of the excavated tunnel (subfigures d–f), the direction of the principal stress is consistent with the far-field stress when the new tunnel is not excavated, and the support structure has a better recovery effect on the true triaxial stress of the surrounding rock. As excavation progresses, it can be observed that the maximum principal stress direction forms an approximately concentric circle around the free surface, and the maximum principal stress values of the surrounding rock on the outside of the arch shoulder and tunnel bottom corner are significantly higher than those in other areas. Based on the displacement field characteristics of the surrounding rock shown in Figure 11, it can be considered that the rock mass in the corresponding area has caused a rotation in the direction of the principal stress axis during the displacement deformation process.
To study the quantitative variation characteristics of principal stress in the surrounding rock, we selected the surroundings of the tunnel and the center position of the face as measurement points and extracted corresponding principal stress data (see Figure 16 for details). The following characteristics and conclusions can be obtained:
(1)
In the initial state (subgraph a), the principal stress at the top center bottom measuring point is relatively small (0–4 m) in the constructed tunnel, while the triaxial principal stress values in the unexcavated rock mass remain stable. From the stress-monitoring curves on the left and right sides, it can be observed that there is not much difference between the two in terms of maximum and minimum principal stresses. However, the principal stress in the middle of the right side is significantly lower than that on the left side (averaging 10% lower). This may be due to uneven convergence on both sides of the tunnel, and the deeper reason is the uneven deformation caused by the inclined rock layers.
(2)
After the first excavation is completed (subfigure b), the principal stress of the top center bottom measuring points at the four positions on the right (y = 2.5 m − 5.5 m) remains basically stable; however, the maximum principal stress at the top measuring point showed a significant increase in the early stage of the tunnel, while the minimum principal stress at the top and bottom measuring points dropped from around 2 MPa to 0. The stress of the surrounding rock on the excavation face quickly recovered, and the top and bottom measuring points returned to the far-field stress state at y = 7.5 m, while the center measuring point only fully recovered the stress at y = 12 m. According to the monitoring results of the horizontal measuring points, the minimum principal stress is maintained at around 1 MPa in the excavated tunnel, the middle principal stress slightly decreases, and the maximum principal stress increases significantly compared to the initial state. The maximum principal stress in the horizontal measuring point reaches its peak near the excavation surface, indicating a significant stress concentration at that location; The surrounding rock 1 m deep in front of the excavation has been restored to the far-field stress state.
(3)
After the second excavation is completed (subfigure c), the maximum principal stress at the top center bottom measuring point of the surrounding rock in front of the excavation face quickly recovers, while the middle and minimum principal stresses continue to rise; the maximum principal stress at the left and right measuring points remains basically unchanged, while the middle principal stress recovers to the initial ground stress. The minimum principal stress begins to recover at y = 7.5 m and reaches a stable value at y = 10.5 m.
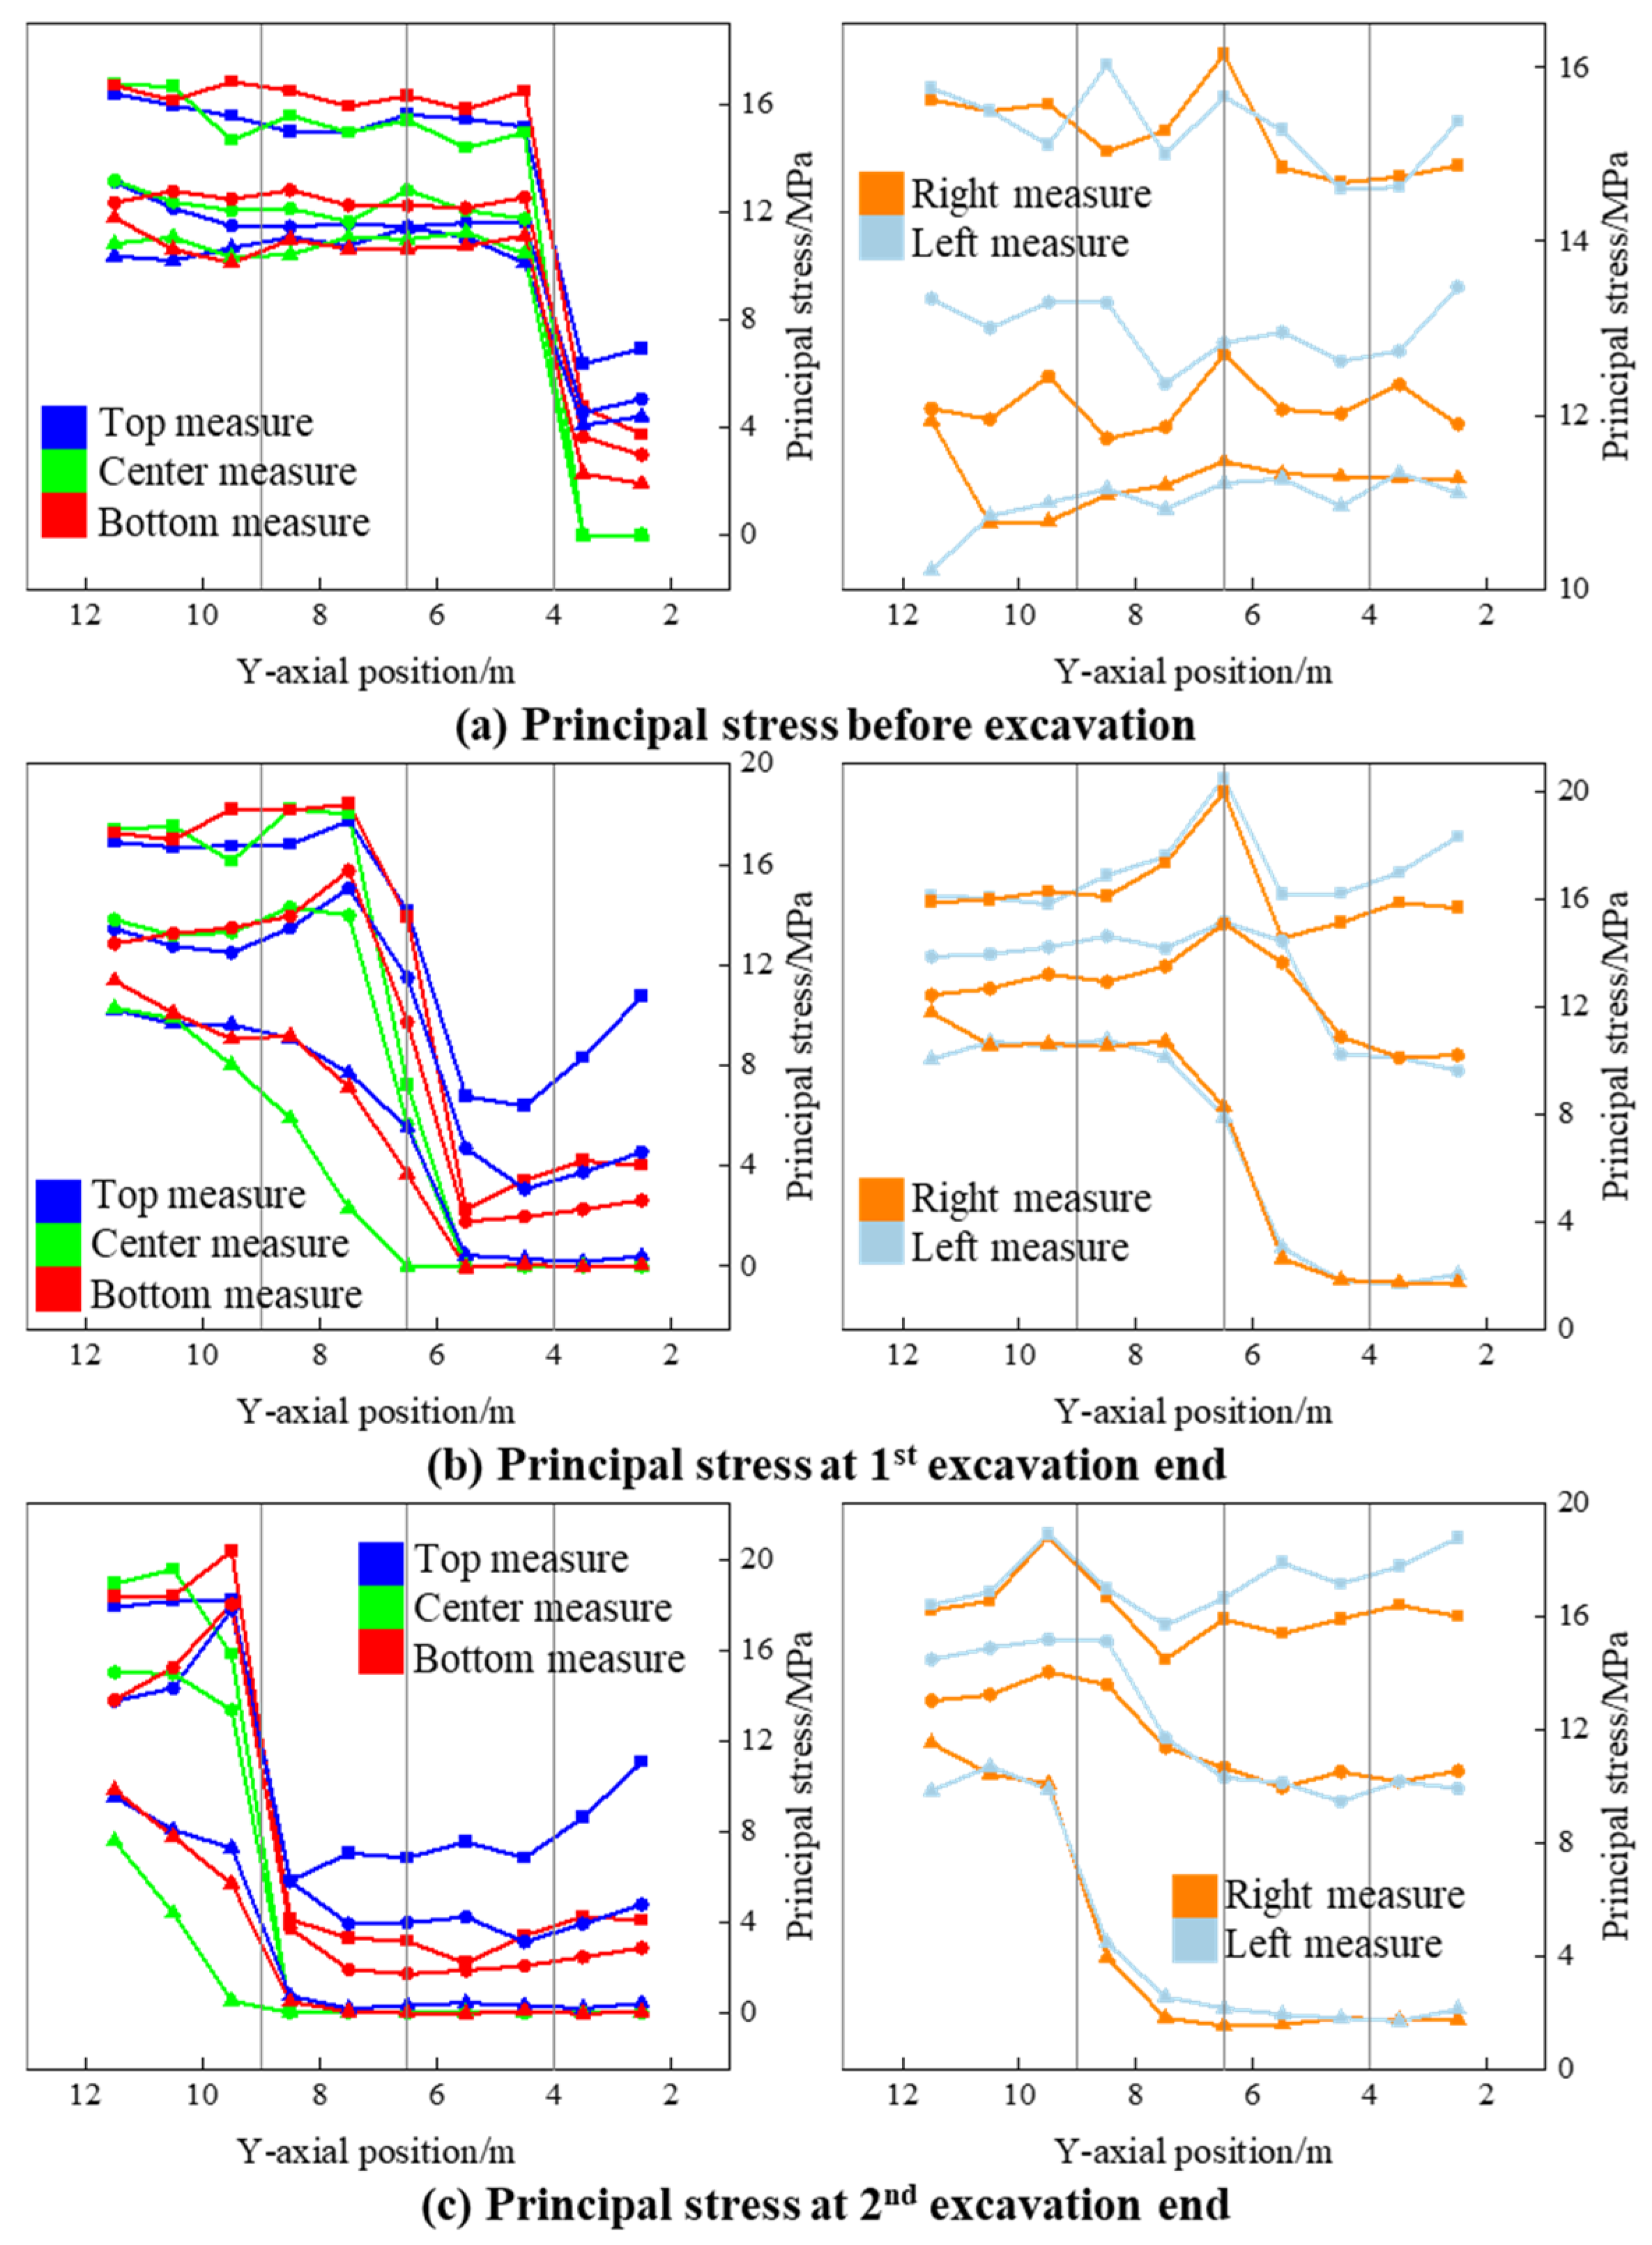
Based on the above results, it can be shown that the maximum principal stress recovery speed is the fastest in the surrounding rock in front of the tunnel, while the middle and minimum principal stresses require longer areas to complete stress recovery. In the process of minimum principal stress recovery, the stress-recovery starting points are at the top and bottom positions near the excavation surface, while the stress recovery starting points at the two sides are further away. Therefore, during the support operation, although the far-field stress is maximum in the horizontal x-direction, the stress recovery at the top and bottom of the tunnel is slow, and the support priority in the corresponding area is higher than that of the side wall position.
Figure 16. Principal stresses at different measured positions and excavation stages.
Applsci 15 12309 g016

4.4. Distribution and Fundamental Mechanics of Secondary Failures

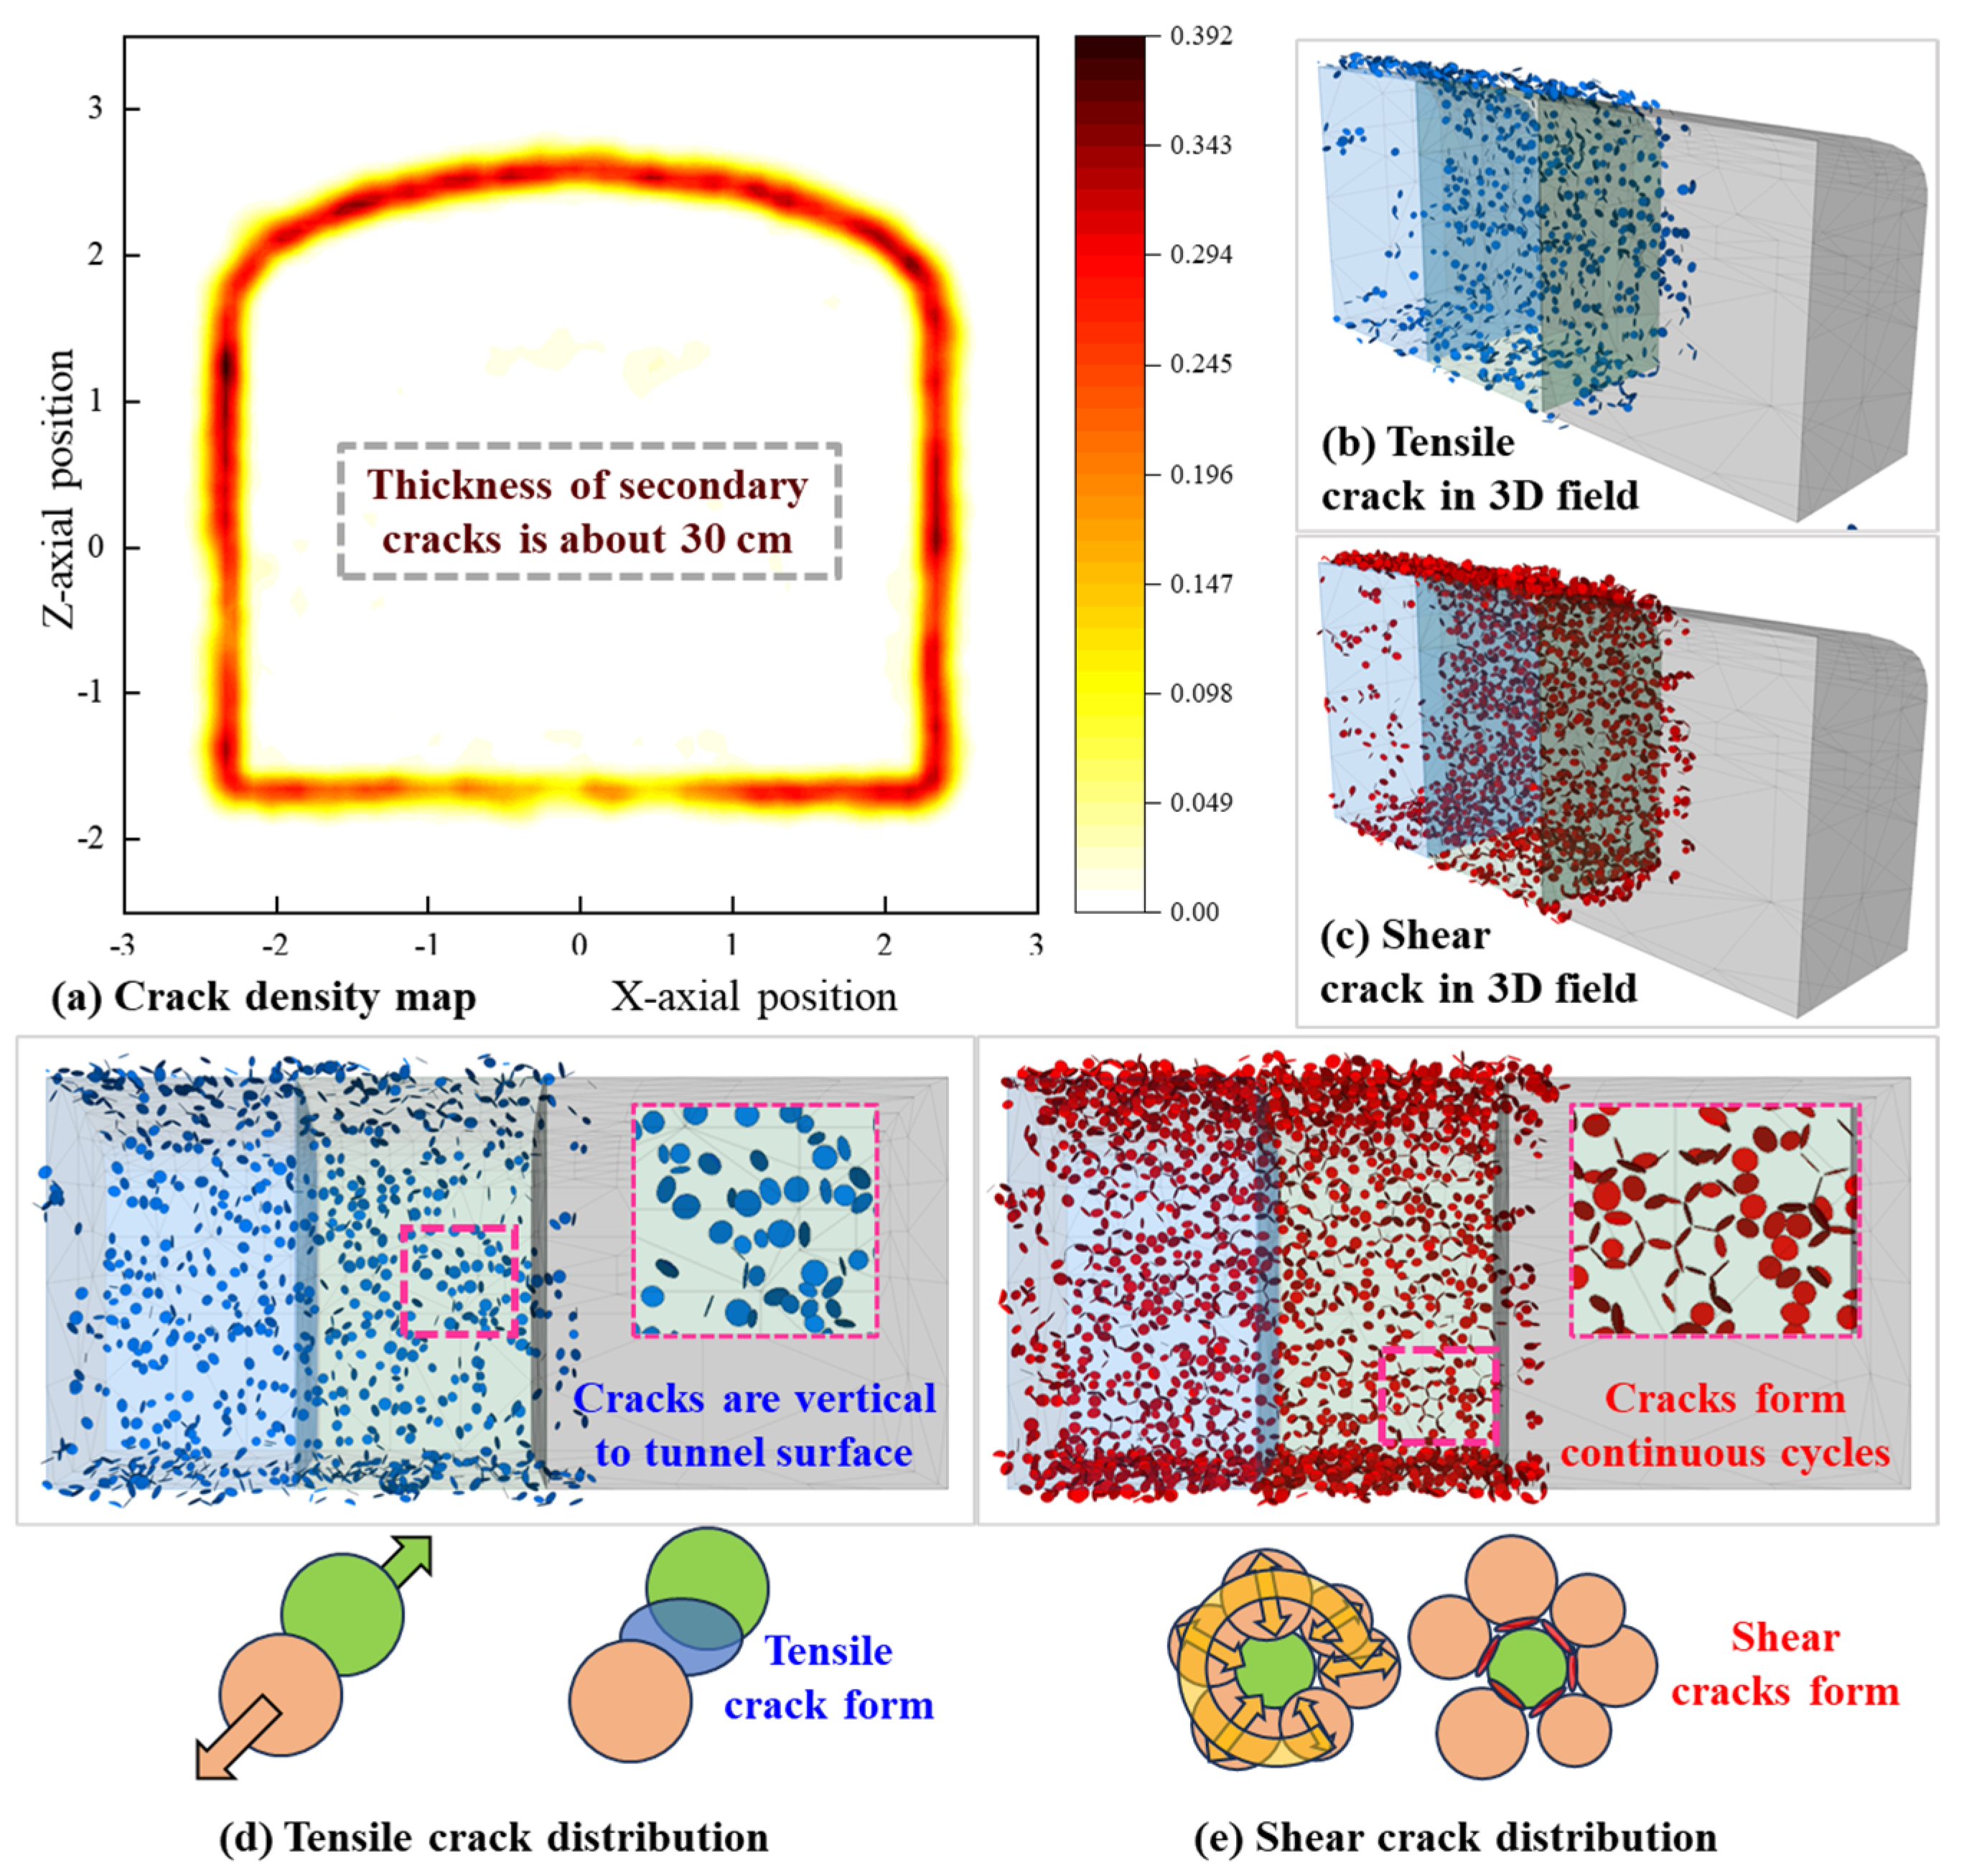
Figure 17 shows the crack distribution in the near-field PFC3D model of the roadway. If the residual cracks in the surrounding rock are projected onto the x–o–z plane (subgraph a), a dense crack zone with a thickness of about 30 cm can be obtained; the crack zone reaches its maximum density in the middle of the two side walls and at the corner of the tunnel (dark red area), and the crack density in the middle of the floor is significantly lower than other positions. Based on the distribution of tensile and shear cracks shown in subfigures b and c, after using mechanical methods to excavate tunnels, shear failure dominates the surrounding rock, which is significantly different from the failure mode dominated by tensile failure after conventional excavation.
Select the perspective on the left to observe the detailed occurrence of secondary cracks (subgraphs d and e). From the current perspective, most of the tensile cracks in the side walls of the tunnel appear circular and elliptical, indicating that the adjacent particles are moving away from each other in the radial (y-direction) direction of the tunnel; a similar situation also occurs at the top and bottom of the tunnel, where the plane of the tensile crack is basically parallel to the free surface.
The distribution characteristics of the shear cracks are completely different (subfigure e). The shear cracks on the side walls of the tunnel form a large number of continuous circular crack zones, and the cracks are mainly elliptical in shape, that is, the particles at the center of the crack ring are squeezed in multiple directions by the surrounding particles (this phenomenon also exists in the roof and floor of the tunnel), which is very similar to the multi-directional cutting of the rock mass by the cutting head in the real mechanical rock-breaking process.
Therefore, using PFC3D to simulate a mechanical excavation method has higher accuracy and more realistic simulation effects compared to traditional numerical simulation processes.

4.5. Comparison Between Excavation and Simulation Methods

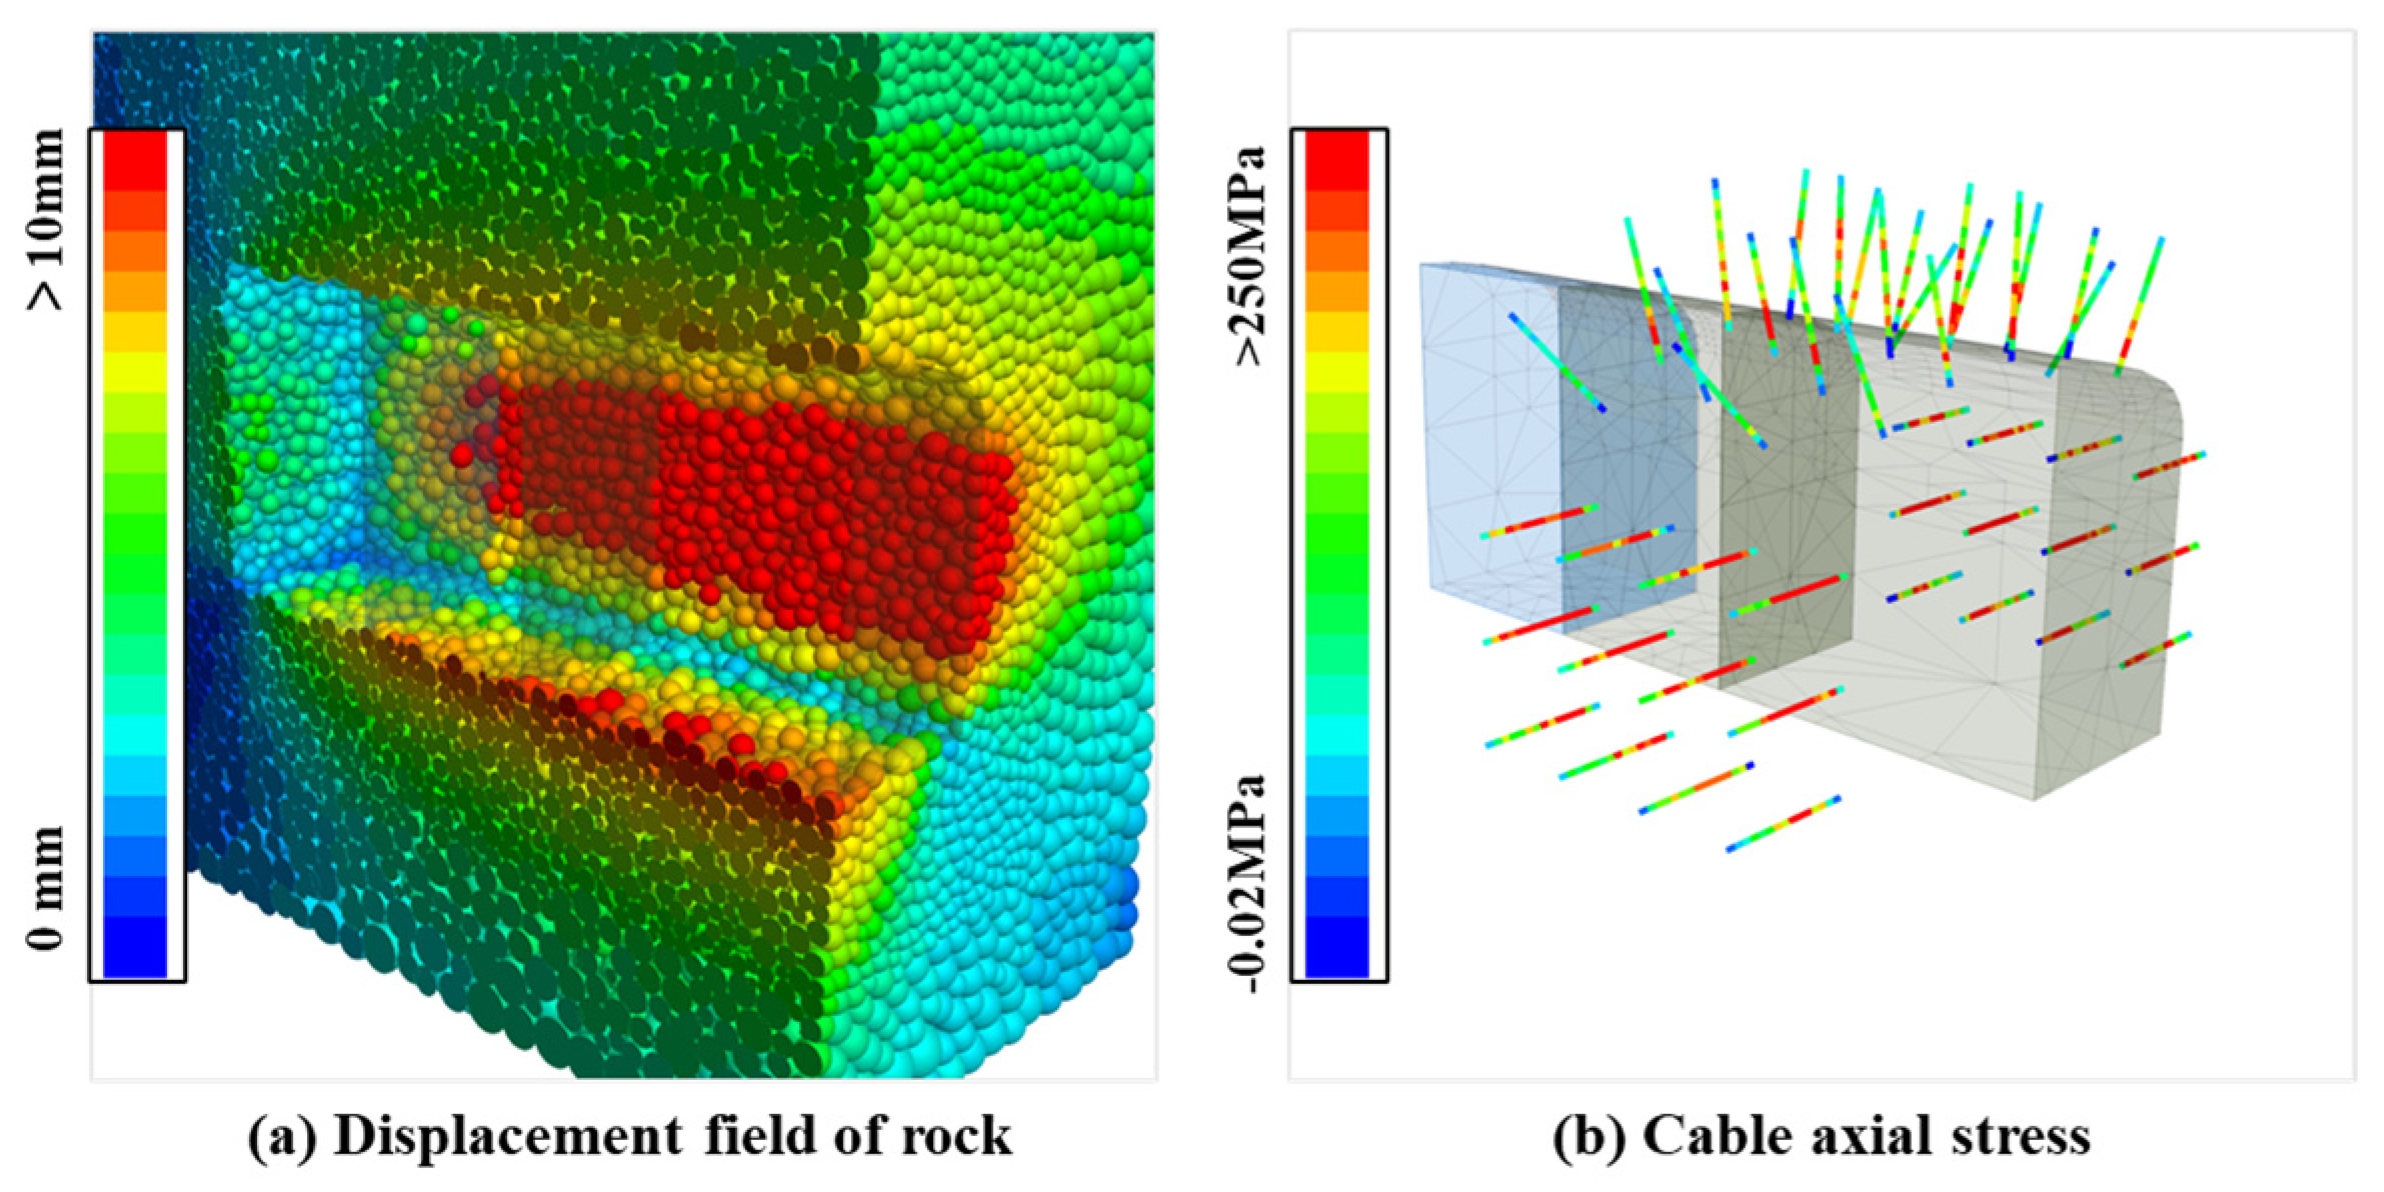
To verify that mechanical rock breaking can cause additional damage to the surrounding rock, we used the excavation method described in Section 3 to reproduce the undisturbed excavation process of the tunnel in the PFC3D model. Figure 18 shows the state of the tunnel’s surrounding rock and anchor rod system under no disturbance excavation. The simulation results show that there are no cracks in the surrounding rock of the newly excavated tunnel, and the surrounding rock particles show a gradual displacement (subgraph a) and no independently stripped red particles (like Figure 12). At the same time, the stress state of the anchor rod remains basically unchanged, which proves that the two excavation methods have an insignificant effect on the existing tunnel, but directly change the safety and stability of the surrounding rock of the new tunnel.
When comparing simulation methods for tunnel excavation, the following conclusions can be drawn:
(1)
The real mechanical excavation simulation of a new tunnel cannot be completed in FLAC3D models, and the “undisturbed” excavation process can only be achieved using the direct deletion method. The deformation of the surrounding rock, anchor deformation, and displacement obtained by this method are slightly larger than those of the PFC3D model, and the difference is due to the different parameter selection principles of the two numerical simulation methods.
(2)
The application of the PFC3D-FLAC3D coupled model can significantly reduce the number of particles and improve computational efficiency. The PFC3D model in this article accounts for 5.2% of the total model volume and contains over 290,000 particles. It is reasonable to speculate that using the large-scale PFC3D model would require at least 2 million particles.
(3)
The direct deletion method can form uniform deformation fields in both FLAC3D and PFC3D tunnel models, ignoring any external disturbances to ensure that the surrounding rock and support structures are in a safer state. On the other hand, the mechanical excavation method in the PFC3D model will result in a certain range of secondary damage and un-stripped rock blocks in the surrounding rock, which is more in line with engineering practice and the previous numerical simulation results of small-scale blade-head rock-breaking. It is recommended to use the FLAC3D and PFC3D coupled models for other types of mechanical rock breaking (such as cross cutters, coal automatic cutters) or hard-rock TBM excavation simulations.

5. Conclusions

Based on the geological conditions and on-site mechanical excavation practices, a three-dimensional numerical simulation of tunnel excavation under inclined strata conditions was performed using a discrete–finite element coupled approach. Systematic analysis of the deformation field, fracture evolution, and anchoring response of the surrounding rock led to the following key conclusions:
(1)
Whether in traditional FEM simulations or DEM models, if the direct deletion method is used to simulate undisturbed or low-disturbance excavation of tunnels, the simulation results cannot reasonably reproduce the damage caused by mechanical cutting to the surrounding rock in real engineering, resulting in tunnels being “safer” in numerical models (because the influence of mechanical cutting process is whole ignored).
(2)
The true triaxial compression stress state constrains the potential impact of weak strata on the tunnel, resulting in a symmetrical distribution of deep displacement and stress fields.
(3)
Due to the maximum external load applied in the horizontal direction, the deformation of the side walls of the tunnel (greater than 10 mm) is significantly greater than that of the surrounding rock of the roof and floor (4–8.5 mm). At the end of the mechanical excavation process, there are still some large deformation particles (with more than 4 cm of movement) remaining on the surface of the tunnel, so these “floating stones” need to be handled carefully in the project. In addition, although the support structure can suppress the deformation of the surrounding rock in the area, the new excavation area needs to complete the support operation in a timely manner (unsupported rock shows a faster deformation rate) to prevent the extreme deformation of the surrounding rock.
(4)
When the first excavation finished, the nodes of the structural element in a yielding state gradually increased (the proportion of the yield region in the tunnel side walls rose from 61.9% to 73.5%), especially the anchor rods in the left and right walls, which were adjacent to the new tunnel surface. The second round of excavation had almost no impact on the state of the supporting structure. Although many anchor rods reached the yield stress after two excavations, their axial stress was still less than the tensile strength, and the anchoring system still worked. However, it is necessary to promptly install new anchor rods in the new tunnel to prevent the existing anchor rods from being subjected to stress that exceeds the threshold.

Author Contributions

Methodology, writing, and review, D.H.; Data and analysis, Z.Z.; Data and analysis, Y.Z. All authors have read and agreed to the published version of the manuscript.

Funding

This research was funded by the National Key Research and Development Program, grant number 2022YFC2904102, and the Natural Science Foundation of Fujian Province under grant number 2023J05112.

Institutional Review Board Statement

Not applicable.

Informed Consent Statement

Not applicable.

Data Availability Statement

The data are not publicly available due to privacy or ethical restrictions, but are available from the corresponding author on reasonable request.

Conflicts of Interest

Author Dan Huang and Zhijie Zheng was employed by the company Beijing General Research Institute of Mining & Metallurgy. The remaining authors declare that the research was conducted in the absence of any commercial or financial relationships that could be construed as a potential conflict of interest.

References

  1. Park, S.; Kim, J.-S.; Kwon, S. Investigation of the development of an excavation damaged zone and its influence on the mechanical behaviors of a blasted tunnel. Geosystem Eng. 2017, 21, 165–181. [Google Scholar] [CrossRef]
  2. Mollo, T.; Sengani, F.; Mahachi, J. Experimental and Numerical Analysis on the Static and Dynamic Performance of Adhesive Bolts in Various Ground Conditions. Appl. Sci. 2025, 15, 10293. [Google Scholar] [CrossRef]
  3. Godio, A.; Oggeri, C.; Seccatore, J. An Analysis of Rock Bolt Dynamic Responses to Evaluate the Anchoring Degree of Fixation. Appl. Sci. 2025, 15, 1513. [Google Scholar] [CrossRef]
  4. Gholipour, M.; Narimani, S.; Davarpanah, S.M.; Vásárhelyi, B. Evaluating Minimum Support Pressure for Tunnel Face Stability: Analytical, Numerical, and Empirical Approaches. J. Exp. Theor. Anal. 2025, 3, 2. [Google Scholar] [CrossRef]
  5. Imashev, A.; Mussin, A.; Adoko, A.C. Investigating an Enhanced Contour Blasting Technique Considering Rock Mass Structural Properties. Appl. Sci. 2024, 14, 11461. [Google Scholar] [CrossRef]
  6. Hashemnejad, A.; Aghda, S.M.F.; Talkhablou, M. Mechanized tunnelling in hydrothermally altered grounds: The effect of hydrothermal fluids on the rock behaviour in the central Iran. Tunn. Undergr. Space Technol. 2020, 99, 103340. [Google Scholar] [CrossRef]
  7. Deng, K.; Gao, J.; Fan, Y.; Yang, G.; Chen, M.; Lu, W. Experimental Investigation on the Mechanical Characteristics of Cement-Filled Joint under Blasting Load. Arab. J. Sci. Eng. 2025, 1–18. [Google Scholar] [CrossRef]
  8. Hekmatnejad, A.; Muñoz, F.; Prado, J.; Saavedra, C.; Roja, E.; Crespin, B.; Aguilar, B. Comprehensive Investigation of the Role of the Geometrical, Topological, and Mechanical Properties of Discrete Fracture Network, Rock Type, and In-Situ Stress on Over-Excavation Around a Tunnel of El Teniente Mine. In Recent Research on Geotechnical Engineering, Remote Sensing, Geophysics and Earthquake Seismology; Springer Nature: Cham, Switzerland, 2024; pp. 69–72. [Google Scholar] [CrossRef]
  9. Parisio, F.; Vilarrasa, V.; Laloui, L. Hydro-mechanical modeling of tunnel excavation in anisotropic shale with coupled damage-plasticity and micro-dilatant regularization. Rock Mech. Rock Eng. 2018, 51, 3819–3833. [Google Scholar] [CrossRef]
  10. Cho, G.-C.; Joo, G.-W.; Oh, T.-M.; Hong, E.-S. New hydro-mechanical tunnel excavation method using an abrasive waterjet system. Jpn. Geotech. Soc. Spec. Publ. 2016, 4, 132–137. [Google Scholar] [CrossRef]
  11. Mussin, A.; Imashev, A.; Matayev, A.; Khussan, B.; Abdrashev, R. Probabilistic analysis application to substantiate support parameters in seismically active and fractured rock masses. Min. Miner. Deposits 2025, 19, 66–75. [Google Scholar] [CrossRef]
  12. Bai, Y.; Li, X.; Yang, W.; Xu, Z.; Lv, M. Multiscale analysis of tunnel surrounding rock disturbance: A PFC3D-FLAC3D coupling algorithm with the overlapping domain method. Comput. Geotech. 2022, 147, 104752. [Google Scholar] [CrossRef]
  13. Hou, R.; Cui, Q.; Guo, Y.; Shi, Y.; Fu, J. A new elasto-visco-plastic damage model and numerical simulation method used for time-dependent behavior prediction of deep tunnel. Comput. Geotech. 2024, 168, 106129. [Google Scholar] [CrossRef]
  14. Min, G.; Fukuda, D.; Oh, S.; Cho, S. Investigation of the dynamic tensile fracture process of rocks associated with spalling using 3-D FDEM. Comput. Geotech. 2023, 164, 105825. [Google Scholar] [CrossRef]
  15. Zheng, Z.; Li, S.; Zhang, Q.; Tang, H.; Liu, G.; Pei, S.; Lu, G. True triaxial test and DEM simulation of rock mechanical behaviors, meso-cracking mechanism and precursor subject to underground excavation disturbance. Eng. Geol. 2024, 337, 107567. [Google Scholar] [CrossRef]
  16. Song, Y.; Yang, S.-Q.; Li, K.-S.; Yin, P.-F.; Pan, P.-Z. Mechanical Behavior and Fracture Evolution Mechanism of Composite Rock Under Triaxial Compression: Insights from Three-Dimensional DEM Modeling. Rock Mech. Rock Eng. 2023, 56, 7673–7699. [Google Scholar] [CrossRef]
  17. Sun, Y.; Kwok, C.Y.; Duan, K. Size effects on crystalline rock masses: Insights from grain-based DEM modeling. Comput. Geotech. 2024, 171, 106376. [Google Scholar] [CrossRef]
  18. Xu, C.; Liu, Q.; Tang, X.; Sun, L.; Deng, P.; Liu, H. Dynamic stability analysis of jointed rock slopes using the combined finite-discrete element method (FDEM). Comput. Geotech. 2023, 160, 105556. [Google Scholar] [CrossRef]
  19. Zhao, Y.; Qi, Q.; Chen, C.; Chen, L. Spalling characteristics of sandstone containing rectangle hole with gradient cavity height: An experimental and DEM numerical study. Theor. Appl. Fract. Mech. 2024, 133, 104550. [Google Scholar] [CrossRef]
  20. Si, X.; Luo, Y.; Luo, S. Influence of lithology and bedding orientation on failure behavior of “D” shaped tunnel. Theor. Appl. Fract. Mech. 2023, 129, 3017–3038. [Google Scholar] [CrossRef]
  21. Zhang, X.-P.; Zhang, P.-Y.; Ji, P.-Q.; Zhang, H.; Zhang, Q. The Applicability of Brazilian Test Loading with Different Platens to Measure Tensile Strength of Rock: A Numerical Study. Rock Mech. Rock Eng. 2023, 57, 233–260. [Google Scholar] [CrossRef]
  22. An, M.; Elsworth, D.; Zhang, W.; Wang, T.; Huang, R.; Huang, L.; Zhang, F. Role of Chlorite on the Friction and Stability of Granite Faults and Implications for Seismicity in Deep Geothermal Reservoirs. Rock Mech. Rock Eng. 2025. [Google Scholar] [CrossRef]
  23. Chen, J.; Ma, J.; Zeng, X.; Zeng, B.; Skrzypkowski, K.; Zagórski, K.; Zagórska, A.; Wu, S. An Enhanced Numerical Calculation Method to Study the Anchorage Performance of Rebars. Materials 2024, 17, 3987. [Google Scholar] [CrossRef] [PubMed]
  24. Takhanov, D.; Zhienbayev, A.; Zharaspaev, M. Determining the parameters for the overlying stratum caving zones during re-peated mining of pillars. Min. Miner. Deposits 2024, 18, 93–103. [Google Scholar] [CrossRef]
  25. Tahmasebinia, F.; Yang, A.; Feghali, P.; Skrzypkowski, K. A Numerical Investigation to Calculate Ultimate Limit State Capacity of Cable Bolts Subjected to Impact Loading. Appl. Sci. 2022, 13, 15. [Google Scholar] [CrossRef]
  26. Huang, H.; Wang, P.; Huang, B.; Jing, G.; Cai, M. Fracturing characteristics of unconfined rock plate subjected to point-plate loading. Eng. Fract. Mech. 2025, 319, 111047. [Google Scholar] [CrossRef]
  27. Zhang, Z.; Wang, X.; Wang, B.; Zhuo, X.; Jia, L. Investigation into the Rock-Breaking Forces of TBM Disc Cutters with Diverse Edge Shapes. Rock Mech. Rock Eng. 2025. [Google Scholar] [CrossRef]
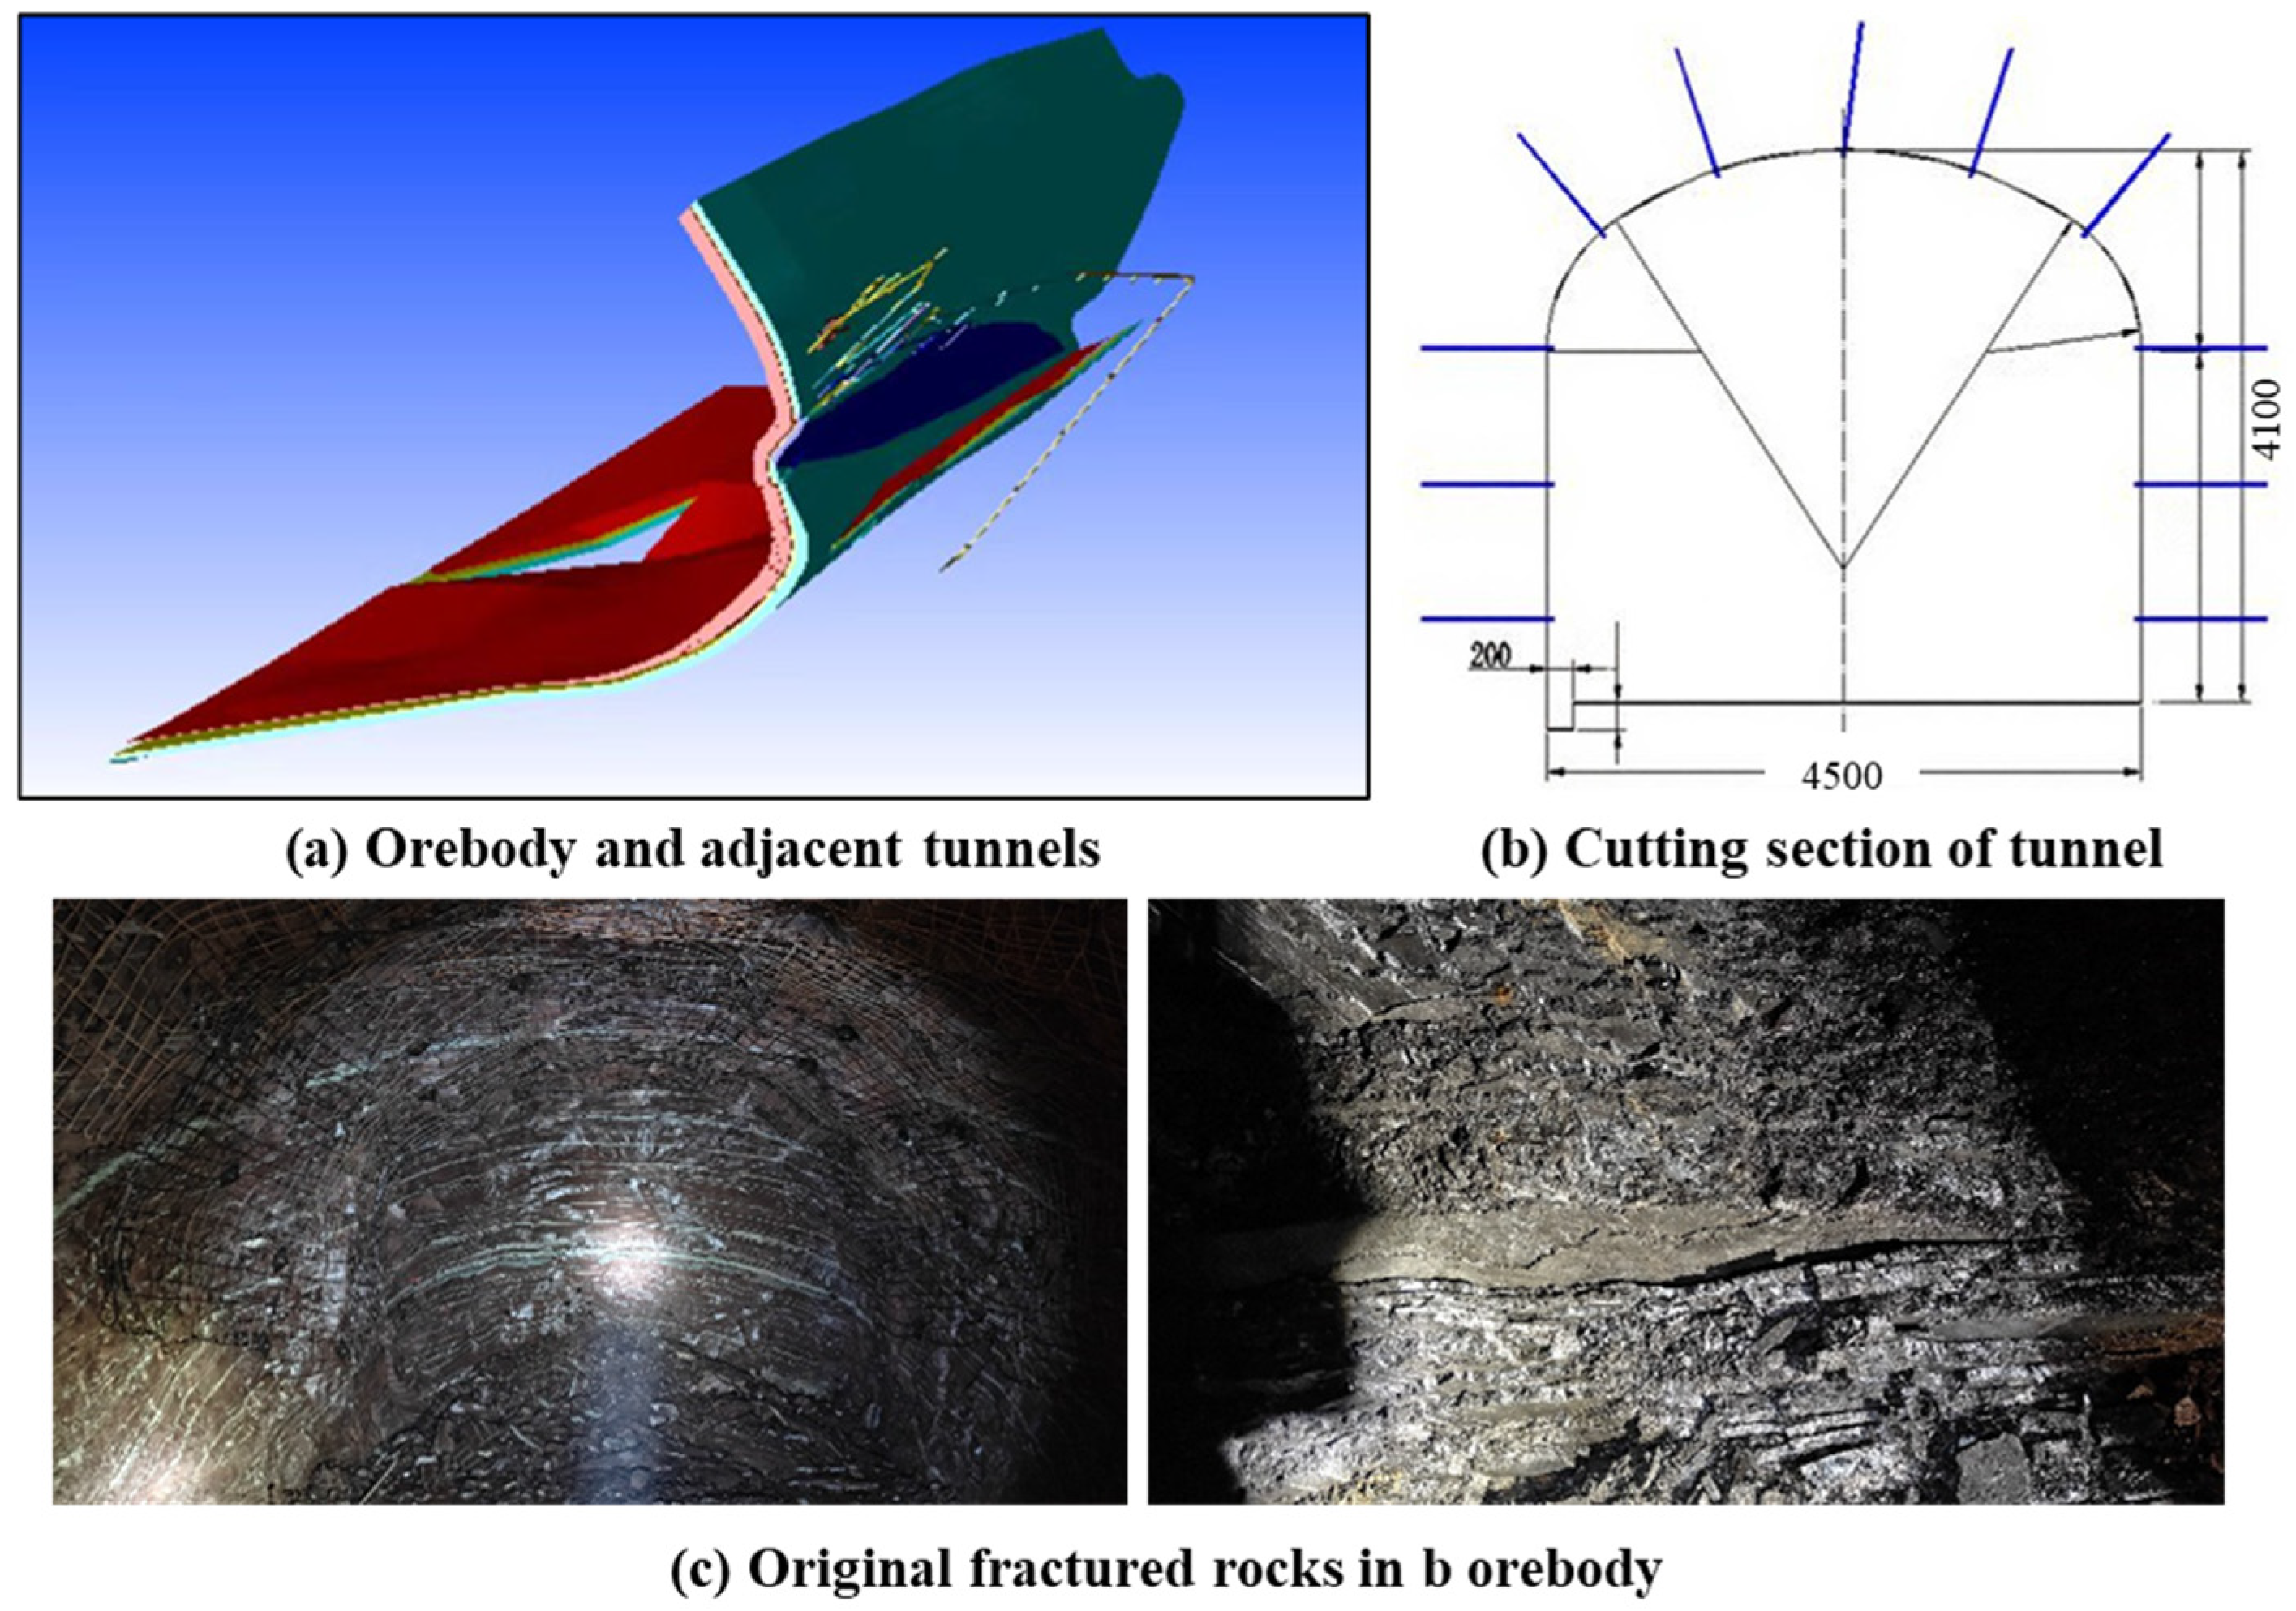
Figure 1. Distribution of the orebody (red part is the B orebody and light blue part is the A orebody) and main assist tunnels (a), tunnel section diagram (b), and the fractured rocks in the case study (c).
Applsci 15 12309 g001
Figure 2. PFC3D-FLAC3D coupled model (a), FLAC3D model (b) and boundary conditions of the numerical model (c).
Applsci 15 12309 g002
Figure 3. The meso-mechanical properties of the PFC3D model at different scales (The 0.1 * 0.05 in the horizontal axis annotation represents a sample height of 0.1 m and a width of 0.05 m).
Applsci 15 12309 g003
Figure 4. Simplified model of the drill (a,b), excavation order in the tunnel section in PFC3D (c), and the full-section excavation in FLAC3D (d).
Applsci 15 12309 g004
Figure 5. Deformation field of the existing tunnel before and after excavation.
Applsci 15 12309 g005
Figure 6. Deformation field and vectors of the tunnel at different excavation stages.
Applsci 15 12309 g006
Figure 7. The maximum and minimum principal stress fields of the tunnel.
Applsci 15 12309 g007
Figure 8. Distribution of the plastic zone at different excavation stages and in various cutting sections.
Applsci 15 12309 g008
Figure 9. Cable status in the surrounding rock of the existing tunnel at two excavation stages.
Applsci 15 12309 g009
Figure 10. Fragment status and secondary failures caused by mechanical cutting [26]. (a) local rock fragment during test; (b) fragment status of particles in PFC3D model; (c) the influence region caused by the drilling head.
Applsci 15 12309 g010
Figure 11. Displacement field and vectors of the tunnel at two rounds of excavations.
Applsci 15 12309 g011
Figure 12. Displacement field of the particles during the progressive excavation.
Applsci 15 12309 g012
Figure 13. Deformation and radial stress curve of the surrounding rock based on the data of the measured points.
Applsci 15 12309 g013
Figure 14. Displacement and axial stress of the cable system at different stages.
Applsci 15 12309 g014
Figure 15. Principal stress status of the surrounding rock along the tunnel strike direction (x = 0 m).
Applsci 15 12309 g015
Figure 17. Crack distribution maps and micro-mechanical mechanics of local failure.
Applsci 15 12309 g017
Figure 18. Displacement field of the surrounding rock and cable axial stress as a new tunnel is directly excavated in the PFC3D model.
Applsci 15 12309 g018
Table 1. The mechanical parameters of the rocks obtained from the underground mine.
Rock StrataDry Density
(g/cm3)
Saturation Rate
(%)
UCS
(MPa)
Elastic
Modulus
E/GPa
Poisson’s Ratio
μ
Tensile
Strength
(MPa)
Cohesion
c/MPa
Internal Friction Angle φ/(°)
B orebody roof2.671.11%45.377.500.214.637.2554.57
B orebody2.8014.24%21.353.100.224.134.7042.52
Week layer2.815.45%28.953.600.234.745.8645.94
A orebody3.000.77%72.618.500.2811.2114.2647.10
A orebody bottom2.860.35%144.6876.240.138.0816.2863.4
Table 2. Numerical simulation microscopic parameters applied in FLAC3D.
ParametersA Orebody BottomA OrebodyWeek LayerB OrebodyB Orebody Roof
Density (g/cm3)3.002.862.812.802.67
Bulk modulus (GPa)18.315.331.745.565.26
Shear modulus (GPa)13.823.200.451.852.29
Cohesion (MPa)2.101.500.190.650.70
Fric5747263839
Table 3. Microscopic parameters of the numerical simulation applied in PFC3D.
Mirco-ParametersB Block Rock (Values)B Block Roof (Values)
Particle minimum radius Rmin0.15 m0.15 m
Ratio of the particle maximum-to-minimum radius Rrat1.661.66
Particle assembly porosity0.080.08
Damping coefficient0.70.7
Particle density ρ2800 kg/m32670 kg/m3
Young’s modulus of particles1.0 GPa1.0 GPa
Young’s modulus of parallel bonds3.0 Pa3.0 Pa
Normal-to-shear stiffness ratio of the parallel bond kn/ks1.01.0
Parallel bond tensile strength8.1 MPa6.5 MPa
Parallel bond cohesion strength 9.05 MPa20.1 MPa
Friction angle between particles φ42.554.5
Table 4. The mechanical parameters of the cable structure.
GroupProperties
Cross-sectional area of the anchor rod3.8 × 10−4 m2
Cross-sectional area of the drilling hole12.57 × 10−4 m2
Young (combined status of steel and cement-based material)98.6 × 10⁹ Pa
Yield–tension310 × 103 Pa
Grout stiffness2 × 107 Pa
Crout cohesion10 × 105 Pa
Length of the anchor rod1.5 m
Diameter of the anchor rod22 mm
Type of materialQ235
Tensile strength of the anchor rod400 MPa
Yield strength of the anchor rod250 MPa
Element number in one cable15
Grout lengthFull length
Disclaimer/Publisher’s Note: The statements, opinions and data contained in all publications are solely those of the individual author(s) and contributor(s) and not of MDPI and/or the editor(s). MDPI and/or the editor(s) disclaim responsibility for any injury to people or property resulting from any ideas, methods, instructions or products referred to in the content.