Article

Rock Cutting and Crack Propagation of Jointed Rock Mass Within Rough Fractures Based on Point-Splitting Process

1
Key Laboratory of High Efficient Mining and Safety of Metal Mines, Ministry of Education, University of Science and Technology Beijing, Beijing 100083, China
2
National Key Laboratory of Intelligent Coal Mining and Rock Formation Control, Beijing 100013, China
3
School of Resources and Safety Engineering, University of Science and Technology Beijing, Beijing 100083, China
*
Author to whom correspondence should be addressed.
Appl. Sci. 2025, 15(22), 12312; https://doi.org/10.3390/app152212312
Submission received: 25 October 2025 / Revised: 16 November 2025 / Accepted: 17 November 2025 / Published: 20 November 2025
(This article belongs to the Section Earth Sciences)

Abstract

The rock is the direct object of disc cutter rock-breaking engineering. It contains natural joint surface. To investigate the influence of joint-surface roughness on the rock-breaking process. The hob model is created using AutoCAD software. The single- and twin-hob rock-breaking processes in intact rocks are simulated with PFC (Particle Flow Code) software. Furthermore, a rough joint network model is established based on MATLAB platform. The influence of joint-surface roughness on failure mode, crack propagation, and rock-breaking load is examined. The results reveal that cutter spacing in intact rock markedly governs the trends of rock-breaking load and crack count. The damage zone extends from the disc cutter–rock contact surface into the specimen interior. The rock-breaking process is mainly dominated by shear cracks. Fracturing of the rock mass occurs along the structural plane, and the force chain and crack propagation mainly distribute through tensile cracks. The initial structural plane of failure gradually penetrates the rock mass surface, resulting in the failure zone development. While considering joint roughness, the RDFN (Rough Discrete Fractures Network) model exhibits higher disc cutter contact force than the DFN (Discrete Fracture Network) model. Throughout the rock-breaking period, both RDFN and DFN models intersect in the number of cracks, but the difference between the two models remains significant. The contact force of the cutter in the RDFN and DFN models differs from that in whole rock. These findings offer a useful reference for elucidating the hob-breaking mechanism in jointed rock masses.

1. Introduction

Mechanical rock-breaking, which has witnessed significant advancements in technology, is now widely used in mining, tunnelling, railway, construction, and other relevant fields. Hob rock-breaking, in particular, finds extensive usage in such fields. Hob rock-breaking is a complicated process that depends on different factors, including the strength of the rock body, the hob’s structural and working parameters, among others. These factors affect the outcome of the rock-breaking in diverse ways. It is thus imperative to study the mechanism of hob rock-breaking thoroughly to break deep rock and hard rock layers with greater efficiency. The conventional hob rock breaking model is shown in Figure 1.
Numerous scholars have conducted extensive research on the rock-breaking mechanism of hobs. Field tests and numerical simulations reveal that optimal hob spacing is inversely proportional to rock strength. The rock strength is directly proportional to the specific energy consumption of rock-breaking [1]. An indoor experiment was performed to investigate the impact of pre-cut groove on the hob-breaking effect in various types of lithology. The results indicated that pre-cut groove depth has a critical value for reducing the normal load of rock-breaking. However, exceeding this value weakens the breaking effect [2]. The influence of the proximity face on hob-breaking effect was analysed by combining the discrete element method with an indoor line-cutting experiment. Considering the complexity of the rock-breaking environment, the efficiency of a single rock-breaking method is reduced for certain specific formations, thus the study of multiple methods coupled rock-breaking plays a crucial role [3]. This report outlines the current techniques for breaking coal roadway, semi-coal rock roadway, and hard rock roadway. It also recommends several effective measures for fast rock-breaking of roadways, and suggests that hard rock-breaking technology in mines should move in the direction of coupling a variety of rock-breaking technologies and integrating mine rock-breaking equipment with intelligent rock-breaking [4]. A thermal–mechanical coupling rock-breaking method is suggested for higher TBM (Tunnel Boring Machine) construction efficiency in very hard rock formations. The rock-breaking effect and applicability of auxiliary TBM rock-breaking method were studied, and useful references were provided for the coupling of multiple rock-breaking methods [5]. A new method for rock-breaking, called laser-assisted hobbing, has been proposed, and its applicability and effect on rock-breaking parameters have been evaluated through numerical simulation. The numerical simulation has confirmed the applicability of the method, and the parameters related to the rock breaking effect meet the theoretical requirements [6]. The aforementioned research findings demonstrate that the factors responsible for hob-breaking interact in a complex manner. The efficiency of hob-breaking can be enhanced by employing relevant auxiliary methods depending on the particular situation.
The rock fracture mechanism offers theoretical backing for examining the hobbing rock breaking process. Geotechnical researchers have performed numerous laboratory experiments and numerical simulations to extend fractures in undamaged rocks, fissured rock bodies, and combined rock formations. To investigate the development of fracture process zone of the indoor three-point bending type I petrological test, a combination of DIC method and acoustic emission localization technology was used, which helped determine the boundary range of the rock fracture process zone [7]. To address the issue of type I/II crack propagation in a coal rock body, an indoor test was conducted to establish the PPR cohesive cracking model. Coal and mudstone were subjected to SCB and PTS experiments, respectively. The results of the experiment demonstrated that coal specimens exhibited more pronounced ductile fracture characteristics when compared to mudstone [8]. Prefabricated fissures exert dominant control on soft rock failure and stability [9]. The laws of rupture which govern microwave heating action were examined from macro, fine, and micro perspectives on rocks of diverse lithologies. In addition, the geological conditions under which rock fragmentation using microwaves was carried out were also deduced. The study’s discoveries reveal the laws of intact rock rupture. Nonetheless, in real rock engineering difficulties, the rock tissue’s intactness and its properties deviate greatly. Therefore, the investigation of rock rupture is exceptionally significant [10]. An experimental–numerical method was employed to analyse the effect of different crack lengths on sandstone materials, including the crack’s expansion rate and rock sample fracture toughness. It was observed that the difficulty of starting cracks increased with the crack length, and so did the expansion rate [11]. The issue of the size effect on crack extension was examined by combining AE and DIC techniques through static loading parallel double-fracture tests of different sizes. The results suggest that the crack extension speed is not significantly affected by different sizes, but the direction of its extension is affected [12]. A three-dimensional model of rocks that includes random cracks was created on the ABAQUS platform. The researchers conducted triaxial numerical simulations and indoor tests, which revealed a significant correlation between the intermediate principal stresses and the direction of the primary cracks. This discovery is of great significance to practical engineering problems related to rock fractures [13]. The influence of bedding plane strength and parallel pre-crack spacing on the crack development of layered rock mass is analysed using laboratory tests and numerical simulation methods. The study shows that the crack propagation direction in layered rock mass is governed by the strength of the bedding plane, whereas the pre-crack spacing has an impact on the main crack length of rock [14]. We performed indoor experiments, in combination with numerical simulations, to analyse the effect of laminar strength and parallel pre-crack spacing on crack development in layered rock formations. Our findings suggest that the direction of crack extension is influenced by laminar strength, whereas pre-crack spacing is negatively correlated to the direction of the crack. These results have crucial practical implications for engineering endeavours. The laminar strength controls the direction of crack extension in laminar rock formations, while the spacing of pre-cracks influences the length of the primary cracks in the rock [15]. A rock specimen containing fissure roughness was produced using 3D printing technology. The development and extension path of cracks, as well as the rock damage process under dynamic loading, were analysed through impulsive impact experiments [16]. A three-dimensional bonded block damage model is proposed to investigate the influence of layered joints on rock-mass excavation [17]. The preceding findings suggest that fissures exert a considerable impact on the formation and propagation of fractures in rocks. Rock bodies’ mechanical properties have a size effect, and examining characterised rock bodies’ unit size forms the core theory to analyse fissured rock bodies’ hob-breaking mechanism. The researchers utilised Unmanned Aerial Vehicles (UAVs) and their structural algorithms to characterise rock formations in a quarry [18]. A method has been proposed to characterise rock structures by integrating photogrammetry and semi-automated measurements [19]. LiDAR and DOS techniques were utilised to obtain information on the structural surface, which was combined with DFN modelling methods for the characterisation of the rock body [20]. Borehole data are used to characterise the rock-mass unit, revealing a pronounced scale effect on its structure [21]. A digital rock-mass model is developed using UAV, machine-learning and laboratory analyses, which provides a reference for characterising rock mass units [22]. A three-dimensional discrete element method was employed to analyse the circumferential pressure’s effect on the unit size of a jointed rock body. The results of the test show that an increase in peripheral pressure of less than 20 MPa leads to a unit size increase. Beyond 20 MPa of peripheral pressure, there is no effect on the unit size. These results laid a theoretical foundation for the characterisation of engineering jointed rock bodies [23]. Recreating the geometric characteristics of the rock formation was made possible by combining fractal theory with 3DEC 5.0 code, using field investigation data [24]. Based on 3D printing technology, the fractured rock mass samples reveal pronounced scale effects in compressive strength and failure mode [25]. The experimental testing shows that altered rock peak strength decreases with increasing specimen size [26]. The effect of joint geometry on the mechanical properties of the rock body was investigated, and a method of characterising the RDFN model with consideration to joint geometry was proposed. Anisotropy tests on this model were conducted using the PFC2D 3.0 code. The PFC platform facilitated the study of the anisotropic mechanics of the rock body. The results indicated a significant relationship between joint geometry and mechanical properties of the rock body. This study offers a new approach to examine the mechanical characteristics and to characterise complex rock bodies [27,28].
The research findings were utilised for constructing the hob model through the AutoCAD 2018 platform. The hob rock fracture mechanical analysis model was created via PFC3D to assess the effect of rock fracture and crack extension of the hob with varying penetration speeds and hob spacings in intact rock. The three-dimensional DFN model and the RDFN model were also constructed using MATLAB 2021 software to analyse the impact of structural surfaces and their roughness on the generation and extension of rock fracture cracks.

2. Establishment of Rock Breaking Model

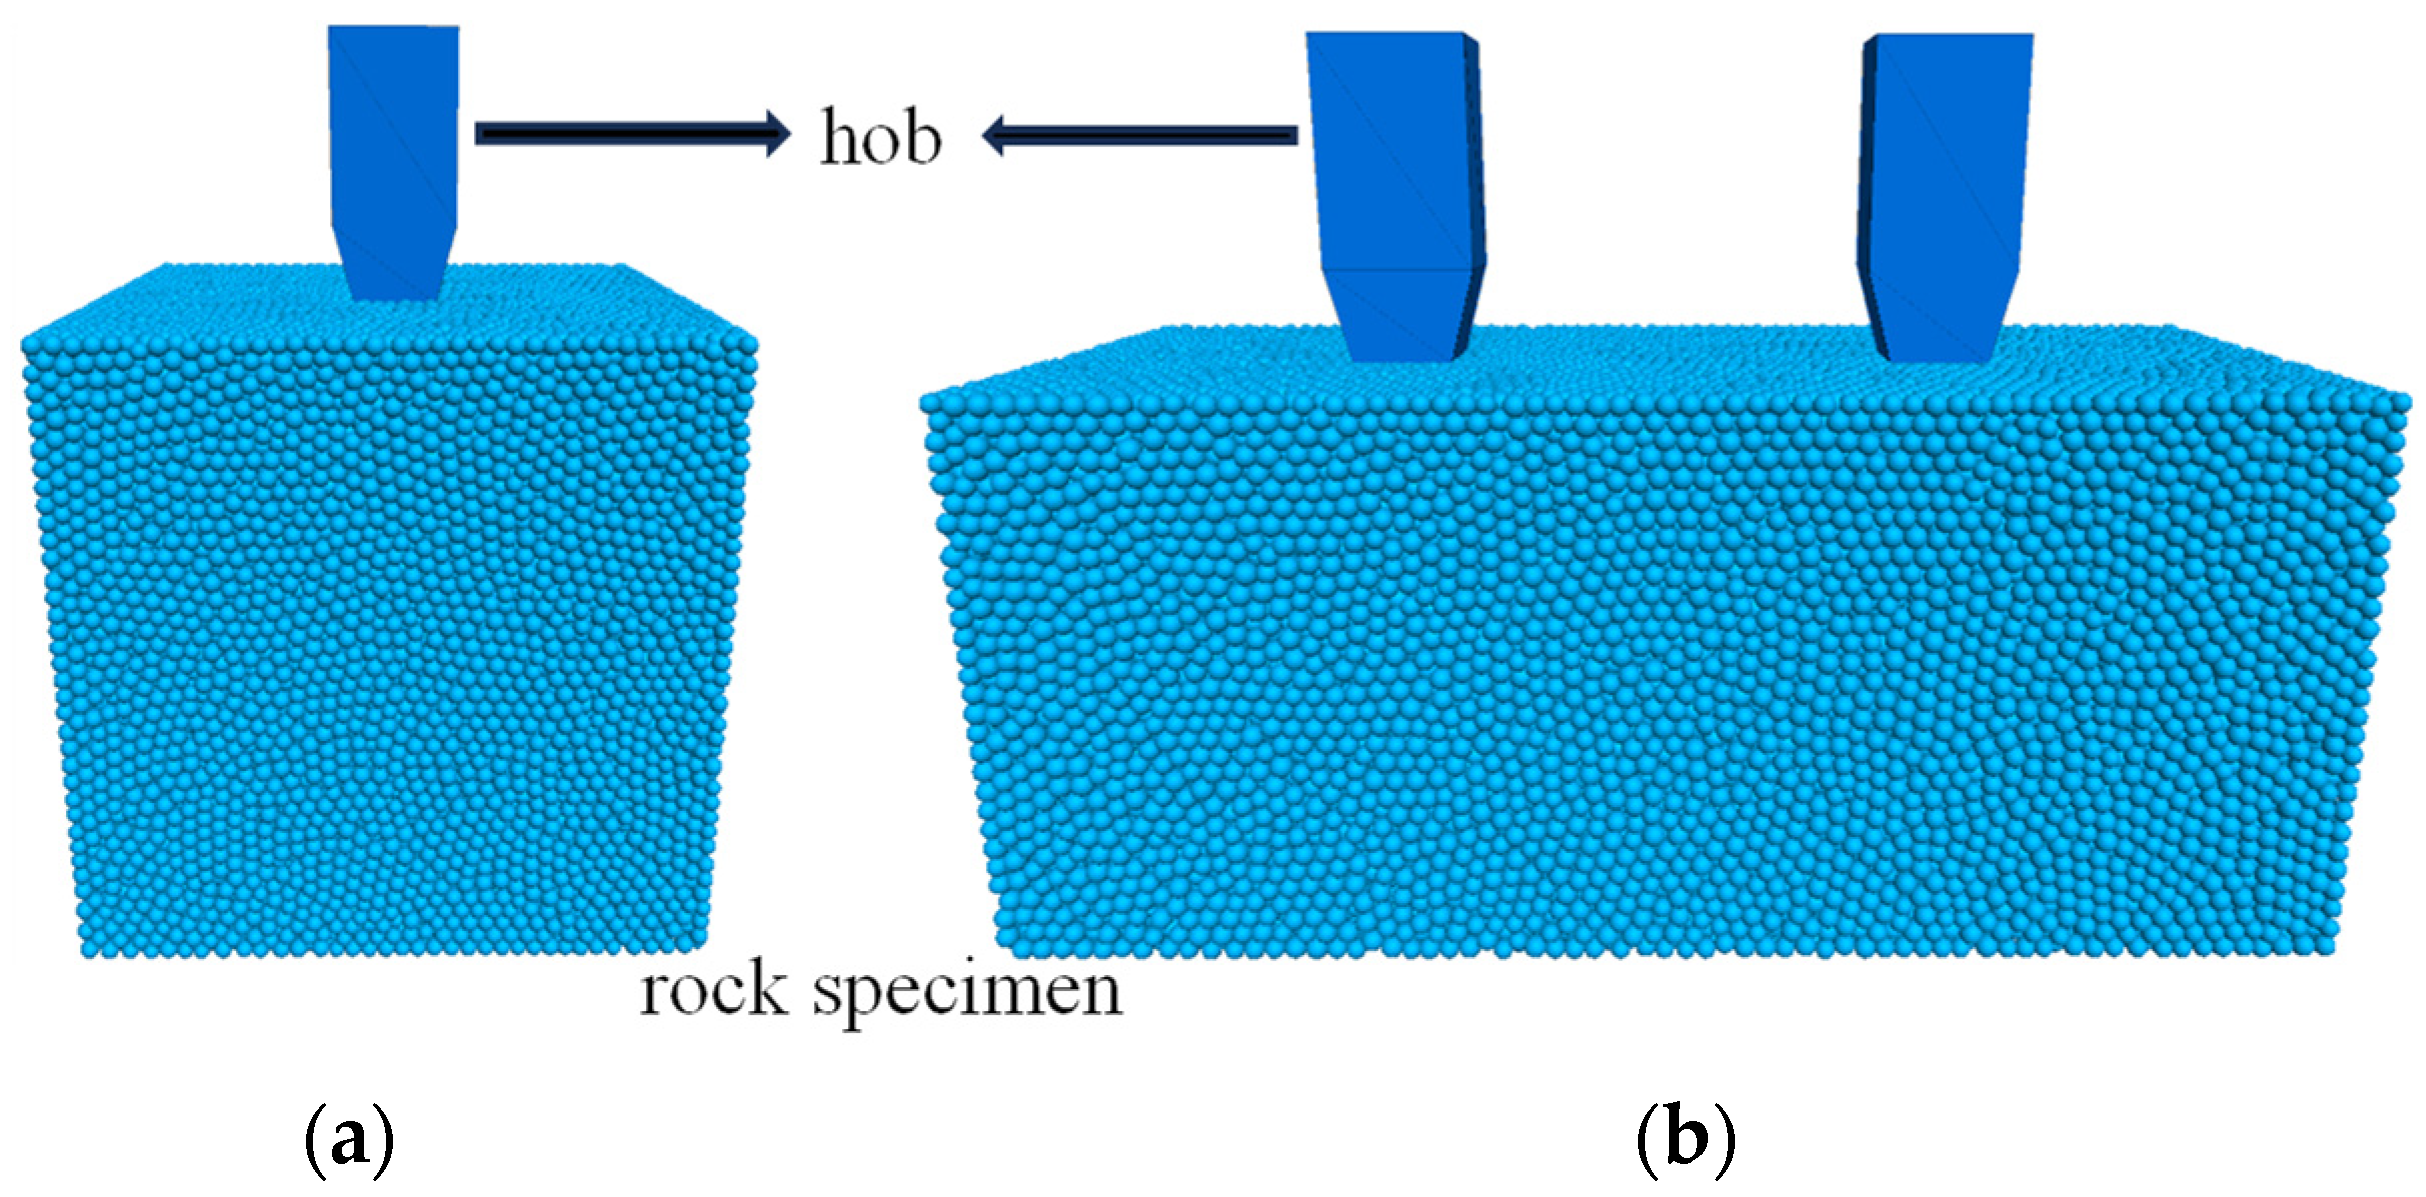
The efficiency of rock-breaking with a hob is determined by the mechanical properties of the rock, hob, the operational parameters, and the external environment. With a fixed external environment, both the petrological properties and hob parameters affect the efficiency of hob rock-breaking. A three-dimensional hob model, illustrating the square cross-sectional shapes, was created on the AutoCAD software, and then imported into the PFC3D numerical simulation software to establish a three-dimensional hob rock-breaking mechanical analysis model to investigate the efficiency of hob rock-breaking. The efficiency of hob rock-breaking for these shapes was analysed with different hob encroachment speeds and hob spacing conditions. Figure 2 illustrates the mechanical analysis model of the square single hob with an encroachment speed of 0.036 m/s, along with the square side-by-side double hob with a hob spacing of 150 mm.
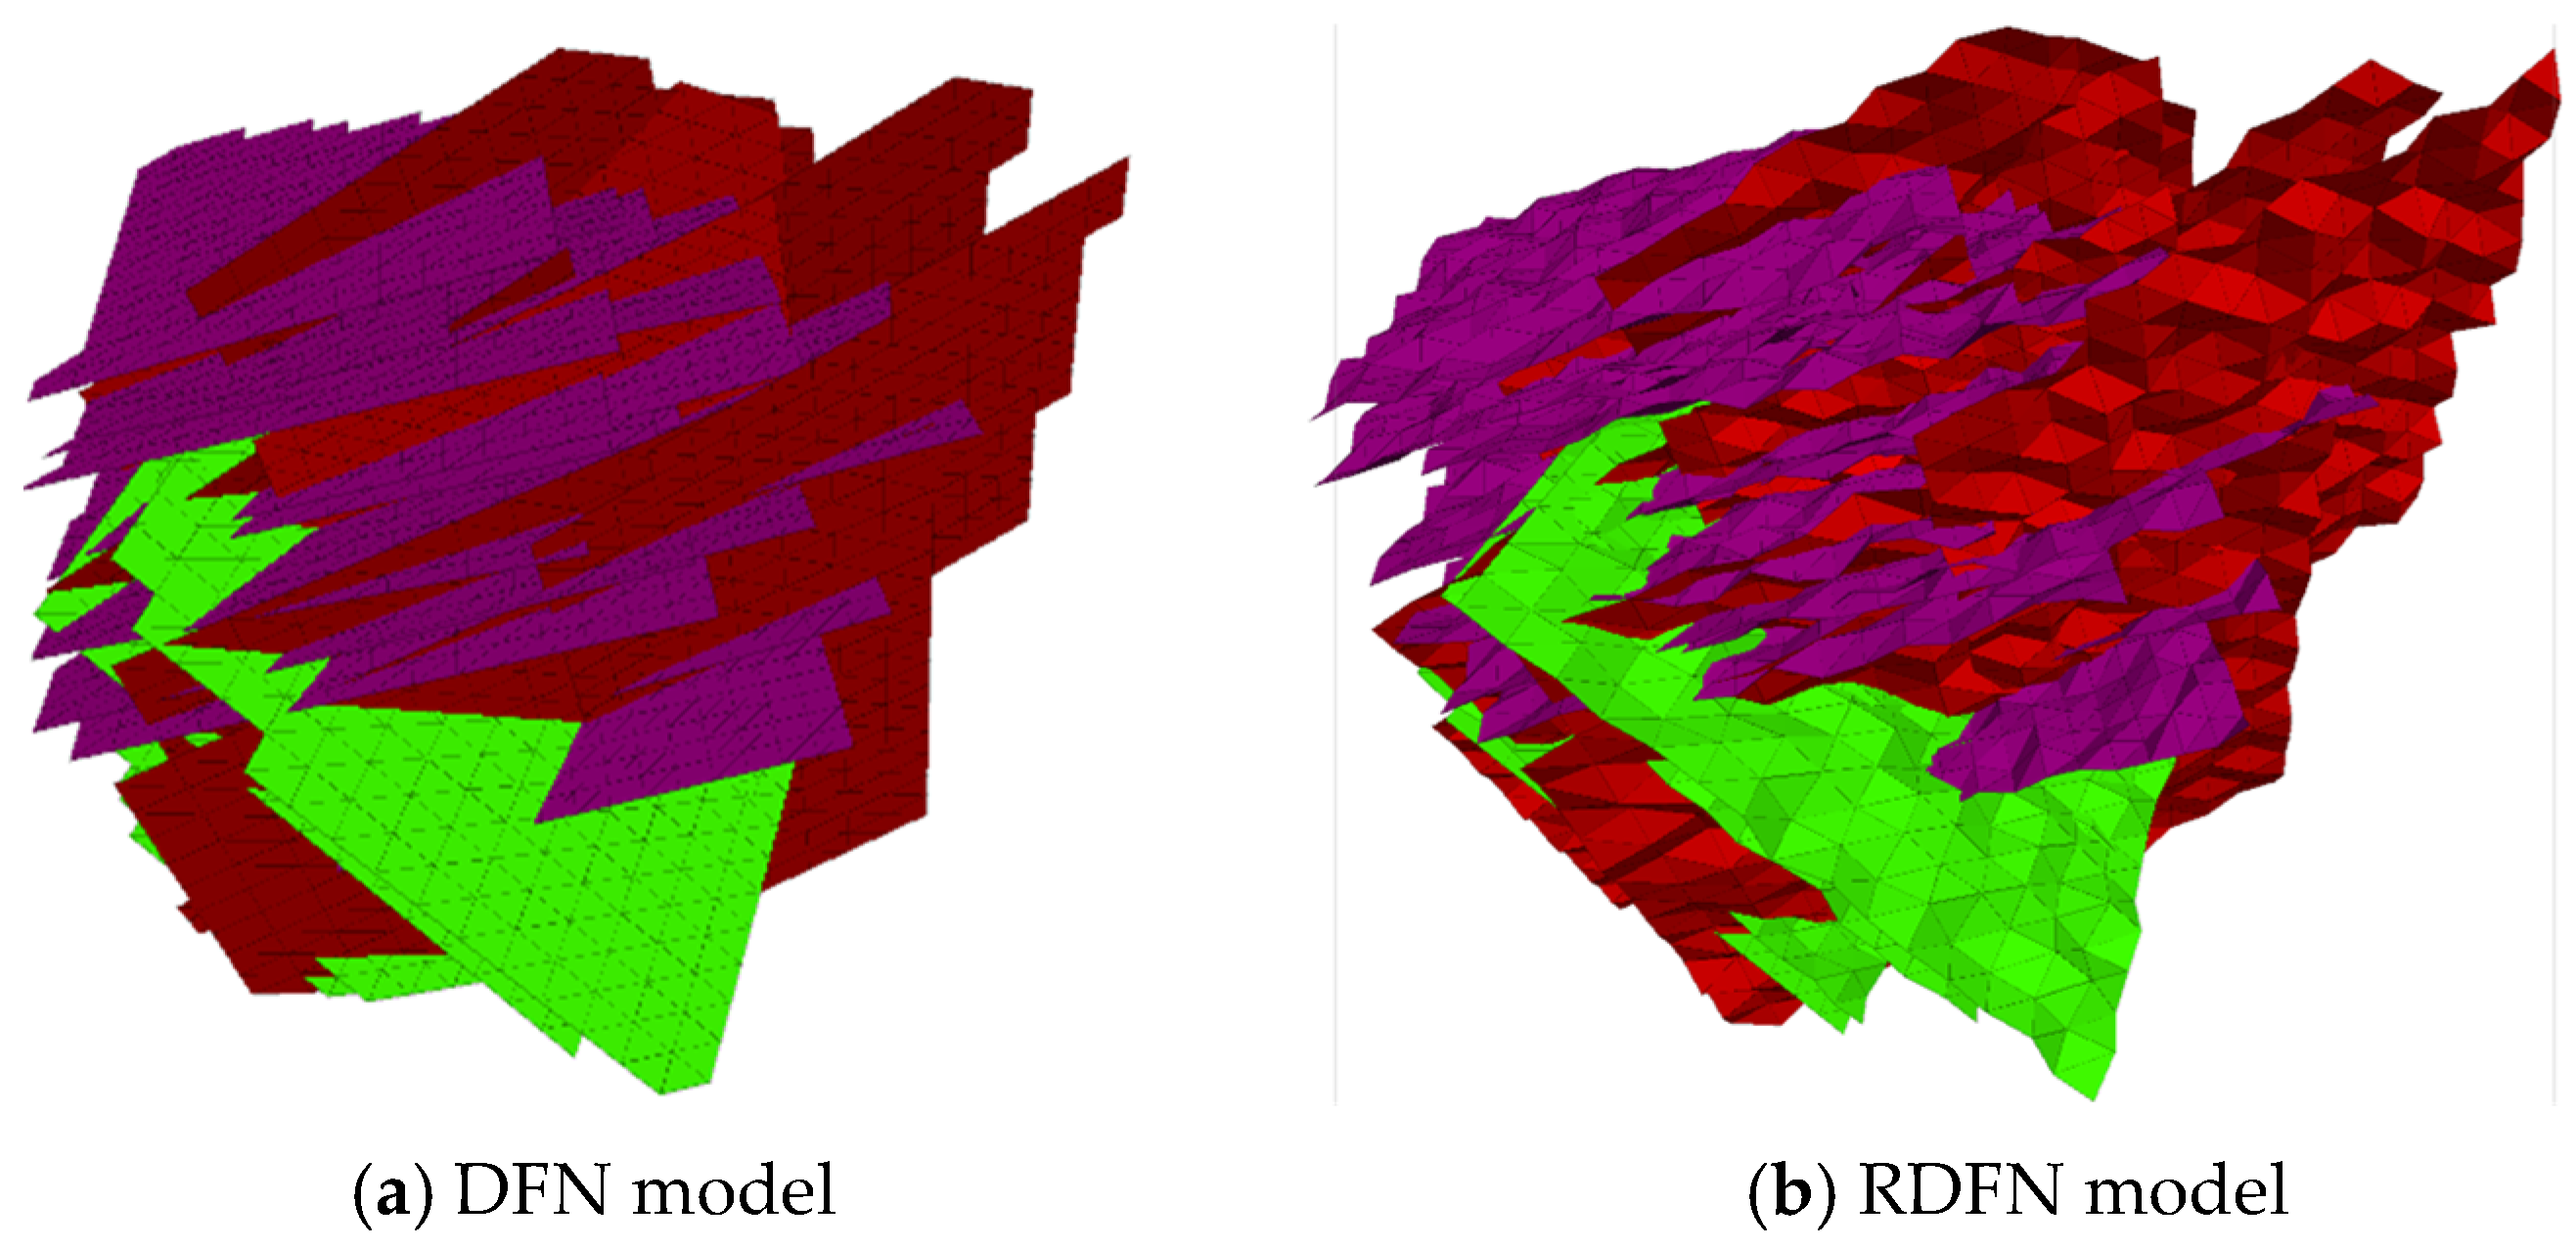
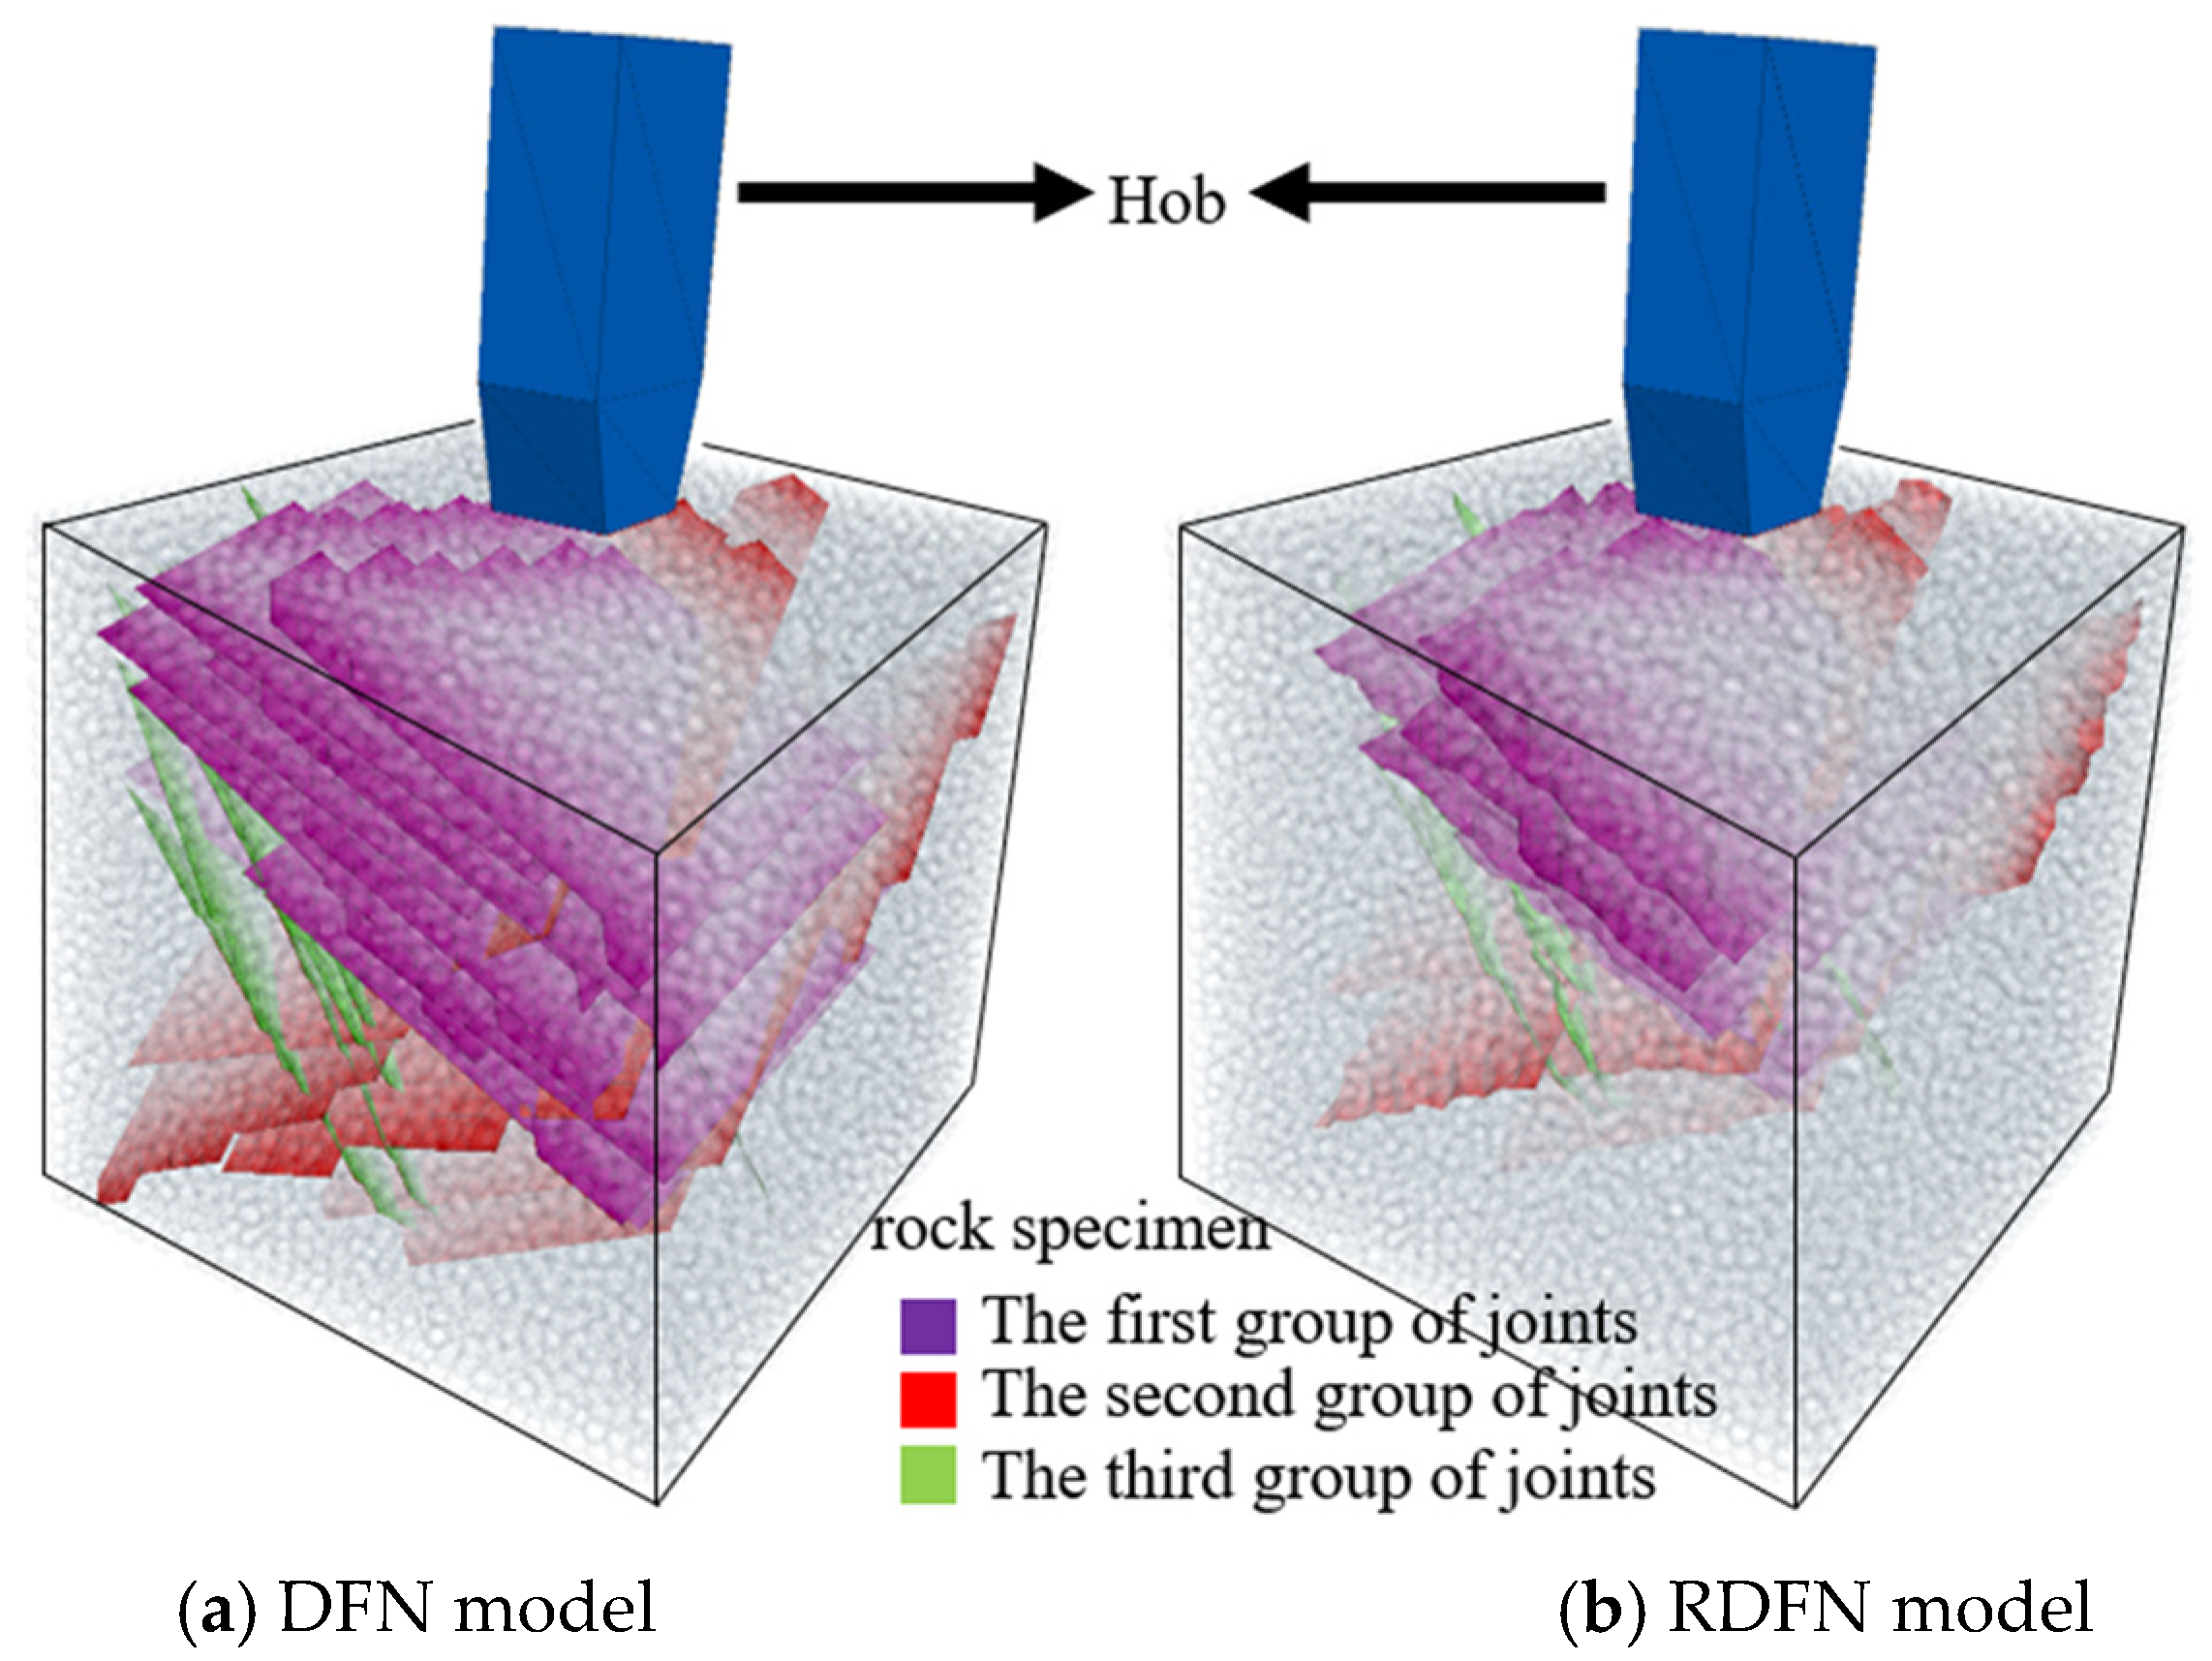
After the strength of the structural body exceeds a specific threshold, the mechanical characteristics of the rock body are determined mainly by the mechanical properties of the structural surface. The development of hobbing rock-breaking techniques for rock bodies that contain joints and fissures plays a crucial role in addressing practical engineering challenges. To account for the roughness characteristics of the structural surface, the MATLAB platform is utilised to create a three-dimensional DFN (Discrete Fractures Network) model with smooth joints and a RDFN model that features roughness of the discrete network (see Figure 3). The combination of the DFN and RDFN models enables the intuitive replication of joint geometrical distribution and roughness characteristics in the rock. To conduct mechanical analysis of the hob-breaking process, the PFC3D numerical simulation platform imported the DFN and RDFN models. The influence of joint roughness on the hob-breaking effect in hard rock was investigated (see Figure 4). Every mechanical analysis model utilises a linear parallel contact model, which is thoroughly outlined in Table 1 and describes the refined mechanical parameters.

3. Complete Rock Breaking

3.1. Hob Speed

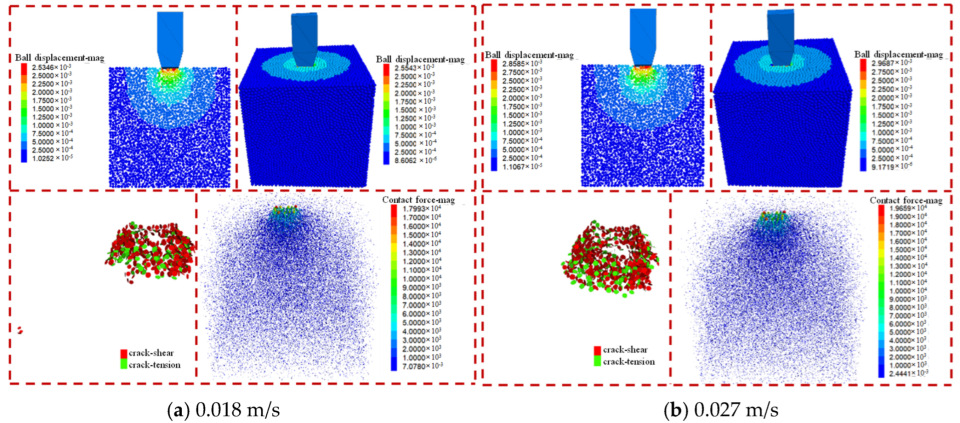
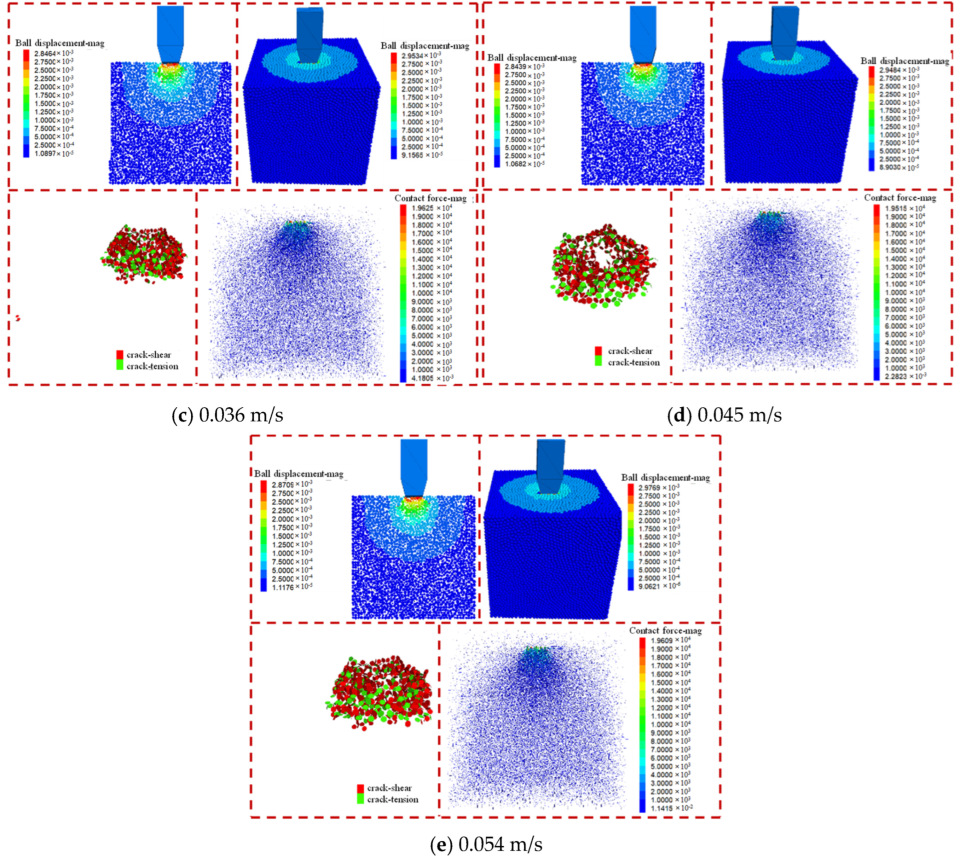
According to Figure 5, the force chain predominantly concentrates on the shallow part of the hob and rock contact, and the force chain density gradually decreases around the contact between the disc cutter and the rock. With the increase in hobbing speed, the force chain in the deep region of the rock appears to distribute uniformly; and at the rate of 0.027 m/s, the force chain value inside the rock decreases, and the maximum force chain value becomes visible on the surface of contact between the hob and the rock. An investigation into the rock’s displacement field reveals evident changes in the shallow part of the rock, where the axis profile direction changes progressively as a circular arc shape from east to west. The alteration trend decreases gradually from the rock surface towards the deeper part of the rock. Furthermore, the hob encroachment speed and rock displacement values increase progressively until a speed of 0.027 m/s, after which they decline gradually, while at 0.045 m/s, they show an inclining trend. There is a considerable effect on the damage zone during the complete rock-breaking process.
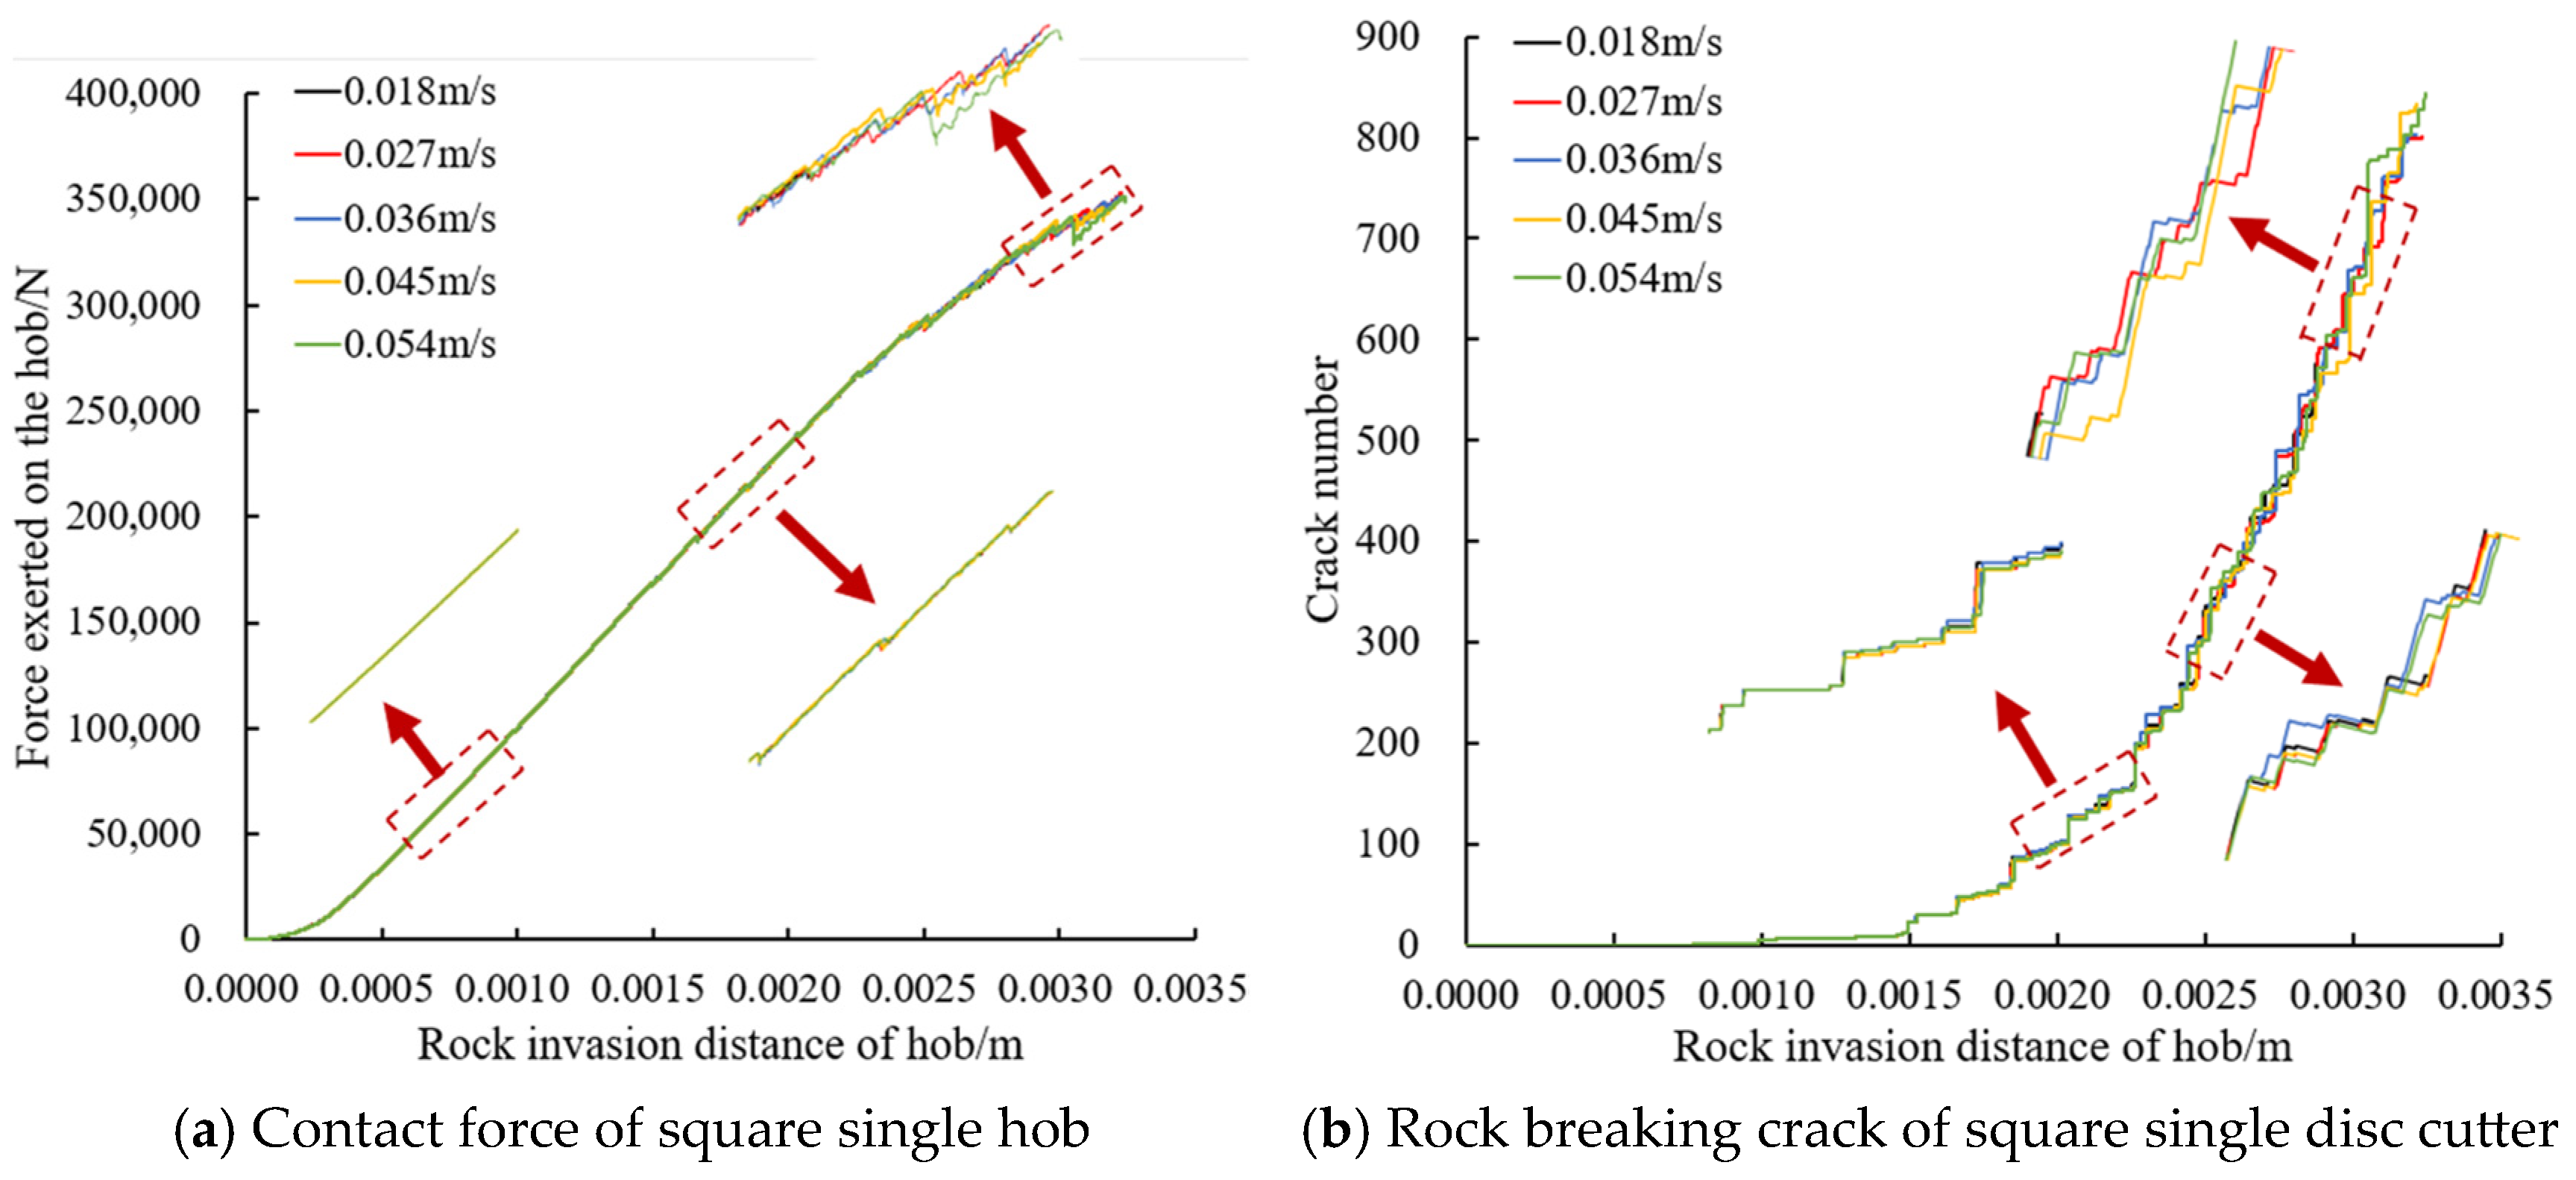
A scrutiny of the crack development in Figure 5 and the rock-breaking curve shown in Figure 6 indicates that the hob contact force and the number of damaged cracks increase continuously throughout the rock-breaking operation. When the hob’s depth of penetration is the same, the hob contact force marginally varies with increasing encroachment speed, and this change is only noticeable in the final phase of rock-breaking when the growth rate starts to drop. Damaged cracks primarily consist of shear cracks and are mainly produced at the contact points between the hob and the rock. During the early crack development stage, their distribution tends to follow the hob section’s boundary. These cracks also exhibit a tendency of propagating inside the rock. Nevertheless, their development along the vertical direction of the hob is minimal. At hob speeds of 0.018 m/s or 0.036 m/s, the rock’s side surface displays indications of a worn-out and constrained area. In the early stages of rock-breaking, the cracks develop at a slow pace. Over time, the rate of crack growth increases, and this shift appears in a step-like manner throughout the period of rock-breaking. Although the hob speed increased, the number of cracks did not alter significantly with an identical hob penetration distance. This condition emerged due to a significant rock zone formation that had the potential to cause damage, thereby impeding the rock’s strength during the hob intrusion process.

3.2. Hob Spacing

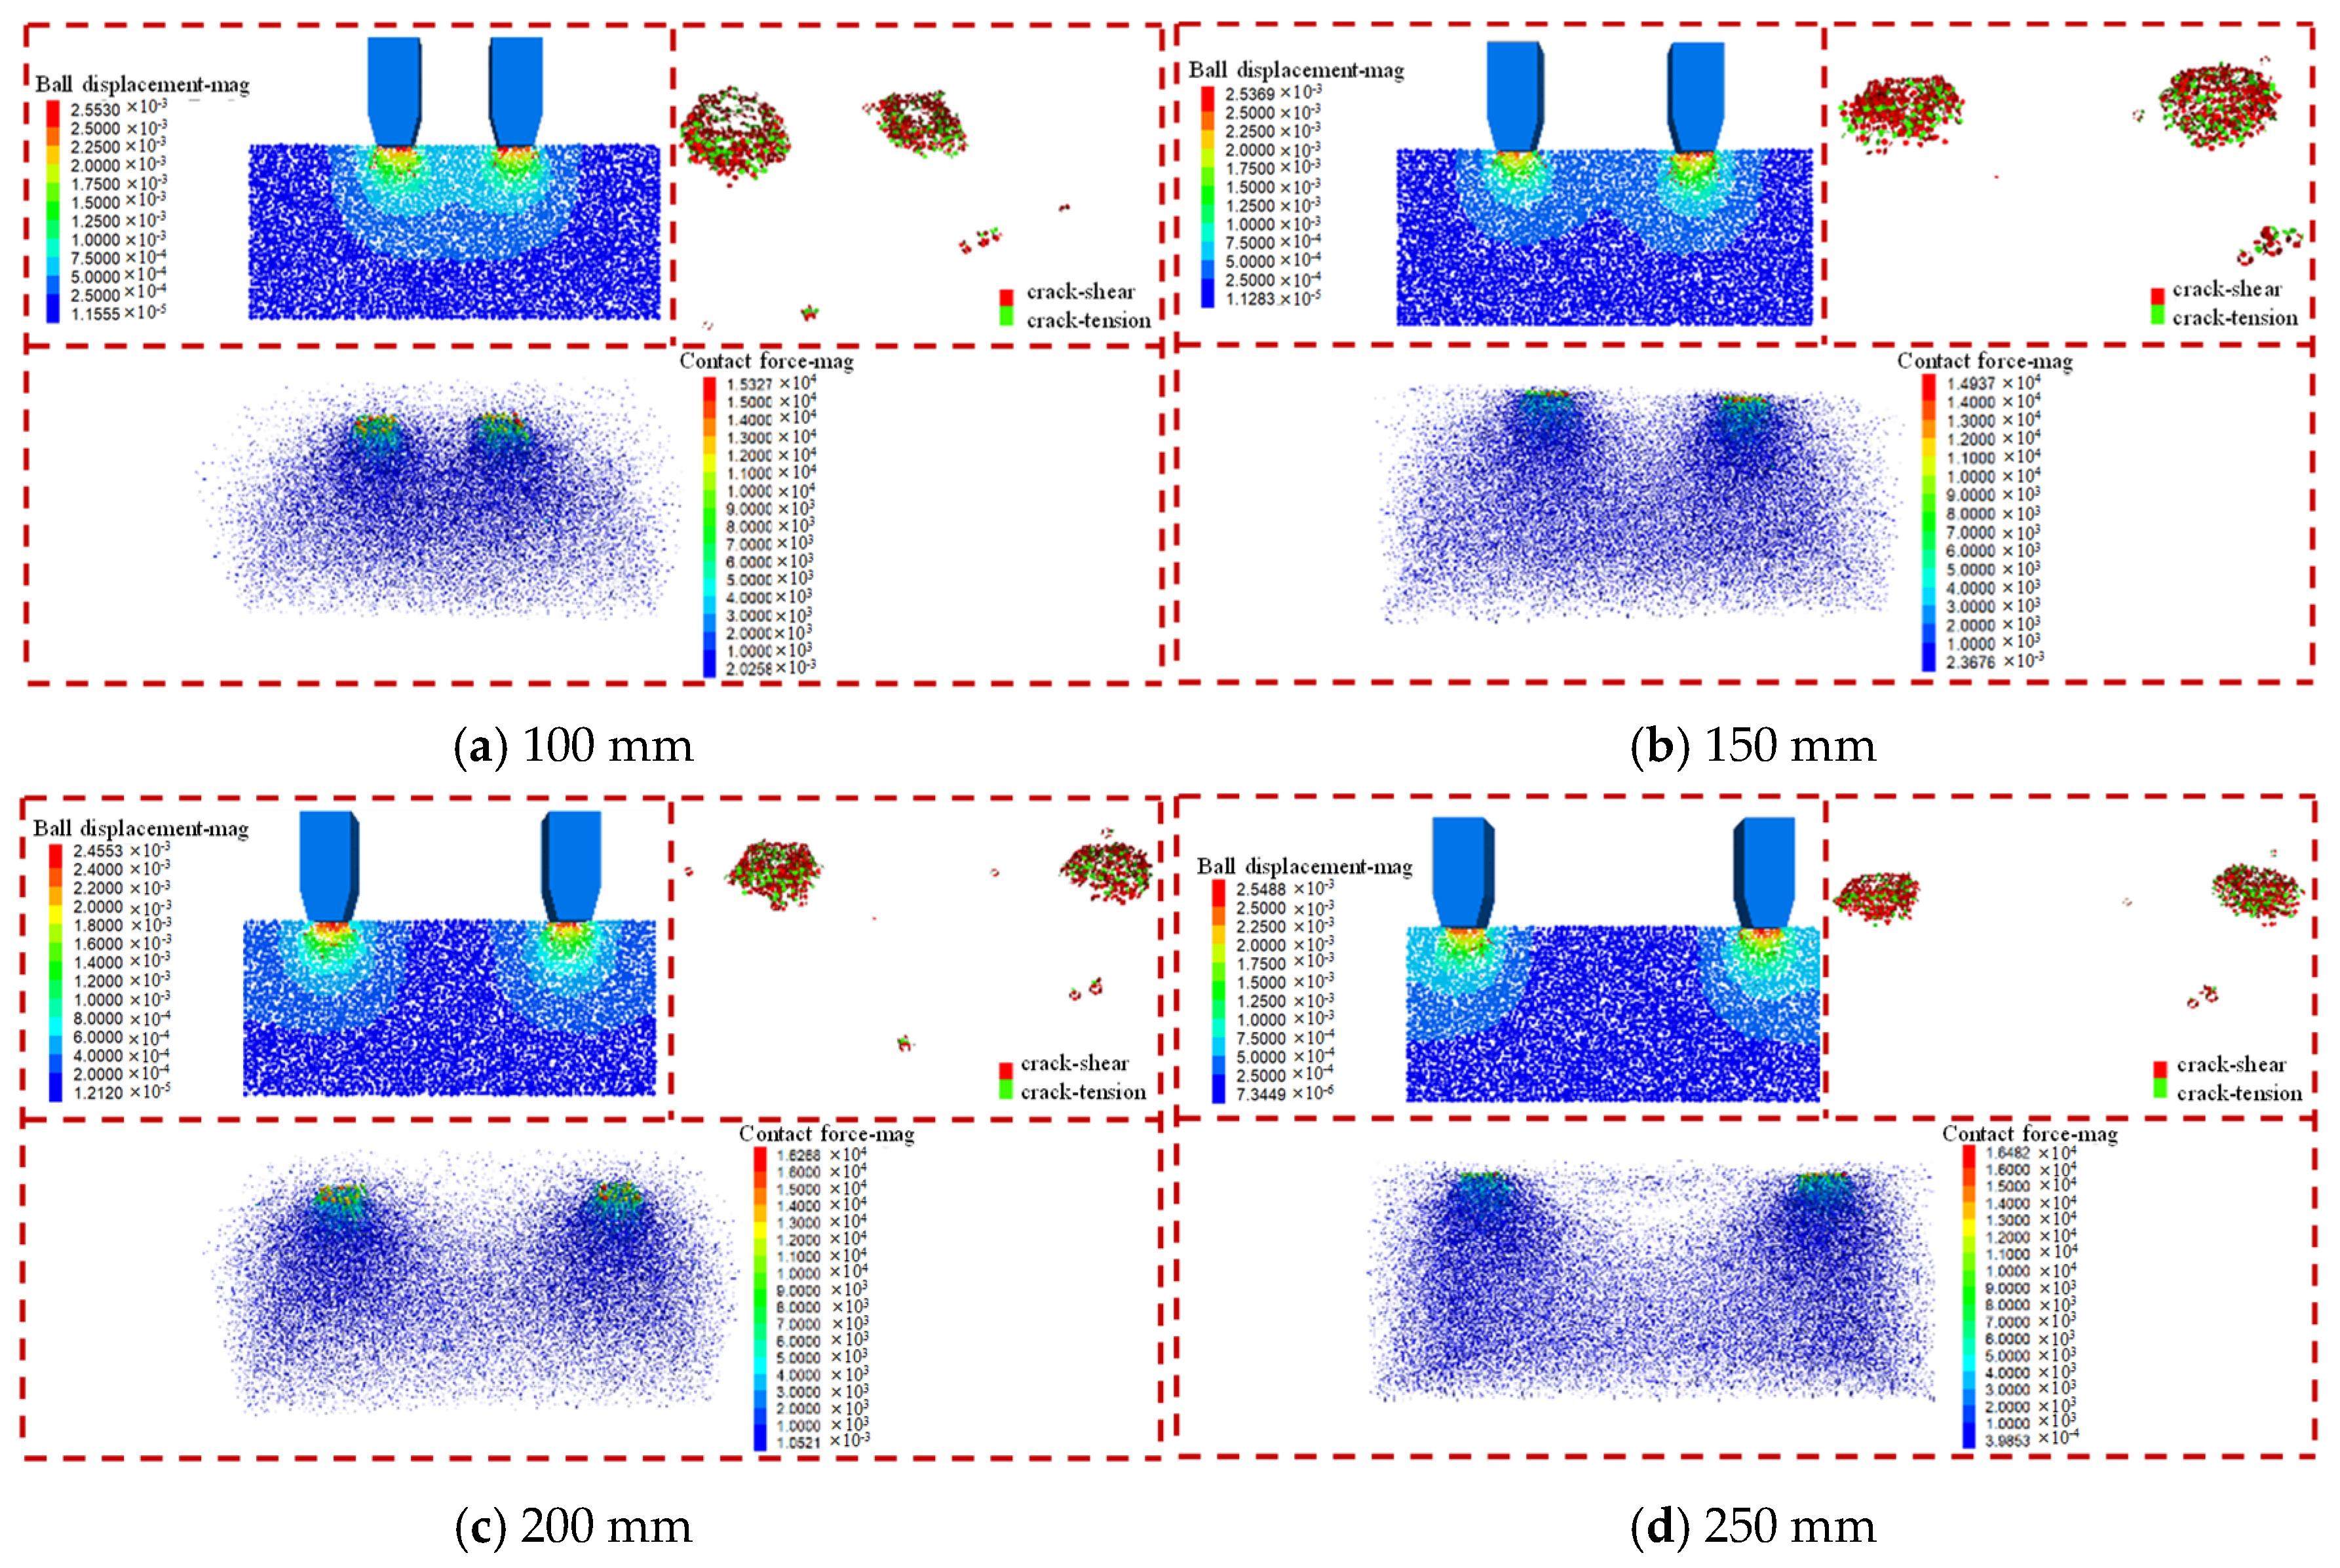
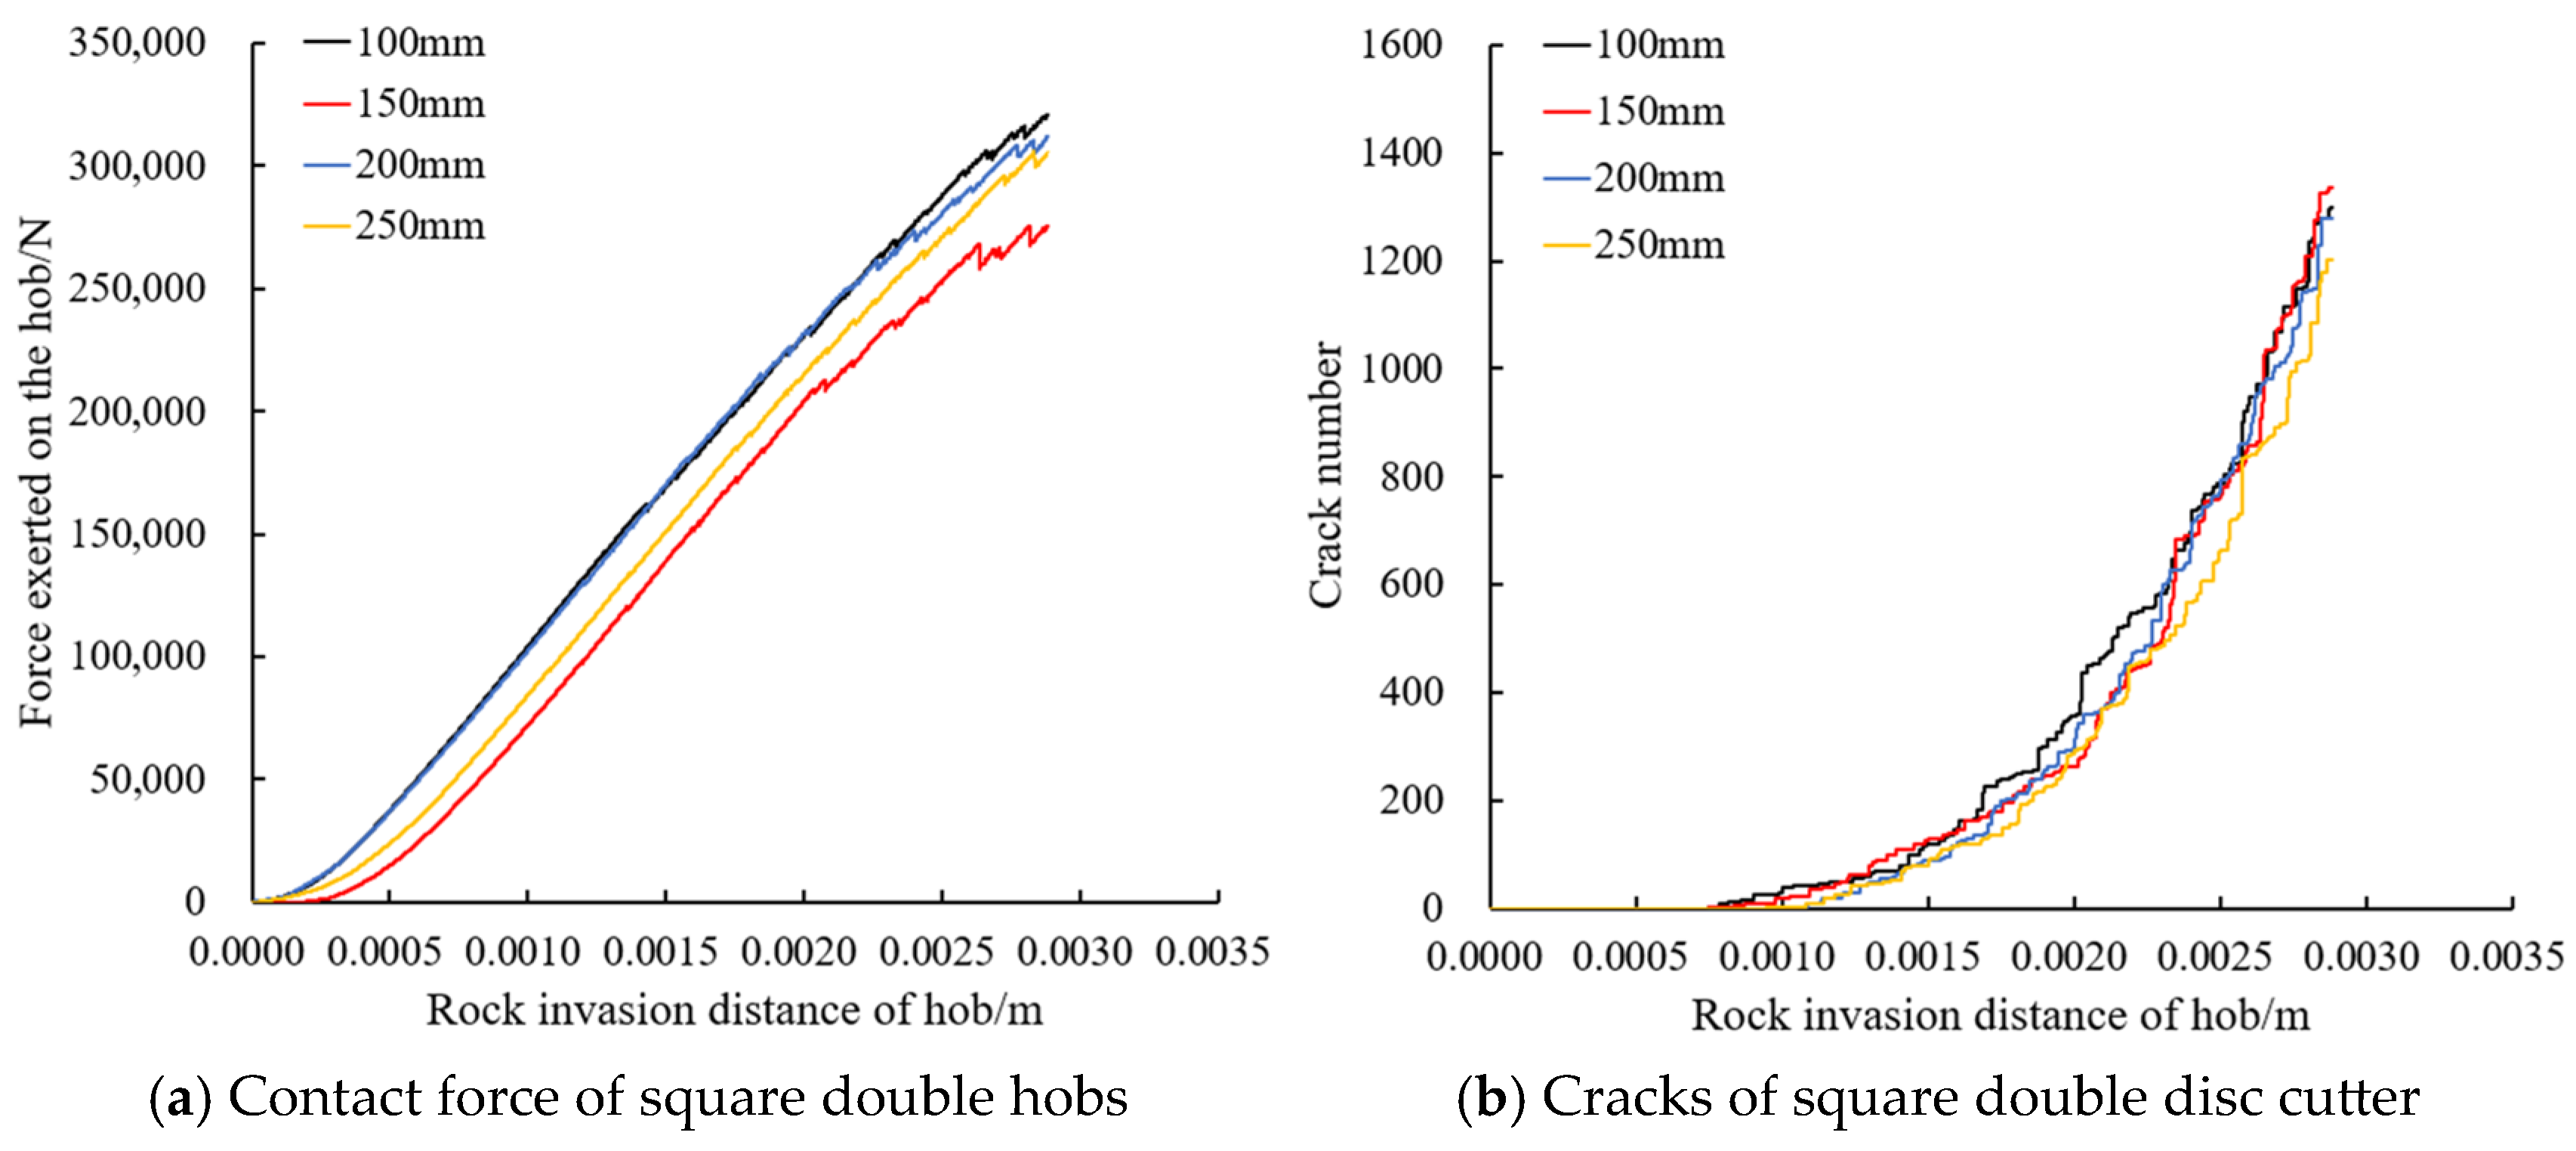
Figure 7 shows a side-by-side double hob cracking effect, while Figure 8 illustrates the resulting cracking curve. The number of cracks increases gradually, in small increments, and the rate of change accelerates steadily during the entire cracking period. The initial time of crack occurrence is inversely proportional to the spacing between the hobs when it ranges from 100 mm to 200 mm. Moreover, when the hob encroachment distance is kept constant, the number of cracks varies in a wavy manner as the hob spacing is increased. The change amplitude is greater than what is observed for single hob rock-breaking. In comparison to single hob rock-breaking, both cracks in double hob rock-breaking are distributed along the hob cross-section boundary during the early stages of crack development. The cracks have an inclination towards the rock interior while the cracks in the hob’s vertical direction are developed gradually, with shear cracks being the primary type. A further distinguishing factor is that the use of dual hobs in rock-breaking produces a local area of damage on the side of the rock under each working condition. During the rock-breaking process, a noticeable alteration in displacement occurs in the shallow section of the rock, which gradually diminishes from the surface to the interior. If the hob spacing is under 200 mm, the damage to the rock tends to create a waviness in the east–west axis direction, appearing between the hobs. However, if the hob spacing is 200 mm, the transitional zone is no longer present. As hob spacing broadens, the impairment area shifts to the Eastern and Western ends of the rock, with a reduction in displacement of the damage zone once the spacing between hobs reaches 200 mm. When the hob spacing attains 200 mm, the displacement of the damage zone shows a decreasing pattern.
The contact force of the hob demonstrates a progressive trend throughout the entire rock-breaking duration. Intermittent, small-amplitude changes are shown in the later stage. At an equivalent hob penetration distance, the hob contact force shows apparent, undulating changes during the rock-breaking operation of a single hob. During the later stages of rock-breaking, the amplitude of change escalates, and the contact force of the hob is at its maximum when the hob spacing is 100 mm. During rock-breaking, the hob contact force is at its minimum when the hob spacing is 150 mm, and at hob spacings of 100 mm and 200 mm, the hob contact force remains comparable to each other. During the breaking period, the contact force is at its smallest at a hob spacing of 150 mm. The contact force shows a similar trend when the hob spacing is 100 mm and 200 mm in the intermediate and later stages of rock-breaking. The force chain distribution law is similar to that of rock-breaking using a single hob. The increase in hob spacing leads to a decreasing force chain distribution density until a hob spacing of 200 mm. Beyond this limit, the tendencies show an increase, forming a dynamic interval where force chain distribution density is sparse between the hob and the rock. The range is directly proportional to the hob spacing, and the value of the force chain changes with small amplitude as the hob spacing increases. The maximum value occurs at the contact between the hob and the rock.

4. Rock-Breaking of Jointed Rock Mass

Additional research is underway to investigate the rock-breaking mechanism and crack development process in practical engineering rock bodies by breaking rock hobs in fissured rock formations. We have analysed the effect of nodal roughness on the breaking of rock hobs in rock formations modelled with the DFN model, as well as in rock bodies modelled with the RDFN model, using a single square hob. We have gained initial insights into the effect of moderate roughness on the nodal surface of the rock body and its impact on rock-breaking efficiency.

4.1. DFN Model

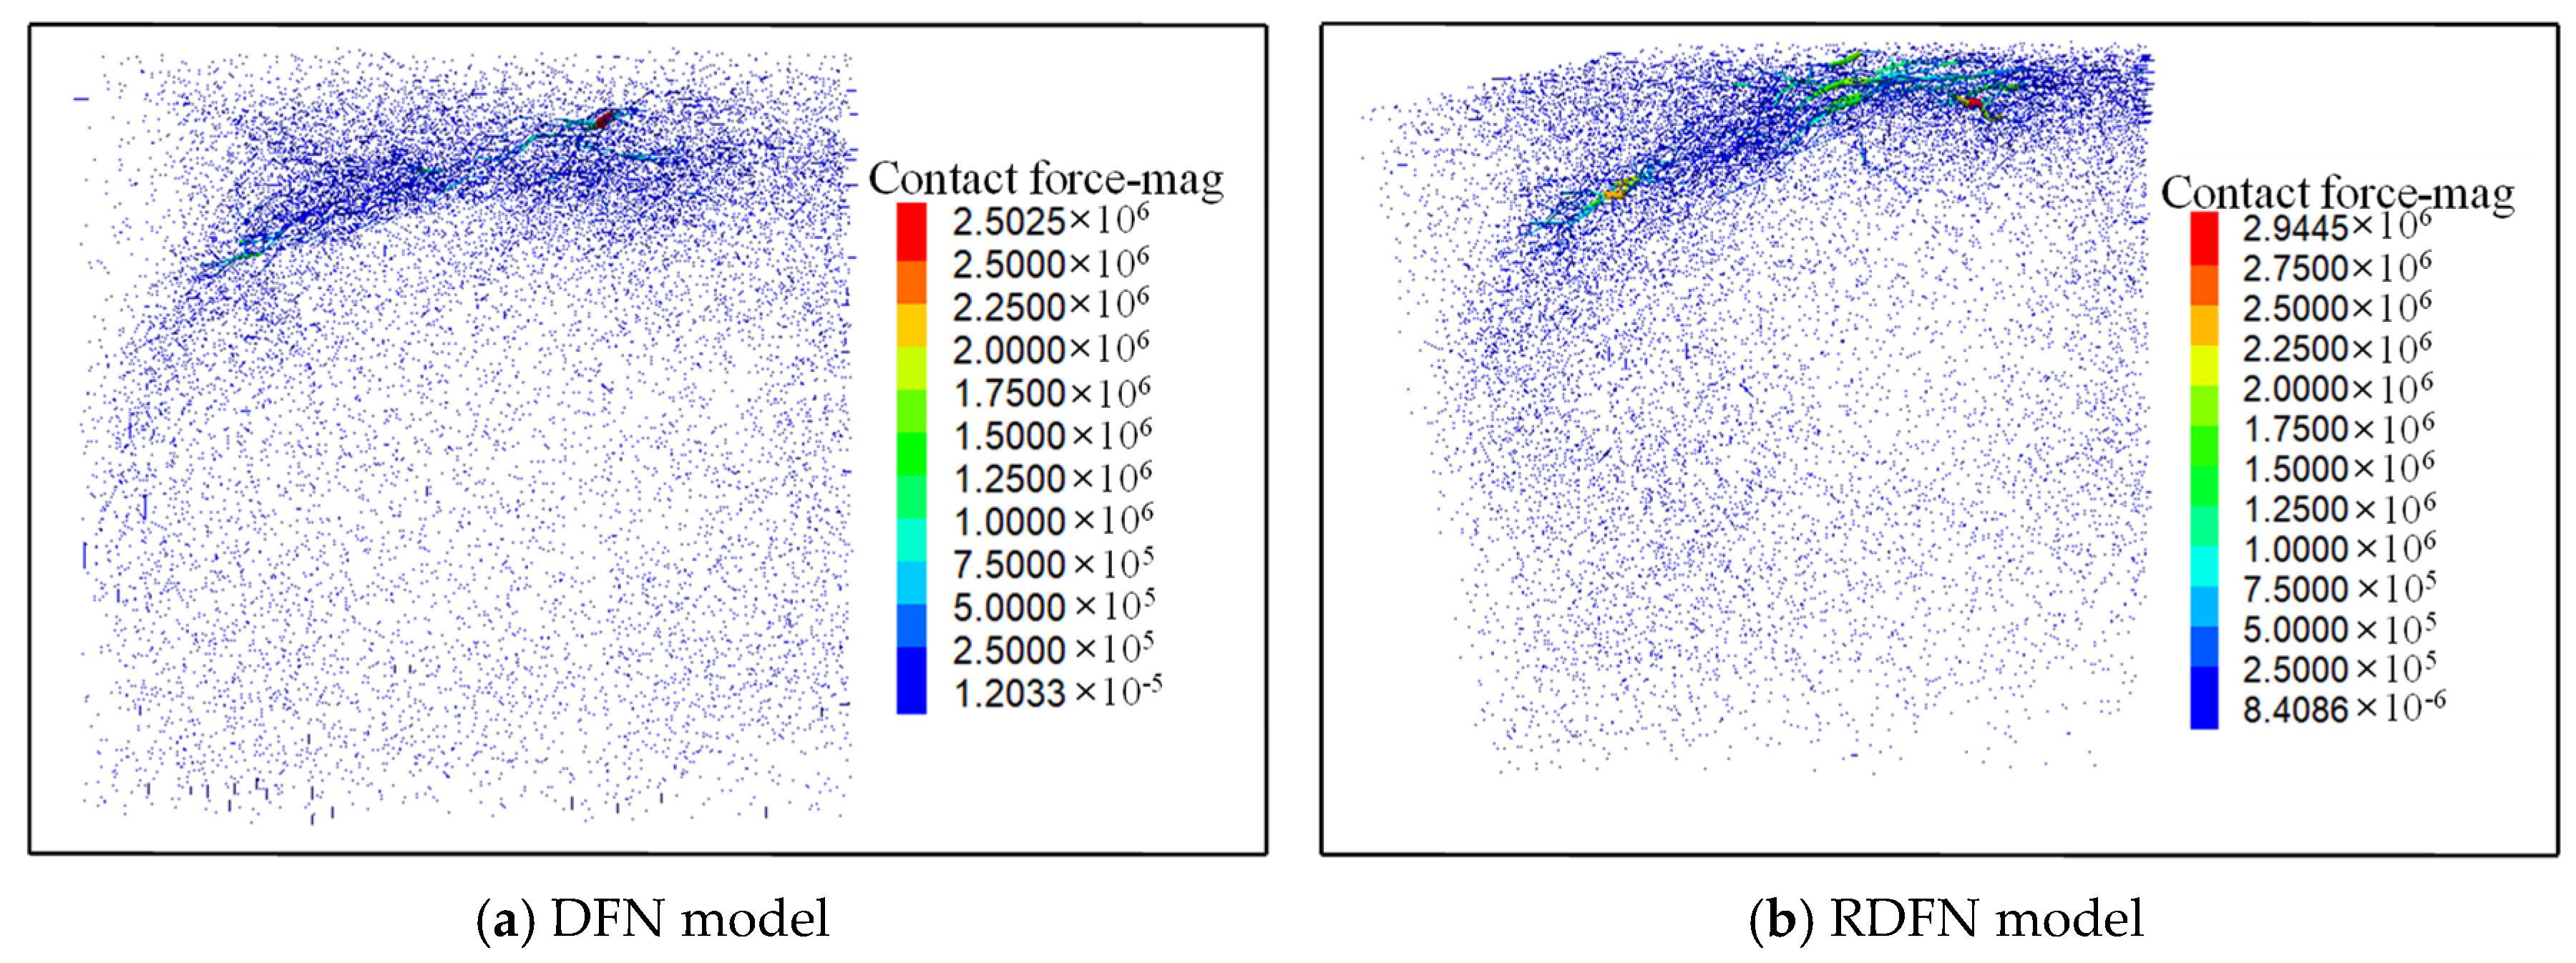
Figure 9 displays the progress of cracks in the DFN model rock body, which can be sorted into three stages. Figure 9a,b displays the initial phase of crack growth, which occurs at the juncture of the rock body’s shallowest structural surface, closest to the hob. This phase displays tension cracks that tend to propagate downwards along an east–west axis of the rock body. Figure 9b–e shows the gradual spreading of cracks from their point of origin until they reach the rock body’s surface. The damage zone moves from the rock body’s interior towards its shallow structural surface, indicating some of the local features of damage within the zone. The value of displacement in the damage zone steadily increases from top to bottom. The number of local damage zones is small, and the displacement value of these zones increases progressively from top to bottom. In this stage, the cracks noticeably expand along the structure’s surface edges. Moreover, the cracks propagate more quickly along the east–west axis, downward. In the subsequent stage, as shown in Figure 9e–h, the cracks primarily extend along the structure’s surface edges. There are only a few cracks on the structural surface. The general pattern moves from the initial development site to the edge of the structural surface and then to the internal structure. The maximum displacement value of the damage zone moves along the bottom of the damage zone and reaches the surface of the rock body. According to Figure 10a, the stress distribution density inside the rock body is concentrated in the direction of damage along the structural surface. Furthermore, the stress distribution below the damage zone of the rock body is sparse.

4.2. RDFN Model

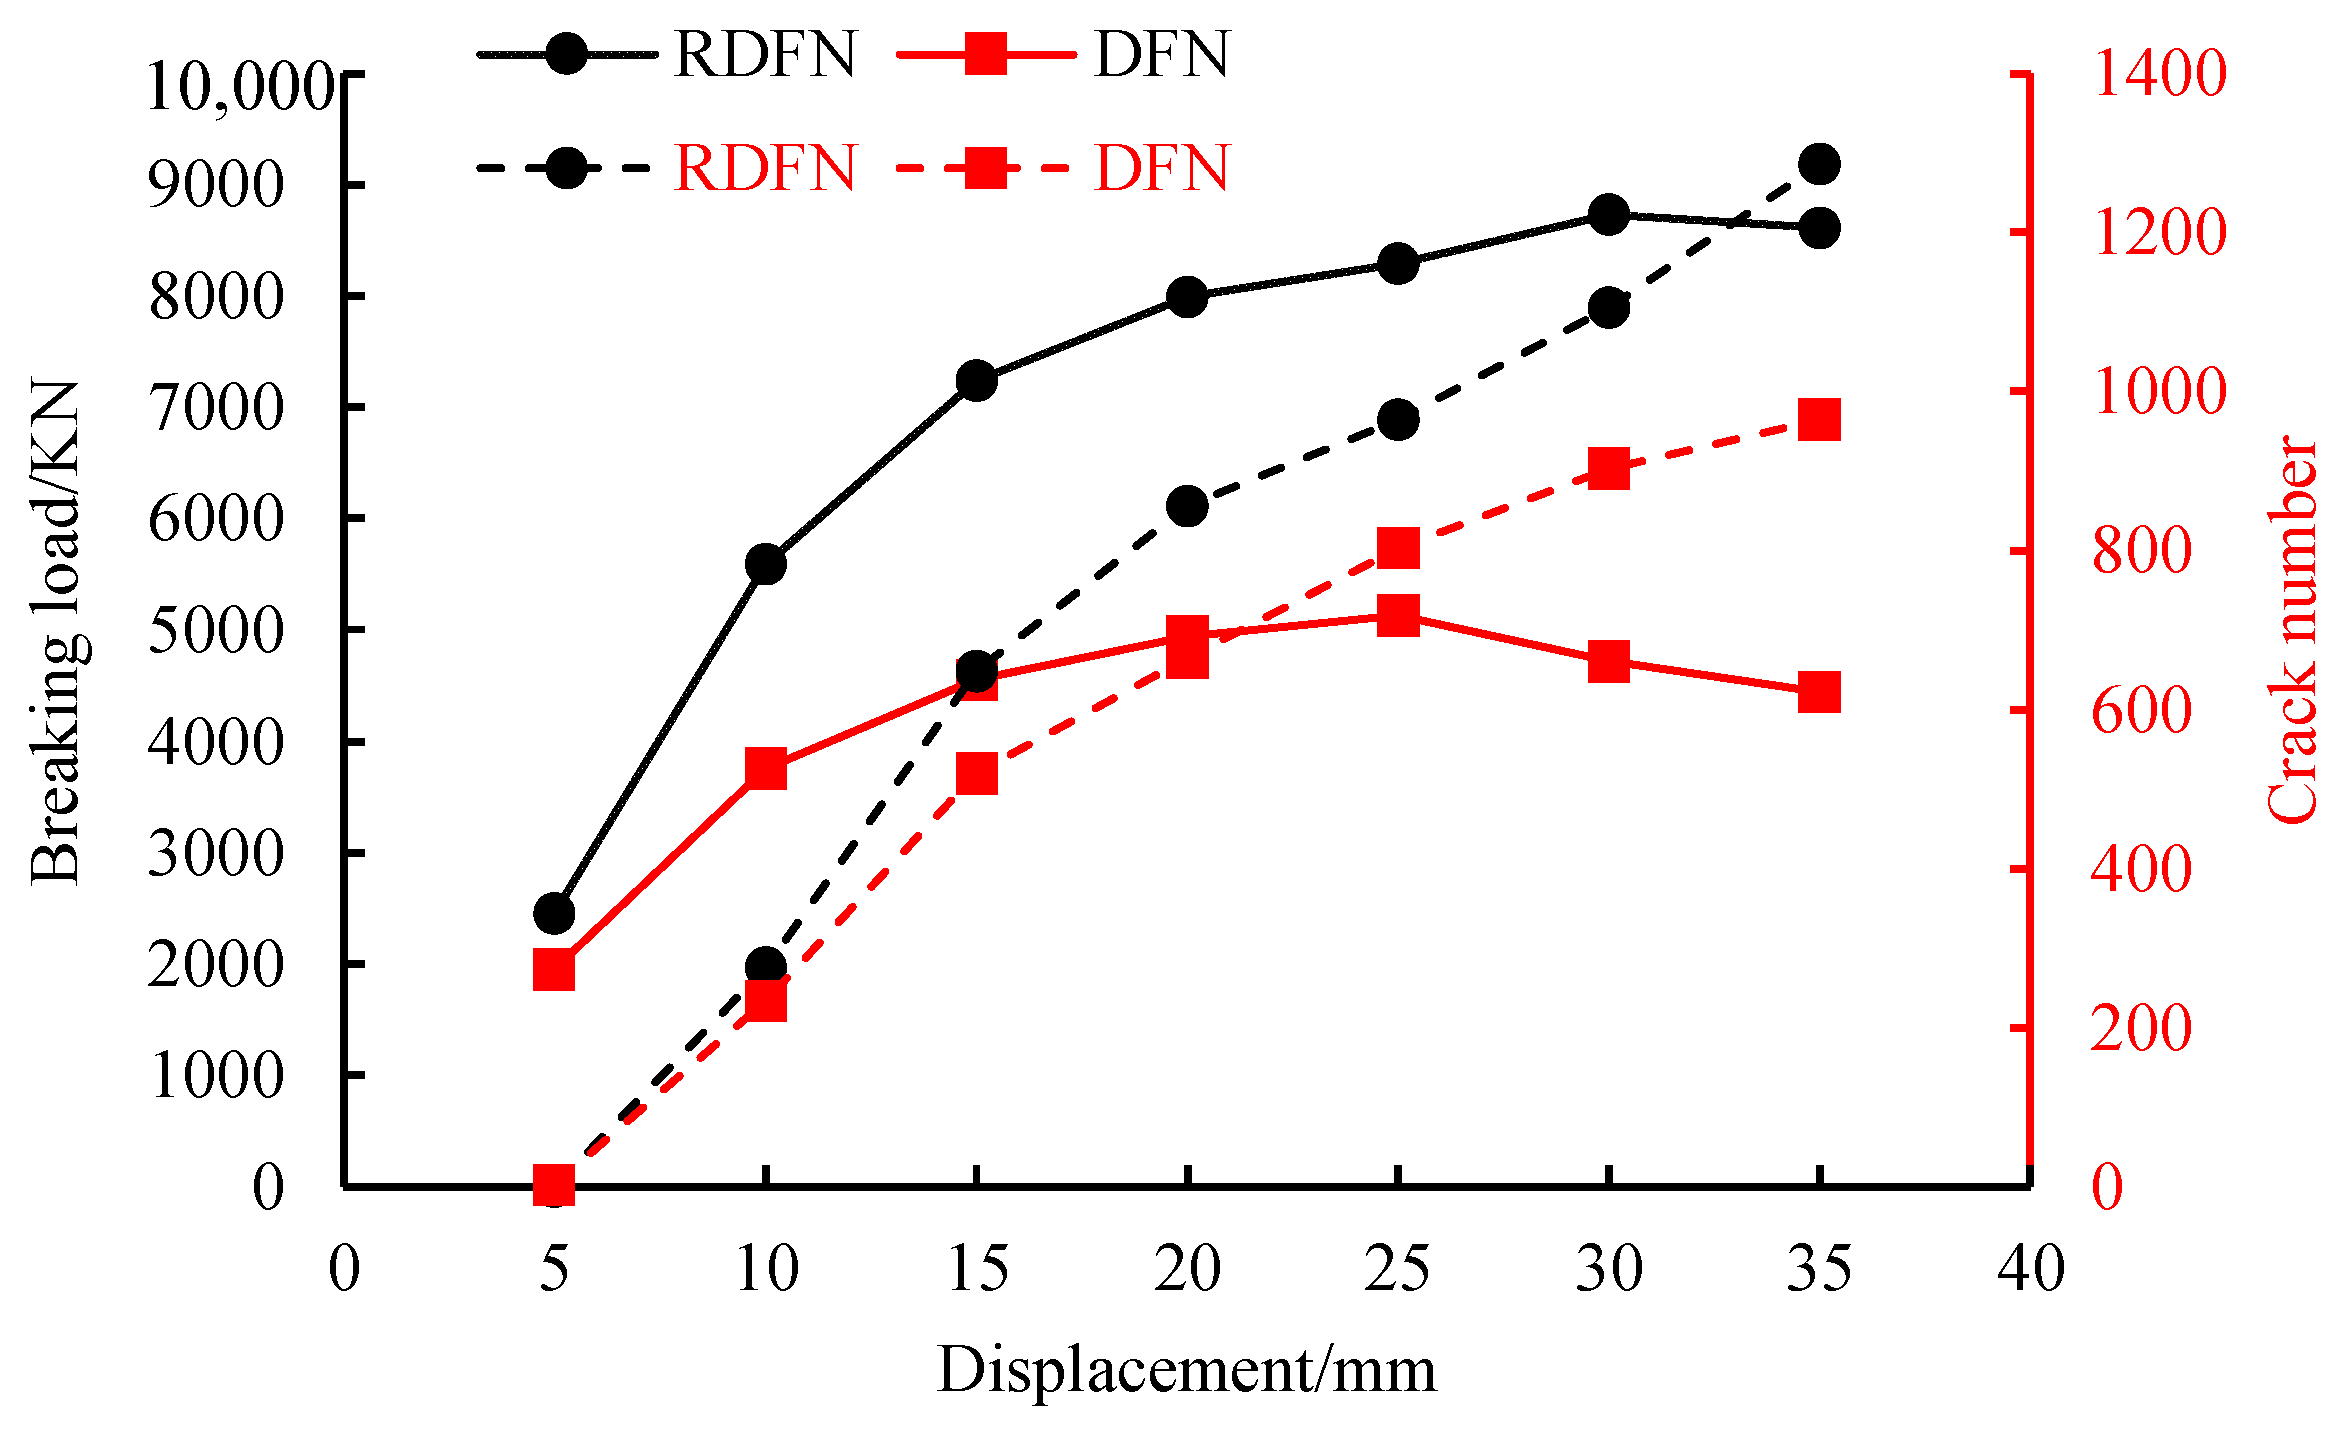
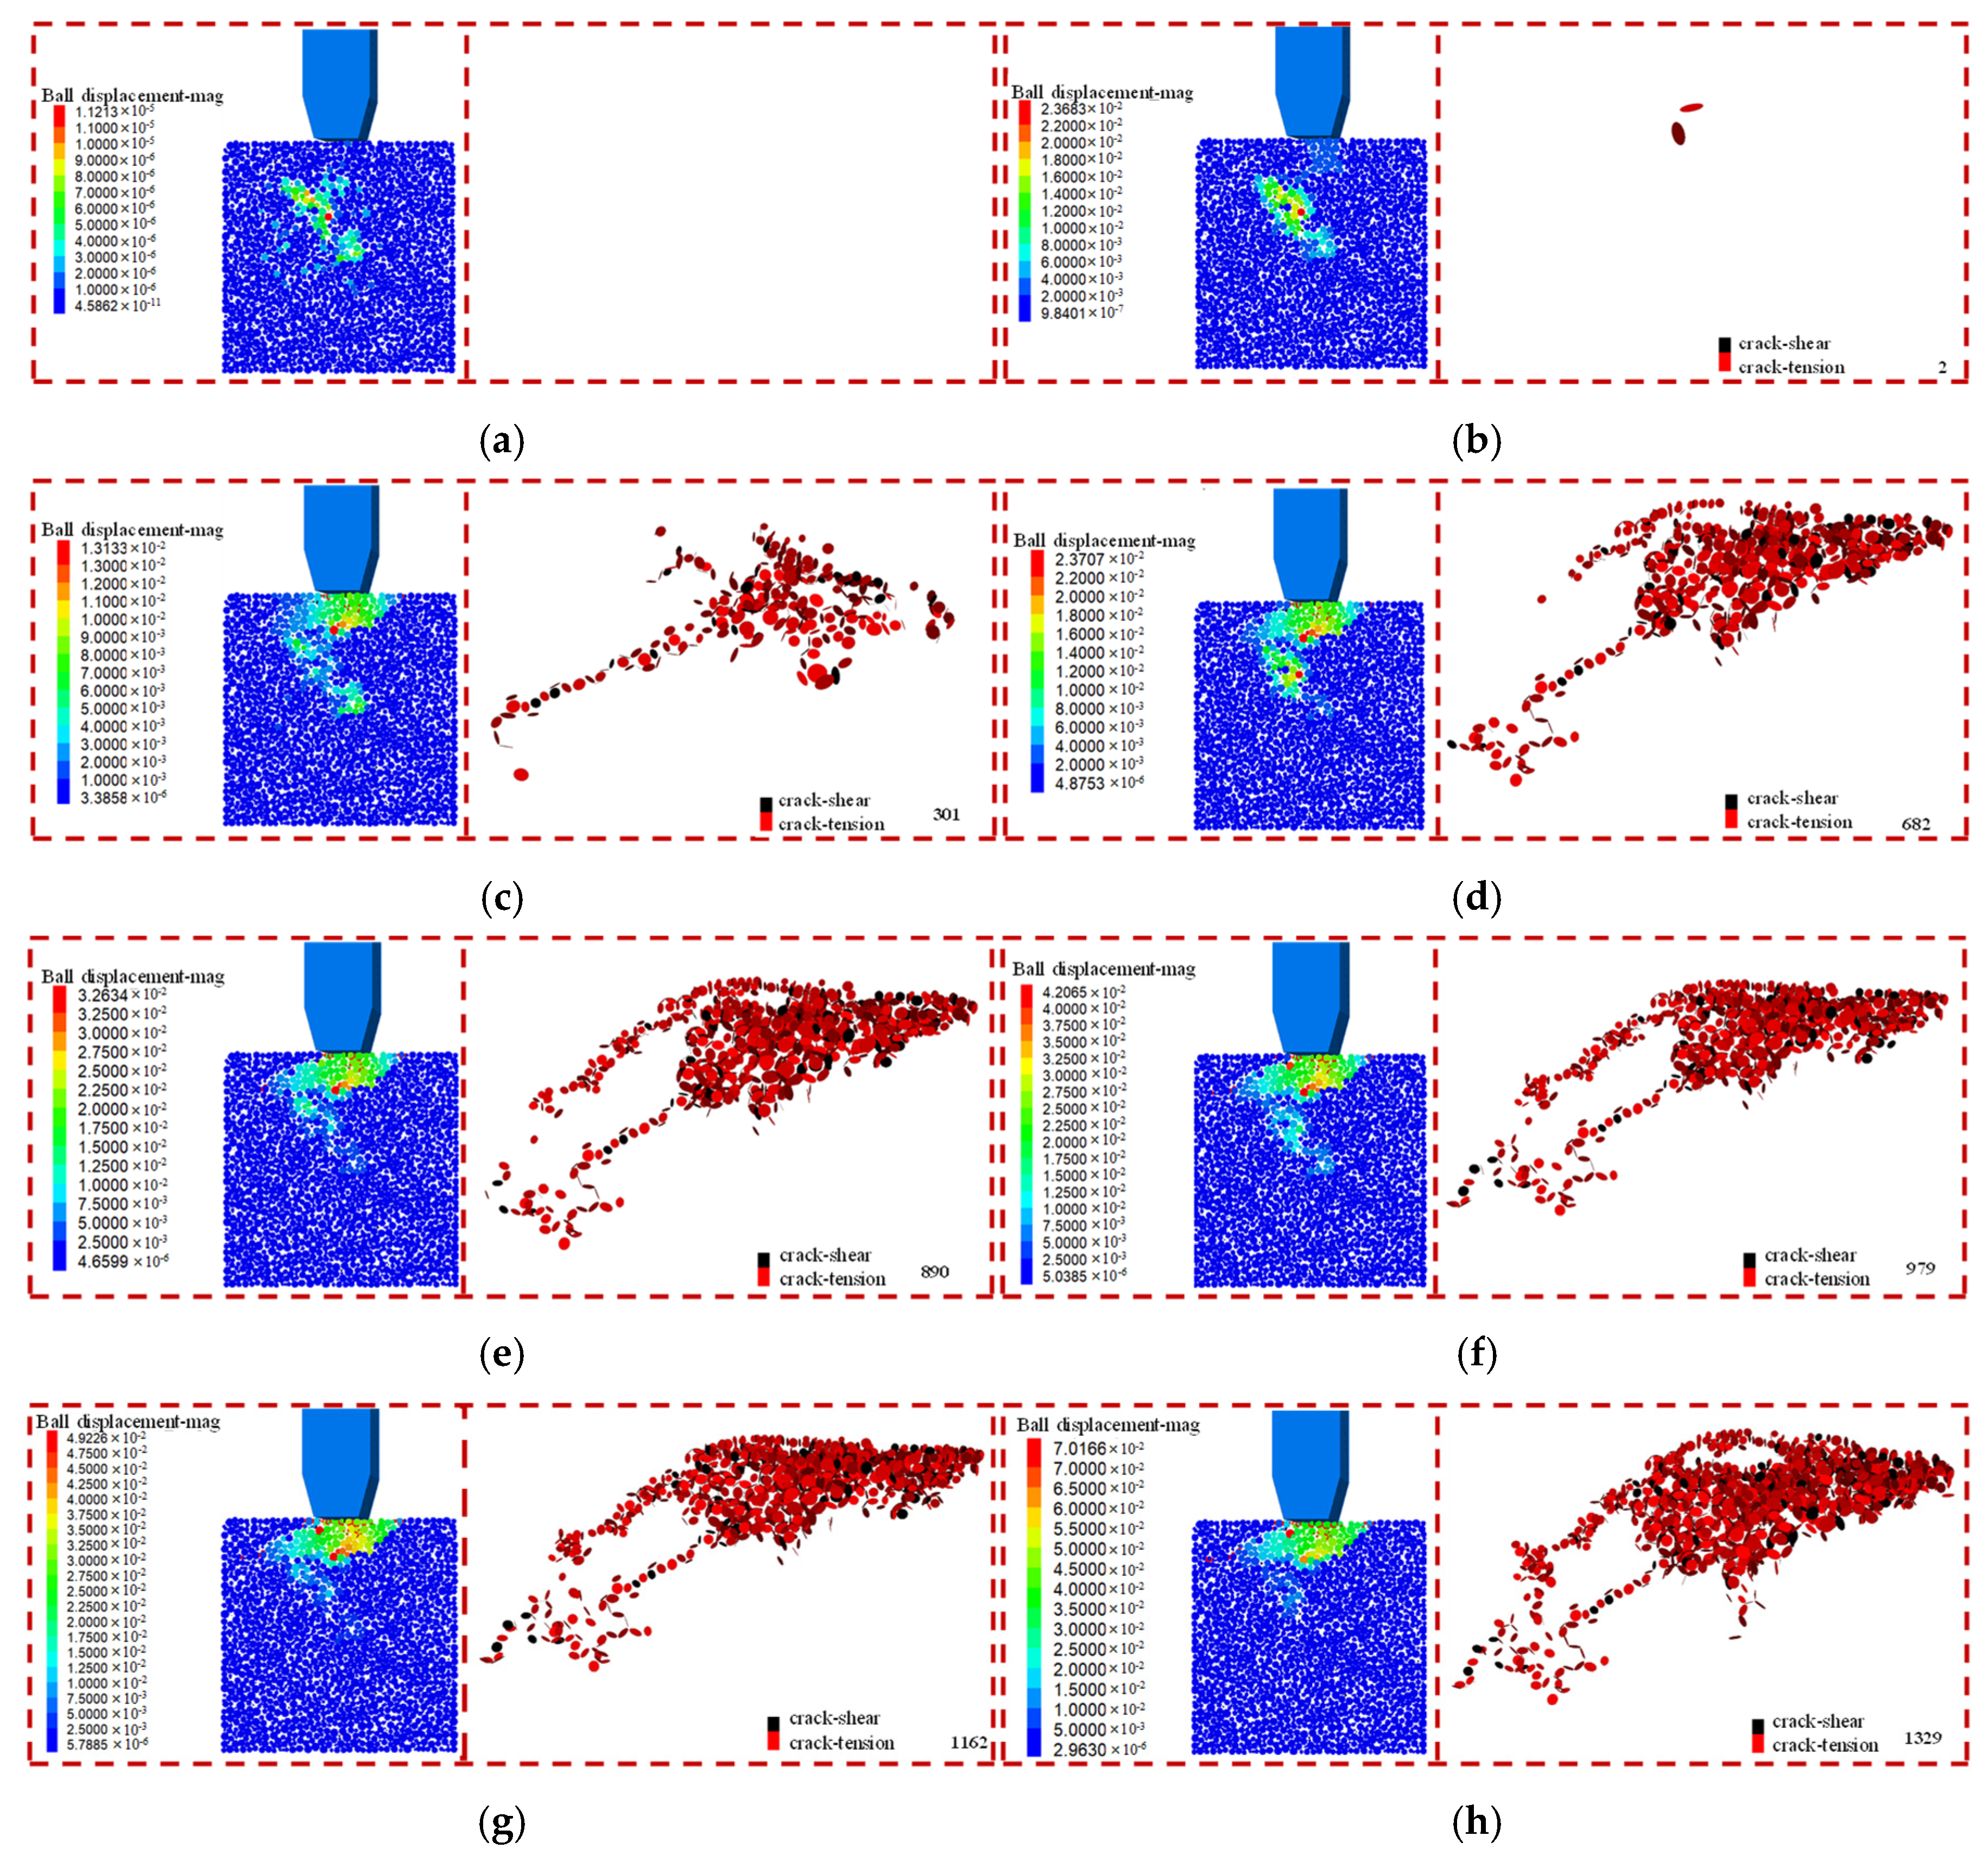
Figure 10 and Figure 11 show that the stress distribution density in the rock body of the RDFN model is equal to that in the DFN model. A significant difference in hob contact force and the change in the number of cracks can be observed. During the rock-breaking period, the hob contact force of the RDFN model exceeds that of the DFN model, resulting in more significant hob wear. The RDFN model records the ultimate hob contact force in the late rock-breaking period, while the DFN model records that moment during the middle of the rock-breaking period. Additionally, the overall magnitude of change is lower than that of the RDFN model. The reason for this outcome is the rougher surface of the structural face in the RDFN model and the hob’s smaller inclination angle in the vertical direction. As a result, the hob causes less rock encroachment. The reason why the hob initially destroys the micro-convex parts, compacts them, and subsequently destroys the structural face as a whole is due to the rough surface of the structural face in the RDFN model and the hob’s small inclination angle in the vertical direction. In the RDFN model, crack development takes place at the intersection of two groups of structural surfaces. One of the groups has a higher dip angle. In the RDFN model, the microconvex part between structural surfaces forms a mesh that hinders the rock breaking process more than in the DFN model. Consequently, during the early stages of crack development, the RDFN model exhibits a lower number of cracks than the DFN model, and they manifest later. At the point of crossing between the rock-breaking crack number curves, the RDFN model indicates a greater number of destructive cracks compared to the DFN model.
When combined with Figure 12, it becomes apparent that RDFN rock damage and crack extension can be divided into three primary stages. Moving from Figure 12a,b, the cracks initially occur at the intersection of the structural surfaces closest to the hob, similar to the DFN model. The cracks then rapidly penetrate the rock surface, forming a large range of damage zones in the shallow part during the stage between Figure 12b,e. To extend the damage further, cracks begin to expand noticeably along the edges of the structural surfaces and along the initially developed part of the cracks. In the final stage, from Figure 12e–h, the cracks mainly extend to the inside of the damaged structural surfaces and along the initially developed part of the cracks to the rock surface. The tensile cracks dominate during the entire rock-breaking period.

5. Conclusions

The rolling force breaking process of the DFN and RDFN models for intact rocks and rock bodies with a structural surface is analysed in this research. In this research, we examine the breaking effect of different hob intrusion speeds, hob spacing, and structural surface roughness on rocks. The research indicates that the following:
(1) The contact force of the hob and the number of cracks under different rock intrusion velocities of the single hob demonstrate an increasing trend. The rock-breaking patterns extend from the rock surface to the interior, encompassing a greater range of potential damage zones. The damage cracks are predominantly shear cracks.
(2) The contact force, crack number and force chain distribution of side-by-side double hobs at different distances are comparable to those of single hobs. However, there is a distinction in the formation of dynamic intervals of sparse force chain distribution between the hobs in a side-by-side double hob configuration, with the damage zone moving towards the east–west direction of the rock with an increase in hob spacing.
(3) Based on the above analyses, further consideration was given to the influence of the joint surface and its roughness on the rock-breaking effect. It was initially found that the hob contact force changes more frequently than that of the intact rock-breaking after the cracks are developed. The hob contact force of the RDFN model was found to be significantly higher than that of the DFN model. Furthermore, the number of cracks in the middle of the pre-destructive phase to the middle and late phases of the rock-breaking phase differed greatly between the RDFN and DFN models. The damage zone is formed by the initial damage structure surface, which gradually extends through the rock surface. The crack extension and force chain are distributed along the damage structure surface, with the tension crack being the dominant feature.
(4) The results provide a valuable reference for elucidating the hob rock-breaking mechanism in jointed rock masses. This paper presents a preliminary investigation into the influence of joint-surface roughness on the rock-breaking process. The effect of single joint surface on the rock-breaking process is not examined. Future work will research the hob rock-breaking mechanism under different joint roughness coefficients.

Author Contributions

Investigation, writing—original draft, G.J.; software, data curation, H.H.; writing—review and editing, P.W.; project administration, M.C. All authors have read and agreed to the published version of the manuscript.

Funding

This research was financially supported by the National Key R&D Programme of China (No. 2023YFC2907400), the National Natural Science Foundation of China (No. 52574101), the specific research fund of the Innovation Platform for Academicians of Hainan Province (YSPTZX202504), and the Hainan Province Science and Technology Special Fund (ZDYF2024GXJS307), the self-supported project for Beijing China Coal Mine Engineering Co., Ltd. (Grant No. KJYF-2024-ZD-03).

Institutional Review Board Statement

Not applicable.

Informed Consent Statement

Not applicable.

Data Availability Statement

Some or all data, models, or code that support the findings of this study are available from the corresponding author upon reasonable request.

Conflicts of Interest

The authors declare that this study received funding from Beijing China Coal Mine Engineering Co., Ltd. The funder was not involved in the study design, collection, analysis, interpretation of data, the writing of this article or the decision to submit it for publication.

References

  1. Shao, X.; Li, H.; Qian, H.; Niu, Y.; Zhu, X.; Ye, S. Optimal TBM cutter penetration and spacing for varying rock strengths: Field tests and numerical modeling. Geotech. Geol. Eng. 2025, 43, 201. [Google Scholar] [CrossRef]
  2. Xu, F.; Lu, J.; Zhuo, H.; Xiao, J.C.; Zhang, C.Q.; Qiu, H.Q. Research on combined rock-breaking mode of pre-cutting groove and TBM mechanical cutter. Rock Soil Mech. 2021, 42, 1363–1372. [Google Scholar]
  3. Zhang, X.H.; Xia, Y.M.; Zeng, G.Y.; Tan, Q.; Guo, B. Numerical and experimental investigation of rock breaking method under free surface by TBM disc cutter. J. Cent. South Univ. 2018, 25, 2107–2118. [Google Scholar] [CrossRef]
  4. Liu, S.; Li, H.; Jiang, H.; Zhang, Q.; Cui, Y.; Liu, X. Research progress and prospect of coal-rock breaking methods in mines. J. China Coal Soc. 2023, 48, 1047–1069. [Google Scholar] [CrossRef]
  5. Liu, X.; Sun, H.; Dong, Q.; Su, Y.; Zhou, J. Extremely hard rock mass excavation using rock breakdown methods to assist TBM in a deep, long diversion tunnel in the Qinling Mountains. J. Tsinghua Univ. 2022, 62, 1292–1301. [Google Scholar]
  6. Zhang, K.; Liu, W.; Yao, X.; Peng, C.; Liu, J.; Zheng, X. Investigation on two-step simulation modeling method for rock breaking by TBM disc cutters assisted with laser. KSCE J. Civ. Eng. 2022, 26, 2966–2978. [Google Scholar] [CrossRef]
  7. Fu, S.Y.; Li, H.B.; Li, X.F. Research on the range of fracture process zone of granite based on DIC and acoustic emission. Chin. J. Rock Mech. Eng. 2022, 41, 2497–2508. [Google Scholar]
  8. Yang, J.; Chai, J.; Zhang, D.; Zhang, Y.X. Study on ductile fracture mechanism of coal and rock mass based on cohesive crack model. Chin. J. Rock Mech. Eng. 2021, 40, 3014–3023. [Google Scholar]
  9. Wen, S.; Liao, C.; Yan, S.; Liang, N.; Jin, T. Damage mechanism and amplification effect of compression failure in soft rock with initial cracks. J. Theor. Appl. Mech. 2025, 63, 375–385. [Google Scholar] [CrossRef] [PubMed]
  10. Gao, M.-Z.; Xie, J.; Yang, B.-G.; Tang, R.-F.; Deng, H.-C.; Liu, Y.-T.; Wang, S.-L. Characteristics and mechanism of rock 3D volume fracturing in microwave field. J. China Coal Soc. 2022, 47, 1122–1137. [Google Scholar]
  11. Liu, R.; Zhu, Z.; Du, Y.; Li, M.; Liu, B.; Wan, D. Study on dynamic propagation law of cracks with different lengths under blasting. Chin. J. Rock Mech. Eng. 2022, 41, 3114–3123. [Google Scholar]
  12. Zhang, X.; Zhang, S.; An, D. Experimental study on the size effect of crack propagation process of disk samples containing parallel double pre-existing flaws. Chin. J. Rock Mech. Eng. 2023, 42, 115–128. [Google Scholar] [CrossRef]
  13. Li, Z.; Zhou, W.; Wang, L.; Li, W.; Ren, B. Numerical simulation of true triaxial fracture evolution of rocks with random fracture. J. China Univ. Min. Technol. 2023, 52, 43–51. [Google Scholar]
  14. Zhang, H.; Yuan, C.; Chen, S.; Yang, G.; Xia, H. Experimental study of fracture geometry characteristics on rock mass strength and crack propagation evolution law. Eur. J. Environ. Civ. Eng. 2022, 26, 7972–8001. [Google Scholar] [CrossRef]
  15. Cheng, L.; Chang, X.; Wang, S.; Wang, Y.; Zhang, M. Effect analysis of bedding plane and fracture distribution on crack propagation process in layered fractured rock mass. J. Eng. Sci. Technol. Rev. 2021, 14, 90–99. [Google Scholar] [CrossRef]
  16. Su, H.; Jiang, Y.; Yu, L.; Wang, W.; Guo, Q. Dynamic fracture and deformation responses of rock mass specimens containing 3D printing rough joint subjected to impact loading. Geomech. Geophys. Geo-Energy Geo-Resour. 2022, 8, 186. [Google Scholar] [CrossRef]
  17. Xie, Z.; Qiu, S.; Li, S.; Jiang, Q.; Xu, D.; Zheng, M. Excavation damage mechanism of deep buried layered fractured rock mass based on three-dimensional bonded block damage model. Comput. Geotech. 2025, 180, 107101. [Google Scholar] [CrossRef]
  18. Herrero, M.J.; Pérez-Fortes, A.P.; Escavy, J.I.; Insua-Arévalo, J.M.; De la Horra, R.; López-Acevedo, F.; Trigos, L. 3D model generated from UAV photogrammetry and semi-automated rock mass characterization. Comput. Geosci. 2022, 163, 105121. [Google Scholar] [CrossRef]
  19. Buyera, A.; Aichingerb, S.; Schuberta, W. Applying photogrammetry and semi-automated joint mapping for rock mass characterization. Eng. Geol. 2022, 264, 105332. [Google Scholar] [CrossRef]
  20. Vlachopoulos, N.; Vazaios, I.; Forbes, B.; Carrapatoso, C. Rock mass structural characterization through DFNLiDAR–DOS methodology. Geotech. Geol. Eng. 2020, 38, 6231–6244. [Google Scholar] [CrossRef]
  21. Li, J.; Caspari, E.; Greenwood, A.; Pierdominici, S.; Lemke, K.; Venier, M.; Kück, J.; Baron, L.; Pistone, M.; Petri, B.; et al. Integrated rock mass characterization of the lower continental crust along the ICDP-DIVE 5071_1_B borehole in the IVREA-VERBANO zone. Geochem. Geophys. Geosyst. 2024, 25, e2024GC011707. [Google Scholar] [CrossRef]
  22. Pola, A.; Herrera-Díaz, A.; Tinoco-Martínez, S.R.; Macias, J.L.; Soto-Rodríguez, A.N.; Sereno, H.; Avellán, D.R. Rock characterization, UAV photogrammetry and use of algorithms of machine learning as tools in mapping discontinuities and characterizing rock masses in Acoculco Caldera Complex. Bull. Eng. Geol. Environ. 2024, 83, 260. [Google Scholar] [CrossRef]
  23. Fatolahzadeh, S.; Sepúlveda, S.; Singh, J. Applicability and limitations of terrestrial and UAV-based remote sensing techniques for slope rock mass characterization. In Proceedings of the 59th US Rock Mechanics/Geomechanics Symposium, Santa Fe, NM, USA, 8–11 June 2025. [Google Scholar]
  24. Li, L.; Wu, W.; El Naggar, M.H.; Mei, G.; Liang, R. Characterization of a jointed rock mass based on fractal geometry theory. Bull. Eng. Geol. Environ. 2019, 78, 6101–6110. [Google Scholar] [CrossRef]
  25. Li, N.; Zhang, K.; Luo, G.; Zhang, K. Experimental study on the size effect and anisotropy in mechanical properties of fractured rock mass based on 3D printing. Theor. Appl. Fract. Mech. 2024, 129, 104224. [Google Scholar] [CrossRef]
  26. Li, X.; Zhang, C.; Zhang, S. Influence Mechanism of Loading Rate and Size Effect on Altered Rock Mechanical Properties. Adv. Transdiscipl. Eng. 2024, 62, 855–860. [Google Scholar]
  27. Wang, P.; Qi, Z.; Ma, C.; Cai, M. Mechanical behavior and failure modes of jointed rock mass based on rough discrete fracture network models. Environ. Earth Sci. 2022, 81, 543. [Google Scholar] [CrossRef]
  28. Wang, P.; Liu, C.; Qi, Z.; Liu, Z.; Cai, M. A rough discrete fracture network model for geometrical modeling of jointed rock masses and the anisotropic behaviour. Appl. Sci. 2022, 12, 1720. [Google Scholar] [CrossRef]
  29. Sun, H.; Zhu, D.F.; Jin, A.B.; Chen, S.J. Failure characteristics and crack evolution laws of hard rock under nonlinear unloading rates. J. Northeast. Univ. 2022, 43, 1010–1018. [Google Scholar]
  30. Sun, C.; Ao, Y.H.; Zhang, J.M.; Wang, S. Particle flow of meso-fracture characteristics and macro-scale effect of granites. Chin. J. Geotech. Eng. 2020, 42, 1687–1695. [Google Scholar]
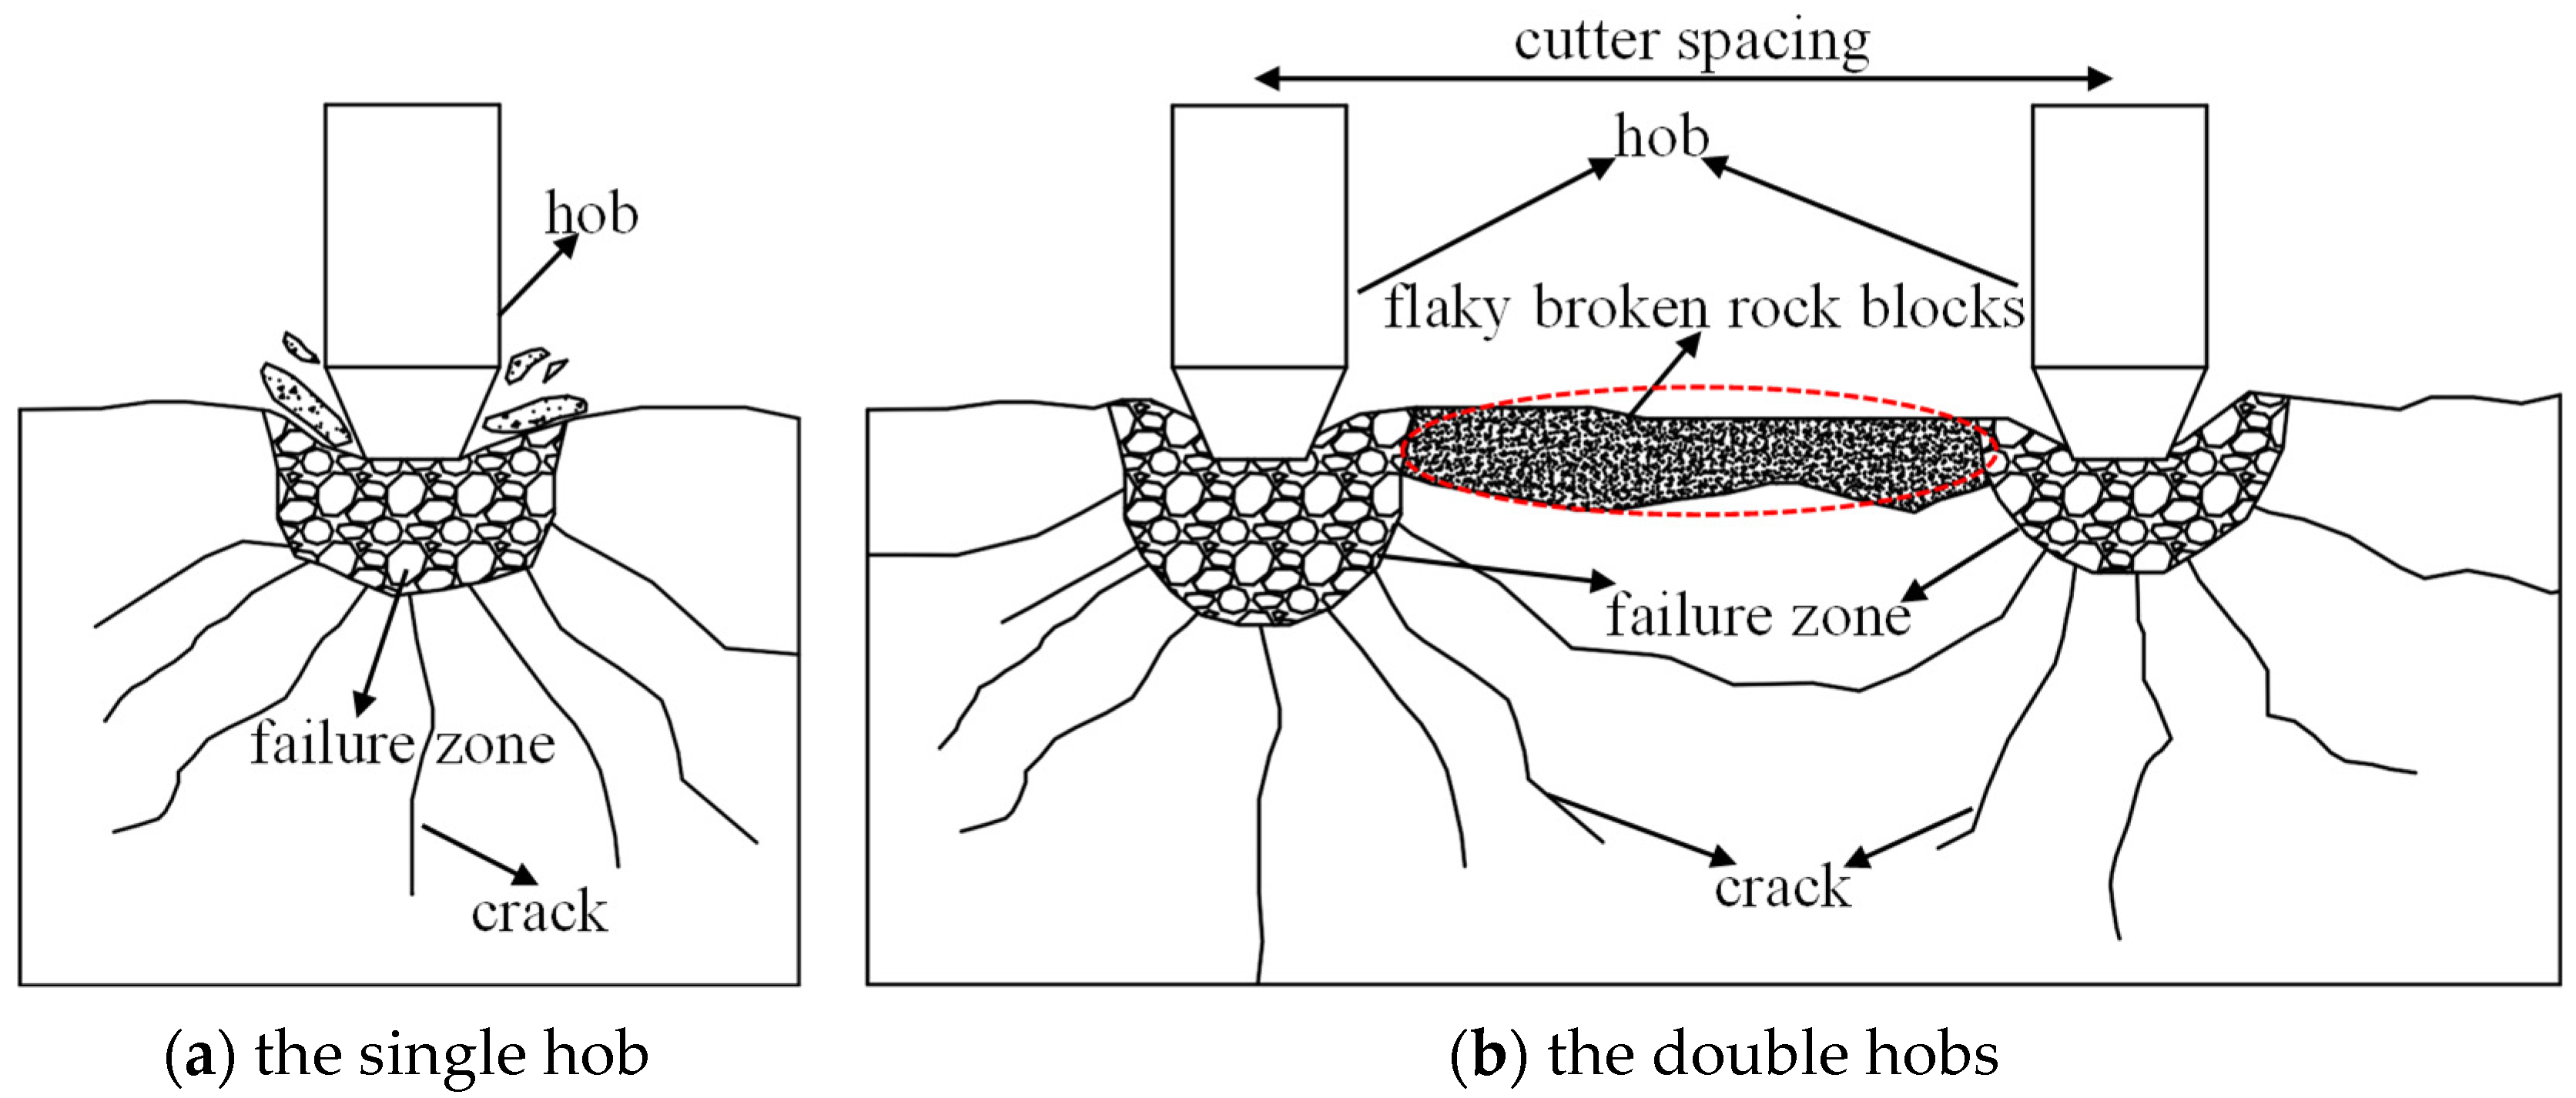
Figure 1. The schematic diagram of the hob rock-breaking.
Applsci 15 12312 g001
Figure 2. Rock-breaking mechanical model of square hobs. (a) The speed of rock-breaking by a single square hob is 0.036 m/s. (b) Square double disc cutter spacing 150 mm.
Applsci 15 12312 g002
Figure 3. A comparison diagram depicting the joint geometry of the discrete fracture network model.
Applsci 15 12312 g003
Figure 4. A mechanical analytical model for rock fragmentation using a hob in a jointed and fractured rock mass.
Applsci 15 12312 g004
Figure 5. Rock-breaking effect of square single hob.
Applsci 15 12312 g005aApplsci 15 12312 g005b
Figure 6. Rock-breaking curve of square single hob.
Applsci 15 12312 g006
Figure 7. Rock-breaking effect of square double hob cutter.
Applsci 15 12312 g007
Figure 8. Rock-breaking curve of square double hobs.
Applsci 15 12312 g008
Figure 9. Crack propagation process of DFN model.
Applsci 15 12312 g009
Figure 10. Distribution of rock breaking force chain of disc cutter in jointed fractured rock mass.
Applsci 15 12312 g010
Figure 11. Curves of contact force of hob and number of cracks in jointed fractured rock mass.
Applsci 15 12312 g011
Figure 12. (ah) RDFN model crack propagation process.
Applsci 15 12312 g012
Table 1. Micromechanical parameters of model.
ParameterMechanical Analysis Model of Rock Breaking by Square Hob [29,30]DFN Model and RDFN Model
Strength of Rock SpecimenFracture Intensity
Ball Rmin/mm2.550
Ball Rmax/mm380
Particle damping coefficient0.70.7
particle density/kg·m−327002650
effective modulus E/GPa215
kn/ks21
Bond effective modulus E/GPa215
k n ¯ / k s ¯ 21
tension bond strength σ c ¯ /MPa32255
Bonding cohesion c ¯ /MPa24505
internal friction ƒ/(°)325730
friction coefficient/µ0.20.40.5
k n ¯ /Pa 55,000
k s ¯ /Pa 55,000
Disclaimer/Publisher’s Note: The statements, opinions and data contained in all publications are solely those of the individual author(s) and contributor(s) and not of MDPI and/or the editor(s). MDPI and/or the editor(s) disclaim responsibility for any injury to people or property resulting from any ideas, methods, instructions or products referred to in the content.