Article

Shortened Acquisition Duration for Brain Tumor 11C-Methionine Positron Emission Tomography on Silicon Photomultiplier Positron Emission Tomography/Computed Tomography

1
Department of Radiology and Nuclear Medicine, Research Institute for Brain and Blood Vessels-Akita, 6-10 Senshu-Kubota-Machi, Akita 010-0874, Japan
2
Course of Radiological Technology, Health Sciences, Tohoku University Graduate School of Medicine, 2-1 Seiryo, Aoba-ku, Sendai 980-8575, Japan
3
Department of Radiation Disaster Medicine, International Research Institute of Disaster Science, Tohoku University, 468-1 Aramaki Aza-Aoba, Aoba-ku, Sendai 980-0845, Japan
*
Authors to whom correspondence should be addressed.
Appl. Sci. 2025, 15(22), 12292; https://doi.org/10.3390/app152212292
Submission received: 23 October 2025 / Revised: 14 November 2025 / Accepted: 18 November 2025 / Published: 19 November 2025

Abstract

Positron emission tomography/computed tomography (PET/CT) scanners equipped with silicon photomultiplier detectors offer superior sensitivity and count-rate performance. The aim of this study was to evaluate the feasibility and impact of shortening the acquisition duration in brain tumor 11C-methionine PET using a silicon photomultiplier PET/CT system, and to assess how point spread function (PSF) correction influences quantitative values. In the phantom study, a brain tumor phantom was scanned using the Biograph Vision silicon photomultiplier-based PET/CT system. Data were acquired for 10, 5, 3, and 1 min, and the images were reconstructed with and without PSF correction. In the clinical study, 20 patients who underwent 11C-methionine PET were retrospectively analyzed. PET data were acquired over 10 min and subsequently reconstructed for 10, 5, and 3 min. We evaluated quantitative parameters including the maximum standardized uptake value (SUVmax), and their relative errors under shortened acquisition durations were analyzed. In the phantom study, the SUVmax increased with shorter acquisition durations; however, this increase was less pronounced with PSF correction. In the clinical study, relative errors of SUVmax for the 5 and 3 min acquisitions with PSF correction were 2.9 ± 3.8% and 5.2 ± 5.4%, respectively. They were smaller than those without PSF correction (5.5 ± 5.1% and 12.7 ± 8.5%), indicating superior quantitative stability with shortened acquisition duration. The combination of the Biograph Vision system and PSF correction enabled the acquisition of high-quality PET images with shortened scan times.

1. Introduction

11C-methionine is a radiotracer that reflects amino acid metabolism [1] and exhibits lower uptake in normal brain tissue than in 18F-fluoro-2-deoxy-D-glucose (18F-FDG). Consequently, 11C-methionine has superior diagnostic performance in brain tumor differentiation [2,3,4,5] compared with that of 18F-FDG and is recognized as a valuable tracer for discriminating between tumor recurrence and radiation necrosis following radiotherapy [6,7,8,9]. Furthermore, positron emission tomography (PET) studies have reported that the 11C-methionine uptake area corresponds well with the area of tumor extension compared with the contrast-enhanced area on magnetic resonance imaging and is useful for treatment planning [10,11,12].
In clinical PET imaging, determining the appropriate acquisition parameters, particularly the acquisition duration, is critical [13,14,15]. The standard protocol typically involves a 10 min acquisition beginning 20 min after the intravenous administration of 11C-methionine [16]. PET image quality is primarily influenced by the number of detected events, with longer acquisition durations enhancing the signal-to-noise ratio (SNR). However, extended acquisition durations increase the patient burden and the risk of motion artifacts, particularly in individuals who have difficulty maintaining a stable position. Therefore, optimizing the acquisition duration is essential for achieving a balance between image quality and patient comfort. Furthermore, the shortened acquisition duration of 11C-methionine PET leads to cost savings, more efficient staffing, and effective use of medical resources, resulting from an increased number of examinations per day.
Recent advancements in PET technology, such as silicon photomultiplier (SiPM)-based PET/computed tomography (CT), have been significant. A Biograph Vision PET/CT scanner (Siemens Healthineers, Knoxville, TN, USA) equipped with SiPM detectors has a superior SNR and quantitative performance compared with that of a conventional photomultiplier tube (PMT)-based PET/CT scanner [17,18,19]. Reportedly, Biograph Vision can shorten the acquisition duration or reduce the injection dose for whole-body 18F-FDG PET [20,21,22,23], and it may also enable shorter acquisition durations in clinical 11C-methionine PET. The Japanese Society of Nuclear Medicine recommends a 10 min acquisition as the standard PET protocol for brain tumors [16]; however, this recommendation aims to ensure consistent diagnostic quality across various institutions and scanner types. Therefore, it is important to investigate the minimum acquisition duration required to maintain clinical utility.
Morimoto et al. reported the potential to shorten the acquisition durations in brain tumor 11C-methionine PET [24]. However, their study used PMT-based PET/CT and did not evaluate the effect of point spread function (PSF) correction, which significantly affects PET image quality. PSF reconstruction can enhance image contrast, SNR, and lesion detectability [25,26] but may also influence quantitative measures, such as standardized uptake value (SUV) and metabolic tumor volume (MTV), associated with Gibbs artifacts depending on lesion size [27,28,29,30]. SUV and MTV are important parameters for determining tumor malignancy, prognosis, and treatment strategy [31,32,33,34,35,36]. Therefore, a comparative evaluation of reconstructions with and without PSF correction is necessary to determine whether PSF-related artifacts compromise the utility of a shorter acquisition duration.
The aim of this study is to assess the feasibility and quantitative impact of shortened acquisition duration in 11C-methionine PET using SiPM-based PET/CT. We investigated the relationship between acquisition duration and quantitative metrics with and without PSF correction in image reconstruction using phantom and clinical evaluation.

2. Materials and Methods

2.1. Phantom Study

The phantom study was conducted according to the phantom testing procedure manual for 11C-methionine brain tumor PET imaging established by the Japanese Society of Nuclear Medicine [16]. To simulate a clinical examination, six spheres of varying sizes (φ38, 27, 16, 10, 7.5, and 5 mm) and the background area of a brain tumor phantom were filled with 12.3 and 4.1 kBq/mL 18F solution at the start of the scan (a radioactivity concentration ratio of 3:1), respectively.
  • Data Acquisition and Image Reconstruction
The PET data were acquired using a Biograph Vision 600 PET/CT scanner equipped with SiPM detectors [37,38,39].
To assess the impact of shortened acquisition durations, list-mode data acquired in the 18F-phantom study were extracted for 523, 280, 173, and 59 s from the beginning of the scan, corresponding to 10, 5, 3, and 1 min of acquisition at 11C-methionine, respectively.
Reconstructions with and without PSF were performed to evaluate the effect of PSF correction using the scanner console. The reconstruction conditions are as follows:
-
Reconstruction with PSF: Ordered subset expectation maximization algorithm with PSF correction and time-of-flight (TOF) technique using five iterations and five subsets.
-
Reconstruction without PSF: Ordered subset expectation maximization algorithm with the TOF technique using three iterations and five subsets.
Reconstruction with PSF was our clinical reconstruction protocol, while the number of iterations for the reconstruction without PSF was determined from the contrast-to-noise curve to ensure image quality comparable to that of the PSF reconstruction. The slice thickness for the PET images was 1.65 mm, and no post-smoothing filter was applied.
CT scans for attenuation correction were performed according to our clinical protocol, and the parameters were as follows: 120 kV, 3 mm slice thickness, 1.0 s rotation, using auto exposure control.
  • Data Analysis
Regions of interest with the same size as the spheres were placed on the CT images and copied onto the PET images, as illustrated in Figure 1. In each reconstruction condition, the accuracy of SUVmax for the 10 min acquisition and shortened acquisitions was evaluated using AMIDE [40] software (1.0.6. version).

2.2. Clinical Studies

Twenty consecutive patients who underwent 11C-methionine PET between May 2021 and November 2022 and exhibited abnormal uptake (31 lesions) were retrospectively analyzed. The study population consisted of eleven women and nine men. The patients’ ages and weights ranged from 38 to 87 years and 40.0 to 95.4 kg, respectively. All patients were administered intravenous injections of 313.7–428.0 MBq 11C-methionine.
This study was approved by the ethics committee of our institution (No. 23-39), which determined that additional informed consent was not required, as the analysis fell within the scope of the previously approved protocol (No. 19-10).
  • Data Acquisition and Image Reconstruction
PET and CT were performed according to clinical protocols. The CT scan parameters were described in the phantom study section. Twenty minutes after the administration of intravenous 11C-methionine, PET data were acquired in list mode for 10 min with the patient in the supine position. The acquired list-mode data were reconstructed for scan durations of 10, 5, and 3 min, using the same reconstruction parameters as in the phantom study.
  • Data Analysis
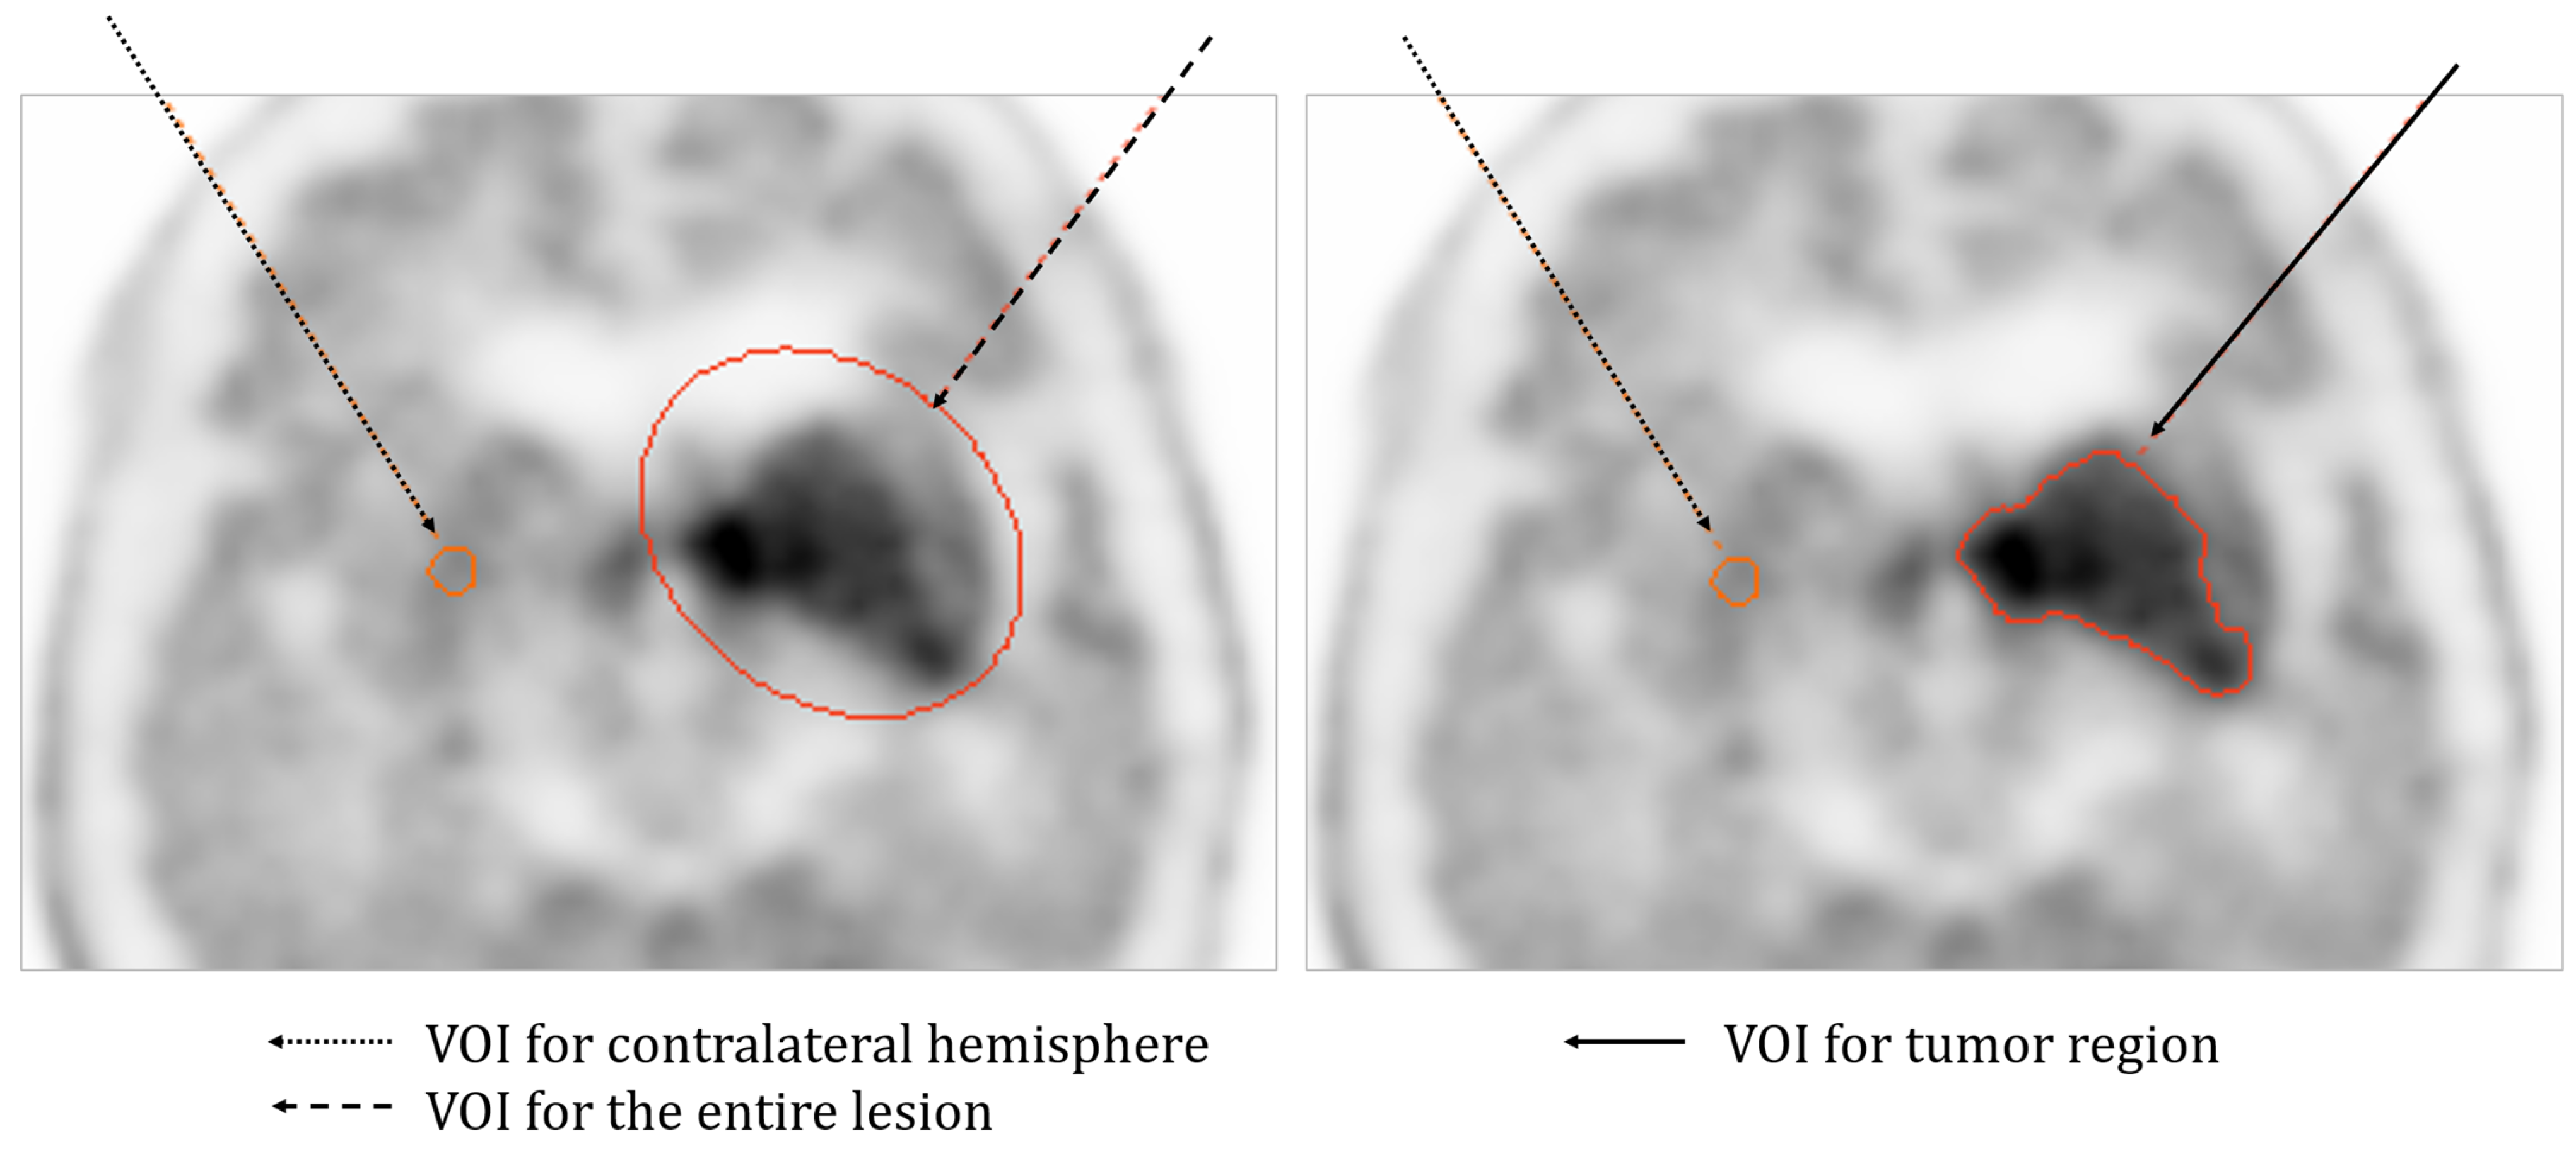
As shown in Figure 2, a volume of interest (VOI) was placed to encompass the entire lesion, and a spherical VOI (φ7 mm) was placed in the contralateral hemisphere [41]. Voxels with an SUV of at least 1.3 times the SUVmean in normal tissue were classified as tumor regions [24,41,42], and SUVmax, SUVpeak, SUVmean, and MTV were measured for each image using syngo.via (Siemens Healthineers, Erlangen, Germany, version VB80F) software.
The relative error of SUVmax (rΔSUVmaxτ) between the 10 min acquisition and a shortened acquisition duration (τ) was calculated as follows:
r Δ S U V m a x τ =   S U V m a x τ S U V m a x 10 min S U V m a x 10 min × 100   %
where SUVmaxτ represents the SUVmax in the shortened acquisition duration (τ), and SUVmax10min represents the SUVmax in the 10 min acquisition. Similarly, rΔSUVpeakτ, rΔSUVmeanτ, and rΔMTVτ were calculated.
  • Visual Assessment
Three radiologists independently evaluated the quality of the PET images. No formal calibration or consensus session was conducted prior to the image interpretation, and each radiologist assessed the images according to their own judgment. The images reconstructed with the clinical conditions (10 min acquisition and reconstruction with PSF) were considered the reference (5 points as a full score). PET images from each reconstruction condition and acquisition duration were assessed relative to the reference images using syngo.via software (Siemens Healthineers). The scoring and evaluation criteria were as follows:
5: Excellent (equivalent image quality to the reference image);
4: Good (slightly inferior to the reference image);
3: Acceptable (no impact on tumor invasion assessment, clinically acceptable);
2: Poor (potential misinterpretation of tumor invasion, not clinically acceptable);
1: Very poor (risk of false negatives or false positives).
Scores of 3, 4 and 5 were considered clinically acceptable; on the contrary, scores of 1 and 2 were deemed suboptimal for diagnosis [43]. For each patient, we calculated the difference in visual assessment score (ΔVAscore) between the reconstructions with and without PSF and evaluated the relationship between ΔVAscore and tumor-normal ratio (TNR) in clinical conditions. ΔVAscore and TNR were calculated as follows:
Δ V A s c o r e = V A s c o r e w i t h   P S F V A s c o r e w i t h o u t   P S F T N R = S U V m a x / S U V m e a n n
where the VA score represents the average visual assessment score assessed by three radiologists for each patient. SUVmeann represents the SUVmean in the normal brain tissue from the VOI in the contralateral hemisphere. The lowest TNR was observed in the patients with multiple lesions.
  • Statistical Analysis
Correlations between SUVmax, SUVpeak, SUVmean, and MTV for the shortened and 10 min acquisitions were evaluated using Pearson’s correlation coefficient.
To evaluate the agreement between the SUVmax for the 10 min acquisition and those for the shortened acquisitions, Bland–Altman analysis was performed.
Inter-observer agreement for visual assessment was evaluated using Fleiss’ kappa statistics. The kappa values were interpreted according to the criteria of Landis and Koch [44] as follows: kappa values <0 as indicating no agreement and 0–0.20 as none to slight, 0.21–0.40 as fair, 0.41–0.60 as moderate, 0.61–0.80 as substantial, and 0.81–1.00 as almost perfect agreement.
All statistical analyses were performed with JASP software (version 0.95.4, JASP Team, Amsterdam, The Netherlands) [45].

3. Results

3.1. Phantom Study

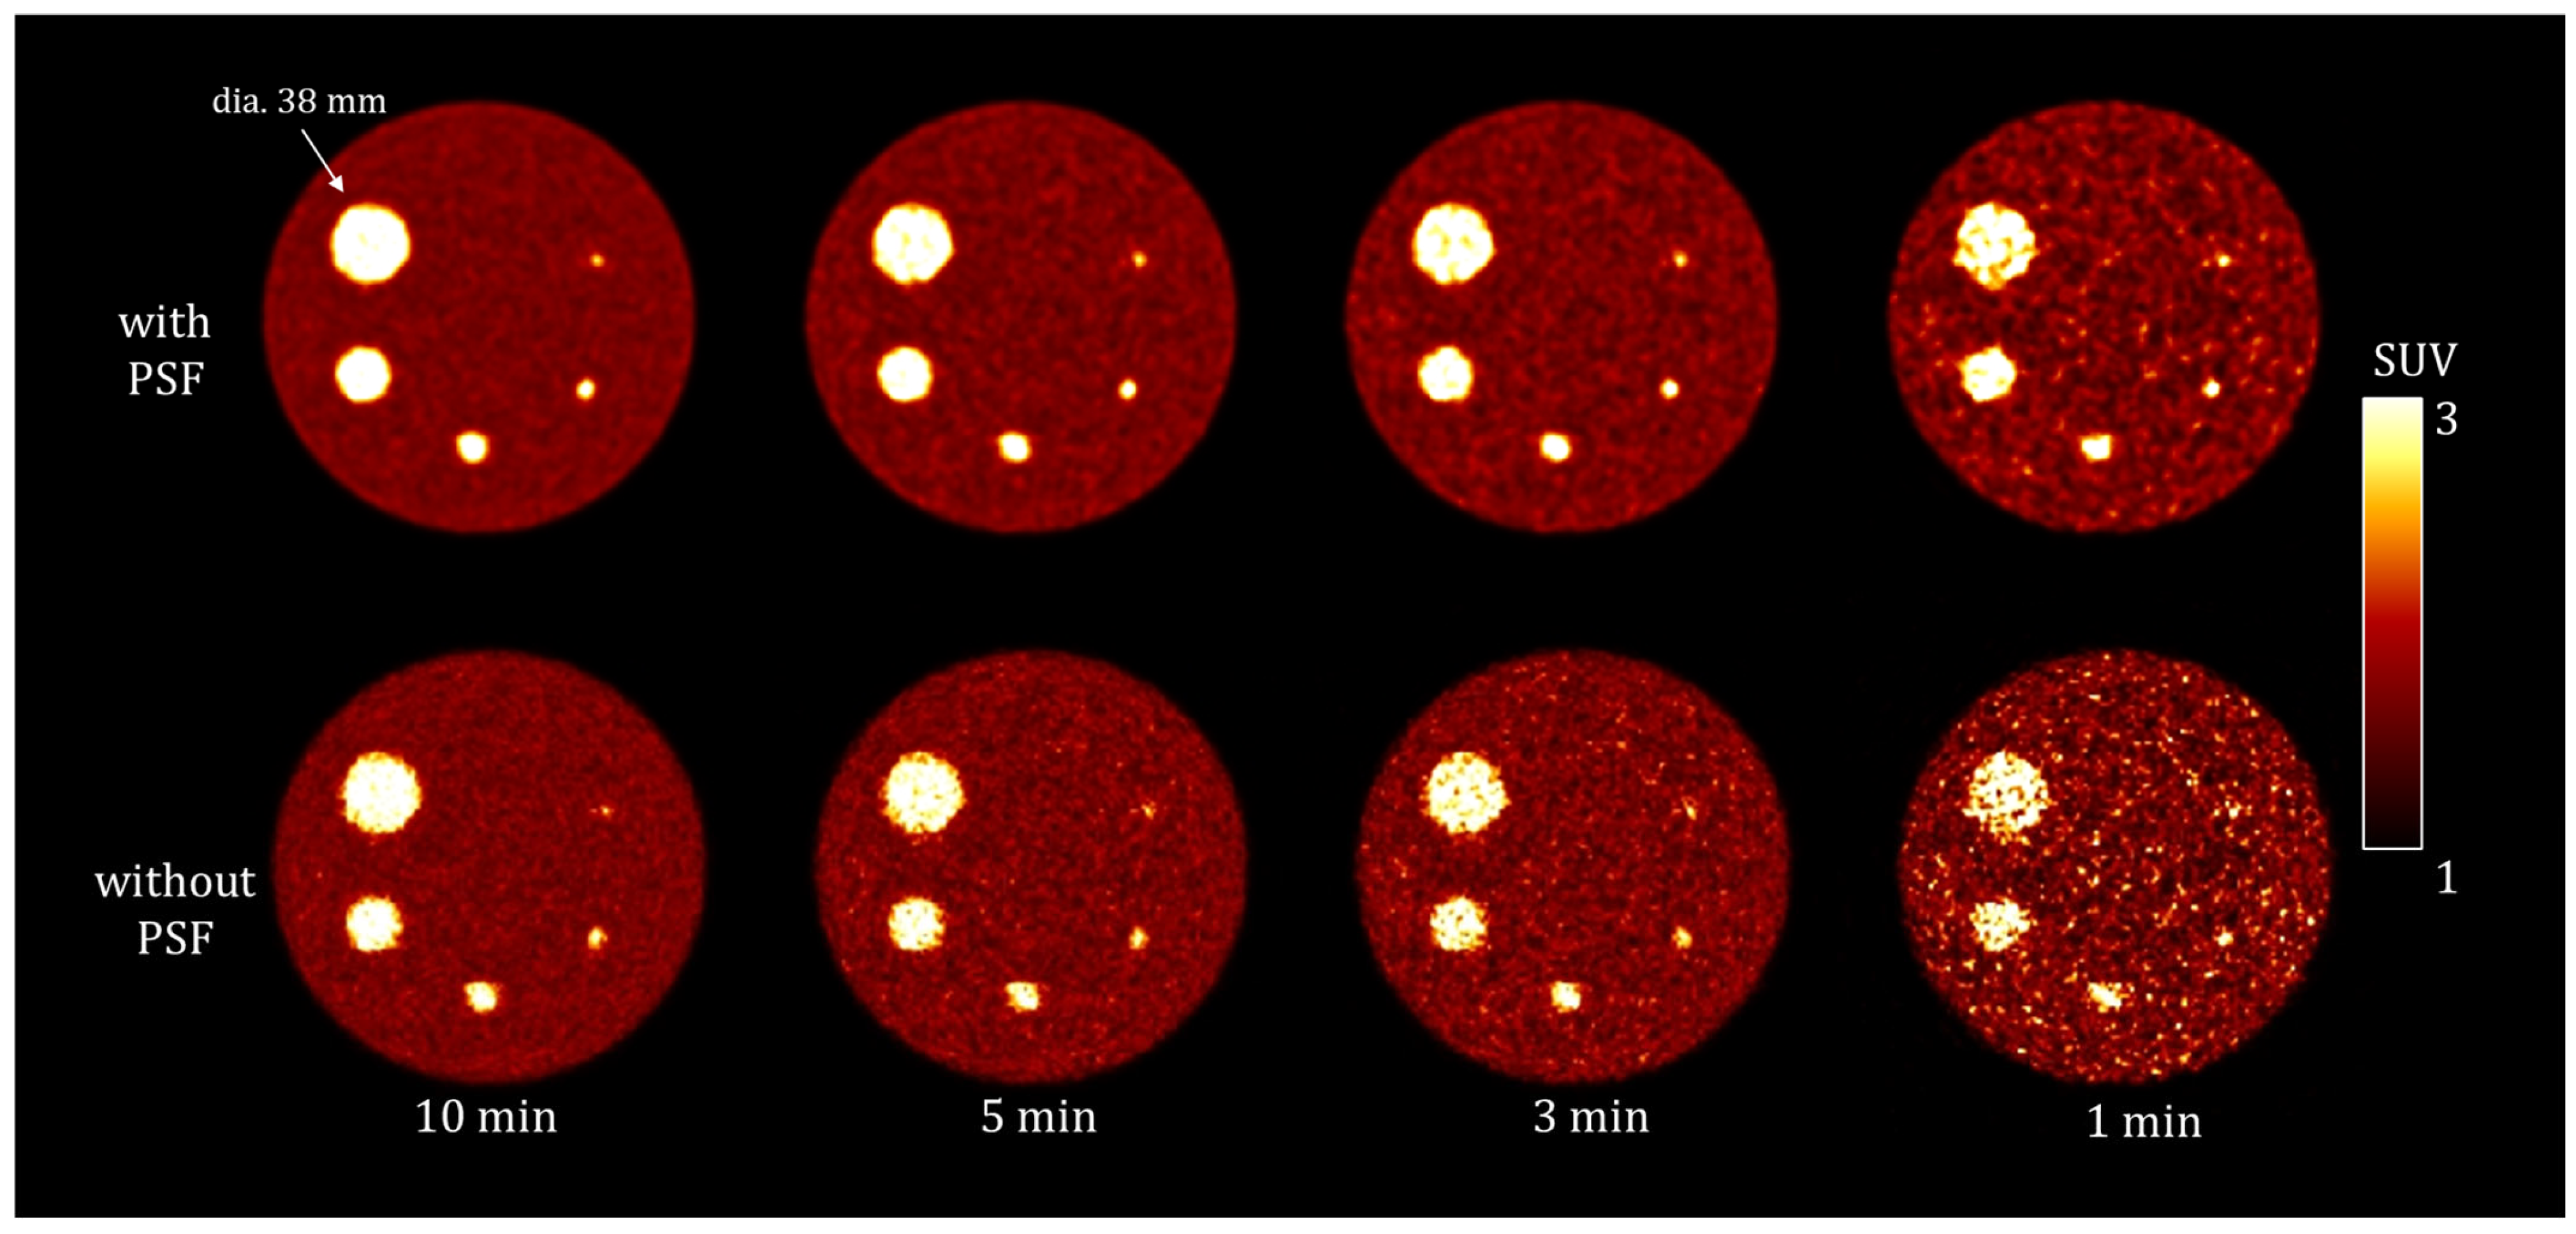
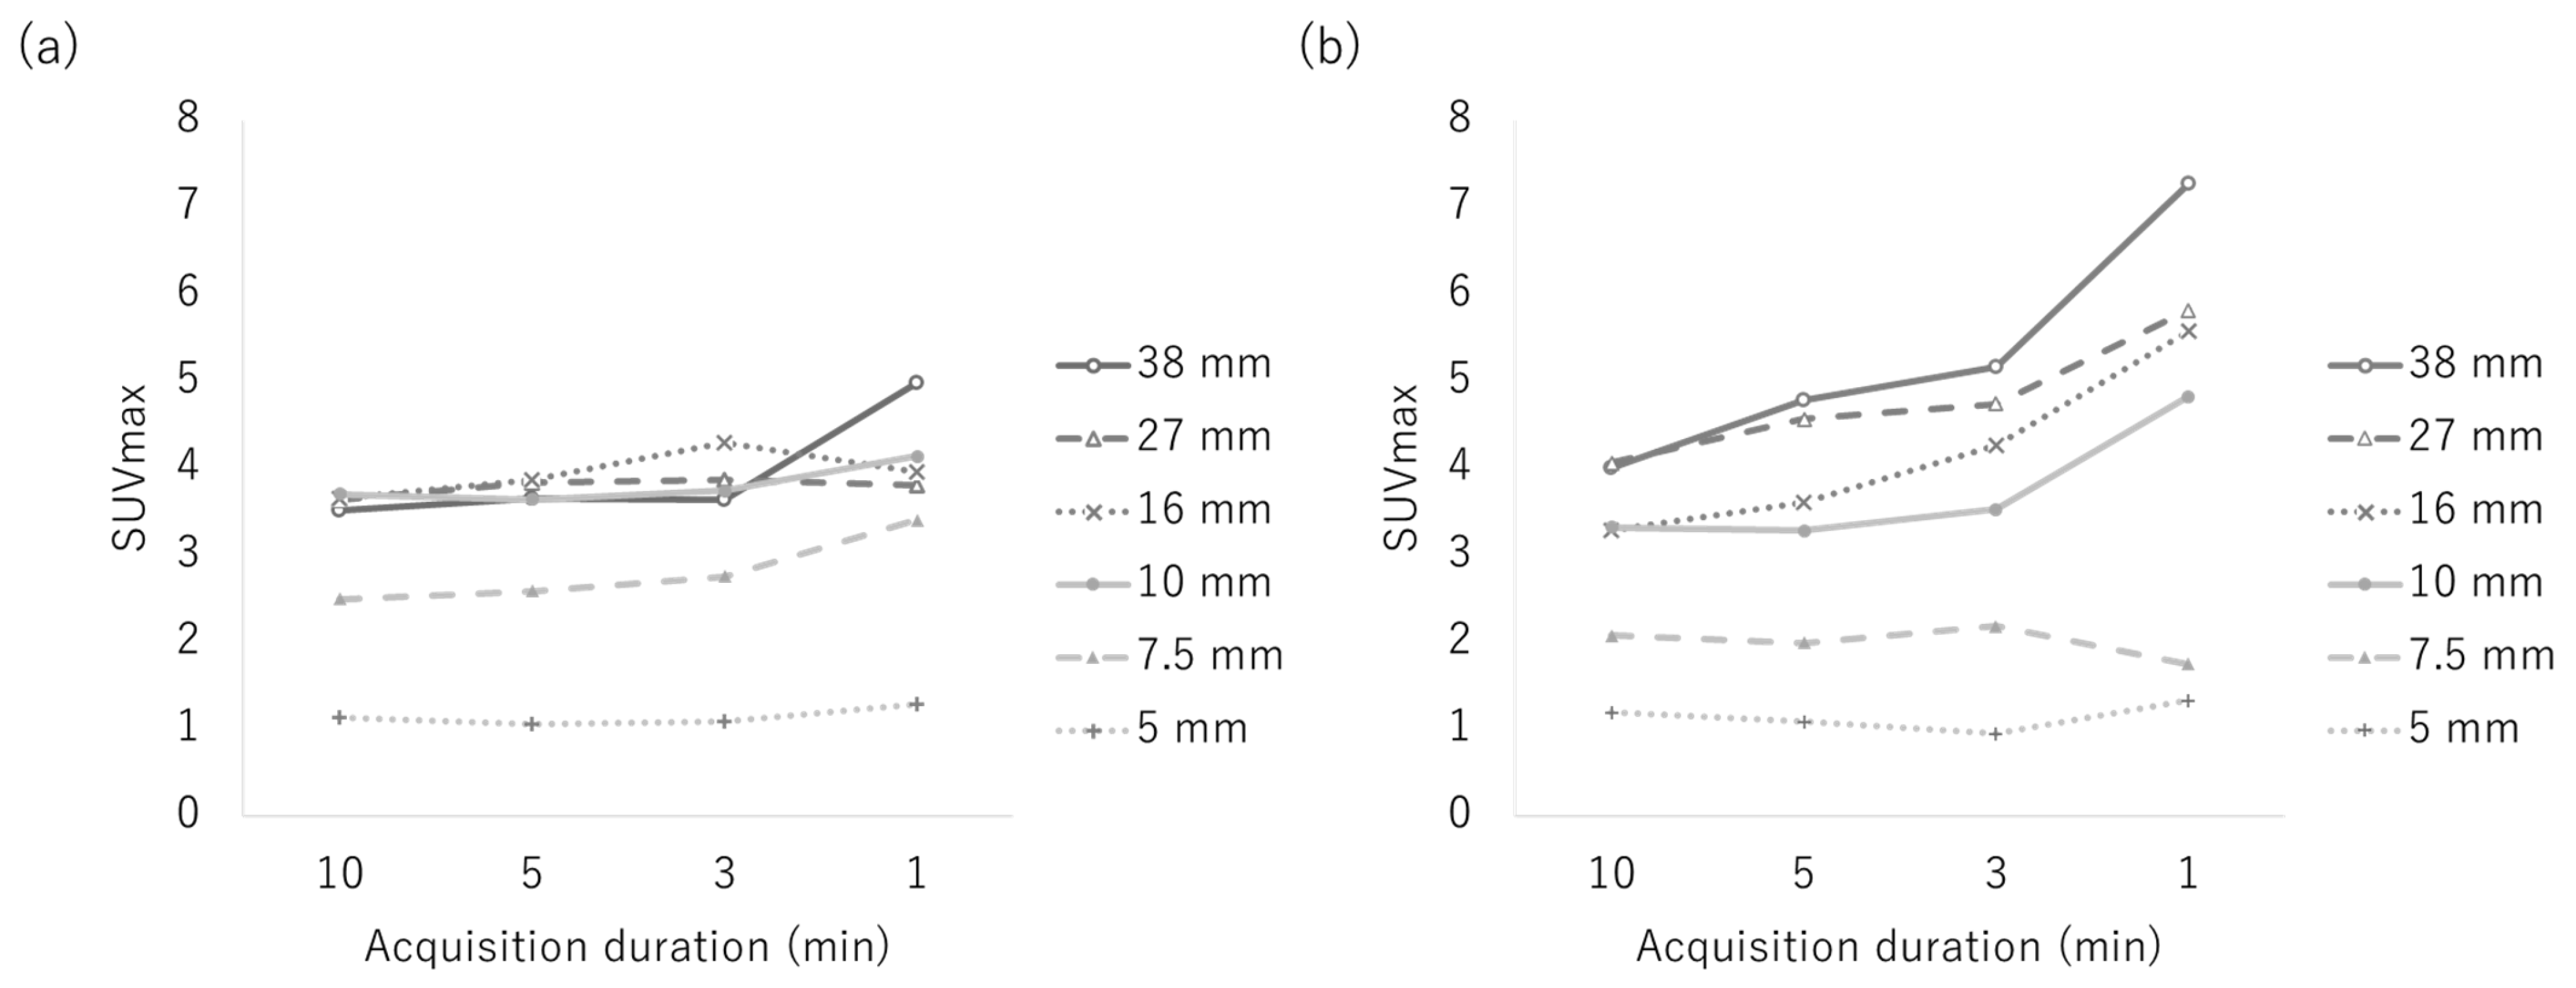
In the phantom study, an increase in statistical noise (Figure 3) and an overestimation of SUVmax (Figure 4) were observed under both reconstruction conditions even in the standard 10 min acquisition. The SUVmax without PSF was increasingly overestimated as the acquisition duration was shortened, whereas the SUVmax with PSF remained stable and was less influenced by the acquisition duration, irrespective of the sphere size. For example, the SUVmax of the 38 mm sphere in the reconstruction with PSF were 3.5, 3.7, 3.6, and 5.0 for the 10, 5, 3, and 1 min acquisitions, respectively. In contrast, the corresponding values in the reconstruction without PSF were 4.0, 4.8, 5.2, and 7.3.

3.2. Clinical Study

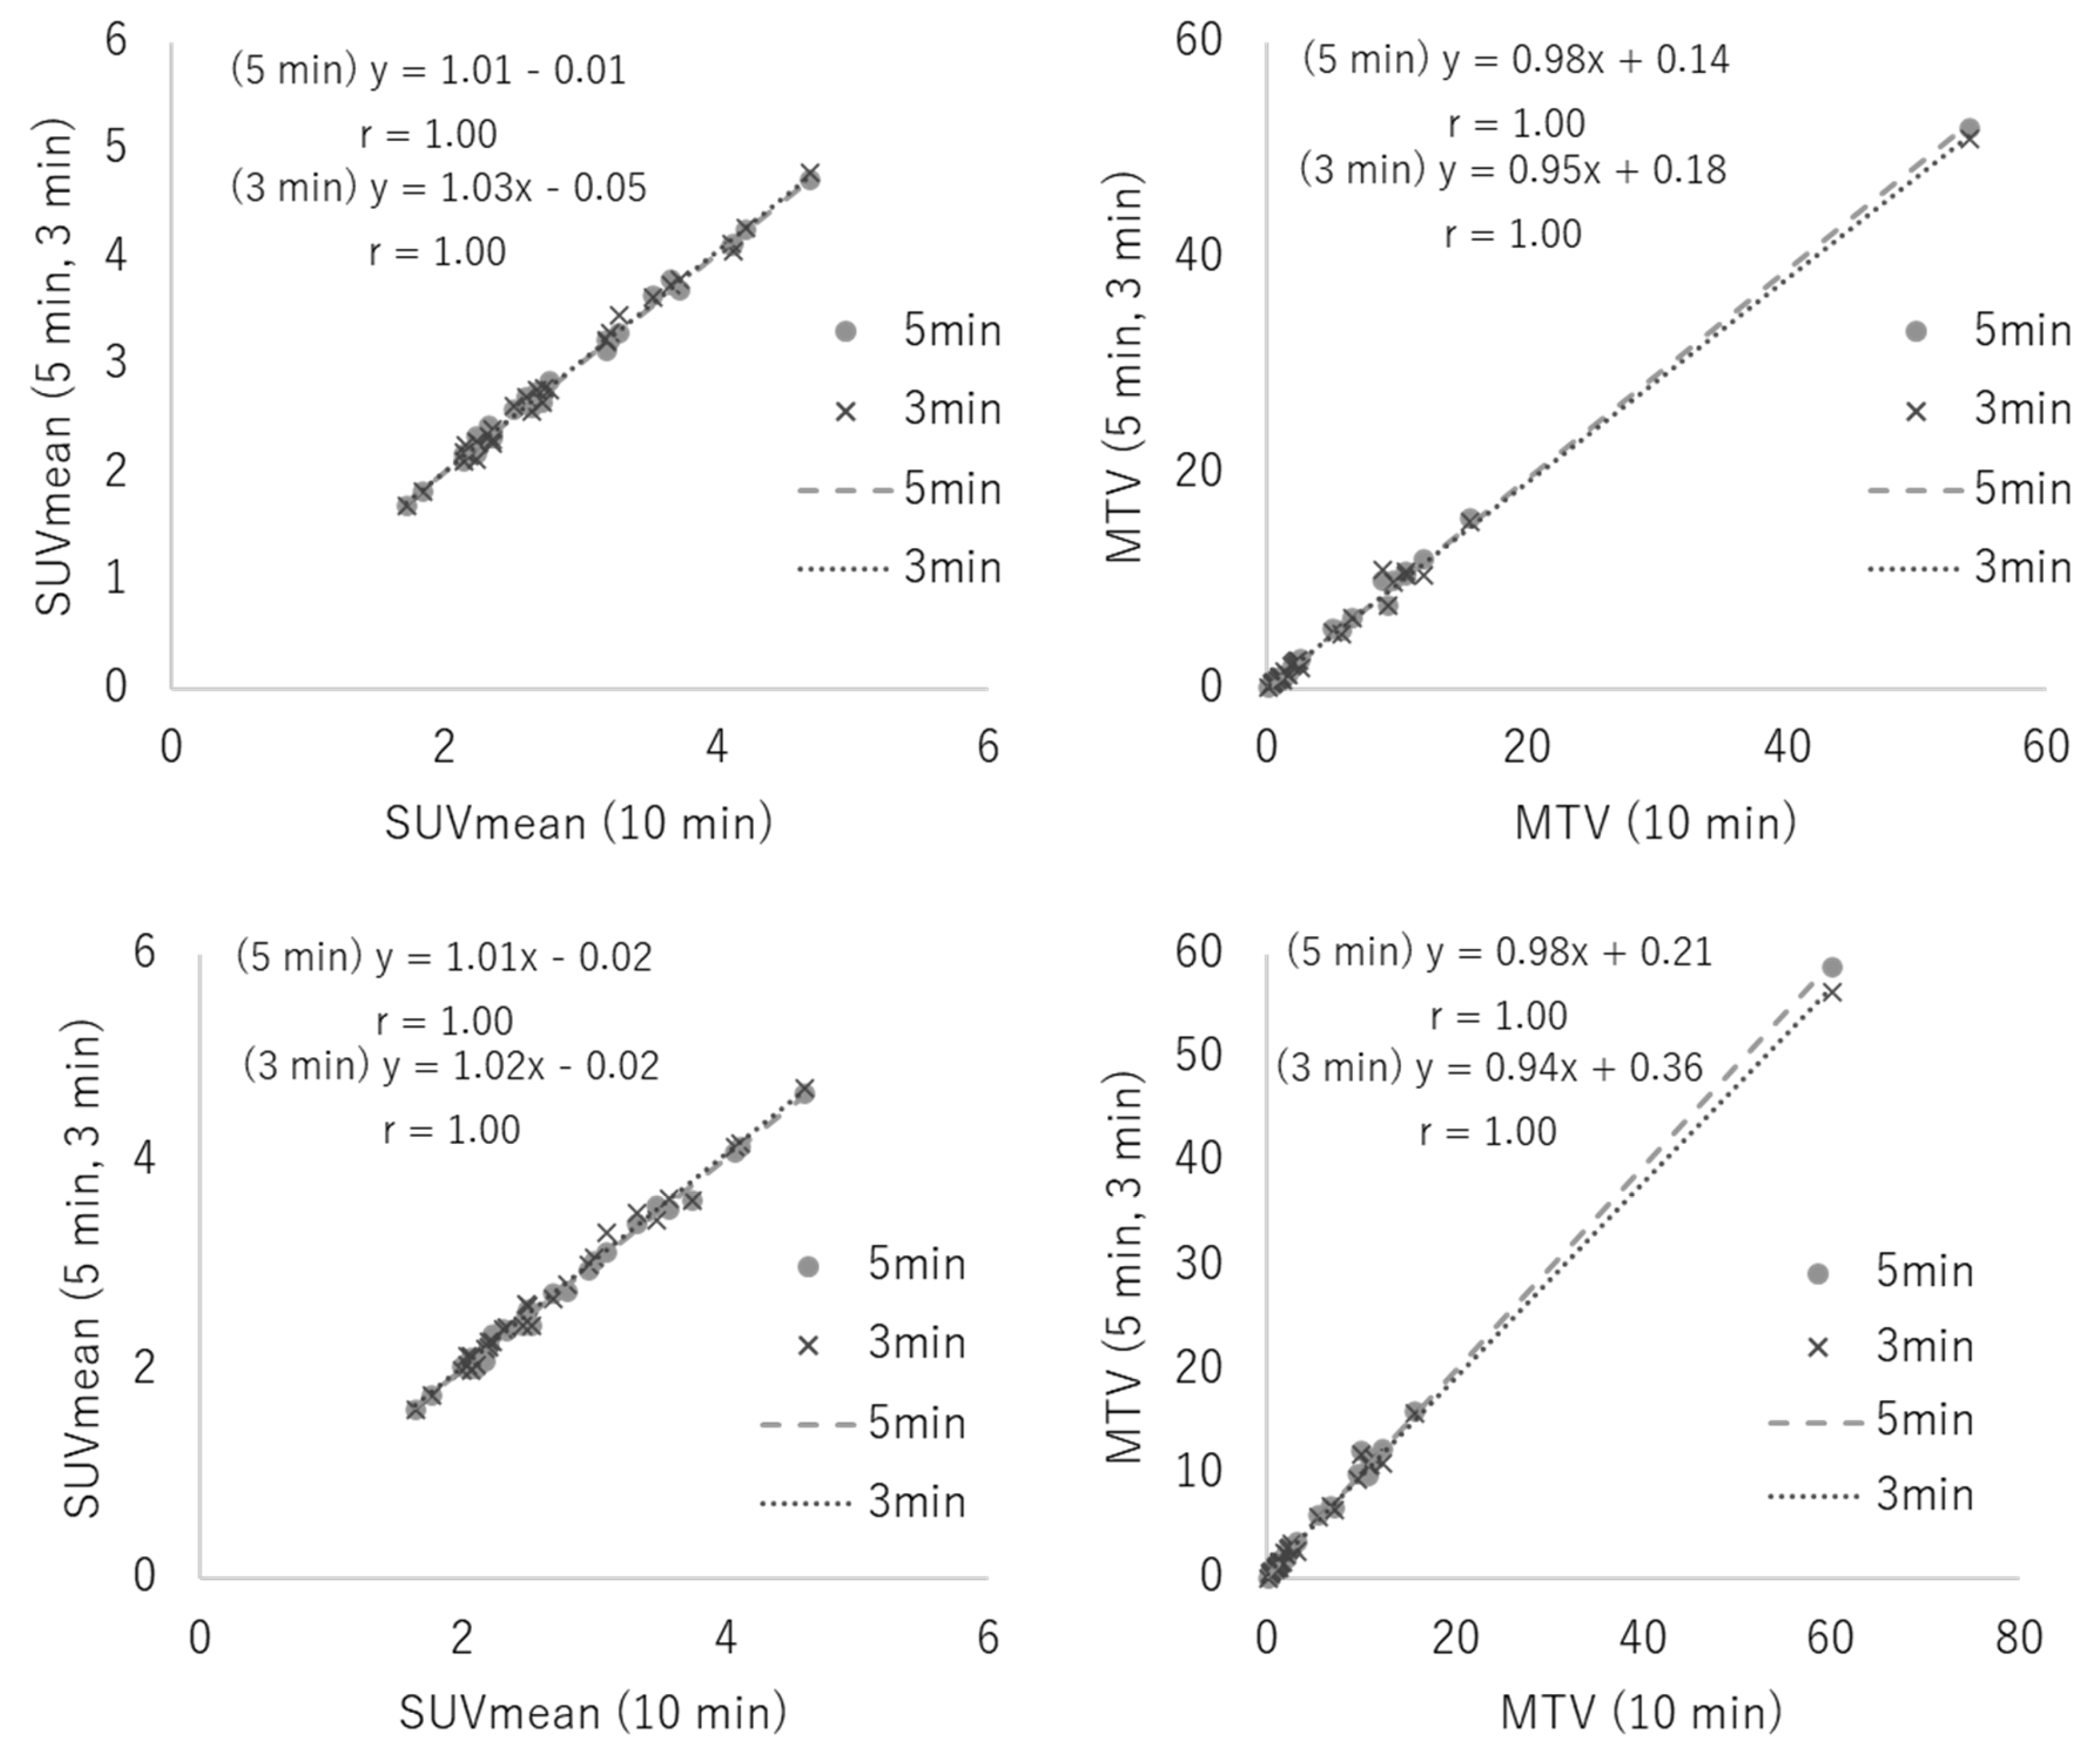
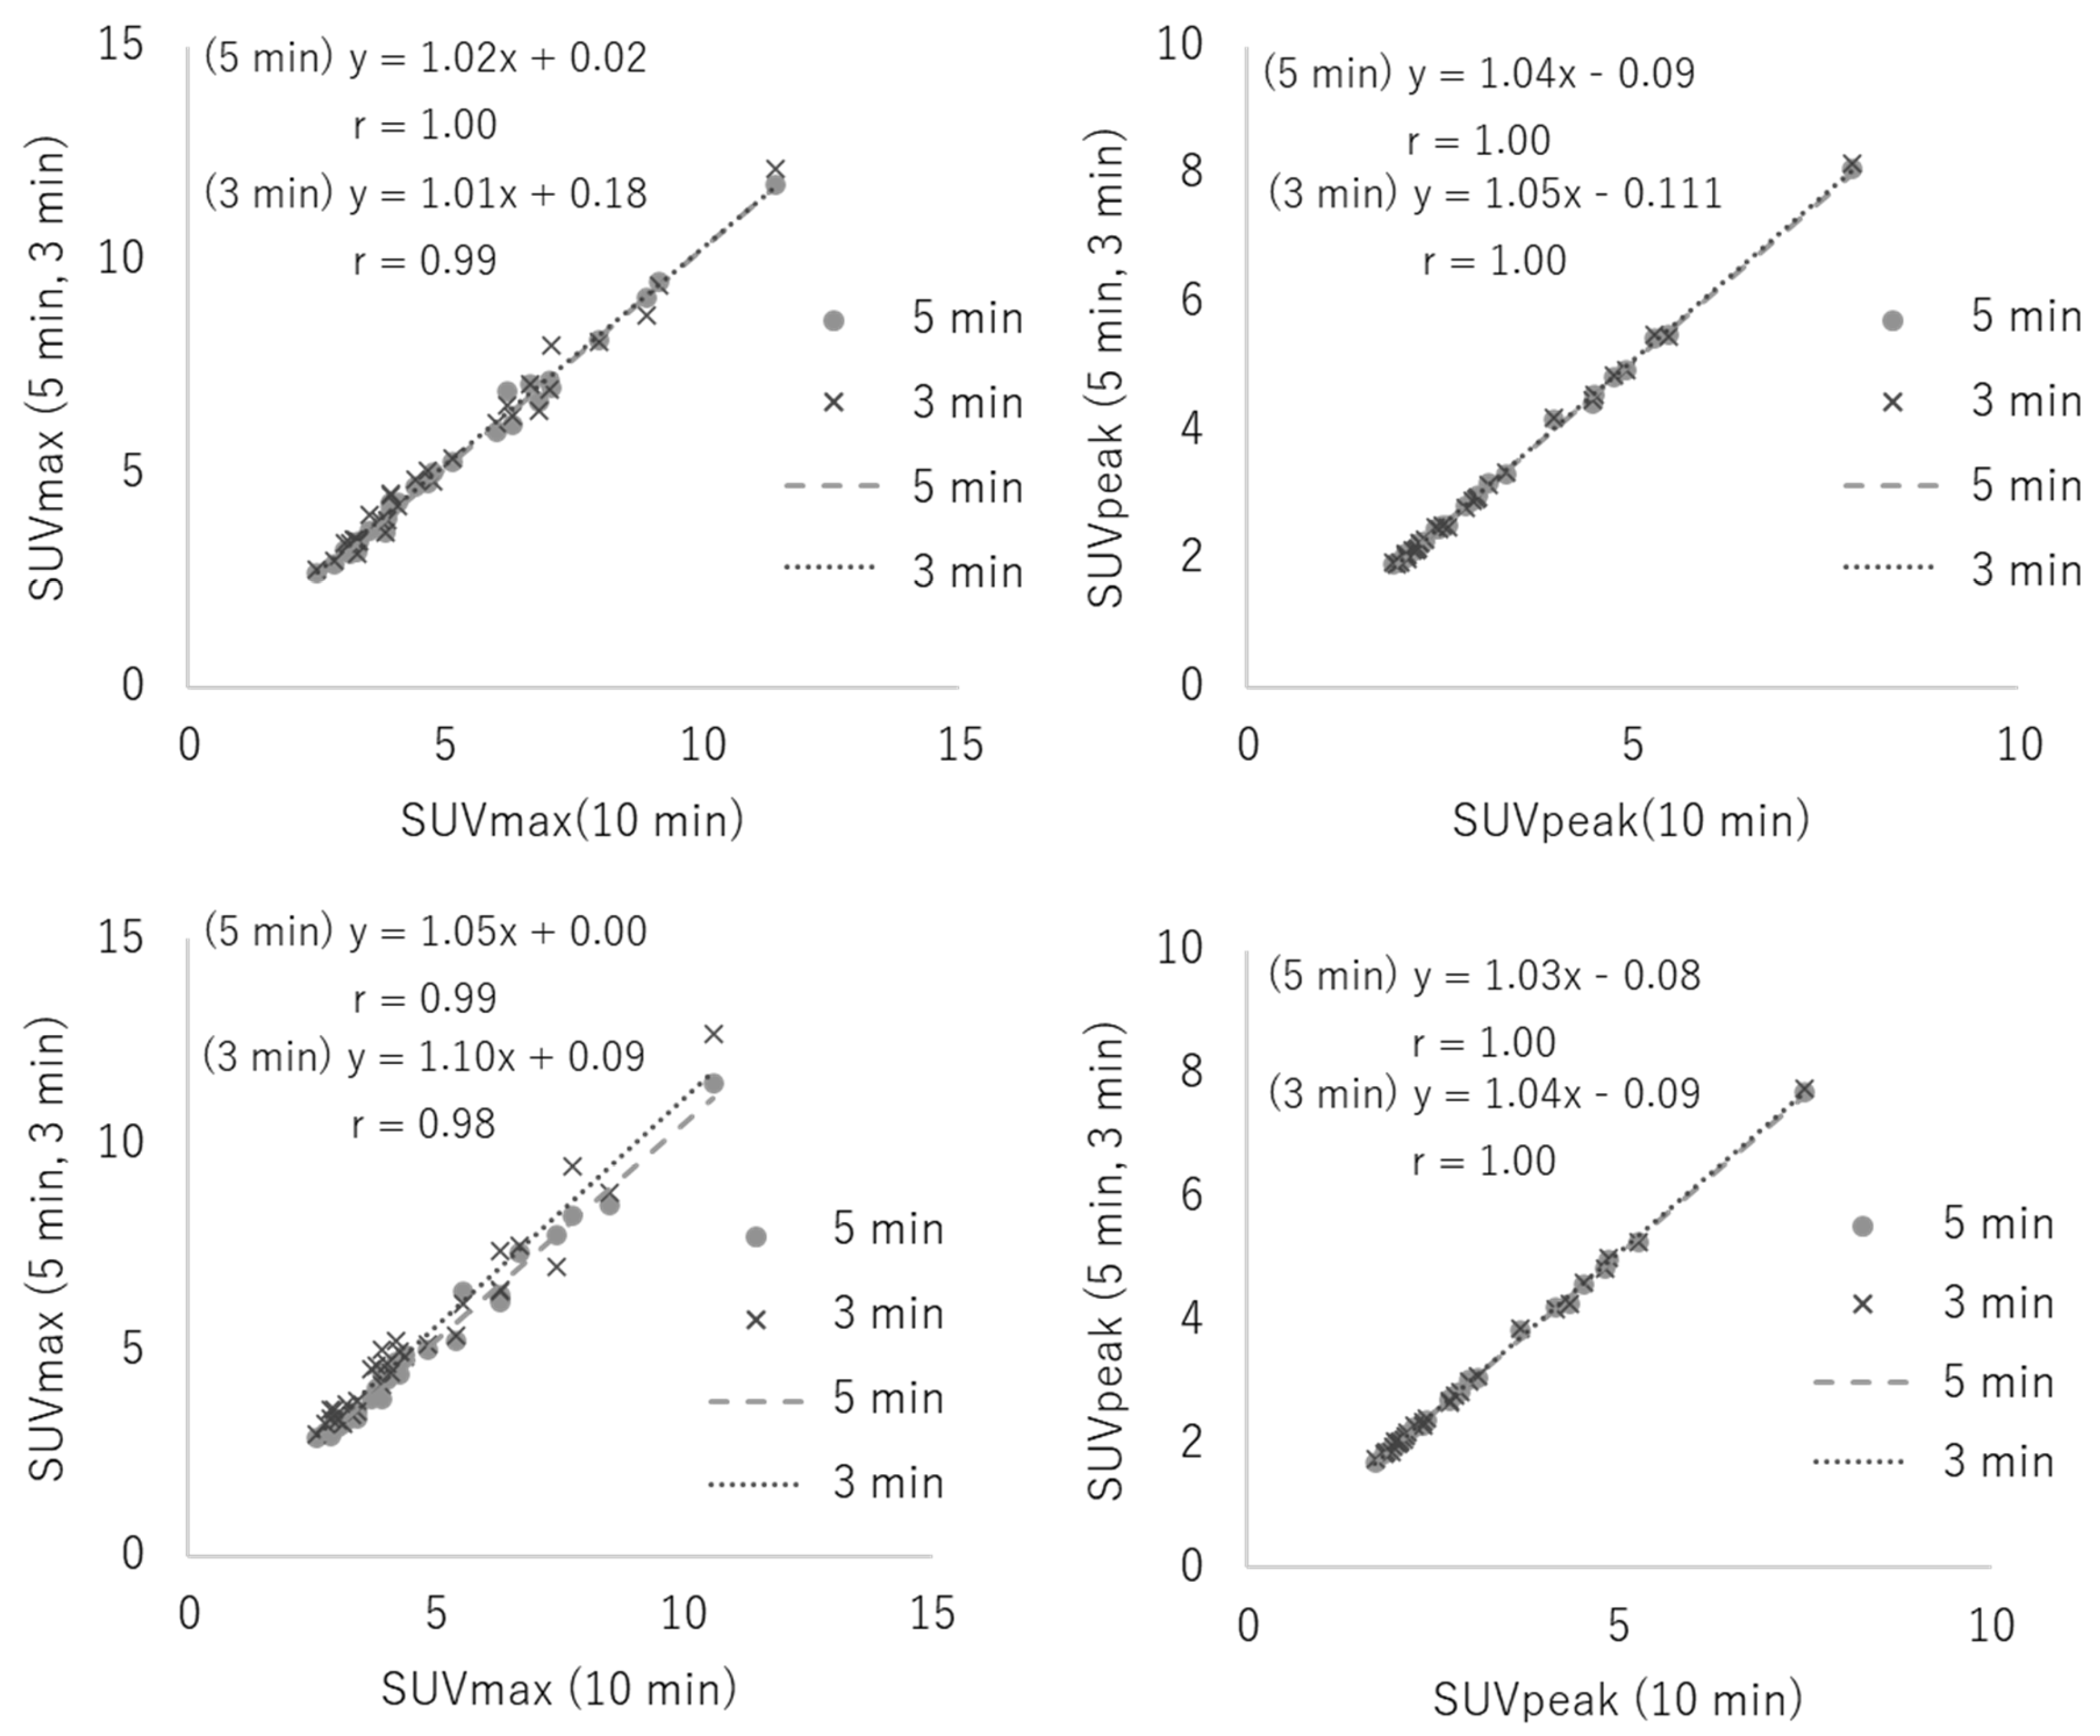
SUVmax, SUVpeak, SUVmean, and MTV showed significant correlations between 10 min acquisition and shortened acquisition durations (Figure 5 and Figure A1). The correlation coefficients were >0.98 for all quantitative parameters, for reconstructions with and without PSF. The regression slopes were close to unity for all conditions, ranging from 0.94 to 1.05, except for the 3 min acquisition for SUVmax without PSF: y = 1.10x + 0.09.
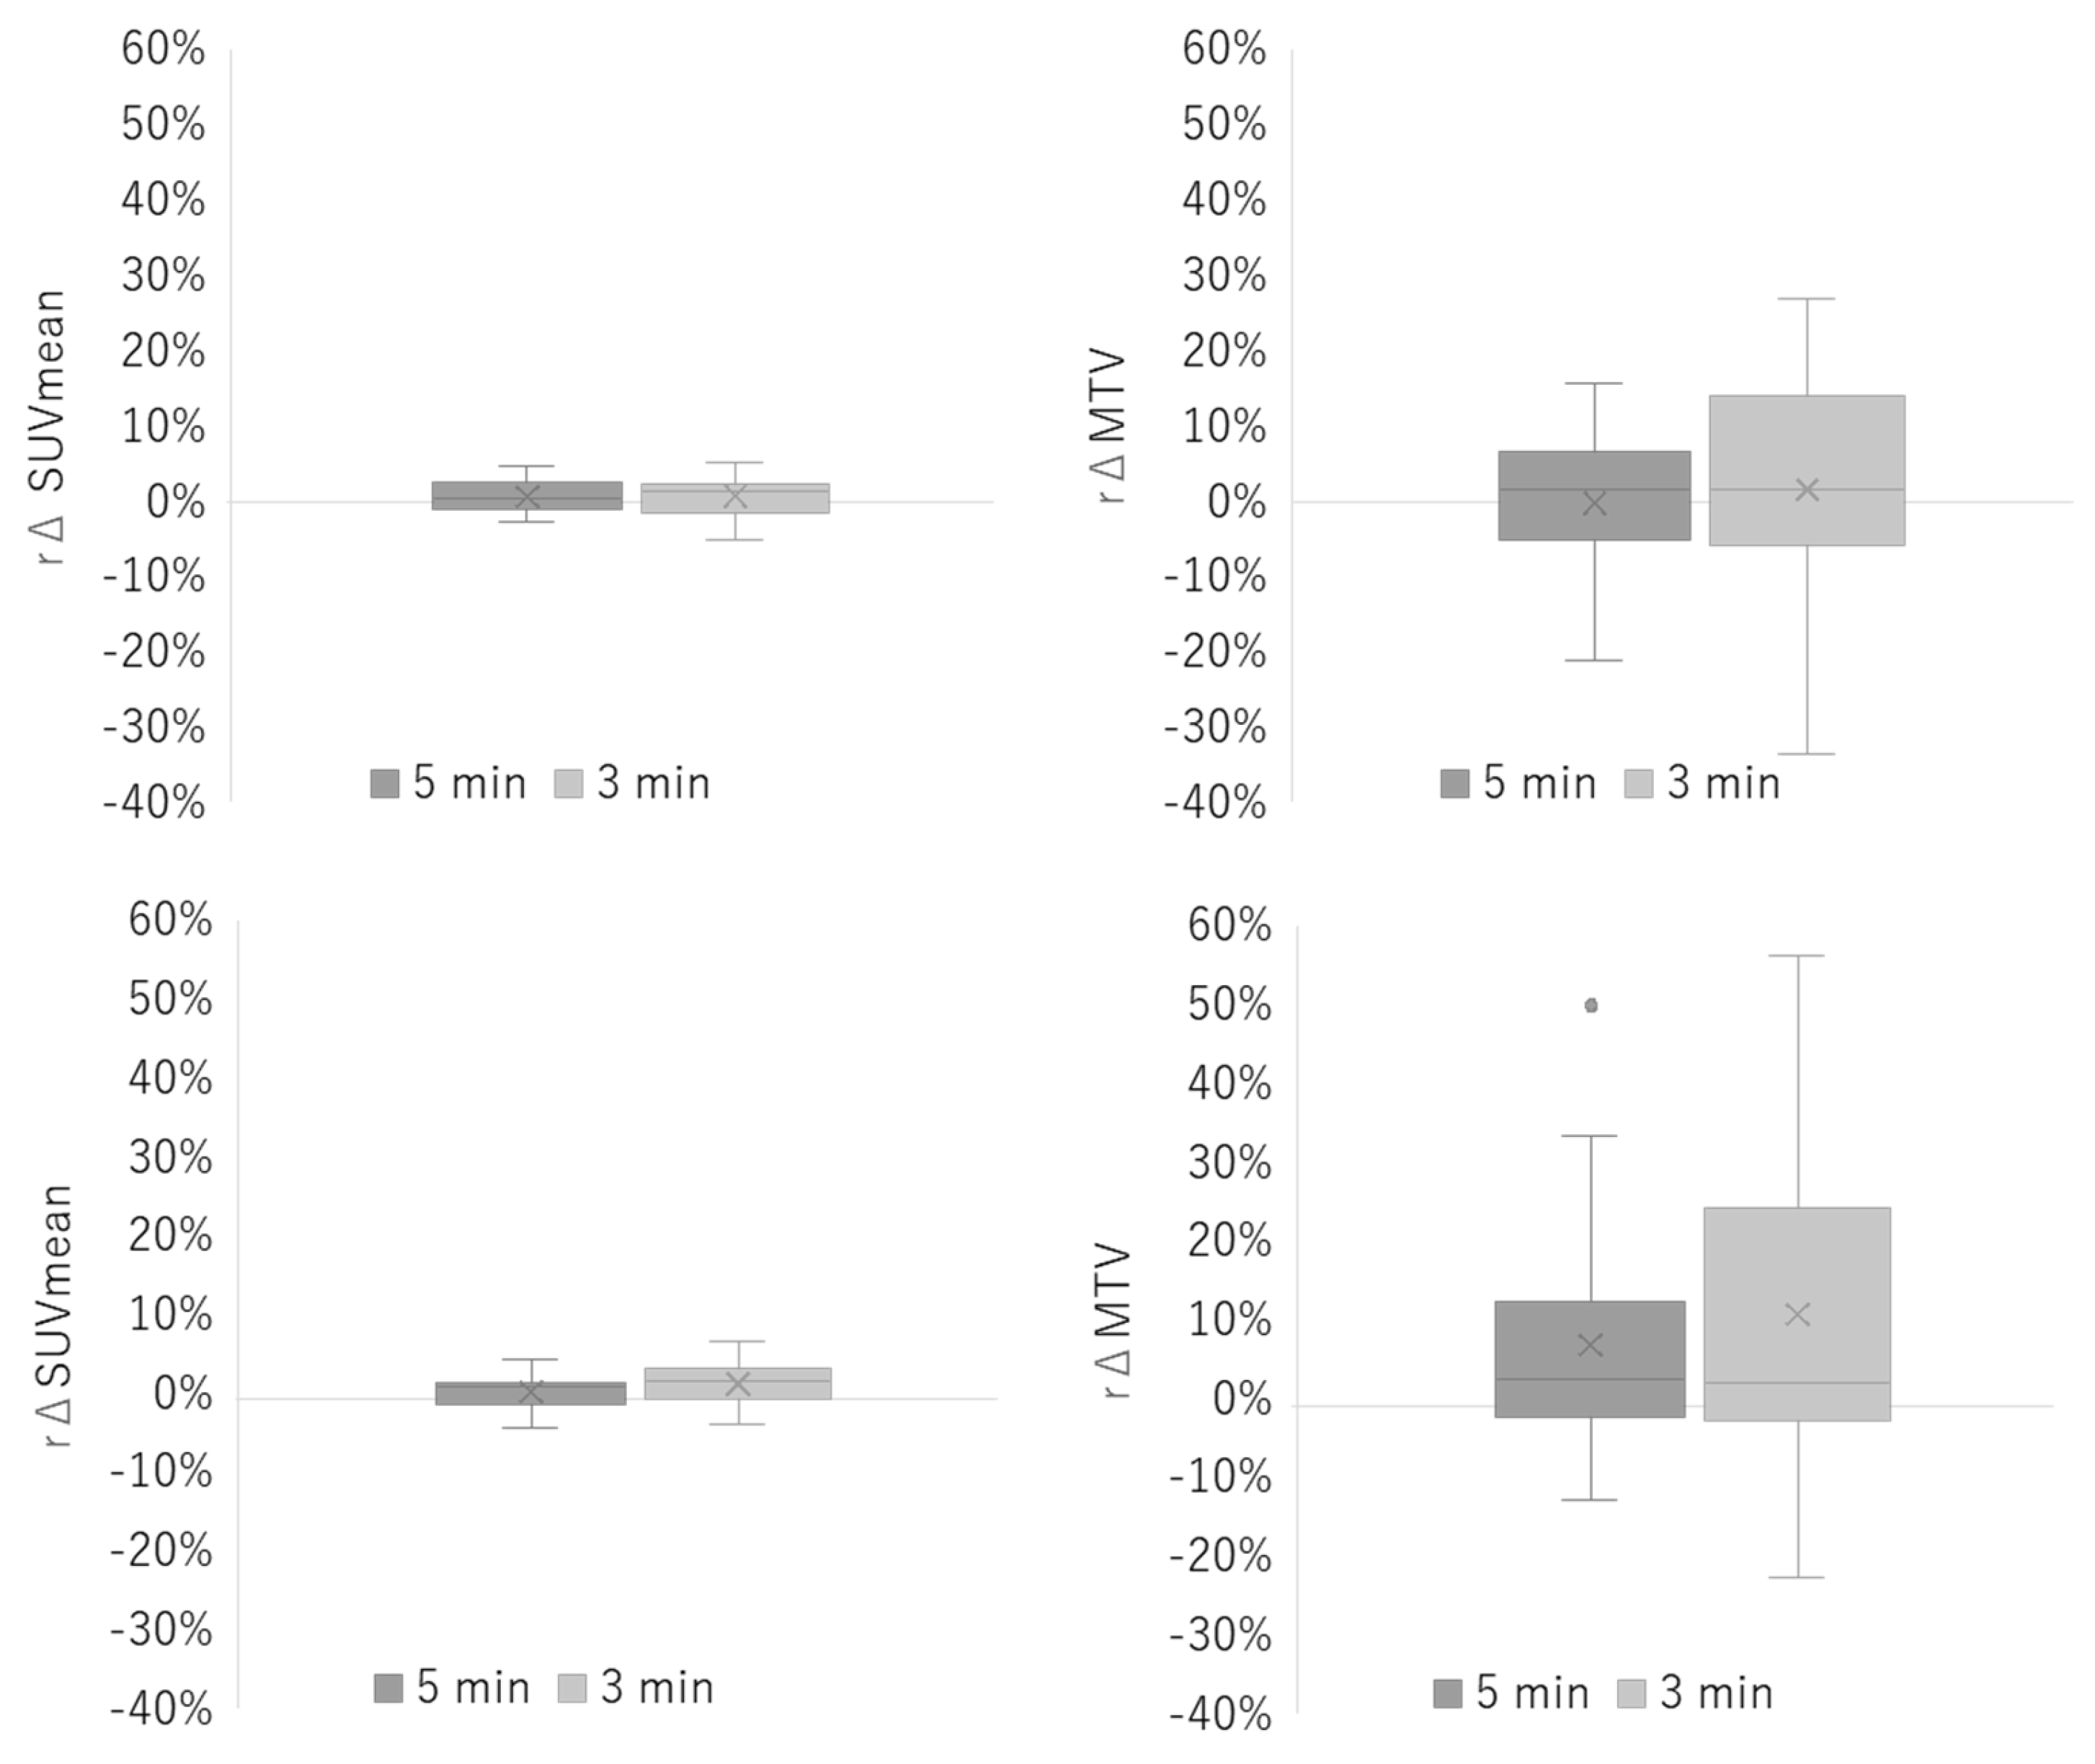
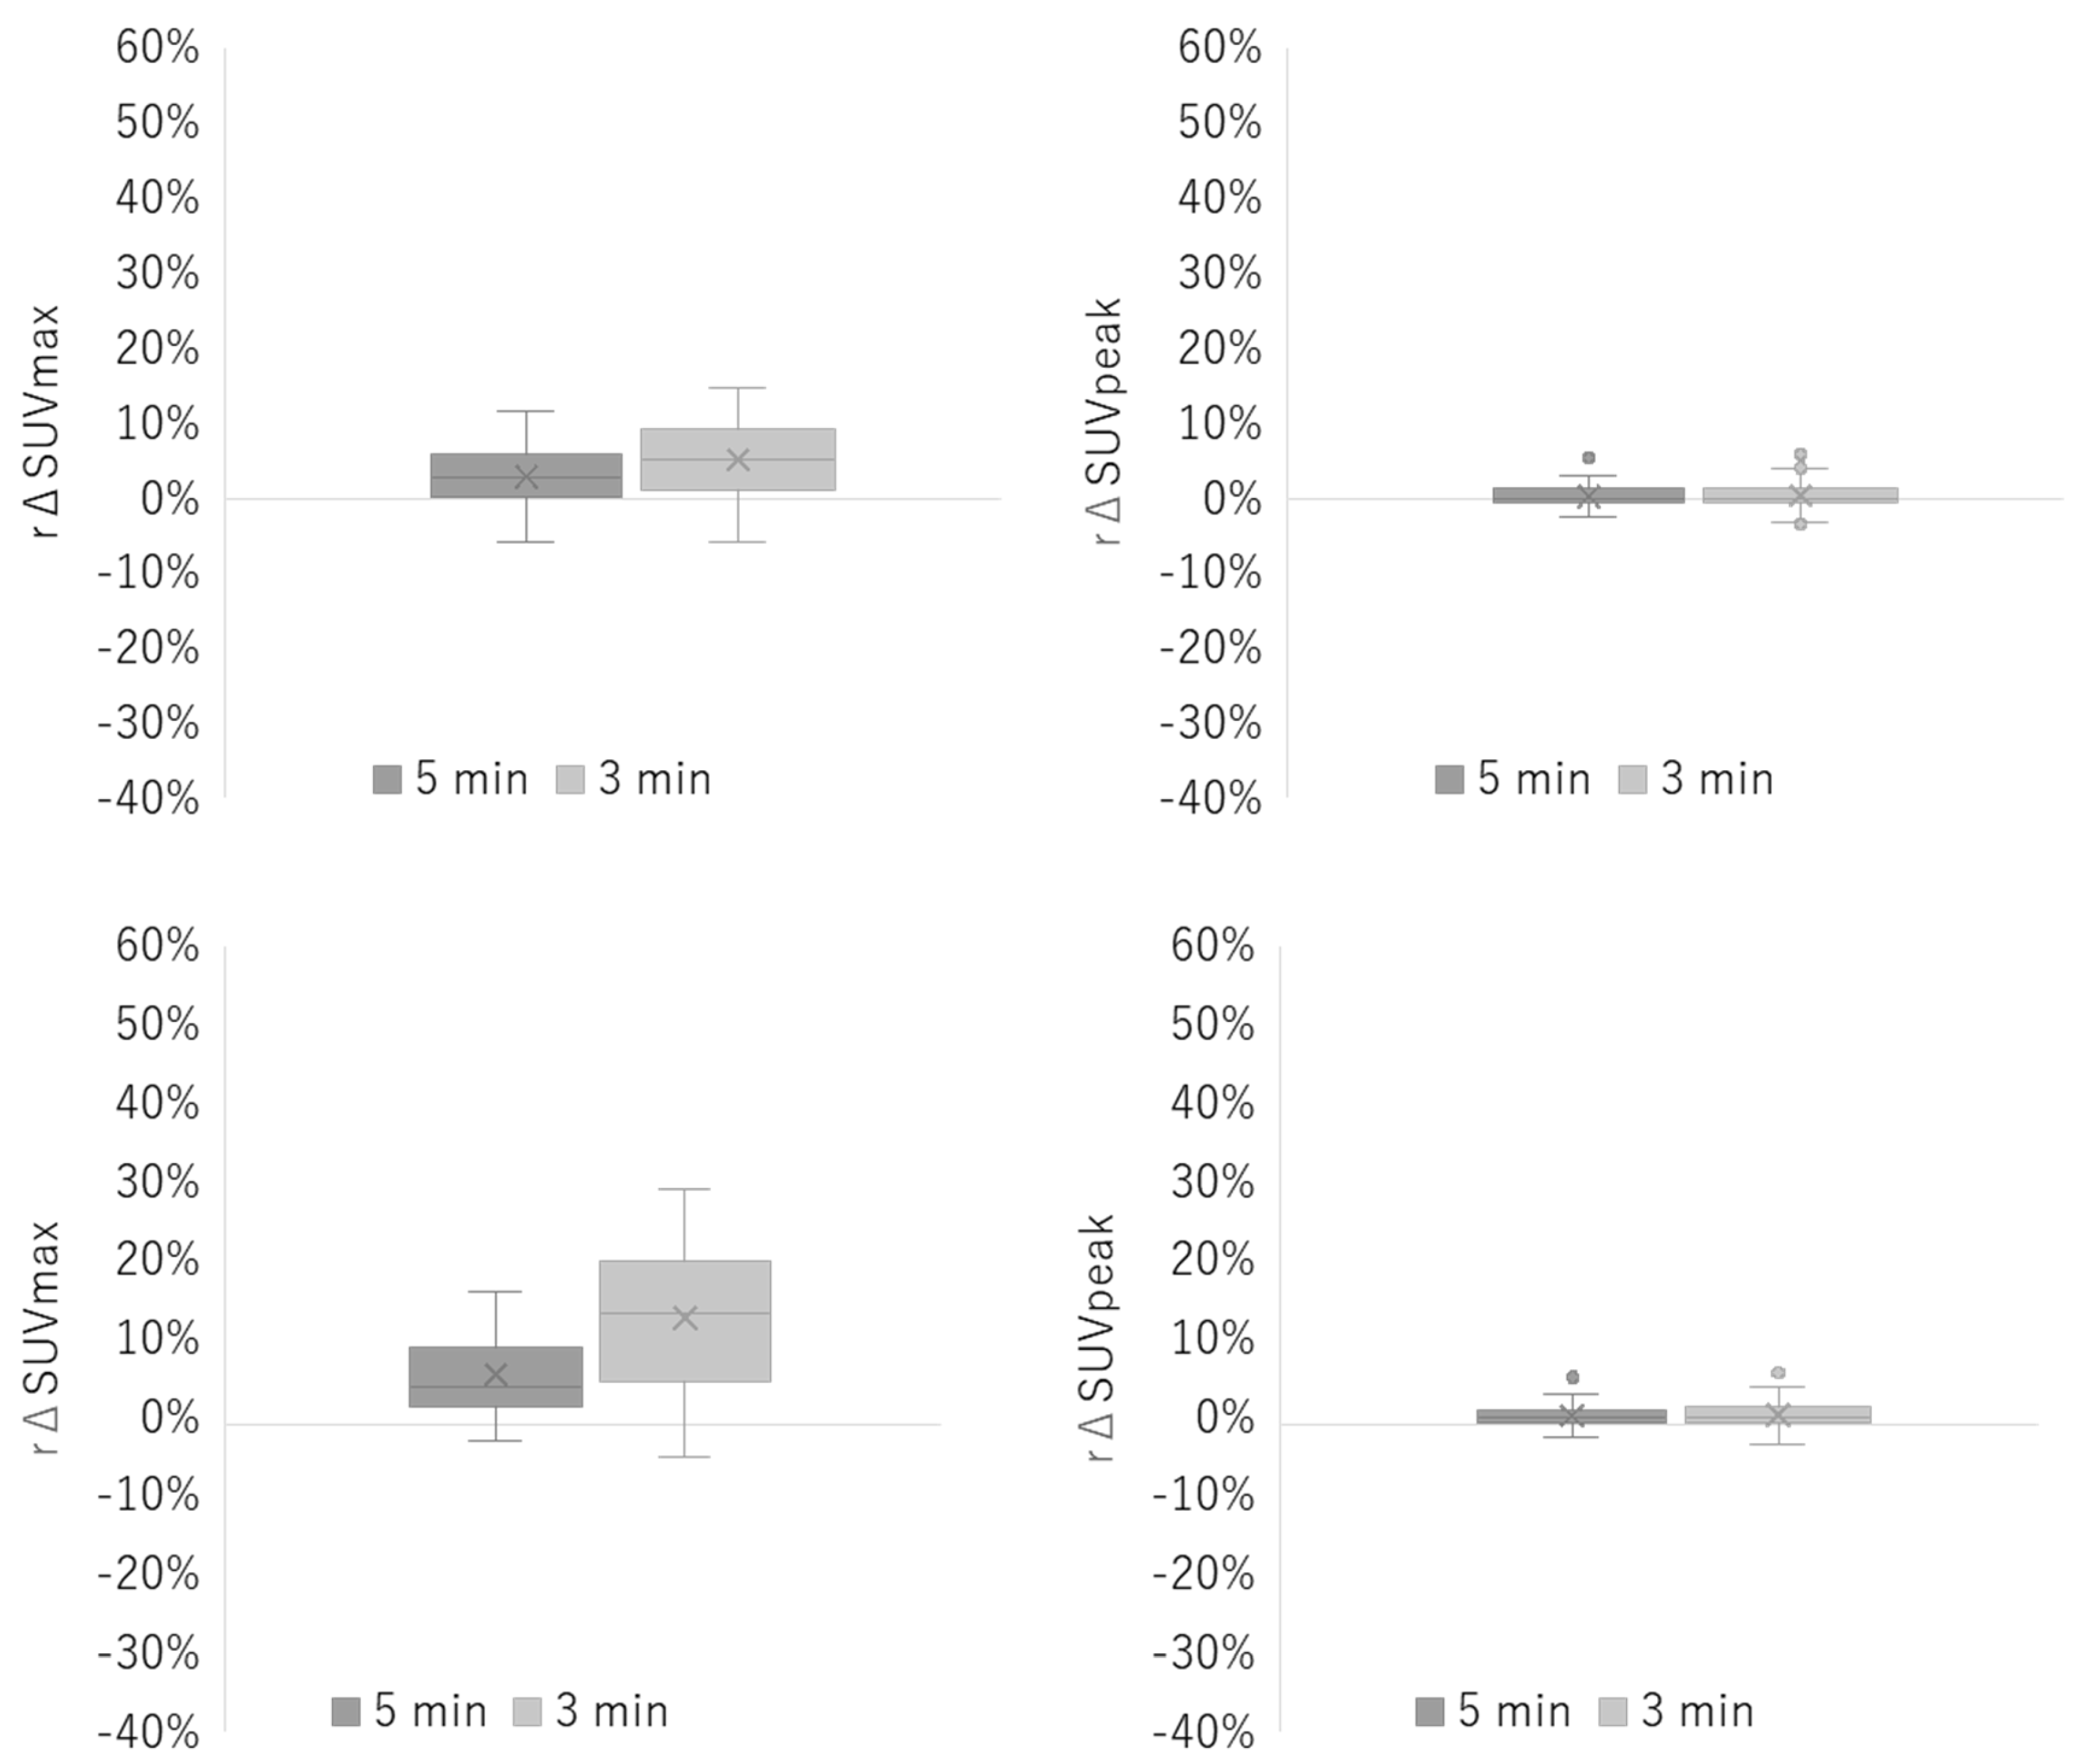
rΔSUVmax was larger for 3 min acquisition durations than for 5 min, and larger in the reconstruction without PSF than with PSF (Figure 6). The values were 2.9 ± 3.8% and 5.2 ± 5.4% for the 5 and 3 min acquisitions with PSF, and 5.5 ± 5.1% and 12.7 ± 8.5% without PSF, respectively. The rΔSUVpeak were smaller compared with rΔSUVmax, and the differences between the reconstruction conditions and the acquisition durations were also smaller. The rΔMTV showed similar trends to rΔSUVmax: in reconstruction with PSF, rΔMTV values for the 5 and 3 s acquisitions were −0.1 ± 9.0% and 1.7 ± 14.2%, and the corresponding values in reconstruction without PSF were 6.9 ± 13.6% and 10.8 ± 22.8%, respectively (Figure A2 in Appendix A).
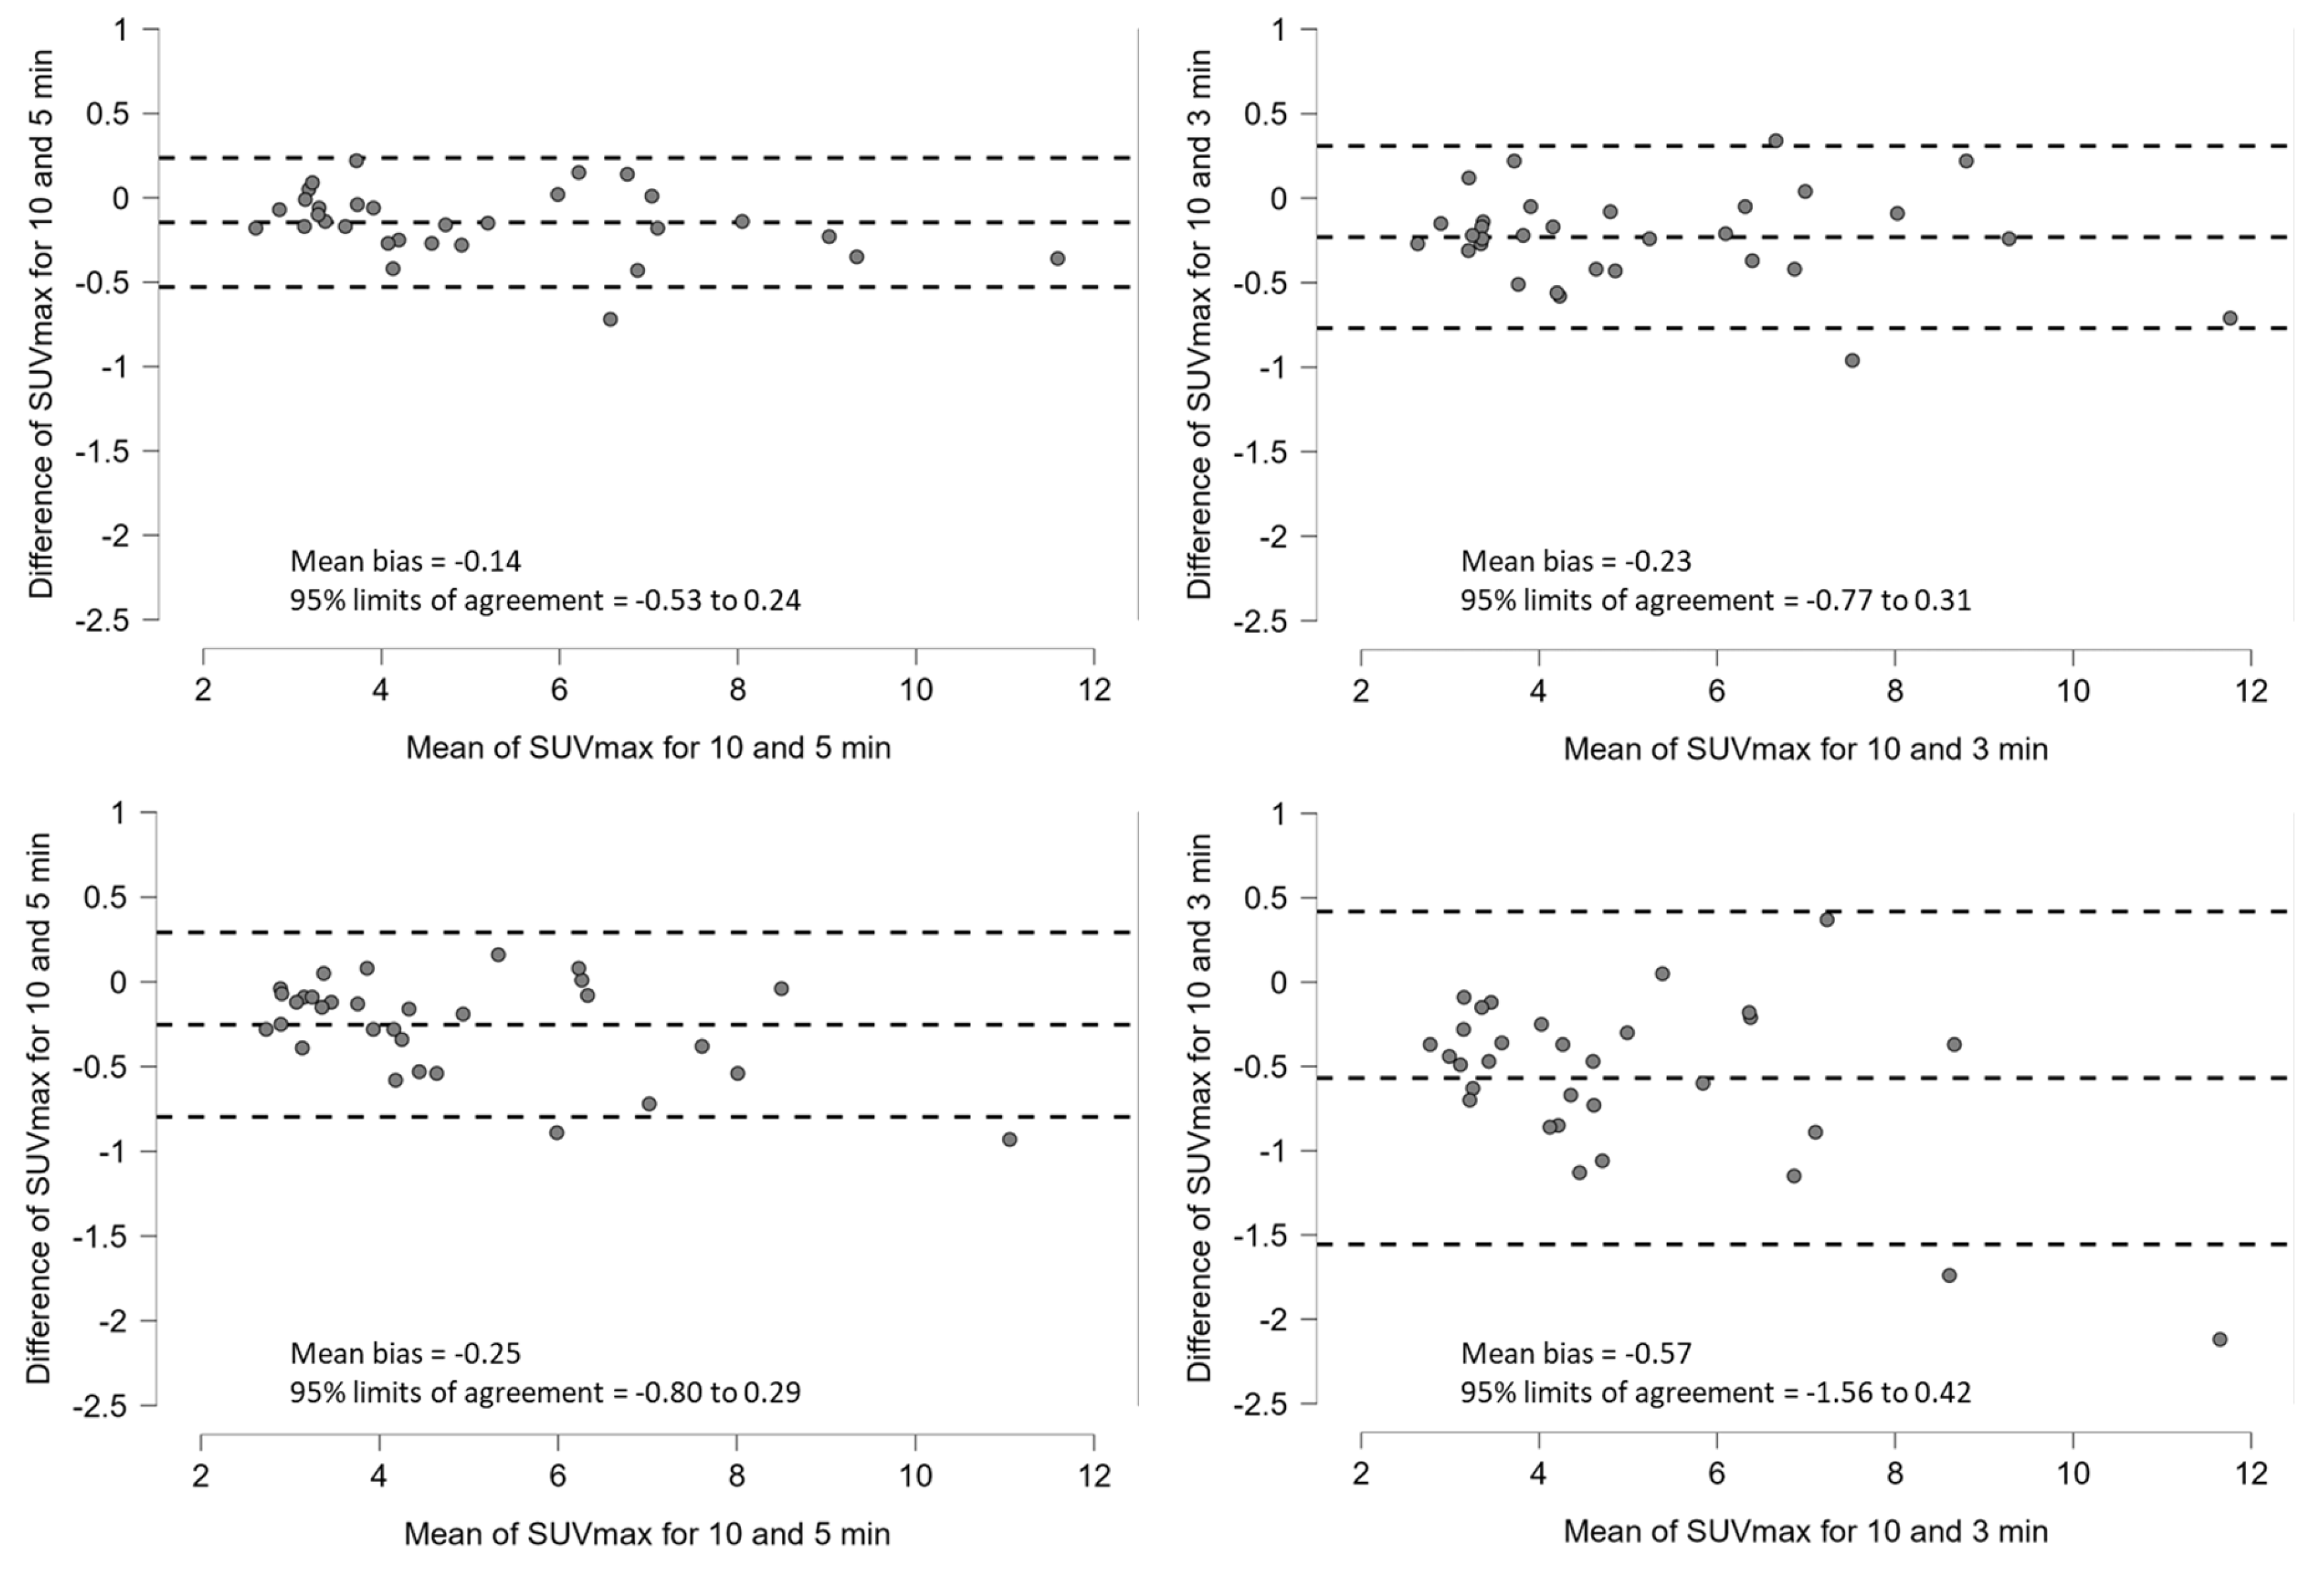
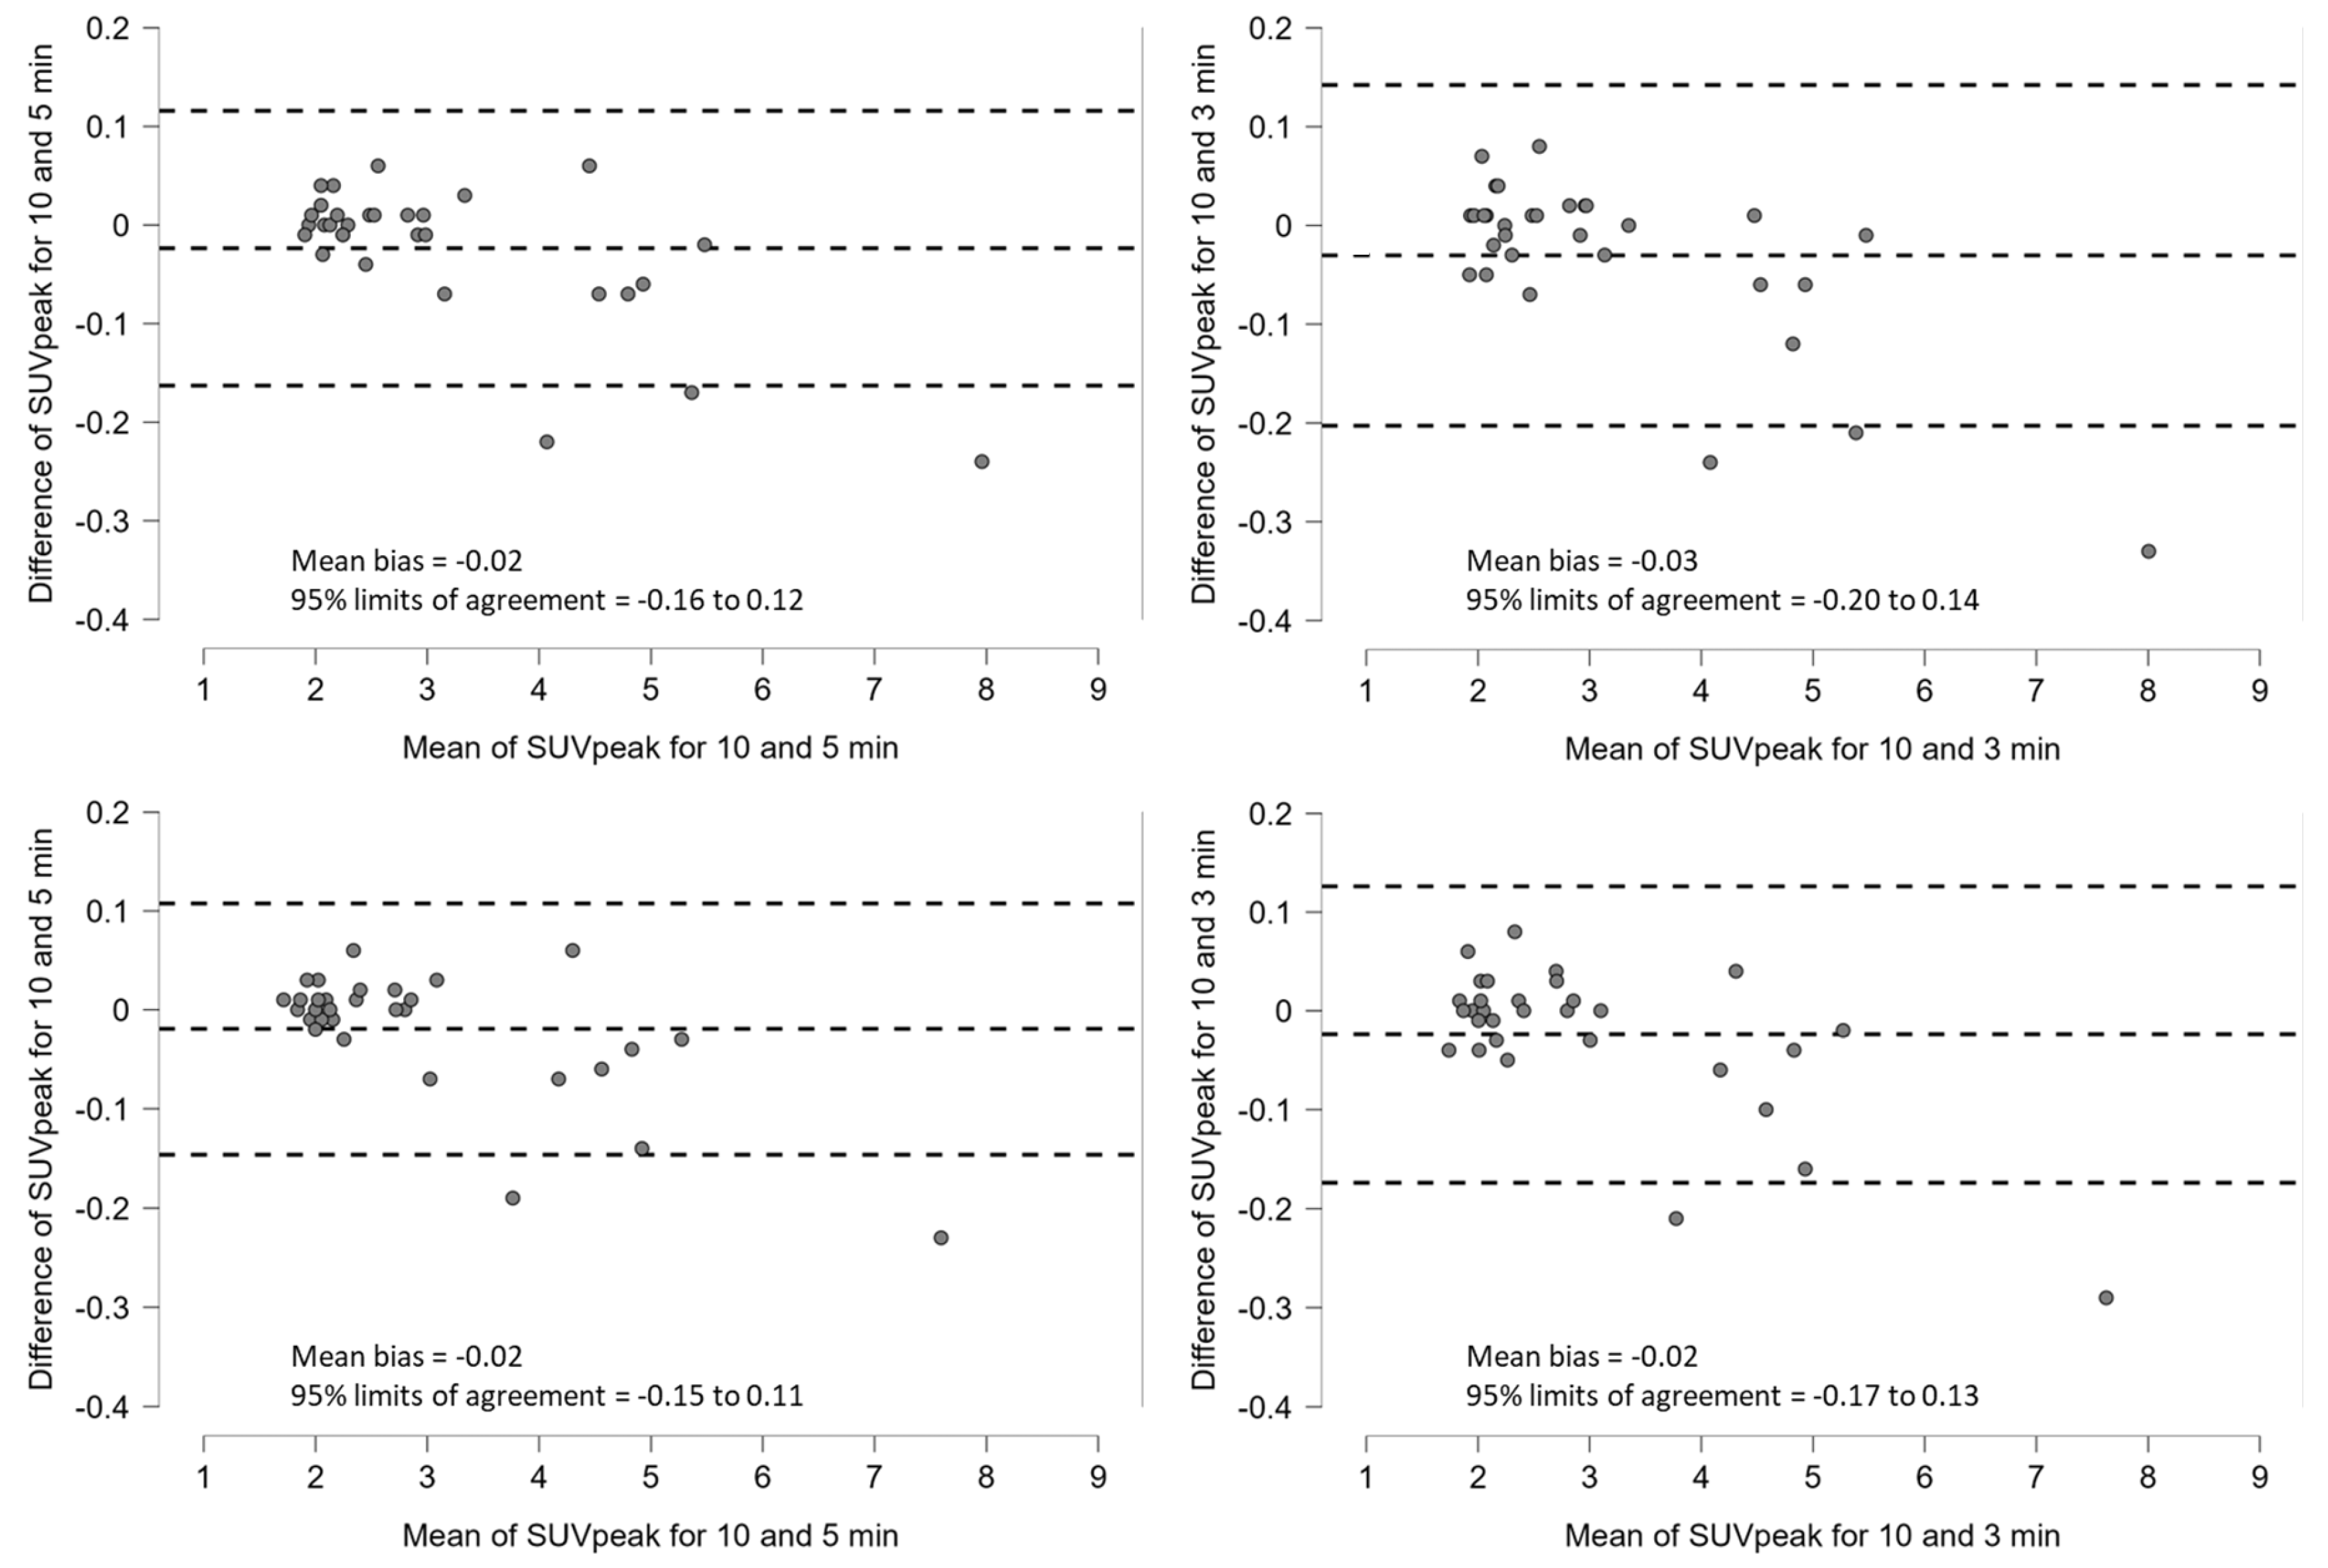
The Bland–Altman analysis for SUVmax showed a mean bias of −0.23, with 95% limits of agreement ranging from −0.77 to 0.31 between the 10 and 3 min acquisitions with PSF, whereas the corresponding values without PSF were −0.57 and −1.56 to 0.42 (Figure 7). For SUVpeak, the mean bias and 95% limits of agreement were −0.03 (−0.20 to 0.14) with PSF, and −0.02 (−0.17 to 0.13) without PSF (Figure 8).
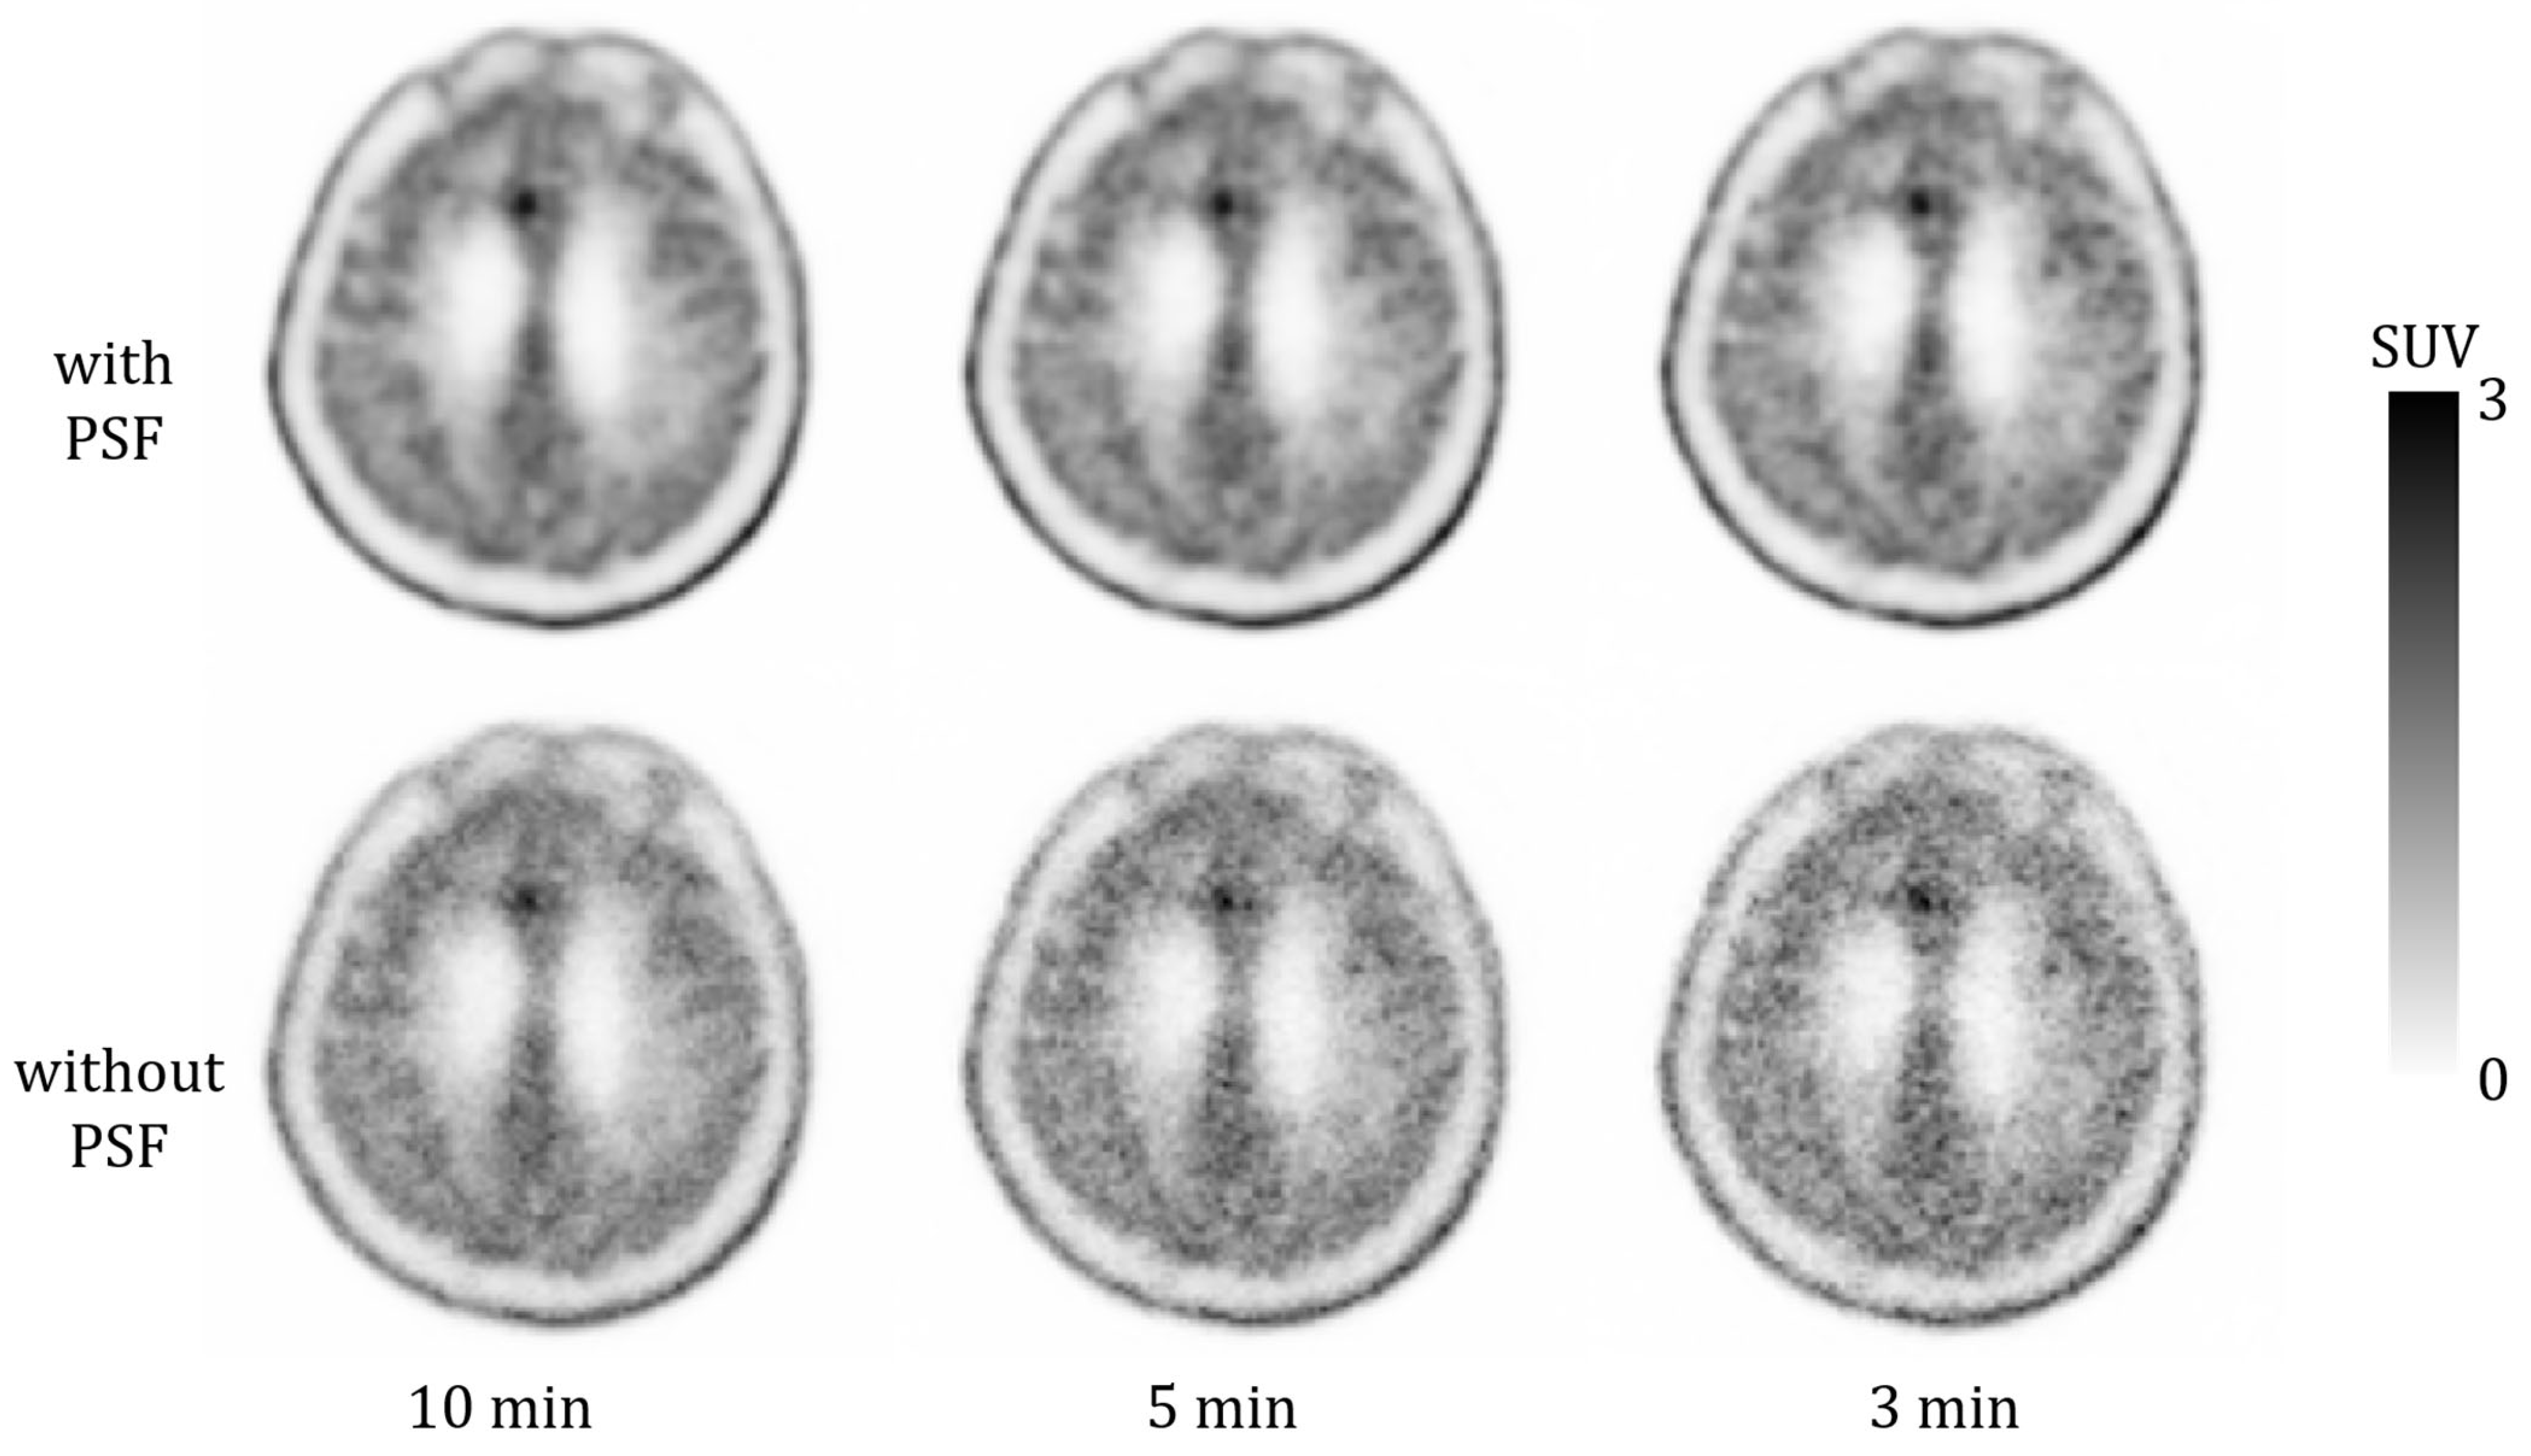
Figure 9 shows clinical images with a large difference in visual scores between reconstructions with and without PSF. The median scores in the 10, 5, and 3 min acquisitions were 5 (reference), 5 (range 5–5), and 4 (range 4–5) for reconstruction with PSF. The corresponding values for reconstruction without PSF were 2 (range 2–4), 2 (range 1–3), and 2 (range 1–2). Similar to the phantom study, an increase in the statistical noise was observed with shorter acquisition durations.
The visual assessment score was superior in reconstruction with PSF than in reconstruction without PSF (Table 1). The median scores with the PSF correction for the 5 and 3 min acquisitions were 5 (range 4–5) and 5 (range 3–5), respectively, with none of the radiologists assigning a score of ≤ 2. In the reconstruction without PSF, the median scores for the 10, 5, and 3 min acquisitions were 4 (range 2–5), 3 (range 1–5), and 2 (range 1–5), respectively. The scores for the 3 min acquisition without PSF ranged from 1 to 5, varying depending on the patient and lesion characteristics. The kappa value was 0.35, indicating fair agreement among readers according to the Landis and Koch criteria.
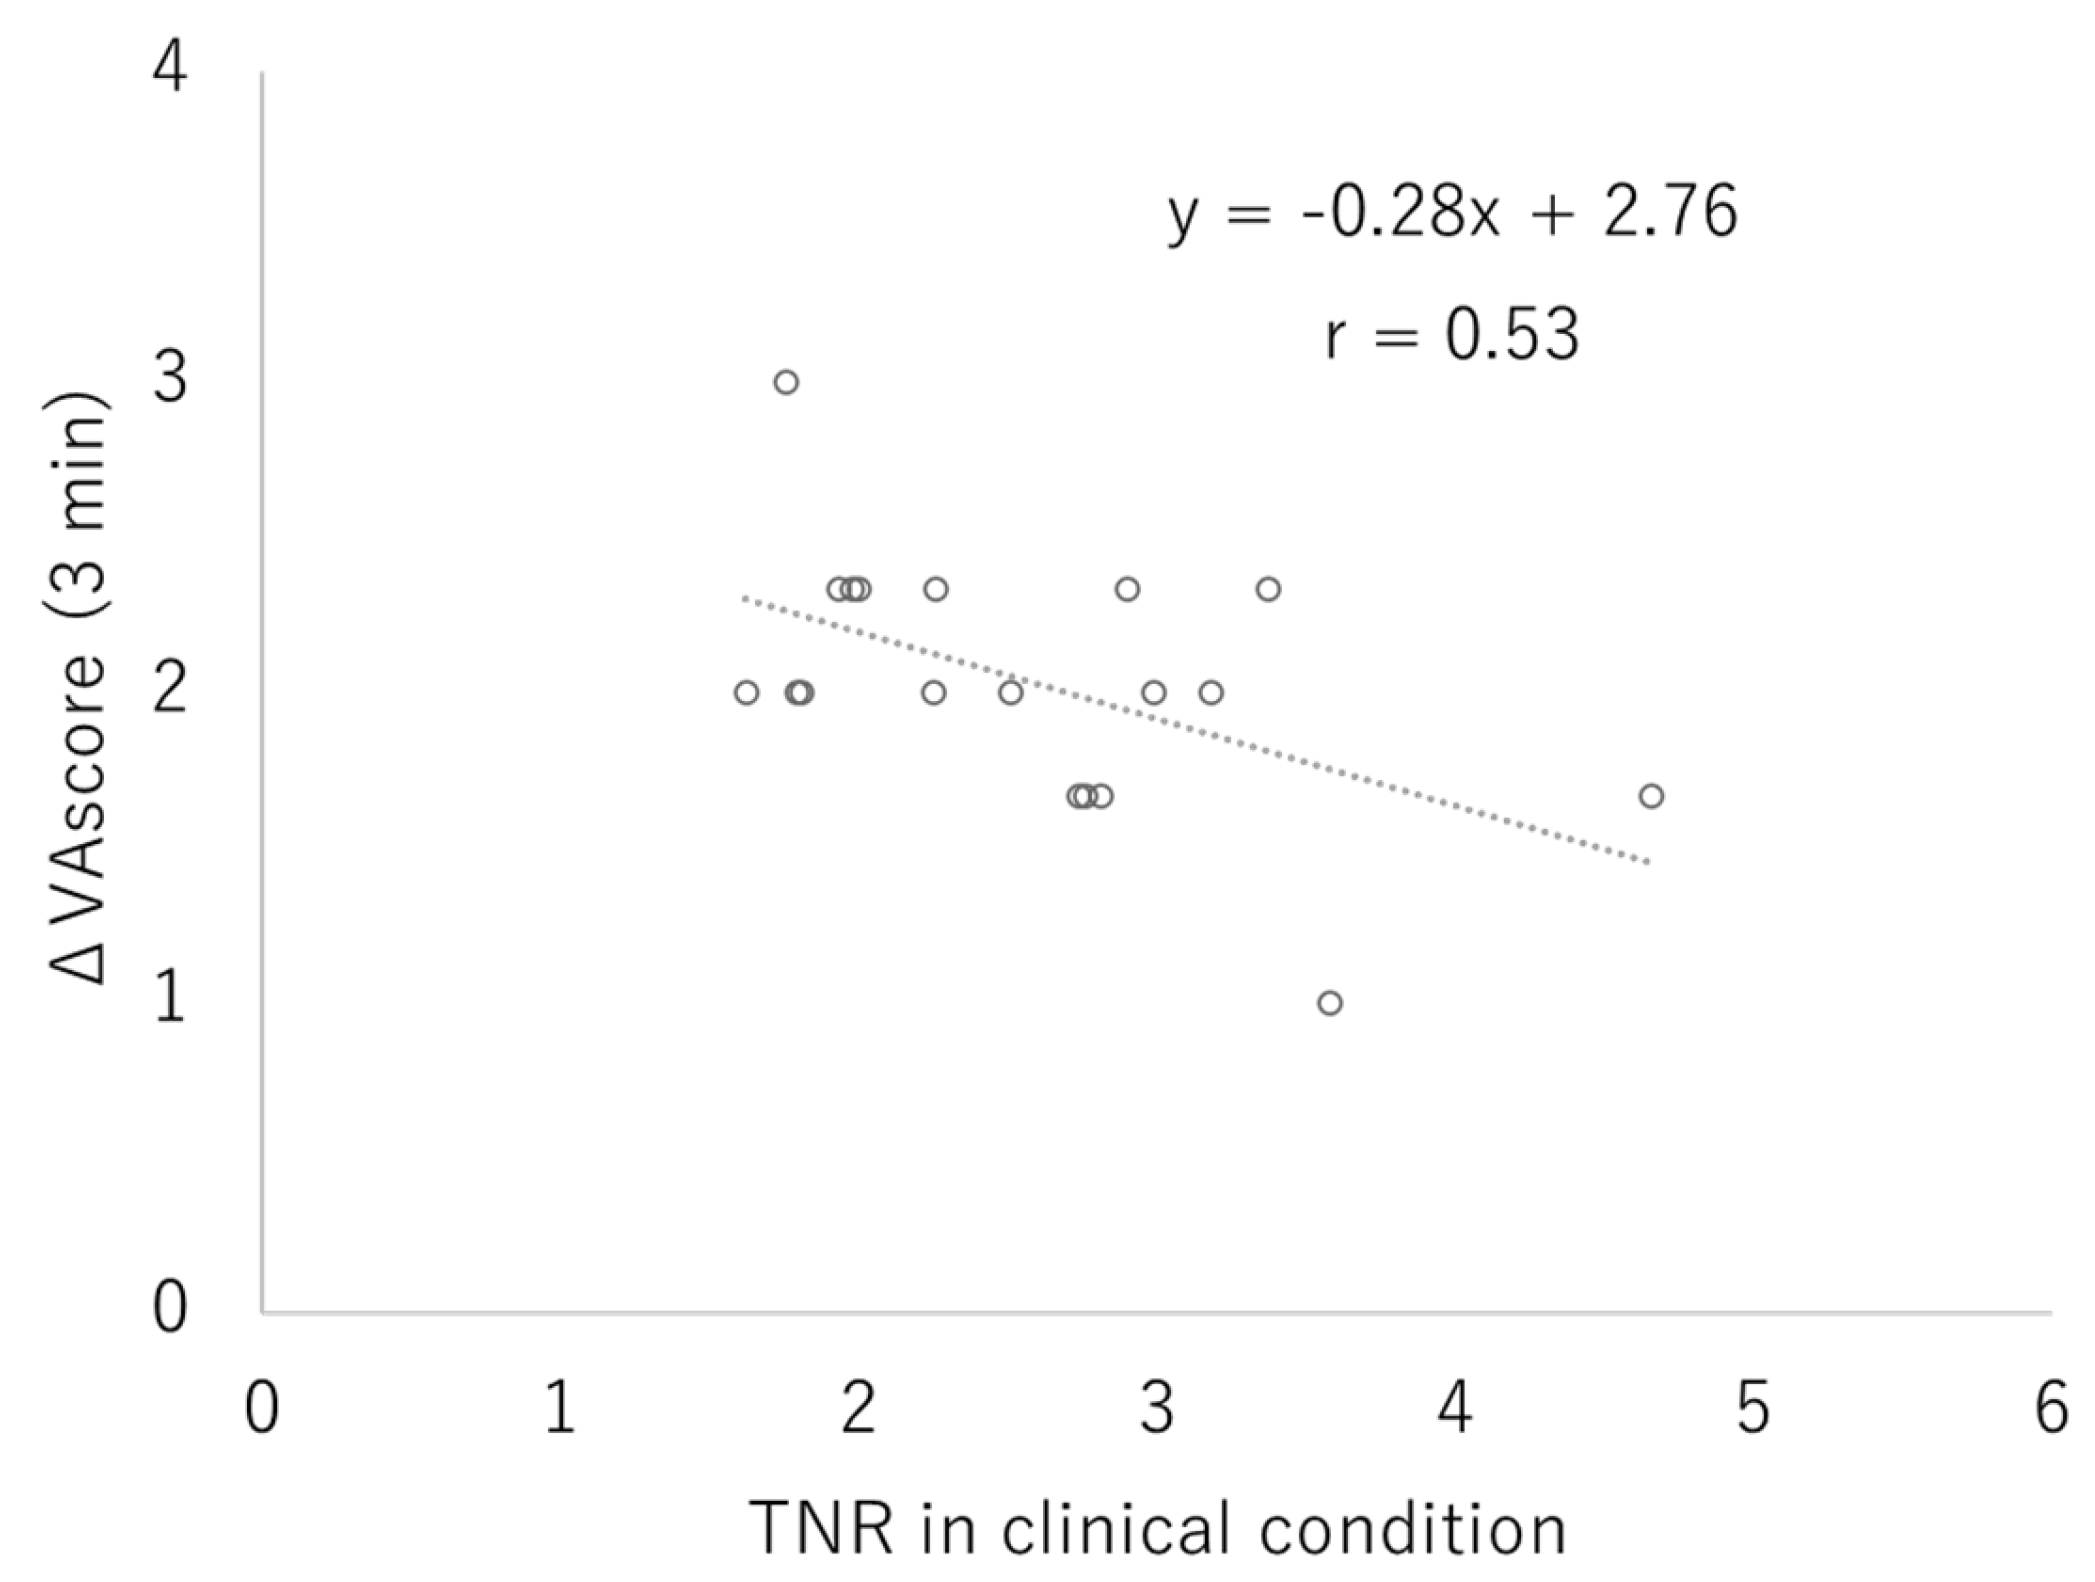
The ΔVAscores for patients with low TNR lesions tended to be larger. The ΔVAscore for 3 min acquisition and TNR showed moderate correlations, as shown in Figure 10, and the correlation coefficient was 0.53.

4. Discussion

In this study, we evaluated the influence of shortened acquisition duration and PSF correction on quantitative values in 11C-methionine brain tumor PET using the latest generation of SiPM PET/CT scanners. Previous studies have investigated the feasibility of shortened acquisition durations in 11C-methionine PET using conventional PMT-based PET/CT systems [24]; however, to the best of our knowledge, this is the first study to evaluate shortened acquisition duration using the SiPM PET/CT scanner and the effect of PSF correction.
In the phantom and clinical studies, SUVmax and rΔSUVmax increased with shorter acquisition durations; however, these increases were less pronounced in the reconstruction with PSF. SUVmax is highly sensitive to statistical noise, which becomes more prominent with shorter acquisition durations owing to the reduced number of detected events. Akamatsu et al. reported that PET images reconstructed with PSF correction exhibited lower coefficients of variation than those reconstructed without PSF correction [26], and the results of our study are consistent with their observation that reconstruction with PSF suppresses noise-induced variability in SUVmax. In our study, the rΔSUVmax with PSF in the 3 min acquisition was 5.2 ± 5.4%, which is sufficiently smaller than the uptake variability of 11C-methionine in normal brain tissues, which is up to 12.6% [46]. In addition, Bland–Altman plots demonstrated that the SUVmax derived from the shortened acquisitions were in close agreement with those from the 10 min acquisition, with no systematic bias across the measurement range. These findings further support the quantitative reliability of the shortened protocols.
This supports the reliability of SUV measurements in terms of shortened acquisition duration with the SiPM PET/CT device, Biograph Vision system, and PSF reconstruction.
Reportedly, Gibbs artifacts caused by PSF might influence quantitative accuracy [27,28,29]. However, obvious Gibbs artifacts were not observed in the present phantom or clinical studies, and reconstruction with PSF showed a smaller relative error for SUVmax. This indicates that the advantage of the noise-suppressing effect of the PSF outweighs the disadvantage of Gibbs artifacts.
SUVpeak and SUVmean exhibited smaller relative errors than SUVmax. Lodge et al. reported that the SUVpeak is a more robust parameter for assessing the most metabolically active regions of tumors [47]. Similarly, Akamatsu et al. demonstrated that the SUVpeak is a highly reproducible metric with reduced susceptibility to statistical noise [48,49]. Our results are consistent with these findings, indicating that SUVpeak is a more reliable quantitative parameter than SUVmax in clinical 11C-methionine PET studies, particularly with shortened acquisition durations.
In the reconstruction with PSF, the MTV also exhibited smaller relative errors than those without PSF. MTV exhibited larger relative errors than other quantitative indices; however, in the majority of lesions, MTV remained within ±1.0 cm3. Lesions with greater MTV tended to have larger volumes, irregular morphologies, or multiple discrete areas of increased uptake within a single lesion. These characteristics likely result in more extensive boundary regions adjacent to the normal tissue, thereby increasing the potential for cumulative errors in lesion delineation.
The visual assessments further support the advantages of PSF correction for shortened acquisition durations. The PET images with PSF reconstruction were highly scored (> 3), regardless of the acquisition duration, and consistently provided clinically acceptable image quality across a range of lesion uptake intensities. The inter-observer agreement does not represent high reliability, as quantified by Fleiss’ kappa (kappa value = 0.35); however, it suggests a consistent tendency in the readers’ judgments. These results indicate that PSF reconstruction helps evaluate the extent of tumor invasion and distinguishes tumor recurrence from radiation necrosis following radiotherapy, even with shortened acquisition durations. The relationship between ΔVAscore and TNR showed the trend that PSF correction improves the VAscore, particularly for patients with low-contrast lesions to normal brain tissue. For example, images without PSF correction, as shown in Figure 9, did not meet clinical standards and were assigned lower scores (1 or 2) for a shortened acquisition duration; however, the visual scores were significantly improved by the use of PSF correction. These results indicate that PSF correction may be useful for improving the visibility or detectability of low-contrast lesions in a shortened acquisition duration. However, further investigation involving more patients and lesions is needed.
Considering the above, the adverse influences of Gibbs artifacts introduced by PSF correction appear to be minimal with the current reconstruction settings and the SiPM PET/CT device used in the study, the Biograph Vision system. Our findings suggest that the suppression of statistical noise through PSF correction has a more significant impact on the quantitative accuracy than any disadvantage associated with Gibbs artifacts. Furthermore, the combination of PSF correction and SiPM PET/CT allows for clinically acceptable imaging, even with acquisition durations as short as 3 min. However, further studies are needed to validate whether these findings are applicable to various SiPM PET/CT or reconstruction conditions. The shortened acquisition time may reduce patient motion, yield motion-free images, and further improve image quality. The results of this study also showed the potential for reducing the radiation exposure dose for patients or medical staff via injection dose reduction with a conventional acquisition duration [50,51,52]. To fully realize these benefits, continuous education and training are essential [53,54,55], particularly regarding scanner-specific reconstruction settings, PSF correction behavior, and optimized acquisition protocols, which should be addressed in future studies.
This study has some limitations. First, the sample size was relatively small, which may have limited the statistical power and generalizability of the findings, making it difficult to classify and analyze the data according to tumor type, size, or anatomical distribution, as well as patient-related factors such as age, body weight, and administered dose.
Second, the retrospective nature of the study may have introduced a selection bias and unmeasured confounding factors. Third, not all cases were confirmed histopathologically, which may have affected the diagnostic certainty and accuracy of the findings. Despite these limitations, the present study provides preliminary but clinically relevant evidence supporting the feasibility of short acquisition duration for 11C-methionine PET using SiPM PET/CT systems. These findings suggest that scan duration may be reduced without substantially compromising image quality, potentially improving patient comfort and enabling more effective use of medical resources. Future studies with larger cohorts and histopathological confirmation are warranted to validate and generalize these results.

5. Conclusions

The combination of the Biograph Vision system and PSF correction has the potential to produce clinically acceptable 11C-methionine PET images, even with a 3 min acquisition duration, offering advantages over conventional PMT-based PET/CT systems.

Author Contributions

Conceptualization, T.I., K.S., M.I. and M.K. (Mamoru Kominami); methodology, T.I., K.S. and M.I.; validation, T.I.; formal analysis, T.I.; investigation, T.I., K.S., M.K. (Mamoru Kominami), Y.S., F.K., H.Y. and T.K.; resources, H.Y.; data curation, T.I.; writing—original draft preparation, T.I.; writing—review and editing, K.S., M.I., Y.S. and K.C.; visualization, T.I.; supervision, M.K. (Mamoru Kato), T.K. and K.C.; project administration, T.K. and K.C.; funding acquisition, K.C. All authors have read and agreed to the published version of the manuscript.

Funding

This research was funded by the NRA Human Resource Development, Human Resource Development Program for Advanced Radiation Protection with Practical Problem-Solving Skills in Japan.

Institutional Review Board Statement

The study was conducted in accordance with the Declaration of Helsinki, and approved by the Institutional Ethics Committee the Akita Cerebrospinal and Cardiovascular Center (approval number: 23-39). This study involved a secondary analysis of 11C-methionine PET data originally collected in an ongoing clinical study (approval number: 19-10).

Informed Consent Statement

The ethics committee determined that additional informed consent was not required as the analysis fell within the scope of the previously approved protocol.

Data Availability Statement

The data presented in this study are available on request from the corresponding author due to privacy and ethical restrictions.

Conflicts of Interest

The authors declare no conflicts of interest.

Abbreviations

The following abbreviations are used in this manuscript:
18F-FDG18F-fluoro-2-deoxy-D-glucose
PETPositron Emission Tomography
MRIMagnetic Resonance Imaging
SNRSignal-to-Noise Ratio
CTComputed Tomography
SiPMSilicon Photomultiplier
PMTPhotomultiplier Tube
JSNMJapanese Society of Nuclear Medicine
PSFPoint Spread Function
SUVStandardized Uptake Value
SUVmaxMaximum Standardized Uptake Value
SUVmeanMean Standardized Uptake Value
SUVpeakPeak Standardized Uptake Value
MTVMetabolic Tumor Volume
VOIVolume of Interest
ROIRegion of Interest
TNRTumor-to-Normal Ratio
OSEMOrdered Subset Expectation Maximization
TOFTime-of-Flight
AMIDEA Medical Image Data Examiner (software)

Appendix A

Figure A1. The SUVmean and MTV in the reconstruction with and without PSF (n = 31). The top row shows the SUVmean and MTV in the reconstruction with PSF, whereas the bottom row shows those without PSF. The horizontal axis represents the quantitative values in the clinical 10 min acquisitions, whereas the vertical axis represents the corresponding values in the 5 and 3 min acquisitions.
Applsci 15 12292 g0a1
Figure A2. The rΔSUVmean and rΔMTV in the reconstruction with and without PSF (n = 31). The top row shows the rΔSUVmean and rΔMTV in the reconstruction with PSF, while the bottom row shows those without PSF.
Applsci 15 12292 g0a2

References

  1. Singhal, T.; Narayanan, T.K.; Jain, V.; Mukherjee, J.; Mantil, J. 11C-L-methionine positron emission tomography in the clinical management of cerebral gliomas. Mol. Imaging Biol. 2008, 10, 1–18. [Google Scholar] [CrossRef]
  2. Zhao, C.; Zhang, Y.; Wang, J. A meta-analysis on the diagnostic performance of 18F-FDG and 11C-methionine PET for differentiating brain tumors. AJNR Am. J. Neuroradiol. 2014, 35, 1058–1065. [Google Scholar] [CrossRef]
  3. Chung, J.K.; Kim, Y.K.; Kim, S.K.; Lee, Y.J.; Paek, S.; Yeo, J.S.; Jeong, J.M.; Lee, D.S.; Jung, H.W.; Lee, M.C. Usefulness of 11C-methionine PET in the evaluation of brain lesions that are hypo- or isometabolic on 18F-FDG PET. Eur. J. Nucl. Med. Mol. Imaging 2002, 29, 176–182. [Google Scholar] [CrossRef] [PubMed]
  4. Pirotte, B.; Goldman, S.; Massager, N.; David, P.; Wikler, D.; Vandesteene, A.; Salmon, I.; Brotchi, J.; Levivier, M. Comparison of 18F-FDG and 11C-methionine for PET-guided stereotactic brain biopsy of gliomas. J. Nucl. Med. 2004, 45, 1293–1298. [Google Scholar] [PubMed]
  5. Stefano, A.; Leal, A.; Richiusa, S.; Trang, P.; Comelli, A.; Benfante, V.; Cosentino, S.; Sabini, M.G.; Tuttolomondo, A.; Altieri, R.; et al. Robustness of PET radiomics features: Impact of co-registration with MRI. Appl. Sci. 2021, 11, 10170. [Google Scholar] [CrossRef]
  6. Albert, N.L.; Weller, M.; Suchorska, B.; Galldiks, N.; Soffietti, R.; Kim, M.M.; la Fougère, C.; Pope, W.; Law, I.; Arbizu, J.; et al. Response Assessment in Neuro-Oncology working group and European Association for Neuro-Oncology recommendations for the clinical use of PET imaging in gliomas. Neuro Oncol. 2016, 18, 1199–1208. [Google Scholar] [CrossRef]
  7. Ceyssens, S.; Van Laere, K.; de Groot, T.; Goffin, J.; Bormans, G.; Mortelmans, L. [11C]methionine PET, histopathology, and survival in primary brain tumors and recurrence. AJNR Am. J. Neuroradiol. 2006, 27, 1432–1437. [Google Scholar]
  8. Tsuyuguchi, N.; Sunada, I.; Iwai, Y.; Yamanaka, K.; Tanaka, K.; Takami, T.; Otsuka, Y.; Sakamoto, S.; Ohata, K.; Goto, T.; et al. Methionine positron emission tomography of recurrent metastatic brain tumor and radiation necrosis after stereotactic radiosurgery: Is a differential diagnosis possible? J. Neurosurg. 2003, 98, 1056–1064. [Google Scholar] [CrossRef]
  9. Govaerts, C.W.; van Dijken, B.R.; Stormezand, G.N.; van der Weide, H.L.; Wagemakers, M.; Enting, R.H.; van der Hoorn, A. 11C-methyl-L-methionine PET measuring parameters for the diagnosis of tumour progression against radiation-induced changes in brain metastases. Br. J. Radiol. 2021, 94, 20210275. [Google Scholar] [CrossRef]
  10. Momose, T.; Nariai, T.; Kawabe, T.; Inaji, M.; Tanaka, Y.; Watanabe, S.; Maehara, T.; Oda, K.; Ishii, K.; Ishiwata, K.; et al. Clinical benefit of 11C methionine PET imaging as a planning modality for radiosurgery of previously irradiated recurrent brain metastases. Clin. Nucl. Med. 2014, 39, 939–943. [Google Scholar] [CrossRef]
  11. Miwa, K.; Shinoda, J.; Yano, H.; Okumura, A.; Iwama, T.; Nakashima, T.; Sakai, N. Discrepancy between lesion distributions on methionine PET and MR images in patients with glioblastoma multiforme: Insight from a PET and MR fusion image study. J. Neurol. Neurosurg. Psychiatry 2004, 75, 1457–1462. [Google Scholar] [CrossRef]
  12. Roessler, K.; Gatterbauer, B.; Becherer, A.; Paul, M.; Kletter, K.; Prayer, D.; Hoeftberger, R.; Hainfellner, J.; Asenbaum, S.; Knosp, E. Surgical target selection in cerebral glioma surgery: Linking methionine (MET) PET image fusion and neuronavigation. Minim. Invasive Neurosurg. 2007, 50, 273–280. [Google Scholar] [CrossRef] [PubMed]
  13. Pinto, S.; Caribé, P.; Sebastião Matushita, C.; Bromfman Pianta, D.; Narciso, L.; da Silva, A.M.M. Aiming for [18F]FDG-PET acquisition time reduction in clinical practice for neurological patients. Phys. Med. 2023, 112, 102604. [Google Scholar] [CrossRef] [PubMed]
  14. Usmani, S.; Ahmed, N.; Gnanasegaran, G.; Musbah, A.; Al Kandari, F.; Van den Wyngaert, T. 18F-NaF PET/CT of obese patients on a lutetium-yttrium oxyorthosilicate PET/CT system: Patient dosimetry, optimization of injected activity, and acquisition time. J. Nucl. Med. Technol. 2021, 49, 150–155. [Google Scholar] [CrossRef] [PubMed]
  15. Kaimoto, Y.; Fukushima, K.; Kanaya, K.; Asanuma, M.; Aoba, K.; Yamamoto, A.; Nakao, R.; Kaneko, K.; Nagao, M.; Chida, K. Optimization of intraventricular radioactive concentration for 13N ammonia PET with time-of-flight scanner: Simplified phantom study with noise equivalent count rate analysis. Ann. Nucl. Cardiol. 2023, 9, 33–39. [Google Scholar] [CrossRef]
  16. Japanese Society of Nuculear Medicine. Standard PET Imaging Protocols and Phantom Test Procedures and Criteria: Executive Summary; Japanese Society of Nuclear Medicine: Tokyo, Japan, 2017; Available online: https://jsnm.org/wp_jsnm/wp-content/themes/theme_jsnm/doc/StandardPETProtocolPhantom20170201.pdf (accessed on 23 October 2025).
  17. van Sluis, J.; de Jong, J.; Schaar, J.; Noordzij, W.; van Snick, P.; Dierckx, R.; Borra, R.; Willemsen, A.; Boellaard, R. Performance characteristics of the digital Biograph Vision PET/CT system. J. Nucl. Med. 2019, 60, 1031–1036. [Google Scholar] [CrossRef]
  18. van Sluis, J.; Boellaard, R.; Somasundaram, A.; van Snick, P.H.; Borra, R.J.H.; Dierckx, R.A.J.O.; Stormezand, G.N.; Glaudemans, A.W.J.M.; Noordzij, W. Image quality and semiquantitative measurements on the Biograph Vision PET/CT system: Initial experiences and comparison with the Biograph mCT. J. Nucl. Med. 2020, 61, 129–135. [Google Scholar] [CrossRef]
  19. Carlier, T.; Ferrer, L.; Conti, M.; Bodet-Milin, C.; Rousseau, C.; Bercier, Y.; Bendriem, B.; Kraeber-Bodéré, F. From a PMT-based to a SiPM-based PET system: A study to define matched acquisition/reconstruction parameters and NEMA performance of the Biograph Vision 450. EJNMMI Phys. 2020, 7, 55. [Google Scholar] [CrossRef]
  20. van Sluis, J.; Boellaard, R.; Dierckx, R.A.J.O.; Stormezand, G.N.; Glaudemans, A.W.J.M.; Noordzij, W. Image quality and qctivity optimization in oncologic 18F-FDG PET using the digital Biograph Vision PET/CT System. J. Nucl. Med. 2020, 61, 764–771. [Google Scholar] [CrossRef]
  21. Alberts, I.; Sachpekidis, C.; Prenosil, G.; Viscione, M.; Bohn, K.P.; Mingels, C.; Shi, K.; Ashar-Oromieh, A.; Rominger, A. Digital PET/CT allows for shorter acquisition protocols or reduced radiopharmaceutical dose in [18F]-FDG PET/CT. Ann. Nucl. Med. 2021, 35, 485–492. [Google Scholar] [CrossRef]
  22. Weber, M.; Jentzen, W.; Hofferber, R.; Herrmann, K.; Fendler, W.P.; Rischpler, C.; Umutlu, L.; Conti, M.; Costa, P.F.; Sraieb, M.; et al. Evaluation of 18F-FDG PET/CT images acquired with a reduced scan time duration in lymphoma patients using the digital biograph vision. BMC Cancer 2021, 21, 62. [Google Scholar] [CrossRef]
  23. Inomata, T.; Sato, K.; Ibaraki, M.; Kominami, M.; Kinoshita, F.; Shinohara, Y.; Kato, M.; Kinoshita, T. Evaluation of low-dose whole-body FDG PET with SiPM-based PET/CT Scanner: Visual and semi-quantitative analyses using random sampling from full-dose scan data (in Japanese). Nihon Hoshasen Gijutsu Gakkai Zasshi 2023, 79, 1127–1135. [Google Scholar] [CrossRef] [PubMed]
  24. Morimoto, M.; Kudomi, N.; Maeda, Y.; Kobata, T.; Oishi, A.; Matsumoto, K.; Monden, T.; Iwasaki, T.; Mitamura, K.; Norikane, T.; et al. Effect of quantitative values on shortened acquisition duration in brain tumor 11C-methionine PET/CT. EJNMMI Phys. 2021, 8, 34. [Google Scholar] [CrossRef] [PubMed]
  25. Shekari, M.; Ghafarian, P.; Ahangari, S.; Ay, M.R. Quantification of the impact of TOF and PSF on PET images using the noise-matching concept: Clinical and phantom study. Nucl. Sci. Tech. 2017, 28, 167. [Google Scholar] [CrossRef]
  26. Akamatsu, G.; Ishikawa, K.; Mitsumoto, K.; Taniguchi, T.; Ohya, N.; Baba, S.; Abe, K.; Sasaki, M. Improvement in PET/CT image quality with a combination of point-spread function and time-of-flight in relation to reconstruction parameters. J. Nucl. Med. 2012, 53, 1716–1722. [Google Scholar] [CrossRef]
  27. Zeng, G.L. Gibbs artifact reduction by nonnegativity constraint. J. Nucl. Med. Technol. 2011, 39, 213–219. [Google Scholar] [CrossRef]
  28. Snyder, D.L.; Miller, M.I.; Thomas, L.J.; Politte, D.G. Noise and edge artifacts in maximum-likelihood reconstructions for emission tomography. IEEE Trans. Med. Imaging 1987, 6, 228–238. [Google Scholar] [CrossRef]
  29. Lasnon, C.; Desmonts, C.; Quak, E.; Gervais, R.; Do, P.; Dubos-Arvis, C.; Aide, N. Harmonizing SUVs in multicentre trials when using different generation PET systems: Prospective validation in non-small cell lung cancer patients. Eur. J. Nucl. Med. Mol. Imaging 2013, 40, 985–996. [Google Scholar] [CrossRef]
  30. Tsutsui, Y.; Awamoto, S.; Himuro, K.; Umezu, Y.; Baba, S.; Sasaki, M. Edge artifacts in point spread function-based PET reconstruction in relation to object size and reconstruction parameters. Asia Ocean. J. Nucl. Med. Biol. 2017, 5, 134–143. [Google Scholar] [CrossRef]
  31. Chiang, G.C.; Galla, N.; Ferraro, R.; Kovanlikaya, I. The added prognostic value of metabolic tumor size on FDG-PET at first suspected recurrence of glioblastoma multiforme. J. Neuroimaging 2017, 27, 243–247. [Google Scholar] [CrossRef]
  32. Wood, J.R.; Green, S.B.; Shapiro, W.R. The prognostic importance of tumor size in malignant gliomas: A computed tomographic scan study by the Brain Tumor Cooperative Group. J. Clin. Oncol. 1988, 6, 338–343. [Google Scholar] [CrossRef]
  33. Liu, H.; Shen, L.; Huang, X.; Zhang, G. Maximal tumor diameter in the preoperative tumor magnetic resonance imaging (MRI) T2 image is associated with prognosis of Grade II Glioma. Medicine 2021, 100, e24850. [Google Scholar] [CrossRef]
  34. Takano, K.; Kinoshita, M.; Arita, H.; Okita, Y.; Chiba, Y.; Kagawa, N.; Fujimoto, Y.; Kishima, H.; Kanemura, Y.; Nonaka, M.; et al. Diagnostic and prognostic value of 11C-Methionine PET for nonenhancing gliomas. AJNR Am. J. Neuroradiol. 2016, 37, 44–50. [Google Scholar] [CrossRef] [PubMed]
  35. Ninatti, G.; Sollini, M.; Bono, B.; Gozzi, N.; Fedorov, D.; Antunovic, L.; Gelardi, F.; Navarria, P.; Politi, L.S.; Pessina, F.; et al. Preoperative [11C]methionine PET to personalize treatment decisions in patients with lower-grade gliomas. Neuro Oncol. 2022, 24, 1546–1556. [Google Scholar] [CrossRef] [PubMed]
  36. Nakajo, K.; Uda, T.; Kawashima, T.; Terakawa, Y.; Ishibashi, K.; Tsuyuguchi, N.; Tanoue, Y.; Nagahama, A.; Uda, H.; Koh, S.; et al. Maximum 11C-methionine PET uptake as a prognostic imaging biomarker for newly diagnosed and untreated astrocytic glioma. Sci. Rep. 2022, 12, 546. [Google Scholar] [CrossRef] [PubMed]
  37. Ibaraki, M.; Matsubara, K.; Shinohara, Y.; Shidahara, M.; Sato, K.; Yamamoto, H.; Kinoshita, T. Brain partial volume correction with point spreading function reconstruction in high-resolution digital PET: Comparison with an MR-based method in FDG imaging. Ann. Nucl. Med. 2022, 36, 717–727. [Google Scholar] [CrossRef]
  38. Ibaraki, M.; Shinohara, Y.; Watanabe, A.; Sato, K.; Ohmura, T.; Yamamoto, H.; Kinoshita, T. Arrival time mapping with 15O-gas PET for cerebrovascular steno-occlusive diseases: A comparative study with CT perfusion. EJNMMI Res. 2025, 15, 20. [Google Scholar] [CrossRef]
  39. Shinohara, Y.; Ibaraki, M.; Matsubara, K.; Sato, K.; Yamamoto, H.; Kinoshita, T. Visualization of small brain nuclei with a high-spatial resolution, clinically available whole-body PET scanner. Ann. Nucl. Med. 2024, 38, 154–161. [Google Scholar] [CrossRef]
  40. Loening, A.M.; Gambhir, S.S. AMIDE: A free software tool for multimodality medical image analysis. Mol. Imaging 2003, 2, 131–137. [Google Scholar] [CrossRef]
  41. Kracht, L.W.; Miletic, H.; Busch, S.; Jacobs, A.H.; Voges, J.; Hoevels, M.; Klein, J.C.; Herholz, K.; Heiss, W.D. Delineation of brain tumor extent with [11C]L-methionine positron emission tomography: Local comparison with stereotactic histopathology. Clin. Cancer Res. 2004, 10, 7163–7170. [Google Scholar] [CrossRef]
  42. Yoo, M.Y.; Paeng, J.C.; Cheon, G.J.; Lee, D.S.; Chung, J.K.; Kim, E.E.; Kang, K.W. Prognostic value of metabolic tumor volume on 11C-Methionine PET in predicting progression-free survival in high-grade glioma. Nucl. Med. Mol. Imaging 2015, 49, 291–297. [Google Scholar] [CrossRef]
  43. Sonni, I.; Baratto, L.; Park, S.; Hatami, N.; Srinivas, S.; Davidzon, G.; Gambhir, S.S.; Iagaru, A. Initial experience with a SiPM-based PET/CT scanner: Influence of acquisition time on image quality. EJNMMI Phys. 2018, 5, 9. [Google Scholar] [CrossRef]
  44. Landis, J.R.; Koch, G.G. The measurement of observer agreement for categorical data. Biometrics 1977, 33, 159–174. [Google Scholar] [CrossRef]
  45. JASP Team. JASP (Version 0.95.4) [Computer Software]; JASP Team: Amsterdam, The Netherlands, 2024. Available online: https://jasp-stats.org/ (accessed on 23 October 2025).
  46. Uda, T.; Tsuyuguchi, N.; Terakawa, Y.; Takami, T.; Ohata, K. Evaluation of the accumulation of 11C-methionine with standardized uptake value in the normal brain. J. Nucl. Med. 2010, 51, 219–222. [Google Scholar] [CrossRef]
  47. Lodge, M.A.; Chaudhry, M.A.; Wahl, R.L. Noise considerations for PET quantification using maximum and peak standardized uptake value. J. Nucl. Med. 2012, 53, 1041–1047. [Google Scholar] [CrossRef]
  48. Akamatsu, G.; Ikari, Y.; Nishida, H.; Nishio, T.; Ohnishi, A.; Maebatake, A.; Sasaki, M.; Senda, M. Influence of statistical fluctuation on reproducibility and accuracy of SUVmax and SUVpeak: A phantom study. J. Nucl. Med. Technol. 2015, 43, 222–226. [Google Scholar] [CrossRef] [PubMed]
  49. Sher, A.; Lacoeuille, F.; Fosse, P.; Vervueren, L.; Cahouet-Vannier, A.; Dabli, D.; Bouchet, F.; Couturier, O. For avid glucose tumors, the SUV peak is the most reliable parameter for [18F]FDG-PET/CT quantification, regardless of acquisition time. EJNMMI Res. 2016, 6, 21. [Google Scholar] [CrossRef] [PubMed]
  50. Fujisawa, M.; Haga, Y.; Sota, M.; Abe, M.; Kaga, Y.; Inaba, Y.; Suzuki, M.; Meguro, T.; Hosoi, Y.; Chida, K. Evaluation of lens doses among medical staff involved in nuclear medicine: Current eye radiation exposure among nuclear-medicine staff. Appl. Sci. 2023, 13, 9182. [Google Scholar] [CrossRef]
  51. Fujisawa, M.; Sota, M.; Haga, Y.; Tanaka, S.; Kataoka, N.; Kato, T.; Kaga, Y.; Abe, M.; Suzuki, M.; Inaba, Y.; et al. Real-time monitoring of occupational radiation exposure in nuclear medicine technologists: An initial study. Appl. Sci. 2025, 15, 11008. [Google Scholar] [CrossRef]
  52. ICRP. Radiation dose to patients from radiopharmaceuticals: A compendium of current information related to frequently used substances. ICRP Publ. 2015, 44, 7–321. [Google Scholar] [CrossRef]
  53. Chida, K. What are useful methods to reduce occupational radiation exposure among radiological medical workers, especially for interventional radiology personnel? Radiol. Phys. Technol. 2022, 15, 101–115. [Google Scholar] [CrossRef]
  54. Sagehashi, K.; Haga, Y.; Takahira, S.; Tanabe, M.; Nakamura, M.; Sota, M.; Kaga, Y.; Abe, M.; Tada, N.; Chida, K. Evaluation of radiation dose to the lens in interventional cardiology physicians before and after dose limit regulation changes. J. Radiol. Prot. 2024, 44, 031512. [Google Scholar] [CrossRef]
  55. Chida, K.; Morishima, Y.; Inaba, Y.; Taura, M.; Ebata, A.; Takeda, K.; Shimura, H.; Zuguchi, M. Physician-received scatter radiation with angiography systems used for interventional radiology: Comparison among many X-ray systems. Radiat. Prot. Dosim. 2012, 149, 410–416. [Google Scholar] [CrossRef]
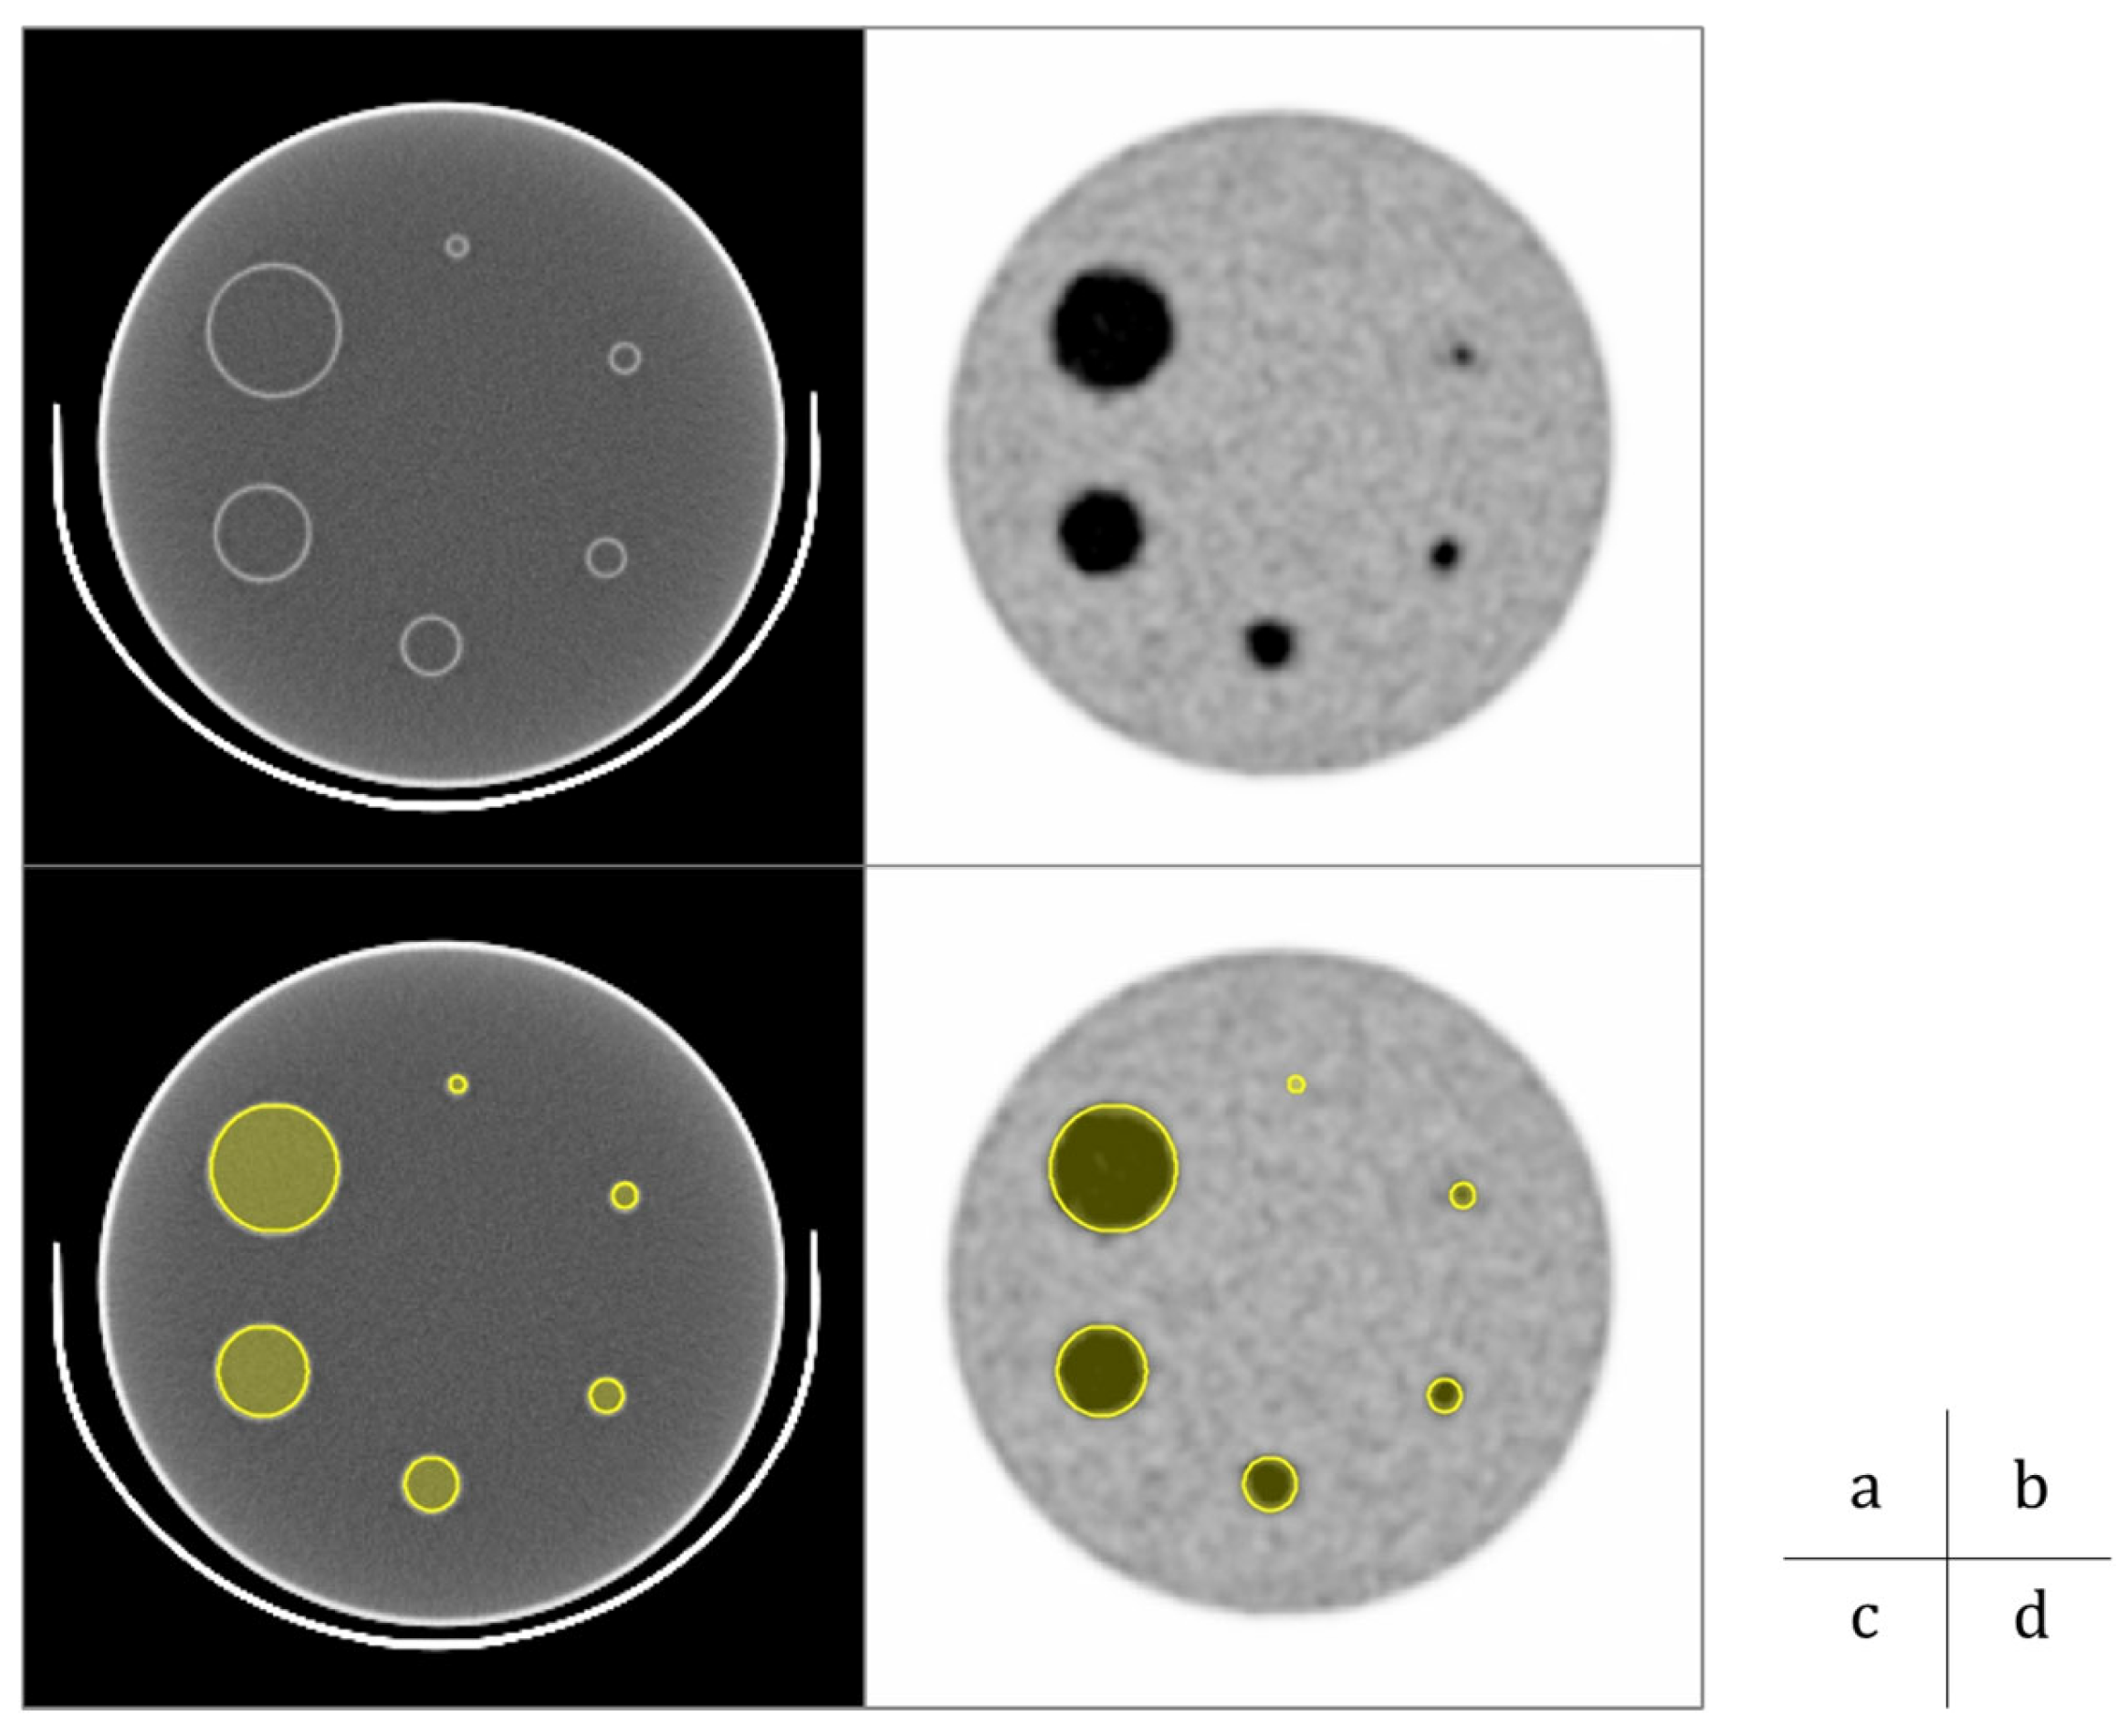
Figure 1. The setting of ROI for phantom images. CT (a) and PET (b) images of the brain tumor phantom. ROIs of the same size in each sphere (yellow circles) are placed on the CT image (c) and copied onto the PET images (d).
Applsci 15 12292 g001
Figure 2. The setting of VOI for clinical images. A volume of interest (VOI) was placed to encompass the entire lesion (orange circle pointed by dashed arrow), and a spherical VOI (φ7 mm) was placed in the contralateral hemisphere (pointed by dotted arrow). Voxels with an SUV of at least 1.3 times the SUVmean in the contralateral hemisphere were classified as tumor regions and the analysis target VOI (indicated by a solid arrow).
Applsci 15 12292 g002
Figure 3. PET images of a brain tumor phantom in each reconstruction condition and acquisition duration. The top row shows the PET images reconstructed with PSF, whereas the bottom row shows images without PSF. The acquisition durations corresponded to 10, 5, 3, and 1 min for 11C, from left to right.
Applsci 15 12292 g003
Figure 4. The SUVmax of six spheres in the brain tumor phantom in shortened acquisition durations. (a) The reconstruction with PSF. (b) The reconstruction without PSF.
Applsci 15 12292 g004
Figure 5. The SUVmax and SUVpeak in the reconstruction with and without PSF (n = 31). The top row shows SUVmax and SUVpeak in the reconstruction with PSF, whereas the bottom row shows those without PSF. The horizontal axis represents the quantitative values in the clinical 10 min acquisitions, whereas the vertical axis represents the corresponding values in the 5 and 3 min acquisitions.
Applsci 15 12292 g005
Figure 6. The rΔSUVmax and rΔSUVpeak in the reconstruction with and without PSF (n = 31). The top row shows the rΔSUVmax and rΔSUVpeak in the reconstruction with PSF, while the bottom row shows those without PSF.
Applsci 15 12292 g006
Figure 7. Bland–Altman plots comparing SUVmax between the 10 min acquisition and the shortened acquisition durations. The top row shows the results with PSF, while the bottom row shows those without PSF. Each plot shows the difference in SUVmax between the shortened and 10 min acquisitions plotted against their mean values. The central dashed line represents the mean bias, and the outer dashed lines indicate the 95% limits of agreement (mean ± 1.96 SD).
Applsci 15 12292 g007
Figure 8. Bland–Altman plots comparing SUVpeak between the 10 min acquisition and the shortened acquisition durations. The top row shows the results with PSF, while the bottom row shows those without PSF. Each plot shows the difference in SUVpeak between the shortened and 10 min acquisitions plotted against their mean values. The central dashed line represents the mean bias, and the outer dashed lines indicate the 95% limits of agreement (mean ± 1.96 SD).
Applsci 15 12292 g008
Figure 9. The clinical images with large difference in visual score between reconstructions with and without PSF. The acquisition durations were 10, 5, and 3 min from left to right. Upper row: Reconstruction with PSF. Bottom row: Reconstruction without PSF.
Applsci 15 12292 g009
Figure 10. The relationship between ΔVAscore and TNR (smallest TNR if multiple lesions present) in clinical conditions (n = 20).
Applsci 15 12292 g010
Table 1. The visual assessment scores for each reconstruction condition and acquisition duration.
Reconstruction ConditionAcquisition Duration (min)
1053
with PSF555
(range)(reference)(4–5)(3–5)
without PSF432
(range)(2–5)(1–5)(1–5)
Disclaimer/Publisher’s Note: The statements, opinions and data contained in all publications are solely those of the individual author(s) and contributor(s) and not of MDPI and/or the editor(s). MDPI and/or the editor(s) disclaim responsibility for any injury to people or property resulting from any ideas, methods, instructions or products referred to in the content.