Article

Detection of Brain Tumors Using UWB Antennas in a High-Fidelity Phantom Model

1
Electronics Department, Autonomous University of Tamaulipas, Unidad Académica Multidisciplinaria Reynosa Rodhe (UAMRR), Carretera San Fernando Cruce Con Canal Rodhe, Reynosa 88779, Mexico
2
Department of Electronic and Telecommunications, CICESE Research Center, Ensenada 22860, Mexico
*
Author to whom correspondence should be addressed.
Appl. Sci. 2025, 15(22), 12275; https://doi.org/10.3390/app152212275
Submission received: 19 September 2025 / Revised: 14 November 2025 / Accepted: 14 November 2025 / Published: 19 November 2025

Abstract

This research presents an ultra-wideband antenna array for the non-invasive early detection of brain tumors. The primary objective of this work is to evaluate the detection capabilities of a proposed Vivaldi antenna array system for identifying small and multiple brain tumors under various simulated biological conditions. The core of the system is a Vivaldi-type antenna operating from 2.4 to 17.7 GHz, configured in both two- and four-antenna arrays. A high-fidelity, seven-layer phantom model was developed to replicate brain tissue, with each layer assigned specific electromagnetic properties (relative permittivity, tangential loss) and physical thickness. The study rigorously analyzes the system’s performance in detecting tumors across diverse scenarios, including variations in phantom complexity, tumor size, permittivity, and the number of present tumors. Using the Delay and Sum algorithm for image reconstruction, the results demonstrate the system’s feasibility in detecting tumors as small as 0.625 mm in diameter. This underscores the significant potential of the proposed design as a powerful tool for non-invasive medical diagnostics.

1. Introduction

Ultra-wideband (UWB) antenna arrays have emerged as key players in radar and imaging applications, particularly in object detection, due to their exceptional image resolution. This capability has led to their increasing use in medical diagnostics, enabling the detection of various diseases within the human body, including those affecting the breast, brain, and fingers. These advancements contribute to improving the quality of healthcare by enhancing diagnostic accuracy, reducing the workload of medical professionals, and offering more efficient monitoring methods.
Brain cancer, a disease affecting a significant portion of the global population, is often diagnosed at advanced stages. Currently, the most widely used method for the detection of brain tumors is magnetic resonance imaging (MRI), an imaging technique that employs a magnetic field and radio waves to create detailed images of the brain and surrounding tissues. However, to highlight potential abnormalities, a contrast agent—commonly referred to as “contrast”—is injected to enhance image quality, allowing for better distinction between a brain tumor and healthy tissue [1]. This contrast substance, composed of gadolinium, is primarily used to detect smaller tumors; nevertheless, it does not guarantee the detection of tumors at early stages. Additionally, the cost of MRI examinations is high, and the large size of the equipment requires a designated installation space. It is important to note that patients may experience symptoms of claustrophobia or anxiety when placed inside the scanner due to the narrow and enclosed structure of the magnetic resonance tunnel. Furthermore, off-resonance artifacts such as signal loss, geometric distortions, and blurring can affect the clinical and scientific accuracy of MRI images [2]. On the other hand, computed tomography (CT) is another method used for brain tumor detection. This procedure employs X-rays to generate images of the brain and skull. Similar to MRI, CT scans often require the injection of a contrast agent to improve image visualization; however, this contrast can cause side effects such as a sensation of excessive body heat, a metallic or bitter taste in the mouth, and an increased urge to urinate [3]. The routine use of intravenous contrast may not always be necessary and carries risks such as adverse reactions or renal complications [4]. When there are indications of a brain mass, healthcare providers frequently recommend an MRI scan to obtain a more accurate diagnosis. Another relevant method for brain tumor detection is positron emission tomography (PET) with methionine, which utilizes a radioactive methionine tracer to obtain metabolic images of the brain. However, radiation exposure is a critical aspect to consider, as it increases during the procedure. Allergic reactions to the injected radiopharmaceutical may also occur. This imaging technique has limited anatomical resolution, which can lead to false-positive or false-negative results, thereby affecting clinical interpretation [5]. Despite its diagnostic value, PET remains a costly imaging modality compared to other procedures [6]. In response to these limitations, new non-invasive technologies based on radiofrequency are emerging as promising alternatives for monitoring and early detection of brain tumors, utilizing antennas to improve diagnosis and disease management. For example, the study presented in [7] utilizes an antenna array operating within the 3.0 to 12.0 GHz frequency range for breast tumor detection, employing the DAS (Delay and Sum) algorithm. This approach successfully identifies a tumor with a 3 mm radius using a 100 mm diameter phantom made of a single material. Similarly, in [8], a phantom with two layers of varying dimensions and permittivity (εr) is used, with the antenna operating between 6.5 and 35.0 GHz, successfully detecting a 2 mm radius tumor using the Time-reversal Algorithm.
Further studies, such as those in [9,10,11], incorporate phantoms with three layers, with diameters ranging from 120 mm to 160 mm, and utilize operating frequencies from 1.0 to 19.0 GHz. These studies demonstrate the ability to detect tumors with a radius of 20 mm, 6.5 mm, and 5 mm using image reconstruction methods such as the Multiple Signal Classification Technique (MT), Specific Absorption Rate (SAR) method, Path Loss Distribution (PLD) method, and DAS algorithm, respectively. Notably, the study in [9] focuses on brain tumor detection, while [10,11] explore breast tumor detection. In [12,13], three-layer phantoms with a 120 mm diameter are used to detect breast tumors with a radius of 2.5 mm and 5 mm using DAS and SAR methods, with antennas operating in frequency ranges from 3.0 to 15.0 GHz.
Additional research in [14,15] investigates the performance of UWB antennas on four-layer phantoms, corresponding to abdominal and breast tissue. In [16], a coplanar antenna is used to detect a 5 mm-radius brain tumor using the Elliptical Synthetic Aperture Radar (E-SAR) method, with a human head phantom measuring 98 mm in diameter. This phantom consists of six layers with distinct permittivity, and the antenna operates in the 0.8 to 2.8 GHz frequency range. Similarly [17], explores the use of a seven-layer phantom with a diameter of 144.4 mm for brain biotelemetry, employing the SAR method and a frequency range of 3.0 to 5.0 GHz for image visualization.
The varying number of layers across these studies highlights the significant influence of phantom structure on signal propagation and tumor detection efficiency. These results suggest that the number and configuration of layers are critical to the success of detection methods. Some studies use invasive techniques, where antennas are placed inside the head. In contrast, others position antennas non-invasively between layers, as in [17], where the antenna is placed between the cerebrospinal fluid and dura mater. In [16], the phantom configuration varies the distance between transmitting (Tx) and receiving (Rx) antennas, exploring different detection scenarios.
Although current tumor detection methods are often invasive and pose long-term health risks, particularly due to the small size and deep location of tumors, UWB antenna arrays offer a promising solution. The problem statement of this research is to find out the design of an array of UWB antennas to detect brain tumors on a high-fidelity phantom. To this end, the proposed approach utilizes UWB Antipodal Vivaldi antennas for brain tumor detection, employing a more realistic phantom model that simulates the anatomical structure of the human head, including tissues such as white matter, gray matter, cerebrospinal fluid, dura mater, skull, fat, and skin. This model consists of seven layers, each with its respective permittivity, providing a more accurate representation of human tissue.
The study aims to detect brain tumors using a UWB antenna array in a realistic phantom model, with a focus on tumor size and location. The DAS method is employed to determine the precise location of the tumor, using probes positioned transversely to the phantom. The study presents results for two different scenarios: one with two antennas and another with four antennas, evaluating the impact of antenna count on diagnostic accuracy. The goal of this design is to conduct an exhaustive search to identify the minimum tumor size that can be detected in each of the configurations mentioned. The study highlights the significant potential of UWB antenna arrays in medical imaging, offering non-invasive, cost-effective, and high-resolution alternatives for early disease detection and diagnosis.

2. UWB Array Antenna Model

2.1. Vivaldi Antenna Element

We used an antipodal Vivaldi antenna element for this study based on [18]. This profile was designed and optimized on a 1.6 mm thick FR4 substrate with a dielectric constant of εr = 4.65, a loss tangent of δ = 0.0025, and a copper thickness of 0.035 mm. It is equipped with a SMA connector. The physical dimensions of the element are as follows: W = 45 mm, L = 45 mm, a = 11 mm, b = 23 mm, c = 1.5 mm, d = 1.8 mm, and e = 1.5 mm as shown in Figure 1. The antenna is designed to operate within a frequency range of 2.4 to 17.7 GHz.

2.2. Phantom Model

An adult human head typically has a circumference of between 59 cm and 62 cm. A model with a circumference of 65 cm, a length of 182.1 mm, and a width of 143.8 mm was used.
Figure 2 shows the human head phantom modeled in Computer Simulate Technology (CST) Studio Suite, where the anatomical layers are delineated and a tumor is placed in the right hemisphere. Figure 2c presents the values used to calculate the corresponding length and width of the model.
The phantom is composed of seven layers, each with a specific dielectric permittivity and thickness. The values used for each of these layers are detailed in Table 1.

2.3. UWB Array Antennas with Phantom

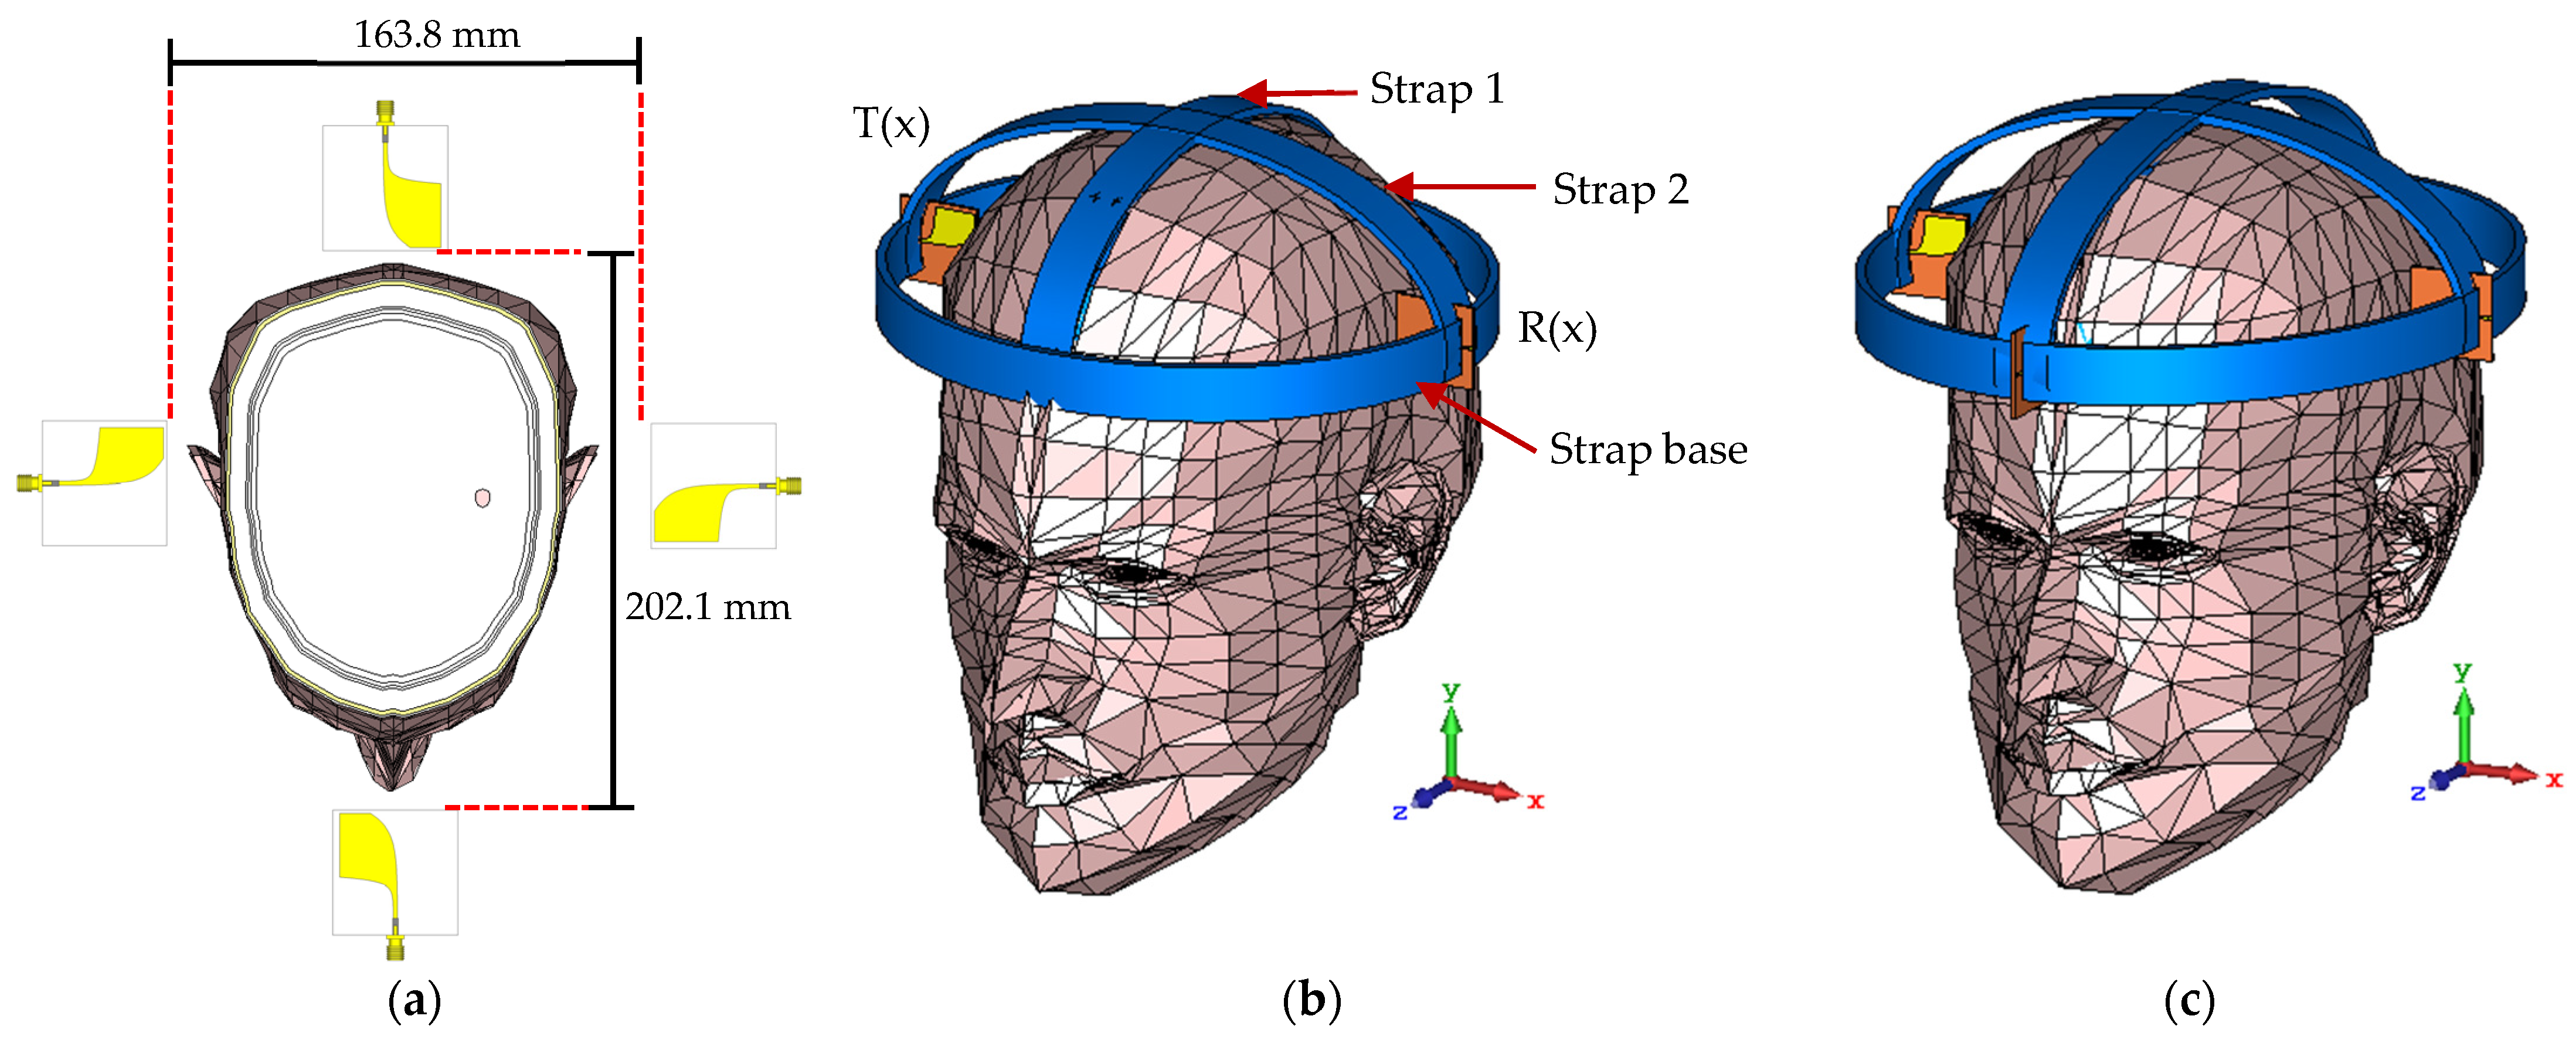
A two-element and four-element antenna array are used for the detection of brain tumors, specifically in the inner white matter region. Figure 3a shows that the Vivaldi-type antennas are positioned with a vertical separation of 202.1 mm. In the two-element array, the antennas are positioned at 180 degrees, while in the four-element array, they are positioned at 90 degrees. To maintain the stability of the UWB antenna array, a prototype with a helmet shape was designed (see Figure 3). The prototype headband is made of Polylactic Acid (PLA) material, and its dimensions are provided in Table 2.

3. Imaging Method

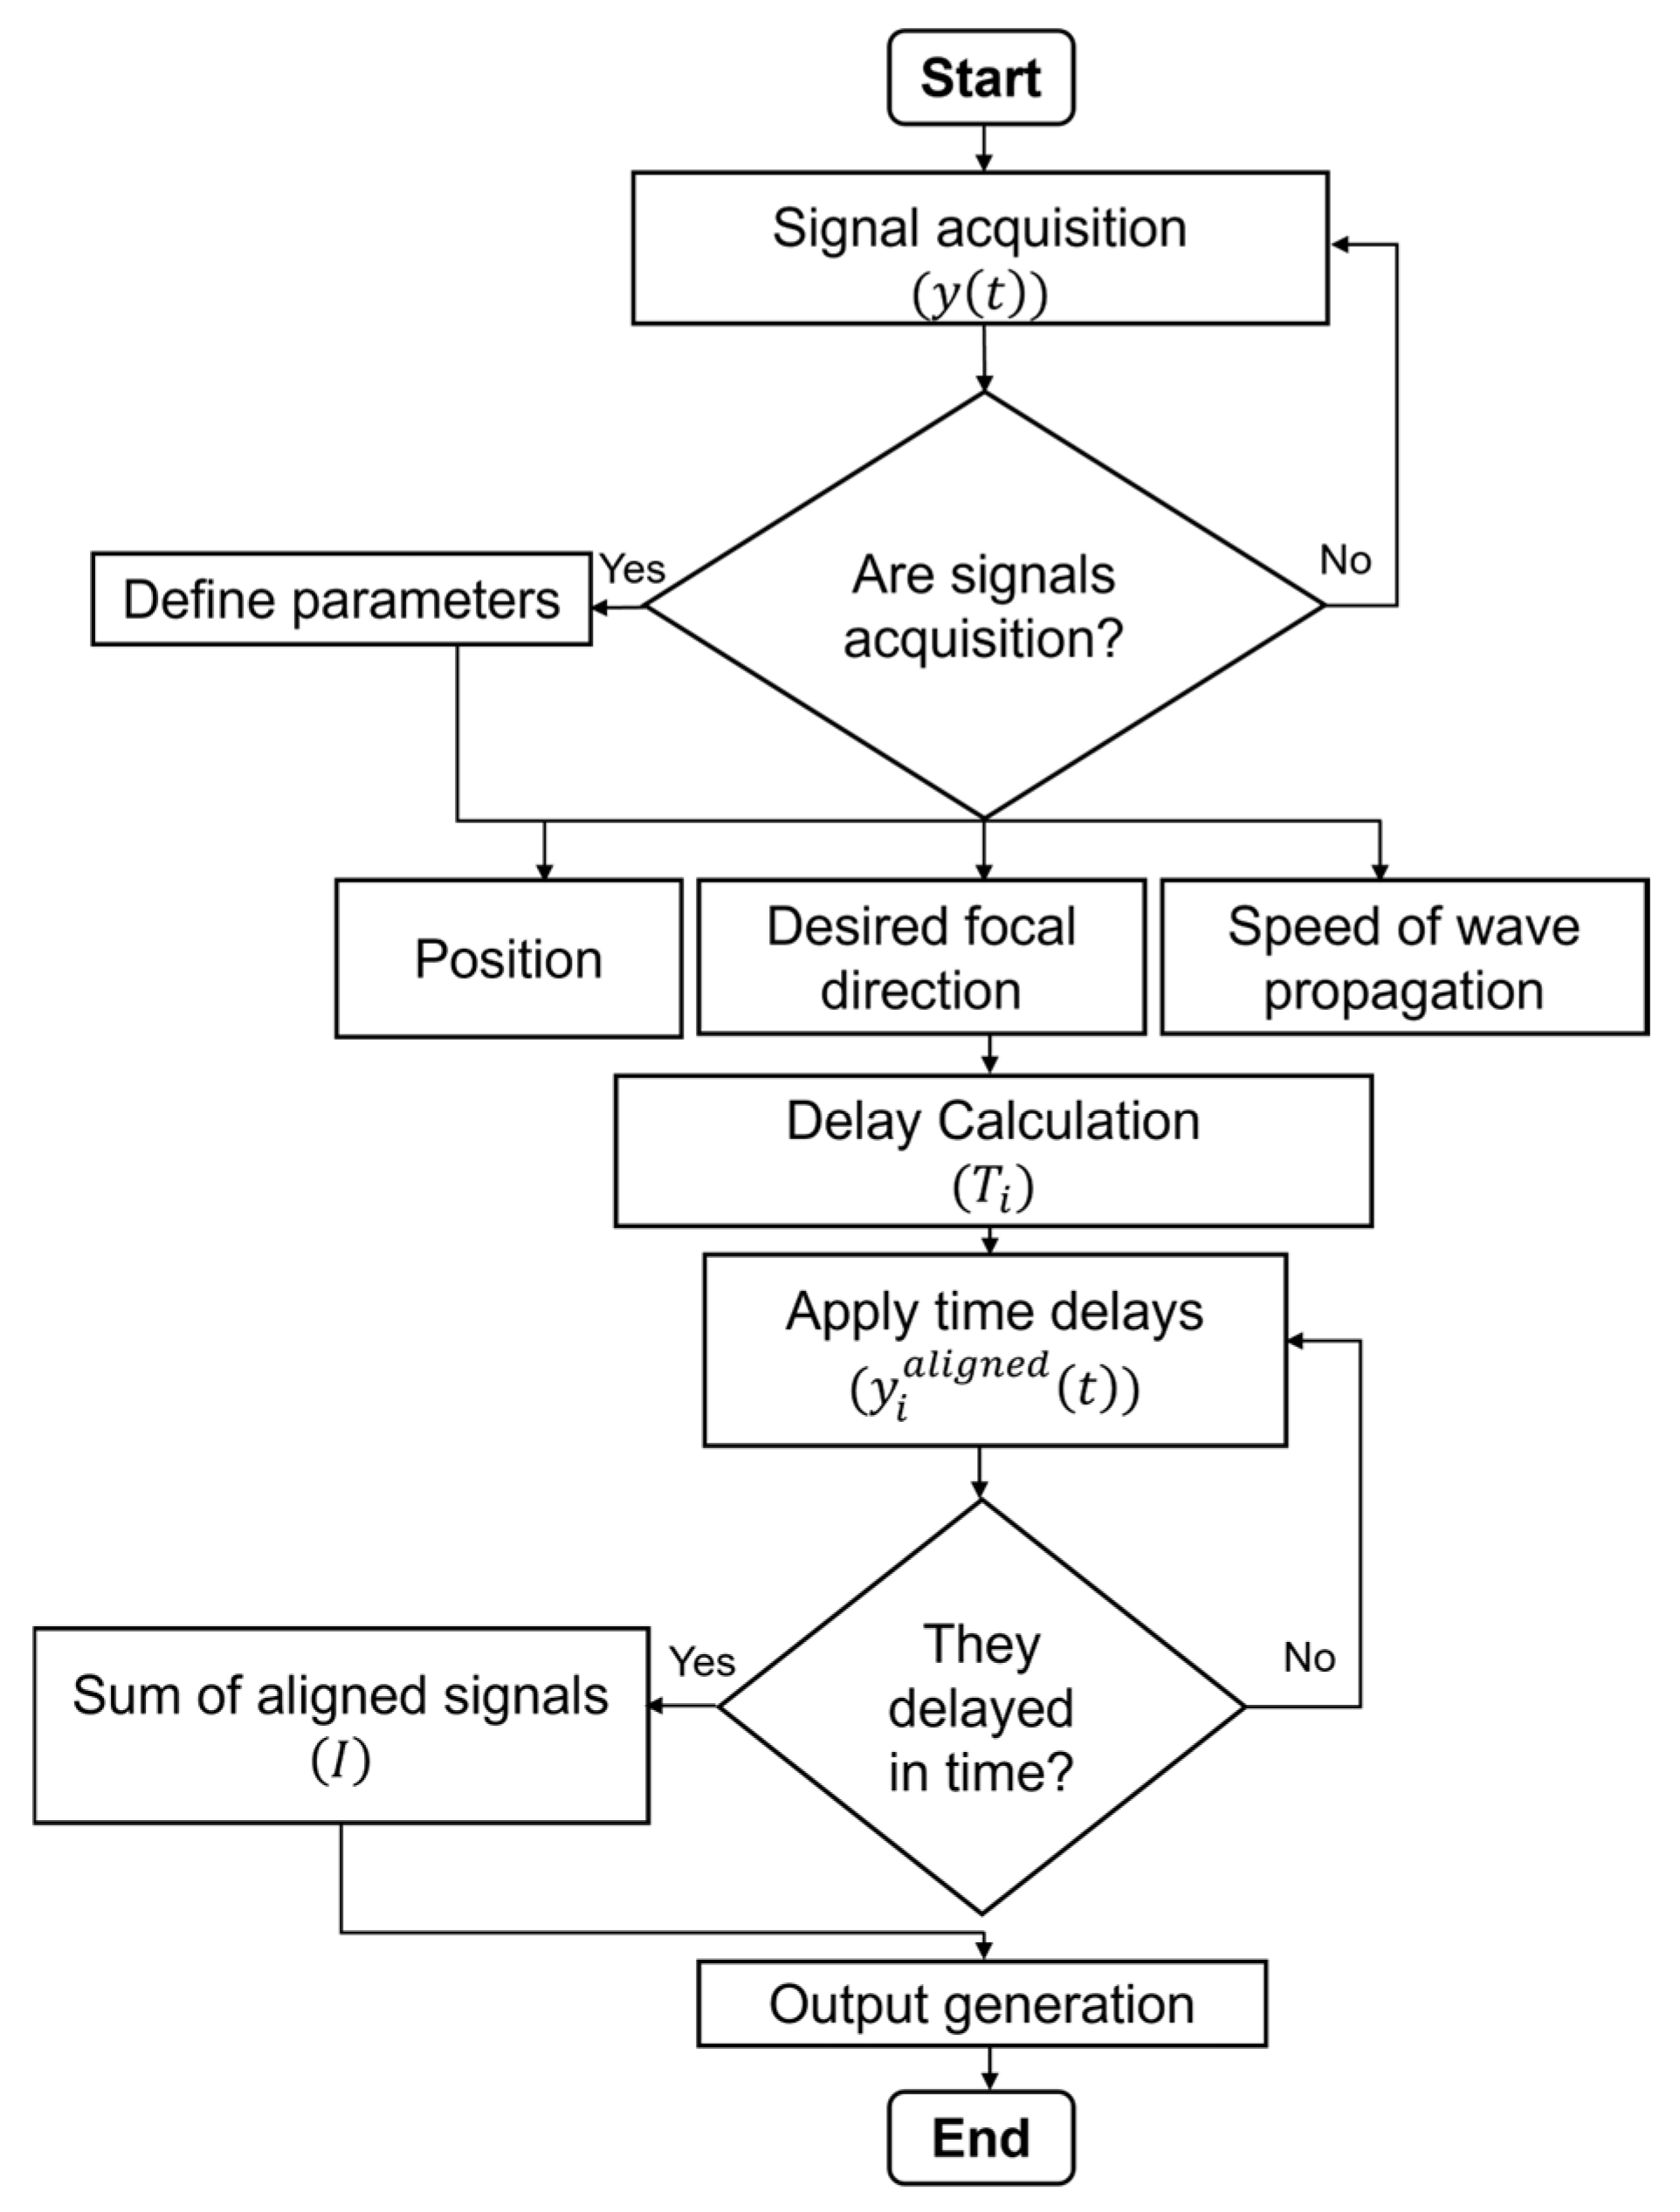
For image reconstruction, the DAS method was employed [10]. The methodology of DAS is detailed by a flowchart in Figure 4 [20].
This approach is based on the summation of signals induced by a Gaussian pulse, as shown in Equation (1). The signals are modulated by each antenna in the array, and an integral is then performed to obtain the result.
y t = sin 2 π f t t 0 exp t t 0 2 τ 2 ,
where the frequency is fixed as f = 7.5 GHz, the width of transmitted pulse is defined as τ   = 80.2 ps, and the initial time is t 0 = 3.5 τ . Then, the intensity magnitude is obtained by integrating the pulses as depicted in Equation (2) [21].
I = 0 τ i = 1 N N 1 / 2 w i y i t T i 2 d t ,
To determine the tumor’s position in the image, test points are utilized, as illustrated in Figure 5, where three test points can be observed, point 2 being the one that contains the tumor. The term I at each test point is determined by multiplying the shifted signal y i t T i by its corresponding weight w i , which reflects the signal’s amplitude as a function of its attenuation. The term Ti is the propagation time of the ith signal. The signals y i t T i from the N antennas in the array are summed, and the resulting value is squared, producing a single composite signal at each test point. The time delays Ti and the weighting factors w i in Equation (2) are determined using the CST Microwave Studio. Primarily, the weighting factors wi are the attenuation that the pulse suffers when it is propagated by the medium. And the variable Ti is the time delay that the ith pulse lasted to travel from the transmitted antenna to each point inside the phantom. Finally, the integral of the signal at each test point is computed to obtain the result. These test points generate numerical values when the calculations in Equation (2) are performed. However, the phantom without the tumor must also be simulated, as the quotient of the values for each test point is calculated using Equation (3). The quotient of the signals is expressed as:
x i j n = A w i t h , i j n / A w i t h o u t , i j n ,
Used for imaging. In (3), A w i t h , i j n and A w i t h o u t , i j n are the signals without and with the tumor, respectively.
During the simulations we used a rectangular grid of 361 test points. This configuration allows for analyzing the signal’s behavior as it is transmitted from the Tx antenna and received by the Rx antenna. The distance between each test point was 10 mm.

4. Simulation Results

4.1. Single Antenna Element Performance

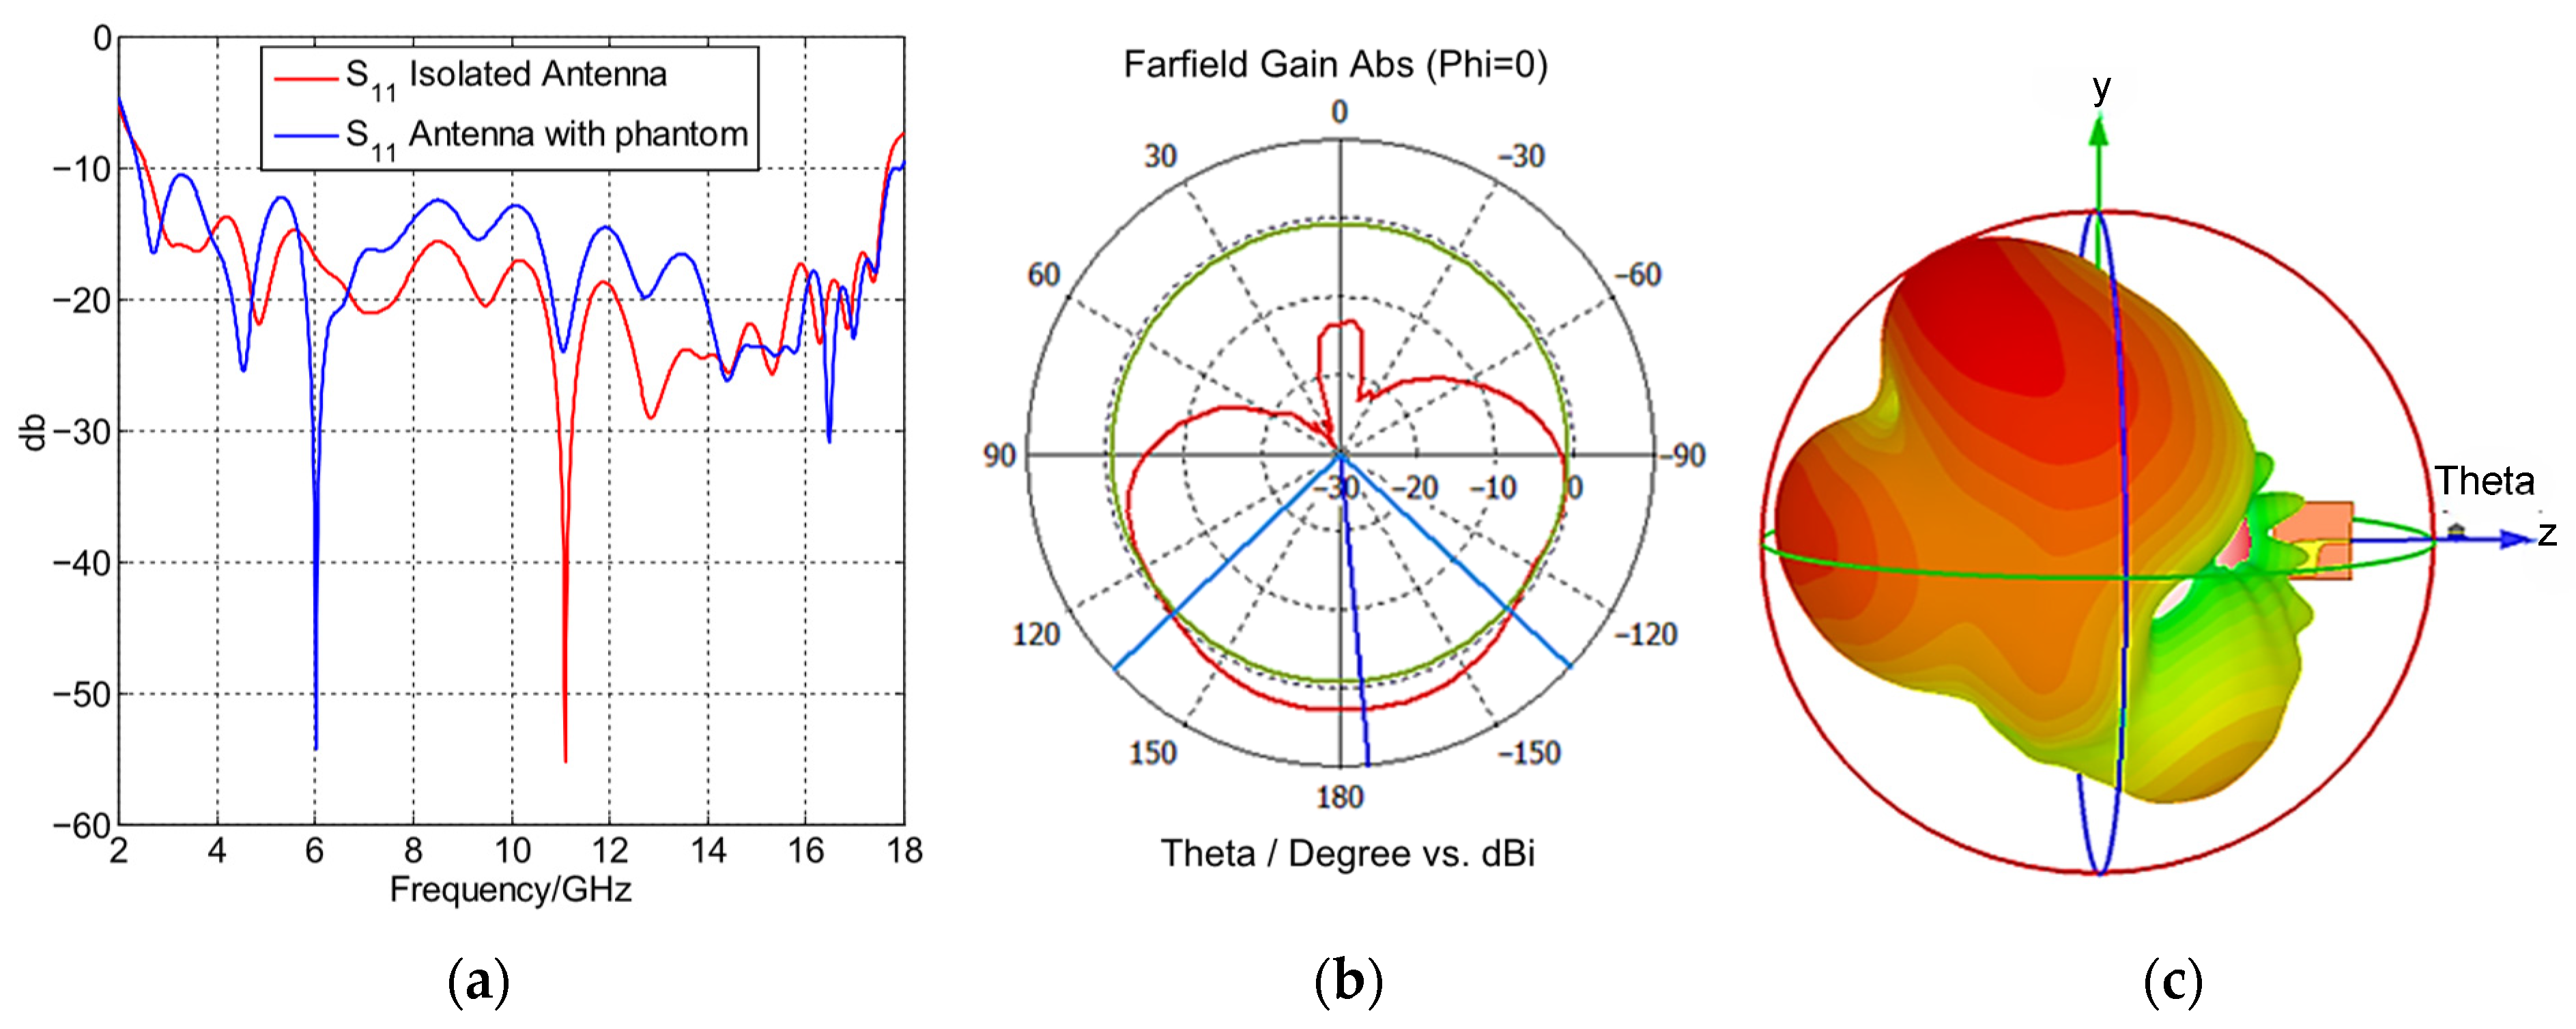
A simulation of the antenna performance in contact with the phantom was conducted. Figure 6 shows the S11 parameter and the radiation pattern of a single antenna. The S11 parameter results below 10 dB across the frequency range from 2.4 GHz to 17.7 GHz with the phantom, whereas the radiation pattern shows maximum radiation towards the phantom.
An analysis focused on the SAR parameter that was carried out. Based on this analysis, the Antenna Power Efficiency percentage was determined, calculated according to Equation (4) [9].
E f = P h e a d P i n p u t · 100 % ,
where P i n p u t (W) is the input power and P h e a d (W) is the power absorbed in the brain phantom in front of the antenna. The results are summarized in Table 3, which presents the efficiency values corresponding to five different frequencies evaluated in the study, considering all layers of the phantom compared to a phantom of one layer of gray matter material. The proposed antenna obtains a better absorbed power ratio in lower frequencies when the seven-layer phantom is considered. However, the absorbed power ratio is less for higher frequencies with a phantom with seven layers.
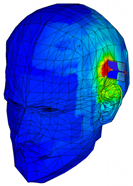
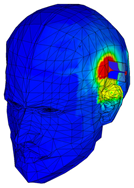
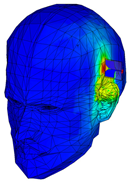
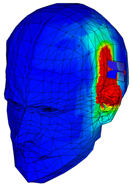
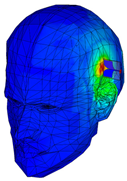
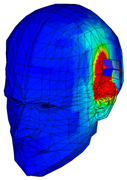
Table 4 contains the visualization of the SAR parameter in the phantom at the same frequencies evaluated in Table 3. In the case of the phantom of seven layers, it is observed that the SAR is less only in higher frequencies.

4.2. Antenna Performance with Phantoms Composed by Different Materials

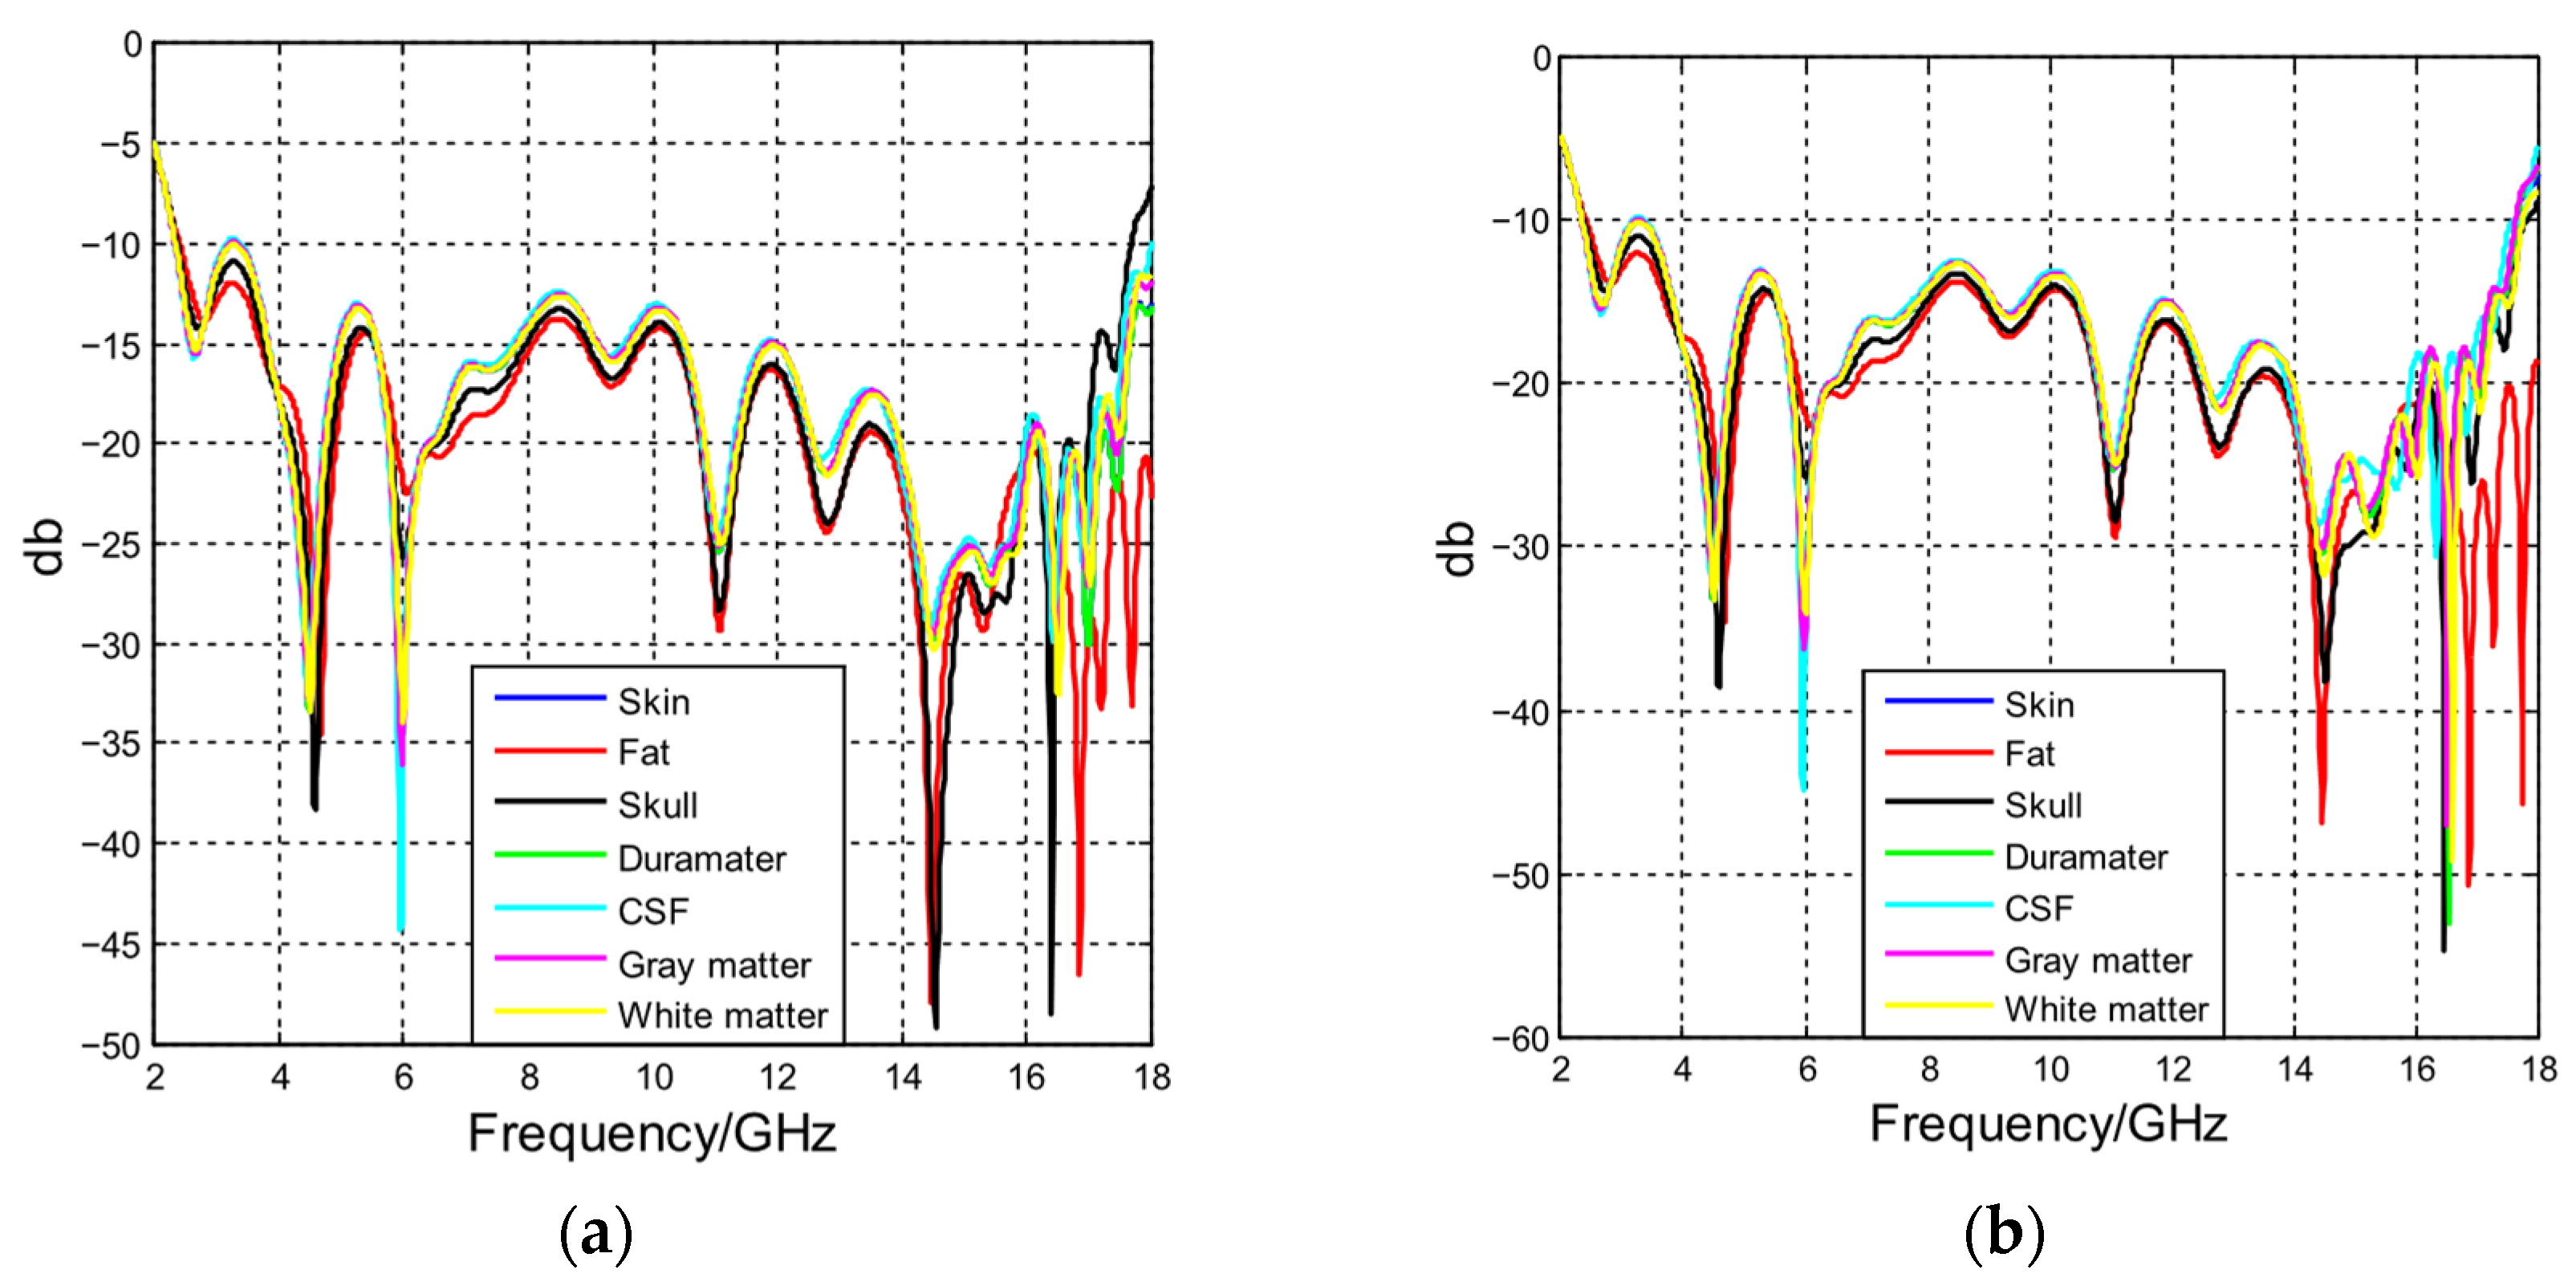
Now, it is important to know the effect of the different materials that compose the phantom. To this end, Figure 7 presents the results of seven simulations, showing the S11 parameter for the phantom made of a single material, as specified in Table 1. The simulations are conducted for both the two-antenna and four-antenna configurations. The antennas are placed 10 mm from the phantom. It is observed that the reflection coefficient is very similar when the phantom is modeled with a single material. Nevertheless, the reflection coefficient deteriorated in lower frequencies, especially in 3.5 GHz for the skull, gray matter, white matter, and cerebrospinal fluid (CSF).

4.3. Time Signals and Image Resolution

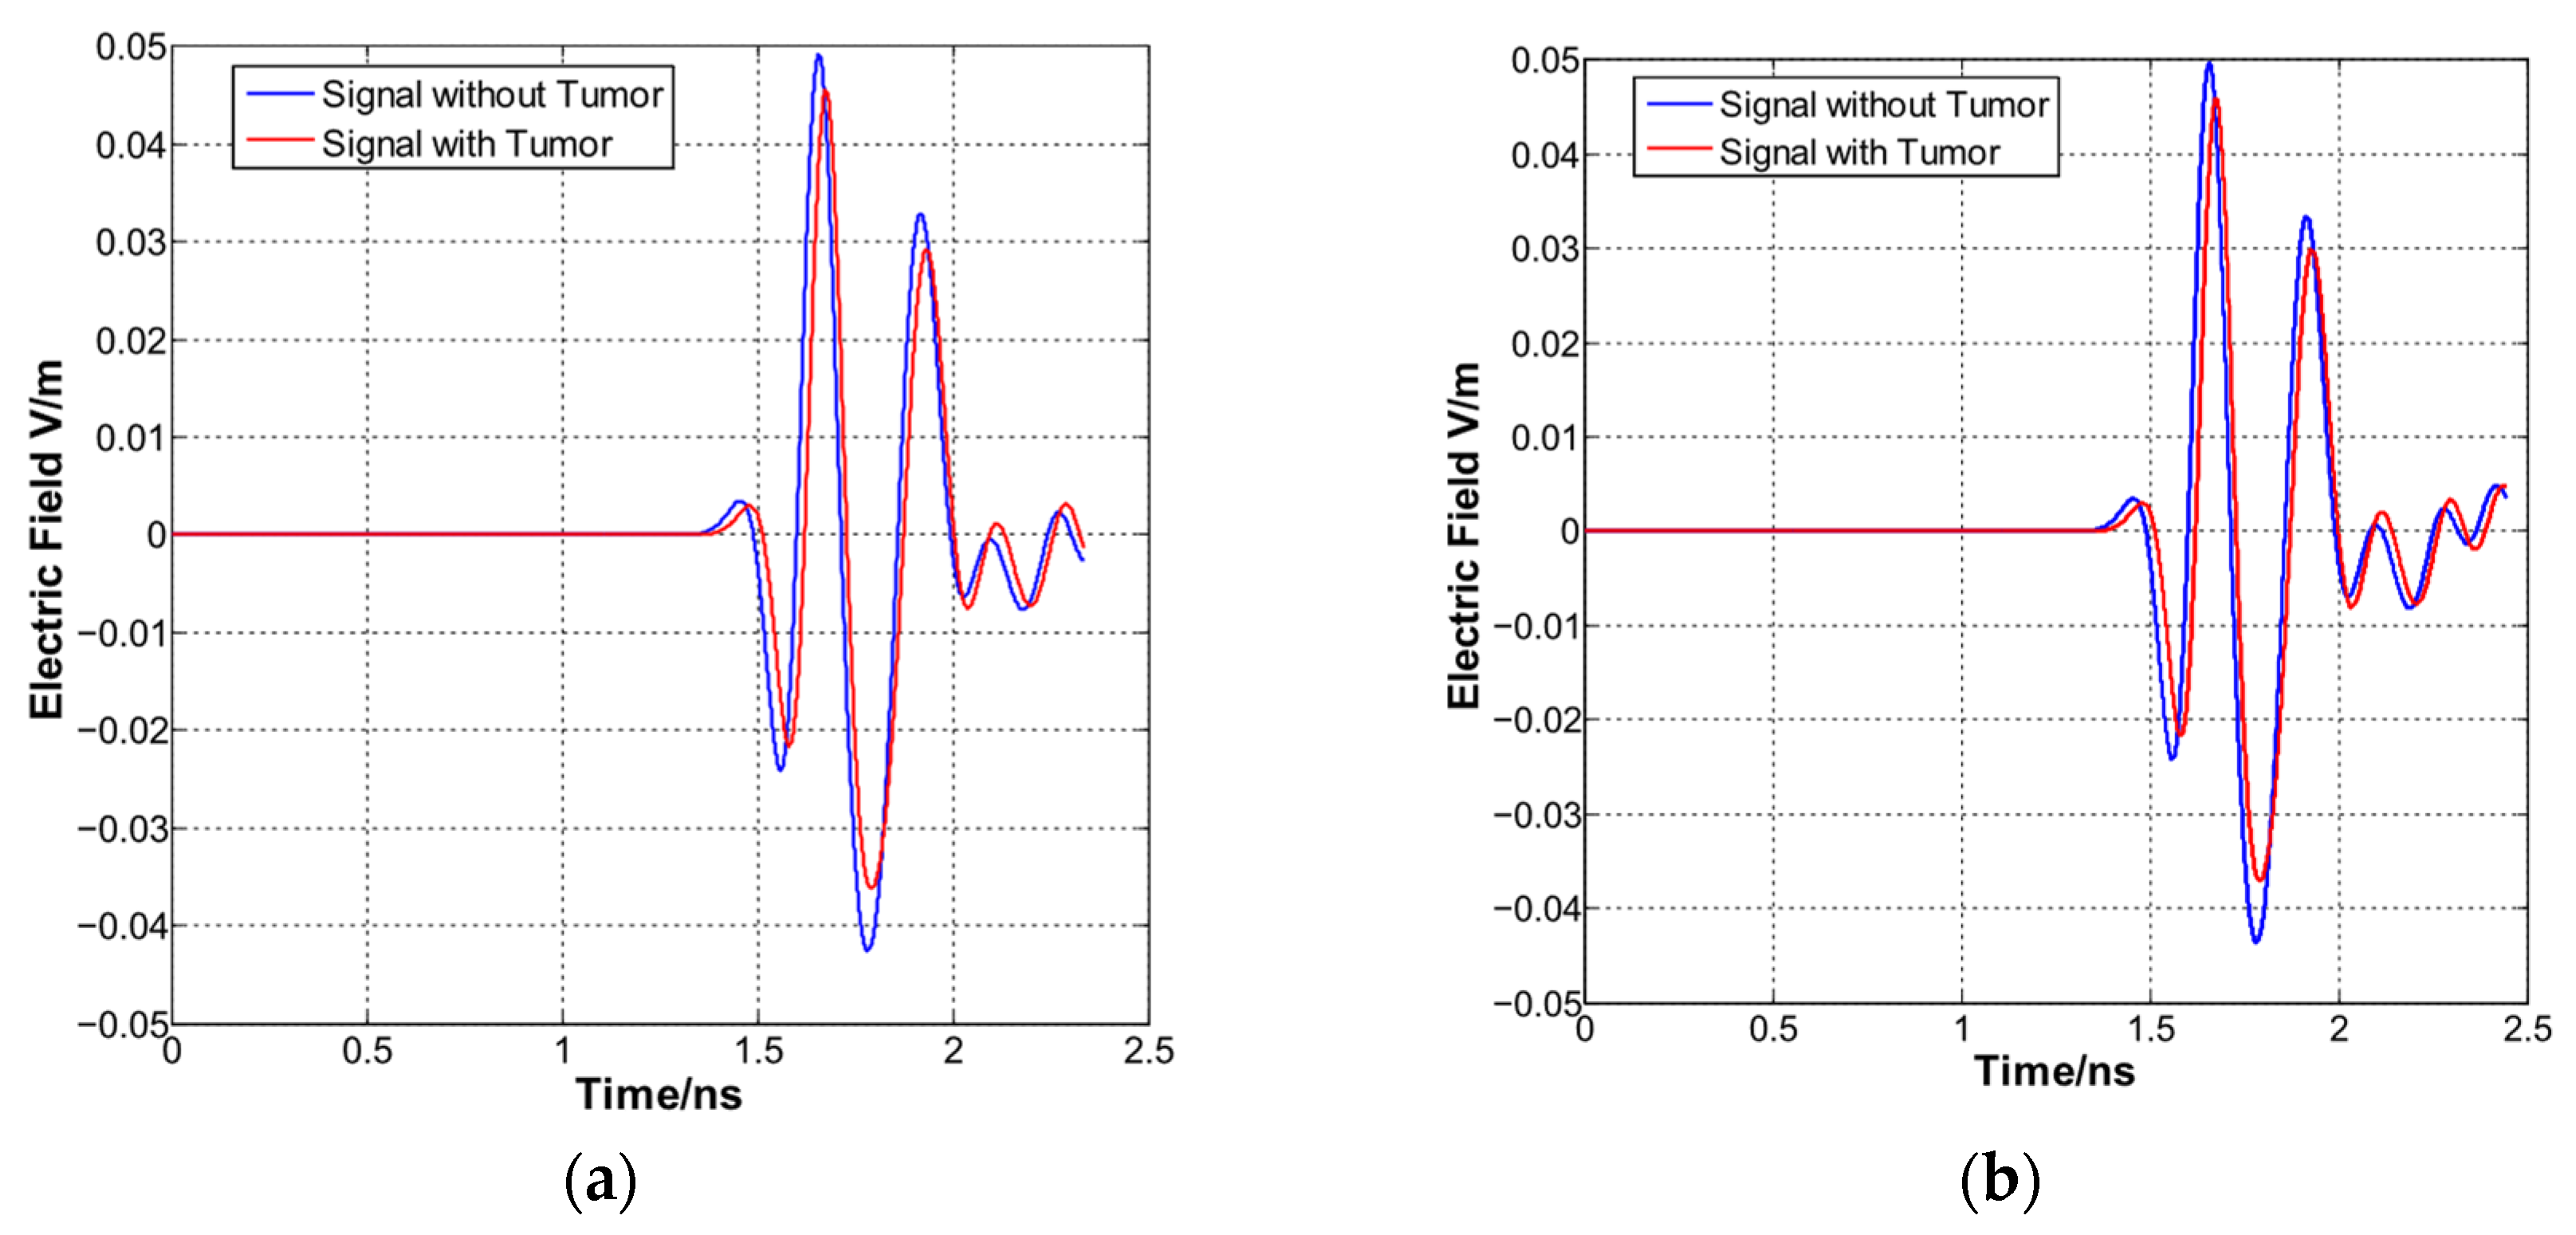
Now, we considered a phantom with seven different layers as depicted in Figure 2b. In this case, Figure 8 illustrates the time signals at the test point located at center of the phantom when two and four antennas are mounted vertically with respect to the phantom. A comparison of the time signals generates an image, as described in Equation (3). In this context, if any signals at any test point are equal with and without the tumor’s presence, Equation (3) would be the unit.
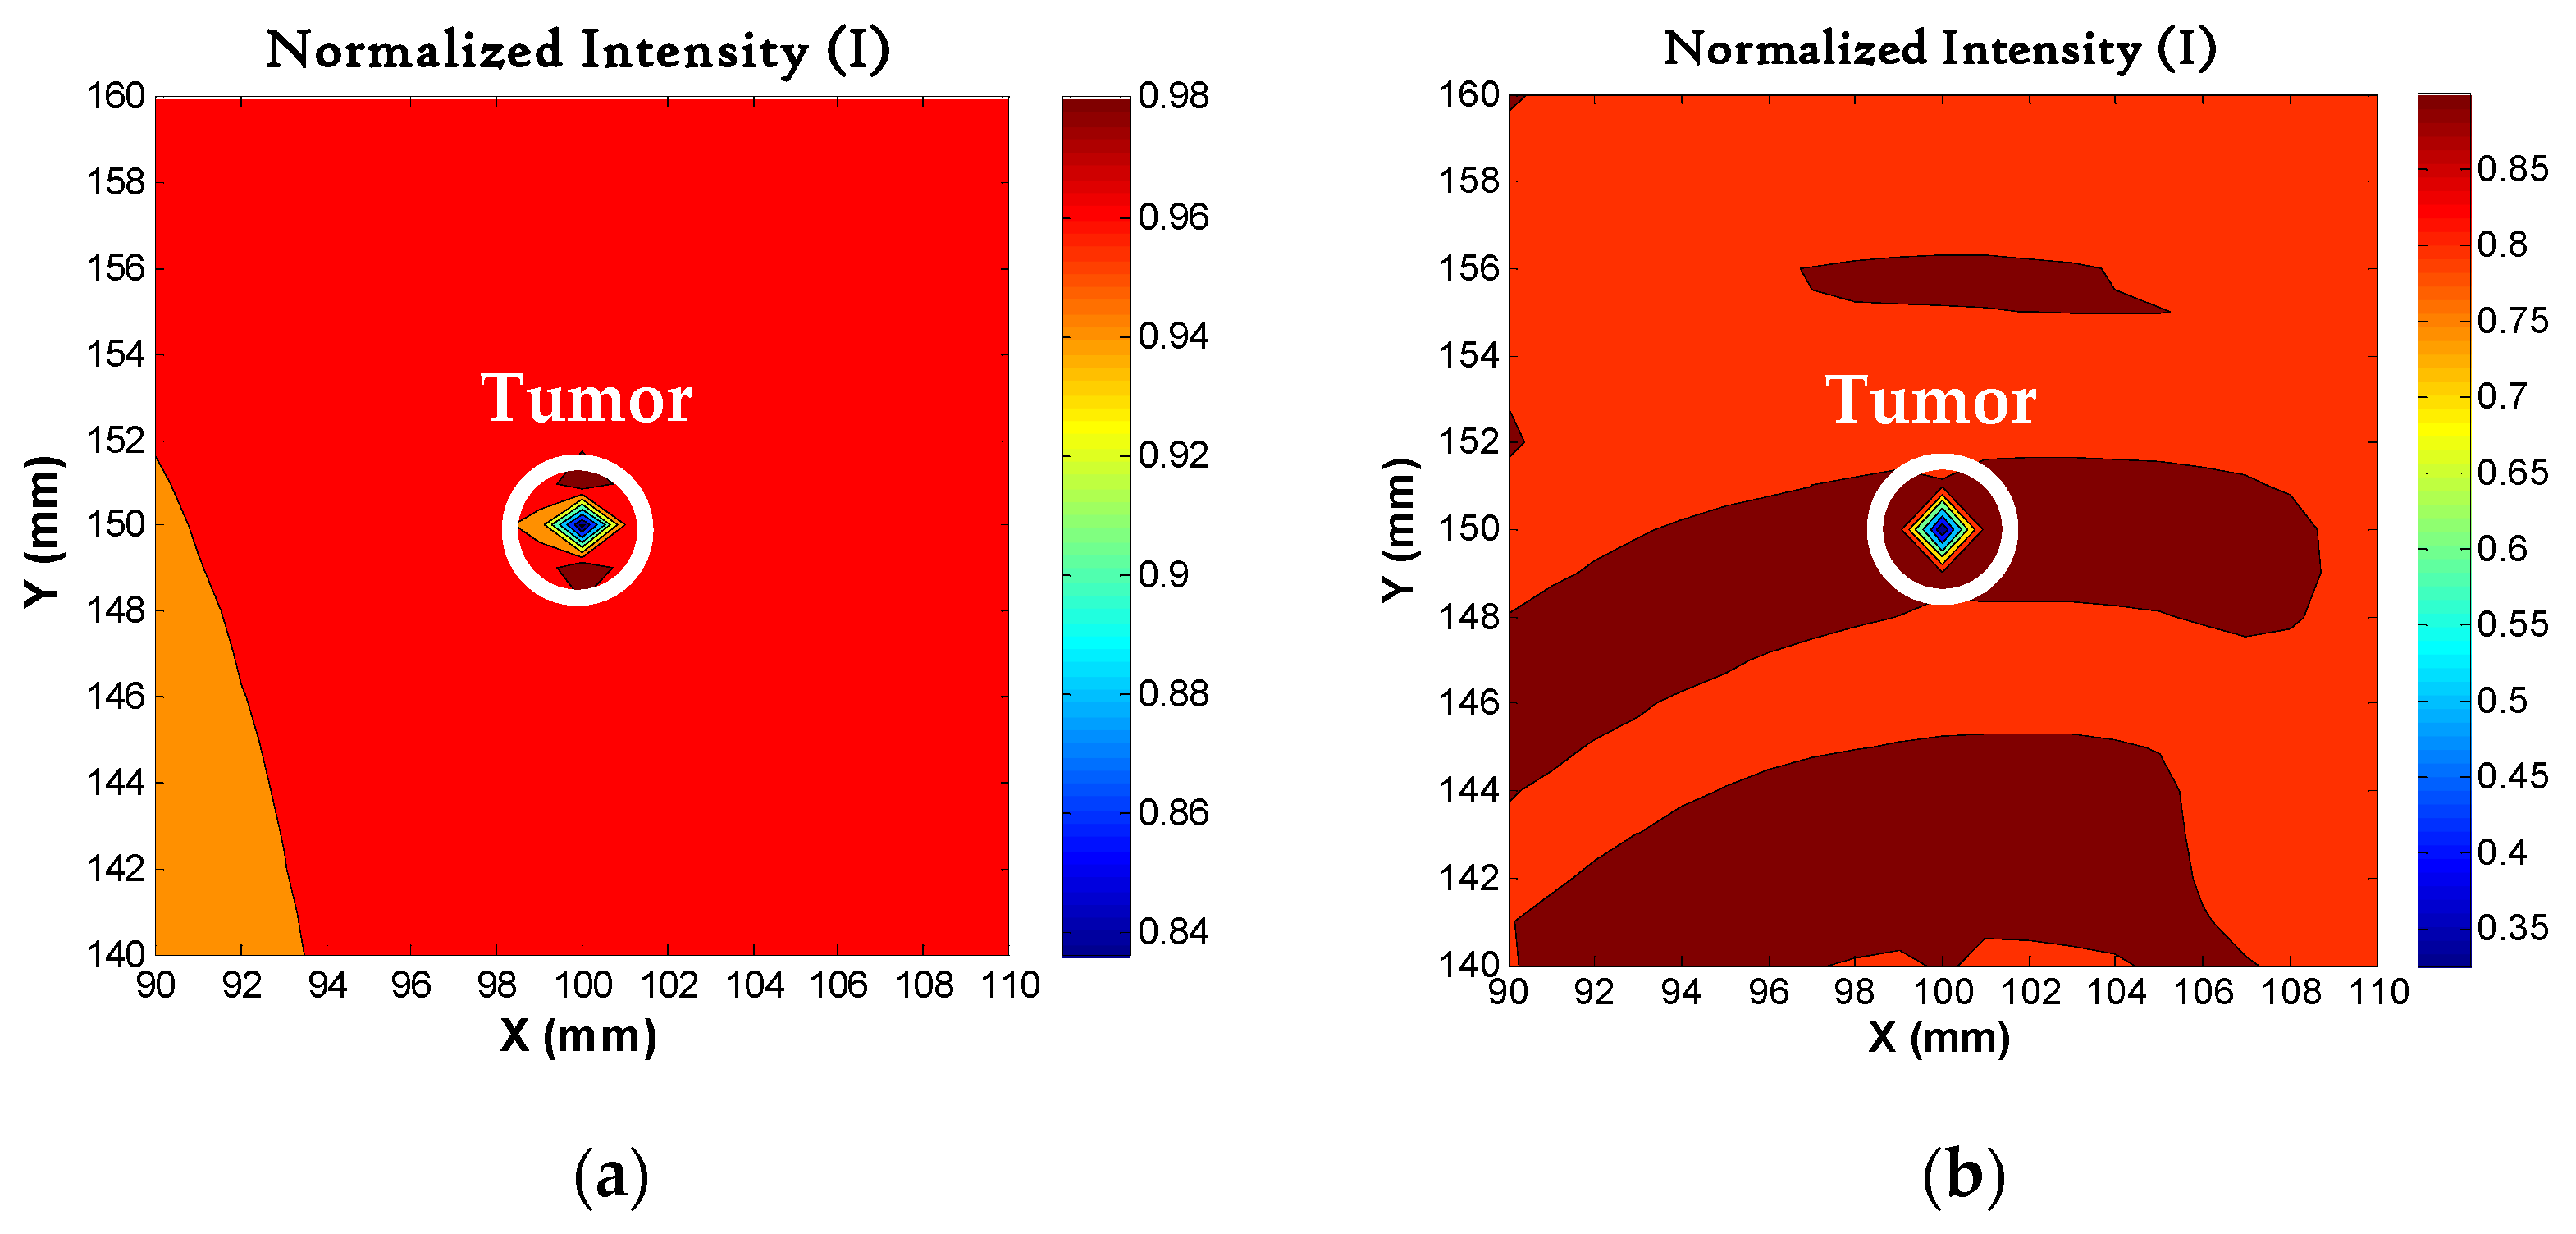
The variation in the signal is evident in Figure 8, as the number of antennas increases during the simulation. It generates signals for each test point with a resolution of 19 × 19 test points unit mesh. By rearranging these values according to the mesh, it becomes possible to visualize the cross-sectional image of the phantom using the DAS method. The images obtained for both cases (2 and 4 antennas) are shown in Figure 9, considering a tumor with a 0.625 mm diameter. When more antennas are used the image of the tumor is finer.

4.4. Image Reconstruction with Different Layers in Phantom

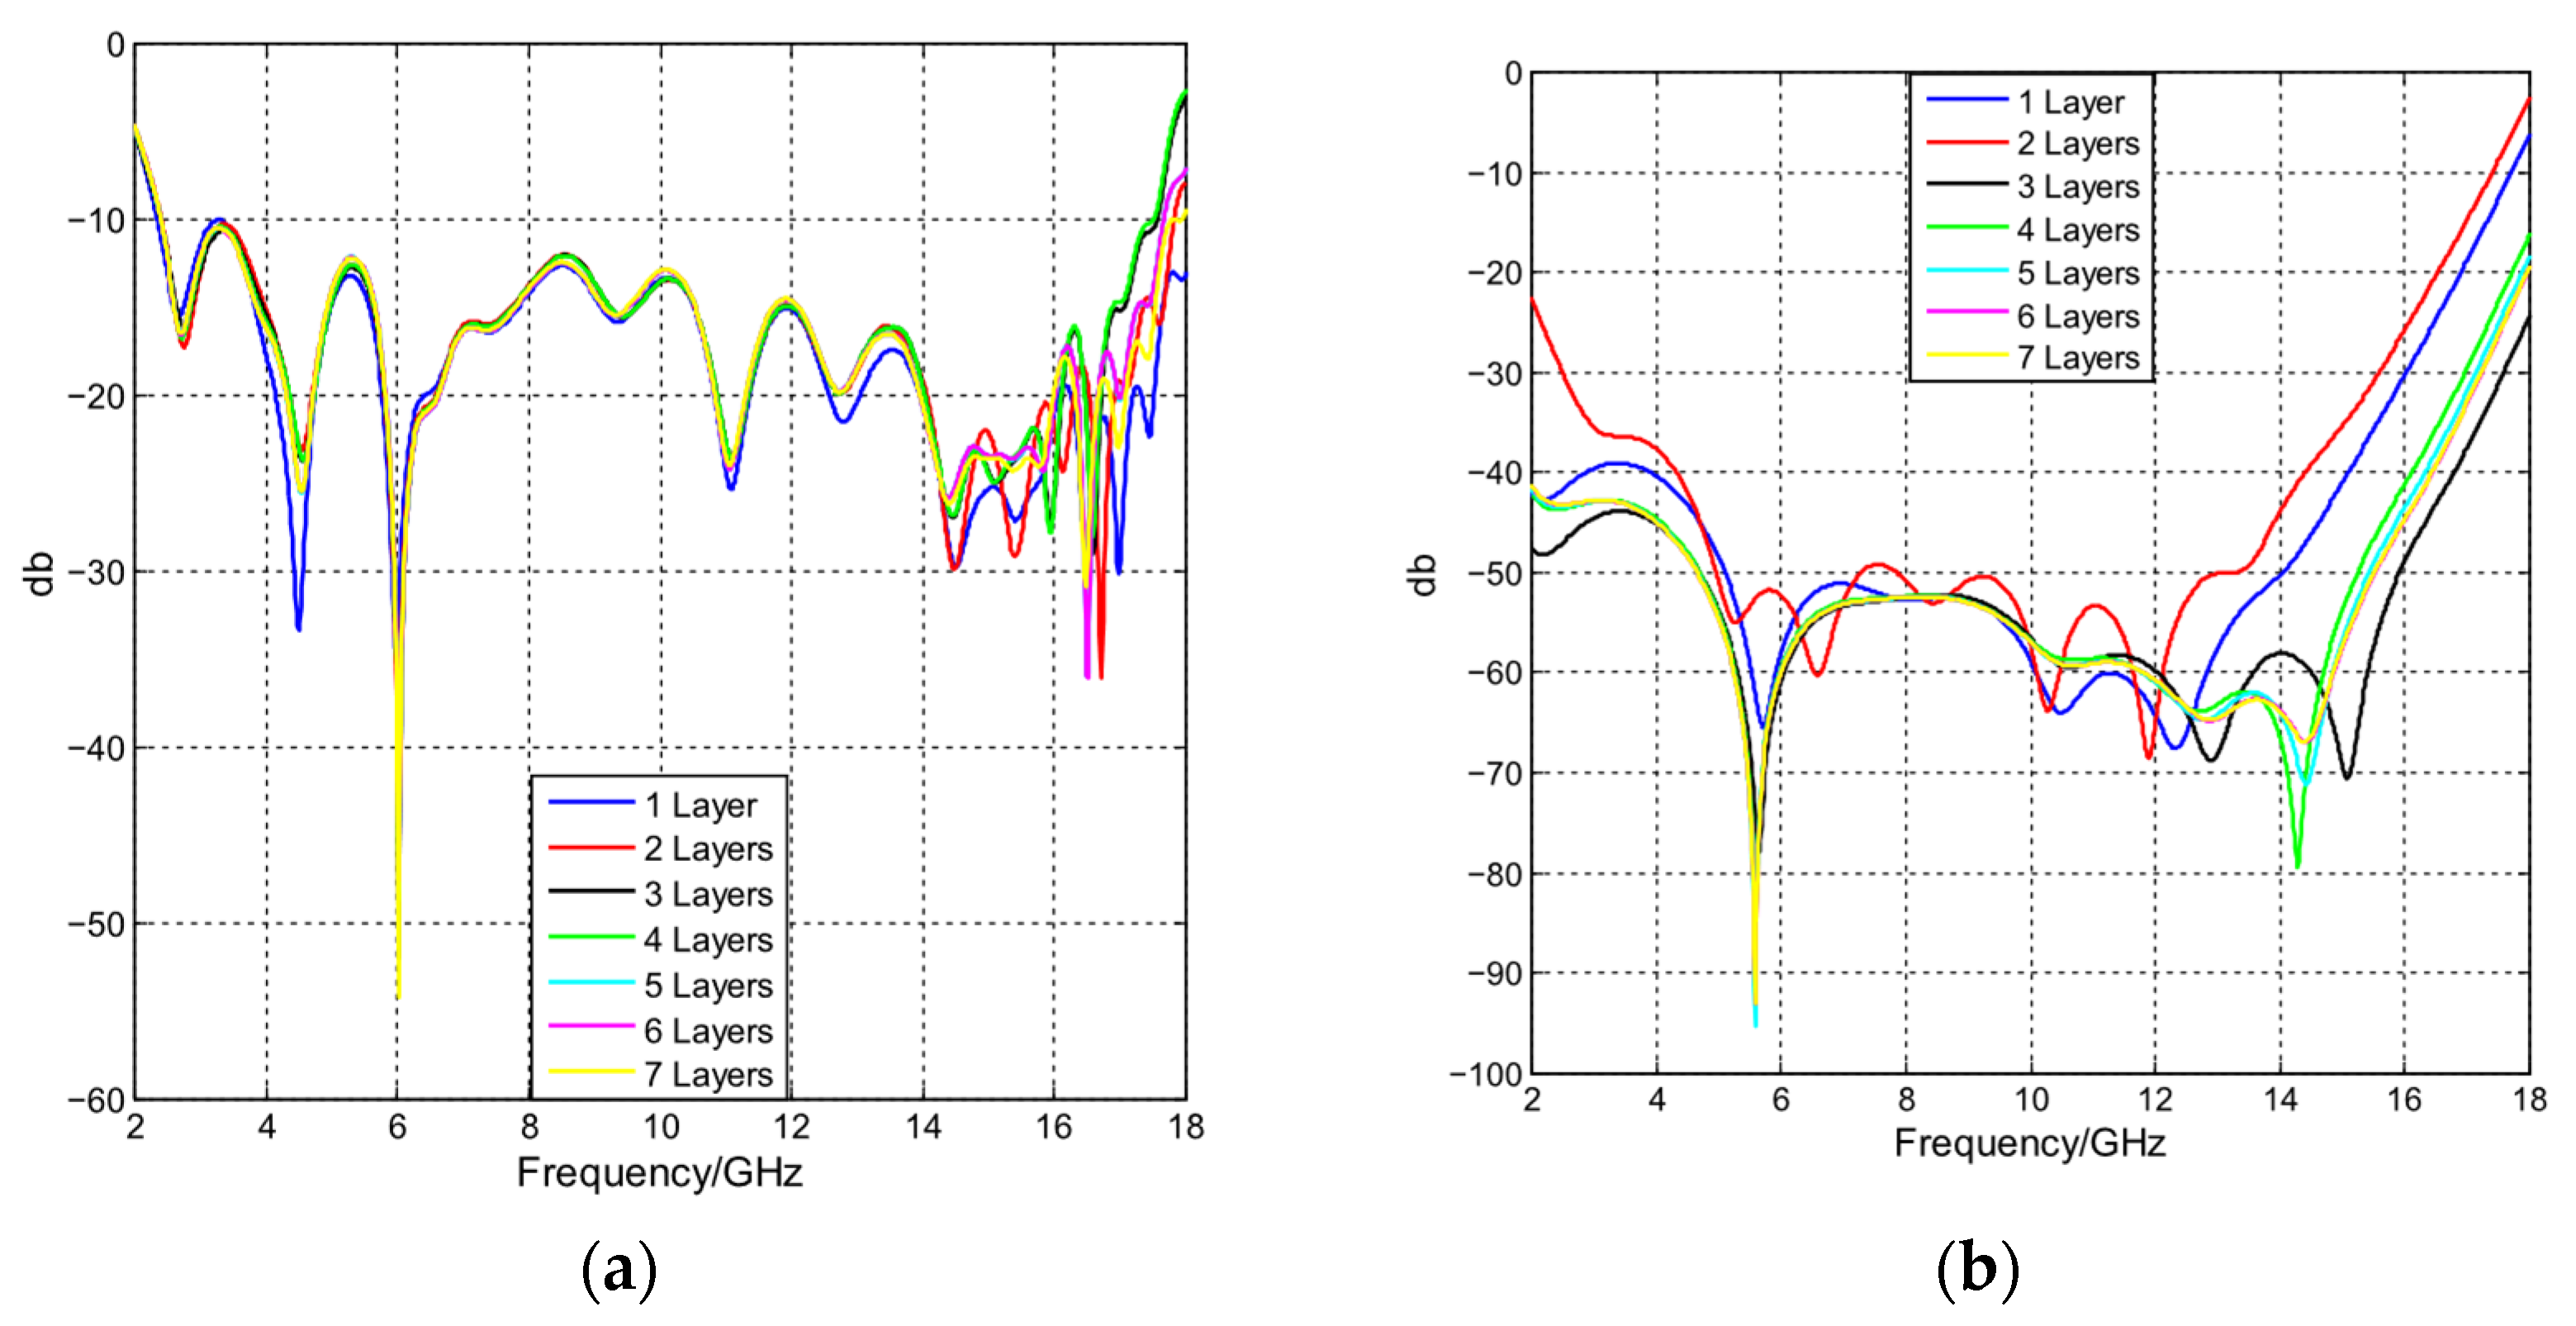
Similarly, the study analyzed the S parameters by sequentially adding layers of material to the phantom, as specified in Table 1. The results of this analysis are presented in Figure 10. The reflection coefficient resulted very similar when the seven layers were added to the phantom model. The S11 parameter behavior shows minimal variation when using a phantom with a larger amount of material in the proposed layers. In contrast, S21 parameters change at high frequencies. This means image construction cannot be achieved at frequencies higher than 14.8 GHz This suggests that it is feasible to increase the thickness of these layers without impacting the antenna’s performance in tumor detection in lower frequencies.
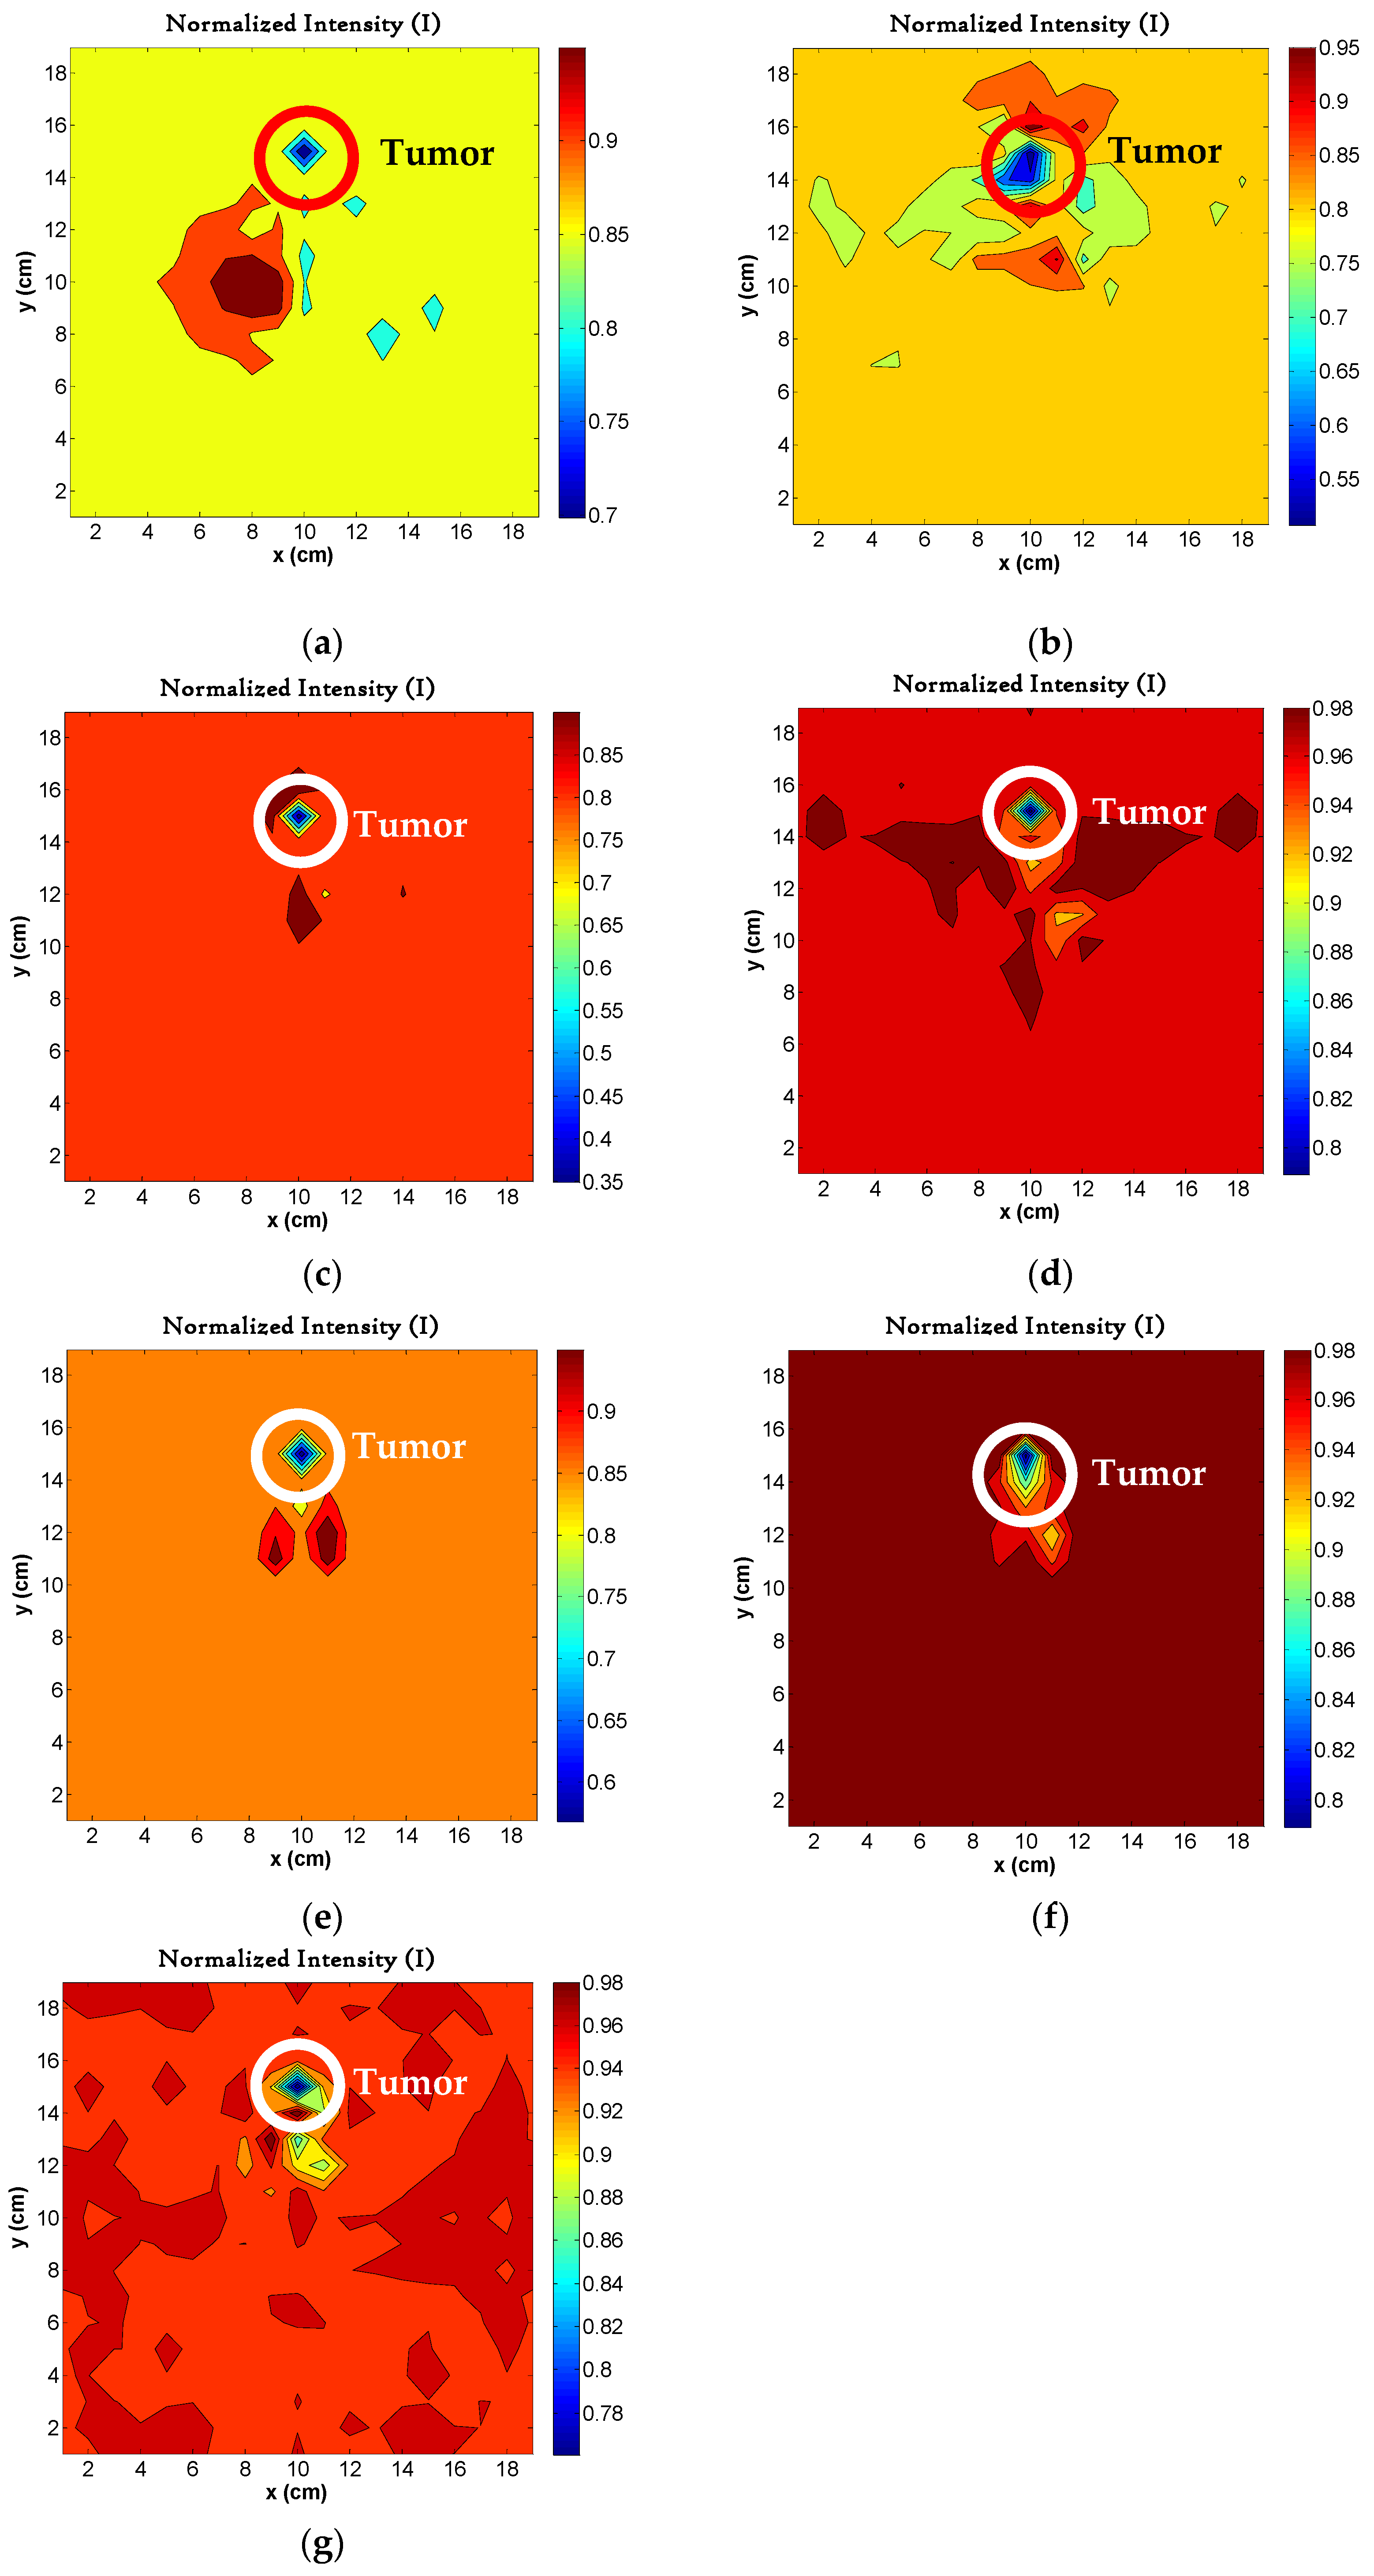
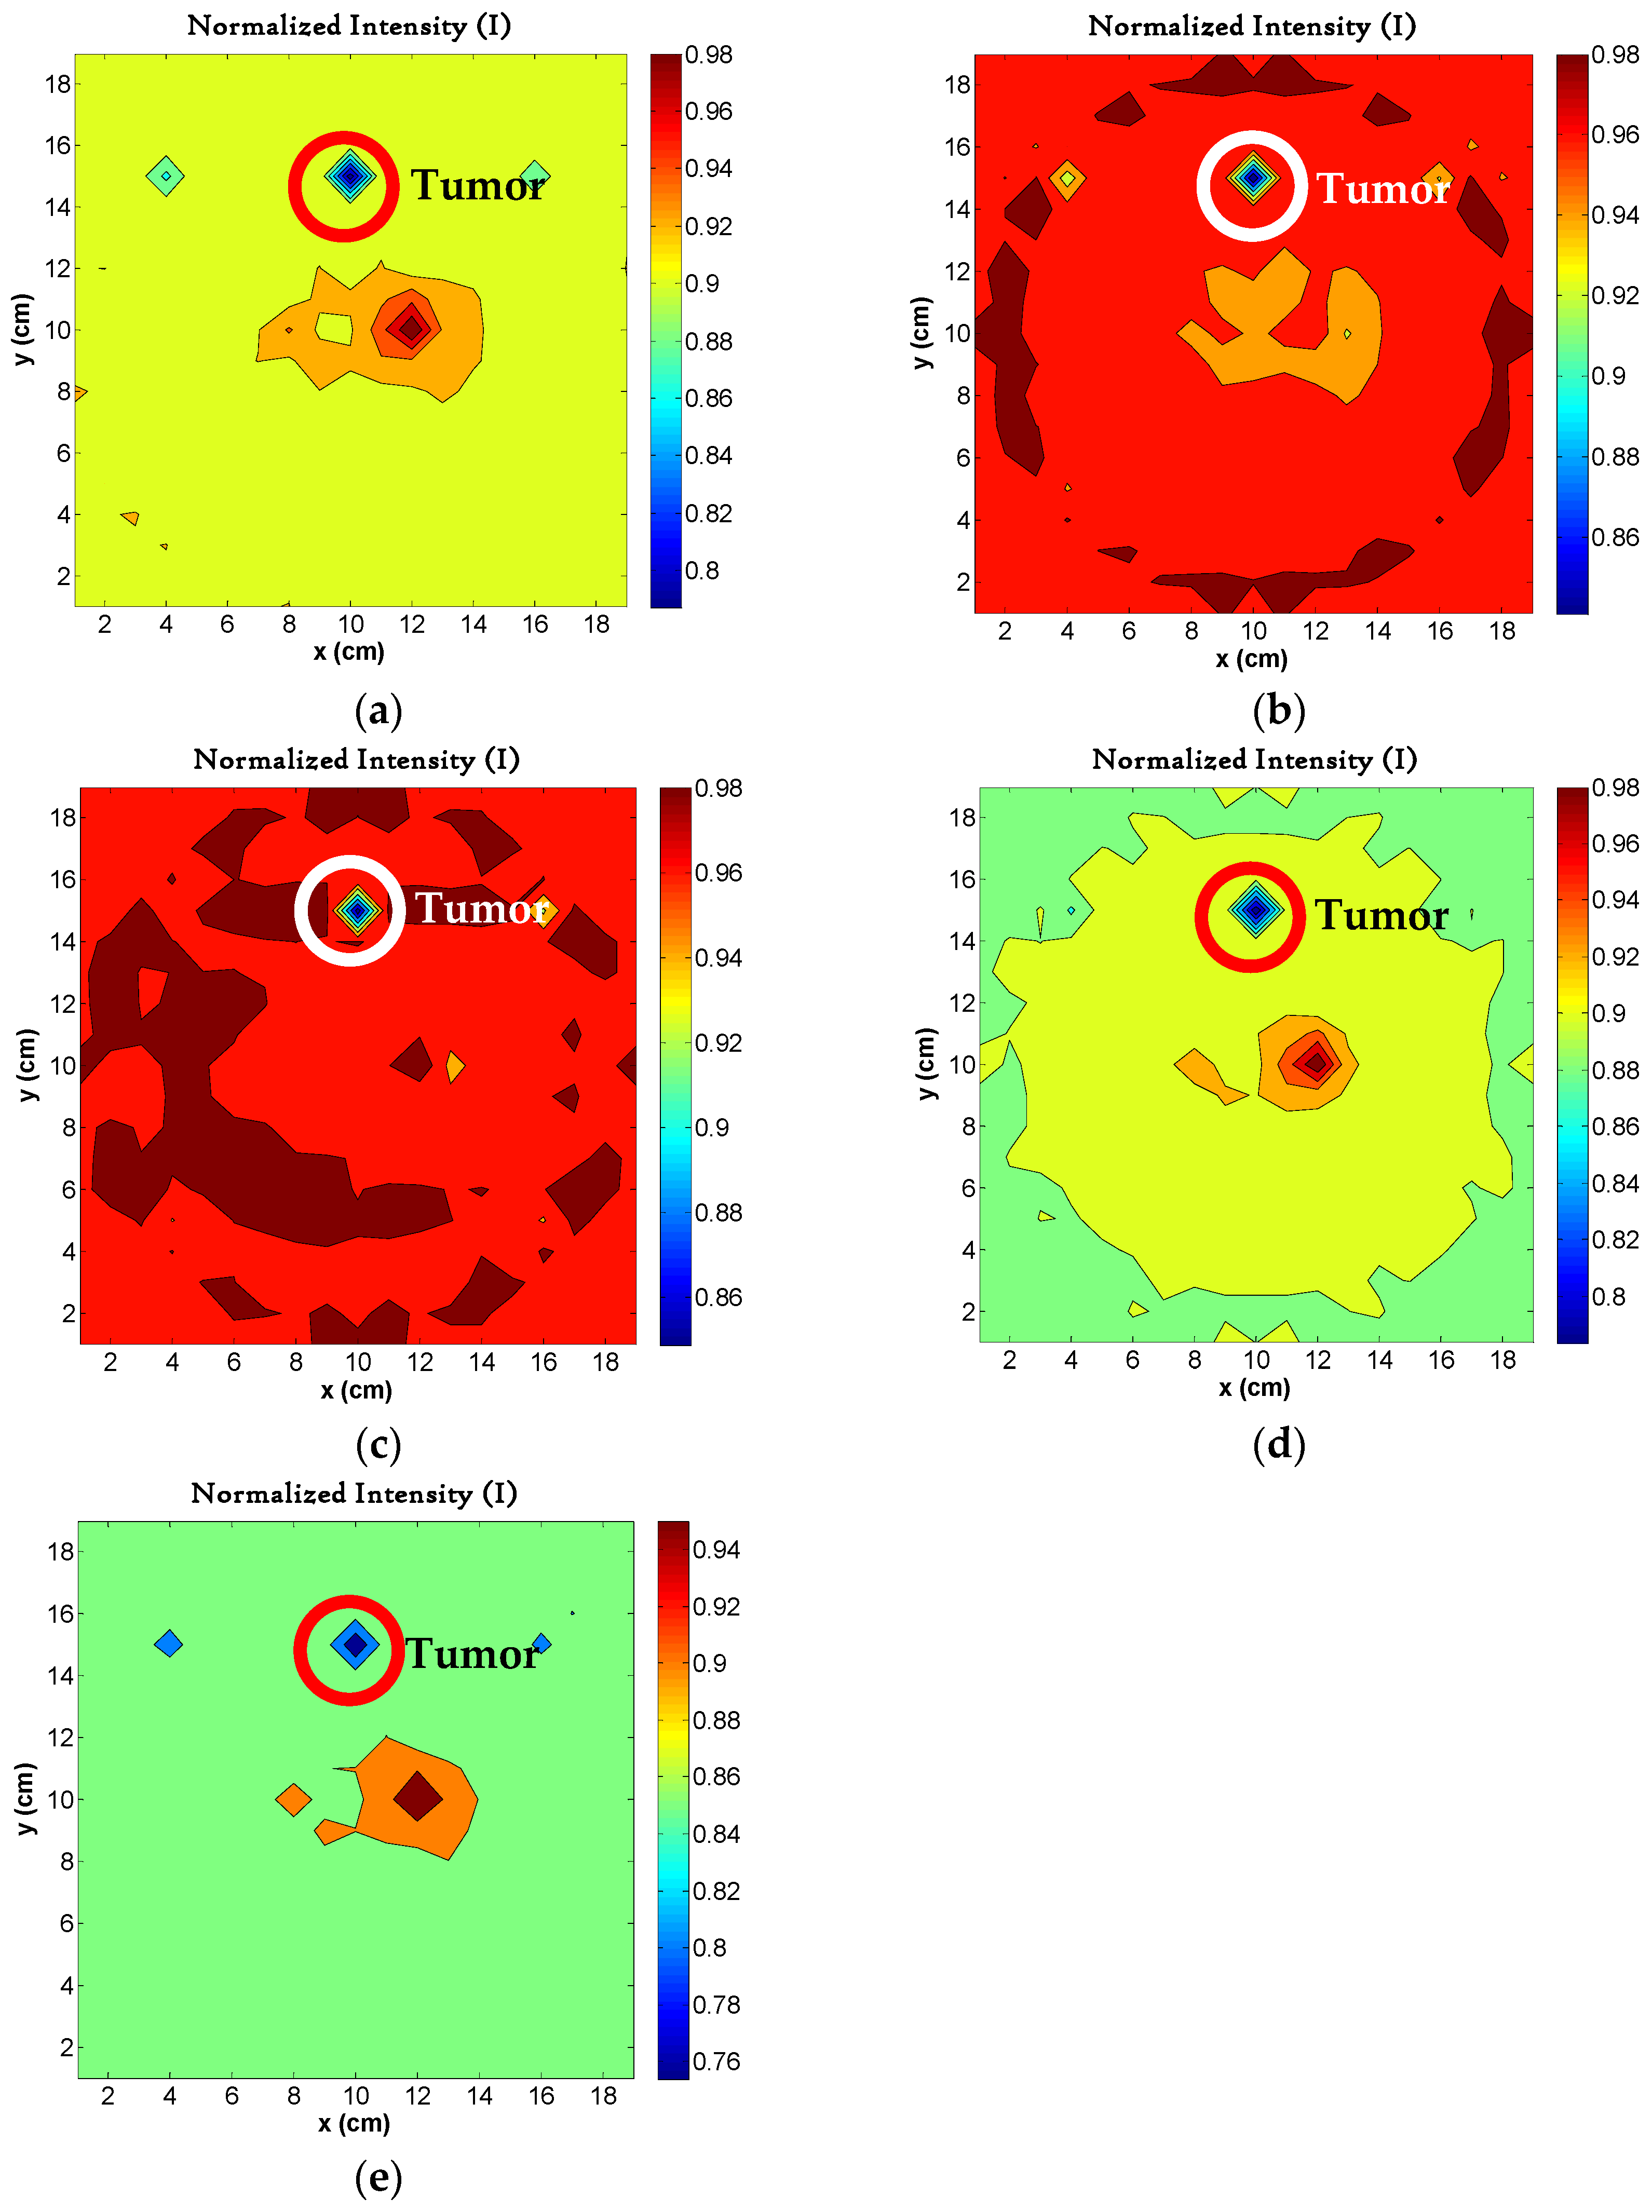
Additionally, the images of the cases in Figure 10 were reconstructed with two antennas. Image generation is based on the DAS technique, which allows for the determination of signal behavior at each test point as shown in Figure 11. The results are analyzed using MATLAB R2014a software, employing the mathematical operation defined in Equation (2), which assigns a value to each test point. The analyzed tumor was fixed with a diameter of 10.0 mm for Figure 10, which is very tiny. This is very important to detect the disease early.
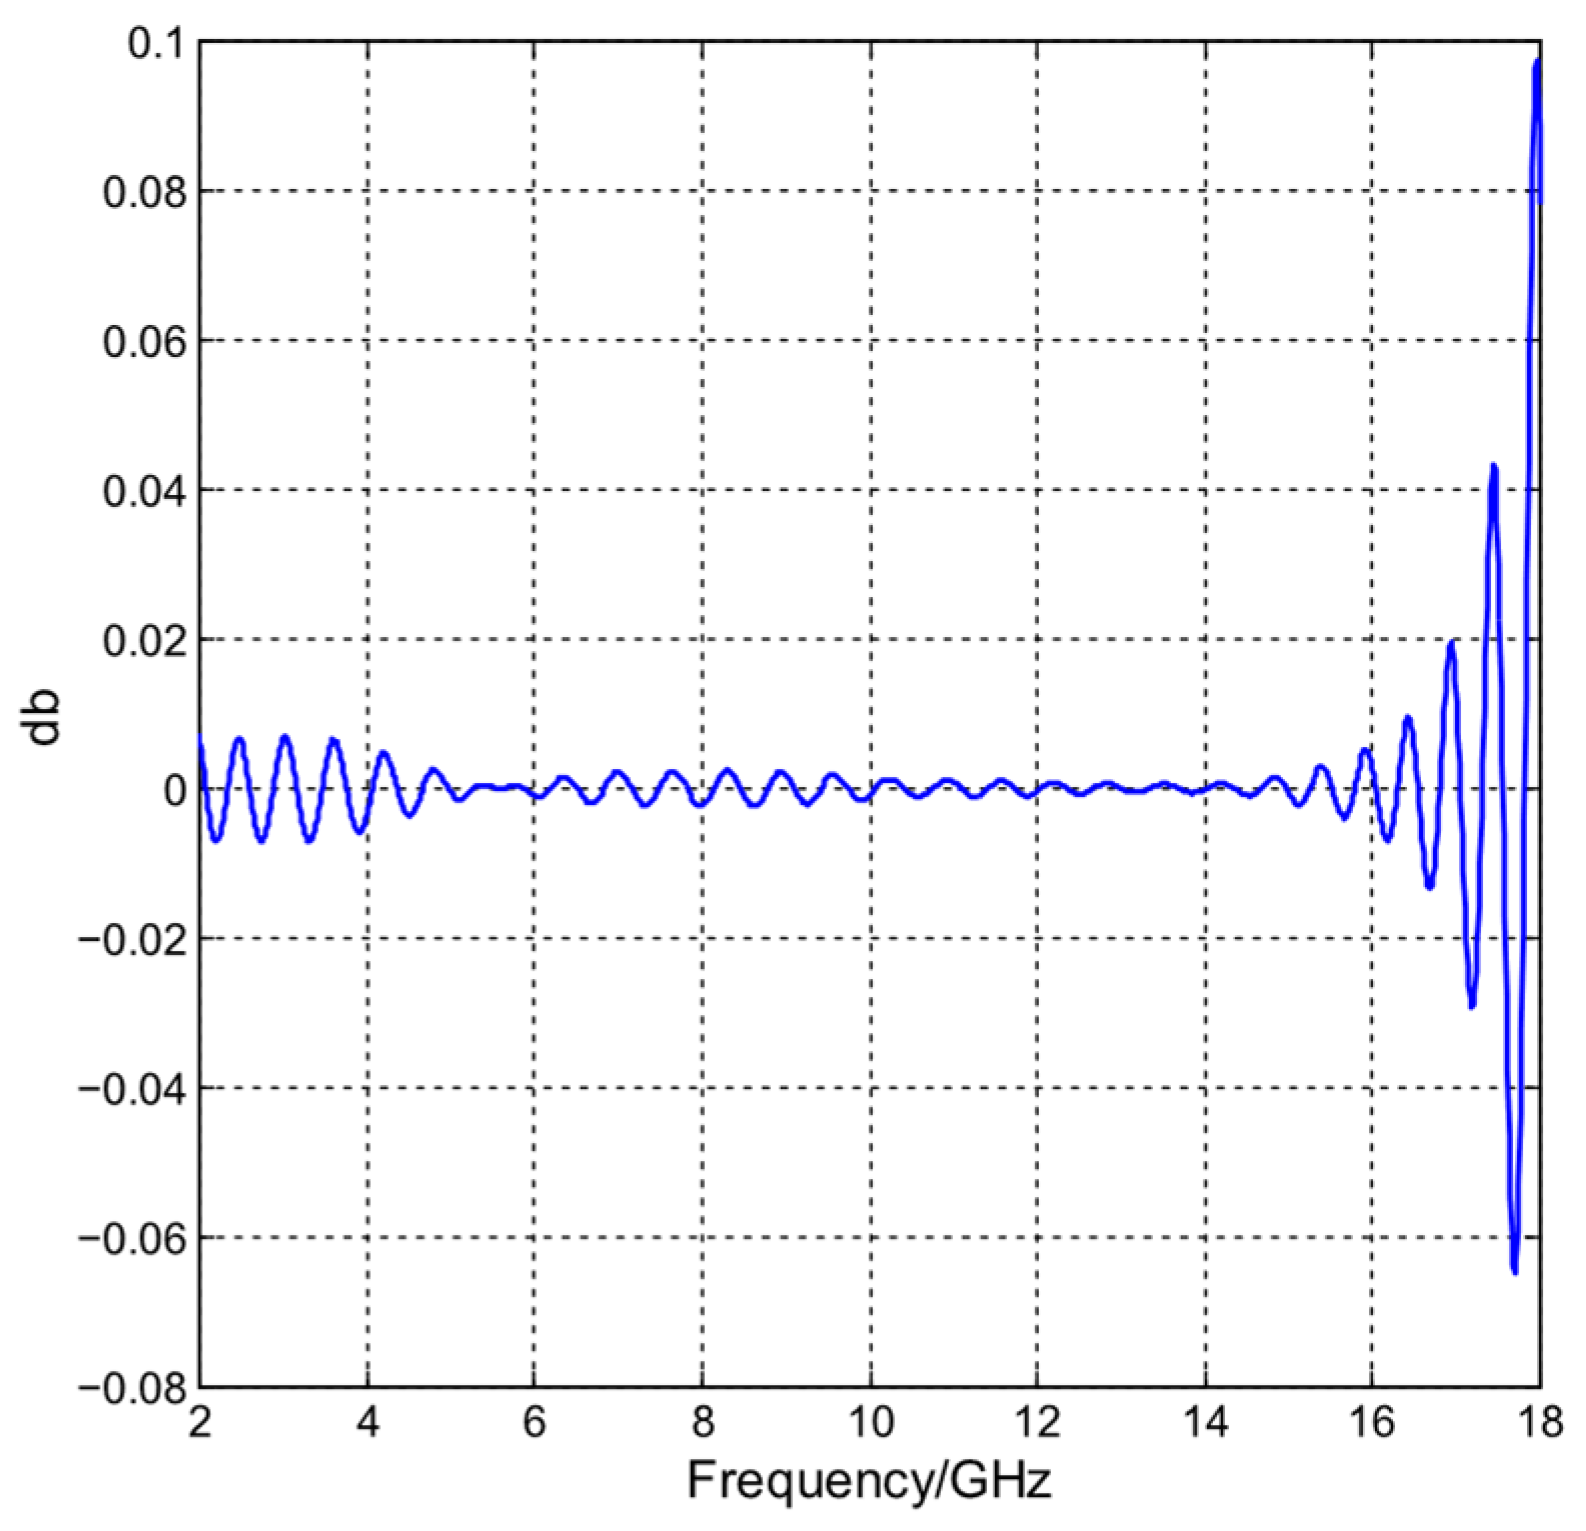
Figure 12 shows the total attenuation or gain between the input port of the first block and the output port of the last block, when several blocks (or sections) are connected one after another.
When analyzing the S21 parameter, the drops (lower S21 values) represent frequencies with high attenuation or signal blocking, while the flat or higher regions indicate good signal transmission through the device or system.

4.5. Image Reconstruction for Different Sizes of Tumors

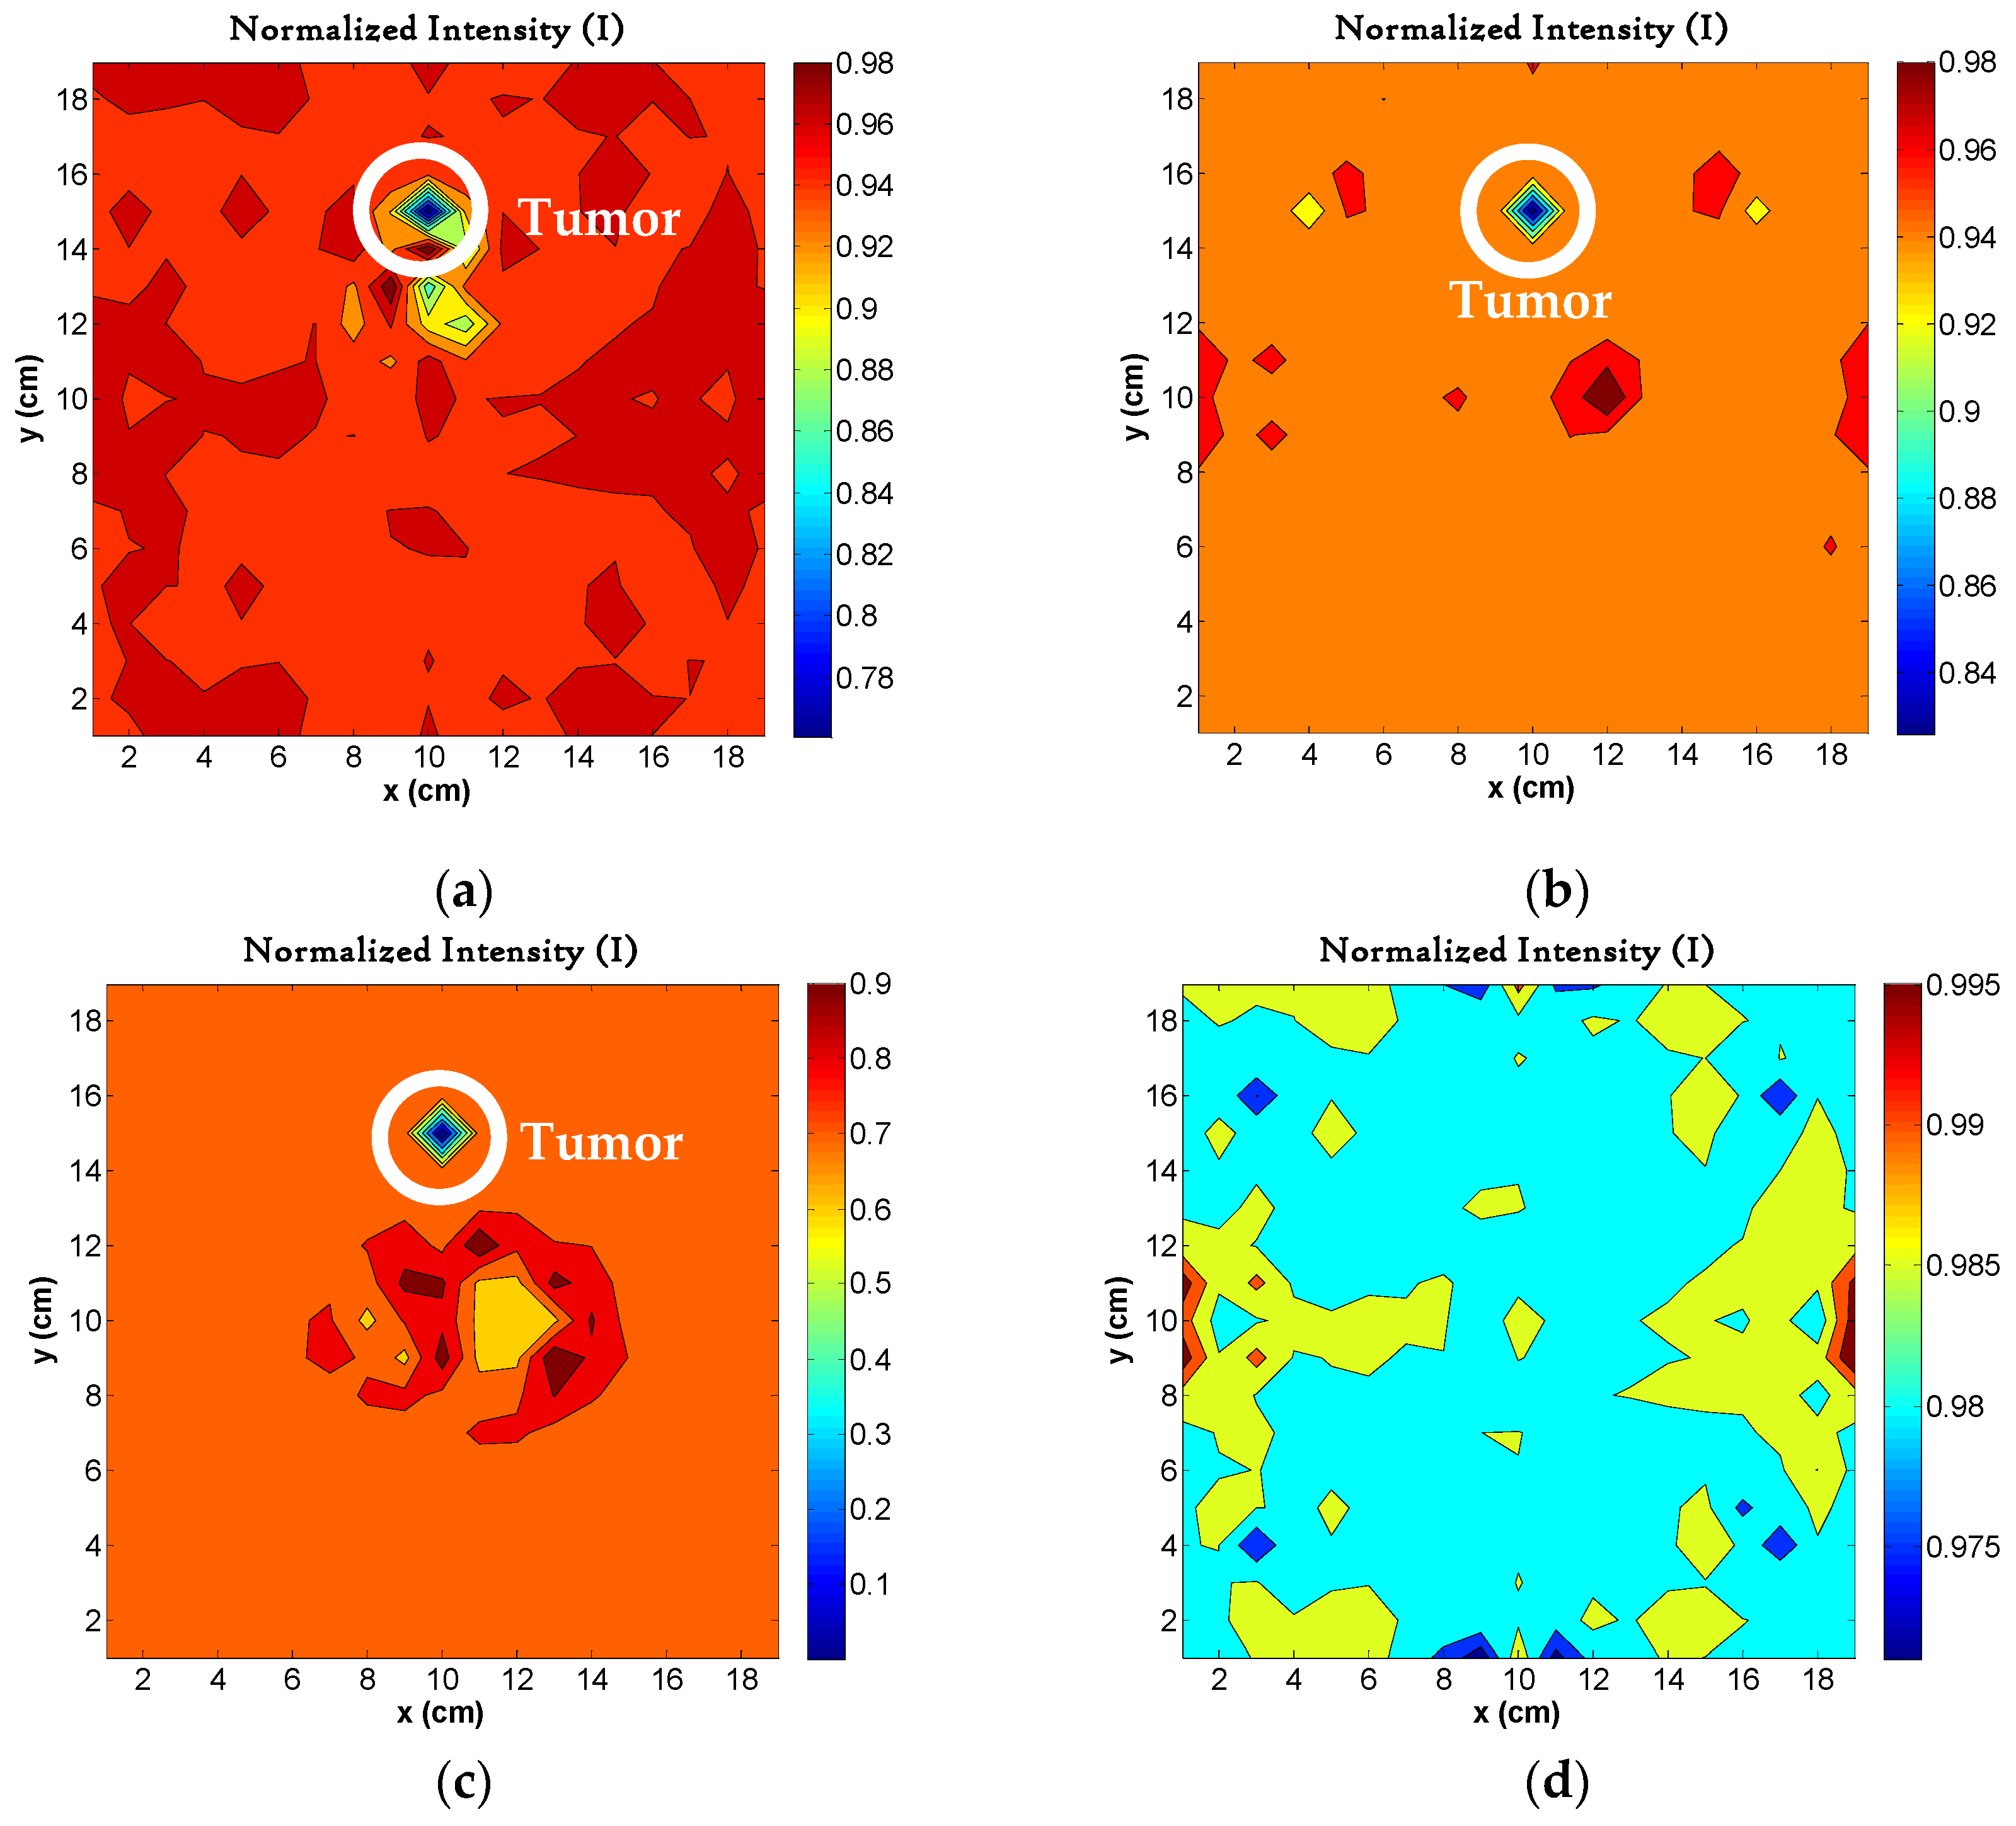
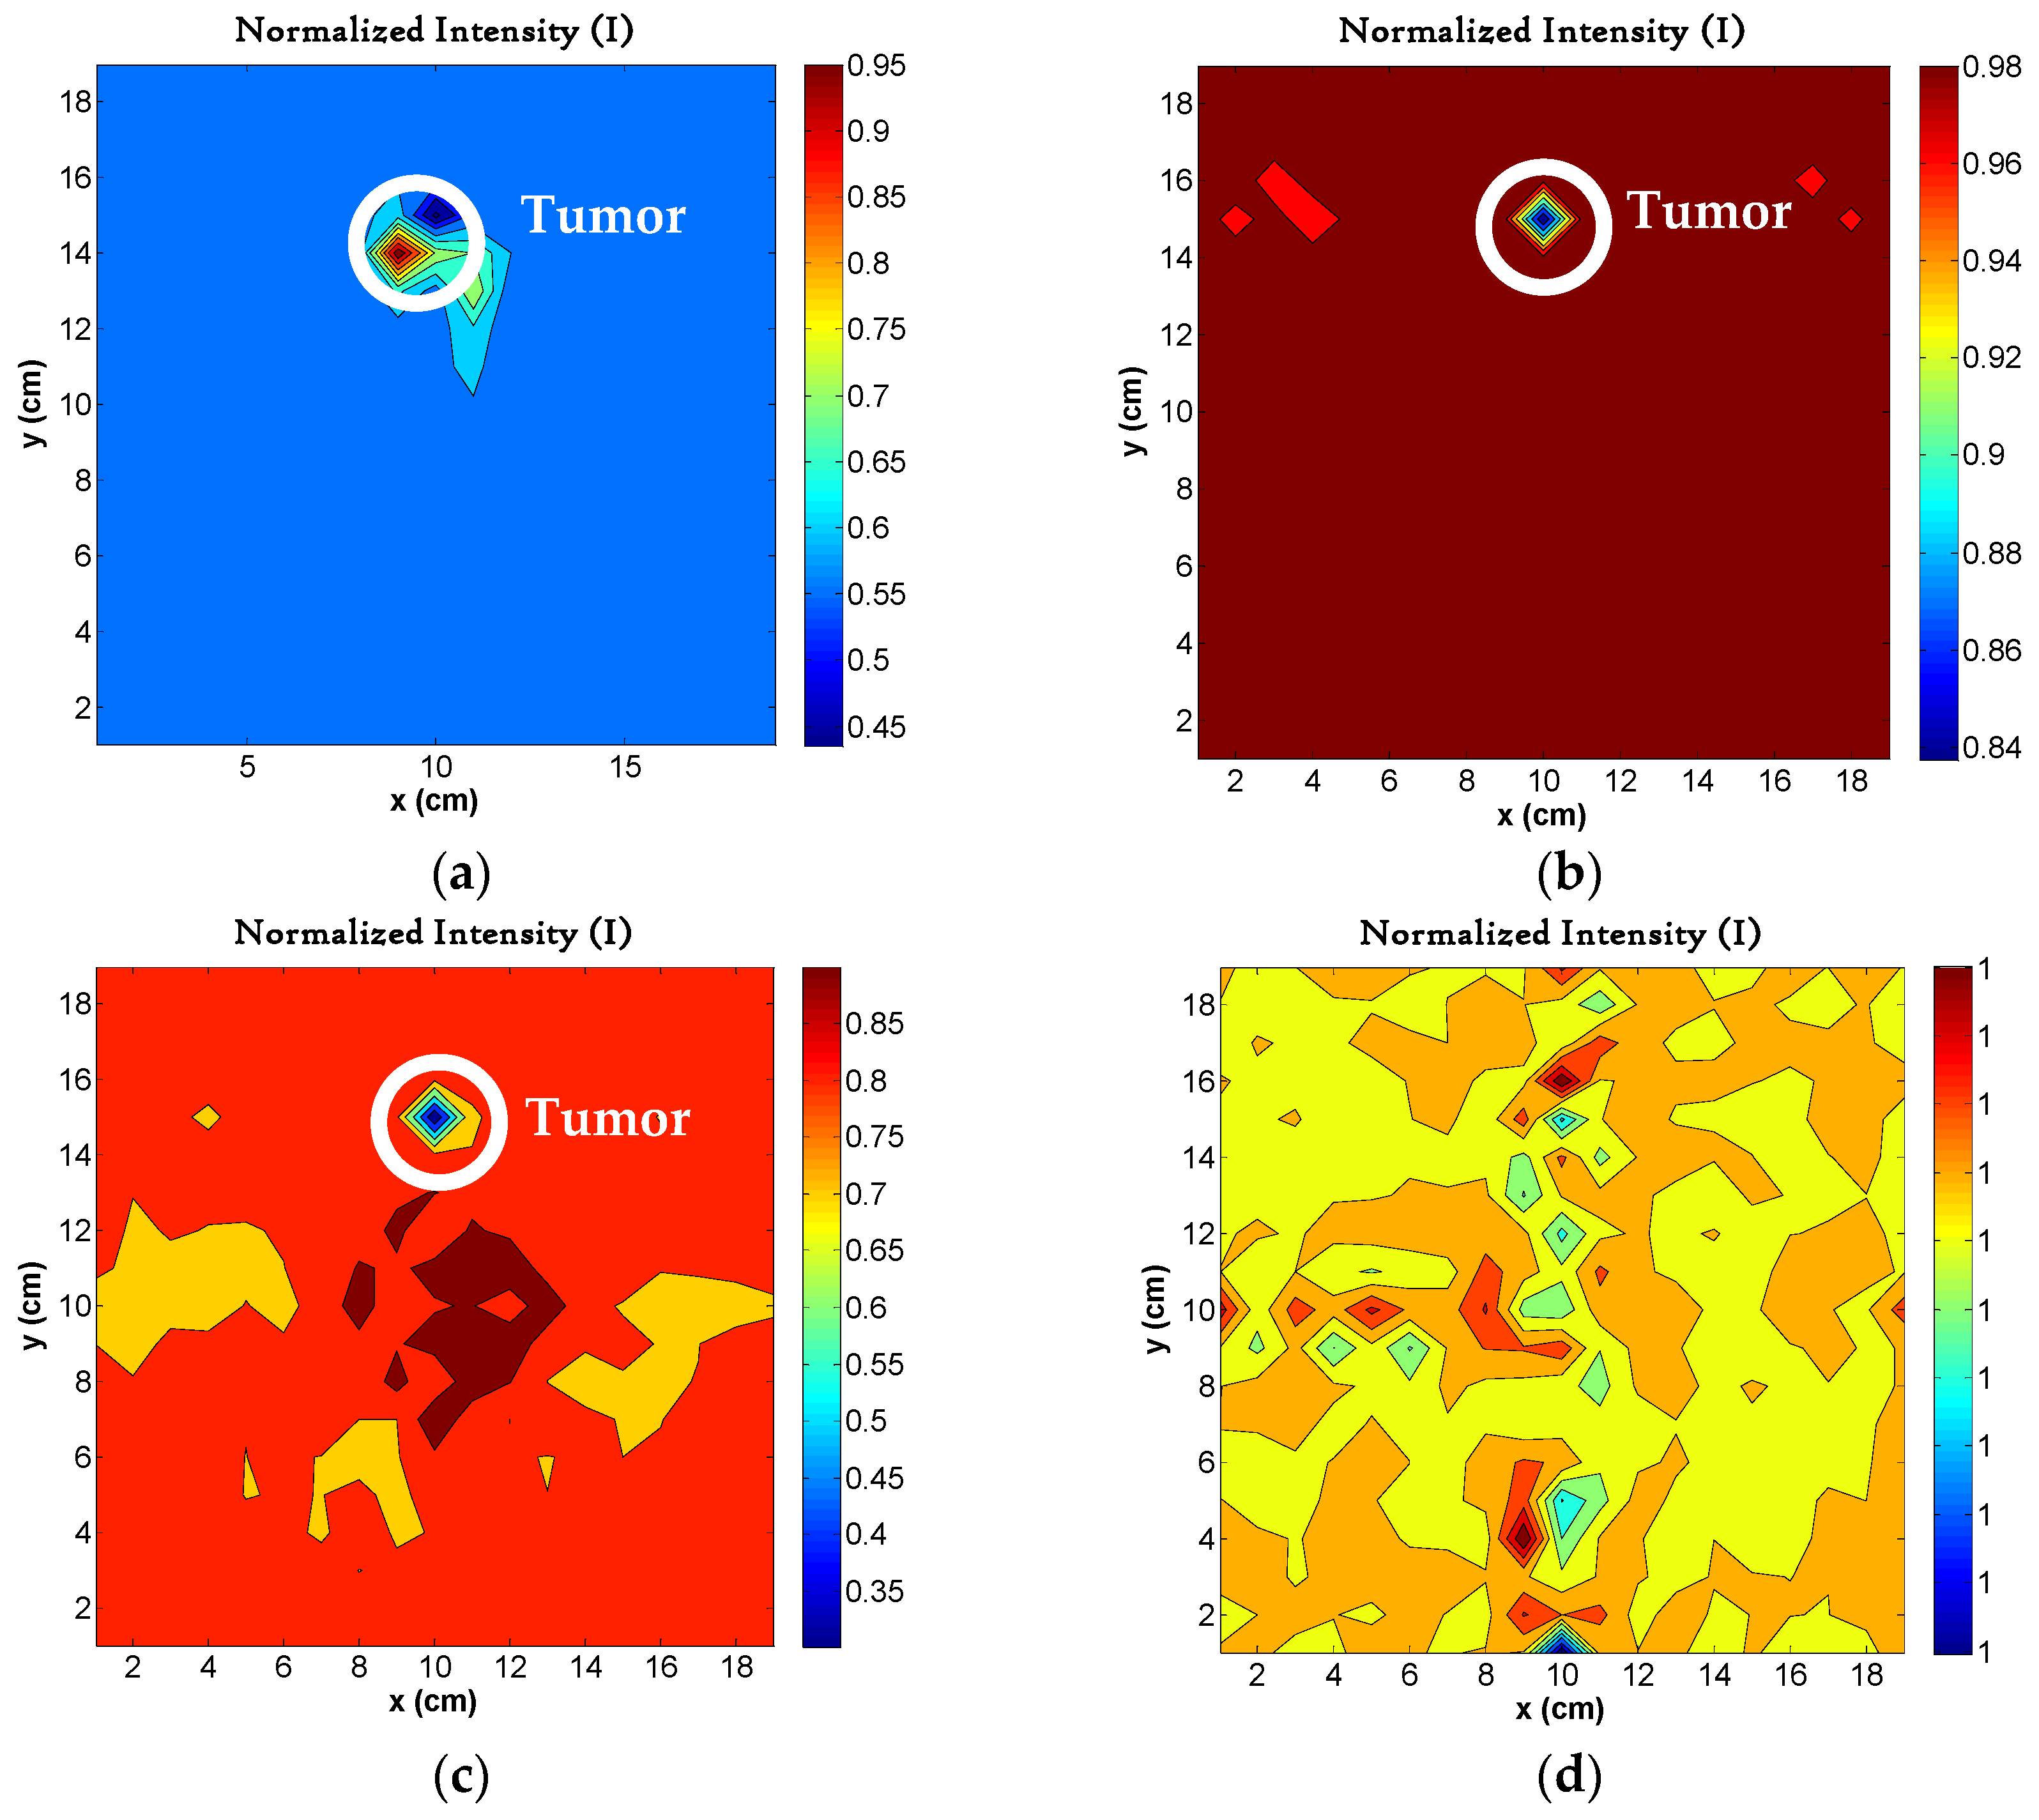
Now, we analyzed the system with different diameters of the tumor. To this end, the results of four simulations conducted to assess tumor detection capabilities are presented, considering the following tumor diameters: 10 mm, 2.5 mm, 0.625 mm, and 0.3125 mm. This is illustrated in Figure 13 with two antennas and Figure 14 with four antennas. The tumor location will be determined based on the minimum quotient value of the signal peak, which indicates the precise position of the tumor.
When using a tumor with a diameter of 0.3125 mm in the phantom, adequate detection is not achievable with two antennas. It was possible the tumor detection of 0.625 mm in diameter with two antennas. This is evident in Figure 13d, where the values obtained using the imaging method show a difference of 0.05 mm, which hinders effective tumor detection. On the other hand, for the case with four antennas, tumor detection is successfully demonstrated in Figure 14, where tumors with diameters of 10 mm, 2.5 mm, and 0.625 mm are identified.
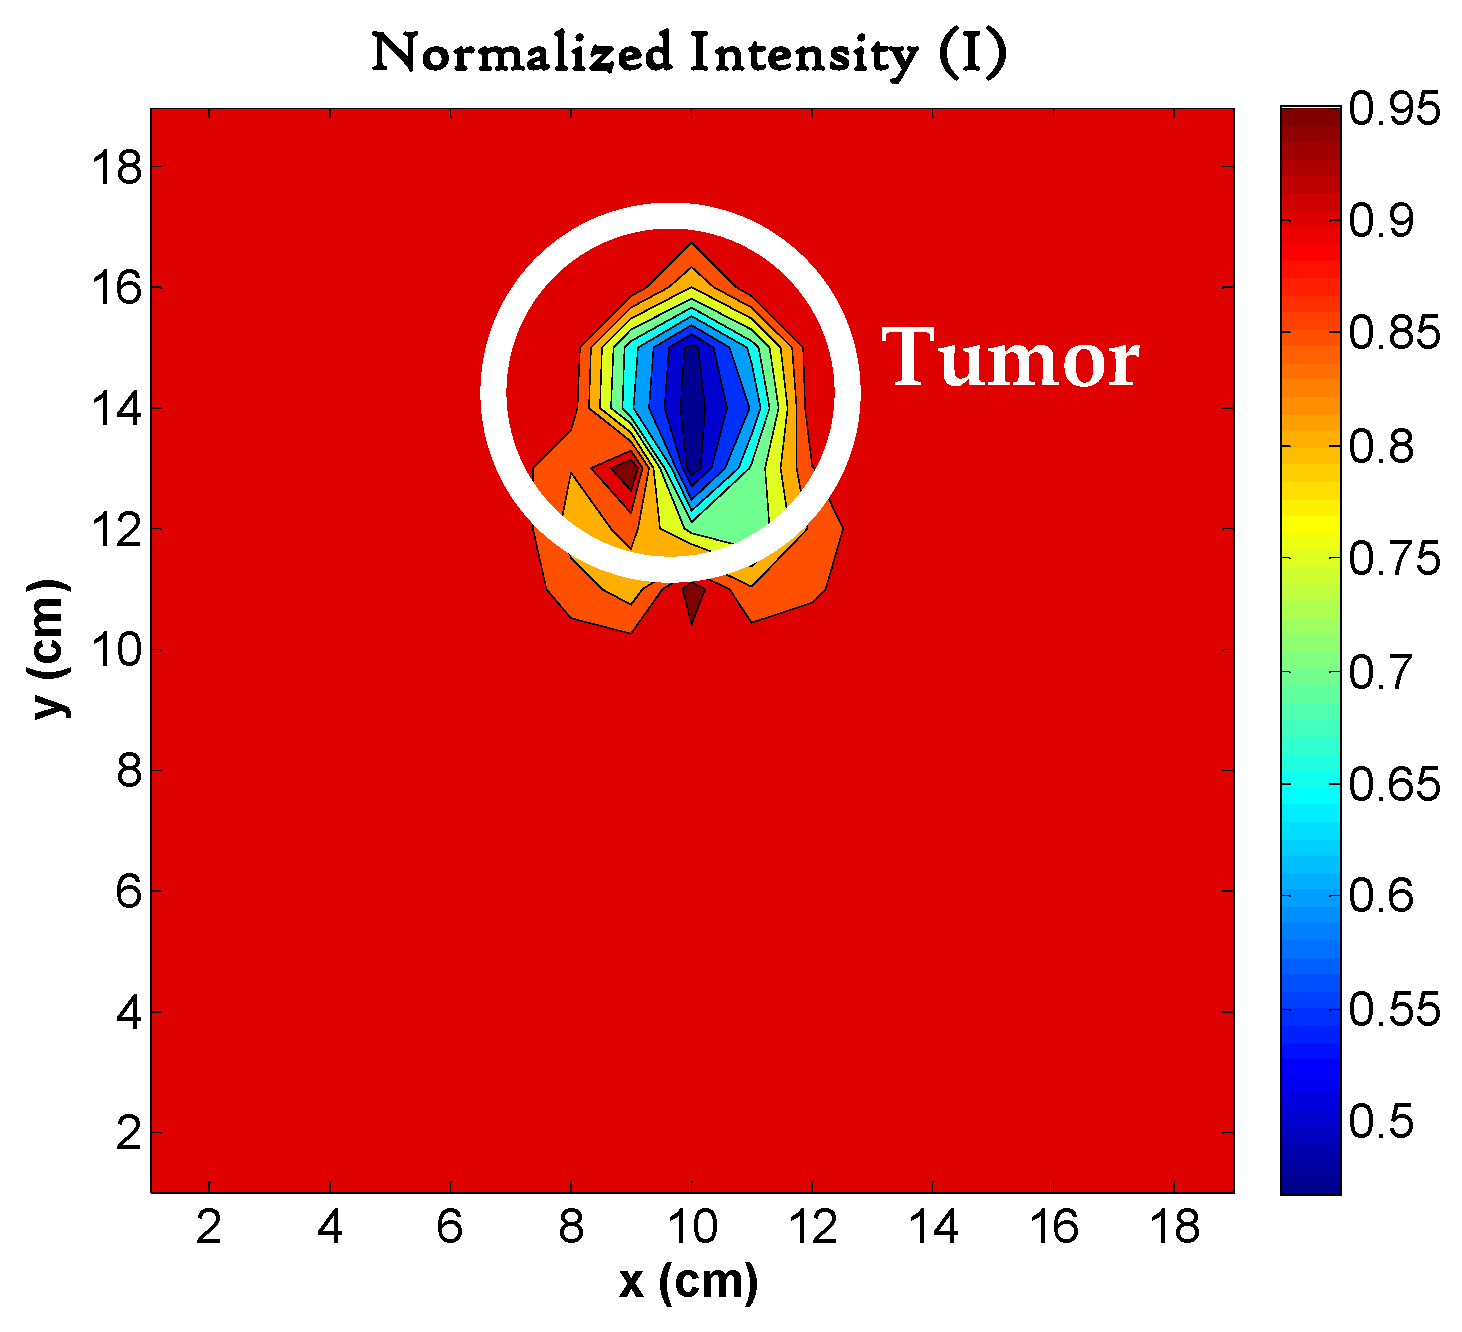
Similar to the observations made with the use of two antennas, the minimum detectable tumor size is 0.625 mm in diameter. This is one of the key advantages of using the antenna proposed in the present study. Now, it is important to reveal if the system is capable of detecting a bigger tumor. In this case, a simulation was also conducted with a tumor of 20 mm in diameter, and the results of this simulation are shown in Figure 15.

4.6. Image Reconstruction for Variations in Permittivity

Until now, we have analyzed the system with fixed values for permittivity in several layers of the phantom. However, it is necessary to reveal what the impact is when the permittivity changes affect the tumor detection. This is because there exist variations in permittivity for different patients. Figure 16 shows that the value of the dielectric constant is analyzed with a variation of ±1% for the total layers of the phantom in five different cases. Table 5 shows the values used for each case. These cases were obtained by using two antennas. As observed in Figure 16, the variations in permitivity do not considerably affect the tumor detection.

4.7. Image Reconstruction for Different Number of Tumors

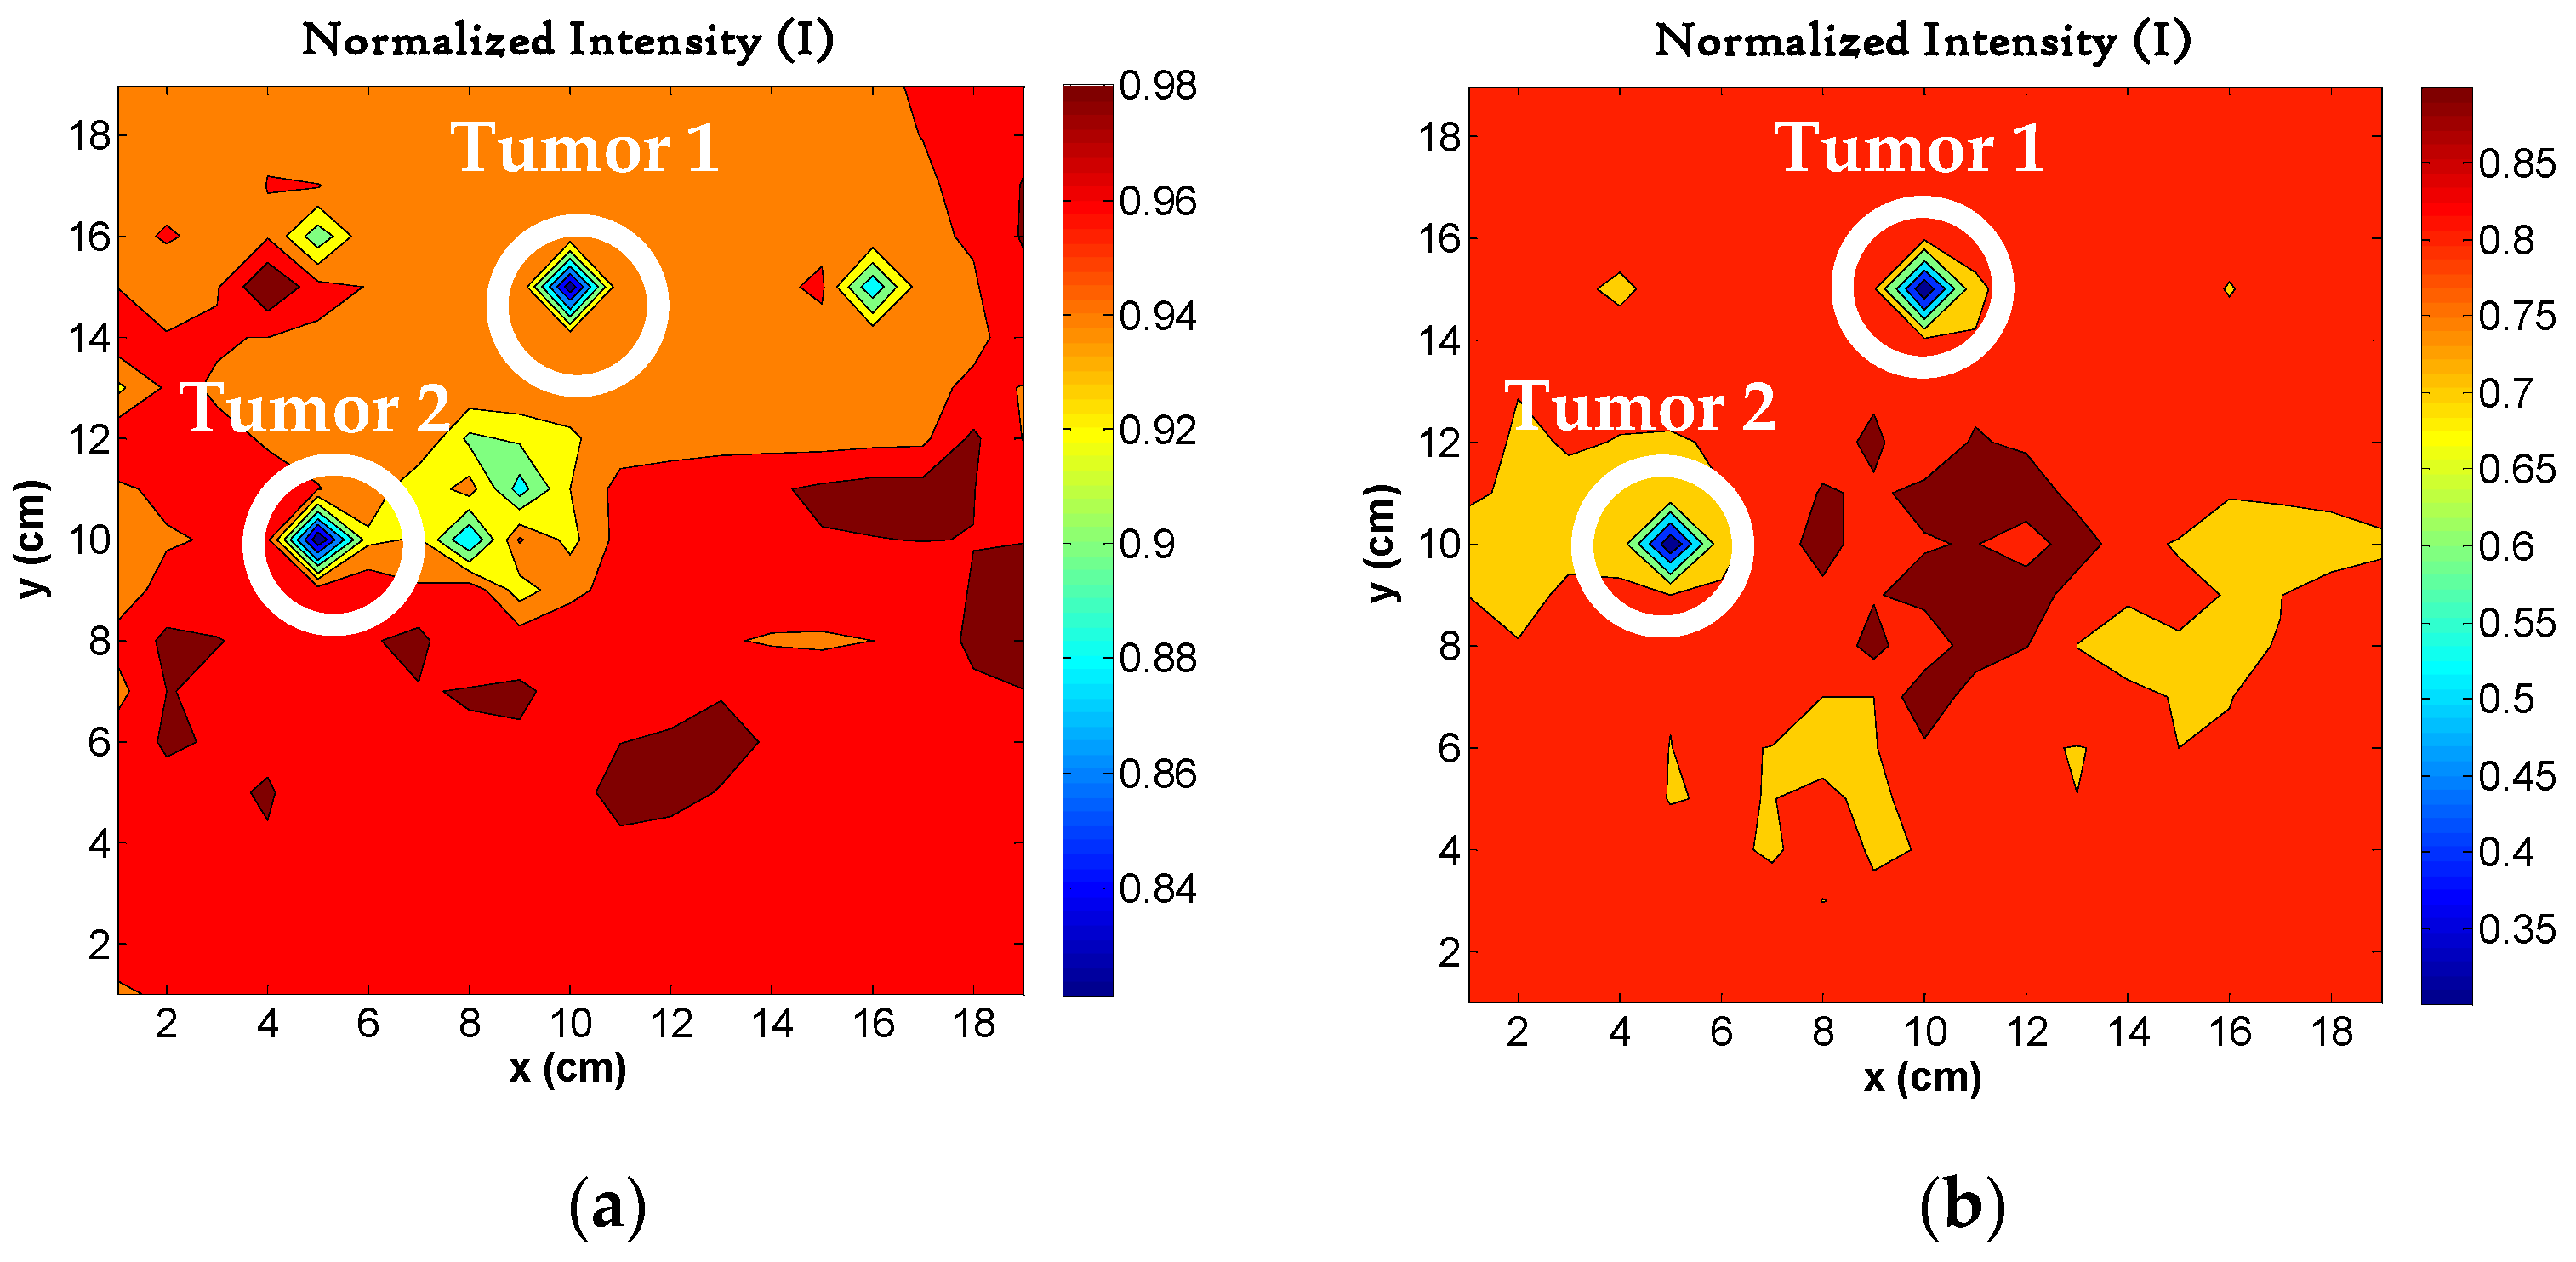
Moreover, we analyzed the system when there is more than one tumor. The number of detectable tumors increases in both the two-antenna and four-antenna cases, with a better response observed when using four antennas. The imaging results for each case, using a tumor 0.625 mm in diameter, are presented in Figure 17.
According to the results obtained, the use of both configurations is effective, as it allows for the detection of a greater number of tumors, if present. It is worth noting that performing a greater number of simulations, as well as increasing the number of test points, will significantly contribute to improving the quality of image resolution.

4.8. Image Quality Metrics

Two image quality metrics were employed to quantitatively analyze the reconstruction produced by the DAS algorithm. For this purpose, four images corresponding to the presence of the tumor at sizes 10 mm, 2.5 mm, 0.625 mm, and 0.3125 mm were considered. Likewise, the corresponding analysis was carried out for the images obtained using two and four antennas. First, the Contrast-to-Noise Ratio (CNR) was evaluated, which is defined as follows:
C N R = 20 log 10 S s i g n a l C m e a n
where S s i g n a l corresponds to the maximum response in the region identified as belonging to the tumor, while C m e a n represents the mean response in the C l u t t e r region (defined as the area of the image known to belong to the phantom but not to the tumor). It was assumed that the region corresponding to the tumor location was delimited by a circle of radius r . In this context, the signal-to-clutter ratio (CNR) was defined as follows:
S C R = 20 log 10 S m a x C m a x
Based on ImageJ version 1.54K para windows (Image Processing and Analysis in Java) [22], an image processing program primarily designed for the analysis of scientific images, the evaluation of image quality metrics was carried out, resulting in the calculation of CNR and SCR values. Table 6 and Table 7 contain the CNR and SCR values for two and four antennas.
Where x ¯ corresponds to the average pixel value and S to the noise or standard deviation of the clutter and object, in this case the tumor.

4.9. Results Comparison with Similar Works

Finally, Table 8 provides a summary of the characteristics of antenna designs reported in the literature on UWB antenna arrays, alongside the proposed design. The most notable previous studies have primarily focused on broadband for imaging applications, particularly in different parts of the body, with a particular emphasis on the female breast [7,8,10,12,13,15,23,24]. On the other hand, the works in [7,25] present simulations of medical applications using antenna arrays, which typically feature an omnidirectional radiation pattern. In addition, the works [16,26,27] use phantom with only 6 layers and less than 2 GHz of bandwidth. In this work, the operating frequency is from 2.4 GHz to 17.7 GHz, suitable for detecting tumors larger than 0.6 mm in a phantom of 7 layers. The novelty of this research is the fact that the tumor detection uses a high-fidelity phantom with different layers, detects tiny tumors, and investigates variations in permittivity and number of tumors.

5. Conclusions

This work proposes a system for brain tumor detection based on a Vivaldi antenna array configured with two and four elements, operating within the frequency range of 2.4 to 17.7 GHz. Through signal analysis using the DAS method, the system successfully identified a tumor with a minimum diameter of 0.625 mm, achieving satisfactory detection results. The study considered a high-fidelity phantom to verify more realistic results. This implied tumor detection for different number of layers in phantoms, detection of tiny tumors, variations in permittivity and number of tumors. This approach represents a potential contribution to the healthcare field, offering viable alternatives for the early detection of the disease. In future work, the objective will be to design and implement the physical phantom, which will enable further validation and improvement of the proposed system.

Author Contributions

Conceptualization, L.I.B. and M.A.P.; Methodology, L.I.B.; Software, L.E.R. and A.R.; Validation, A.R.; Investigation, L.E.R.; Data curation, A.R.; Writing—review & editing, L.E.R., A.R. and L.I.B.; Visualization, M.A.P.; Supervision, L.I.B. and M.A.P. All authors have read and agreed to the published version of the manuscript.

Funding

This work has been supported by the Secretaria de Ciencia Humanidades Tecnologia e Innovacion (SECIHTI) Mexico, under grant no. PEE-2025-G-266; by the Universidad Autònoma de Tamaulipas, under grant no. UAT/SIP/INV/2025/019 and by Consejo Tamaulipeco de Ciencia y Tecnología (COTACYT).

Institutional Review Board Statement

Not applicable.

Informed Consent Statement

Not applicable.

Data Availability Statement

The original contributions presented in the study are included in the article, further inquiries can be directed to the corresponding author.

Conflicts of Interest

The authors declare no conflict of interest.

References

  1. Mayo Clinic. Tumor Cerebral. Prensa de Mayo Clinic, 15 October 2025. [Google Scholar]
  2. Haskell, M.W.; Nielsen, J.-F.; Noll, D.C. Off-resonance artifact correction for magnetic resonance imaging: A review. NMR Biomed. 2023, 36, e4867. [Google Scholar] [CrossRef] [PubMed]
  3. Cancer Council NSW. Understanding Brain Tumors; IVE Group: Sydney, Australia, 2024. [Google Scholar]
  4. Narita, C.; Clements, W.; Varma, D. Assessing the necessity of intravenous contrast for computed tomography in the acute undifferentiated abdomen. J. Med. Imaging Radiat. Sci. 2023, 54, 123–130. [Google Scholar] [CrossRef]
  5. THANC Guide. Tomografía por Emisión de Positrones (PET); THANC Foundation: New York, NY, USA, 2025. [Google Scholar]
  6. Aljubran, A.H.; Badran, A.; Alshaer, O.; Alhashem, H.; Omar, A.; Eldali, A. Pattern of use of positron emission tomography/computed tomography (PET/CT) scan in non-colorectal gastrointestinal cancers at KFSHRC, Riyadh, Saudi Arabia. Egypt. J. Radiol. Nucl. Med. 2020, 50, 60. [Google Scholar] [CrossRef]
  7. Lasemiimeni, Z.; Atlasbaf, Z.; Karbaschi, N. Dual-Functional Ultrawideband Antenna With High Fidelity Factor for Body Area Networks and Microwave Imaging Systems. IEEE Access 2021, 9, 112930–112941. [Google Scholar] [CrossRef]
  8. Alhawari, A.R.H.; Almawgani, A.H.M.; Hindi, A.T.; Alghamdi, H.; Saeidi, T. Metamaterial-based wearable flexible elliptical UWB antenna for WBAN and breast imaging applications. AIP Adv. 2021, 11, 015128. [Google Scholar] [CrossRef]
  9. Fiser, O.; Hruby, V.; Vrba, J.; Drizdal, T.; Tesarik, J.; Vrba, J., Jr.; Vrba, D. UWB Bowtie Antenna for Medical Microwave Imaging Applications. IEEE Trans. Antennas Propag. 2022, 70, 5357–5372. [Google Scholar] [CrossRef]
  10. Li, H.; Zhang, H.; Kong, Y.; Zhou, C. Flexible Dual-Polarized UWB Antenna Sensors for Breast Tumor Detection. IEEE Sens. J. 2022, 22, 13648–13658. [Google Scholar] [CrossRef]
  11. Sediq, H.T. Tumor detection concepts using eagle-shaped UWB antenna signals for medical purposes. Sens. Actuators A Phys. 2023, 362, 114653. [Google Scholar] [CrossRef]
  12. Danjuma, I.M.; Akinsolu, M.O.; See, C.H.; Abd-Alhameed, R.A.; Liu, B. Design and optimization of a slotted monopole antenna for ultra-wide band body centric imaging applications. IEEE J. Electromagn. RF Microw. Med. Biol. 2020, 4, 140–147. [Google Scholar] [CrossRef]
  13. Subramanian, S.; Sundarambal, B.; Nirmal, D. Investigation on Simulation-Based Specific Absorption Rate in Ultra-Wideband Antenna for Breast Cancer Detection. IEEE Sens. J. 2018, 18, 10002–10009. [Google Scholar] [CrossRef]
  14. Särestöniemi, M.; Sonkki, M.; Myllymäki, S.; Pomalaza-Raez, C. Wearable Flexible Antenna for UWB On-Body and Implant Communications. Telecom 2021, 2, 285–301. [Google Scholar] [CrossRef]
  15. Hammouch, N.; Ammor, H.; Himdi, M. A Compact Flexible UWB Antenna for Biomedical Applications: Especially for Breast Cancer Detection. In Proceedings of the 6th International Conference on Wireless Technologies, Embedded, and Intelligent Systems, Fez, Morocco, 14–16 October 2020; Springer: Singapore, 2020; pp. 1061–1072. [Google Scholar]
  16. Naghavi, A.H.; Hassani, H.R.; Oloumi, D. Investigation and Analysis of EM Pulse Propagation Inside Human Head for High-Resolution UWB Elliptical SAR Imaging. IEEE J. Electromagn. RF Microw. Med. Biol. 2022, 6, 485–493. [Google Scholar] [CrossRef]
  17. Shin, G.; Kim, W.; Kim, M.C.; Kim, J.; Chung, J.Y.; Nah, J.; Yoon, I.J. A Deionized Water-Infilled Dual-Layer Insulator-Applied Brain-Implanted UWB Antenna for Wireless Biotelemetry Applications. IEEE Trans. Antennas Propag. 2022, 70, 6469–6478. [Google Scholar] [CrossRef]
  18. Gazit, E. Improved design of the Vivaldi antenna. IEE Proc. 1988, 135, 89–92. [Google Scholar] [CrossRef]
  19. Sasikala, S.; Karthika, K.; Arunkumar, S.; Anusha, K.; Adithya, S.; Al-Gburi, A.J.A. Design and Analysis of a Low-Profile Tapered Slot UWB Vivaldi Antenna for Breast Cancer Diagnosis. Prog. Electromagn. Res. M 2024, 124, 43–51. [Google Scholar] [CrossRef]
  20. Van Veen, B.D.; Buckley, K.M. Beamforming: A versatile approach to spatial filtering. IEEE ASSP Mag. 1988, 5, 4–24. [Google Scholar] [CrossRef]
  21. Nilavalan, R.; Gbedemah, A.; Craddock, I.; Li, X.; Hagness, S. Numerical investigation of breast tumour detection using multi-static radar. Electron. Lett. 2003, 39, 1787–1789. [Google Scholar] [CrossRef]
  22. Institutos Nacionales de Salud de EE.UU. ImageJ—Image Processing and Analysis in Java; Institutos Nacionales de Salud de EE.UU: Bethesda, MD, USA, 2024. [Google Scholar]
  23. Lasemi, Z.; Atlasbaf, Z. Impact of Fidelity Factor on Breast Cancer Detection. IEEE Antennas Wirel. Propag. Lett. 2020, 19, 1649–1653. [Google Scholar] [CrossRef]
  24. Vanegas Cárdenas, D.N. Estudio de Una Antena UWB: Diseño, Caracterización y Simulación de Una Antena UWB Para Sistemas de Detección de Cáncer. Bachelor’s Thesis, La Universidad de Los Andes, Bogotá, Colombia, 2018. [Google Scholar]
  25. Li, R.; Guo, Y. A Conformal UWB Dual-Polarized Antenna for Wireless Capsule Endoscope Systems. IEEE Antennas Wirel. Propag. Lett. 2021, 20, 483–487. [Google Scholar] [CrossRef]
  26. Inum, R.; Rana, M.M.; Shushama, K.N.; Quader, M.A. EBGBased Microstrip Patch Antenna for Brain Tumor Detection via Scattering Parameters in Microwave Imaging System. Int. J. Biomed. Imaging 2018, 2018, 8241438. [Google Scholar] [CrossRef] [PubMed]
  27. Dishali, M.J.; Kumar, K.M.; Nawaz, S.M. Design of Microstrip Patch Antenna for Brain Cancer Detection. ICTACT J. Microelectron. 2019, 5, 731–737. [Google Scholar]
  28. Yousaf, M.; Ben Mabrouk, I.; Zada, M.; Akram, A.; Amin, Y.; Nedil, M.; Yoo, H. An Ultra-Miniaturized Antenna With Ultra-Wide Bandwidth Characteristics for Medical Implant Systems. IEEE Access 2021, 9, 40086–40097. [Google Scholar] [CrossRef]
  29. Li, X.; Yan, J.; Jalilvand, M.; Zwick, T. A Compact Double-Elliptical Slot-Antenna for Medical Applications. In Proceedings of the 6th European Conference on Antennas and Propagation (EUCAP), Prague, Czech Republic, 26–30 March 2012. [Google Scholar]
  30. Hossain, A.; Islam, M.T.; Beng, G.K.; Kashem, S.B.A.; Soliman, M.S.; Misran, N.; Chowdhury, M.E.H. Microwave brain imaging system to detect brain tumor using metamaterial loaded stacked antenna array. Nat. Sci. Rep. 2022, 12, 16478. [Google Scholar] [CrossRef] [PubMed]
Figure 1. Antenna design: (a) antenna dimensions; (b) front view; (c) back view.
Applsci 15 12275 g001
Figure 2. Human head phantom: (a) head with brain; (b) layers of head; (c) dimensions of phantom.
Applsci 15 12275 g002
Figure 3. Phantom of human head with diadem: (a) Top View (b) two-antenna array; (c) four-antenna array.
Applsci 15 12275 g003
Figure 4. Flowchart of DAS method.
Applsci 15 12275 g004
Figure 5. Phantom with test points in cross section.
Applsci 15 12275 g005
Figure 6. Antenna functionality: (a) S11 with and without phantom; (b) main cut of radiation pattern at 6.1 GHz with phantom; and (c) 3D radiation pattern at 6.1 GHz with phantom.
Applsci 15 12275 g006
Figure 7. S11 parameter of antennas located in presence of phantoms of different materials: (a) with two antennas; (b) with four antennas.
Applsci 15 12275 g007
Figure 8. Time signals at the center of the phantom in the presence of a tumor of 5 mm in its radius: (a) two antennas and (b) four antennas.
Applsci 15 12275 g008
Figure 9. Images of the tumor: (a) two antennas and (b) four antennas.
Applsci 15 12275 g009
Figure 10. S-parameters with different phantoms: (a) S11 and (b) S21.
Applsci 15 12275 g010
Figure 11. Image result of sequentially adding the layers of material of Table 1: (a) 1 layer; (b) 2 layers; (c) 3 layers; (d) 4 layers; (e) 5 layers; (f) 6 layers; (g) 7 layers.
Applsci 15 12275 g011
Figure 12. S21 parameter: Attenuation as a function of frequency.
Applsci 15 12275 g012
Figure 13. Image result with tumor diameter of: (a) 10 mm; (b) 2.5 mm; (c) 0.625 mm; (d) 0.3125 mm.
Applsci 15 12275 g013
Figure 14. Image result with tumor diameter of: (a) 10 mm; (b) 2.5 mm; (c) 0.625 mm; (d) 0.3125 mm.
Applsci 15 12275 g014
Figure 15. Result imaging of a 20 mm diameter tumor with two antennas.
Applsci 15 12275 g015
Figure 16. Variation of ± 1% to dielectric permittivity values of each phantom layer using a 2.5 mm diameter tumor: (a) Test 1; (b) Test 2; (c) Test 3; (d) Test 4; (e) Test 5.
Applsci 15 12275 g016
Figure 17. Result imaging with: (a) 2 antennas; (b) 4 antennas.
Applsci 15 12275 g017
Table 1. Dielectric properties of human head tissues [17].
TissuesDielectric Permittivity (εr)Tangent Loss (δ)Thickness (mm)
Skin40.8470.2971
Fat5.1250.1602
Skull10.5320.31010
Dura mater40.0960.3071.5
CSF63.730.3662
Gray matter46.580.2983.7
White matter34.4780.27870.52
Tumor [19]54.94.010
Table 2. Dimensions for helmet prototype.
Objectx (mm)y (mm)z (mm)
Strap 11589.23272.1
Strap 2233.889.2315
Strap base233.889.23272.1
Table 3. Antenna power efficiency.
FrequencyAbsorbed Power Ratio ( E f )
Seven LayersOne Gray Matter Layer
3.92 GHz65.39%64.19%
5.79 GHz81.39%75.95%
7.91 GHz88.75%92.80%
9.67 GHz81.47%86.62%
11.28 GHz93.64%99.36%
Table 4. SAR parameter calculated with CST Microwave Studio.
Specific Absorption Rate
Frequency3.92 GHz5.79 GHz7.91 GHz9.67 GHz11.28 GHz
Phantom with seven layers of materialsApplsci 15 12275 i001Applsci 15 12275 i002Applsci 15 12275 i003Applsci 15 12275 i004Applsci 15 12275 i005
SAR (W/Kg)1.051.681.291.371.79
0.921.611.431.551.96
Phantom of one layer of gray matterApplsci 15 12275 i006Applsci 15 12275 i007Applsci 15 12275 i008Applsci 15 12275 i009Applsci 15 12275 i010
Table 5. Values of the dielectric constant variation.
TissuesOriginal (εr) Test 1 (εr)Test 2 (εr)Test 3 (εr)Test 4 (εr)Test 5 (εr)
Skin40.84741.008540.408540.658540.468540.5085
Fat5.1255.16375.14375.10375.17375.0737
Skull10.53210.516710.506710.586710.596710.4667
Dura mater40.09640.345040.425039.795040.005040.2050
CSF63.7363.442763.962763.922763.292763.2427
Gray matter46.5846.574247.014246.424246.664246.3242
White matter34.47834.453234.483234.473234.443234.4632
Tumor54.955.401054.951054.501054.511054.6310
Table 6. Image quality metrics of two antennas.
Two Antennas
Tumor (mm) ( x ¯ ) Tumor S
Tumor
x ¯ Clutter S
Clutter
ContrastNoiseSNRCNRContrast Resolution
10.0127.51.73257.751.25869.752.44573.628.538%
2.5101.51.73259.51.291422.45958.617.126%
0.625127.51.291148.51212.14198.89.818%
0.3125480.81649.51.2911.52.05358.80.732%
Table 7. Image quality metrics of four antennas.
Four Antennas
Tumor (mm) ( x ¯ ) Tumor S
Tumor
( x ¯ ) Clutter S
Clutter
ContrastNoiseSNRCNRContrast Resolution
10.0118.02722.06474.9190.95443.1086.7855.356.3522%
2.573.11118.34748.5561.23624.5556.2583.983.9220%
0.625169.4622.783160.9813.6338.4813.58260.92.373%
0.312543.4171.97542.8330.3890.5842.174220.271%
Table 8. UWB antenna imaging comparison.
DesignN° AntennasFreq. (GHz)Size (mm)MaterialApplicationLayers of Phantom⌀ Phantom
(mm)
r Tumor (mm)Imaging Method
Micro strip Antenna [7]123.0–12.016 × 20 × 1.6FR-4Breast11003DAS Algorithm
Ultra-Miniaturized Antenna [28]12.457 × 7 × 0.2Rogers ULTRALAMImplant1100Not specifiedNot specified
Dual-Polarized Antenna [25]22.15–14.7521.7 × 14.8 × 0.8Roger 6010Endoscope160Not specifiedNot specified
Flexible elliptical Antenna [8]126.5–35.010 × 10 × 0.7TextileBreast2502Time-reversal Algorithm
Bow-Tie Antenna [9]81.0–6.060 × 60 × 50Rogers RO4003CBrain316020MT Algorithm
Dual-Polarized Antenna [10]83.9–19.030 × 30 × 1.6Kapton polyimideBreast31005DAS Algorithm
Micro strip Antenna [11]22.79–18.022 × 26 × 2.6Roger 5880Breast and finger31206.5SAR and PLD Method
Coplanar Antenna [12]23.0–11.033.14 × 14.9 × 0.84FR-4Breast31202.5DAS Algorithm
Micro strip Antenna [13]23.0–15.027.0 × 29.0 × 1.6FR-4Breast31205SAR Method
Micro strip Antenna [23]122.55–12.020.0 × 28.0 × 1.6FR-4Breast31002DAS Algorithm
Micro strip Antenna [23]122.95–12.016.0 × 22.0 × 1.6FR-4Breast31002DAS Algorithm
Double-elliptical slot antenna with feed network [29]11.2–9.040.0 × 40.0 × 1.2Rogers RT6010Human Body (Breast)352Not specifiedNot specified
Coplanar Antenna [24]22.0–10.045.0 × 39.0 × 1.6FR-4 EpoxiBreast3163Not specifiedNot specified
Metamaterial [30]91.37–3.1650 × 40 × 8.66 Rogers RT5880 and RO4350BBrain3Not SpecifiedNot SpecifiedIC-CF-DMAS imaging algorithm
On-body flexible Antenna [14]12.0–11.020 × 30Rogers XT8100Hand and Abdomen478Not specifiedNot specified
Flexible Microstrip Antenna [15]23.64–12.1121 × 14 × 1.6Rogers RT-5880Breast4N/ANot specifiedNot specified
Coplanar Antenna [16]120.8–2.830 × 24 × 1.6FR-4Brain6985E-SAR Method
Microstrip Antenna.
Electromagnetic Band Gap (EBG) [26]
16.3–7.414.5 × 8.9 × 0.7Rogers R03003Brain61805Monostatic radar-based confocal
Microstrip Antenna [27]12.4–2.483560 × 60 × 1.56FR-4Brain6Not SpecifiedNot SpecifiedReturn Loss and SAR
Micro strip Antenna [17]23.0–5.010 × 11 × 0.954TRF-43Brain Biotelemetry7144.4Not specifiedSAR Method
Antipoda Vivaldi Antenna [This Work]2 and 42.4–17.745 × 45 × 1.6FR-4Brain7182.10.3125DAS Algorithm
Disclaimer/Publisher’s Note: The statements, opinions and data contained in all publications are solely those of the individual author(s) and contributor(s) and not of MDPI and/or the editor(s). MDPI and/or the editor(s) disclaim responsibility for any injury to people or property resulting from any ideas, methods, instructions or products referred to in the content.